1. Introduction
High temperature materials such as carbon (C) and silicon carbide (SiC) have unique combinations of properties for high temperature applications. Carbon monoliths and carbon fiber–carbon matrix (C/C) composites have superior mechanical properties at elevated temperature [
1,
2], but they will oxidize via conversion to gaseous species in environments containing oxygen. SiC is robust up to 1700 °C [
3], forms an oxygen-protective silica scale [
4,
5,
6], has low density, has low thermal expansion [
7], has high thermal conductivity [
8], has a high elastic modulus [
9], has high strength [
10], and retains its strength at elevated temperature [
9,
10]. While monolithic SiC exhibits brittle failure behavior indicative of ceramics, it is a prime candidate matrix material for high temperature composites.
Inherently brittle materials such as SiC can exhibit damage tolerance when formed into ceramic matrix composites (CMCs) because the cracking in the SiC matrix deflects at the fiber–matrix interfaces (thin boron nitride (BN) or C layers), the load is transferred to the fibers, and the energy is absorbed in individual fiber cracking and pullout [
11,
12,
13]. Several decades of research have been performed on the processing and testing of C/SiC composites, employing a SiC matrix reinforced with carbon fibers (Cf). While early versions of C/SiC CMCs did not have an interface coating, current state-of-the-art C/SiC CMCs are fabricated with Cf cloths that have been coated with interface layers and, subsequently, densified with SiC using chemical vapor infiltration [
14,
15,
16], forming a C/SiC composite with strain to failure greater than monolithic SiC. Another closely related composite is C/C-SiC, in which there is some of the carbon matrix protecting the Cf, while the remainder of the matrix is densified with SiC. In C/C-SiC composites, the fiber interface coating is less critical because a less strong carbon matrix provides damage tolerance. C/C-SiC composites have been fabricated with fiber cloths, chemical vapor deposition (CVD) or resin build-up of carbon, and silicon (Si) reactive melt infiltration (RMI) [
17,
18,
19,
20,
21] and have also shown significant improvements in strain to failure compared with monolithic SiC and C materials.
One method to obtain the partial carbon matrix is to use polyether ether ketone (PEEK) as the fiber binder and pyrolyze it to form carbon, and PEEK’s high char yield ensures a high amount of carbon in the matrix [
22]. Compression molding (or warm pressing) of C/C-SiC composites has been achieved starting with discontinuous carbon fibers with 6–24 mm lengths [
23] or 0/90° 2D plain weave carbon fiber [
24] with PEEK (because of its high char yield) and Si RMI. Both studies reported toughness and fiber pullout. However, while providing composites with excellent properties, these fabrication methods require expensive tooling and intricate manual labor and are time- and cost-intensive.
In other developments, the advent of automated fiber placement (AFP) fabrication of polymer matrix composites (PMCs) has been demonstrated, incorporating single tows or tapes uniformly by melting and resolidifying thermoplastic-impregnated continuous carbon fibers [
25,
26,
27,
28,
29]. The methods, termed fused deposition modeling (FDM) and fused filament fabrication (FFF), respectively, are used interchangeably, and AFP is a new concept derivative of these techniques, specifically using continuous fibers. For designs that do not require weaves and can utilize the 0/90° 2D application of unidirectional tapes, this drastically reduces the time and cost to make PMCs. Following the AFP process, composites can be removed from build plates and used directly or transitioned to further machining processes. Continuous-fiber AFP for CMCs was first reported in the literature with Cf and modified preceramic polymer (liquid or thermosetting resin) as the printing matrix [
30]. The printer was a modified FDM-type machine that melts the printing matrix. In addition, an in situ screw-driven extrusion delivery system has been used to pre-impregnate fiber tows prior to printing, further densified with CVI [
31]. Additionally, there are efforts to develop FDM processes with short fiber for fabricating CMCs [
32,
33], but these composites tend to have low fiber volume fraction and fibers with short lengths.
In this work, information on previous studies of composites made via PMC AFP and Cf-PEEK pyrolysis with RMI were leveraged and combined to form CMCs on a small scale. The manufacturing process consisted of 3D printing automatically placed fiber preforms in a polymer matrix. Once the PMCs were printed, the polymer matrix was pyrolyzed to form carbon, resulting in porous Cf-C (sometimes called C/C) composites, and then an additional step of RMI of Si was performed to fabricate a C/C-SiC composite. This novel manufacturing technique for CMCs allows for faster and more controlled processing, since fiber preforms were made by robot, and no tooling was necessary in the processing. This paper details the processing steps, characterization of the material after each processing step, and mechanical properties of the C/C-SiC composites processed without pressure (free-formed).
2. Materials and Methods
2.1. Materials
FBR-MP0007 from Desktop Metal, Inc. (Burlington, MA, USA) was used as the printing filament. This filament consists of 60 vol.% continuous Cf tow impregnated with PEEK to high density (1.57 g/cc), i.e., less than 3% porosity. Silicon metal powder (US Nanomaterial, Inc., Houston, TX, USA) with purity of 99.9% and 20 micrometer particle size was used for Si RMI.
2.2. Printing
The printing of the Cf-PEEK composites was done using an FFF printer called the Fiber from Desktop Metal (Burlington, MA). This printing style is known as micro automated fiber placement (µAFP), where tapes of previously impregnated Cf tows are forced through the heated nozzle and deposited onto the build platform. Tapes were laid down in 10 layers with alternating 0/90° direction. Each tape layer was 0.25 mm thick and 3 mm wide. The temperature of the build plate during printing was 150 °C. The temperature of the printing nozzle during printing was 350 °C.
2.3. Pyrolysis
Samples were pyrolyzed to convert PEEK to amorphous carbon, preparing the preform for reactive melt infiltration. Pyrolysis was conducted at 850 °C for 30 min at a heating rate of 2 °C/min, in 500 standard cubic centimeters per minute (sccm) of nitrogen gas (99.9% purity from Airgas) in a graphite furnace.
2.4. Silicon Reactive Melt Infiltration
Pressureless RMI of silicon was performed on the composites after pyrolysis [
34]. The mass of silicon required to fill the pores (Equation (1)) was calculated for each sample, and only that amount of Si was added for RMI, in order to achieve high density, limited residual Si, and high SiC content from the reaction. The mass of silicon to use for the infiltration is denoted as
.
is the volume of the pyrolyzed carbon fiber-carbon matrix part. The mass of carbon fiber-carbon matrix part is denoted as
.
is the mass density of silicon, and 1.8 is the density value used for carbon. Half of the predetermined amount of powdered Si was placed onto BN plates in a graphite crucible, the panels were placed on top of the Si powder, and the other half of the Si powder was placed on top of the porous C/C samples.
The heating cycle for reactive melt infiltration of silicon was done in two steps in one vacuum furnace. The first step heated samples to 1450 °C at 10 °C/min holding for 30 min under vacuum of ~10 Pa, followed by the second step, in which the chamber is filled with Ar to a total pressure of ~100,000 Pa to minimize silicon volatilization, and temperature increased to 1670 °C at 10 °C/min followed by holding for 1 h. The purpose of the second step at 1670 °C was to allow enough reaction time between Si and C to convert as much Si as possible to reaction-bonded SiC.
2.5. Characterization and Mechanical Properties
Archimedes, geometrical, and areal densities were measured where applicable. For pore volume, optical cross-sections were analyzed for areal density, and that value was assumed to hold in 3D, so that the correct amount of silicon could be added. Optical microscopy of specimen cross sections was performed with a Keyence VHX-1000 system. Raman spectroscopy was used to identify the two carbon phases (fibers and matrix from converted PEEK), residual Si metal, and SiC. Raman spectra were obtained with a Renishaw Invia Raman microprobe using a Nd-YAG laser operating at 532 nm and a spot size of ~1 µm. Phase identification was conducted using the principal component analysis within the vendor’s Wire 5.2 software.
X-ray computed tomography (XCT) was done using a Zeiss Metrotom (Carl Zeiss Industrial Metrology, Maple Grove, MN, USA) to help identify delamination, pores, defects, and distortion. The scans were done with a 0.5 mm Cu filter at 180 kV, 97 µA, and 1000 ms with 16 µm resolution in the X, Y, and Z directions. All of the XCT data were reconstructed using VGstudio Max version 3.2.
Thermogravimetric analysis (TGA) using a TA Q50 (TA Instruments, New Castle, DE, USA) was used to determine the decomposition, mass loss, and char yield of the Cf-PEEK printing tow or filament. Thermal treatment was performed at a 10 °C/min heating rate from room temperature to 900 °C in air and flowing nitrogen (N2) at a rate of 50 mL/min.
Four-point bending tests were performed (Equation (2)) on samples with dimensions of 50 mm × 4 mm × 3 mm to measure the displacement and flexural strength, following the procedure outlined in ASTM C1161 using an electromechanical test frame (Instru-Met, Union, NJ, USA) and a silicon carbide fixture with an inner span of 20 mm and outer support span of 40 mm. The strain rate was 0.01 mm/s at 50 Hz collection rate.
is the flexural strength,
is the load,
is the support span,
is the width of the test specimen, and
is the thickness of the sample.
3. Results and Discussion
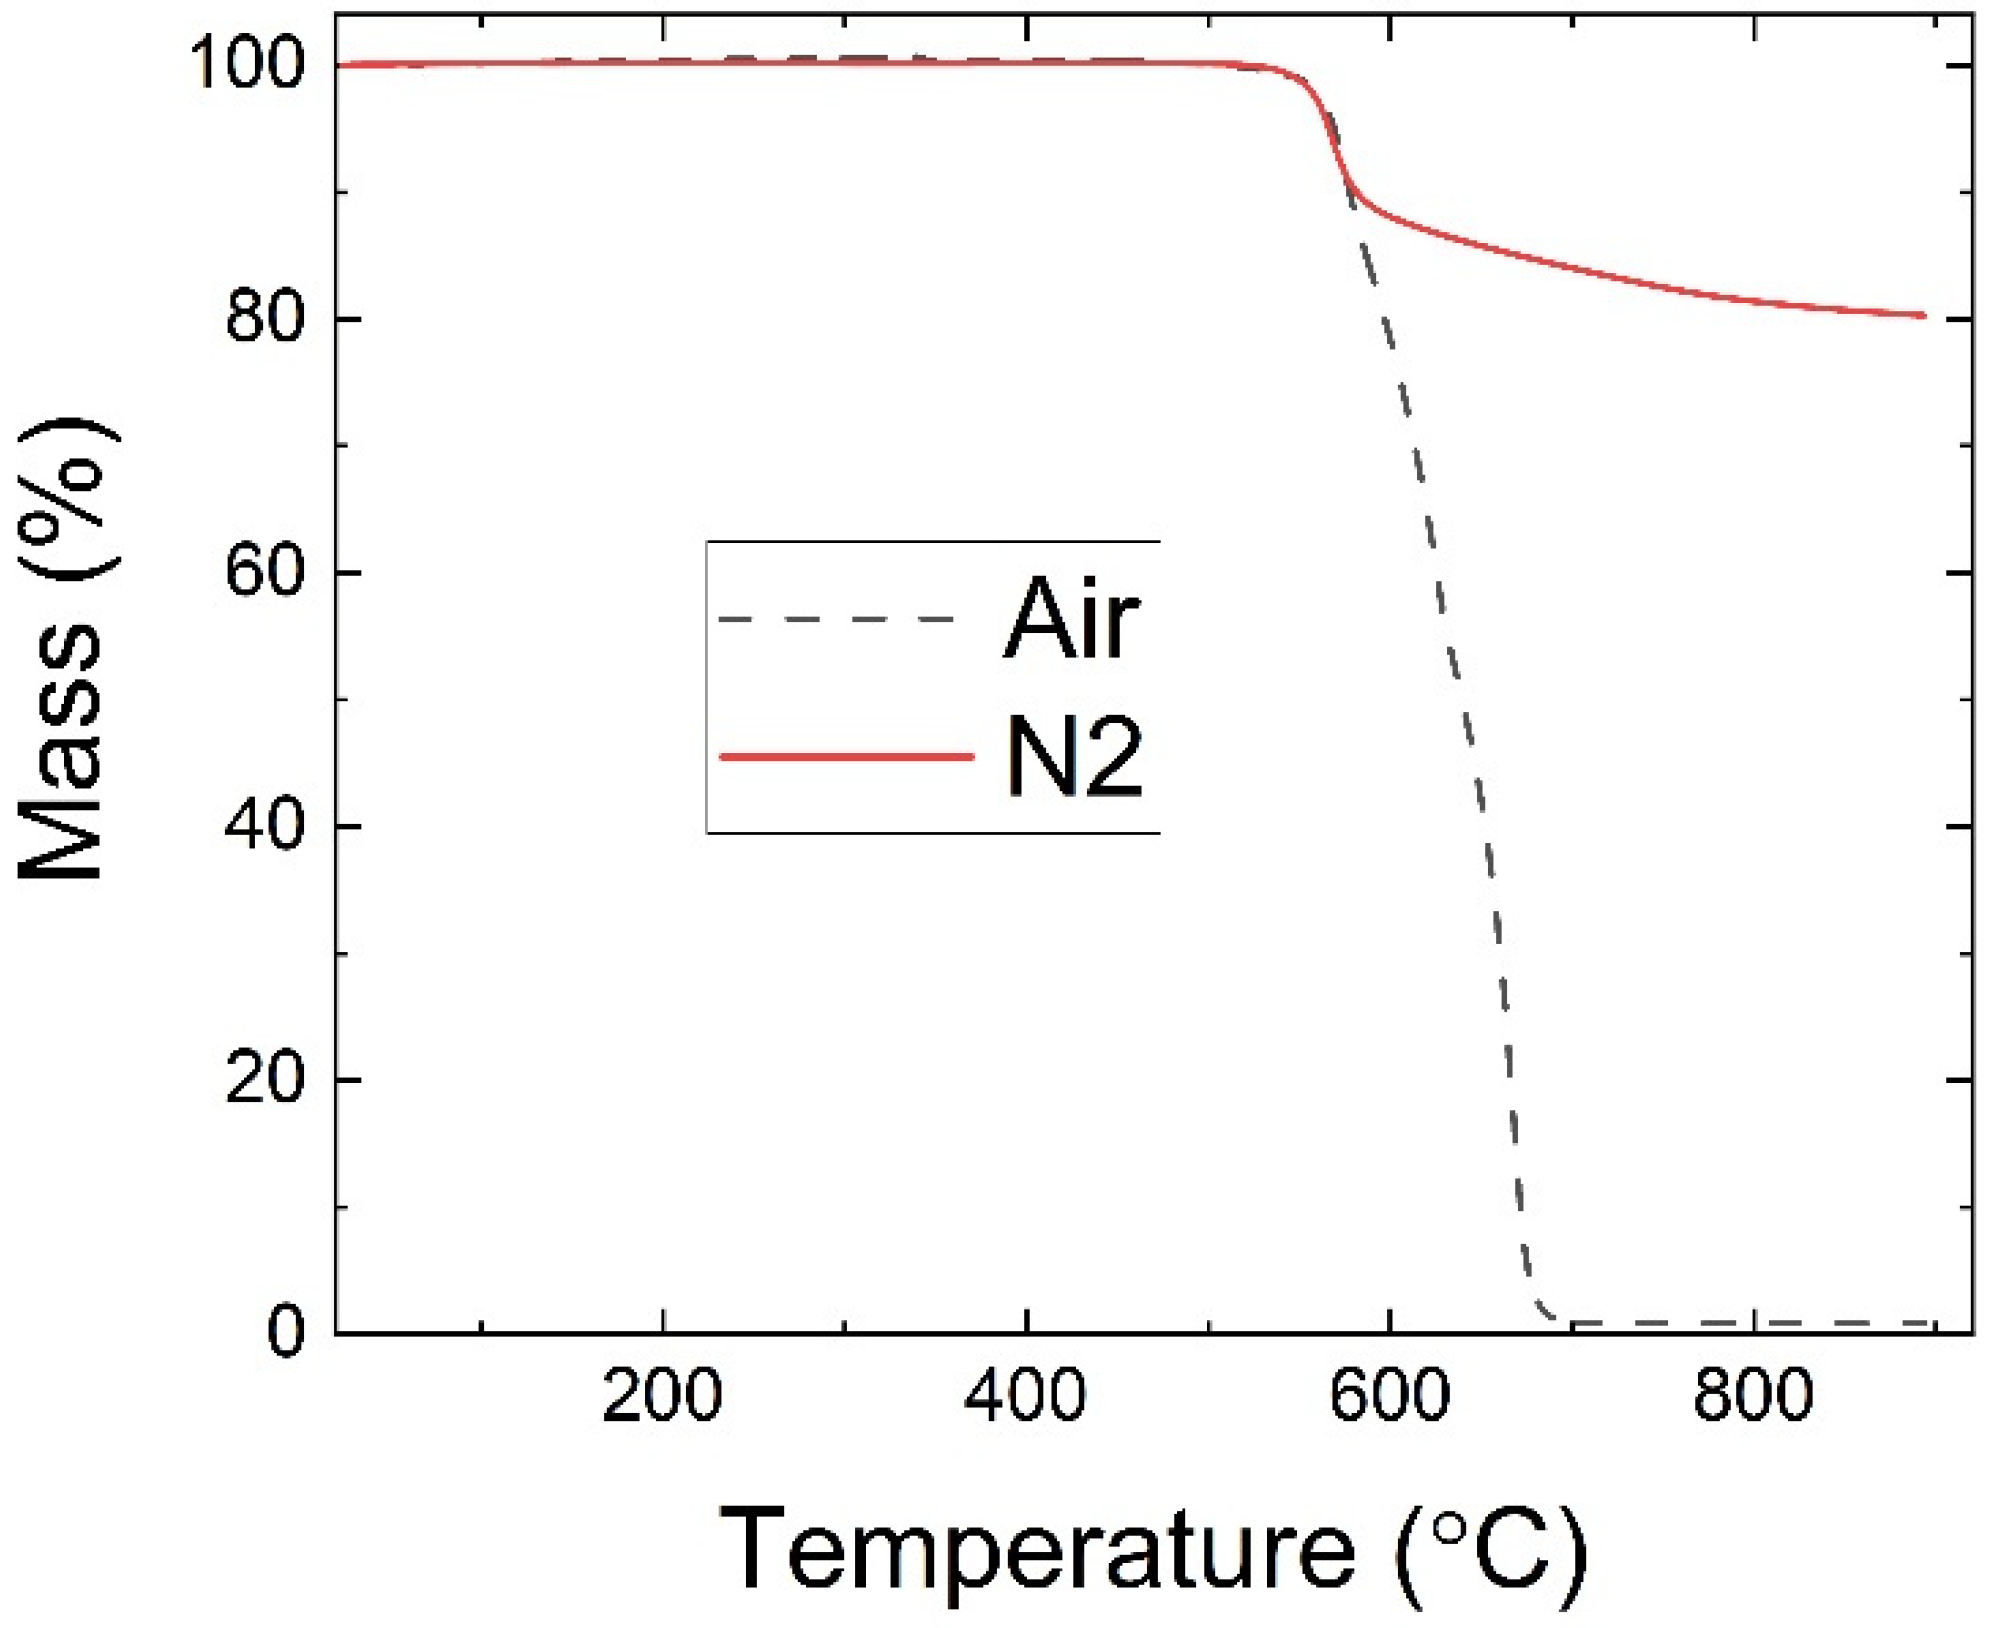
Figure 1 shows the TGA curve for the Cf-PEEK filament in air and N
2. In both cases, the PEEK started to decompose at 600 °C. The comparison is made to show that PEEK and carbon fibers will completely decompose (i.e., reduce in mass to near zero) if heated to 900 °C in air. Heating in the N
2 environment resulted in 80 wt.% retention in the material, which is not a direct char yield because carbon fibers were already embedded in the PEEK as a tow, but it shows that most of the material is retained after the pyrolysis. More imaging analysis is needed to elucidate the microstructure of the resulting Cf-C material.
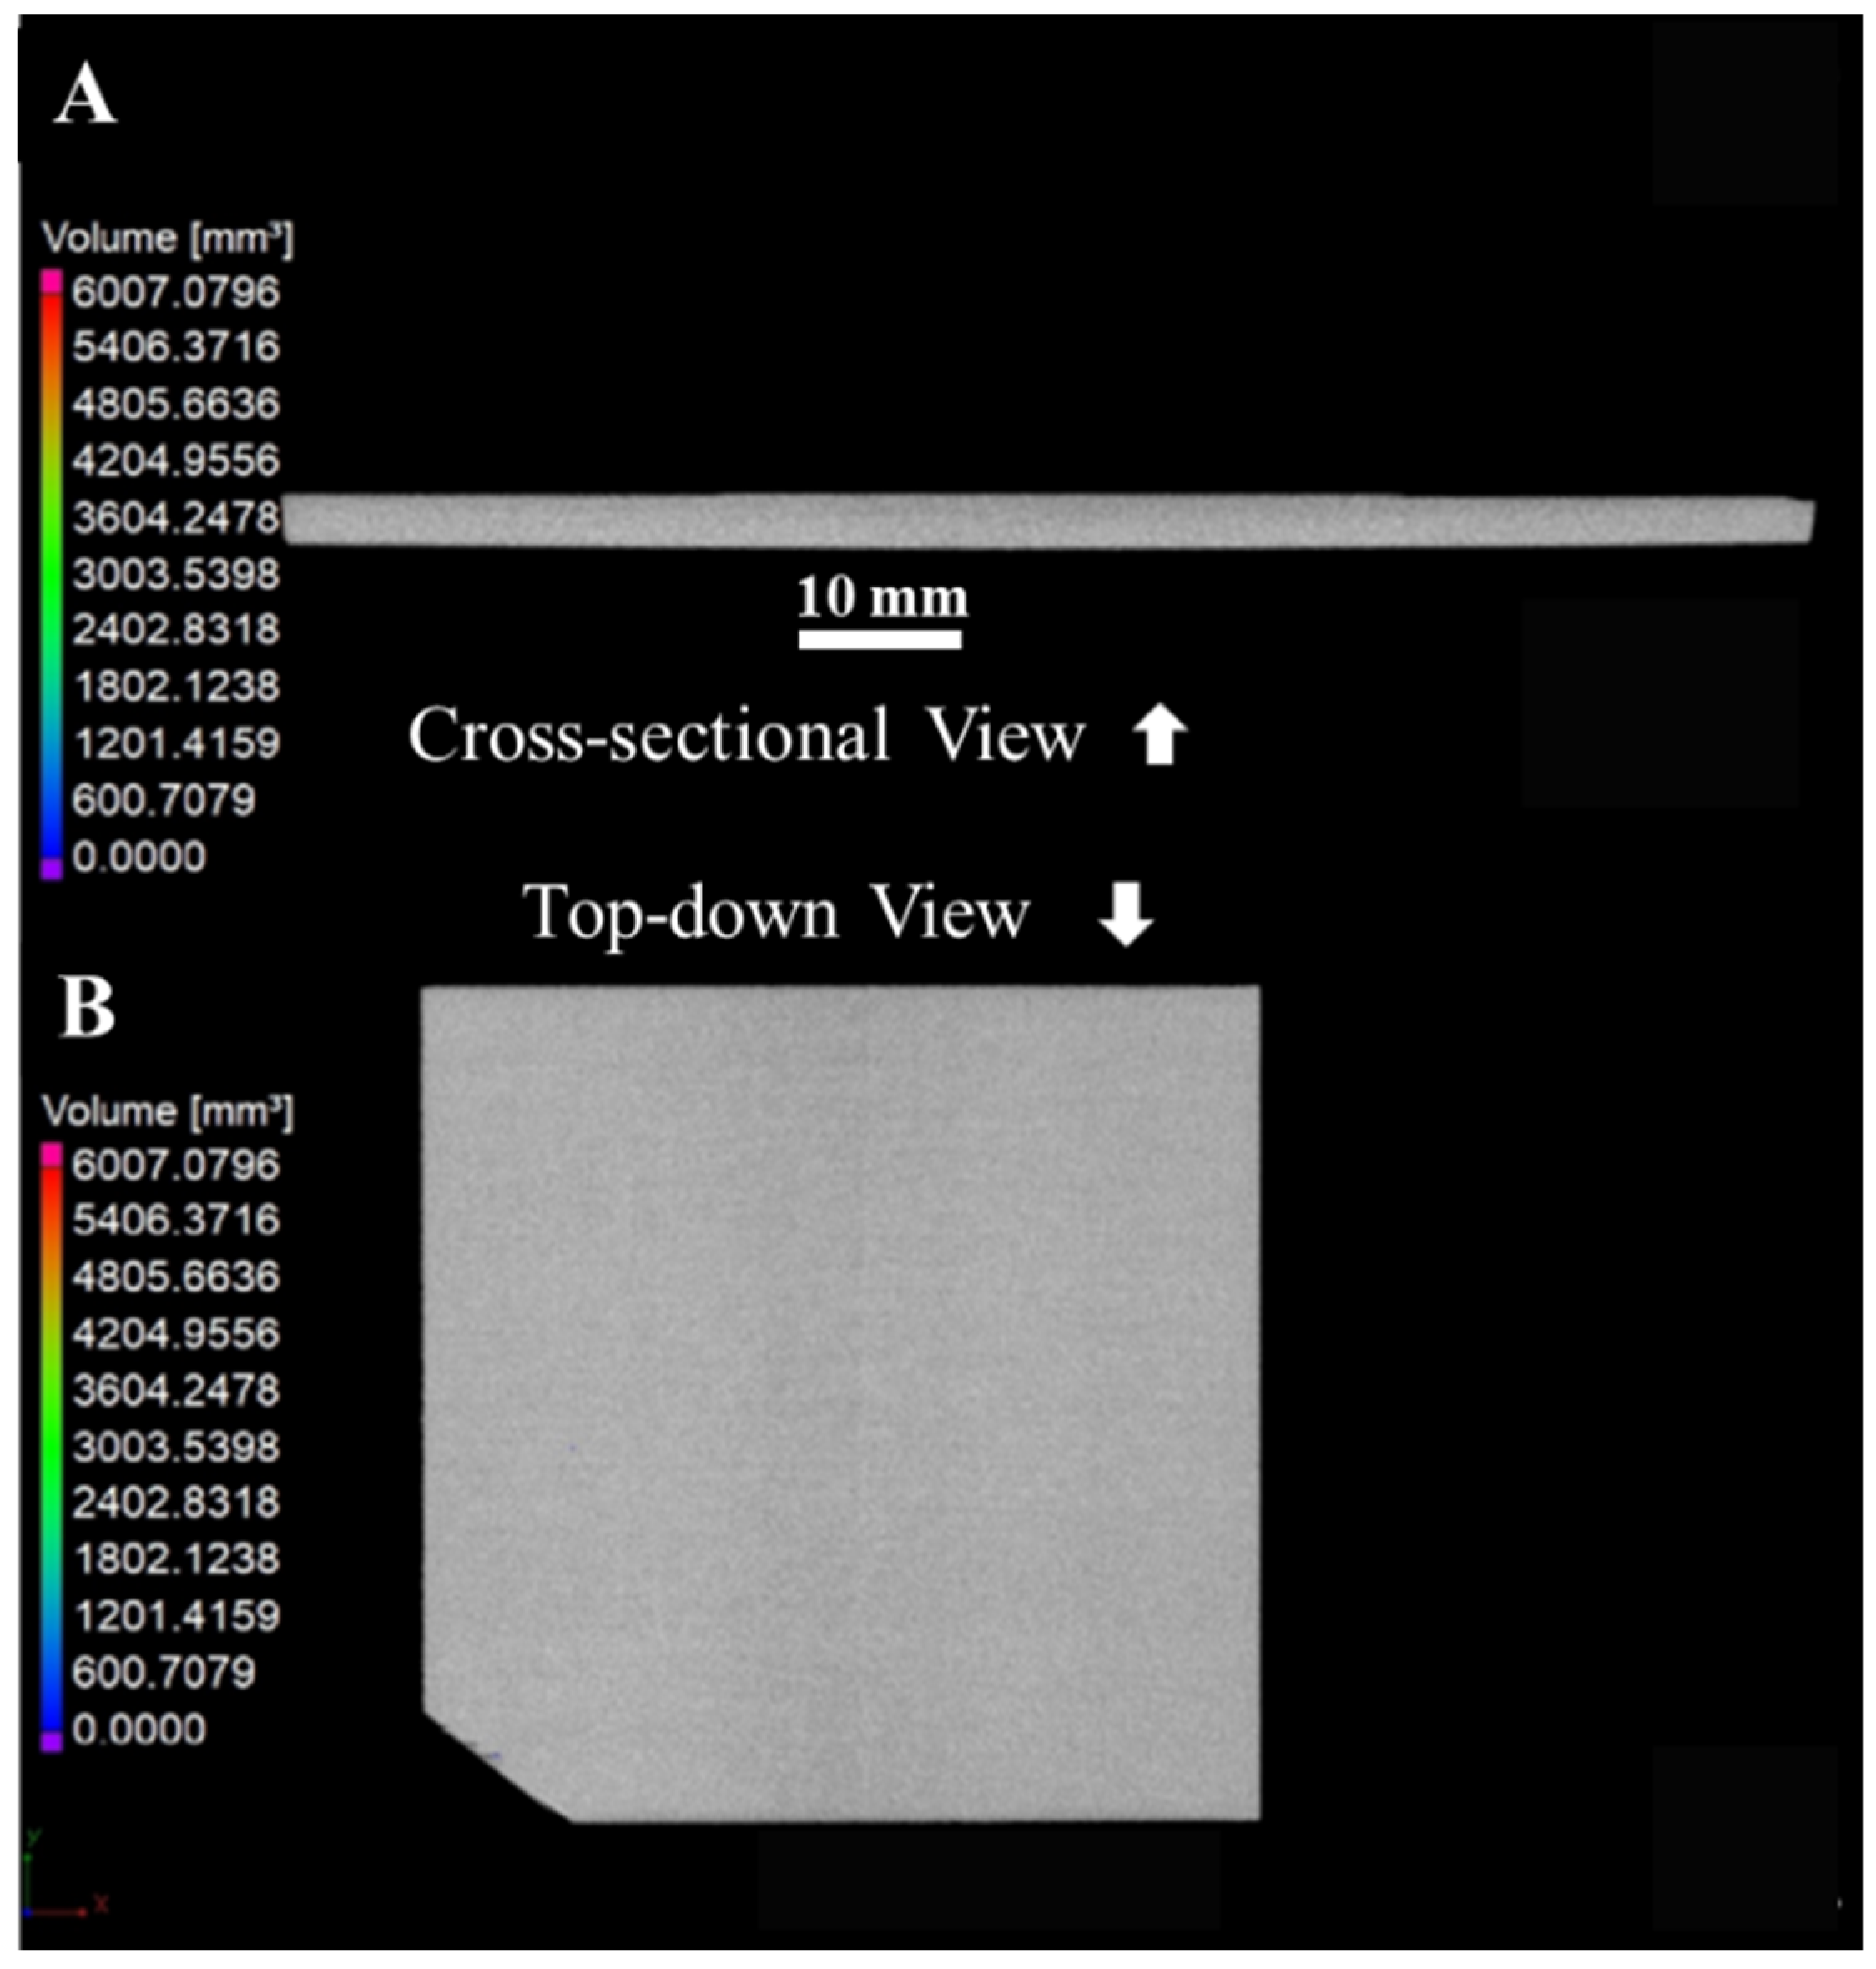
Figure 2 shows an optical image of a printed Cf-PEEK part. The sample was highly dense, and there were no detectable pores. That is because the PEEK worked its way into the part well and adheres the fiber layers. Moreover, the CT scan resolution is in the micron range, so no pores in the submicron range can be detected. Since these two materials, PEEK and carbon, have very low density, it is difficult to obtain scans where the two are distinctly identified versus the background ambient air.
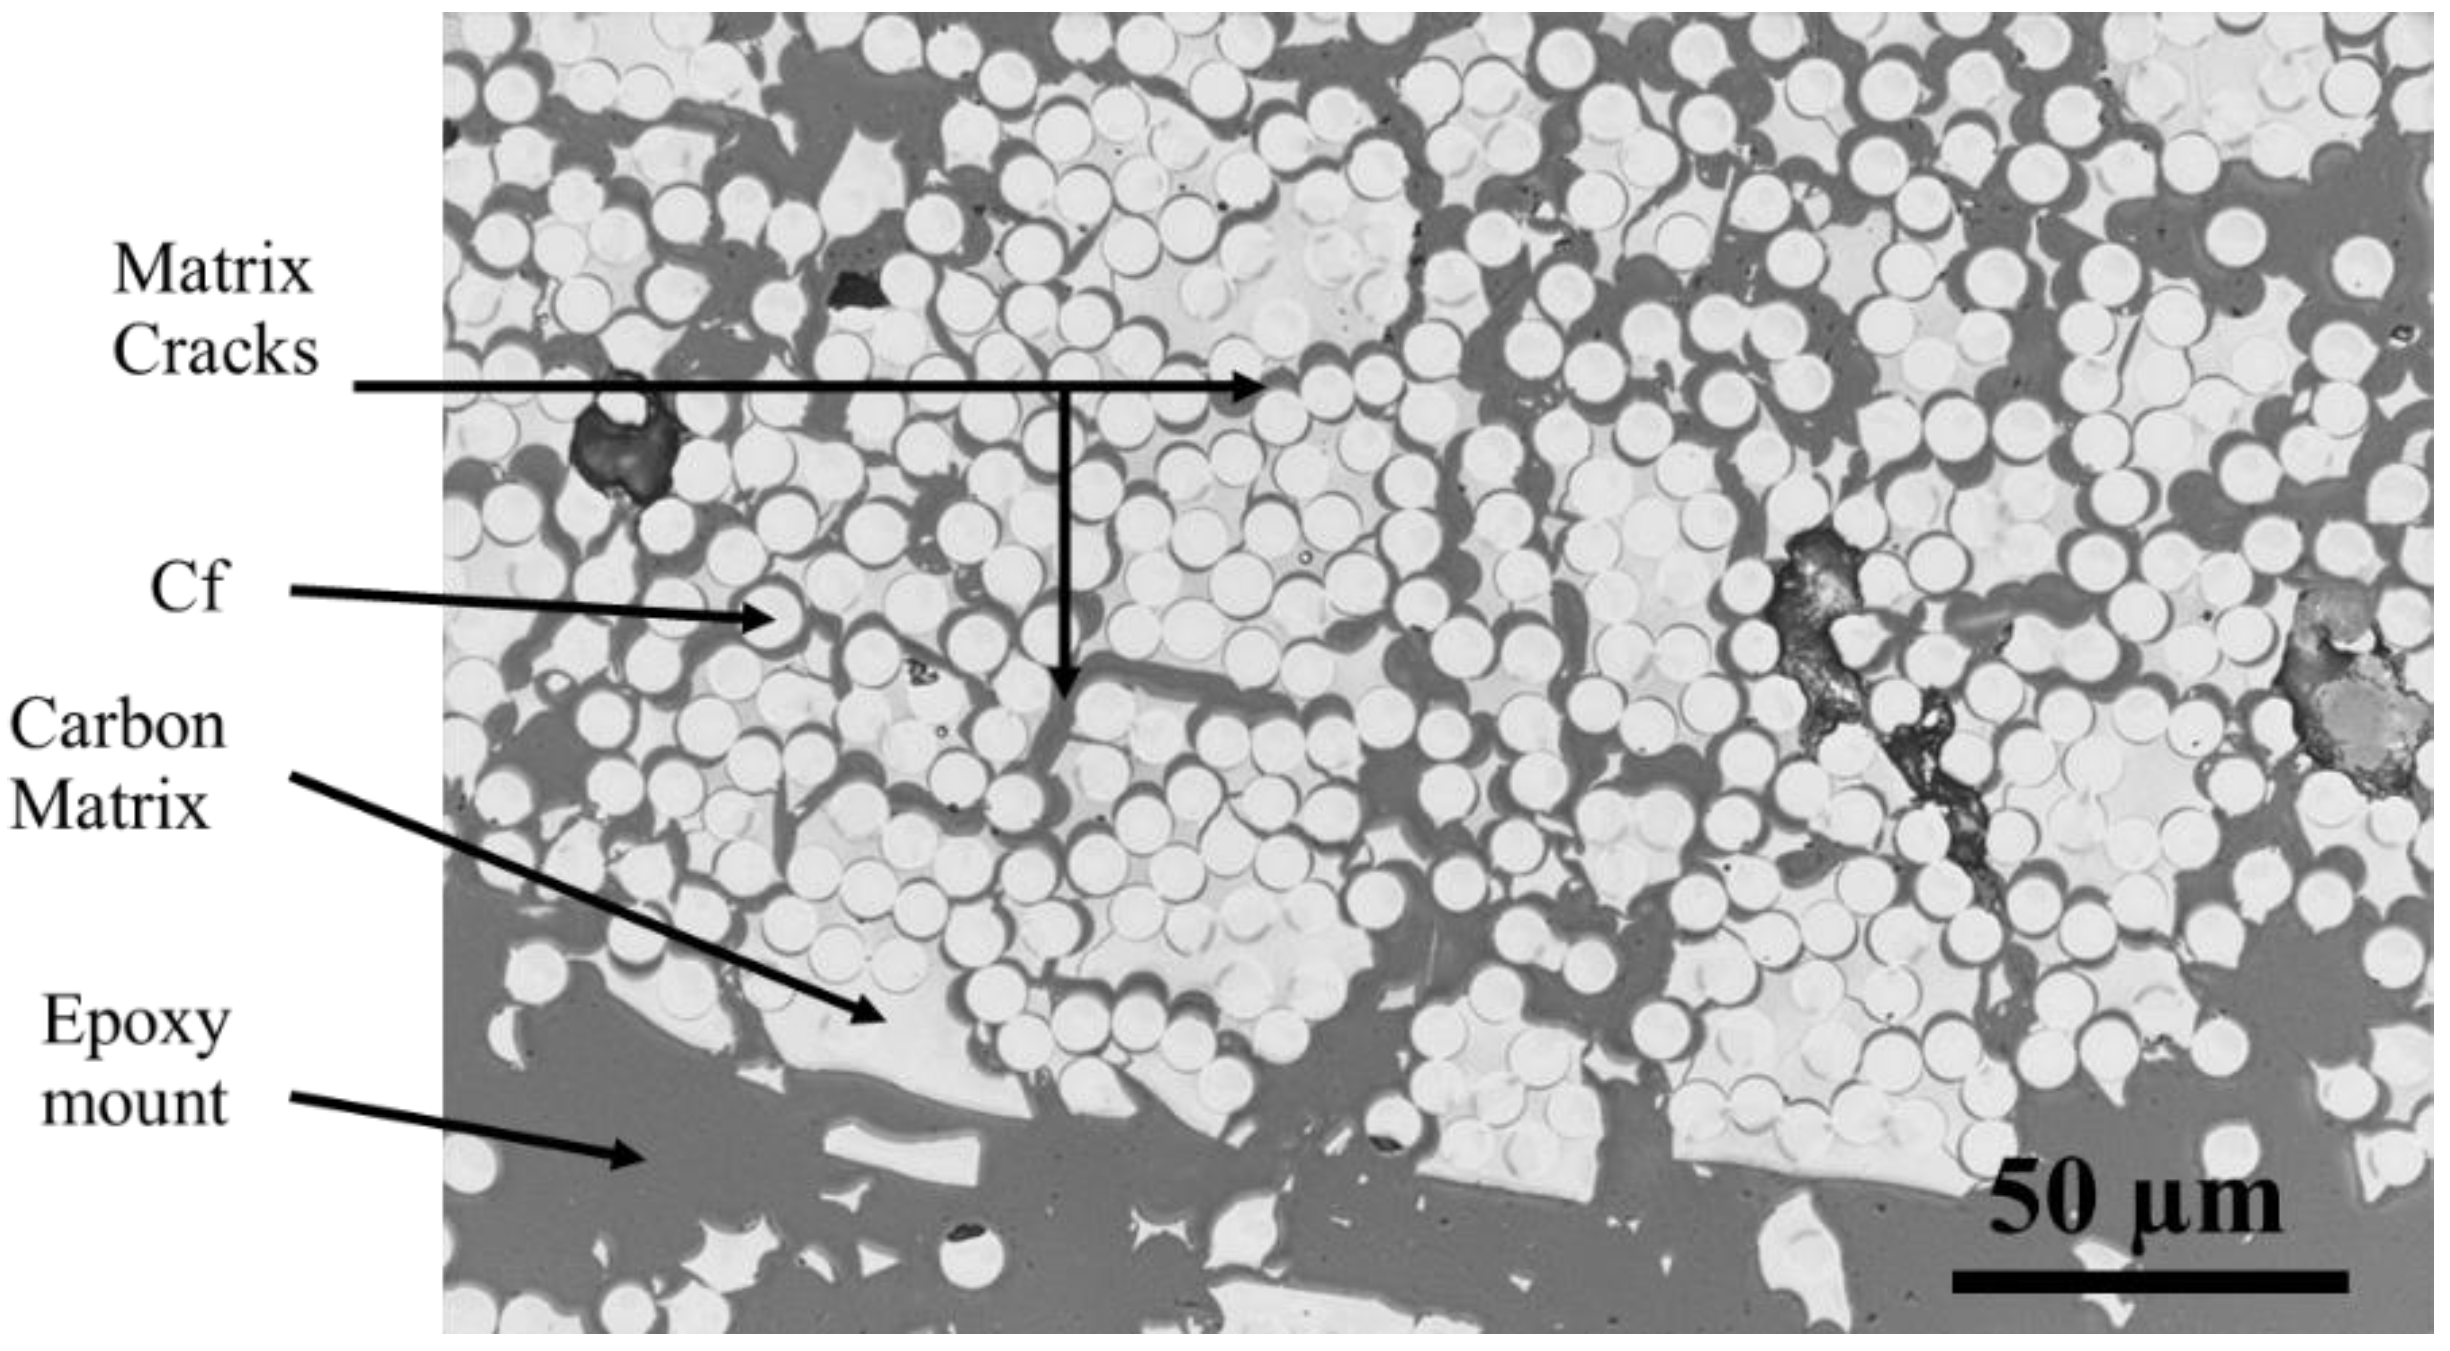
Figure 3 shows an optical image of a pyrolyzed Cf-PEEK part. The pyrolyzed part consists of Cf, shown by the circles in the 2D image and the carbon matrix around the Cf from the conversion process during pyrolysis. The newly formed carbon matrix holds the fiber tows together and mostly surrounds the Cf. There are several areas of cracking and debonding of the carbon matrix around the fibers, which provides a pathway for the subsequent Si infiltrant. The mass and density of the samples were measured before and after pyrolysis and are shown in
Table 1. The dense Cf-PEEK lost mass during pyrolysis and decreased in density. During pyrolysis in an inert atmosphere, predominantly non-carbon elements are removed as volatiles, leaving predominantly carbon in the matrix. Therefore, the density decrease is from two events: (1) the loss of matter from the decomposition of the PEEK thermoplastic structure and (2) the potential bloating of the structure due to pressure built up during the pyrolysis phase.
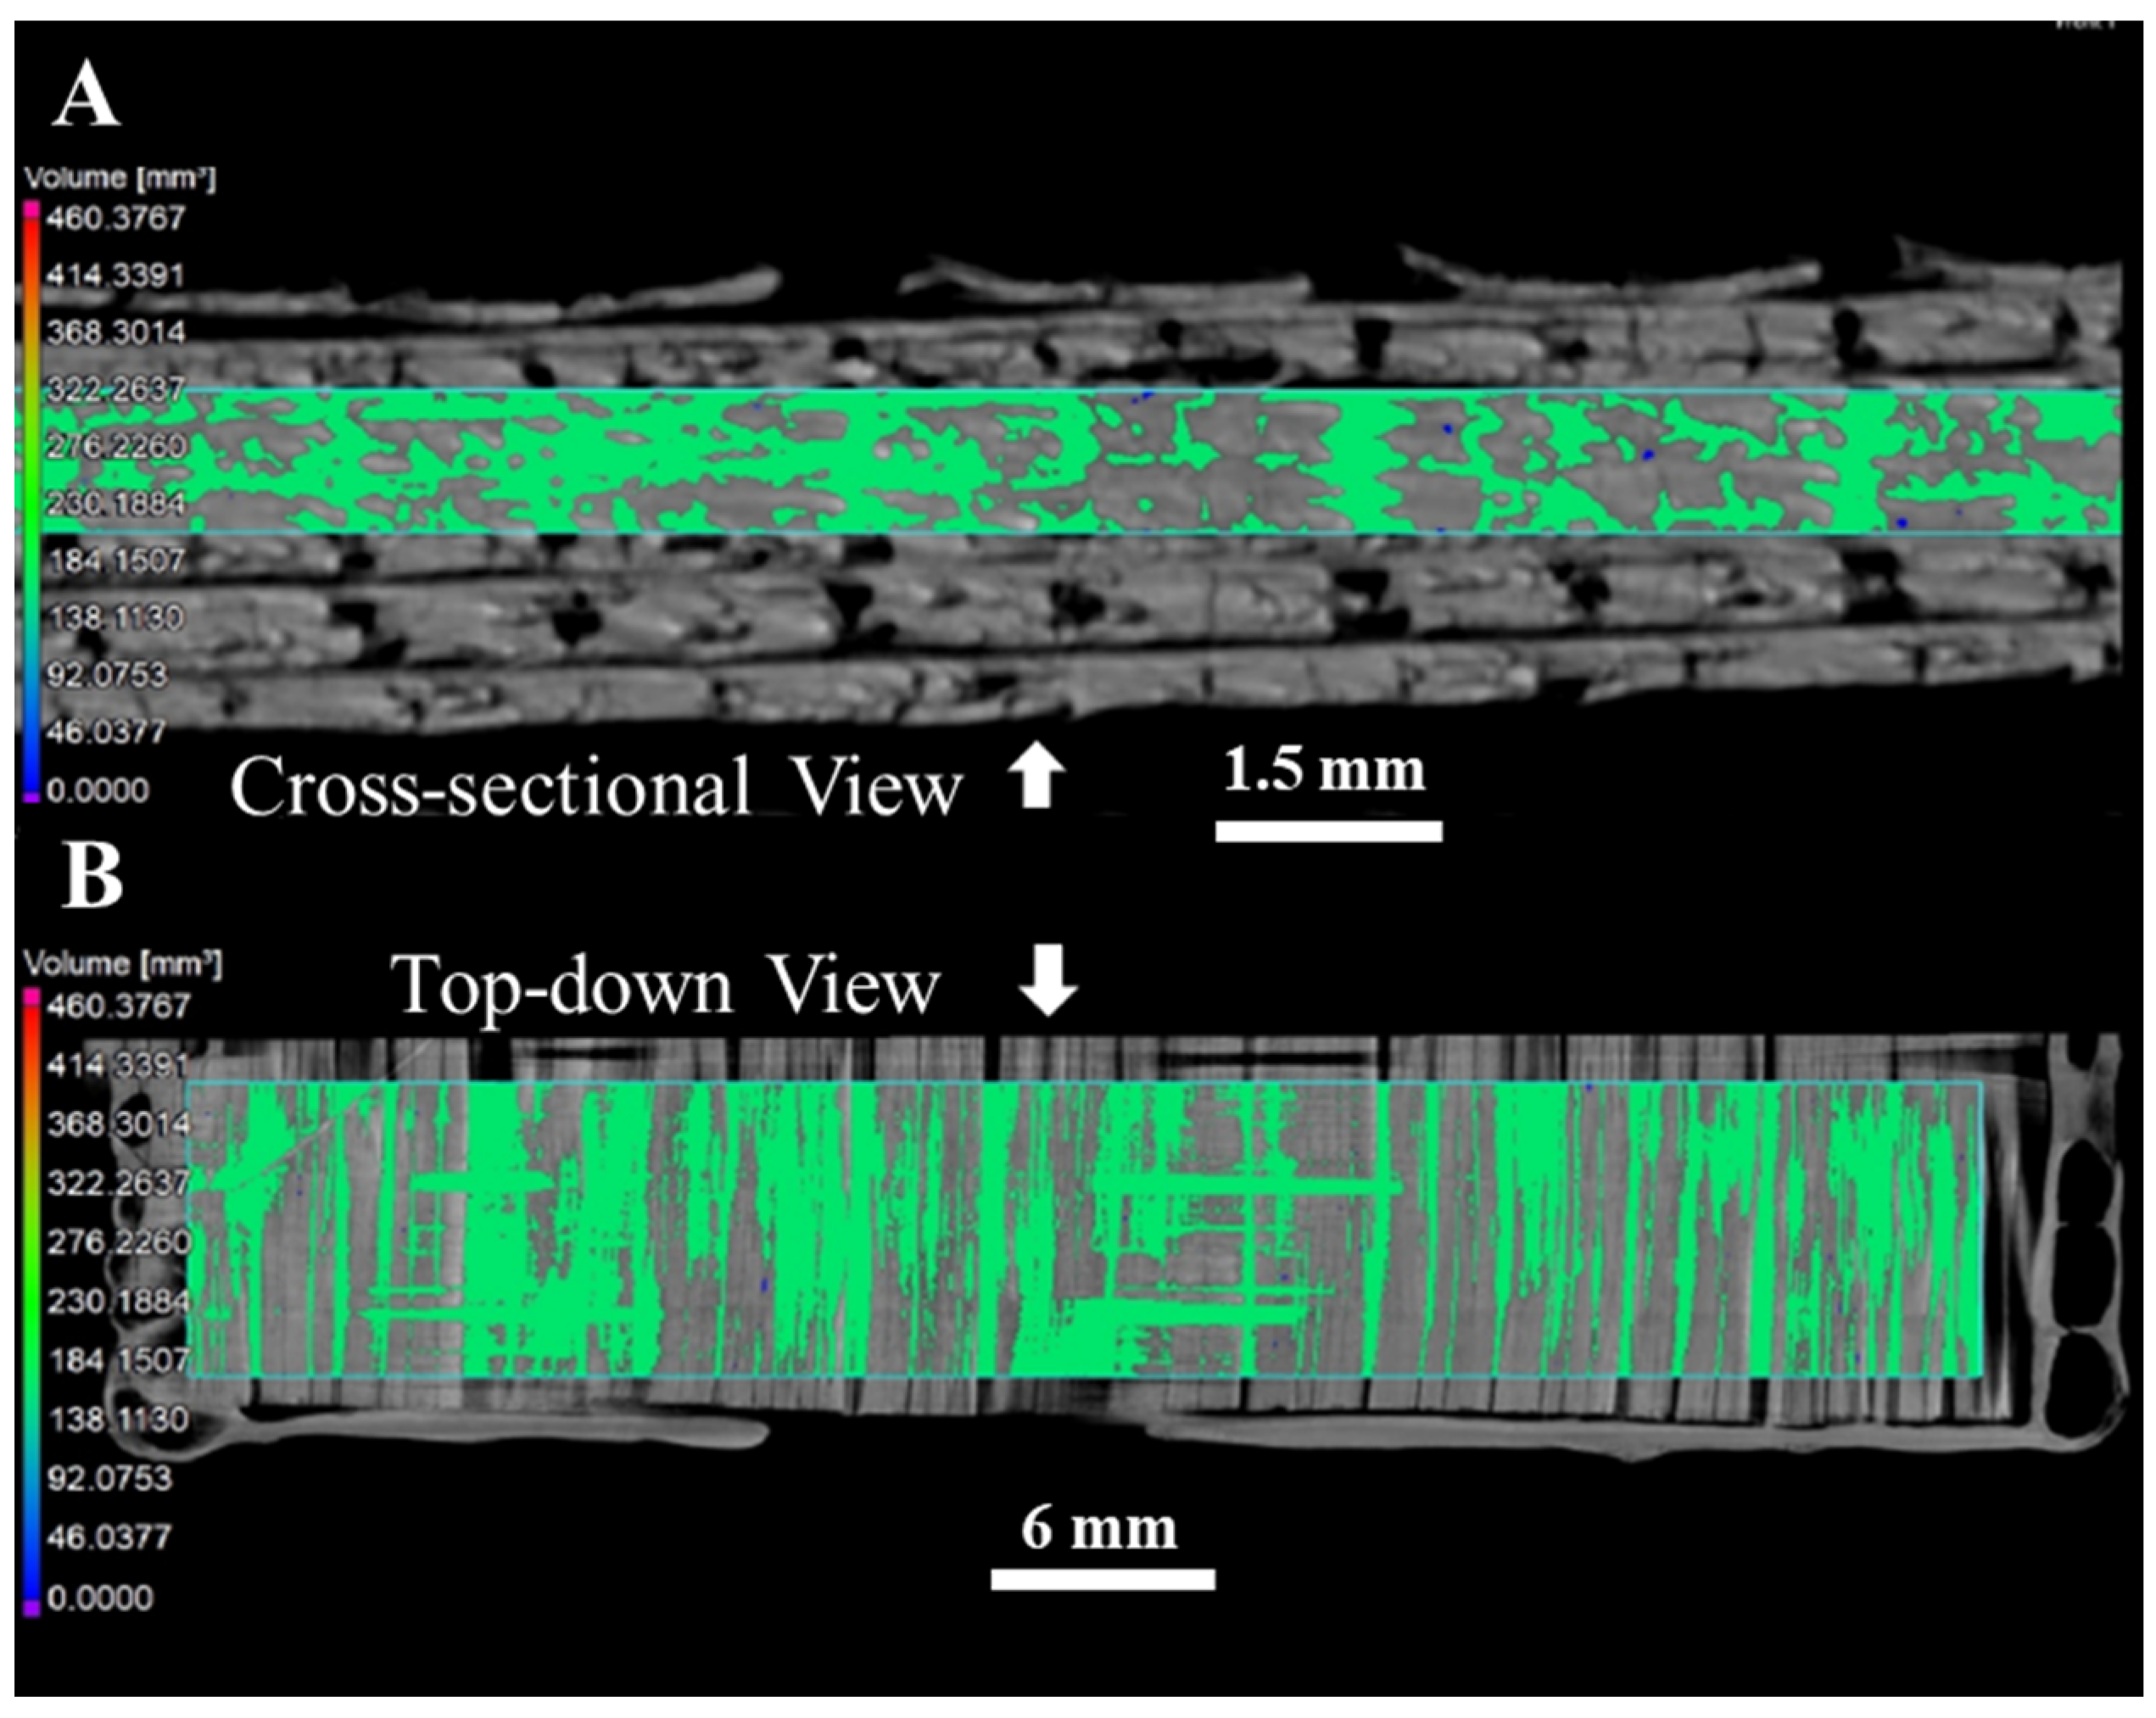
An XCT scan of Cf-C in
Figure 4 was performed to show the volumetric porosity and defects of the bulk samples when converting the Cf-PEEK samples into porous Cf-C samples. There is some delamination between tows, and there is porosity between and within the tows. The porosity of the samples was measured to be about 40 vol.%. This verified that the carbon matrix had enough cracks and open porosity to enable infiltration by the liquid silicon material.
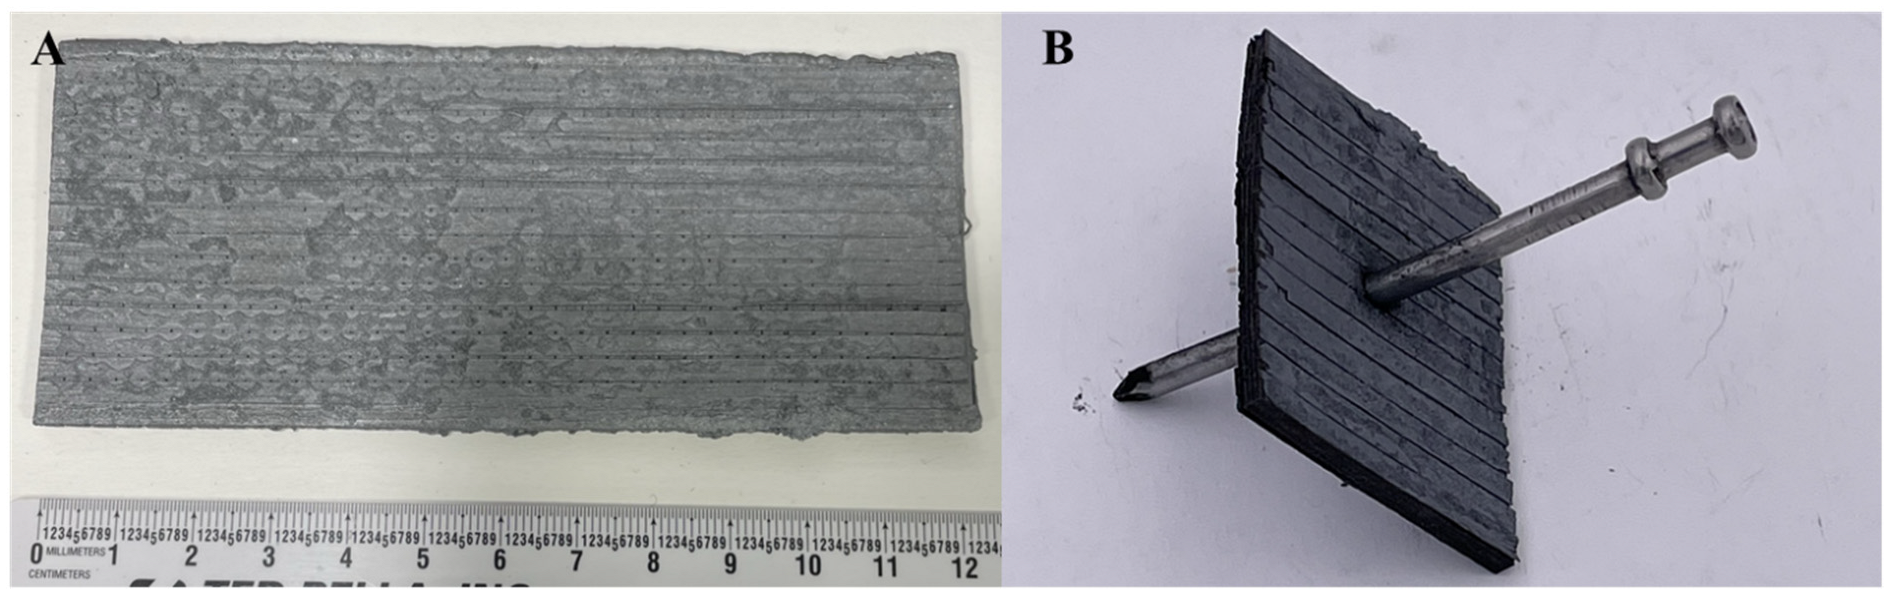
Figure 5A shows an image of a C/C-SiC part after processing the Cf-PEEK samples through pyrolysis to convert PEEK to carbon and the Si melt infiltration step to convert some of the carbon matrix to SiC. The panel was primarily flat with some deviation (~5%), likely due to a minor difference between the volume increase experienced during the formation of SiC and the initial level of porosity in the Cf-C preform. There is residual Si on the surface, so XCT scans were performed to quantify and spatially resolve the pores and defects in the microstructure. A sample was subjected to impact damage by driving a nail through it (
Figure 5B). The composite demonstrated toughness, as the sample did not catastrophically fail. The structural integrity was maintained in all but the affected area with the local impact of the nail. Panels were machined into bend bars to further quantify the strength and toughness of the composites.
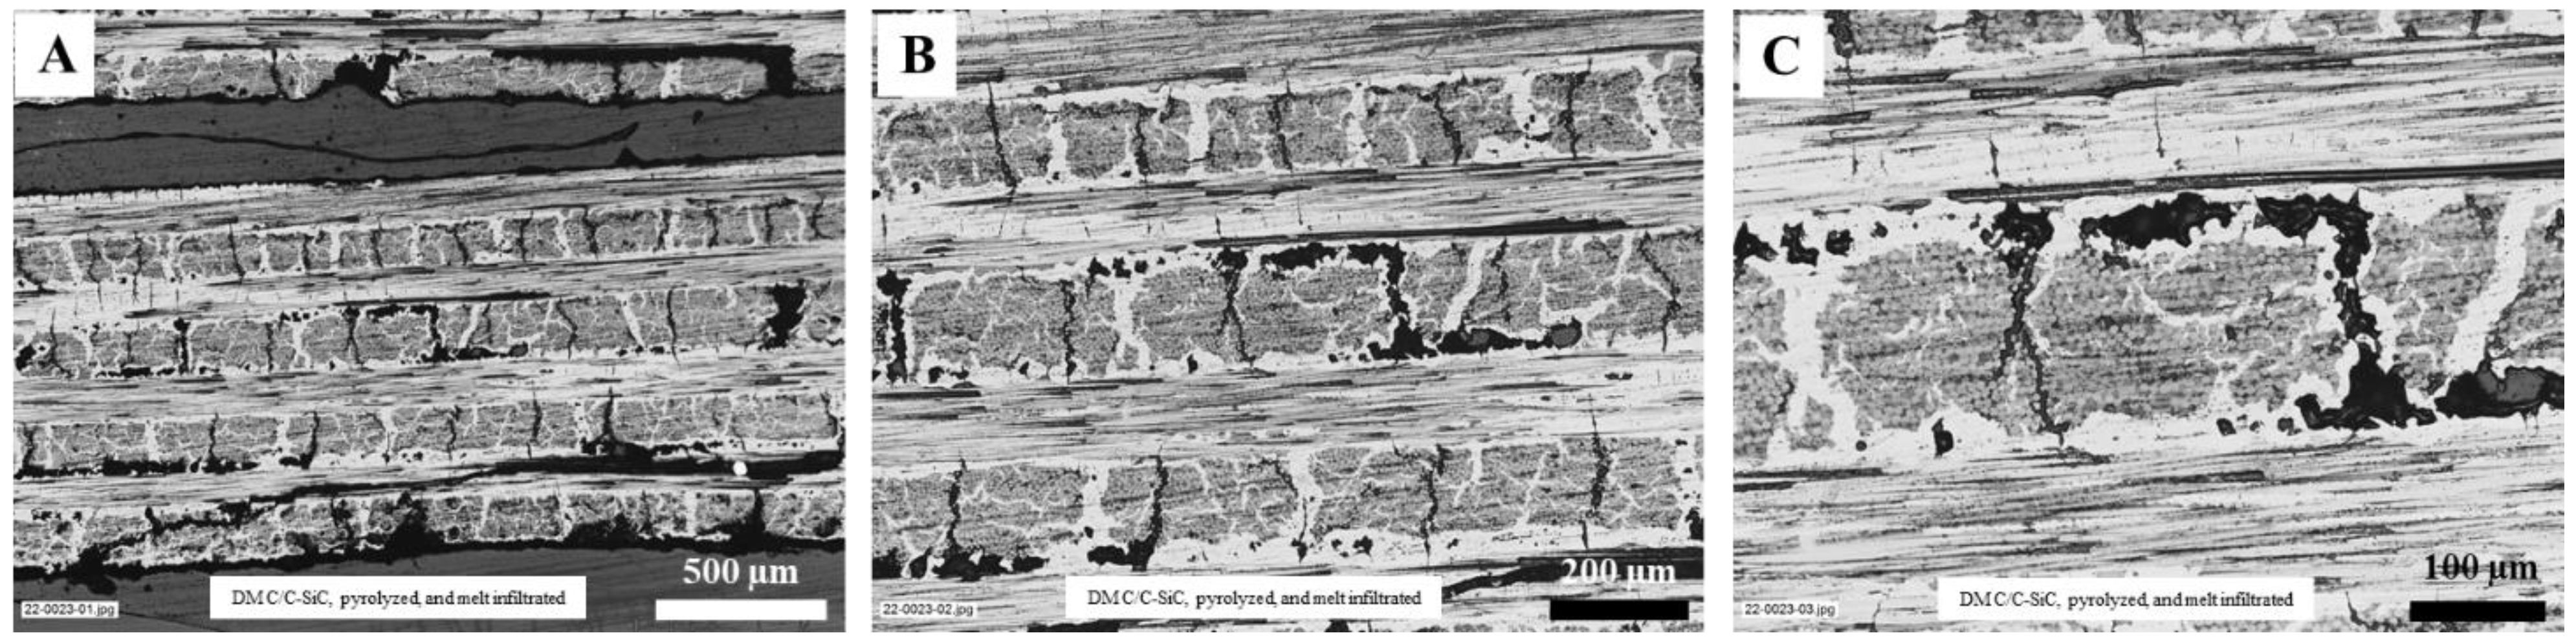
Figure 6 shows optical micrograph images of the cross-sections of a C/C-SiC composite plate. Regions of delamination can be observed in
Figure 6A. Causes of delamination must be identified, and the extent of delamination must be minimized in order for these composites to be useful as structural materials. The images in
Figure 6B and C show that the thickness of the layers in the C/C-SiC composite is approximately 200 μm. It can be observed in
Figure 6B and C that following Si RMI, the microstructure is a mixture of carbon fibers, SiC, Si, and porosity, indicating that the melt infiltration was successful, but the process could be further optimized. The microstructures of the C/C-SiC composites processed for this study resemble those of similar materials [
23,
24]. The results from previous studies indicate that applying pressure during fabrication may reduce delamination. Delamination areas or gaps can occur in parts when the fiber tows are not placed close enough together during the printing deposition process.
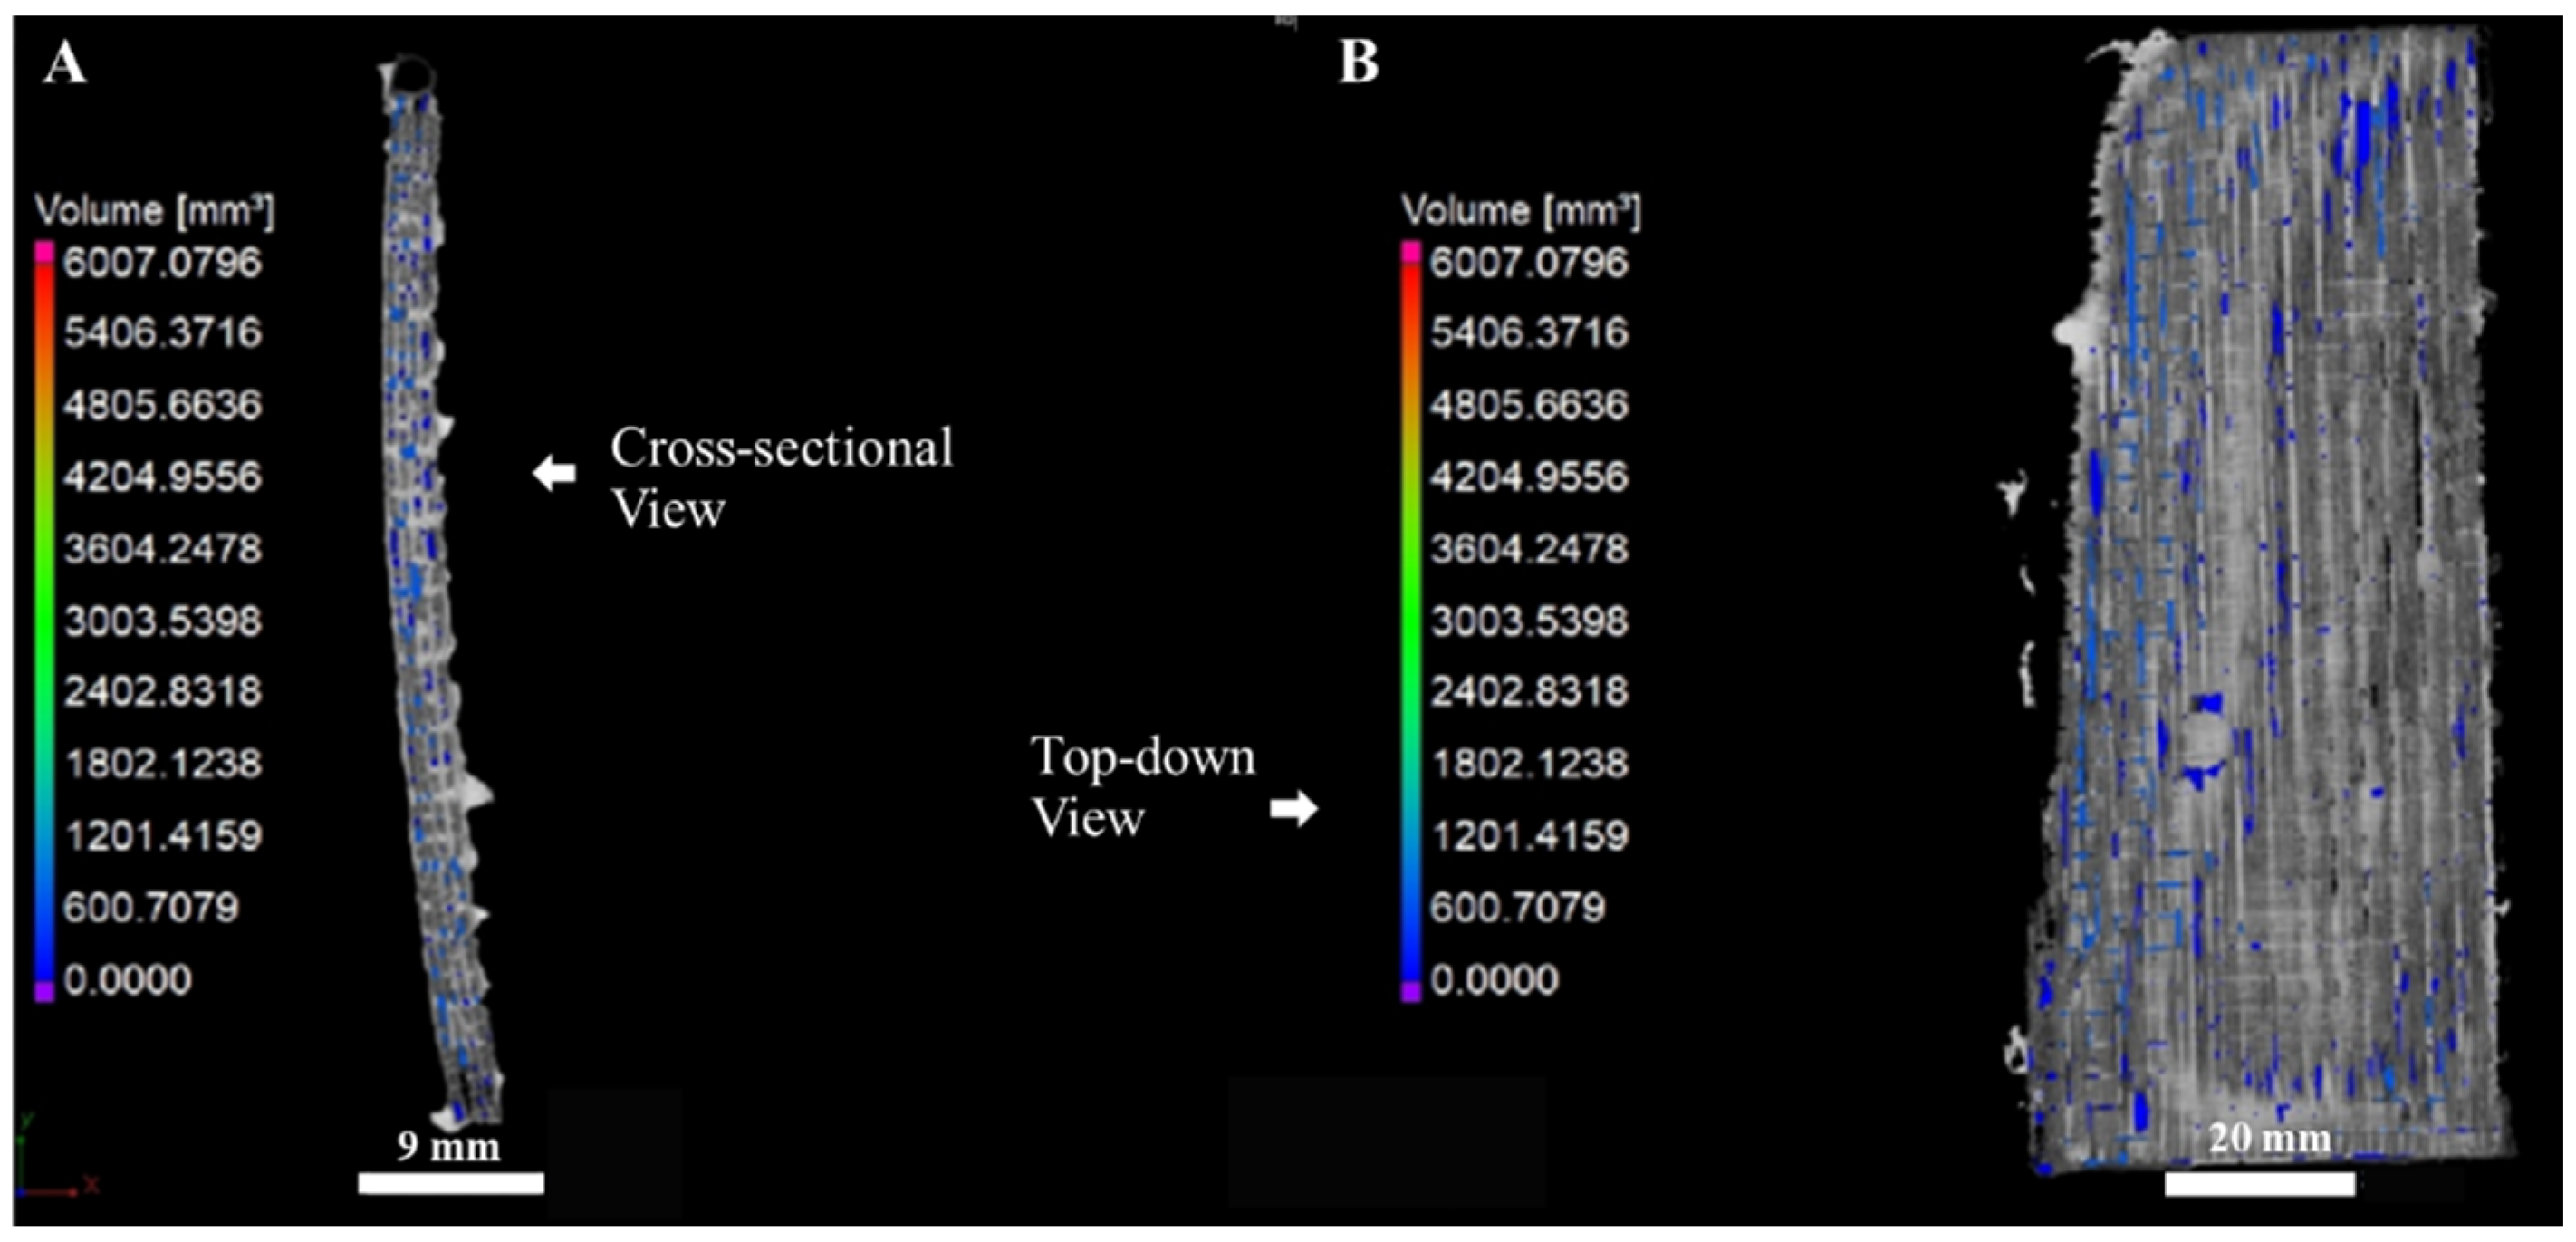
An XCT scan of the C/C-SiC preform was obtained to observe the volumetric porosity and defects in the final composite. The results of the XCT analysis are shown in
Figure 7. The areas of delamination and pores between tows can be identified in the scans. The total amount of porosity in the composites was estimated to be approximately 10–20 vol.%, although delamination could have introduced variations in the estimated value. In addition, the total warpage was minimal and was under 5% deviation from the printed part. An animation of the CT scan reconstruction showing the part volume and defects is shown in
Supplementary Video S1.
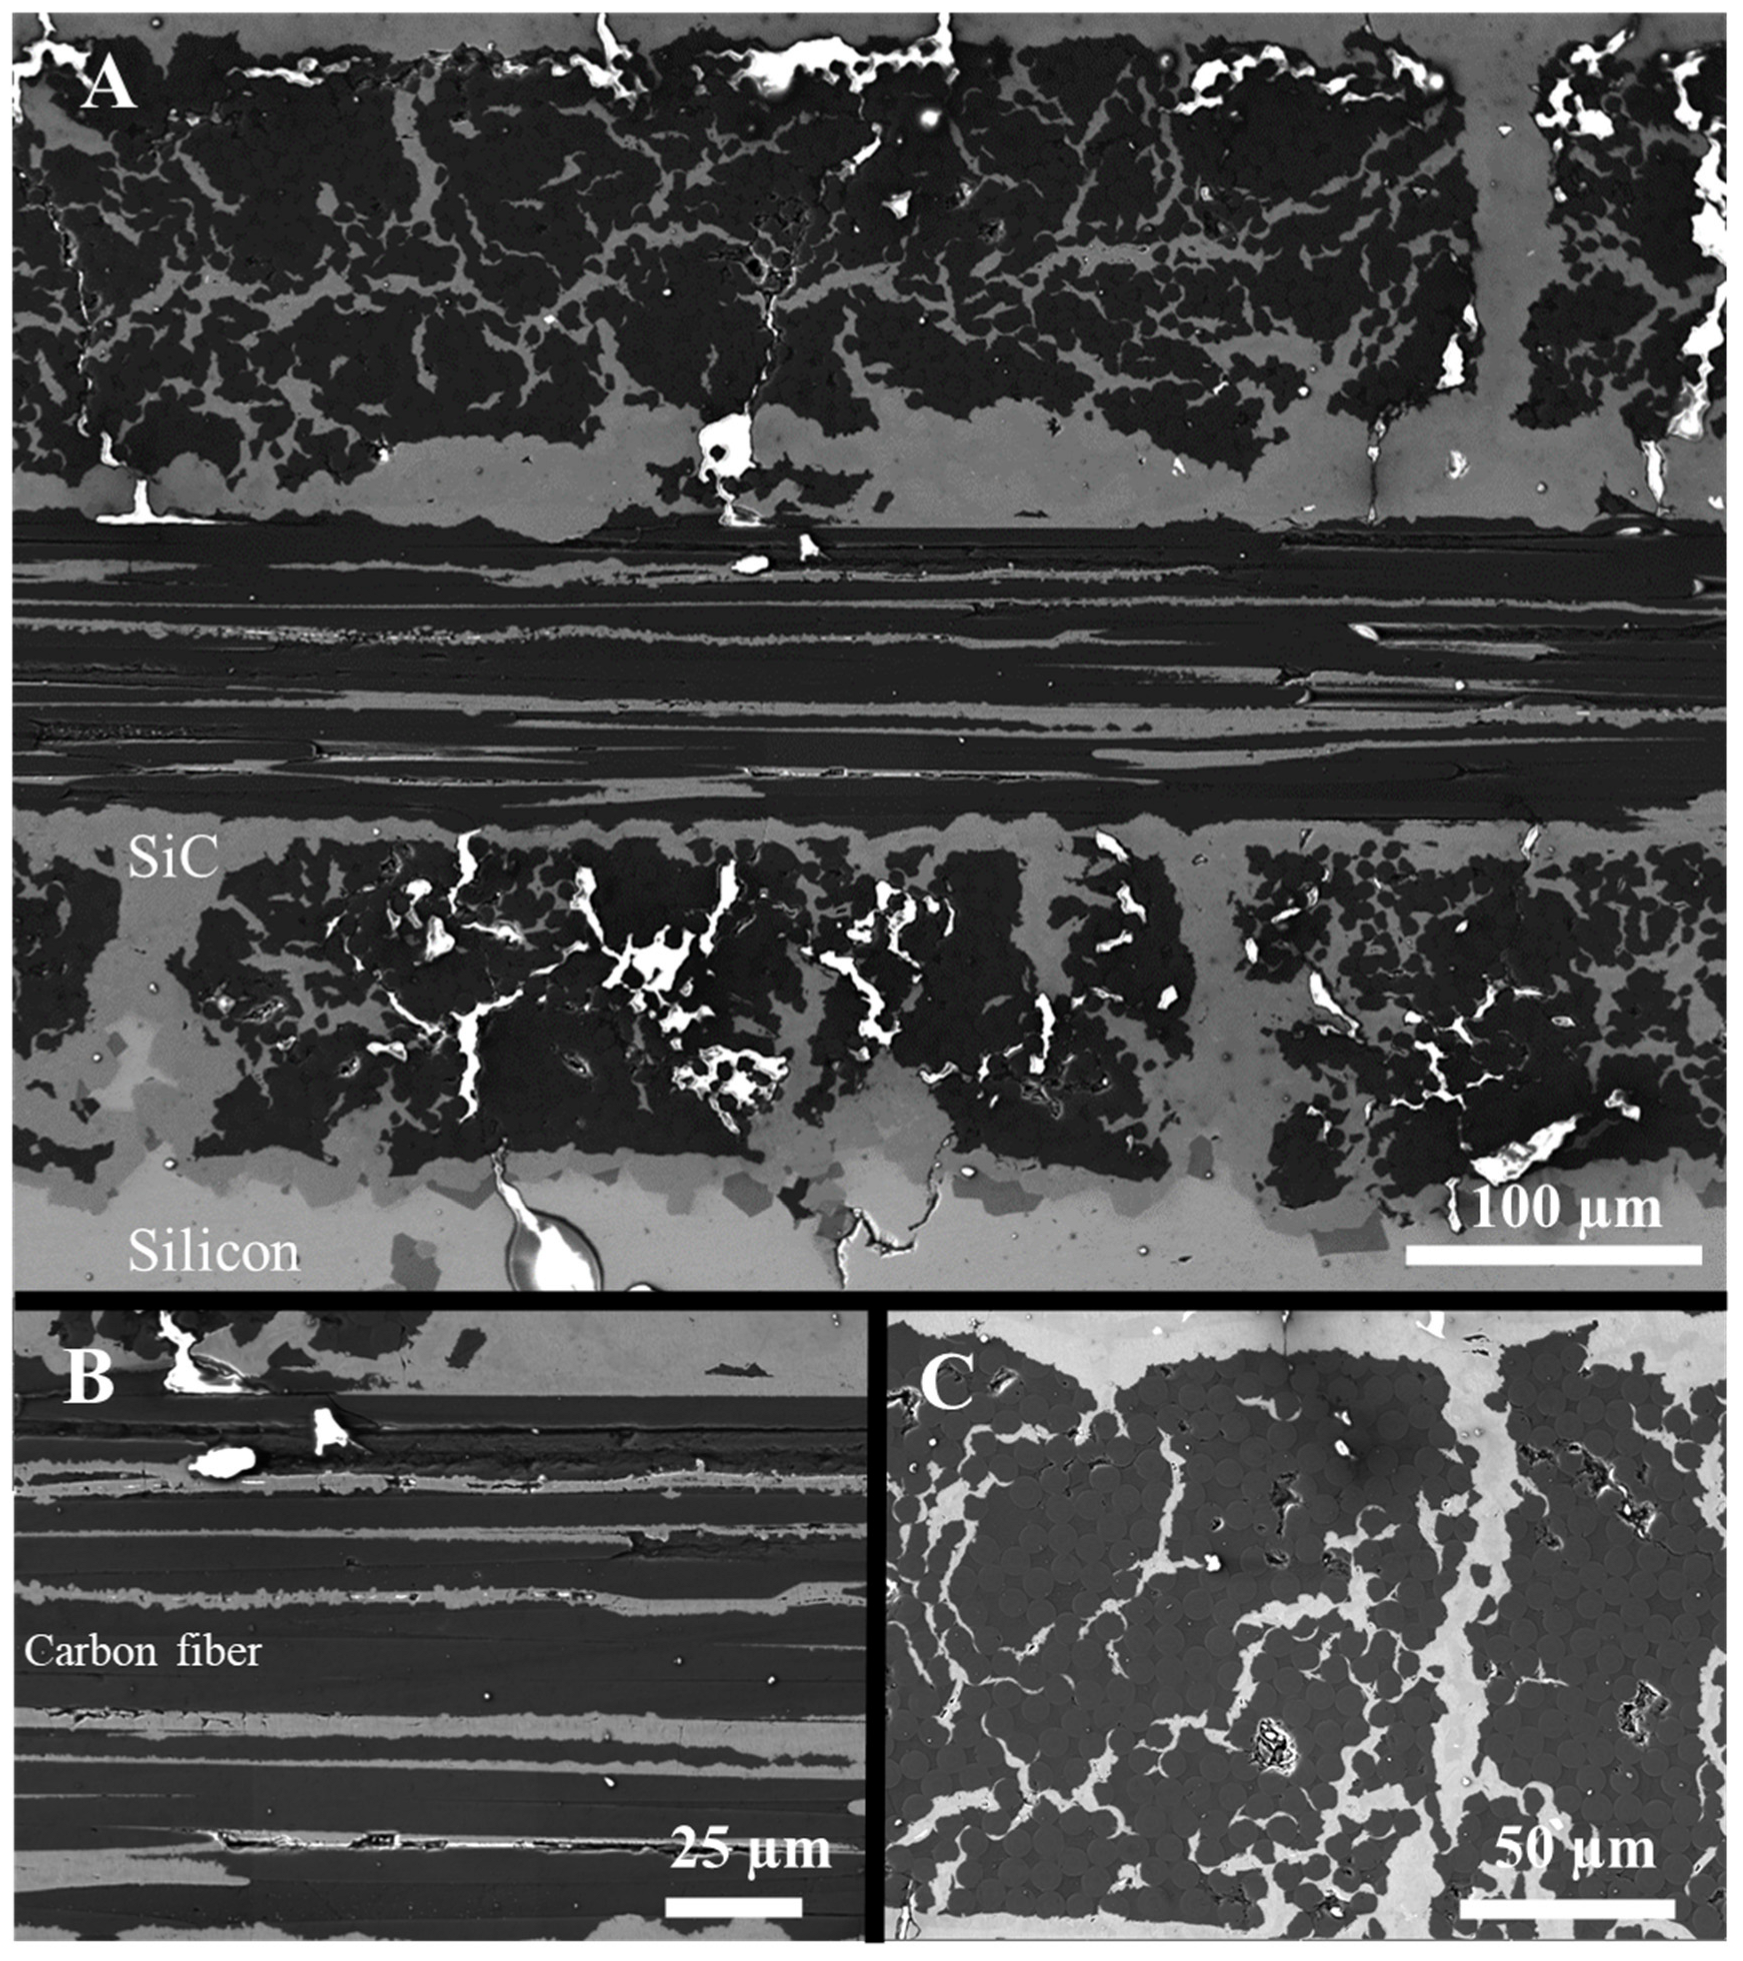
Figure 8 shows SEM images of cross-sections of the final C/C-SiC.
Figure 8A shows several printing layers or tows where the in-plane and out-of-plane tows can be identified. The materials were identified by EDS, where the areas of SiC and unreacted residual silicon can be seen.
Figure 8B shows a more magnified cross-sectional area of the in-plane carbon fibers and also shows the reaction-formed SiC in between the carbon fibers.
Figure 8C shows a more magnified cross-sectional area of the out-of-plane fibers. The tightly packed carbon fibers are surrounded by the carbon matrix, and there are some areas of the cracks that were filled with reaction-bonded SiC and Si.
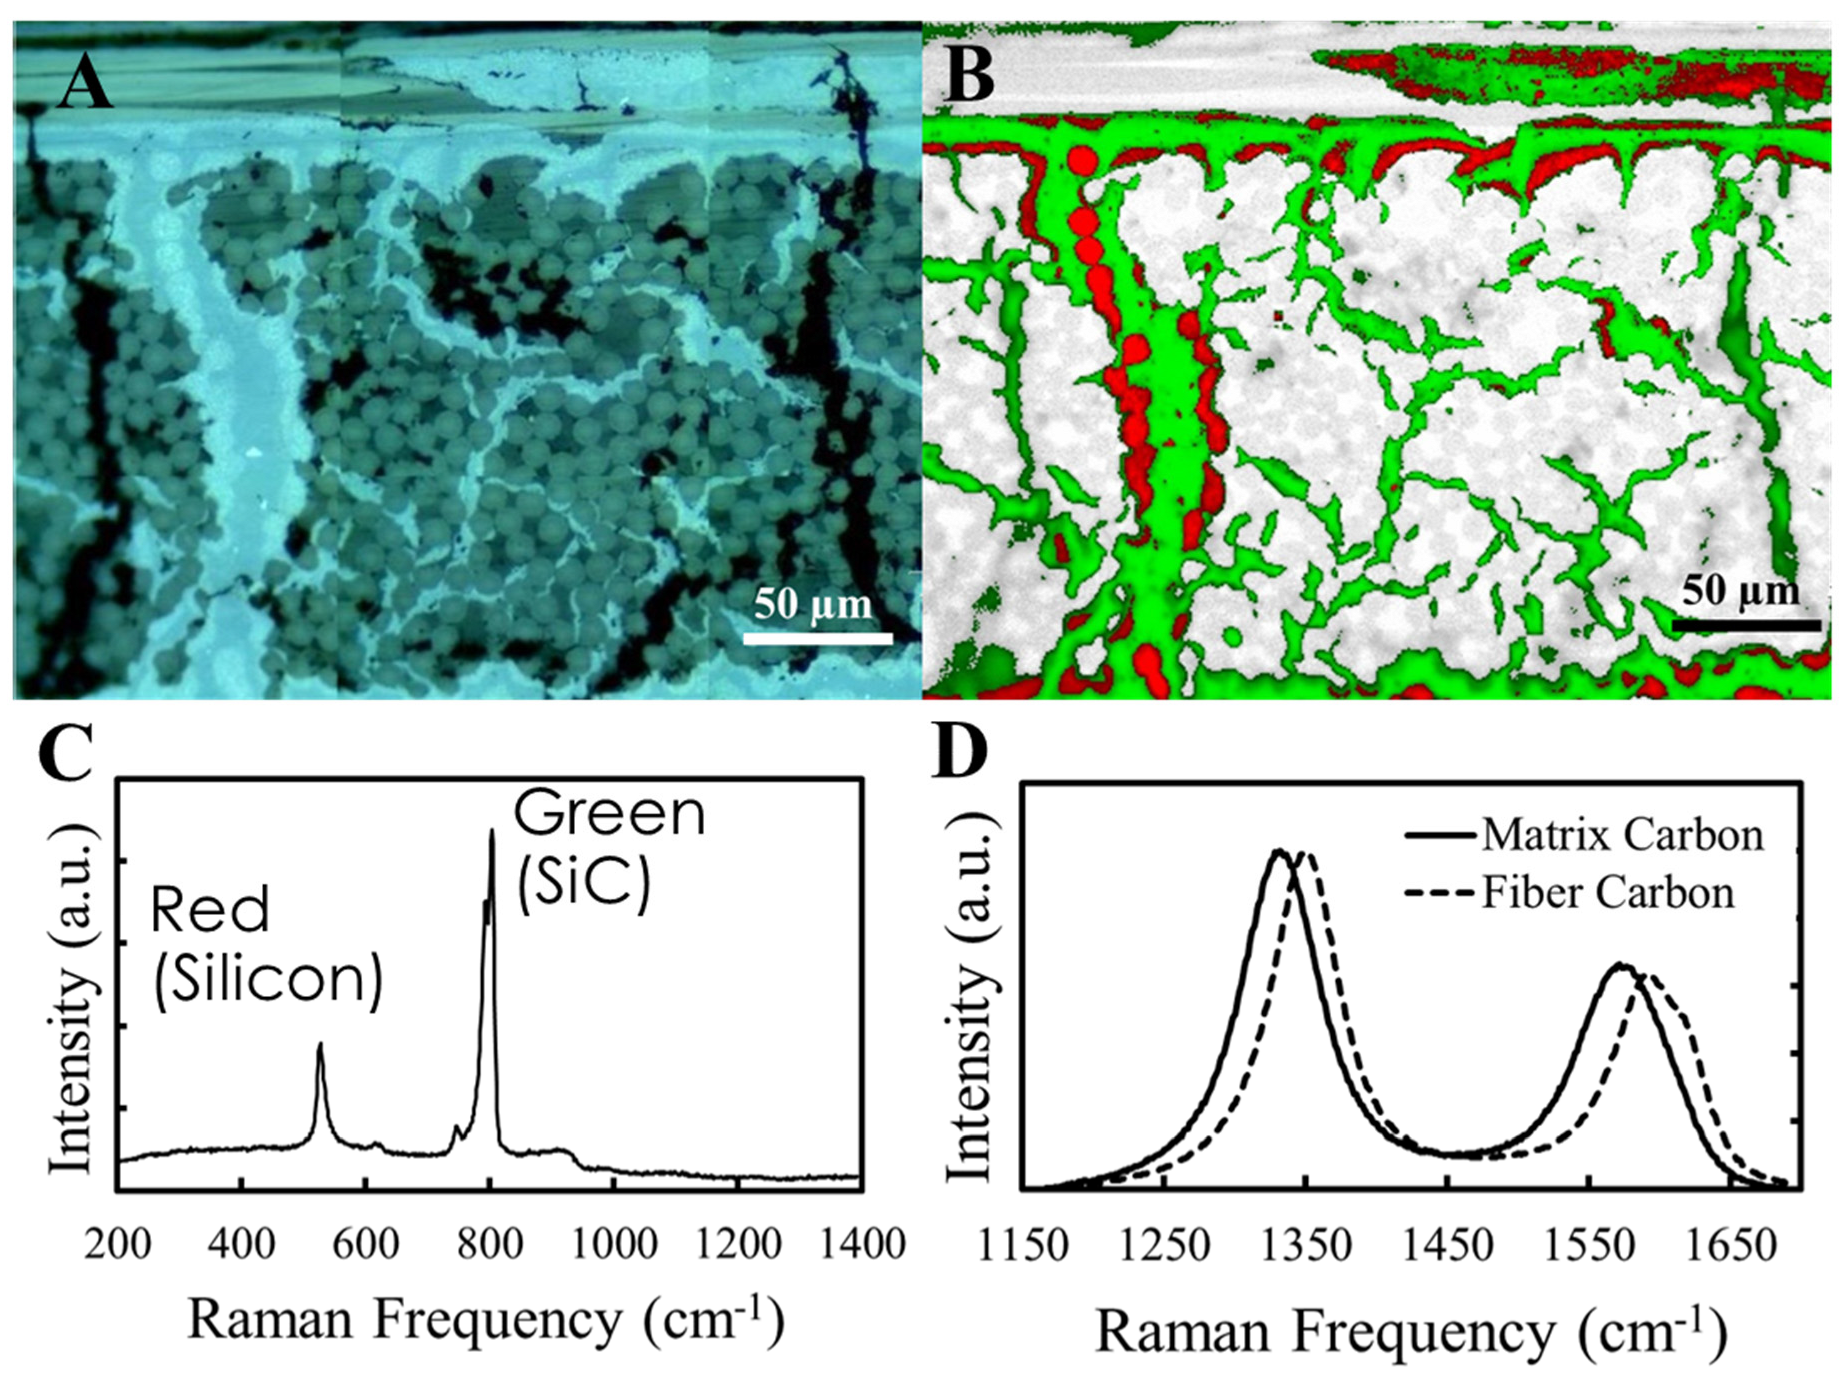
Figure 9 shows the results of Raman spectroscopy from a cross-section of the final C/C-SiC composite. The white region is the matrix carbon, gray is carbon fibers, red is residual silicon, and green is SiC. The Raman spectra collected from the SiC phase had broad peaks suggestive of a highly disordered structure. The polytype could not be identified [
35].
The carbon fibers and the adjacent matrix have nearly identical spectra, showing a phase that is nanocrystalline graphite. The difference in contrast is likely due to the fibers being more nanocrystalline or dense than the carbon matrix pyrolyzed from PEEK. The Raman peaks of the matrix carbon are at a lower frequency compared to those of the fiber carbon, indicating a more disordered structure [
36]. The spatially resolved map shows that the silicon penetrated the tows and reacted to make SiC in the porous regions of the Cf-C preform. There is residual silicon on some of the surfaces, and a minor reaction occurred between the Si and the carbon fibers. This was due to a templating effect, where the reacted SiC was observed to be the size and shape of the carbon fibers. The areas where SiC was formed showed residual silicon, and they may even be mixed at a lower length scale. The carbon fibers were, to a large part, protected by the partial carbon matrix, with a sheath of SiC forming around the Cf-C tow.
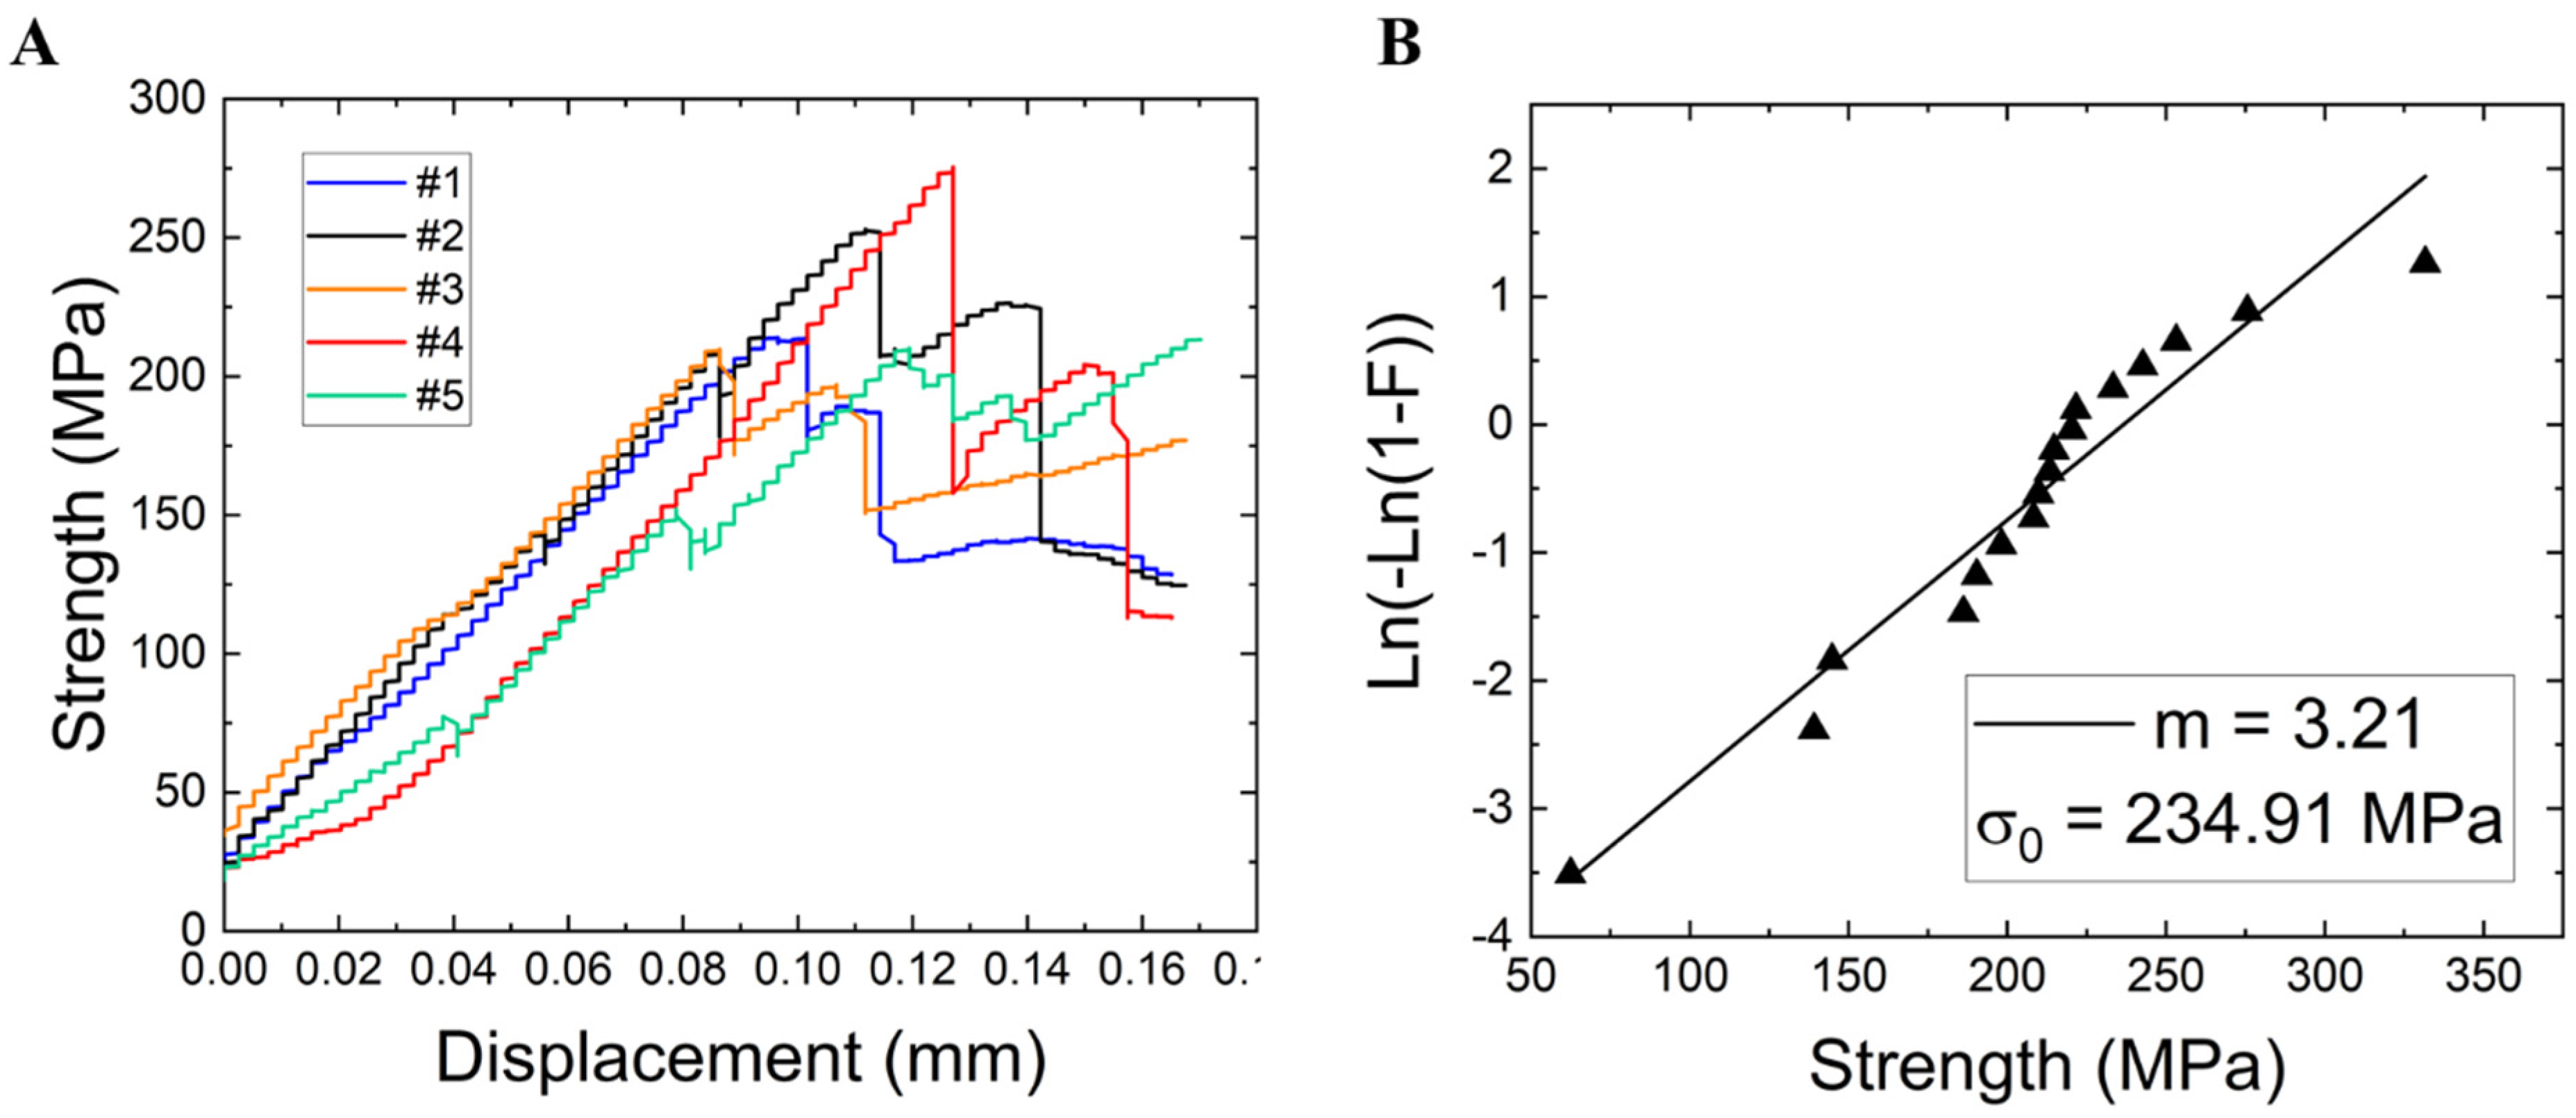
Figure 10 shows the mechanical data in the form of strength–displacement curves for the C/C-SiC composites tested in four-point bending and the Weibull statistics. The samples exhibited a large range of strengths but a relatively high strain to failure. A characteristic strength of 234.91 MPa was determined via Weibull analysis, with a Weibull modulus of 3.21 found using linear regression. The variability most likely arises from the porosity and the delamination. The displacement to failure was high, similar to well-formed CMCs. This is a result of the composites yielding via matrix cracking, the fibers beginning to bear more of the load, the matrix cracks deflecting along the fiber surfaces, the fibers pulling out of the matrix, and the fibers cracking in succession, rather than all occurring at one time. Images of the fracture surfaces were acquired to verify the fracture modes relative to the observed mechanical behavior.
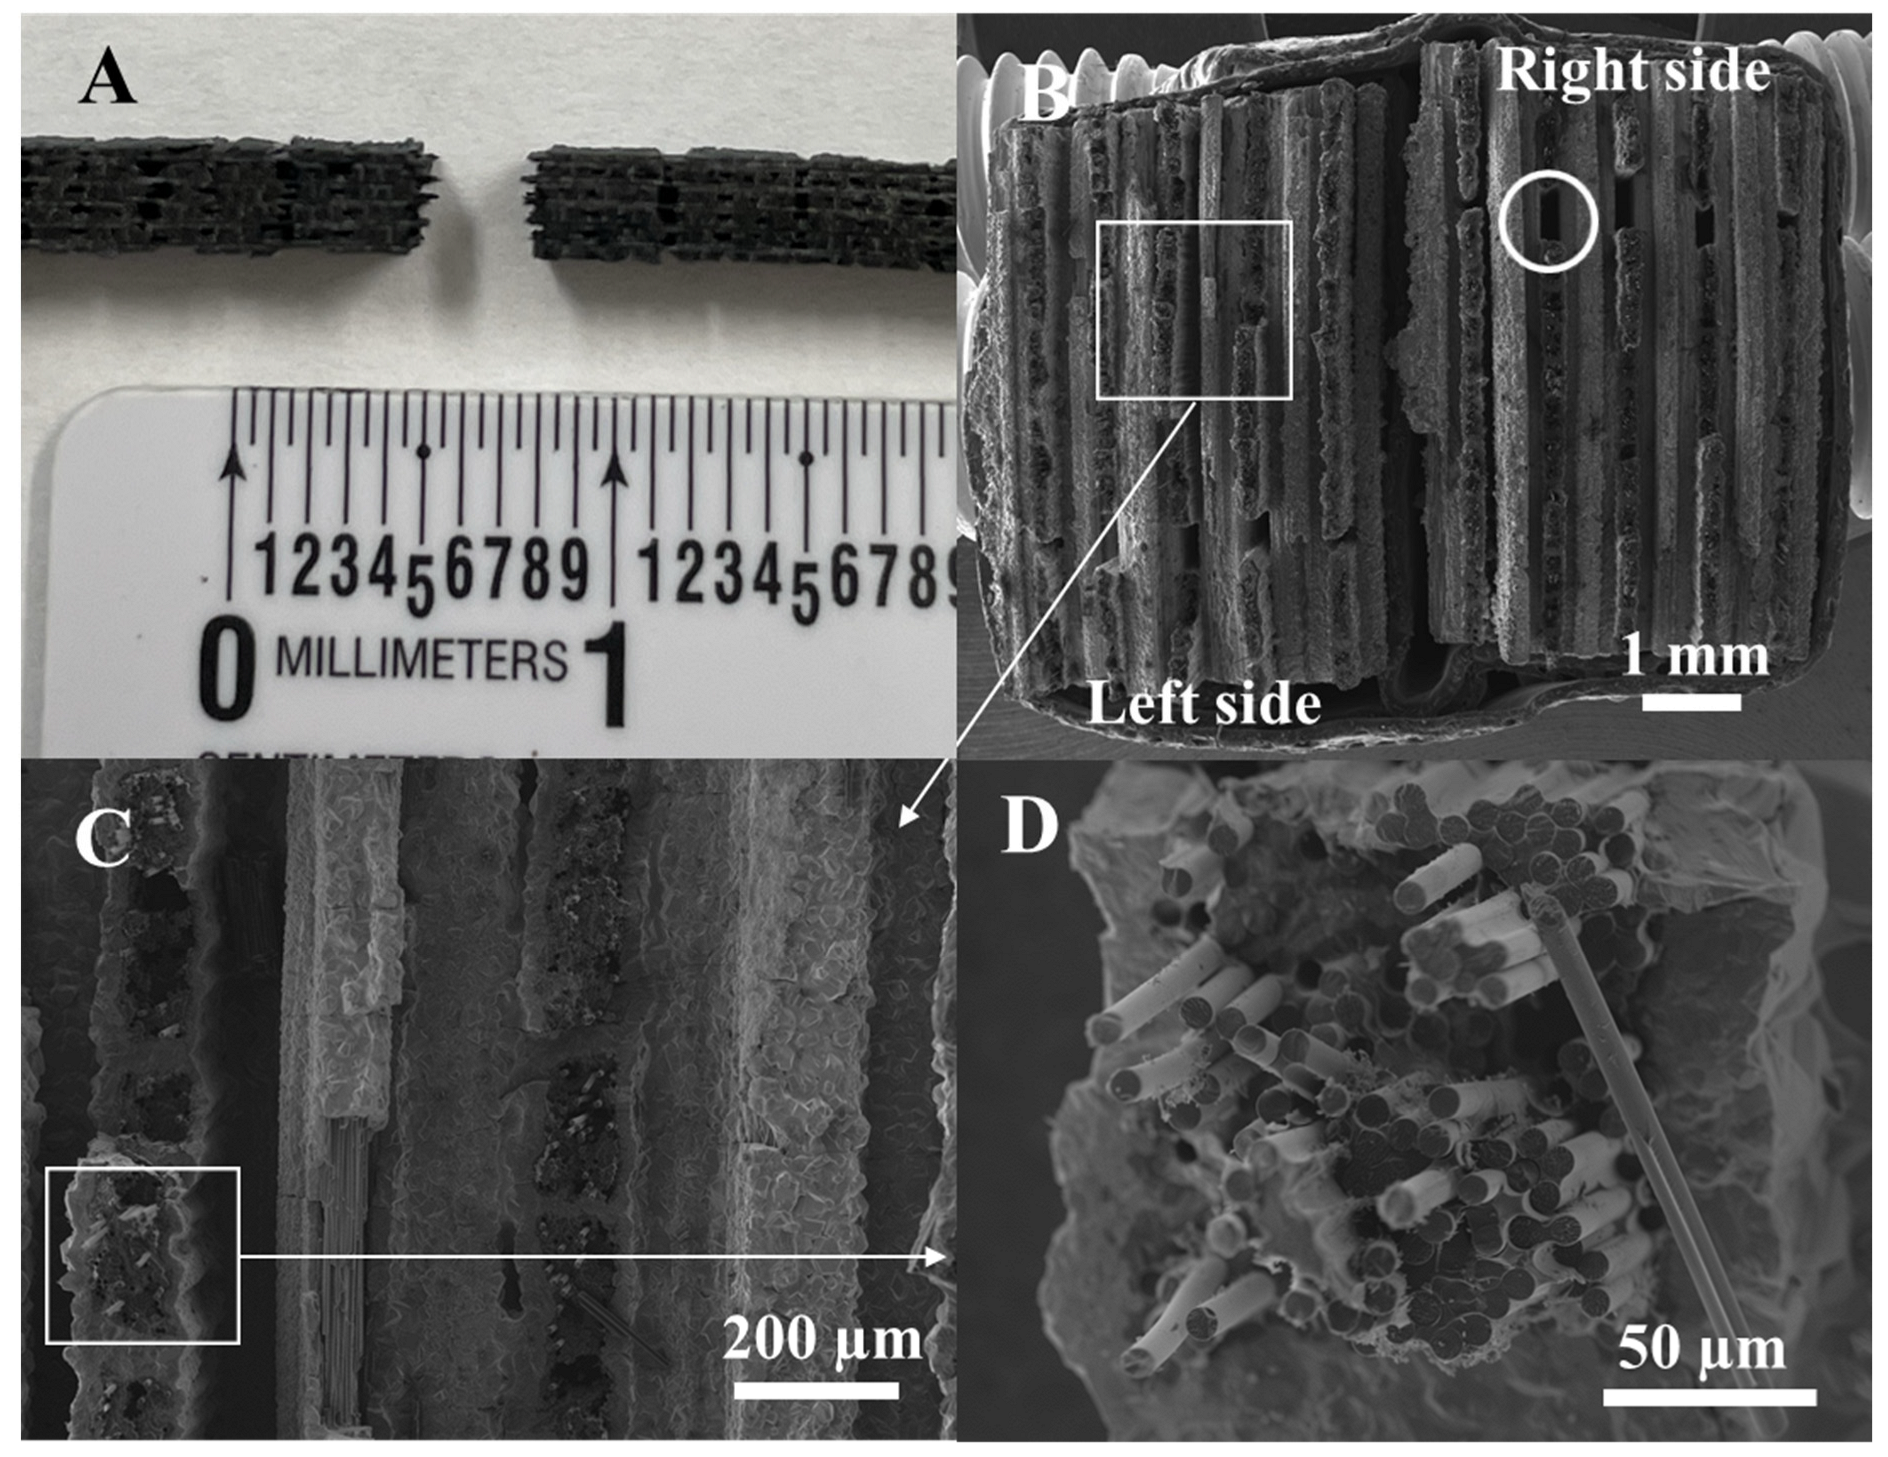
Figure 11 shows the optical and SEM images of the fracture surfaces of a sample following four-point bend testing. The samples tested for this study typically exhibited failure behavior similar to that shown in
Figure 11. The optical image in
Figure 11A shows the side view of the fractured specimen, where no delamination is observed, but fiber pullout occurred. A side-by-side SEM cross-section view of the fracture surface is shown in
Figure 11B. Regions where there are gaps between the fiber tows can be identified (circle in
Figure 11B). Such defects can be a source of failure at a lower-than-expected stress.
The samples showed similar behavior to that observed in
Figure 11. It is evident that no delamination occurred, and most of the failure involved fiber pullout. The macro image in
Figure 11A shows the side view of the fracture surface, where no delamination can be observed, and fiber pull out is visible. The side-by-side cross-section view,
Figure 11B, shows gaps, as pointed out by a circle, where the tows were either completely pulled out, were not fully consolidated with matrix, or were printed with a small gap leaving the large open area in the fracture surface.
Figure 11C shows the area more clearly, where the transverse fiber tows are encased in a material, and the out-of-plane tows show many areas of Cf pullout.
Figure 11D shows this pullout, and this is where the high toughness comes from.
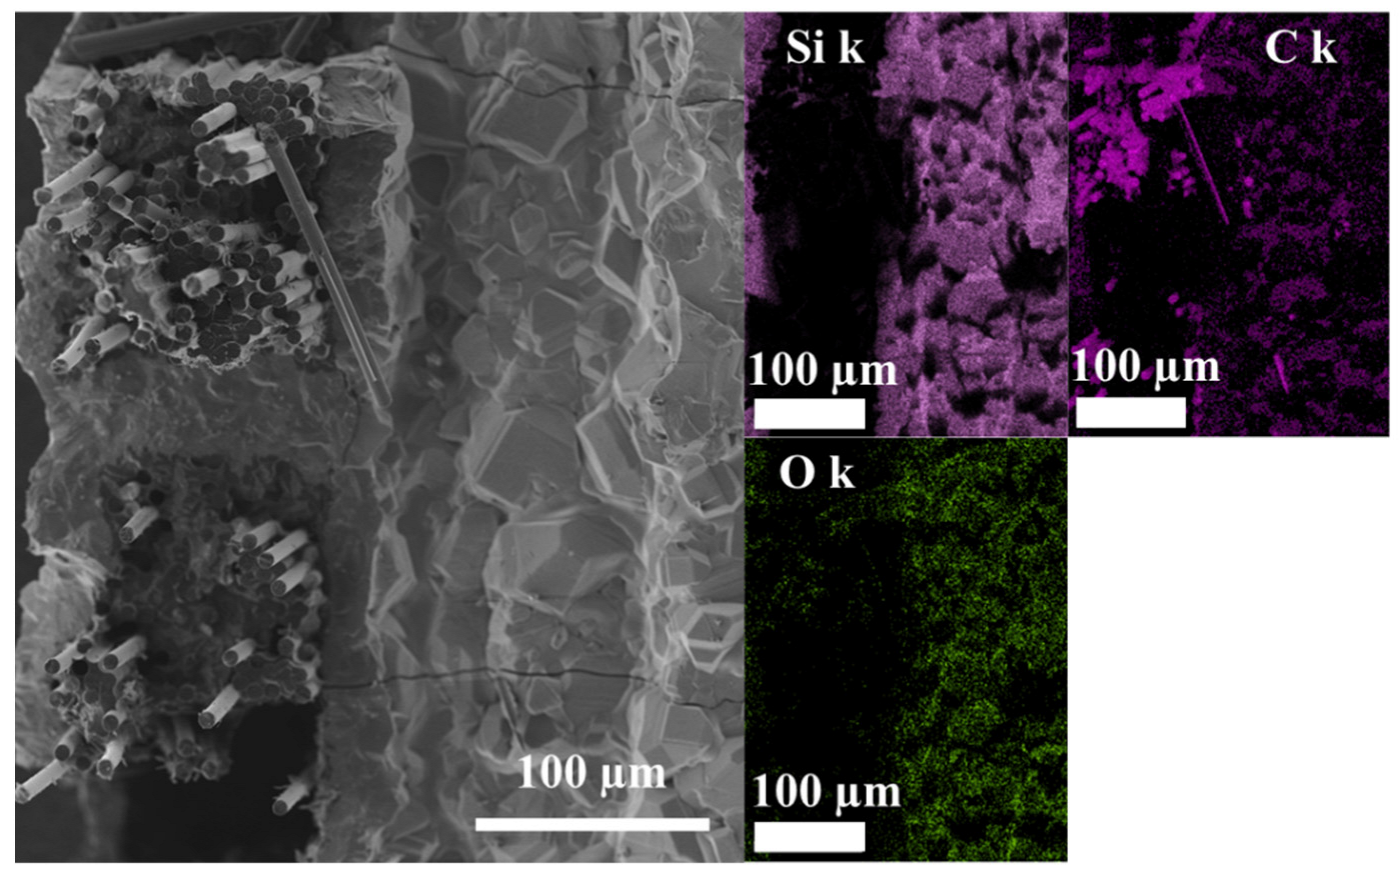
Figure 12 shows the SEM/EDS data from a fracture surface. Some of the fracture surfaces demonstrated this morphology, where the SiC reaction bond has encased the entire tow of Cf-C. Those areas show up in the white or lighter hue, and they are a region from which cracks may initiate and propagate. The areas of carbon, including the carbon fibers, can also be identified in
Figure 12. There was some oxygen detected by EDS, primarily located on the surface of the SiC. There are cracks going through the SiC that have been arrested in the areas where there are a significant amount of carbon fibers or in regions of porosity. The crack deflection and arrest provide the toughness in the composites.
4. Summary and Discussion
Miniature AFP or FDM 3D printing is viable to fabricate fiber-reinforced ceramic matrix composites, but more development is required to optimize the mechanical performance. With continued development, larger-scale AFP systems could be applied to fabricating SiC and other CMCs. One aspect likely causing delamination is the heating and curing of each layer during the sequential printing process. The immediate layer of melted thermoplastic gets deposited on material that has already been melted and resolidified, which may have reacted with the ambient atmosphere (oxidized and absorbed H2O/CO2). However, the densification process following the additive manufacturing of the fiber preform is the same as that used in traditional CMC fabrication methods, and, therefore, the microstructures resemble those from the literature. Large defects and delaminations are known to result in low mechanical strengths, so process development is required to minimize such features in the final microstructure. CT scans with higher resolution or even nano-CT are necessary to identify smaller pores and defects. Variant energy sources should also be explored to differentiate low-density phases and materials.
Applying pressure during curing and/or pyrolysis may improve the layer-to-layer bonding and inhibit delamination. The pyrolyzed PEEK in the porous carbon matrix protected the carbon fibers from any significant reaction and provided enough difference in bonding, so that a fiber interface coating was not needed. While a fiber-interface coating might be beneficial, it has been found that C/C composites with no fiber coating may exhibit damage tolerance if weak interfaces are achieved via processing, by making the first matrix infiltrations porous or less crystalline [
37,
38,
39]. The mechanical performance of C/C-SiC may also benefit from such a differential in material properties at the fiber/matrix interface [
40,
41,
42]. The composites in the current study with pyrolyzed PEEK provide a weaker interface with the carbon fibers, by providing a differential in nanocrystallinity and porosity from that of the neighboring fibers and matrix, which enables the damage-tolerant mechanical behavior. Since melt infiltration is typically performed at ambient pressure, a reduction in delamination would be best accomplished via improvements in pyrolysis and new materials. The damage tolerance of these composites comes from the significant fiber pullout and crack arrest, which could be improved if the tows were printed closer together, providing for a more continuous composite microstructure. In the composites fabricated for this initial study, there are small gaps from tows that are not placed directly next to each other, leading to delamination and porosity artifacts that will decrease strength. However, the composite demonstrated damage tolerance regardless of the microstructural defects. This composite fabrication method is amenable to any continuous fiber tow and polymer filament that can be impregnated and melted, so many other thermoplastic materials may be employed. In addition, other means of densification can be applied, such as chemical vapor infiltration (CVI) and/or polymer infiltration and pyrolysis (PIP). This demonstrated manufacturing technique has the potential to enable low-cost, time-efficient, and reduced-hand-touch manufacturing of CMCs.

 ,
, 


