
Implementation of Sacrificial Support Structures for Hybrid Manufacturing of Thin Walls


1
Georgia Institute of Technology, Atlanta, GA 30332, USA
2
Oak Ridge National Laboratory, Oak Ridge, TN 37830, USA
*
Author to whom correspondence should be addressed.
J. Manuf. Mater. Process. 2022, 6(4), 70; https://doi.org/10.3390/jmmp6040070
Submission received: 7 June 2022
/
Revised: 27 June 2022
/
Accepted: 29 June 2022
/
Published: 30 June 2022
(This article belongs to the Special Issue Hybrid Manufacturing)
Abstract
:Thin-walled features can be difficult to produce with traditional machining methods which often rely on excess stock material for stiffness. This challenge is increased in hybrid manufacturing where the feature is already near net shape before machining. Significant workpiece deflection can result in poor geometric and surface finish tolerances on the finished part. A potential solution to this problem is to implement sacrificial support structures to the as-printed geometry. The supports are then machined away during the finishing portion of the hybrid process. In the present work, several different design parameters for these sacrificial supports were evaluated to determine their impact on the quality of representative thin wall geometry samples. The angle, height, and spacing of triangular support structures were varied for each sample and then machined and examined. The addition of these supports relative to an unsupported configuration provided a deflection reduction of around 0.2 mm. Surface roughness was improved by approximately 1.5 µm. Increasing values of support height were found to correspond to reduced wall deflection. Similarly, decreasing values of support angle and support spacing improved geometric accuracy. Efficiency comparisons showed that increases in print time corresponded to rapidly diminishing gains in geometric accuracy but continued to improve surface roughness. Implications for hybrid finishing of additively manufactured thin-walled structures is briefly discussed.
1. Introduction
Hybrid manufacturing offers the potential to produce parts with increased complexity and lower waste material while maintaining a high level of dimensional accuracy. The machining of additively produced parts is often unchanged from methods used on cast or forged components. Thin walls with a height to width aspect ratio greater than 10:1 are often difficult to accurately machine due to large workpiece deflection from thrust and cutting forces applied during machining. A variety of works have been completed to model the magnitudes of this deflection, but typically ranges from 0.01 mm to 0.3 mm in size [1,2,3]. Additionally, the low stiffness of the wall itself readily results in chatter regardless of tool stiffness [4,5]. Chatter leads to a poor surface finish on the machined wall and reduced tool life.
The challenges that thin wall machining present have been noted and researched for some time [6,7,8]. Traditionally, the solution is to maintain as much stock material as possible during machining using a “step-down” approach [9]. Reduced shank tooling and high-speed machining are also used to prevent rubbing on previous steps of the wall and decrease forces [6,10]. However, for hybrid manufacturing this method is counterintuitive to implement. The near-net shape features produced using additive manufacturing do not provide the excess structural support to implement the step-down method. Printing the feature much thicker than the desired shape would solve this but would also negate the material savings benefits offered by additive and would likely greatly increase the deposition time required for a given component.
In order to prevent the deflection and chatter problems that arise when machining thin walls, a variety of different solutions have been proposed to compensate for deflection digitally. Wang et al. [11] used an algorithm to build on typical step-down machining by optimizing the material removal steps in order to maximize stiffness throughout the process. A block of the material to be removed is subdivided into sections by the algorithm to determine the stiffest material removal order. The experimental results showed significant reductions in deflection over the baseline step-down method. Koike et al. [12] used a similar method, however the orientation of the tool was also considered in the algorithm. Tool orientation was varied in order to direct the cutting force vector in the direction of highest stiffness on the part. This method took significant time to calculate but saw a roughly 10N reduction in cutting forces. However, these two methods rely on the use of the existing stock to maintain stiffness, which is not present in near-net shape hybrid components. Ratchev et al. [13] used finite element analysis to predict the deflection of a workpiece with a theoretical force model. Later, Ratchev et al. [14] used this model to implement modified tool paths to compensate for the geometric error produced due to wall deflection. Cutting points were taken along the tool path and correlated with the predicted finite element analysis (FEA) model deflection to generate modified cutting points to build the compensated tool path. Using this method, the thickness error was reduced by roughly 0.3 mm on an aluminum wall with a 24:1 height to width ratio. Ge et al. [15] bypassed the need for FEA modelling and used in-process probe measurements on thin webs after performing a semi-finishing pass to obtain geometric error. The error was then filtered and used to generate modified tool paths to correct for the error. These processes assist in the reduction of geometric error on thin walls but do not help to compensate for chatter which leaves the possibility of poor surface finishes. Budak et al. [16] used FEA to determine the frequency response function of a part during machining to attempt to avoid chatter. The frequency response function (FRF) was determined initially and then modified based on the material removed from the part. The FRF was then used to create stability lobe diagrams for parameter adjustment enabling small blades to be finished with relatively little chatter. Tang and Liu [1] used a three-dimensional version of the stability lobe diagram to find that a larger exit immersion angle correlated to an increased stable material removal rate (MRR) for thin walls. The relatively constant bead width produced from additive manufacturing makes it difficult to significantly alter the cutting depths in hybrid manufacturing without printing excess material.
In addition to path planning compensation, there has also been significant work to look at alternative ways to fixture thin wall parts to dampen chatter and minimize deflection. Support fixtures have the benefit of not requiring complex computational models but are often part specific and require additional steps in the manufacturing process. Smith et al. [17] machined sacrificial structures during the roughing of thin walls to increase the stiffness of the walls during finishing passes. Several different support schemes were modelled using FEA to determine effectiveness. Two thin wall enclosures were then machined using this technique. FEA results from this work showed that with a single-sided buttress only roughly 50% of the material needed to be machined away. This work showed the potential to use sacrificial structures to minimize geometric error and surface finish but did not look at the specific details of the problem. Zeng et al. [18] developed a model taking into account workpiece vibrations to determine where fixtures should be located on a particular structure to dampen vibrations on thin walls. Each side of a square thin-walled structure was split into 36 sections to establish which sections would require an external fixture to minimize vibrations during machining. Kolluru et al. [19] used a similar approach but used tuned masses and neoprene sheets attached at regular intervals to a thin-walled cylinder to reduce milling vibrations. FEA and impact testing were used to determine appropriate masses to attach to the thin wall. In the machining experiment, vibrations were reduced 4.2 times compared to the neoprene sheet alone. Kolluru and Axinte [20] later found that the adhesive used for mounting the masses proved difficult to remove after machining. In response, a torsion-based fixture was created to push against the thin cylinder to improve stiffness. This was found to be easier to implement and improved upon the vibration reduction found with the previous method. In addition to these works, there are also existing methods for improving the rigidity of parts such as using wax for fixturing the component [21]. Wax has a relatively low melting temperature and can be poured over the thin wall and the thin wall can then be machined normally. However, this requires a method of containing the wax around the thin wall and requires additional post processing to remove the remaining wax after machining. Additive byproducts such as spatter from wire-arc or unmelted powder from blown powder would likely contaminate the wax and limit reusability as well. Taking this concept further, Jiang et al. [22] used magnetorheological fluid in a magnetic field as a damping medium. The part was fixtured in a container and the fluid was poured around the part and solidified. Post process removal of the magnetorheological fluid would likely be easier than wax fixturing but would remain a necessary additional step.
Instead of the potential solutions described previously, this work will propose the use of sacrificial structures incorporated into the additive process to increase the stiffness of thin-walled features which should enable these features to be machined with higher geometric accuracy and lower surface roughness without greatly diminishing the waste material reduction offered by hybrid manufacturing. This method would not require extra steps during the machining process which would aid in minimizing the need for operators to interact with the machine. The intent of this work is to experimentally determine if implementing sacrificial support structures into the design of thin-walled features produced using hybrid manufacturing results in thin walls that are closer to a desired geometry with a lower surface roughness relative to thin walls without support structures.
2. Methodology
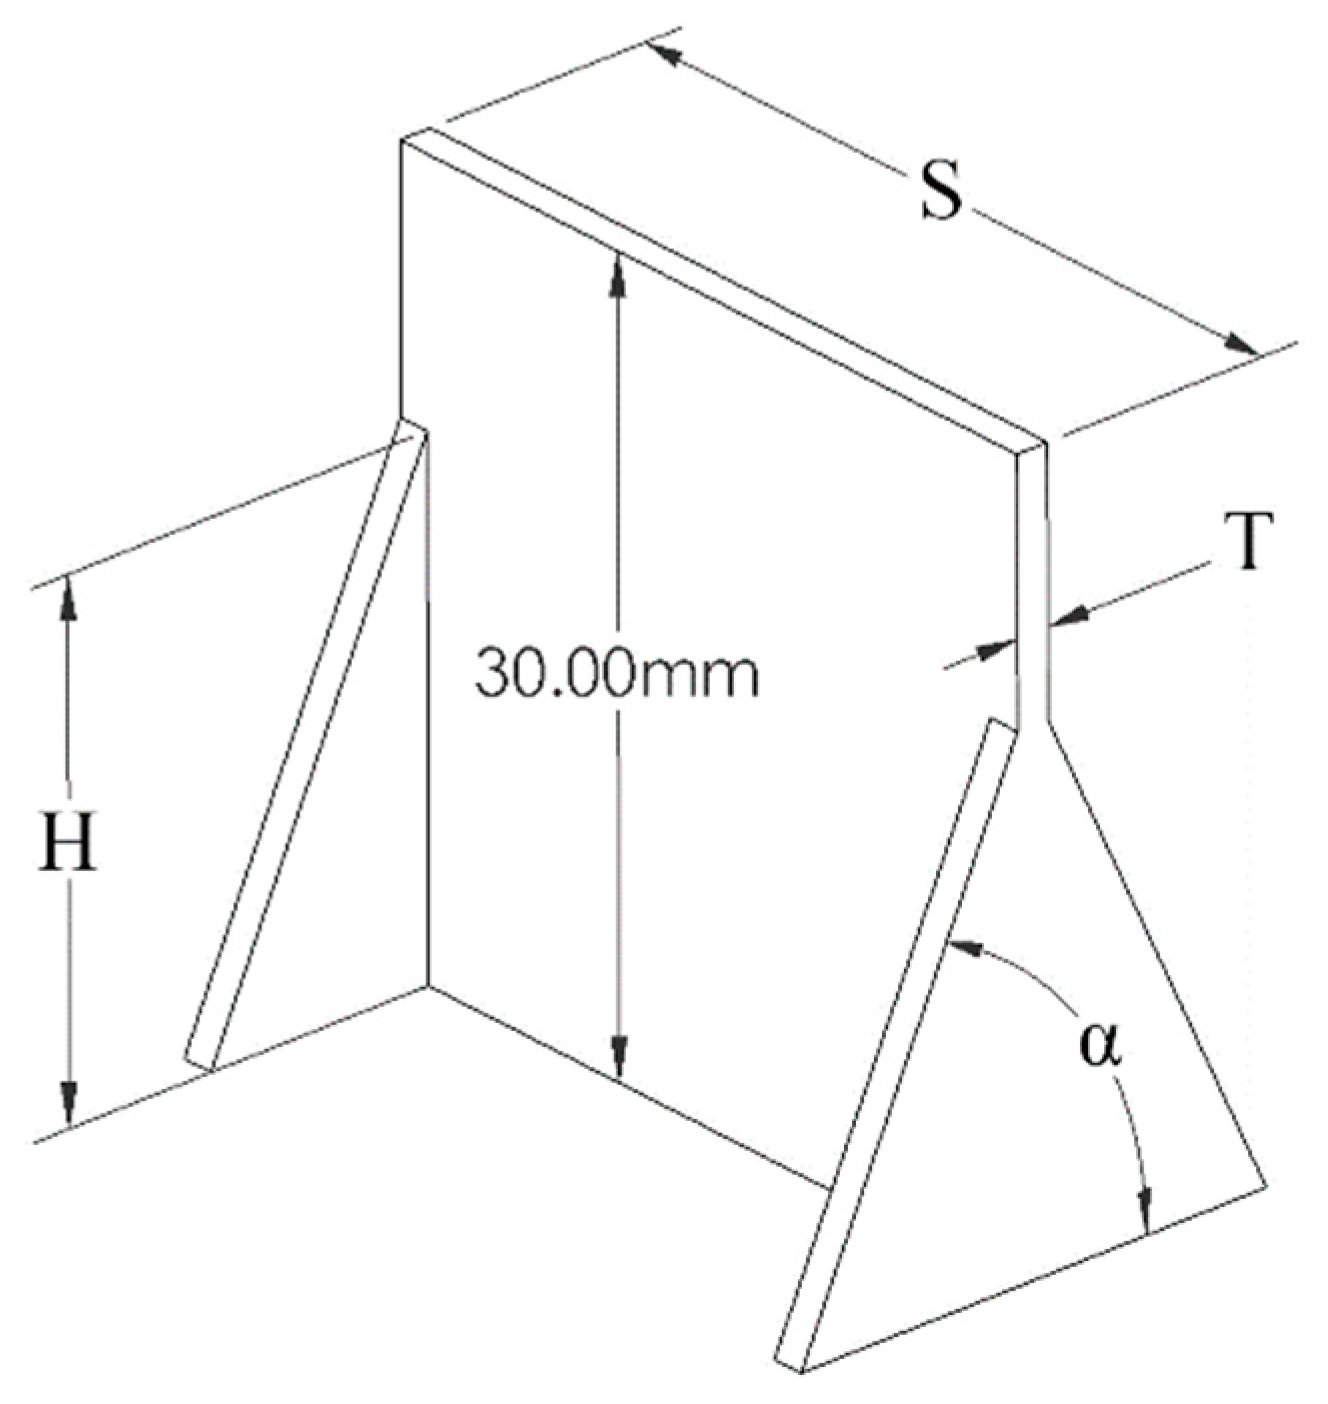
Three different support parameters were studied and their impact on the quality of the resulting thin wall evaluated. These parameters relate to the sample geometry shown in Figure 1. The condition sets to be evaluated are shown in Table 1. The first parameter investigated was support angle (α). It was assumed for these experiments that a triangular support will be the most practical shape to apply as a support, however the angle of the triangle must be investigated. The second parameter to be varied was support height (H). A sufficiently short thin wall may have a low enough deflection such that supports are unnecessary. Similarly, if the sacrificial supports limit deflection enough, that they would not be needed for the full height of the wall. The third parameter was the spacing used between each support (L). If only a single mode of deflection perpendicular to the thin wall is considered, theoretically only a single set of supports would be required for a given feature. However, the effect of torsion on a 3D wall requires a look at how the part will deflect when the spacing between supports is varied. All of these parameters ultimately corresponded to a variation in print time and the final quality of the finished thin wall due to the resistance of machining forces.
In order to test the impact of these three parameters on the quality of the machined thin wall, 24 samples were produced. Three unsupported walls were printed and machined to serve as the baseline for the experiment. These three samples were 30 mm in length and 30 mm in height. In the as-printed condition, the thin walls averaged at 1.46 mm thick and were machined to a nominal thickness of 0.5 mm. This provided an aspect ratio of 60:1 which would readily produce typical problems expected with thin wall machining. A thickness of 0.5 mm was chosen to ensure that a continuous surface was obtained after machining. If less material was removed, samples with high geometric error would be found where the as-printed surface would still be visible near the top of the wall. The impact of support angle was tested by producing thin walls with triangular supports with angles of 45°, 65°, and 85°. The angle was measured between the hypotenuse of the right triangle and the build plate. Three samples were produced for each angle to account for potential error. Each sample remained 30 mm in length and height. To test the effect of support height, 65° triangular supports were implemented as before, but instead varied between 10 mm, 20 mm, and 30 mm in height. The thin wall remained 30 mm in height and length. Finally, the effect of support spacing was tested by producing samples with varying distance between each support. Each of these sample used 65° supports that extended to the 30 mm height of the wall and the wall length was varied at 10 mm, 30 mm, and 50 mm.
After machining each sample, excess build plate material was cut away from the thin wall using a bandsaw. The surface roughness was collected using a contact profilometer and the geometry was measured using a coordinate measuring machine. Data was primarily collected near the top of the wall as the highest deflection was consistently found to occur at the top of the wall and can be assumed to be the worst-case scenario location for each sample.
The machine used for production of the hybrid thin walls and sacrificial support structures was a Mazak VC-500AM. This machine is based on the Mazak VCU-500 5-axis machine in combination with a 1 kW IPG Photonics fiber laser and Oerlikon powder hopper units for blown powder DED processes. The material used for the sacrificial support structure experiments was 316 L stainless steel. Specifically, Carpenter Additive LPW-316-AAAW powder was used. The composition of this powder is shown in Table 2. This powder has a size distribution of 44–106 µm. This material was chosen primarily due to its availability and prior use on the VC-500AM. The sensitivity of changing geometric parameters of sacrificial support structures should readily transfer between materials while the scale of geometric error should be expected to vary.
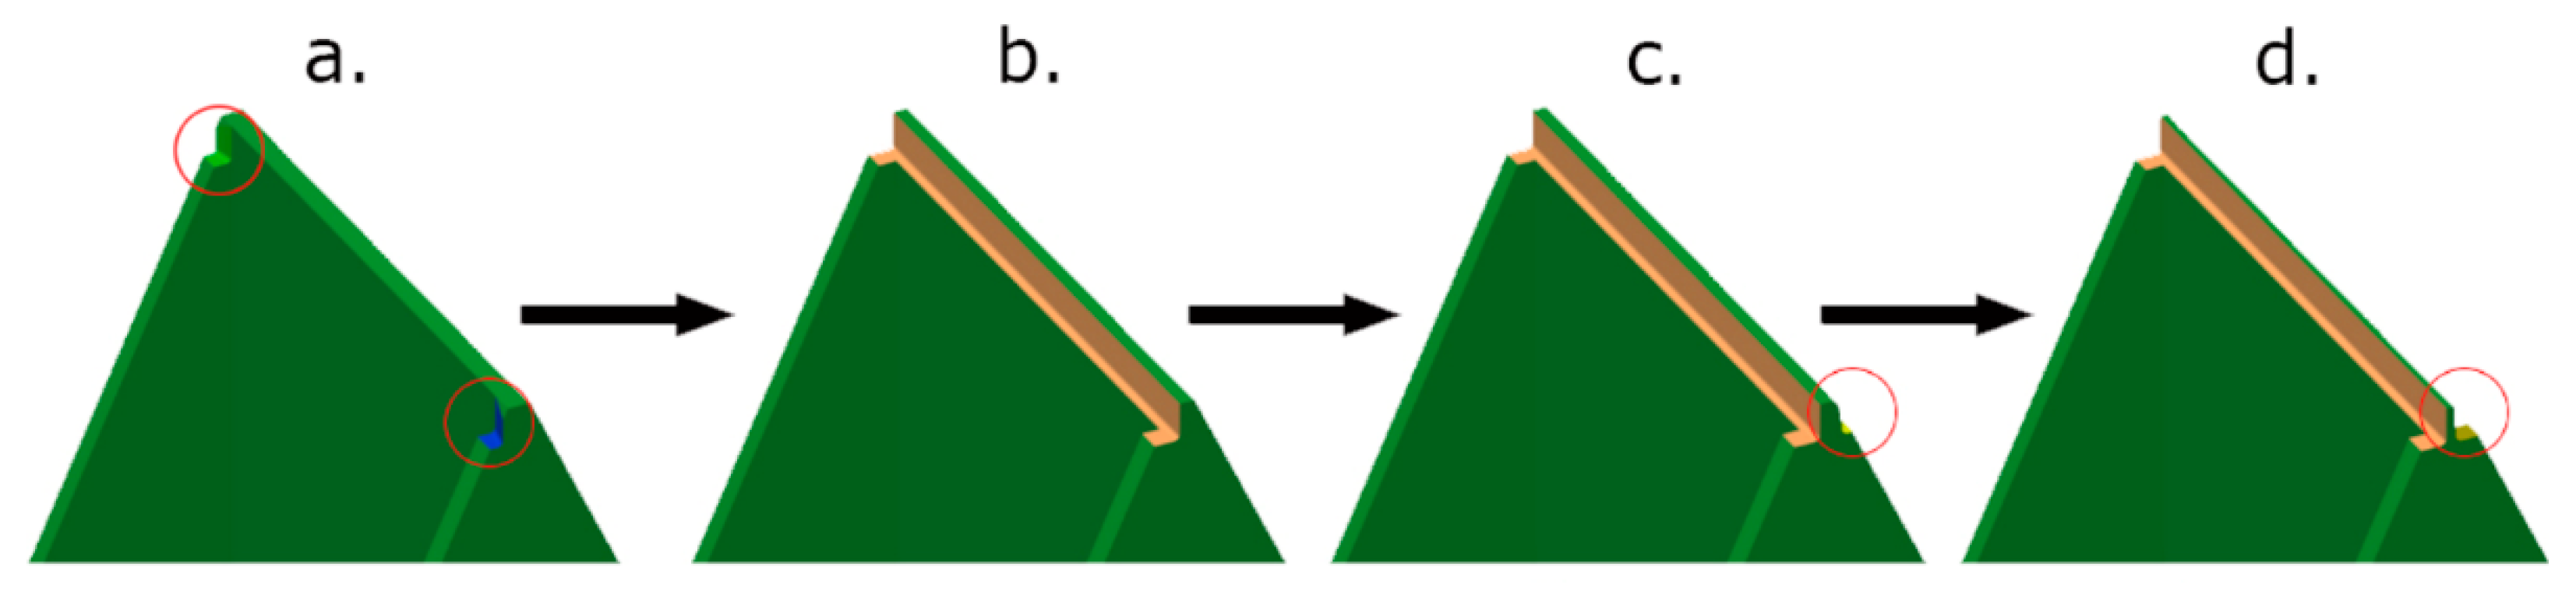
Each of the 24 samples were machined using the same toolpath to ensure a reasonable comparison between changes in support structure variables. All samples were machined using the same VC-500AM machine that was used to print the samples. Due to the relatively small amount of material to be removed from the thin wall only a single rough/finish pass was used for each step. Down milling was used for all machining paths. The support structures were machined along a path parallel to the support itself with the tool slightly offset from the support. Initial sample machining paths where the tool followed a path colinear with the support structure failed due to the support structure bending over during machining. This was likely due to the cutting forces applied directly perpendicular to the support itself. Offsetting the toolpath to the side of the support allowed the cutting forces to be applied in a direction of higher strength for the support and prevented support failure. Figure 2 below shows the steps followed during the machining of two steps during the machining process.
Prior to machining the face of each thin wall, the support material for a given step was machined away to attempt to minimize an increase in radial depth of cut while machining the face of the thin wall. This process is shown in step a, c, e, and g of Figure 2. The radial depth of cut (Rd) still increased by approximately 1 mm when milling the wall face at locations coincident with the support structures and resulted in different surface finishes and geometry at the edges of each sample. No measurements were taken from the edges of any of the samples to account for this potential source of error. The ends and top surface were not machined as these surfaces were not the focus of this experiment. Several initial test samples were machined on the top face of the wall and this was found to cause significant deflection for the unsupported case and resulted in plastic deformation for unsupported thin walls, therefore it was not machined to avoid adding additional confounding factors to the experiment.
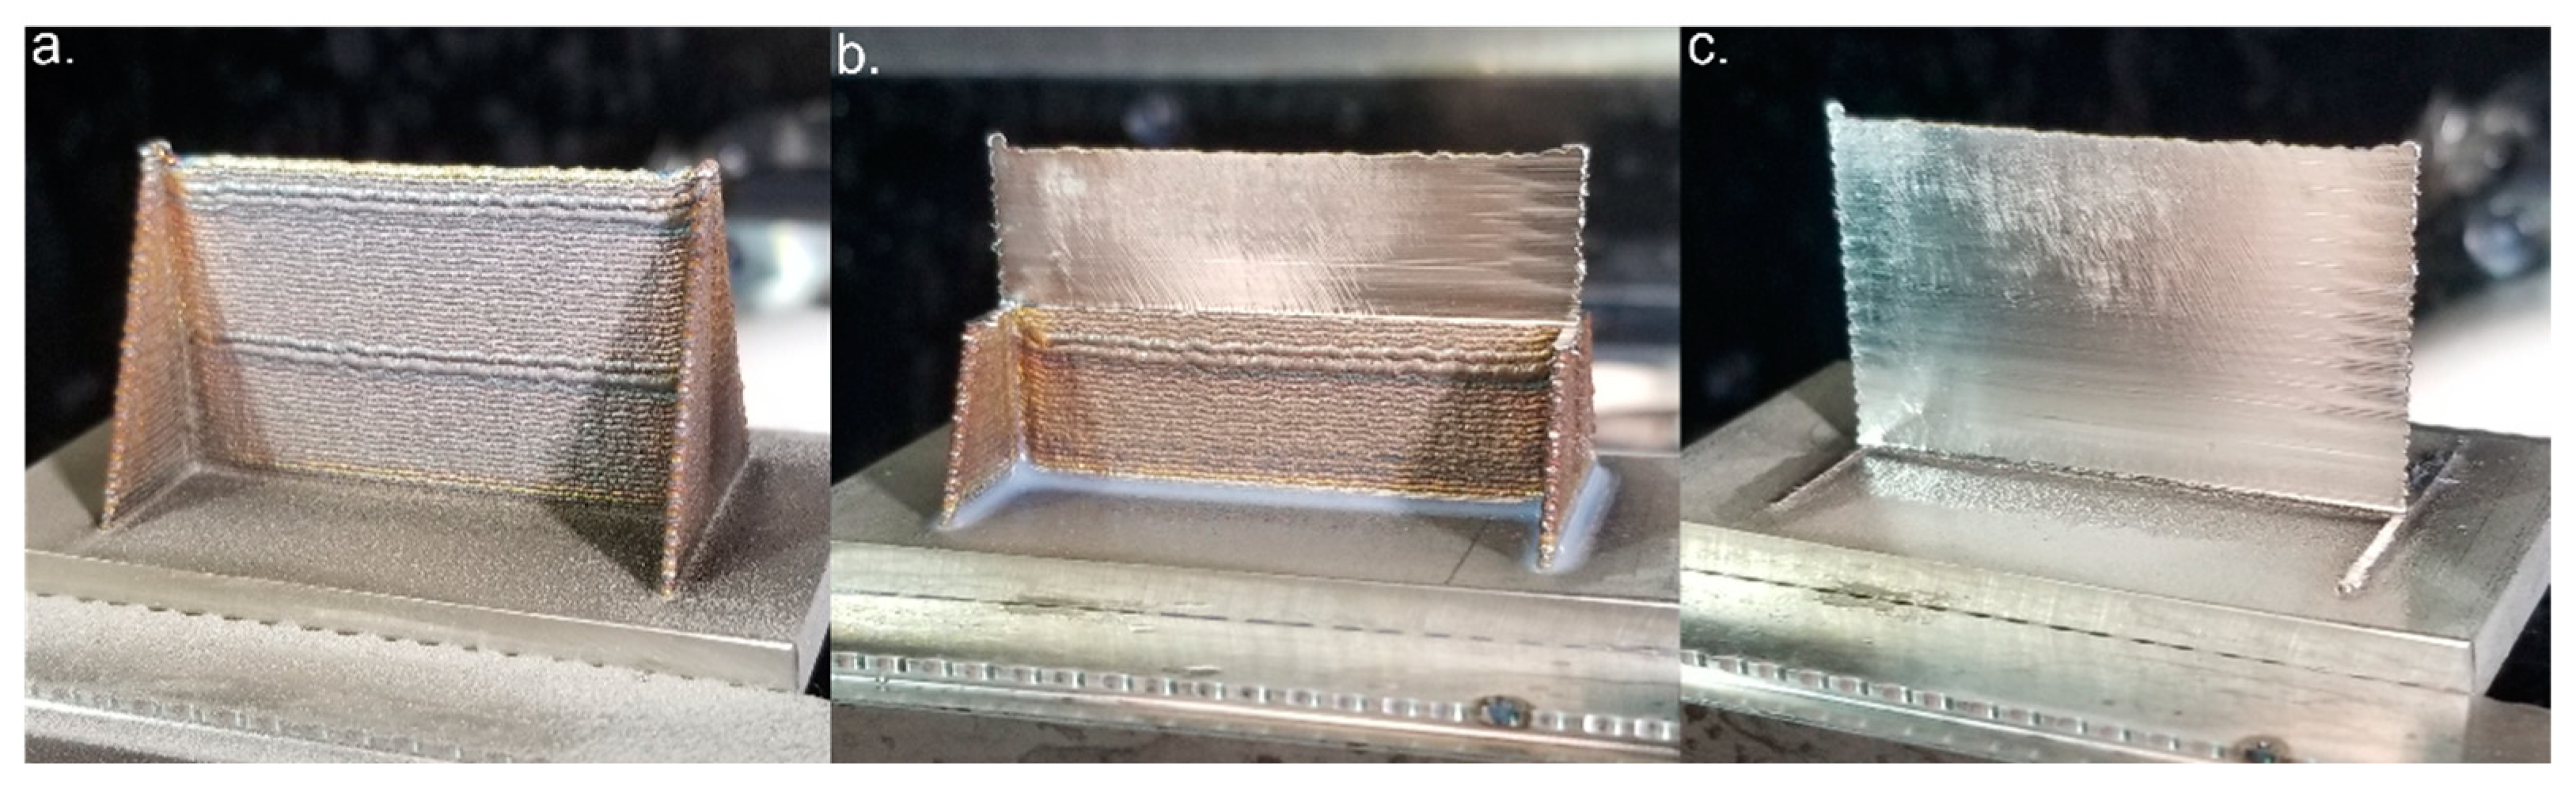
Figure 3 shows the 50 mm wall length sample before, during, and after machining. Figure 3a shows the as-printed thin wall with attached sacrificial support structures. Overbuilding from the additive process can be seen at the top of each support structure. Several deposition layers seen roughly halfway up the wall and near the top of the wall are also thicker than other layers. This was done manually during the printing process to assist in minimizing overbuilding during deposition. Figure 3b shows the same wall partially machined. Chatter can be observed near the center of the wall, and is less prevalent near the support structures on the wall. Figure 3c shows the fully machined thin wall. Surface finish can be seen to improve significantly halfway down the wall. It can also be noted that the surface finish at the top left of the wall changes between Figure 3b,c. This change is due to tool rubbing after the initial machining pass at the top of the wall and will be addressed in the results.
Tooling for machining each sample was chosen to attempt to minimize potential extraneous effects that could alter the final results. To ensure that tool deflection was negligible when measuring the final part geometry, the step-down distance was set at Ad = 2 mm to reduce cutting forces. A larger diameter straight end mill was also chosen to further eliminate any possible tool deflection. The tool chosen was a 0.5” 5-flute end mill. 5 flutes were chosen to avoid potential hammering effects from a lower flute count and to avoid high radial pressure from a high flute count which could increase the potential for chatter. The end mill also has variable flute pitch to further help reduce chatter. The end mill was mounted in a shrink fit tool holder to minimize any potential runout. The tool stick-out was set at 40 mm to allow for 10 mm of additional space between the thin wall and tool holder in the event of overbuilding during the additive process.
Table 3 shows the feed and speed used for machining the sacrificial support structures and the thin wall itself. These parameters correspond to approximately 0.001 inches per tooth. These parameters were chosen to attempt to minimize the effect of chatter on the final results. In practice, a higher feed rate would likely be desirable but would potentially require additional experimentation or stability lobe analysis to determine appropriate parameters.
Geometric results for all samples were obtained using a Zeiss Micura coordinate measuring machine (CMM). This machine provides accuracy to within 0.7 µm plus cosine error. Preliminary measurements using a micrometer served to prove that this accuracy would be sufficient for the expected changes in part geometry. The two probes used for measurement were recalibrated directly prior to collecting data to ensure minimal measurement error. Temperature compensation was also used based on a single temperature sensor mounted to the vice used for sample holding with a coefficient of 17 × 10−6 m/(m °C).
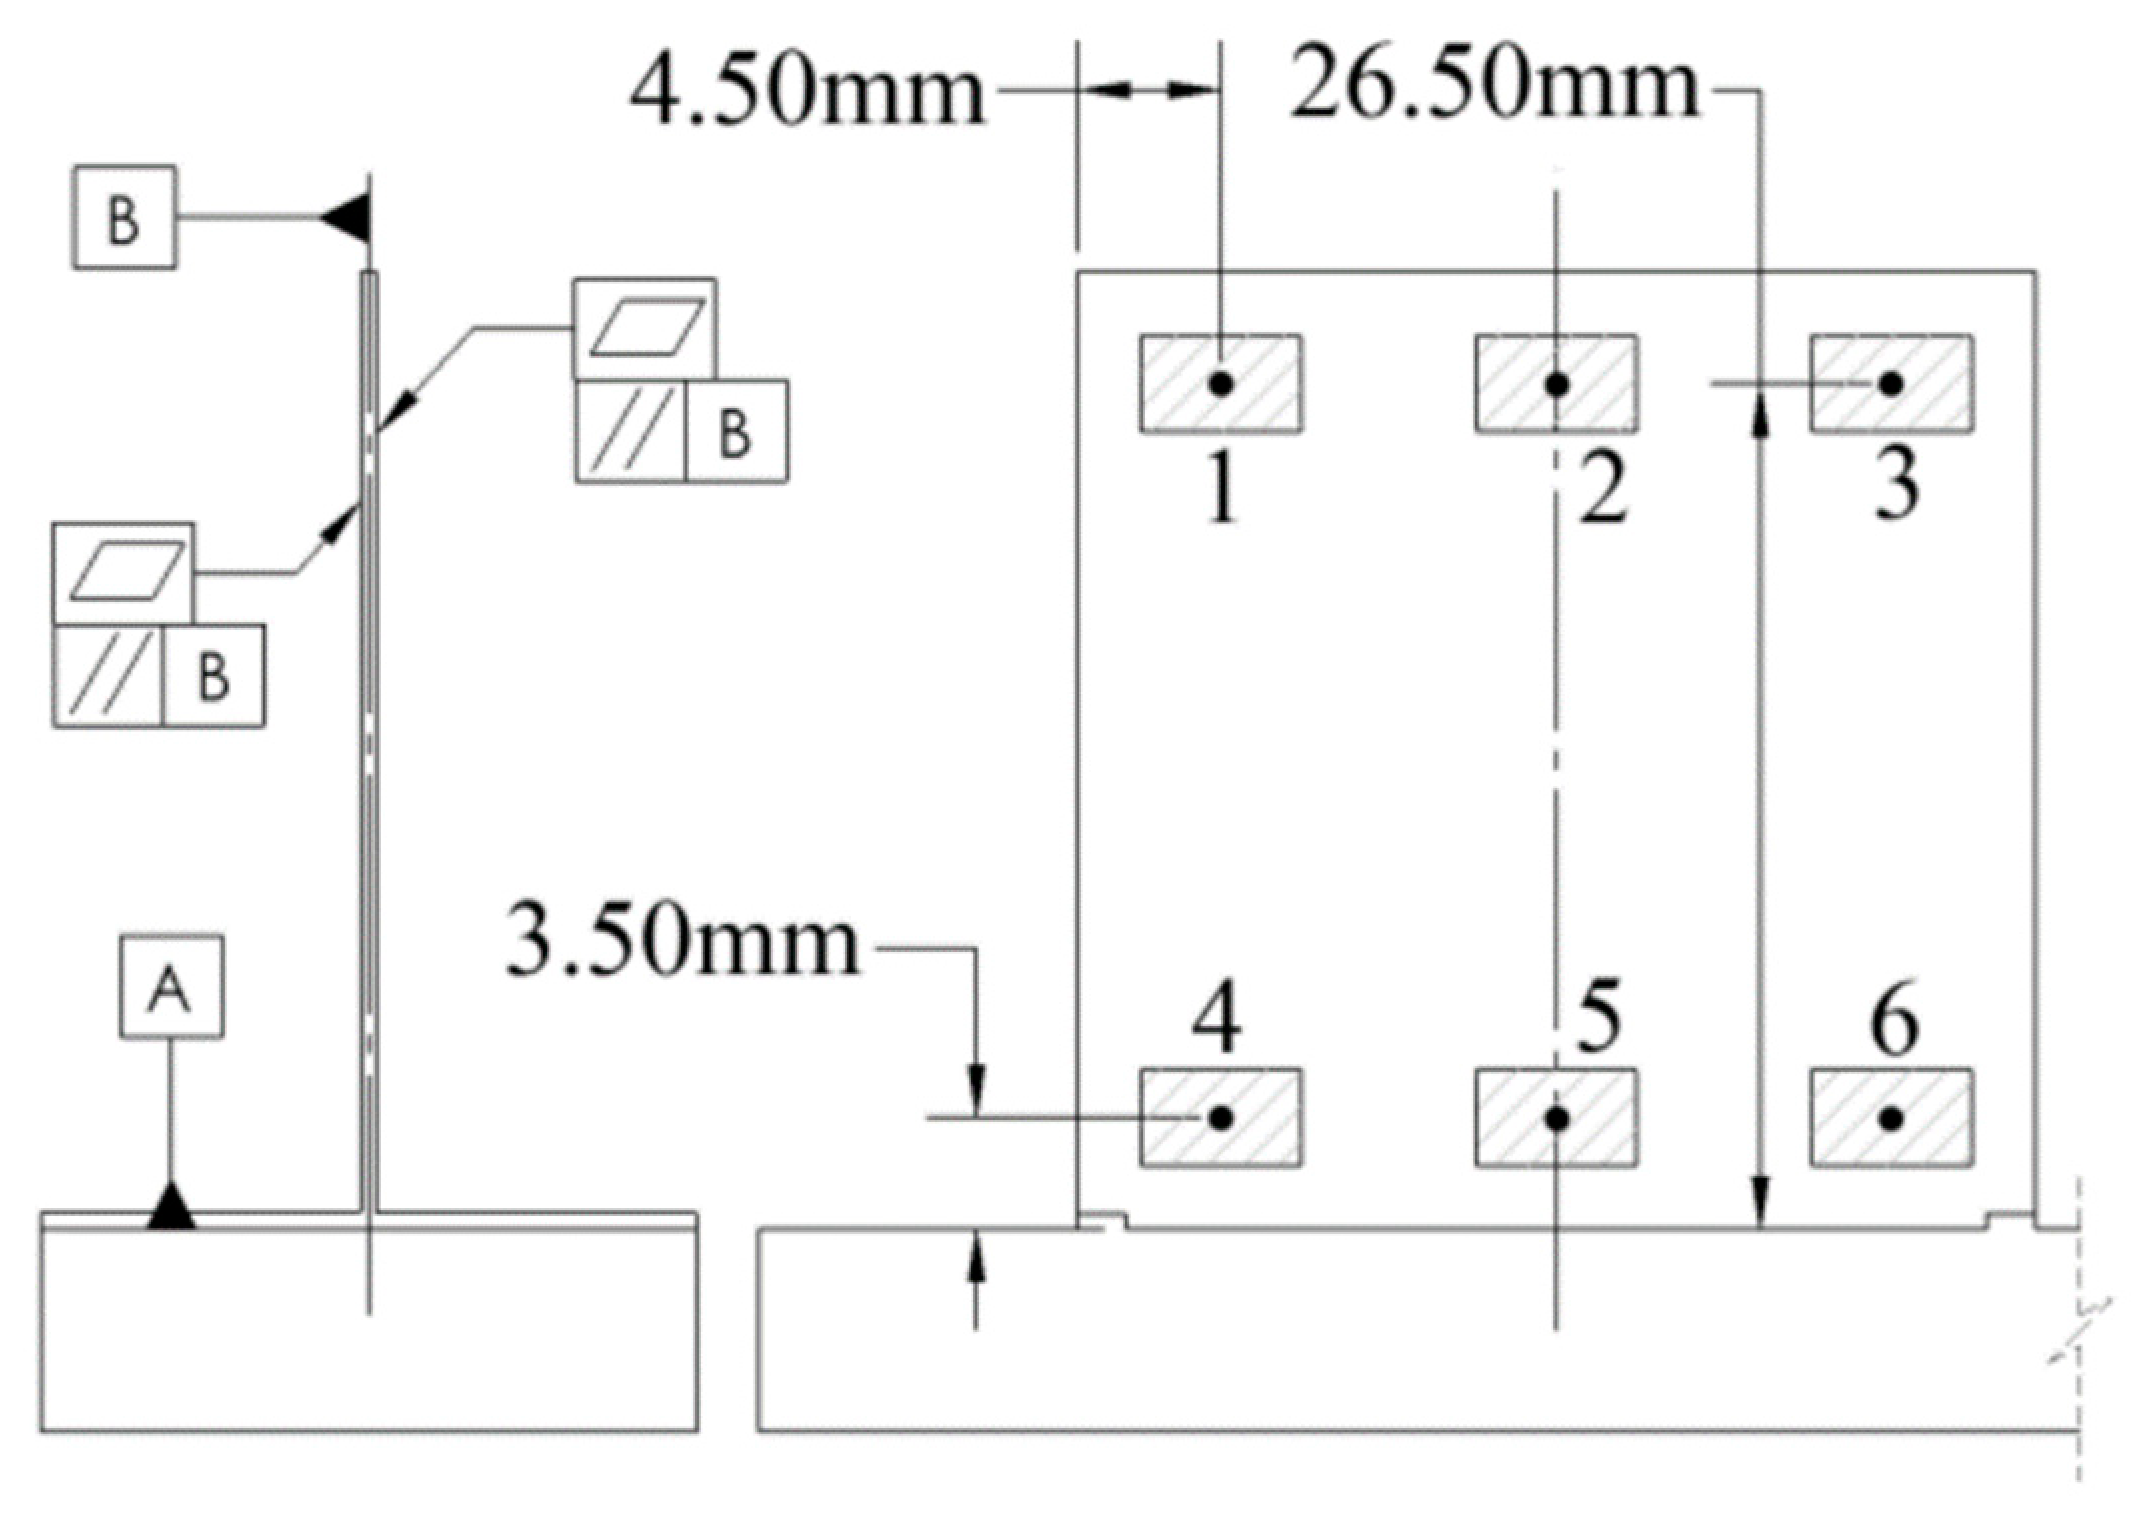
The thickness of each sample was measured in 6 different locations as shown in Figure 4. Each location was represented by a 2 mm by 3 mm patches on each side of the wall with 12 total patches. All patches were 2 mm away from nearby edges to avoid effects from the larger radial depth of cut (Rd) experiences when machining across sections of the wall with leftover support material. The perimeter of each patch was scanned using the CMM to fit a plane to each location. The plane was created using least square fitting to minimize influence from chatter on geometric results. The distance between two patches on opposite sides of the thin wall was then calculated from the center of each patch and parallel to the line that most closely approximates the perpendicular between the two planes. This method ensures that if the wall was not mounted perfectly perpendicular in the vice the thickness measured would not be influenced. The flatness and perpendicularity of each side of the wall relative to a datum “B” was also measured using a scanning path that encompasses the entire surface of the wall.
When scanning a sample using the CMM, a fixed amount of force was applied on the sample from the probe. Due to the low stiffness of the samples, this could represent a significant deflection during scanning and result in measurement error for the samples. To quantify this error, a dial indicator was used to observe the deflection of a 30 mm sample during a probe scanning routine. A deflection of 0.0076 mm was observed at a height of 23 mm. Based on a simple beam deflection this would correspond to a deflection of 0.39 µm at the height thickness was collected from. Assuming this error compounds when measuring both sides the measured thickness can be expected to be 0.78 µm smaller than the real thickness.
Surface roughness for each sample was measured using a Mitutoyo Surftest SJ-410 contact profilometer. The profilometer was set up to automatically eliminate any mounting variation in surface angle. Roughness measurements were collected at a sample height of approximately 26.5 mm to correspond with the thickness measurements collected using the CMM. Measurements were collected on both sides of each sample.
For all samples with a wall length of at least 30 mm, the primary cut-off wavelength λs value was set as 8 µm. This value was used as a maximum cut-off for determining the general shape of the object being measured. The roughness cut-off λc was set as 0.8 mm. This value was used to determine the maximum cut-off for data points collected when calculating surface roughness. It was also used as the travel distance for each roughness sample. A sample size of 10 was used resulting in a measurement path that was 8 mm in length. This path was manually set to have a midpoint at the center of each sample. A Gaussian filter was used to process the collected data and results are reported in Ra for comparability to external sources. For the samples with a wall length of 10 mm, the λc value was changed to 0.25 mm and 15 samples were taken resulting in a path length of 3.75 mm to avoid collecting data from areas where the supports were connected due to the large radial depth of cut experienced there.
3. Results
3.1. Comparison to Unsupported Case
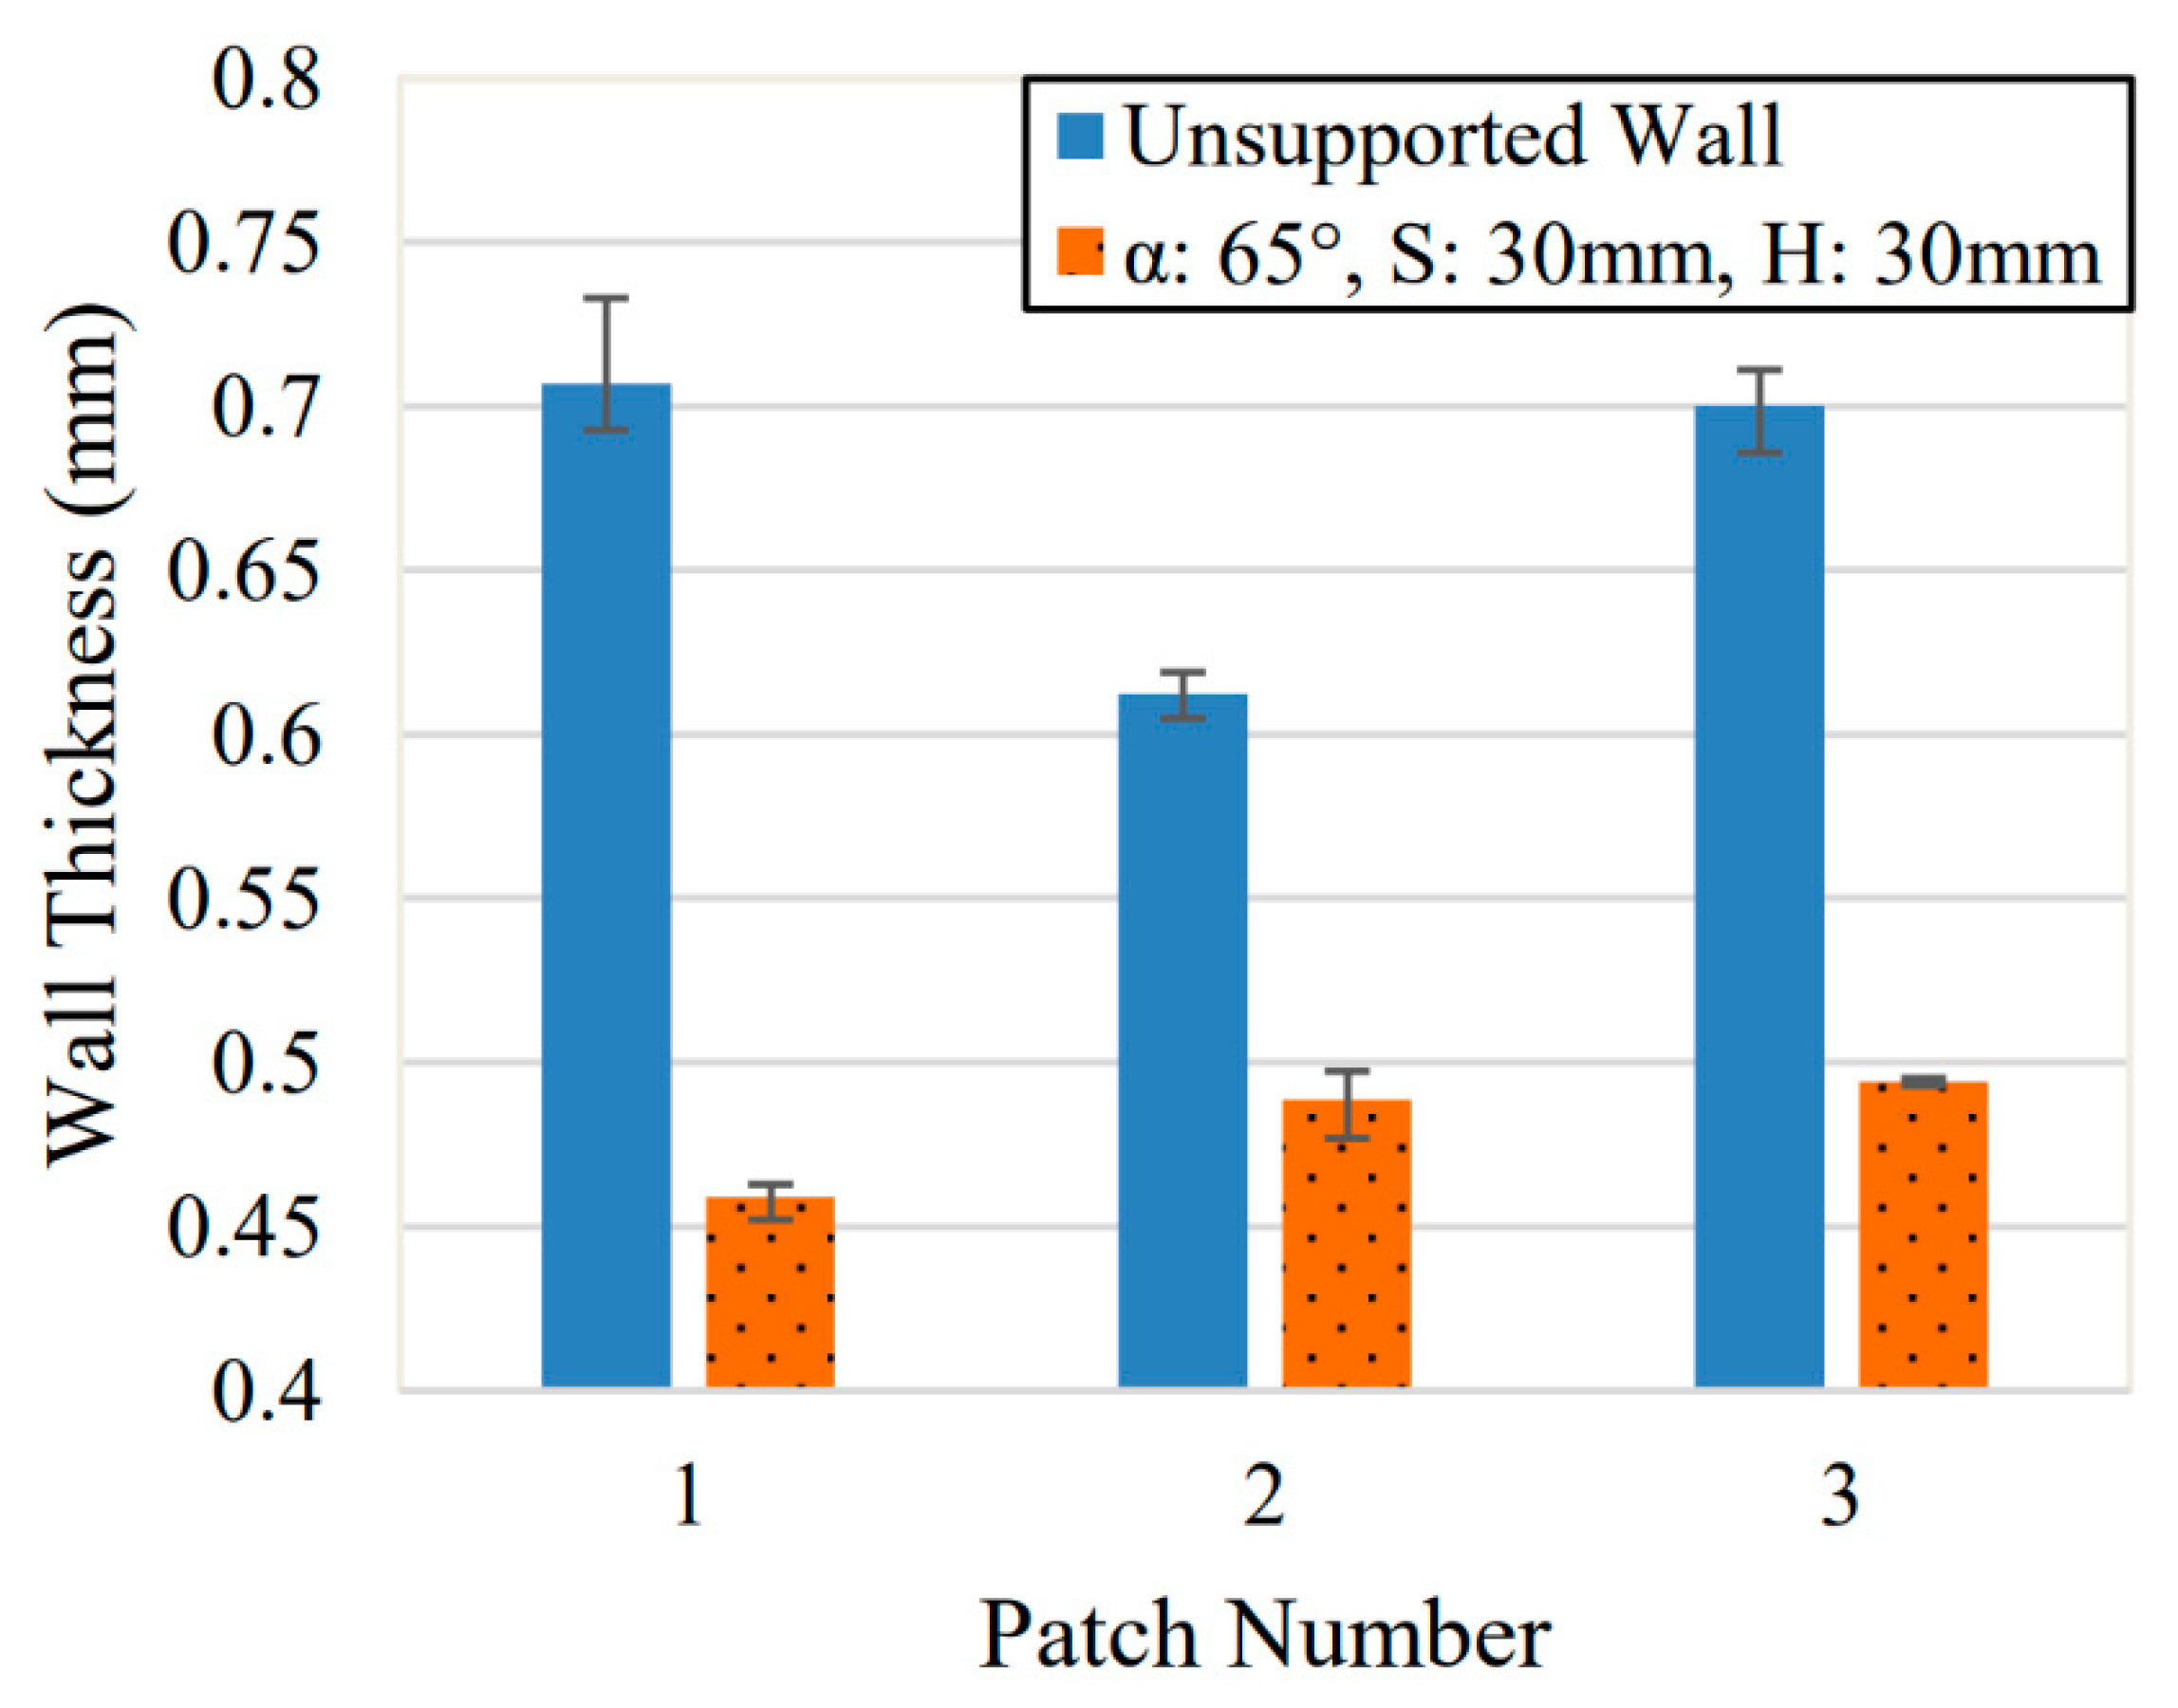
Comparisons between the unsupported and supported cases showed the largest change in values during the experiment. For these comparisons, both the supported and unsupported walls were 30 mm in length (S) and 30 mm in height (H). The supported walls used α = 65° supports which was the midpoint of the selected angle parameter range and wall length range. All samples were machined to a nominal thickness of T = 0.5 mm. Three samples were produced for each case, and their range of values is represented as error bars. All thicknesses are measured at a height of 26.5 mm. Across all samples the error and surface finished improved as height decreased, so this height was meant to serve as a worst-case result based on the highest point that could be measured using the CMM. The plotted value represents the average of the three samples for each parameter set. Figure 5 shows the comparison between these two sets of samples.
The unsupported samples were roughly 0.1–0.2 mm oversized after machining while the supported samples were undersized by up to 0.05 mm. This geometric error is similar in scale to other investigations of thin wall machining for walls of similar size [23,24]. For a thin wall with an aspect ratio of 25:1, even higher levels of geometric error have been observed [3]. Variation in geometry size was also more consistent on the supported walls with the largest deviation from the average being 0.012 mm versus the largest deviation in the unsupported case which was 0.026 mm. Trends can be noted about the geometry across the length of the wall as well. In the unsupported case, each end of the wall was measured to have approximately 0.1 mm higher error than the center of the wall. This is due to the wall bending in multiple directions at the ends of the wall where there was higher stiffness on one side of the point along the wall being machines than on the opposite side. Meanwhile, at the center of the wall there was equal material on both sides of the force being applied resulting in what is approximately 2D bending. In the supported case there was asymmetry in the results where the thickness at Patch 1 was smaller than at Patch 2 and 3. This is likely due to asymmetry in the tool path used. During machining, the end mill traveled in the direction from Patch 1 to Patch 3. As a result, the end mill first contacted the remaining support material at the support nearest to Patch 1 and then eventually encountered the thin wall itself. However, at Patch 3 the end mill was already in contact with the thin wall when it comes into contact with the remaining support material. This increased the radial depth of cut and the cutting forces applied which increases deflection and geometric error at Patch 3. The Patch 2 point exhibited deflection as it was the least supported point along the length of the wall. Asymmetry in the wall thickness across the path being machined was also seen in the thin walls produced by Alexander et al. [23] and is attributed to the decrease in wall thickness during machining.
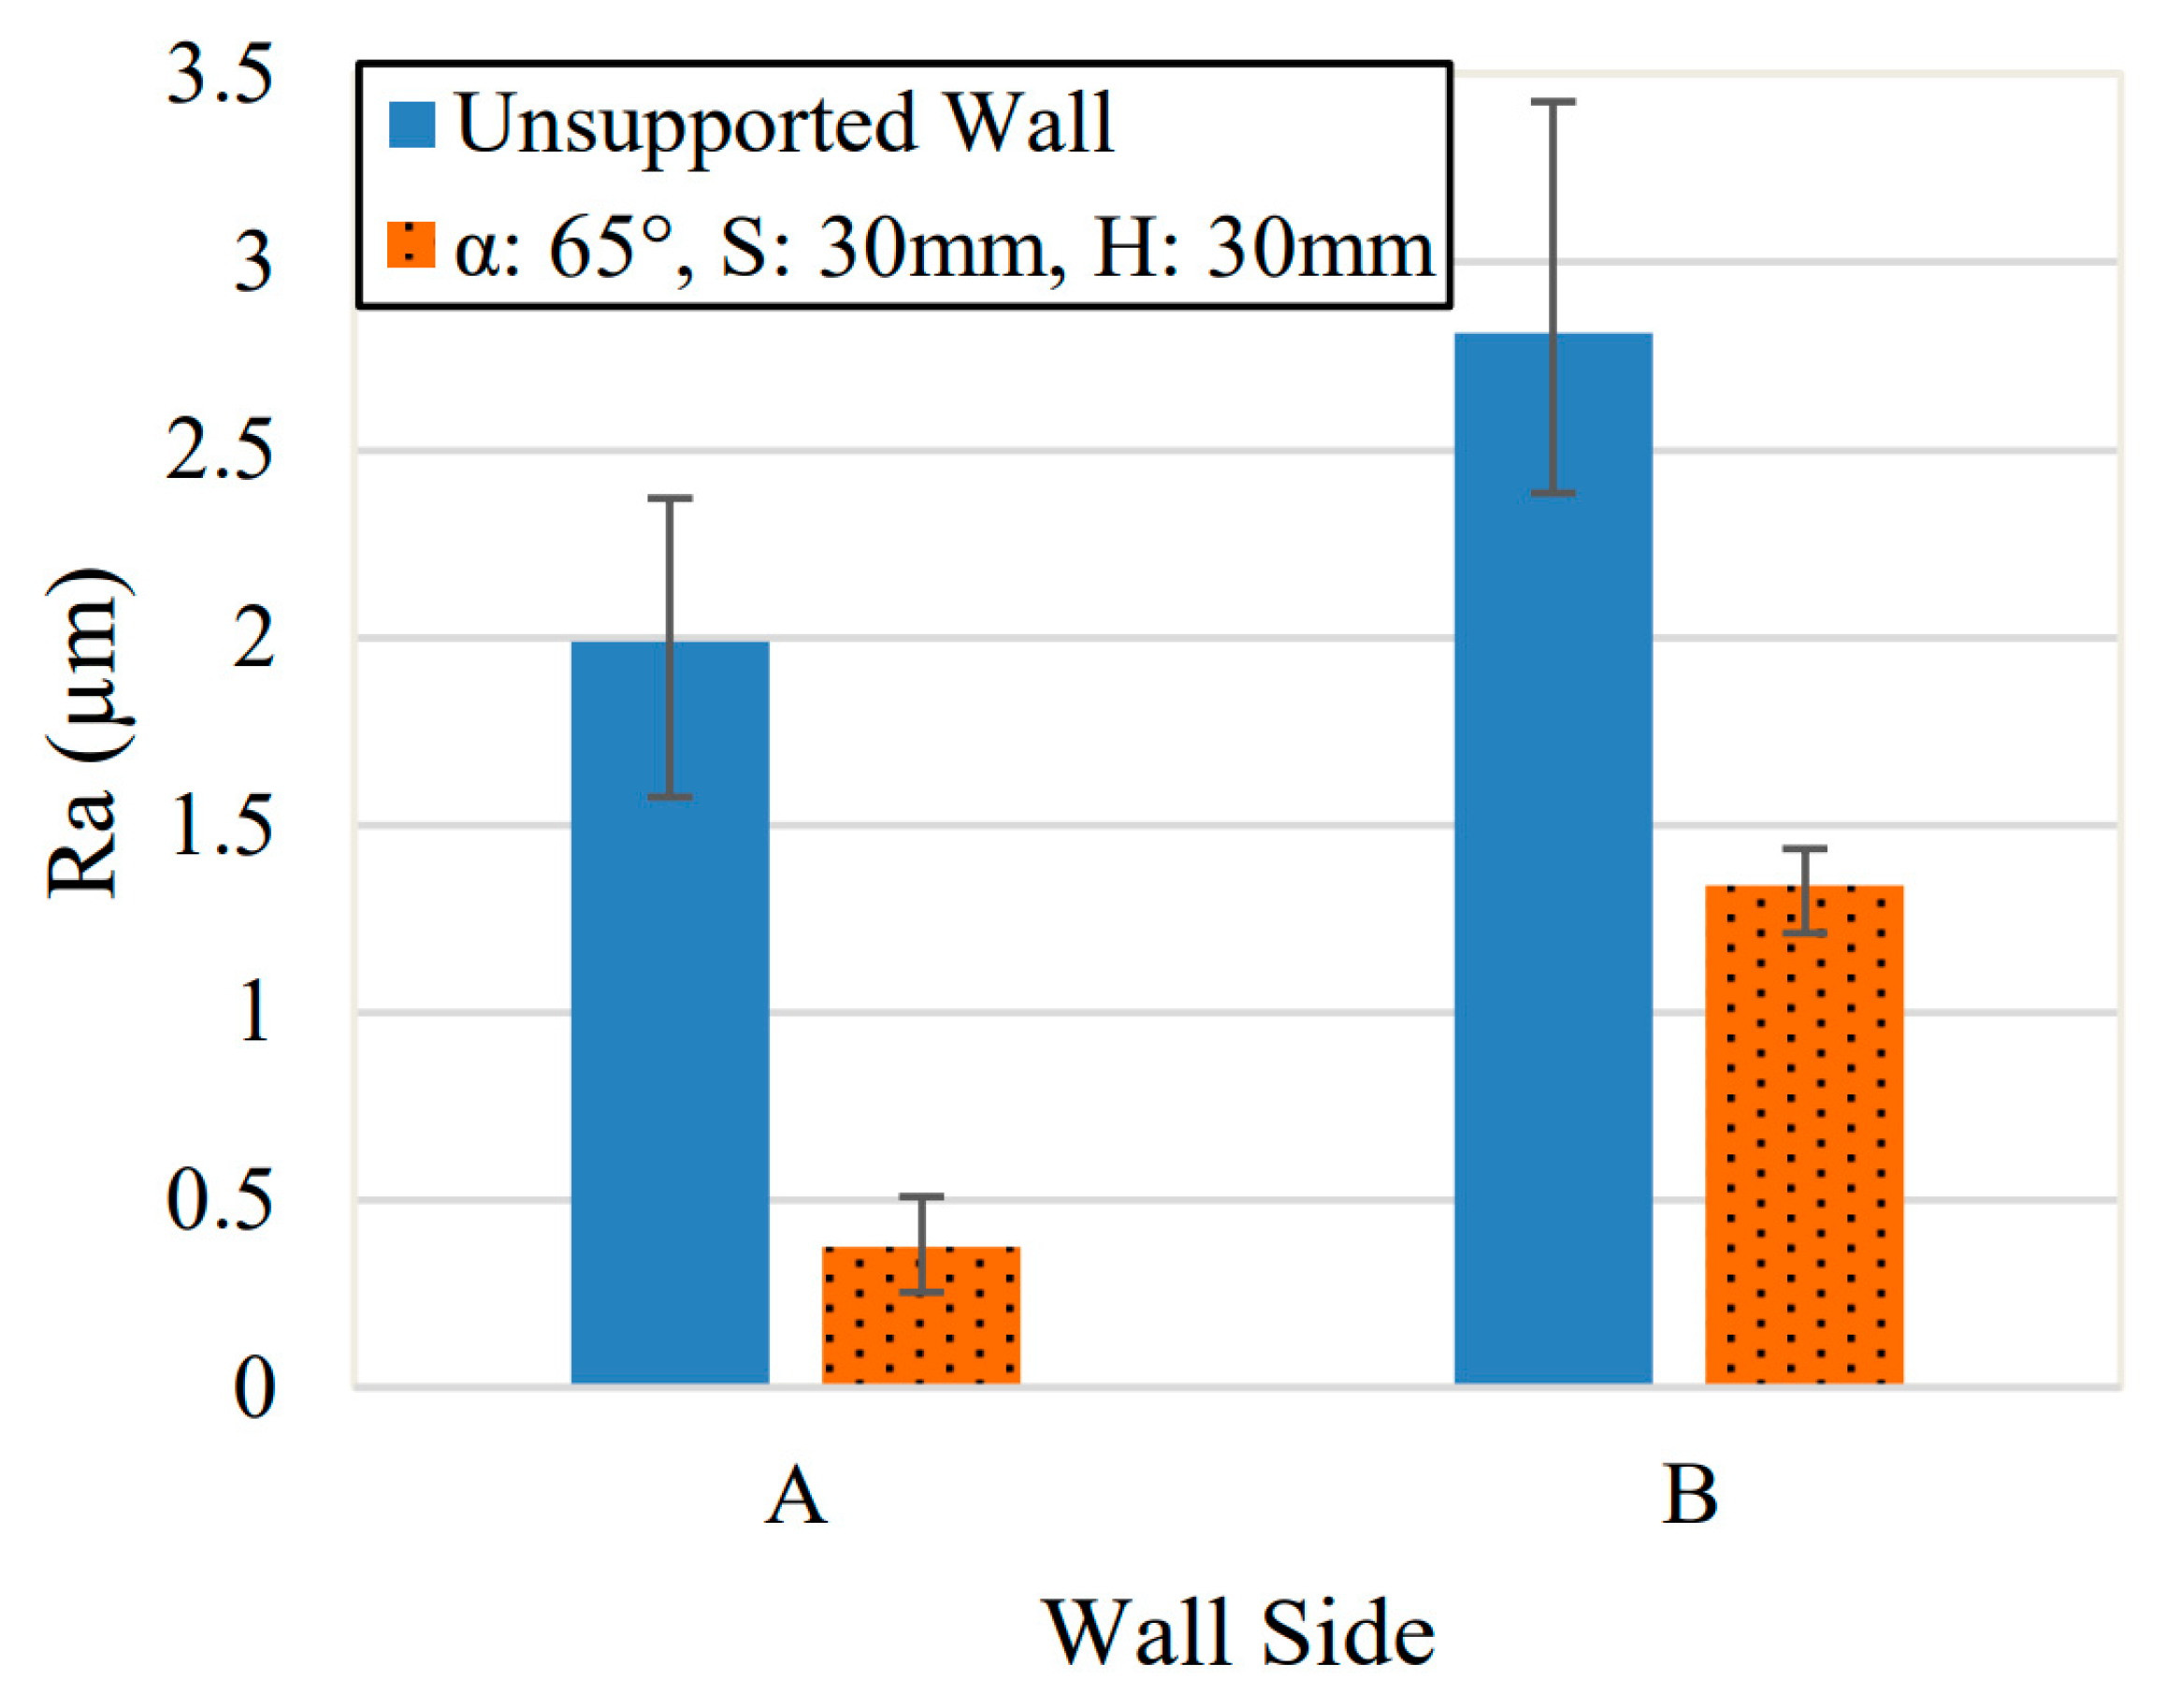
Figure 6 compares the surface roughness of the unsupported and 65° supported samples. Two comparisons are shown in the plot to represent the surface roughness on each side of the wall. This is done to illustrate that there is a significant difference in surface quality between the first and second thin wall machining pass for each machining step down, and is represented as Side A and Side B. Columns labelled A represent the surface finish for the side of the wall that was machined first for each Ad = 2 mm step down during machining. Similar, columns labelled B show the surface roughness for the side that was machined second for each step down.
With the machining path used, the first machining pass for each step down (Side A) was performed while the support structure on the opposite side of the thin wall was still intact. This means that the first machining pass has 2 mm of additional support that is not present when machining Side B. As a result, the roughness measured on the side of the wall that experienced the first machining path was much lower than the opposite side. Variation between sides in the unsupported case was due to the decreased thickness in the thin wall resulting in higher deflection. Overall, the supported wall surface roughness was approximately 1.5 µm lower than the unsupported samples on both sides. Larger error in the unsupported case was much higher due to much larger influence from chatter on the surface finish. The results for Side A were similar to those found in [25] for a wall of similar thickness and height during machining. Although this experiment involved a curved wall which should improve stiffness of the straight walls produced here. The surface roughness measured on Side B for both samples was high compared to other results found for thicker thin walls [26]. Although higher surface roughness measurements have also been noted for high speed milling of aluminum thin walls [27].
3.2. Support Angle Effect on Final Geometry
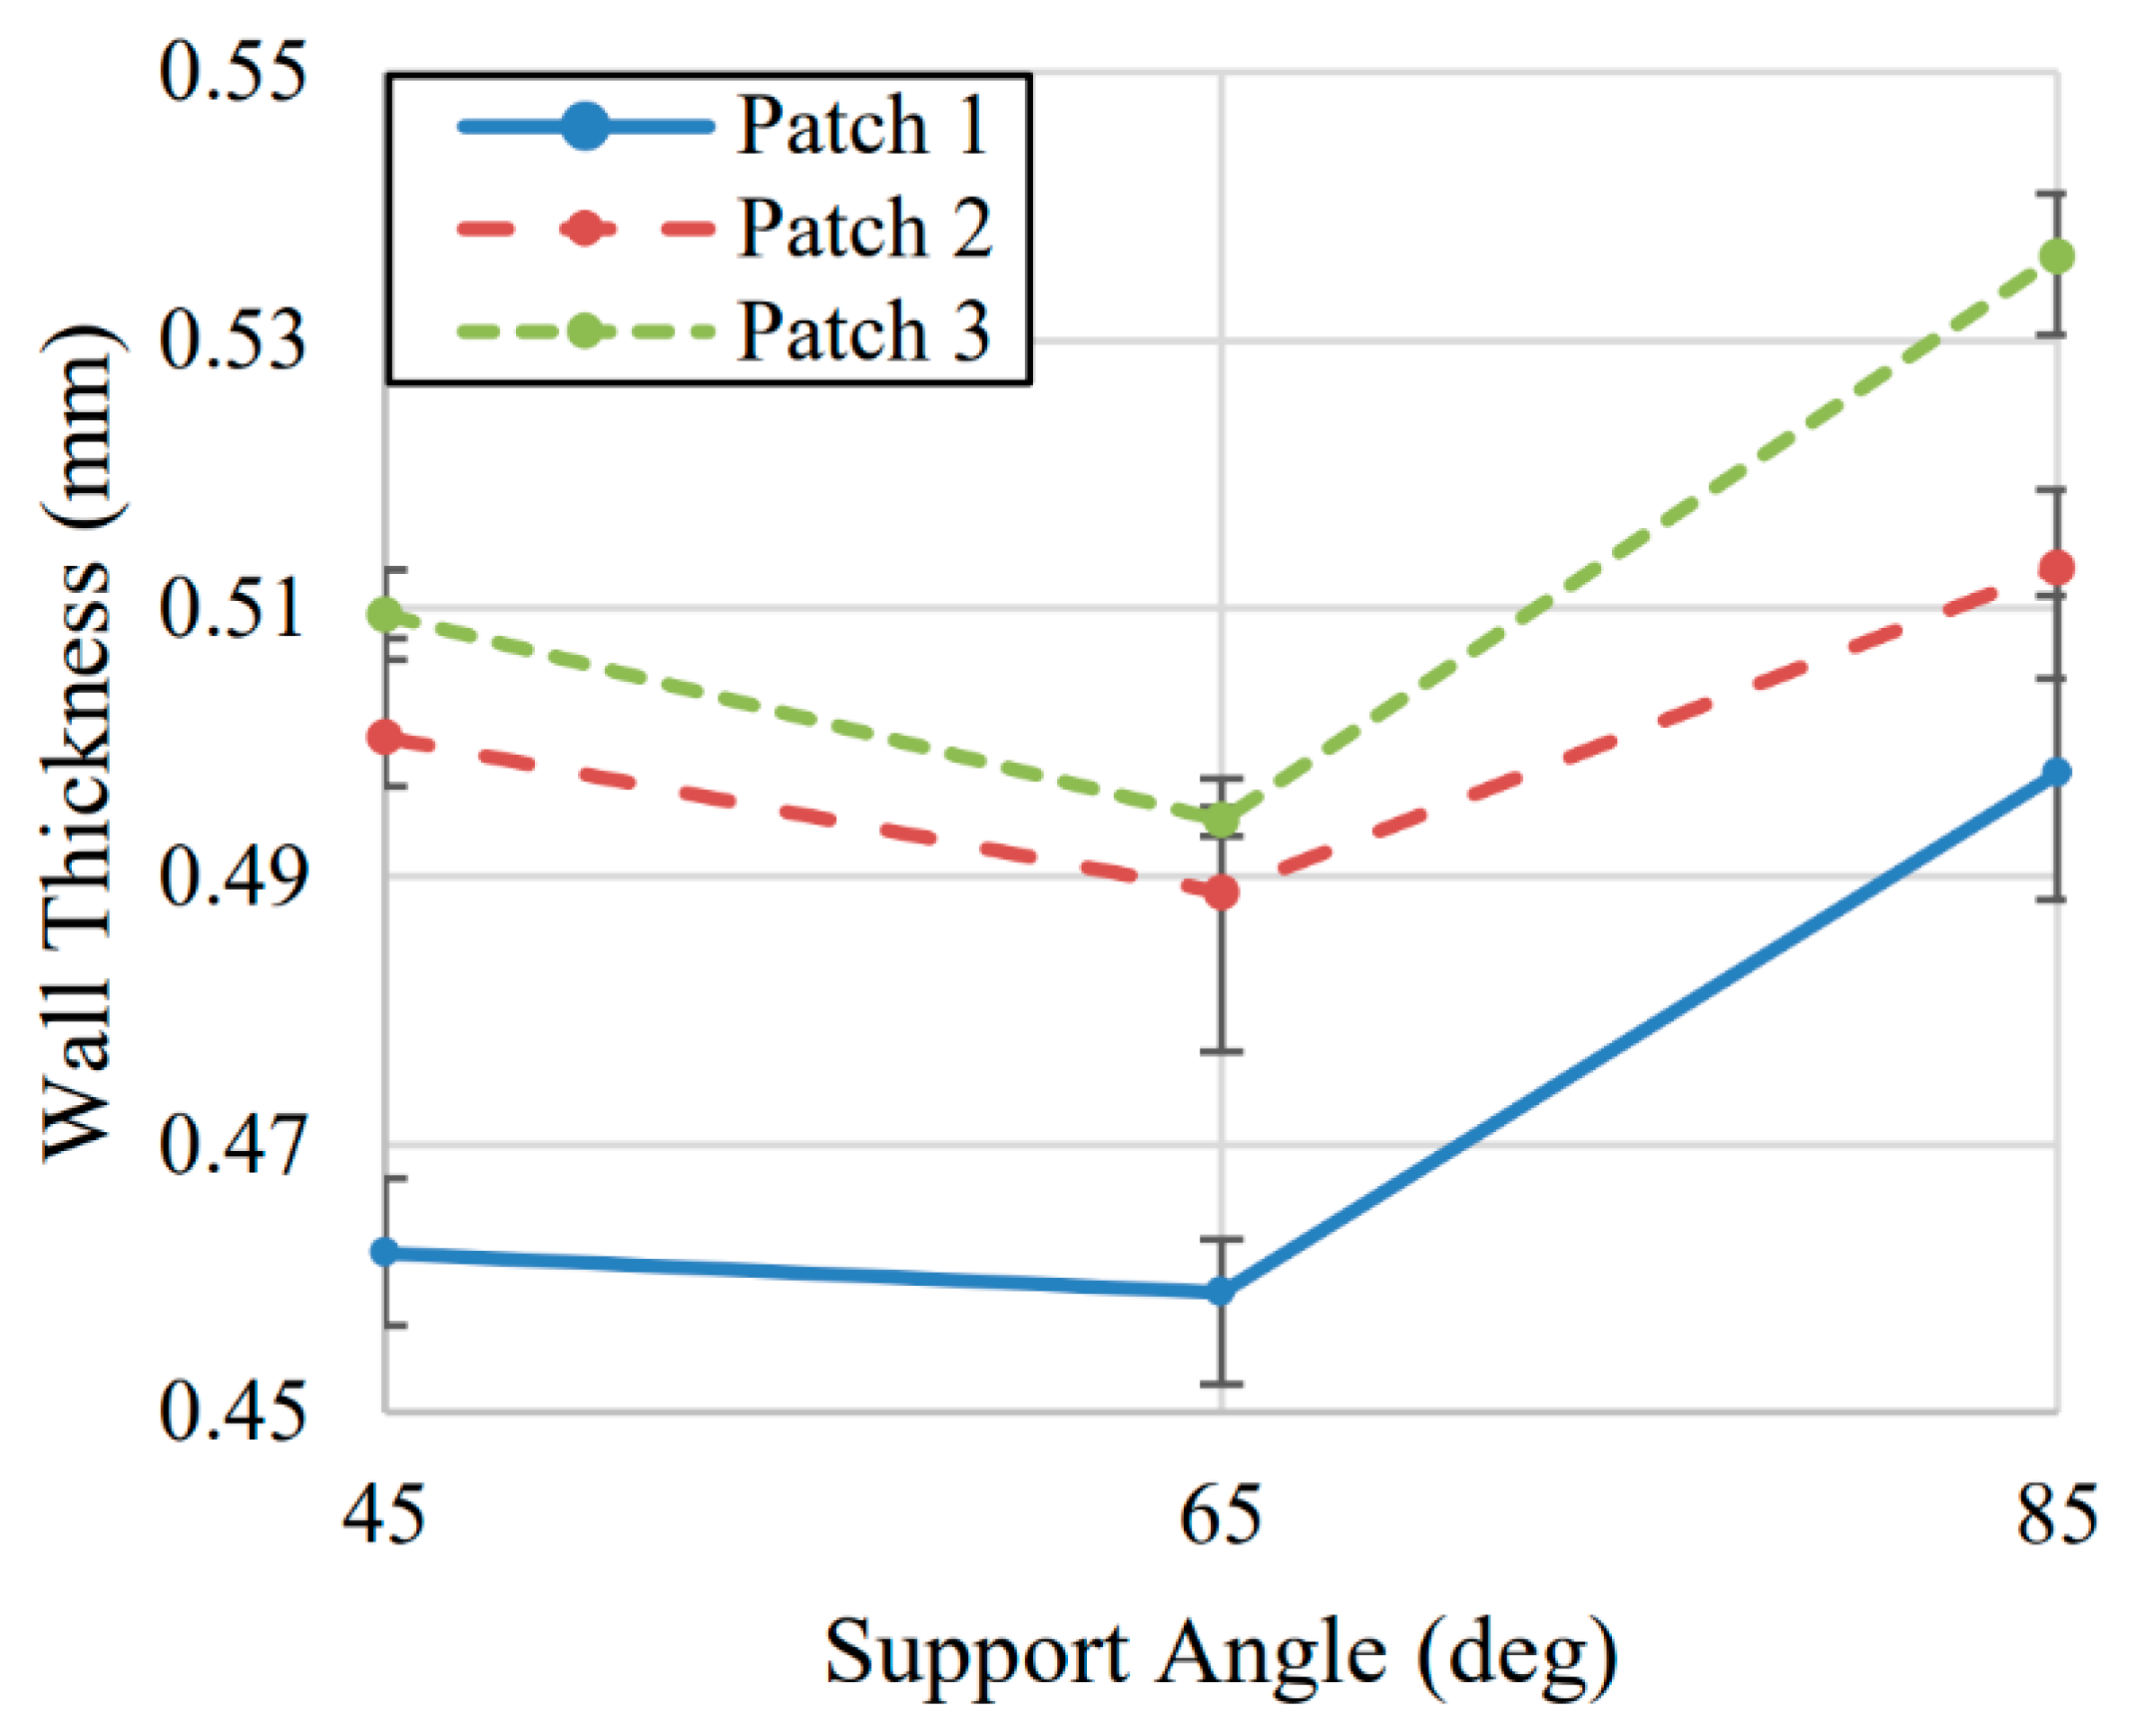
Samples with supports angles of α = 45°, 65°, and 85° were compared to determine the support angle effect on thin wall geometry and surface roughness. Based on the results from the CMM measurement plan, the results were split into 3 different lines. Each line represents the thickness measured for Patch location 1, 2, and 3. The trend for the impact of different support angles is similar, but the overall size varies depending on position.
All samples used for support angle comparison showed similar trends across the length of the wall to the baseline α = 65° support wall used for the unsupported comparison. The wall was thinner where the end mill first contacted the wall, and similar thickness measurements were seen at the Patch 2 and Patch 3 points. All three of these points are plotted below to show their differences and to serve as additional points for validation of the influence of different support angles.
As seen in Figure 7, wall thickness increased between α = 65° and α = 85° as would be expected as the support structure was less substantial, this allowing an increase in wall deflection during machining. Between α = 45° and α = 65°, the thickness appeared to decrease slightly. This change is close to placing within the error bars generated based on the spread of 3 samples, however this discrepancy could also be due to the order in which the samples were produced. The α = 65° supported wall samples were the first samples to be produced with an unused tool. Meanwhile the α = 45° were produced near the end of all the samples made. Tool wear may have been an influence on these results as the sharpness of the tool can greatly impact the cutting forces applied to the thin wall and therefore increase wall deflection and thickness [28,29]. The use of a sharper tool on the α = 65° samples may have resulted in lower wall thickness for those samples compared to samples produced after the end mill had been used several times. Overall change in wall thickness between α = 45° supports and α = 85° supports was roughly 0.02 mm. The cost of this improvement in geometry is relatively high as significantly more printing and machining time was required for the α = 45° support.
3.3. Support Angle Effect on Surface Roughness
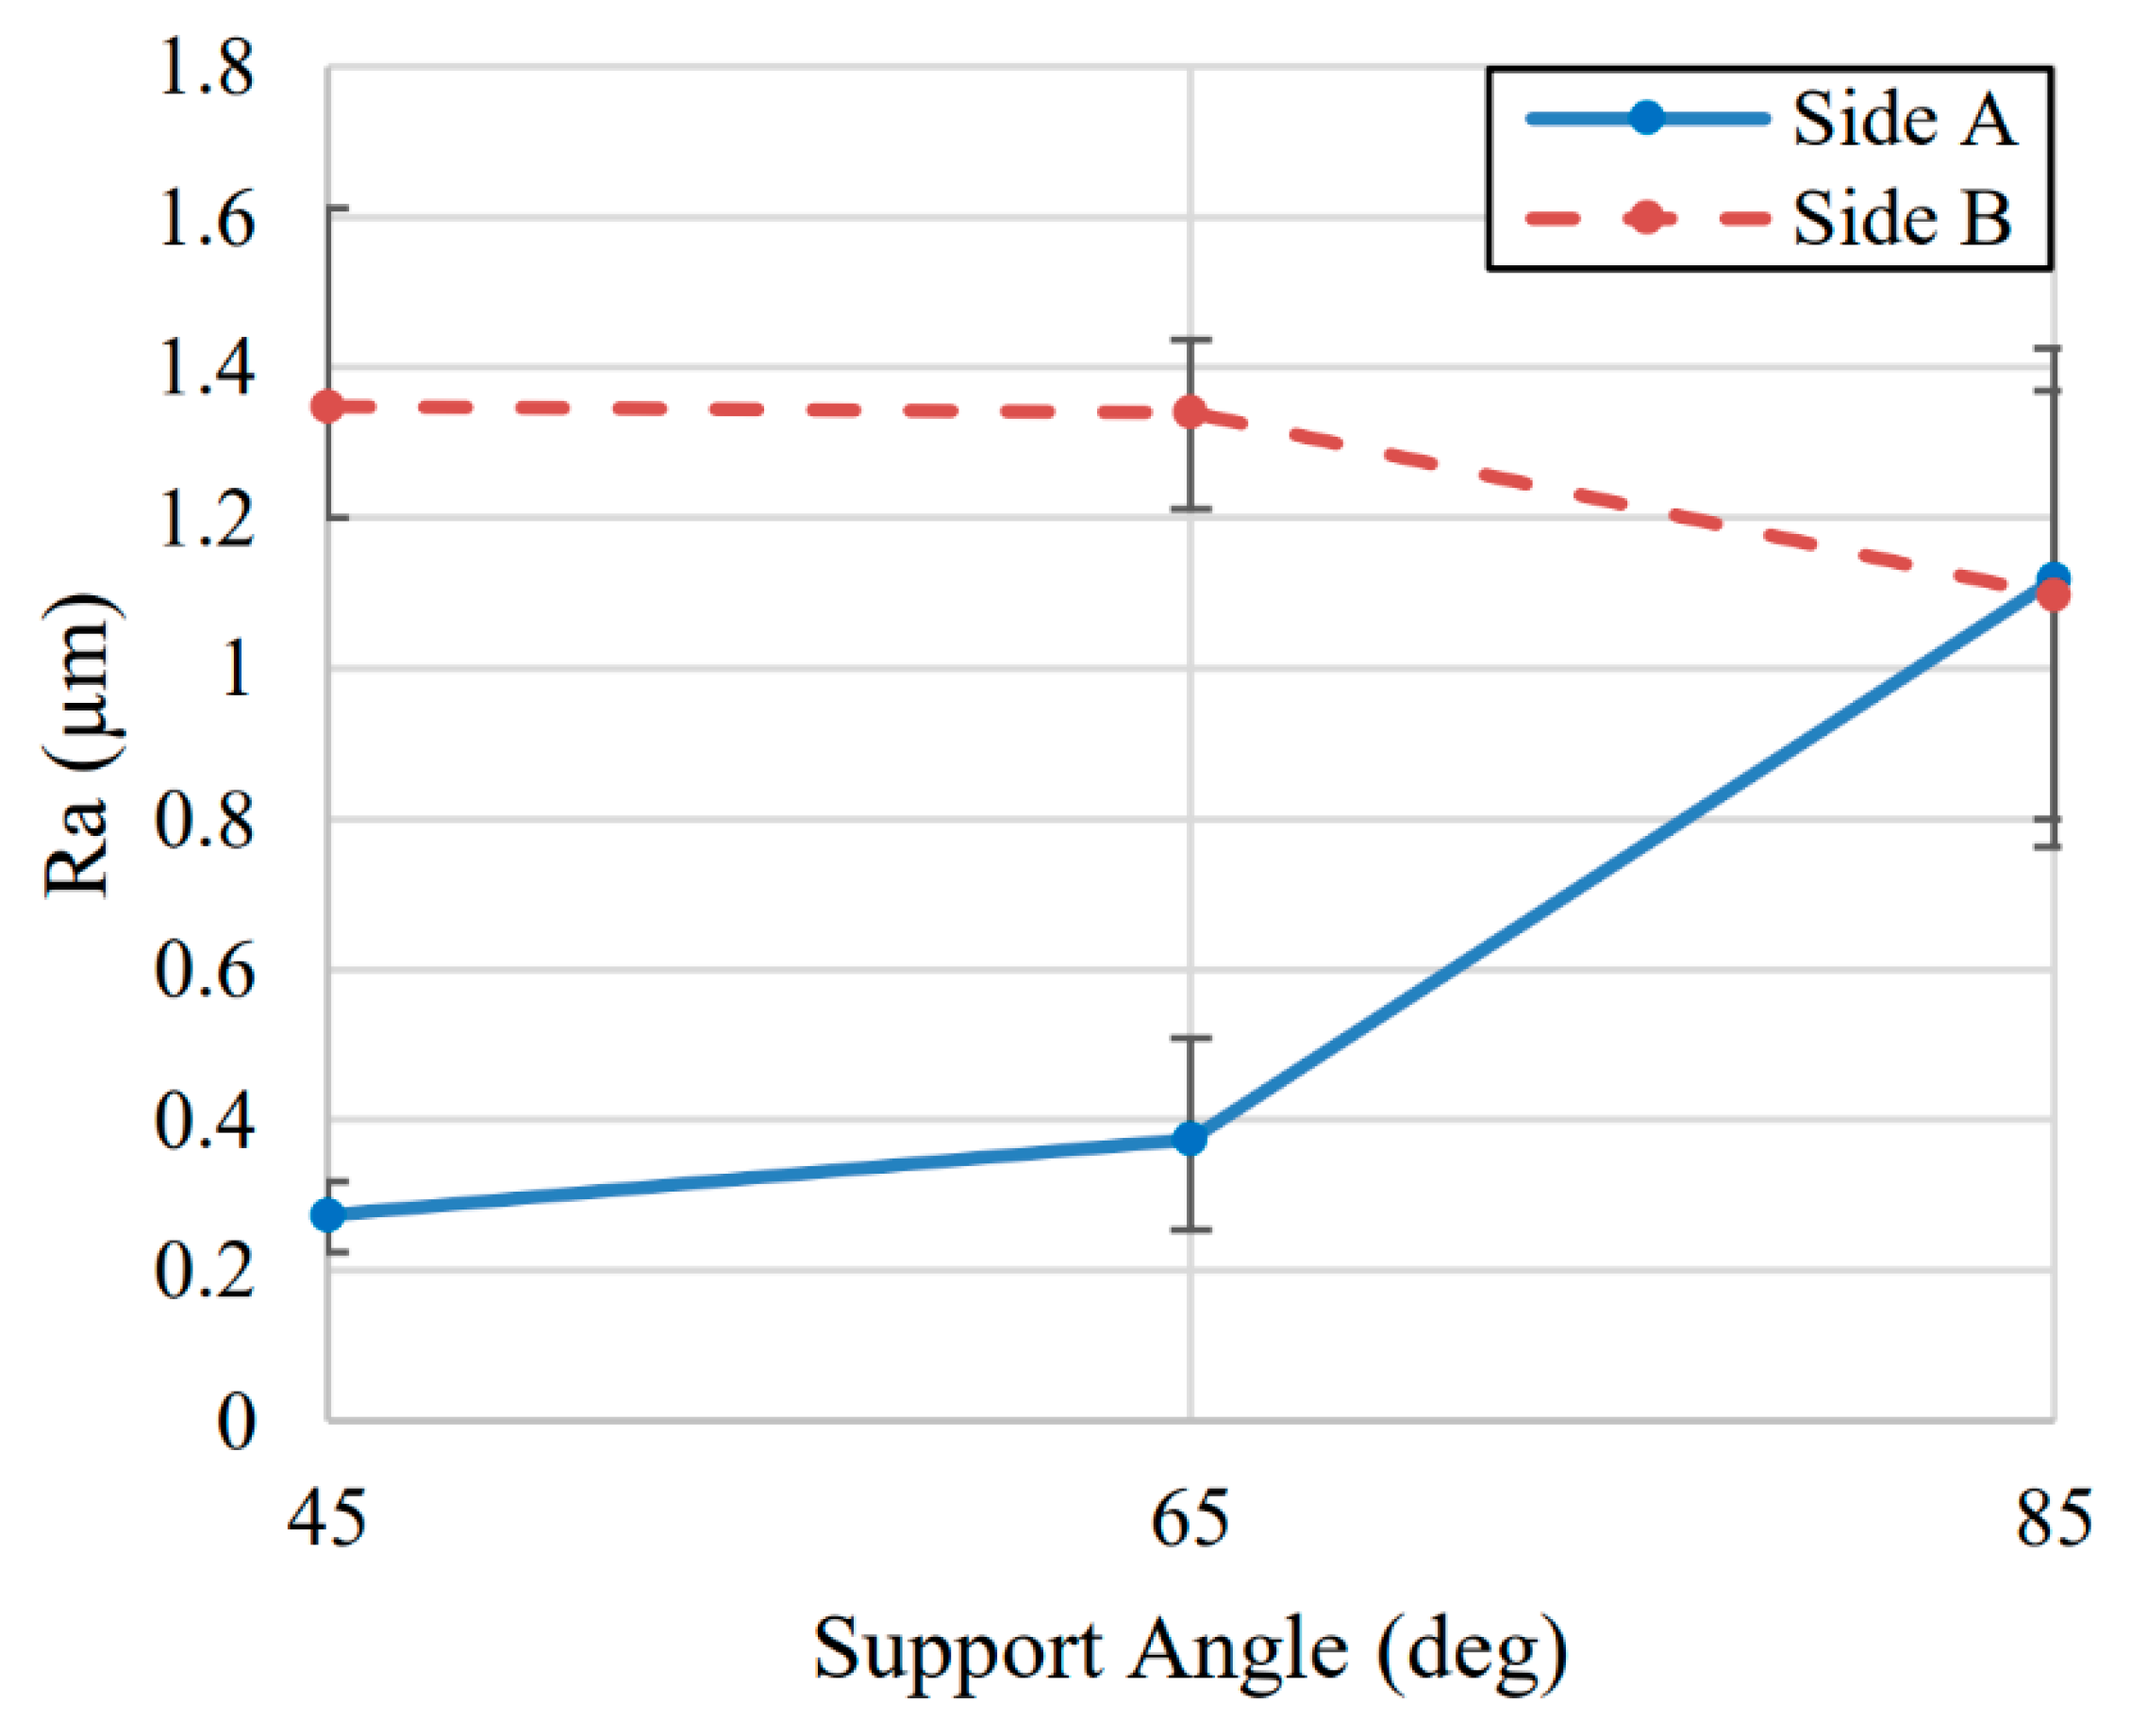
The surface finish on supported walls changed at a much larger scale as the support angle was varied. Figure 8 shows these results for each side of the wall listed as Side A and Side B. Side A represents the machining pass where the supports on the opposite side of the wall were still present when machining the thin wall, and on Side B the supports on the opposite side of the wall have already been machined, and was therefore less stiff. Error bars are represented by the range of values measured for the three samples at each support angle.
The surface roughness measured for Side A see an exponential increase in surface roughness as support angle was increased. By α = 85° the surface finish on Side A of the wall was similar to the surface finish seen on Side B of the wall. At α = 45° and α = 65°, the surface roughness was extremely low and near the limit for surface finishes reasonably obtainable through milling. Side B of the thin wall remained relatively unchanged as support angles changed but was still significantly improved over the unsupported case. This was again due to the removal of the supports on the opposing side of the thin wall, resulting in a decrease in stiffness during the machining of Side B. However, the overall surface roughness of Side B was still much higher than Side A for most support angles. At α = 85° the surface roughness also varied much more widely, this was likely due to increased chatter on the surface that could have influenced the results.
3.4. Support Spacing Effect on Final Geometry
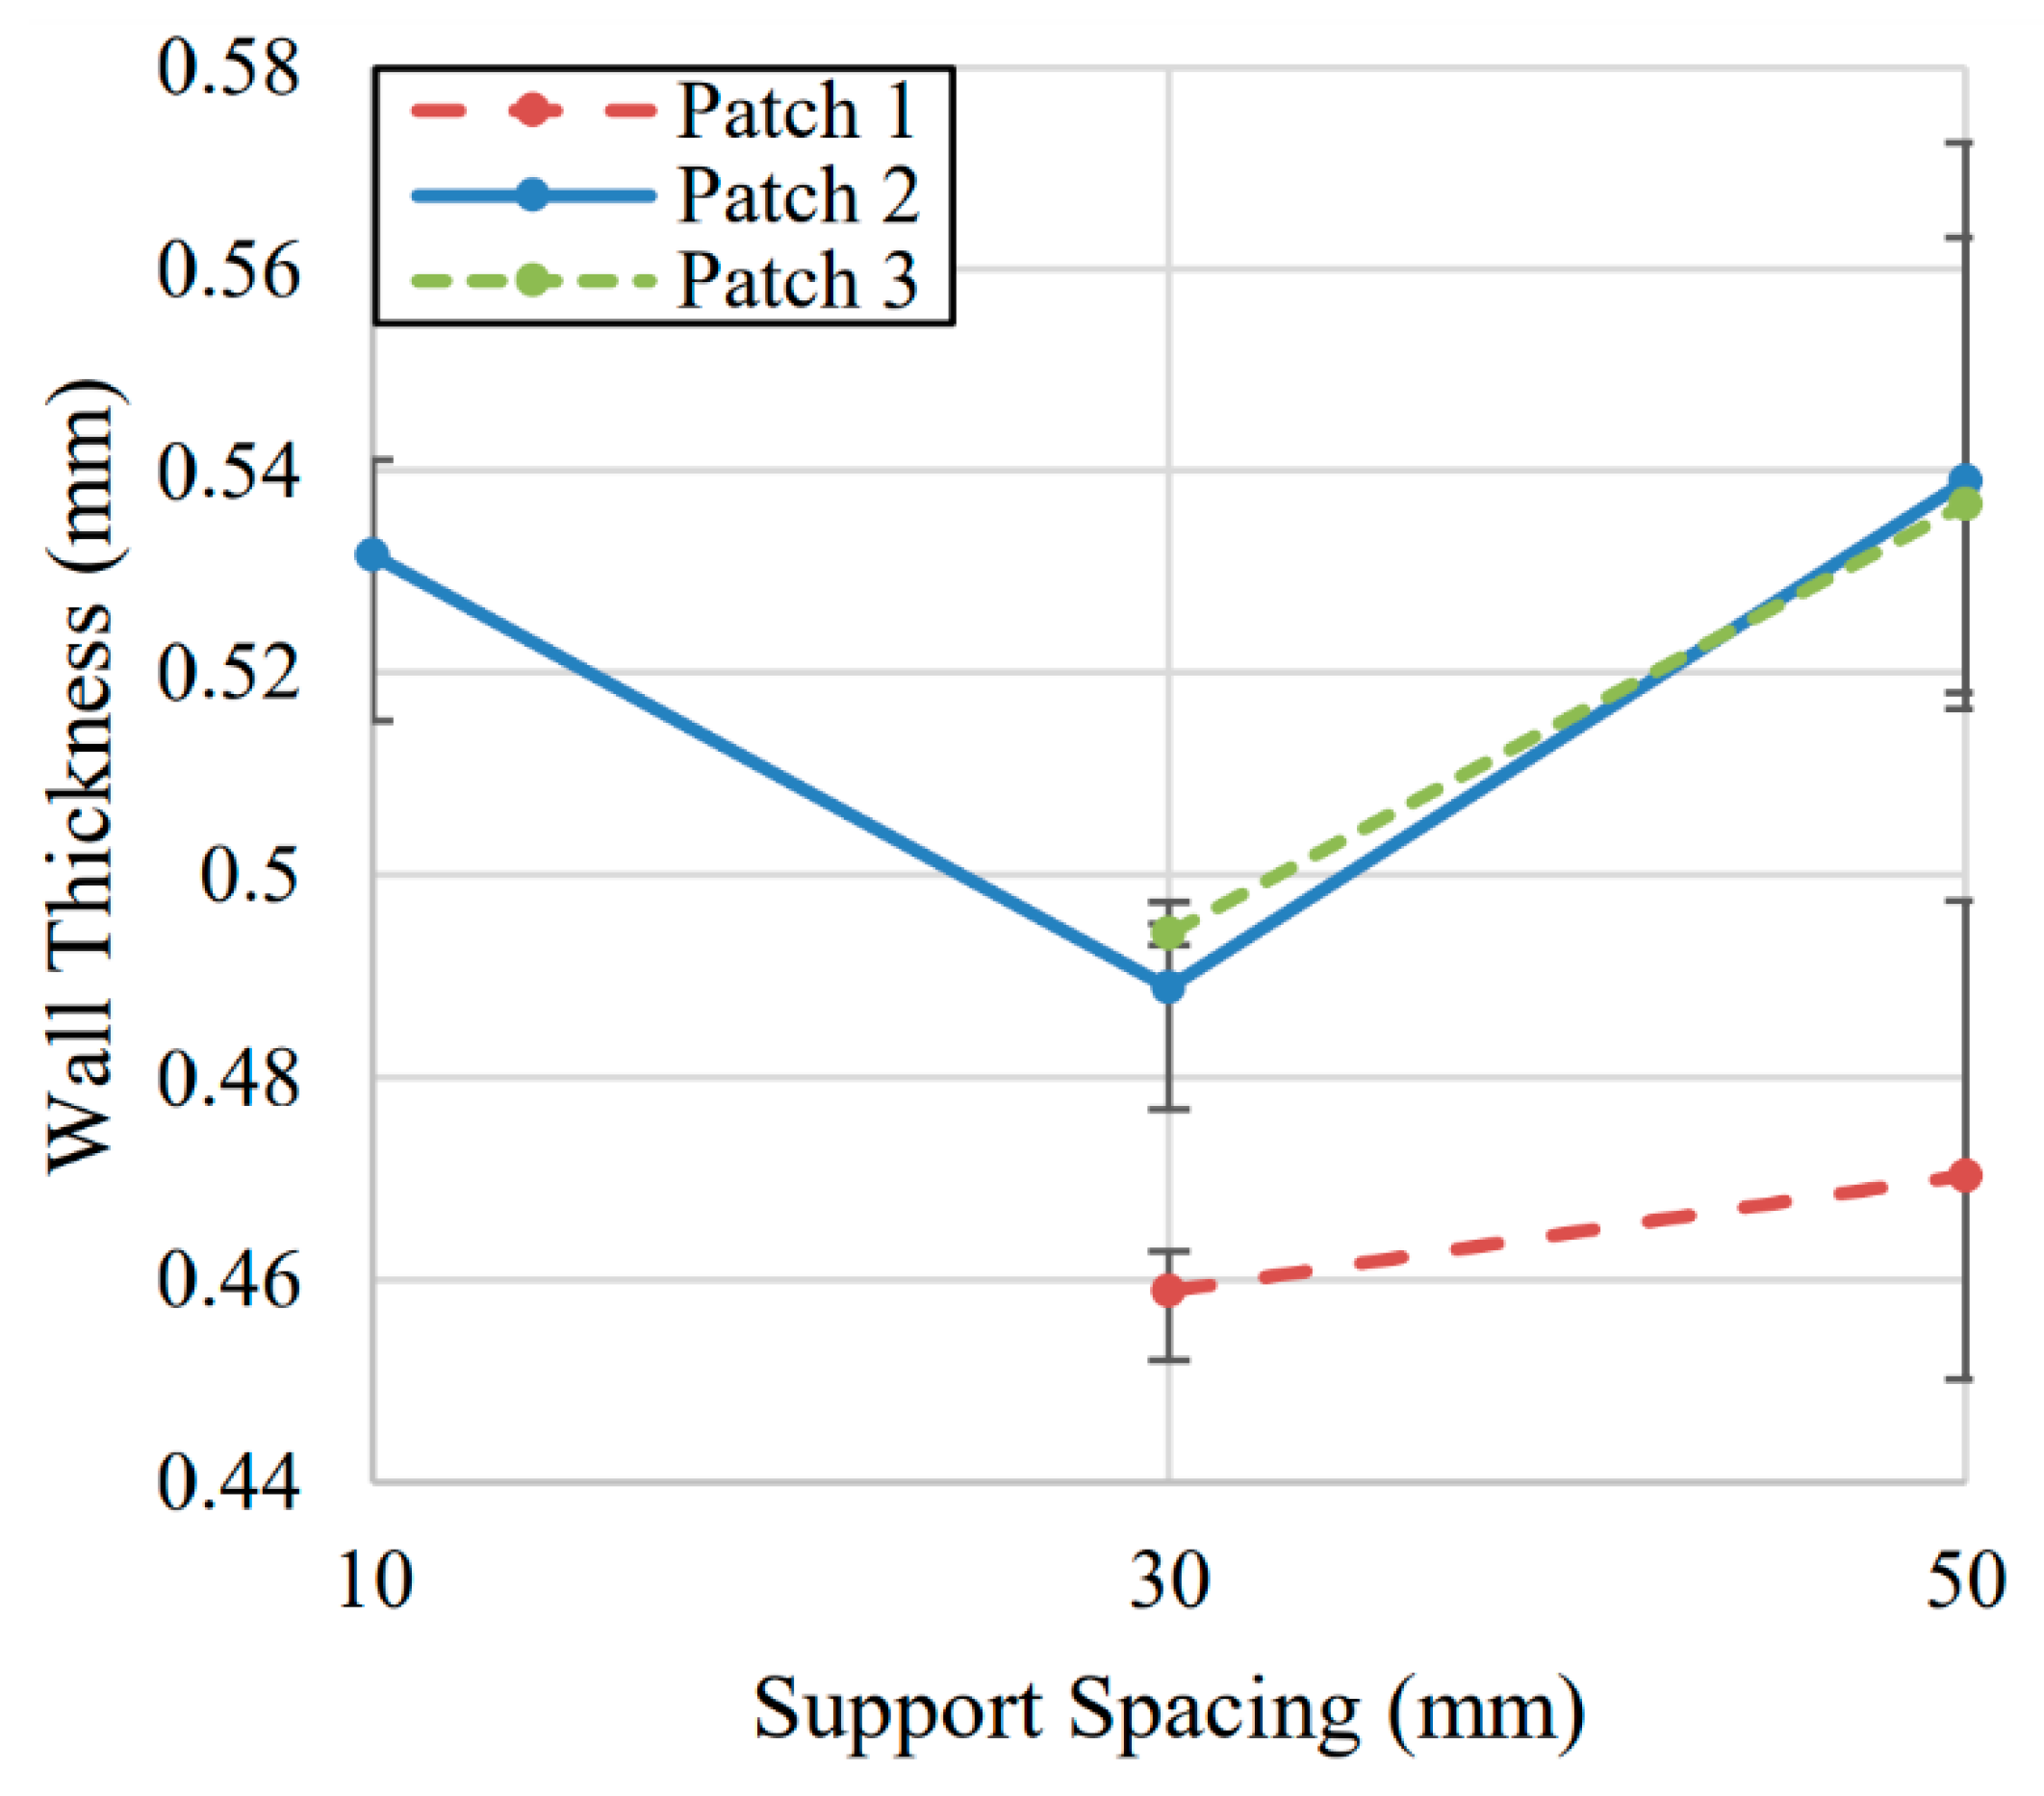
To evaluate the impact of different support spacing schemes, three samples were produced for each wall length of S = 10 mm, 30 mm, and 50 mm. The support angle was fixed at α = 65°, and the support was printed to the full height of the thin wall. Due to the length of the 10 mm sample, results are only shown for the center of each wall for the S = 10 mm sample as there was insufficient space along the length of the 10 mm sample to collect thickness measurements at multiple points.
The results shown in Figure 9 are generally as expected for the S = 30 mm and S = 50 mm support spacing samples. Deflection increased as the supports were spaced further apart. The center and end of Side B had similar geometries as in the previous samples. The end of the Side A wall had smaller thickness due to smaller machining forces from lower radial depth of cut. The scale of the change between S = 30 mm and S = 50 mm was approximately 0.04 mm which is double the change seen between the α = 45° and α = 85° support angle changes.
The S = 10 mm sample was thicker than the 30 mm support spacing and was roughly similar to the 50 mm support spacing samples. This result was likely due to unintended loss in stiffness from the decreased length of the wall rather than the change in support spacing. Decreasing the support spacing between S = 30 mm and S = 10 mm would have been expected to reduce the deflection experienced during machining. Therefore, this result was likely more representative of the impact of length of the wall itself on deflection rather than support spacing. If a standalone thin wall were to be machined the length of the thin wall would influence the deflection experienced. A longer wall would deflect less and have lower geometric error than a shorter wall.
3.5. Support Spacing Effect on Surface Roughness
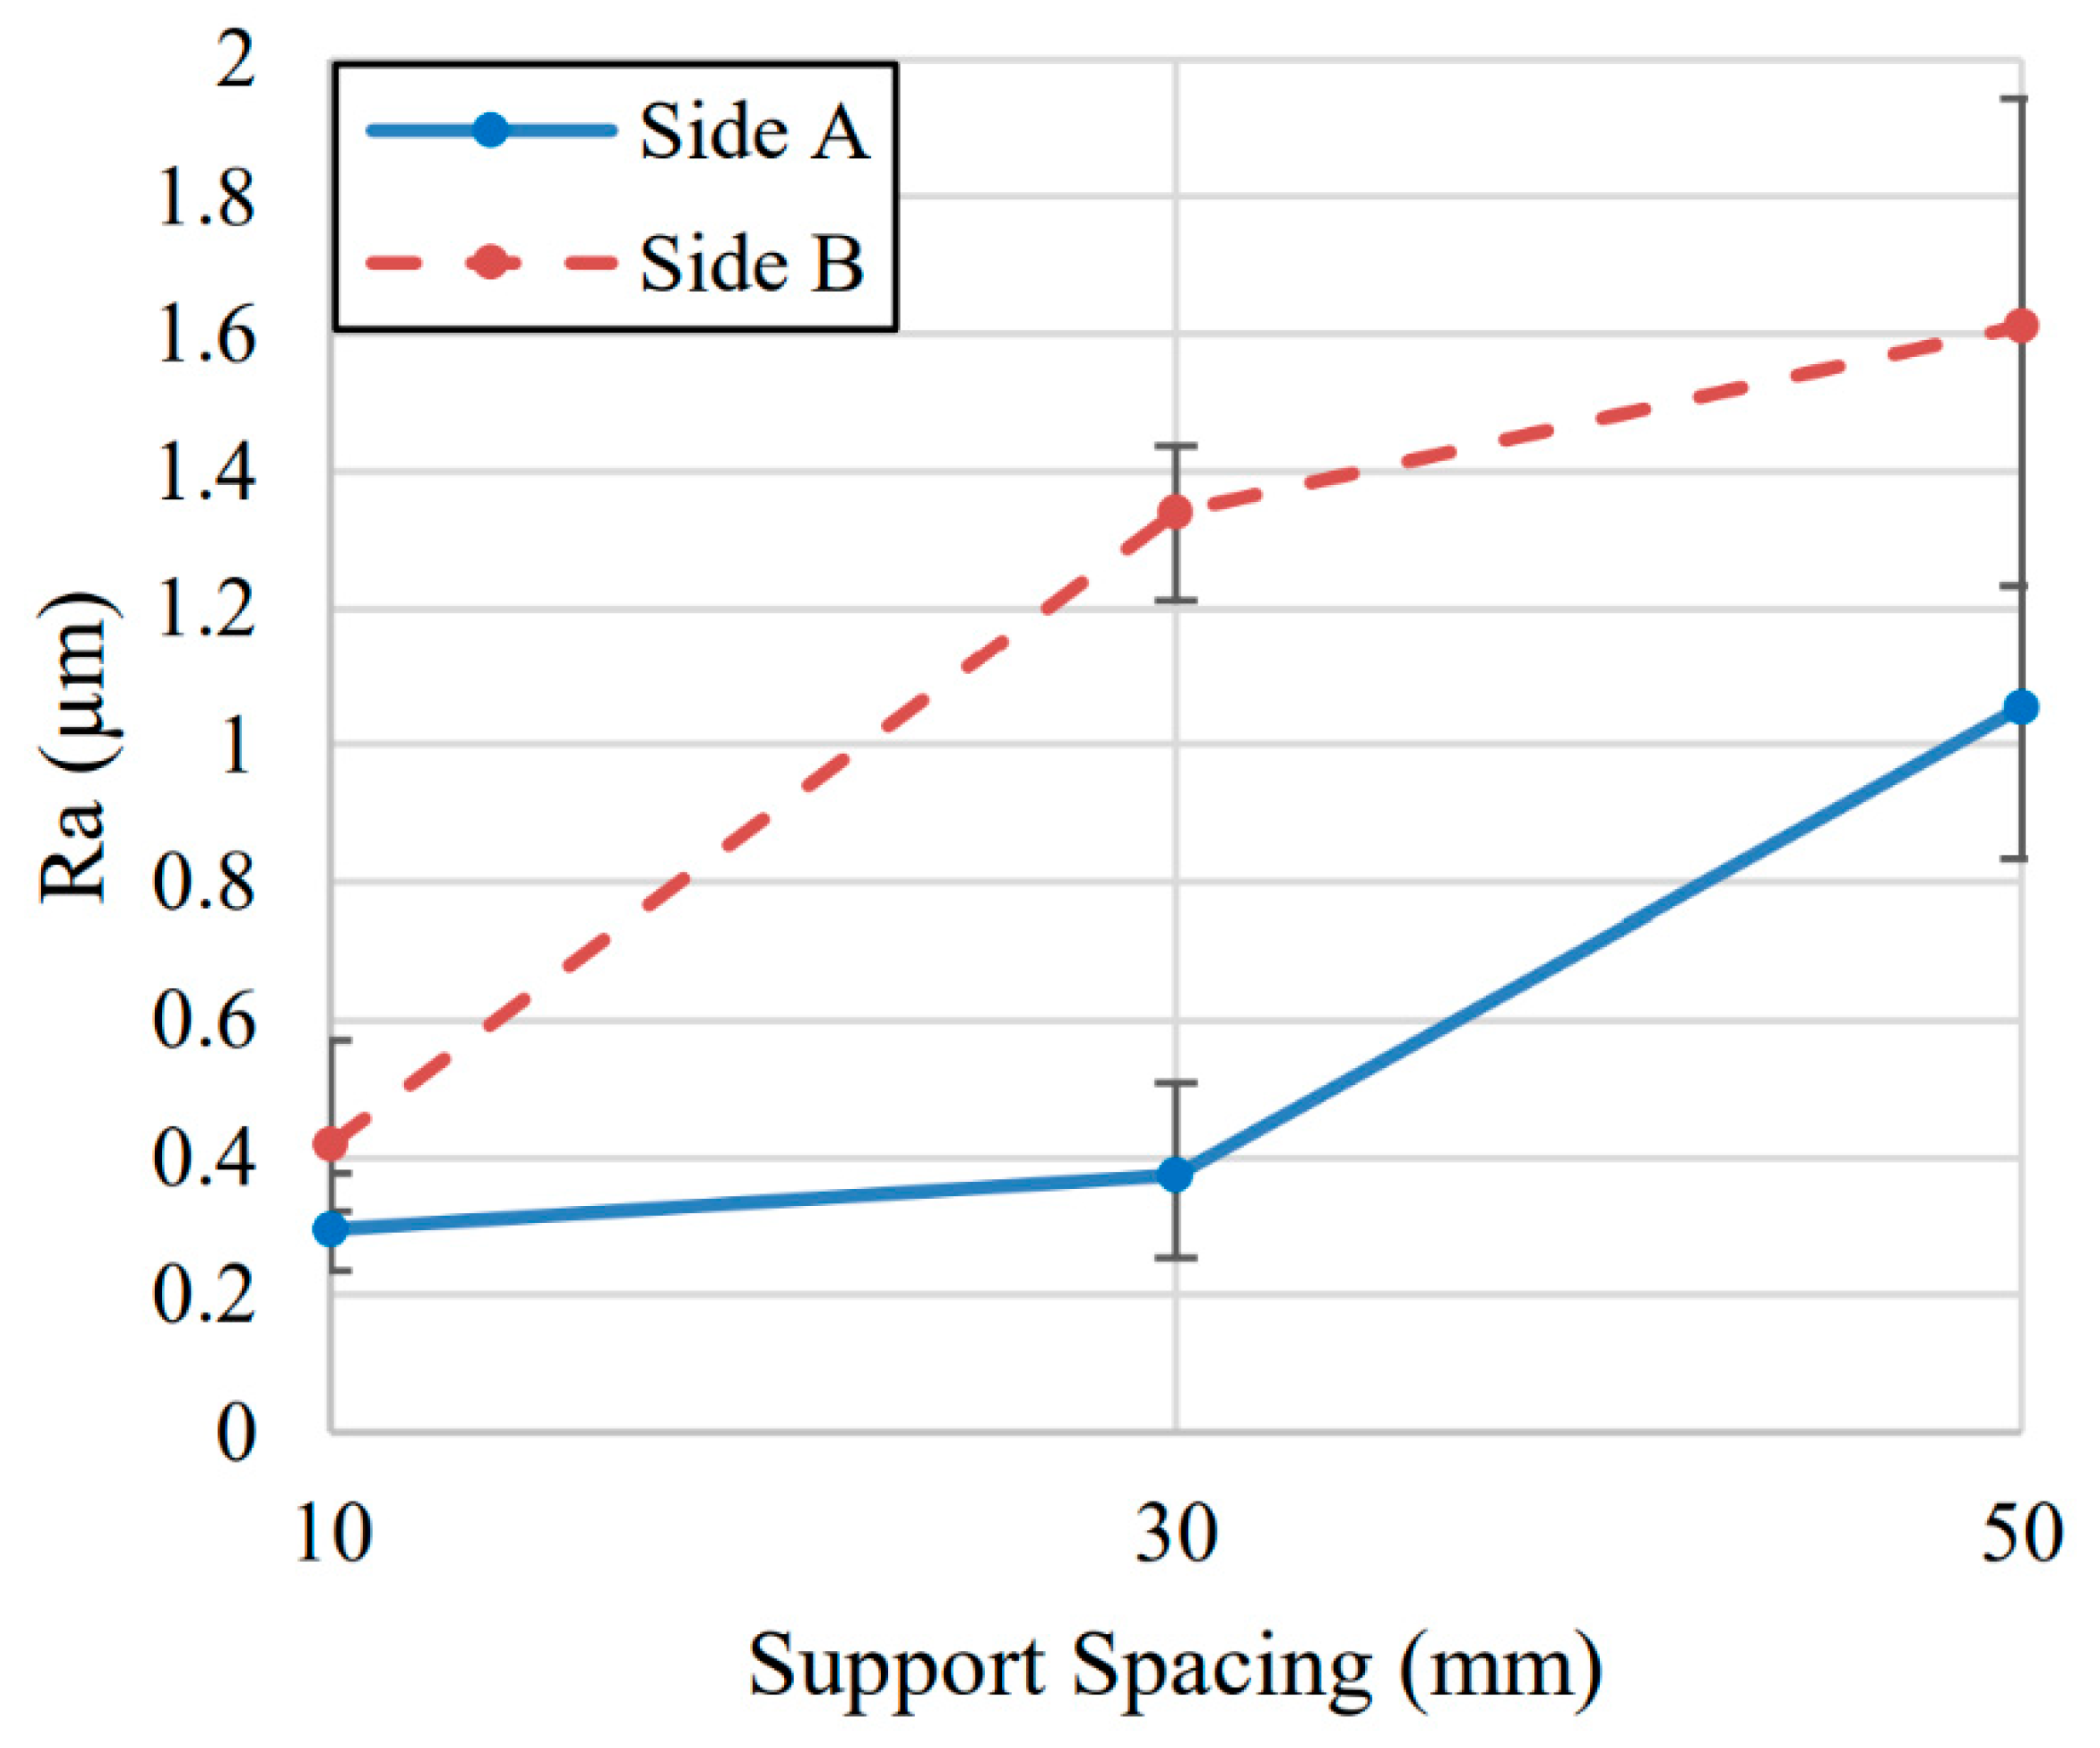
Despite the unintended deflection present in the S = 10 mm sample for geometric comparison, the surface roughness measured on the samples appear to plot as expected. Support spacing was the only parameter tested that appeared to influence the surface roughness for Side B of supported walls. Figure 10 shows that both Side A and Side B of the wall improved in surface roughness as support spacing was decreased. Increasing the density of support structures was expected to improve the stiffness of the workpiece overall which reduces the potential for chatter during machining. The improvement of surface roughness on Side B suggests that surfaces in closer proximity to the support structure will have a lower surface roughness on both sides of the wall. The stiffness provided by the support structure may rapidly decay for Side B at surface locations further away from the support structure. This is evident by the contact profilometer location for all other samples being located further away from the support structures, and correspondingly all other samples exhibiting higher surface roughness values.
For the Side A of the wall the surface roughness for support spacing corresponded to values similar to changing support angle. At S = 10 mm support spacing the surface finish was at the low end of what can be expected from milling, and at S = 50 mm the surface showed some evidence of chatter and increased surface roughness. There was only a small increase in surface roughness between S = 10 mm and S = 30 mm spacing, although this would represent a major increase in material used and printing and machining time required. For Side B of the wall however, there was a very large increase in surface roughness between S = 10 mm and S = 30 mm. Surface roughness for the S = 10 mm sample was the lowest Side B roughness measured for all parameters. However, this would appear to be opposite what might be expected when compared to the geometric error that was present on the S = 10 mm samples. This result may indicate that surface roughness and geometric error are not necessarily coupled due to the influence of chatter. The S = 10 mm sample may have had high deflection due to its short length, but the geometry avoided any chatter and therefore enabled a low surface roughness.
3.6. Support Height Effect on Final Geometry
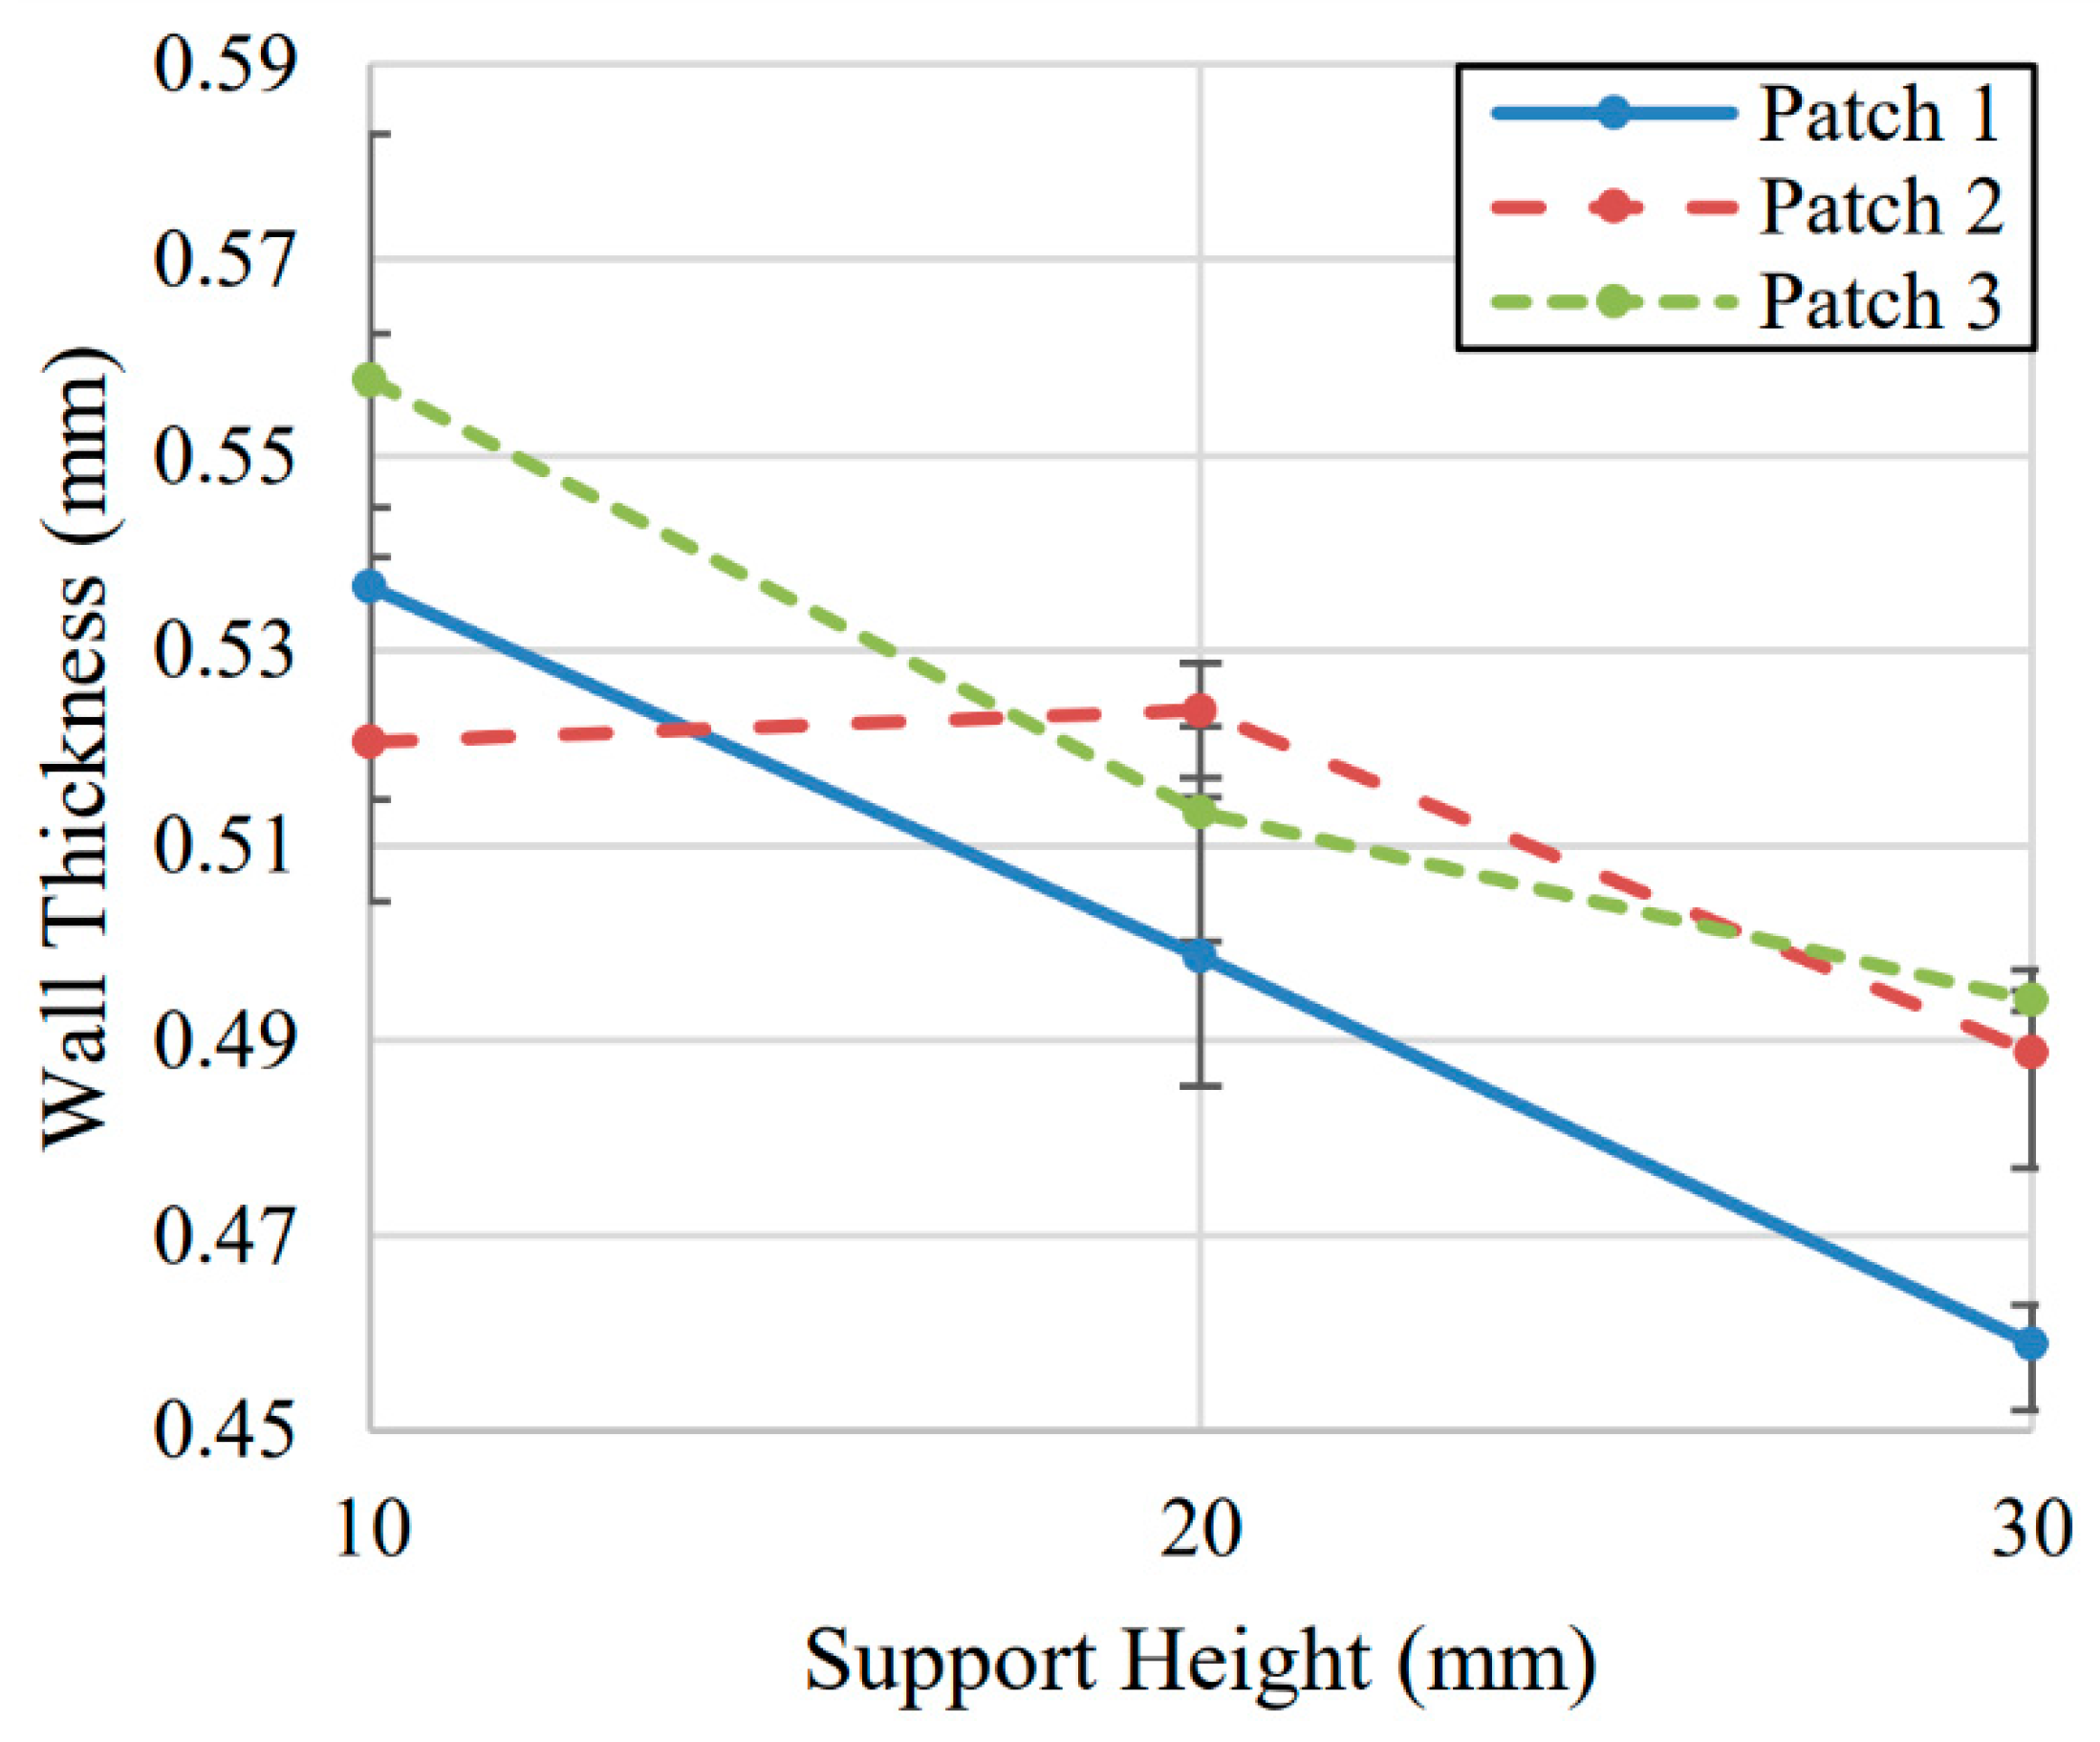
As with the other two parameters, height was evaluated at three different levels: H = 10 mm, 20 mm, and 30 mm. Three samples were evaluated for each height level. The support angle for all of the samples was fixed at α = 65°. The height parameter displayed the largest range of thicknesses of the three tested parameters. Results are again shown separated by position along the length of the wall. Although the samples with H = 10 mm support heights had the highest deflection, they performed noticeably better than the unsupported case for a relatively small print time and material addition.
The support height samples performed largely as expected when measured for geometric error. An exponential change in wall thickness was expected with changing support height when compared to a simple beam deflection equation. However, increasing support height resulted in an almost linear decrease in wall thickness as shown in Figure 11. Overall difference between the H = 10 mm support height and 30 mm support height was approximately 0.08 mm. The H = 10 mm support height samples showed an unexpected change in geometry between the H = 20 mm and H = 10 mm support heights where the geometry remained relatively consistent at the center of the thin wall but continued to increase in thickness as support height decreased at the both ends of the wall. This result was comparable to the geometry found on unsupported samples suggesting that at 10 mm support heights the ends of the wall are no longer stiffer than the center of the wall. This allows for the ends of the walls to deflect more than the center of the wall as was the case in the unsupported samples. Conversely, supported samples tended to deflect more in the center as the ends of the walls were stiffer.
3.7. Support Height Effect on Surface Roughness
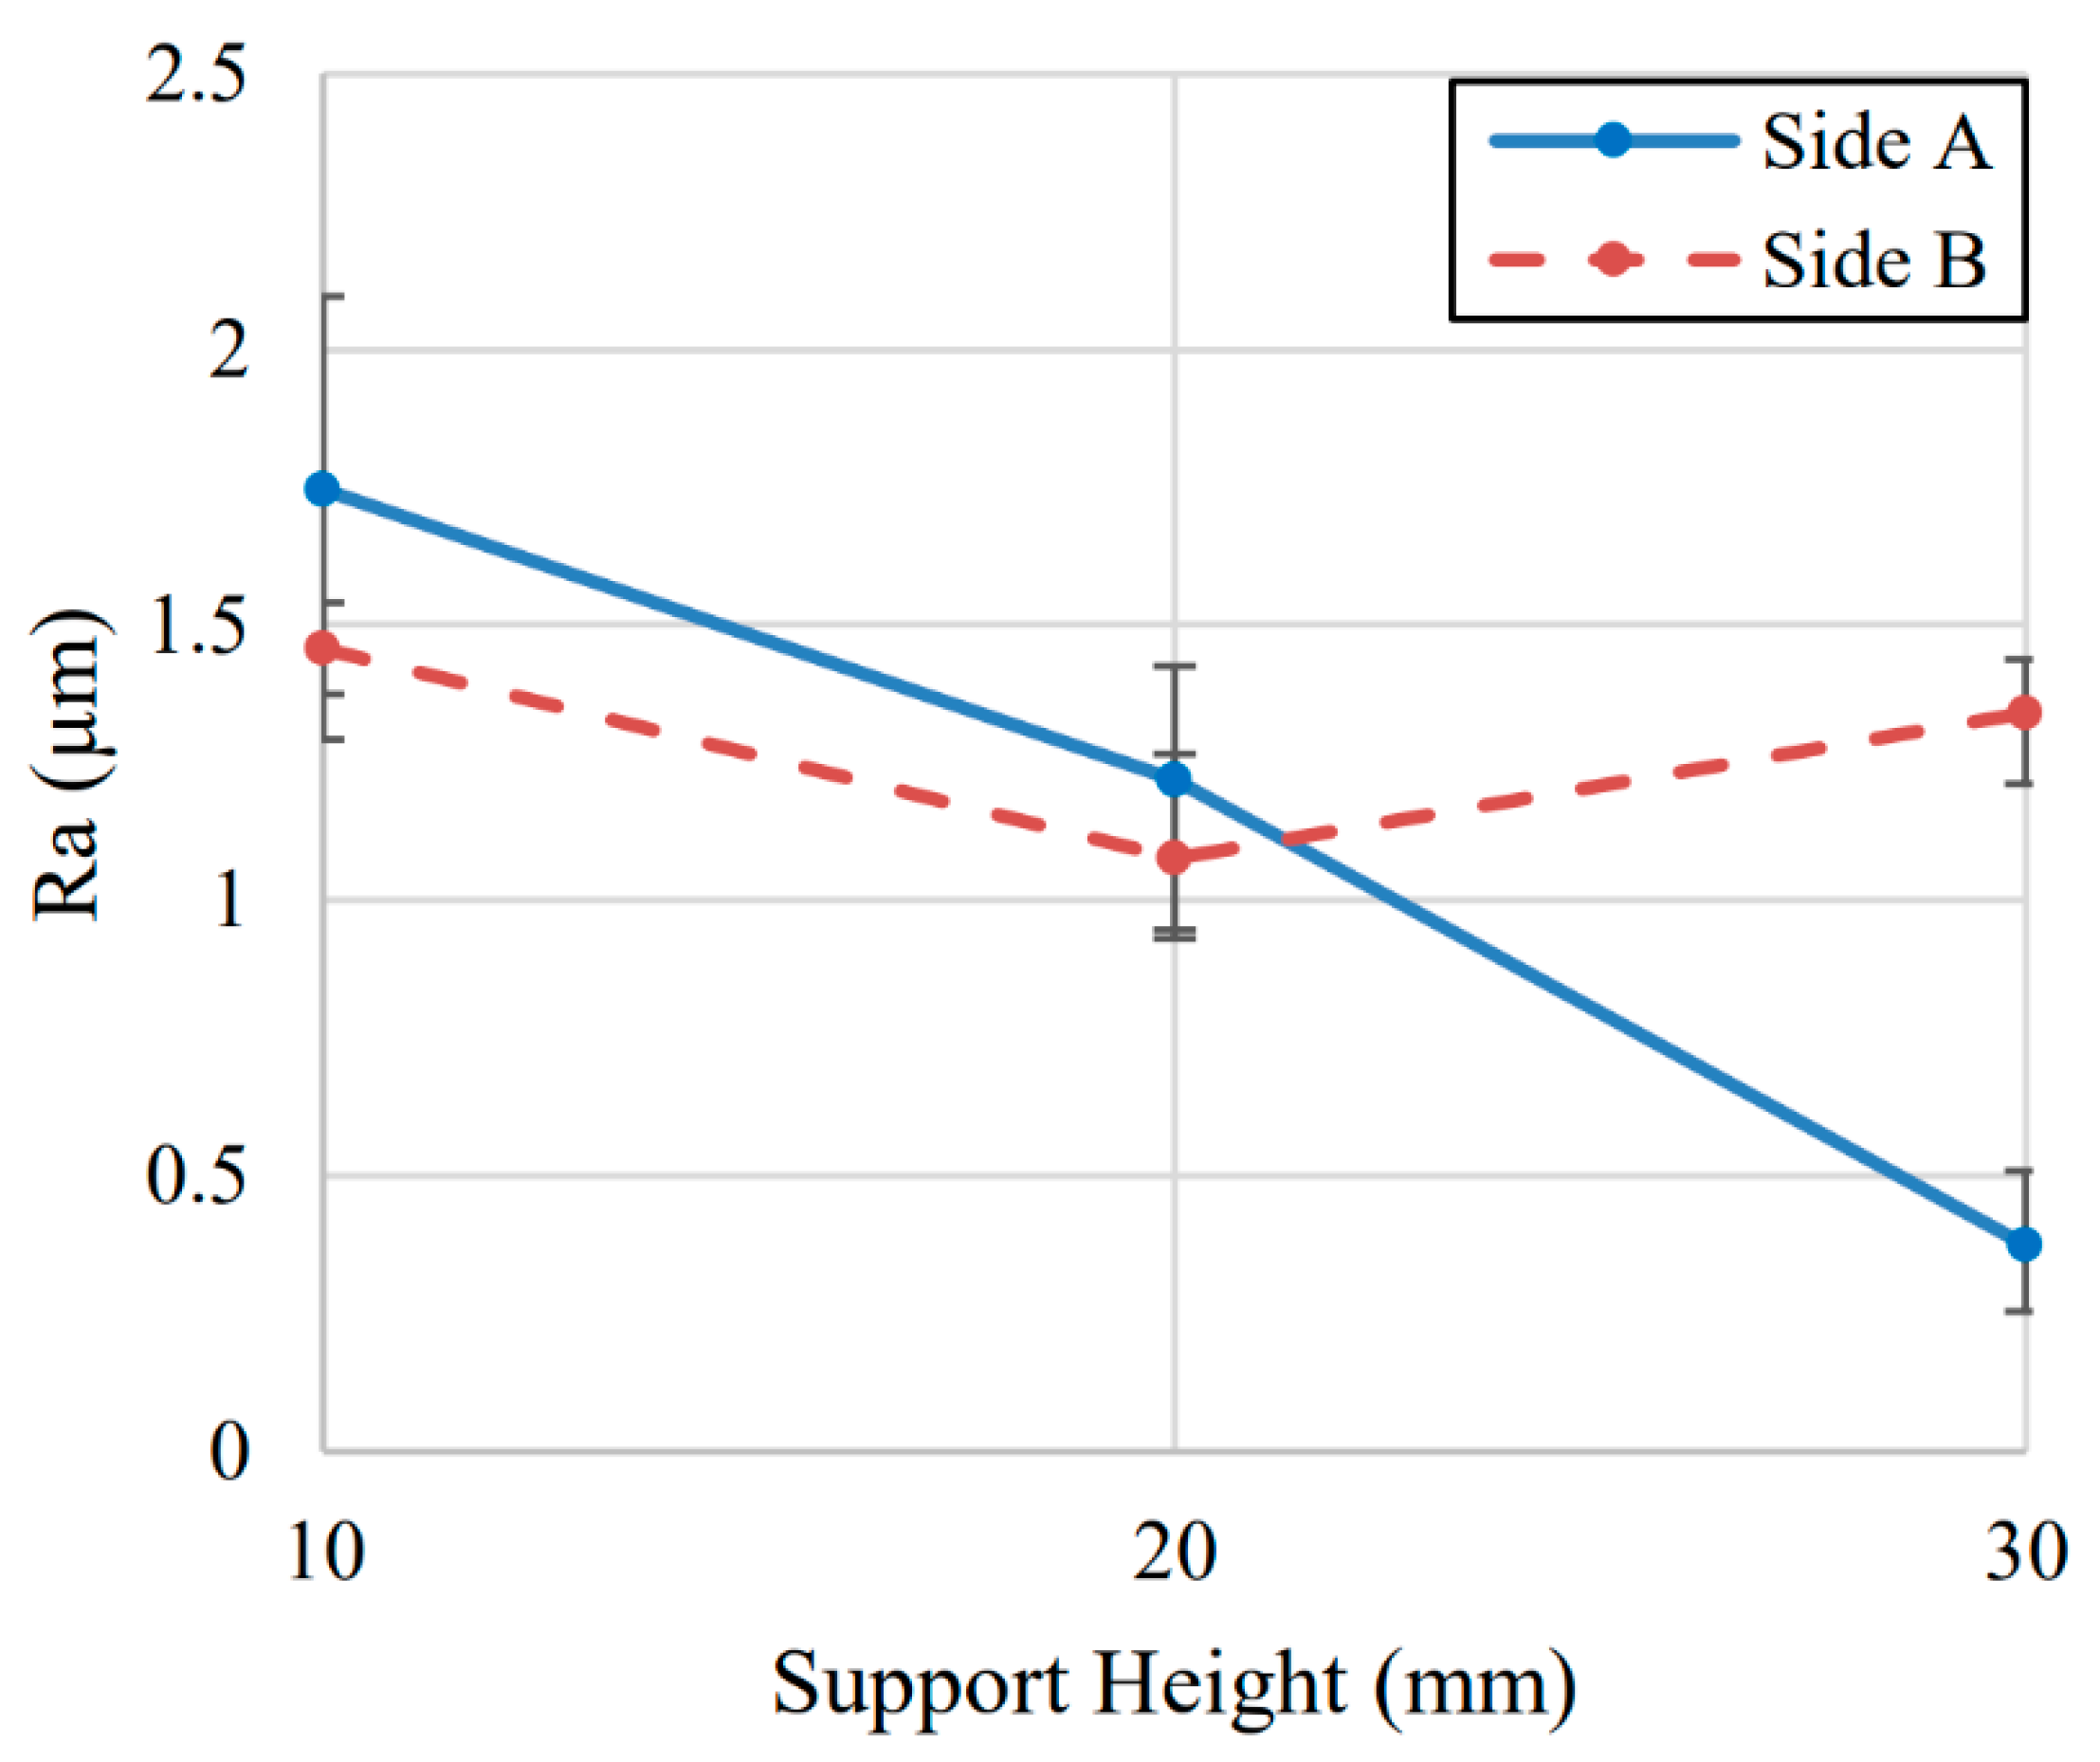
The surface roughness for Side A of machining when varying support height also decreased relatively linearly as support height increased. Figure 12 shows that despite the effective reduction in deflection that the H = 20 mm supports provided, the surface roughness for the H = 10 mm and H = 20 mm support heights were similar for both machining passes. At a roughness of around 1.5 µm this finish was on the high side of measured values. It was not until the support reached to the full height of the wall that Side A was measured to have a lower surface roughness than Side B. Side B surface roughness remained relatively consistent regardless of the support height chosen. The support height samples were also the only samples to produce potentially higher surface roughness on Side A than Side B. Although the difference between the two sides was within the margin of error for H = 10 mm. Since the location for measuring surface roughness was above the H = 20 mm height point, both sides of the wall lacked support material on their respective opposing sides which resulted in similar surface roughness results on both sides for the H = 10 mm and H = 20 mm samples.
Although the surface roughness appeared to decrease slightly between support heights of H = 10 mm and H = 20 mm, this was likely measurement error due to the influence of chatter and a larger sample size would likely show relatively constant values between these two support heights. Chatter was visually apparent on the surface of both of these samples. Based on these results, and the results from the other parameters tested, the surface roughness of Side B appears to be generally the same regardless of support shape and only depends on the proximity of the support itself.
3.8. Influence of Tool Rubbing
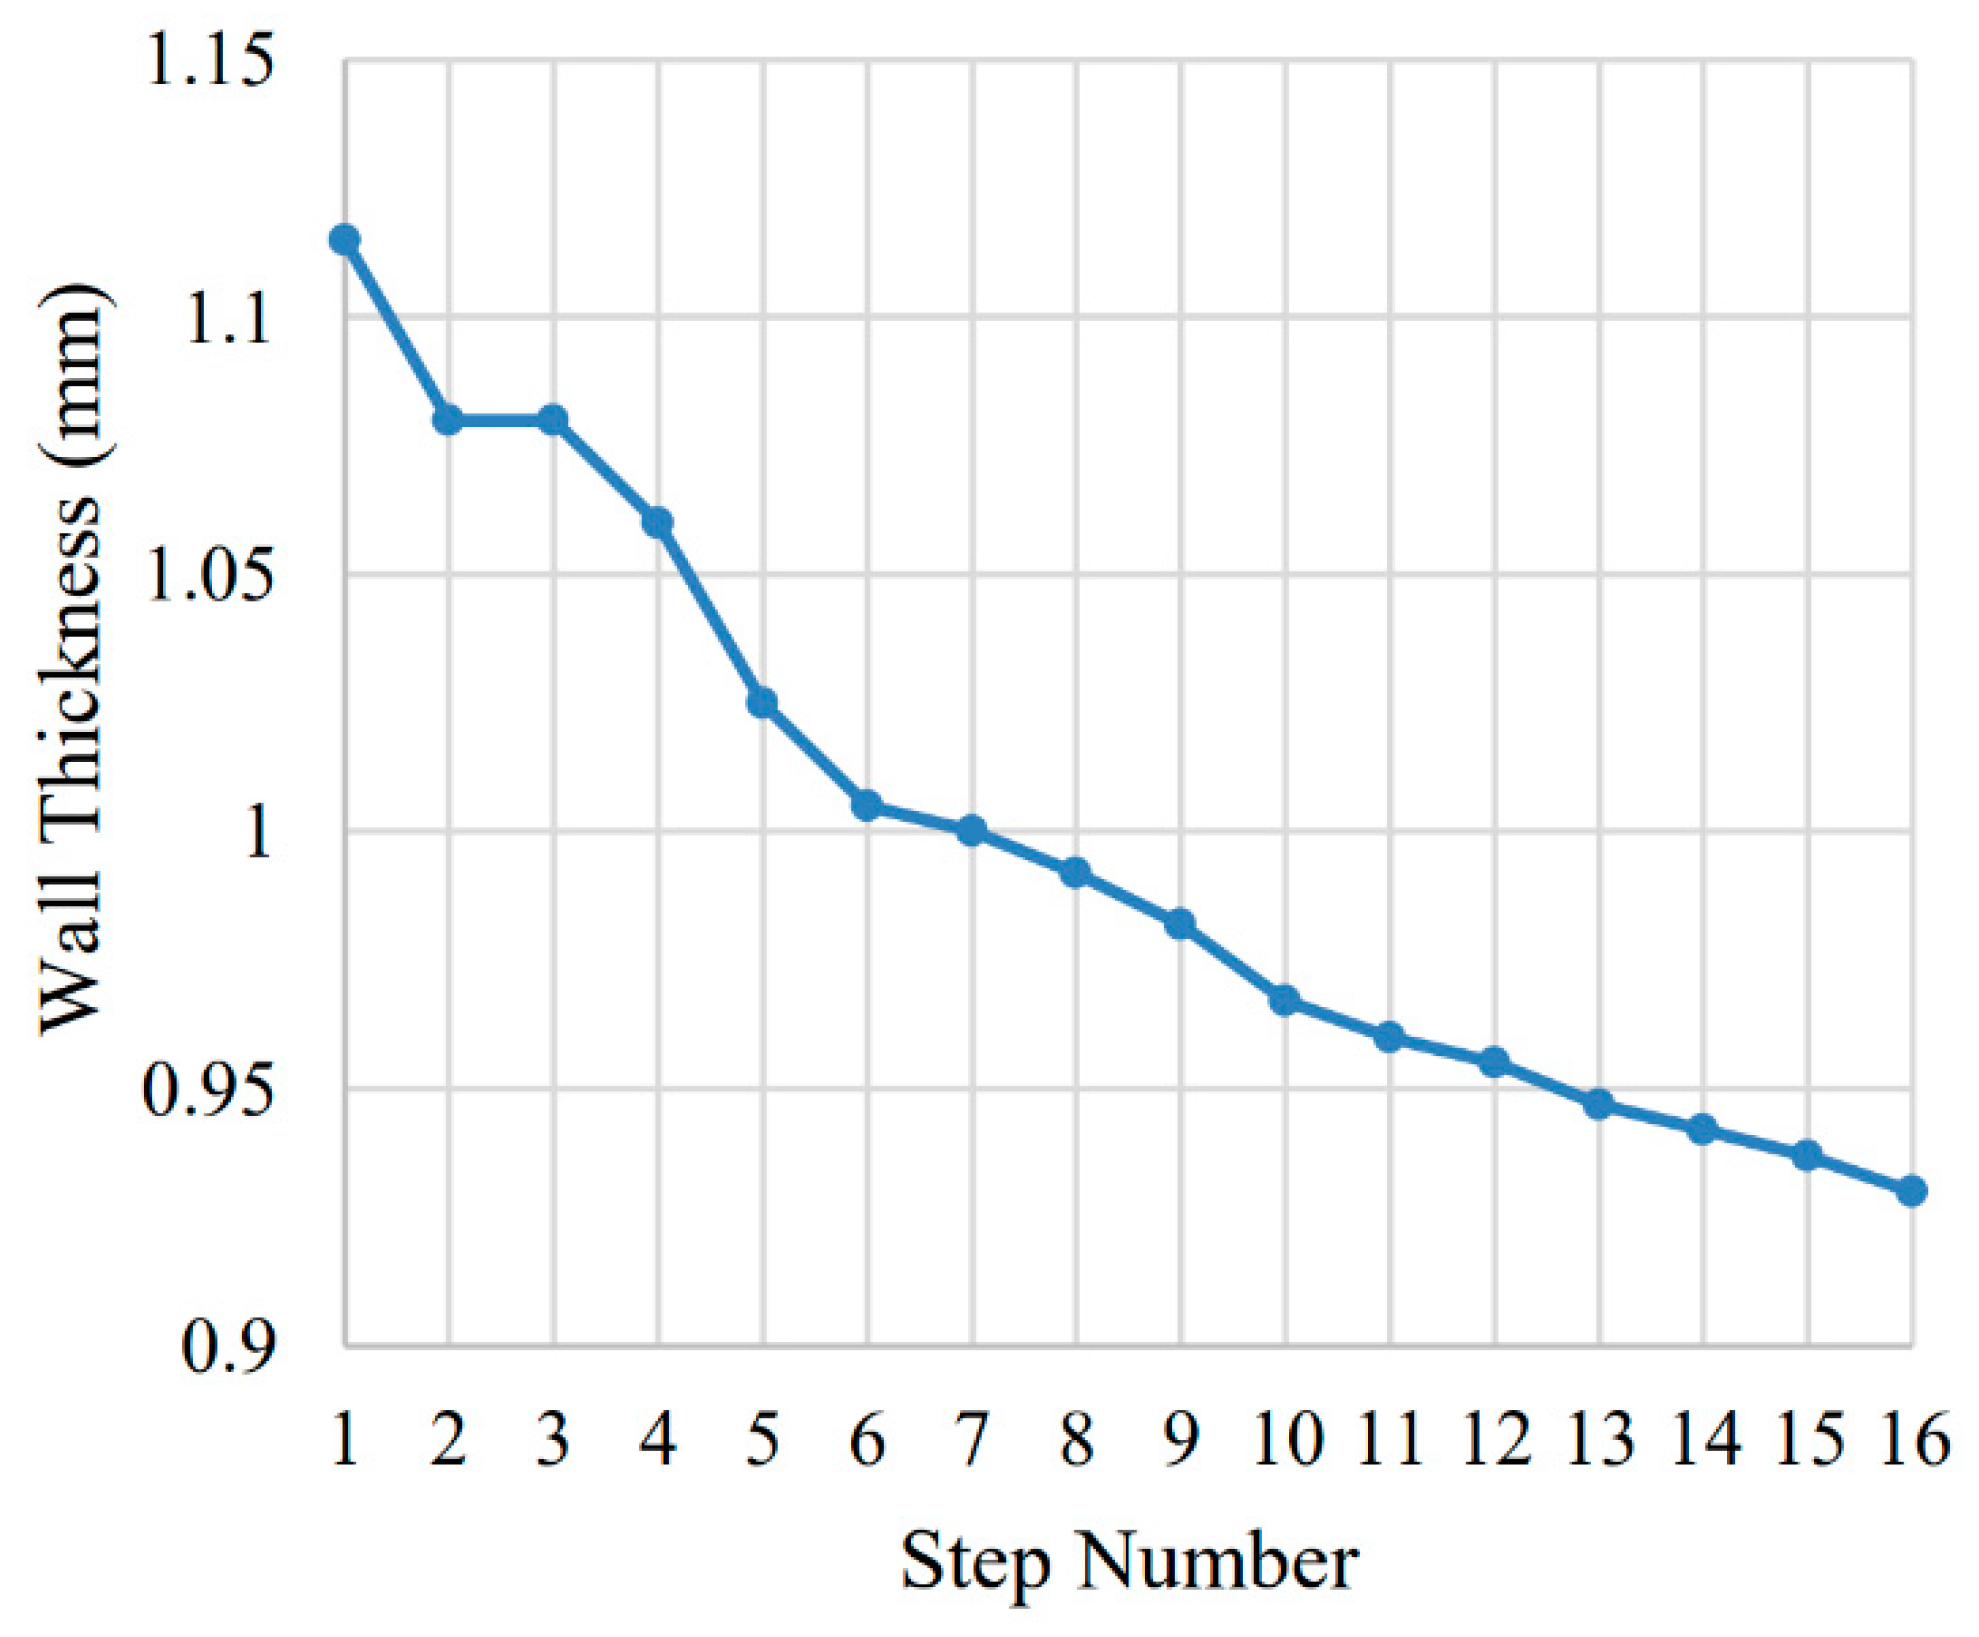
As mentioned previously, the use of a tool with a flute length that was longer than the axial depth of cut influenced the scale of the results presented. As machining forces caused deflection and therefore geometric error in the machined thin wall this resulted in geometry along the wall that would still remain within reach of the endmill along the designed toolpath. Subsequent step downs would continue to re-machine previous steps resulting in a final geometry that was thinner than would have resulted from a single isolated machining path for each Ad = 2 mm step down path. To quantify this effect, an experiment was performed on an unsupported this wall where a region at the top of the wall was measured using a micrometer after each step down. The results of this experiment are shown in Figure 13.
These results show slightly under 0.2 mm of material removed between the first and final pass for the thin wall. This effect was expected to be largest at the top of the thin wall and then decrease to a flat line at the bottom of the wall where negligible deflection was expected. As the results shown for the three changing parameters were all compared based on specific points near the top of the wall, the trends of the results were expected to remain the same with the final geometry scaling based on the number of passes used to machine the wall. The rubbing of the endmill on previous step downs was also likely the cause for some samples showing geometry that was smaller than the expected geometry. The deflection experienced by the thin wall acts in some degree to cause the thin wall to both move away from the endmill and move back towards the endmill which allows for additional material to be removed beyond the dimensions expected from the 0.5 mm designed tool path. Therefore, when producing thin walls, the effect of rubbing can considerably alter the final geometry of the thin wall and should be accounted for if the flute length of the end mill is longer than the axial depth of cut used for each step down.
3.9. Comparison of Support Parameter Efficiency
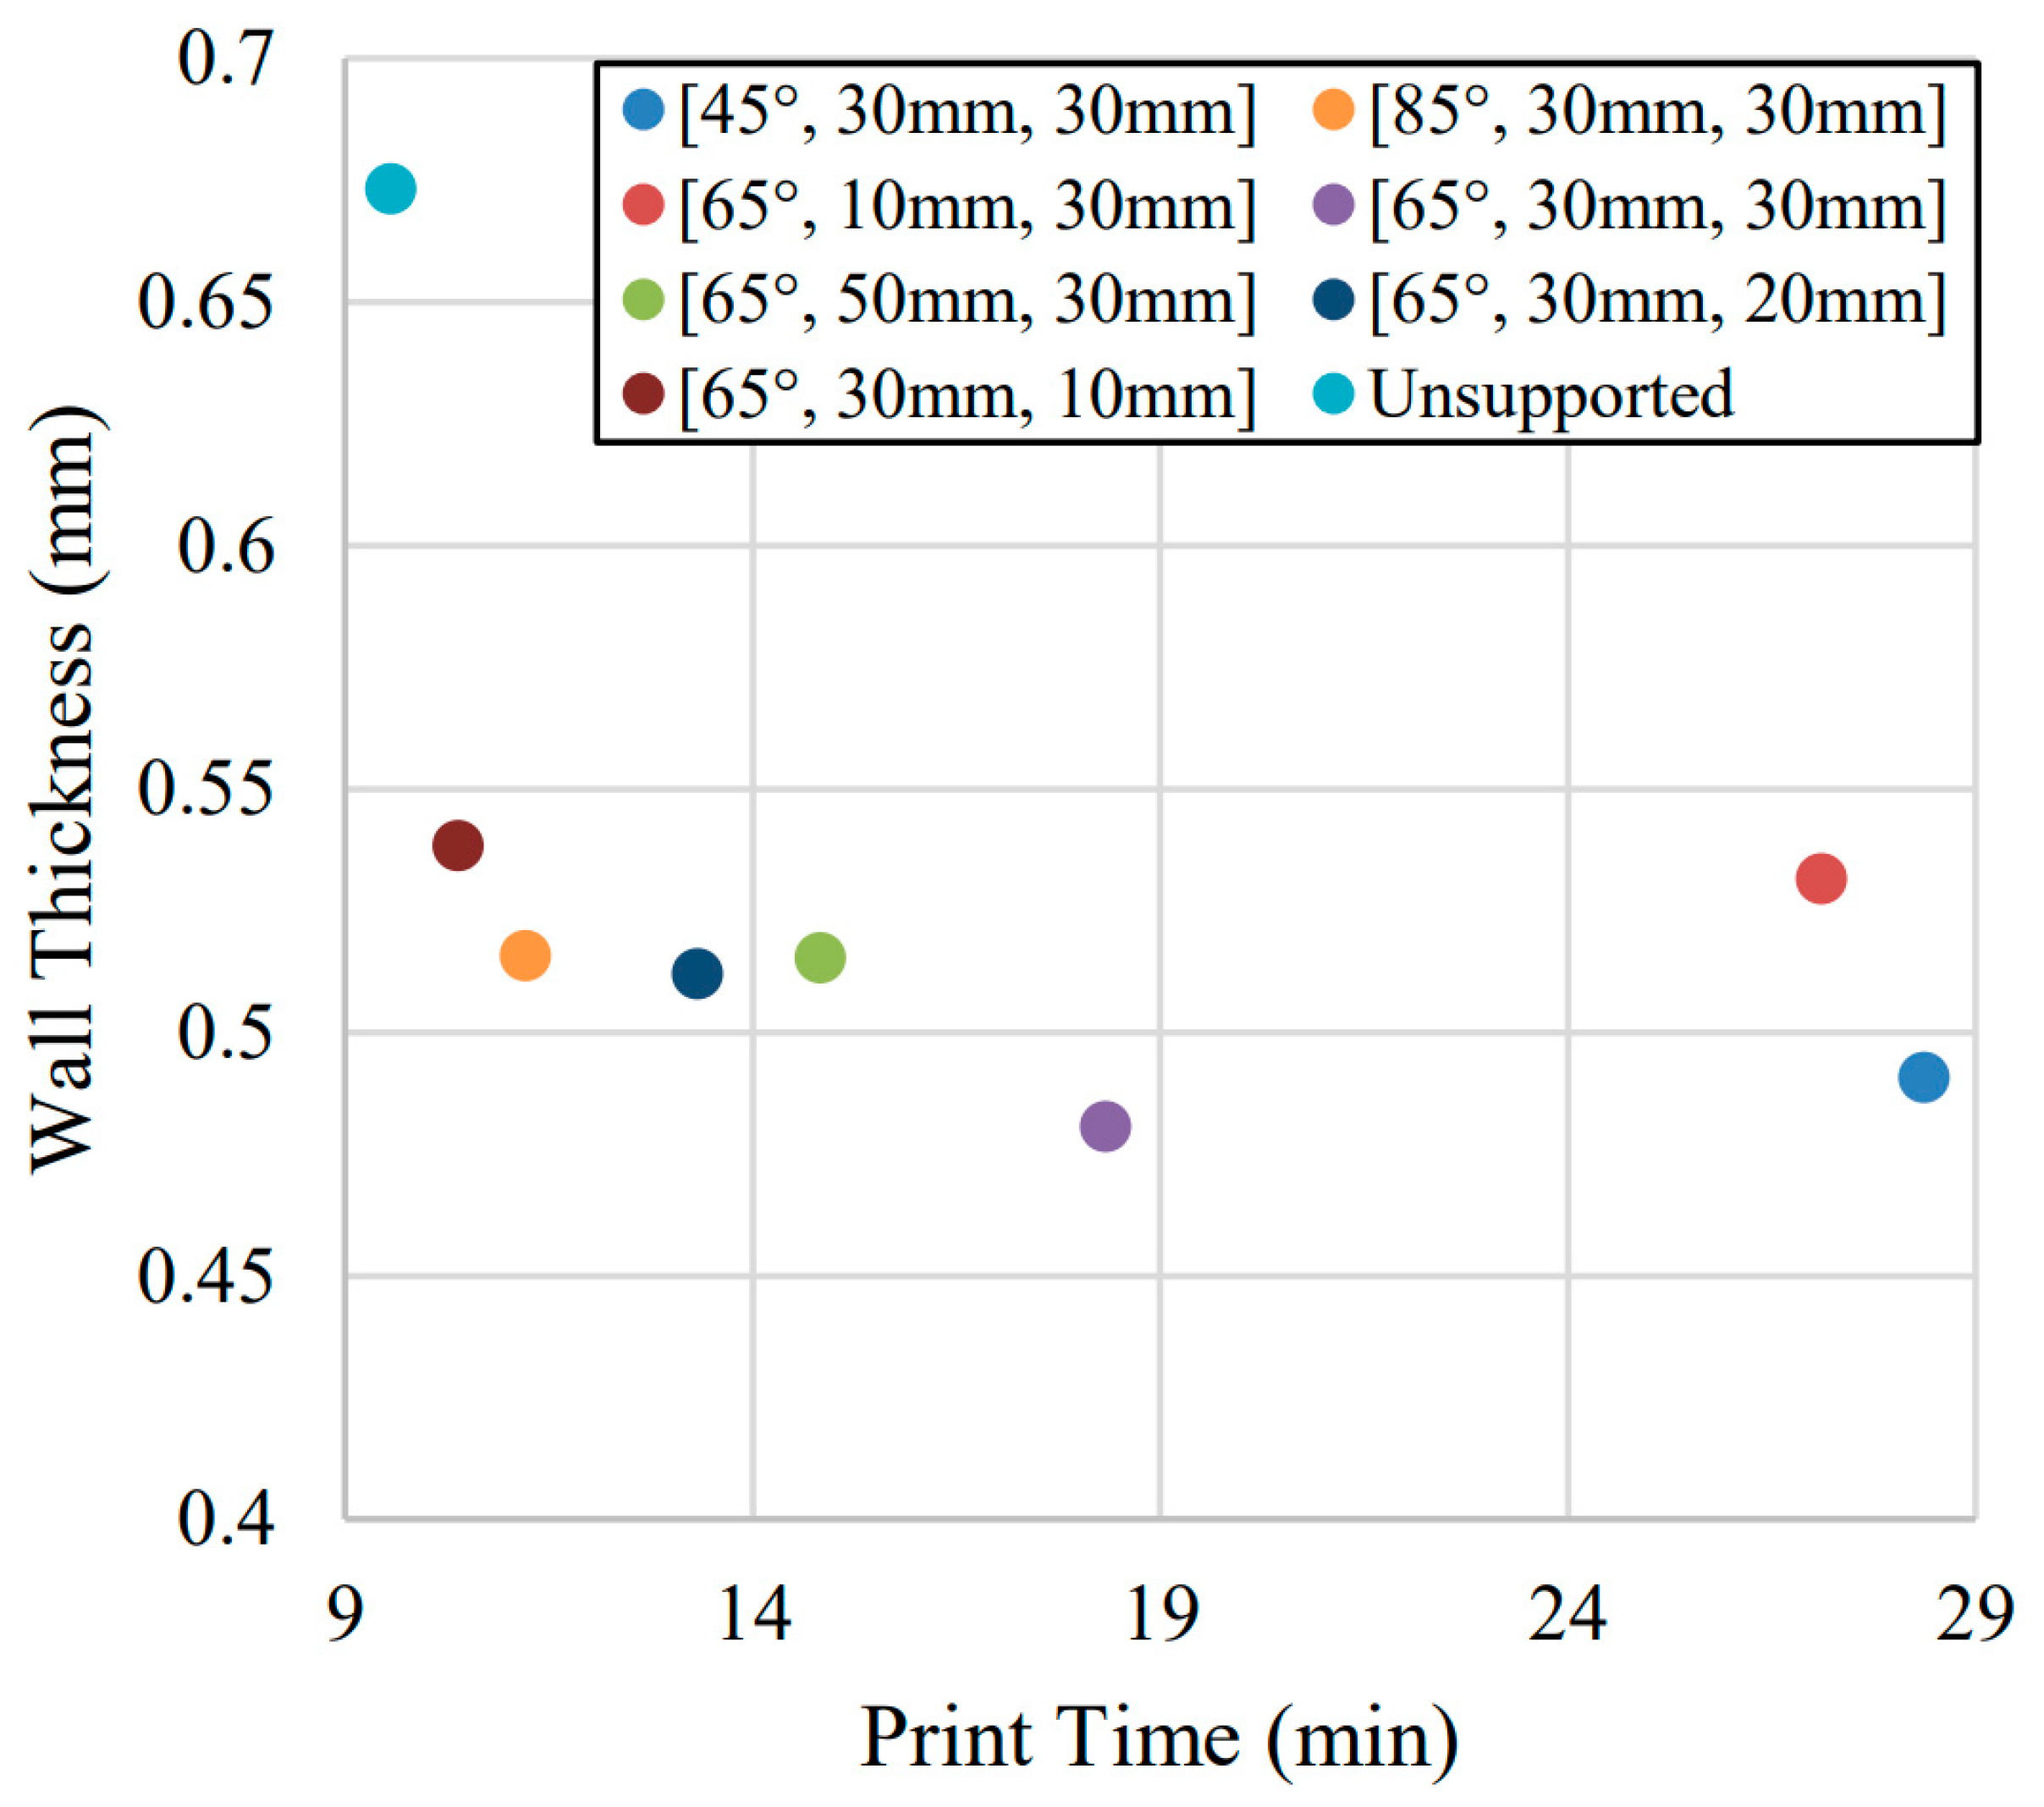
After observing the effect of different sacrificial support parameters on the final quality of thin walls, comparisons are made to see the relationship between support angle, height, and spacing relative to the print time required to produce each support scheme. To produce these results, the toolpaths used to produce each sacrificial support sample were summed and multiplied by the feed rate used during deposition to determine an approximate print time. This method neglects rapid moves of the machine between each bead. However, this was a negligible difference relative to the feed moves. As the same basic tool path was used for each support samples with only the length of beads changing, the rapid moves would also be similar for all tool paths with the exception of the unsupported case. Machining time was also not included in these parameters. The machining tool paths used in the parameter test experiments varied directly with the additive tool paths, and so did not change the comparison of time required relative to quality of thin walls produced. To compare the print time for samples with varying wall lengths compensations were applied to the S = 10 mm and S = 50 mm support spacing print times to make these support schemes comparable to the S = 30 mm wall samples. The S = 10 mm support spacing print time was increased to represent a S = 30 mm wall with 4 supports along each side of its length. The S = 50 mm sample was multiplied by 0.6 to represent that this support scheme would only require 60% of the sacrificial supports compared to a wall that had S = 30 mm support spacing. Figure 14 presents all the tested samples relative to their respective print times and the finished wall thickness. The plotted values are an average across the length of the wall as well as across the three samples produced for each support parameter.
This figure illustrates that there was relatively little improvement in final wall geometry after around 11 min, corresponding to the α = 85° sacrificial supports. The α = 65° and α = 45° supports both achieved a lower wall thickness but took 2–3 times longer to print. The S = 10 mm support spacing geometry results are represented the same as they were earlier, which means that the unintended influence of the short wall length causing an increasing in deflection was still present. In a scenario where the S = 10 mm support spacing was implemented on a thin wall with a longer length the wall deflection would be lower, and the value of the additional print time required would be better represented.
Next, Figure 15 show the comparison between print time required to produce a sample and the corresponding Ra value achieved after machining. Results are presented with the same print time compensations for the S = 10 mm and S = 50 mm support spacing samples. Values presented are an average of the three samples produced for each support parameter. For Side A surface roughness, support schemes that required longer print times generally enabled a lower surface roughness. Although the S = 10 mm support spacing and α = 45° support angle do not appear to provide a significant improvement of the α = 65° support angle for Side A machining. The H = 10 mm support height samples required the least time to produce but showed little improvement in surface roughness. The α = 45° support angle samples required the longest print time and showed the largest decrease in geometric error, but still did not improve the surface roughness on Side B. The S = 10 mm support spacing was the only sample that appears to improve surface finish in an appreciable amount. The α = 85° support angle and H = 20 mm support height samples appeared to provide a small decrease in surface roughness, but it is likely that this was due to the sample size and a larger sample size would show results similar to most other support schemes.
4. Discussion
This work presented a novel method of improving the geometric accuracy and surface finish of high aspect ratio thin walls produced using a hybrid manufacturing combination of blown powder direct energy deposition and CNC machining. Adding simple sacrificial support structures onto a thin wall feature at regular intervals can enable an effective reduction in the deflection experienced during finish machining. The work shown in this paper illustrates how the angle, spacing, and height of this support can be varied to meet the tolerance needs of a specific feature. The addition of any type of sacrificial support structure can quickly allow for a tighter tolerance thin wall, further increasing the stiffness of the support appears to have rapidly diminishing effects but can nonetheless be used to allow for even higher thin wall quality.
Adding the least substantial supports at each end of a thin wall with an angle of α = 85° enabled an average reduction in geometric error of 0.16 mm. Increasing the support angle to α = 45° increases this to 0.18 mm. However, the α = 45° supports required nearly 3 times the print time compared to the unsupported case. For surface finish the sacrificial supports provided between a reduction in surface roughness between 0.89 µm and 1.71 µm for α = 85° and α = 45° supports, respectively for Side A of these samples. For Side B of the wall the machined the surface roughness was reduced by around 1.47 µm but did not significantly vary between different support angles. Changing the distance between each support enabled a deflection reduction between 0.16 µm and 0.19 µm for S = 50 mm and S = 30 mm support spacing. Unintended influences on the experiment leave the S = 10 mm support spacing inconclusive. Changing support spacing was the only parameter tested that appeared to influence the surface roughness measured for Side B. At S = 10 mm, Side B surface roughness was reduced by 1.76 µm. Side A of the wall saw similar roughness reductions. The support height parameter saw roughly linear reductions in geometric error as the height increased. Geometric error was reduced between 0.13 mm and 0.19 mm. Surface roughness was reduced by a maximum of 1.626 µm with full support height for Side A, but again saw an average reduction in surface roughness of 1.52 µm on Side B with no major variation for changing support height. While these are small changes in surface roughness value, they do represent a significant improvement [30,31,32]. Comparisons of geometric error and surface roughness to print time were also presented. For deflection, only marginal gains were seen for support schemes that took longer than roughly 11 min to print which corresponded to the α = 85° sacrificial supports. Surface roughness on Side A of the samples did see significant reductions as print time increased up to the α = 65° supports which required 18.3 min to print. For Side B, there was no major differences between support schemes except for the 10 mm support spacing samples which had the second longest print time at 27.1 min.
5. Conclusions
Based on the results discussed above, taking advantage of hybrid manufacturing to add sacrificial support structures to thin-walled features does allow for improved geometric accuracy and surface roughness. Hybrid manufacturing allows for these support structures to easily be implemented and mostly maintain the material savings benefits of additive manufacturing. After designing the supports in, no extra steps are required for the machine operator to produce the thin wall. The ideal support structure parameters will vary depending on the exact geometry of a part and the tolerances that need to be met, but significant improvements in geometric accuracy can be realized with only minor increases in print time. The surface roughness results showed improvement but were asymmetric which would likely be undesirable on a production part. This work did not focus on machining parameters and additional work in this area might improve surface roughness results. Use of tooling that would avoid rubbing on subsequent layers might allow for clearer results as well. Further work is needed to determine scalability of these supports in larger and more complex shapes, but is expected to provide similar conclusions.
Author Contributions
Conceptualization, D.V. and C.S.; Methodology, D.V. and C.S.; Validation, D.V.; Formal Analysis, D.V.; Investigation, D.V.; Resources, D.V., C.S. and T.K.; Data Curation, D.V. and C.S.; Writing—Original Draft Preparation, D.V.; Writing—Review and Editing, D.V., C.S. and T.K.; Visualization, D.V. and C.S.; Supervision, C.S., T.K. and A.N.; Project Administration, D.V., C.S., T.K. and A.N.; Funding Acquisition, C.S., T.K. and A.N. All authors have read and agreed to the published version of the manuscript.
Funding
This work was supported in part by the Department of Energy [DE-EE0008303]; and the National Science Foundation [CMMI-1825640].
Data Availability Statement
Not applicable.
Conflicts of Interest
The authors declare no conflict of interest.
References
- Tang, A.; Liu, Z. Three-Dimensional Stability Lobe and Maximum Material Removal Rate in End Milling of Thin-Walled Plate. Int. J. Adv. Manuf. Technol. 2009, 43, 33–39. [Google Scholar] [CrossRef]
- Wu, Q.; Li, D.-P.; Zhang, Y.-D. Detecting Milling Deformation in 7075 Aluminum Alloy Aeronautical Monolithic Components Using the Quasi-Symmetric Machining Method. Metals 2016, 6, 80. [Google Scholar] [CrossRef]
- Izamshah, R.; Yuhazri, M.Y.; Hadzley, M.; Md Ali, M.A.; Subramonian, S. Effects of End Mill Helix Angle on Accuracy for Machining Thin-Rib Aerospace Component. Appl. Mech. Mater. 2013, 315, 773–777. [Google Scholar] [CrossRef]
- Bravo, U.; Altuzarra, O.; López de Lacalle, L.N.; Sánchez, J.A.; Campa, F.J. Stability Limits of Milling Considering the Flexibility of the Workpiece and the Machine. Int. J. Mach. Tools Manuf. 2005, 45, 1669–1680. [Google Scholar] [CrossRef]
- Wu, G.; Li, G.; Pan, W.; Raja, I.; Wang, X.; Ding, S. A State-of-Art Review on Chatter and Geometric Errors in Thin-Wall Machining Processes. J. Manuf. Process. 2021, 68, 454–480. [Google Scholar] [CrossRef]
- Tlusty, J.; Smith, S.; Winfough, W.R. Techniques for the Use of Long Slender End Mills in High-Speed Milling. CIRP Ann. 1996, 45, 393–396. [Google Scholar] [CrossRef]
- Smith, S.; Dvorak, D. Tool Path Strategies for High Speed Milling Aluminum Workpieces with Thin Webs. Mechatronics 1998, 8, 291–300. [Google Scholar] [CrossRef]
- Tlusty, J. High-Speed Machining. CIRP Ann. 1993, 42, 733–738. [Google Scholar] [CrossRef]
- Herranz, S.; Campa, F.; Lacalle, L.; Rivero, A.; Lamikiz, A.; Ukar, E.; Sanchez, J.; Bravo, U. The Milling of Airframe Components with Low Rigidity: A General Approach to Avoid Static and Dynamic Problems. Proc. Inst. Mech. Eng. Part B J. Eng. Manuf. 2005, 219, 789–802. [Google Scholar] [CrossRef]
- Zawada-Michałowska, M. High-Performance Milling Techniques of Thin-Walled Elements. Adv. Sci. Technol. Res. J. 2022, 16, 98–110. [Google Scholar] [CrossRef]
- Wang, J.; Ibaraki, S.; Matsubara, A. A Cutting Sequence Optimization Algorithm to Reduce the Workpiece Deformation in Thin-Wall Machining. Precis. Eng. 2017, 50, 506–514. [Google Scholar] [CrossRef]
- Koike, Y.; Matsubara, A.; Yamaji, I. Optimization of Cutting Path for Minimizing Workpiece Displacement at the Cutting Point: Changing the Material Removal Process, Feed Direction, and Tool Orientation. Procedia CIRP 2013, 5, 31–36. [Google Scholar] [CrossRef] [Green Version]
- Ratchev, S.; Liu, S.; Huang, W.; Becker, A.A. Milling Error Prediction and Compensation in Machining of Low-Rigidity Parts. Int. J. Mach. Tools Manuf. 2004, 44, 1629–1641. [Google Scholar] [CrossRef]
- Ratchev, S.; Liu, S.; Becker, A.A. Error Compensation Strategy in Milling Flexible Thin-Wall Parts. J. Mater. Process. Technol. 2005, 162, 673–681. [Google Scholar] [CrossRef]
- Ge, G.; Du, Z.; Feng, X.; Yang, J. An Integrated Error Compensation Method Based on On-Machine Measurement for Thin Web Parts Machining. Precis. Eng. 2020, 63, 206–213. [Google Scholar] [CrossRef]
- Budak, E.; Tunc, T.; Alan, S.; Özgüven, H. Prediction of Workpiece Dynamics and Its Effects on Chatter Stability in Milling. CIRP Ann. Manuf. Technol. 2012, 61, 339–342. [Google Scholar] [CrossRef]
- Smith, S.; Wilhelm, R.; Dutterer, B.; Cherukuri, H.; Goel, G. Sacrificial Structure Preforms for Thin Part Machining. CIRP Ann. 2012, 61, 379–382. [Google Scholar] [CrossRef] [Green Version]
- Zeng, S.; Wan, X.; Li, W.; Yin, Z.; Xiong, Y. A Novel Approach to Fixture Design on Suppressing Machining Vibration of Flexible Workpiece. Int. J. Mach. Tools Manuf. 2012, 58, 29–43. [Google Scholar] [CrossRef]
- Kolluru, K.; Axinte, D.; Becker, A. A Solution for Minimising Vibrations in Milling of Thin Walled Casings by Applying Dampers to Workpiece Surface. CIRP Ann. 2013, 62, 415–418. [Google Scholar] [CrossRef] [Green Version]
- Kolluru, K.; Axinte, D. Novel Ancillary Device for Minimising Machining Vibrations in Thin Wall Assemblies. Int. J. Mach. Tools Manuf. 2014, 85, 79–86. [Google Scholar] [CrossRef]
- Rigidax Tooling & Fixturing Wax. Available online: https://machinablewax.com/rigidax-tooling-fixturing-wax/ (accessed on 9 October 2020).
- Jiang, X.; Zhao, G.; Lu, W. Vibration Suppression of Complex Thin-Walled Workpiece Based on Magnetorheological Fixture. Int. J. Adv. Manuf. Technol. 2020, 106, 1043–1055. [Google Scholar] [CrossRef]
- Alexander, I.; Vladimir, G.; Petr, P.; Mihail, K.; Yuriy, I.; Andrey, V. Machining of Thin-Walled Parts Produced by Additive Manufacturing Technologies. Procedia CIRP 2016, 41, 1023–1026. [Google Scholar] [CrossRef] [Green Version]
- Ślusarczyk, Ł. Analysis of Deformations of Thin Wall Parts in Machining. Mater. Sci. 2015, 9662, 96624L. [Google Scholar] [CrossRef]
- Bolar, G.; Mekonen, M.; Das, A.; Joshi, S.N. Experimental Investigation on Surface Quality and Dimensional Accuracy during Curvilinear Thin-Wall Machining. Mater. Today Proc. 2018, 5, 6461–6469. [Google Scholar] [CrossRef]
- Bolar, G.; Joshi, S. An Experimental Investigation on Productivity and Product Quality during Thin-Wall Machining of Aluminum Alloy 2024-T351. In Advances in Forming, Machining and Automation; Springer: Berlin/Heidelberg, Germany, 2019; pp. 385–393. ISBN 978-981-329-416-5. [Google Scholar]
- Seguy, S.; Dessein, G.; Arnaud, L. Surface Roughness Variation of Thin Wall Milling, Related to Modal Interactions. Int. J. Mach. Tools Manuf. 2008, 48, 261–274. [Google Scholar] [CrossRef] [Green Version]
- Lee, L.C.; Lee, K.S.; Gan, C.S. On the Correlation between Dynamic Cutting Force and Tool Wear. Int. J. Mach. Tools Manuf. 1989, 29, 295–303. [Google Scholar] [CrossRef]
- Xu, C.; Dou, J.; Chai, Y.; Li, H.; Shi, Z.; Xu, J. The Relationships between Cutting Parameters, Tool Wear, Cutting Force and Vibration. Adv. Mech. Eng. 2018, 10, 1687814017750434. [Google Scholar] [CrossRef]
- Cheng, D.-J.; Xu, F.; Xu, S.-H.; Zhang, C.-Y.; Zhang, S.-W.; Kim, S.-J. Minimization of Surface Roughness and Machining Deformation in Milling of Al Alloy Thin-Walled Parts. Int. J. Precis. Eng. Manuf. 2020, 21, 1597–1613. [Google Scholar] [CrossRef]
- Ramanaiah, B.V.; Manikanta, B.; Ravi Sankar, M.; Malhotra, M.; Gajrani, K. Experimental Study of Deflection and Surface Roughness in Thin Wall Machining of Aluminum Alloy. Mater. Today Proc. 2018, 5, 3745–3754. [Google Scholar] [CrossRef]
- de Oliveira, E.L.; de Souza, A.F.; Diniz, A.E. Evaluating the Influences of the Cutting Parameters on the Surface Roughness and Form Errors in 4-Axis Milling of Thin-Walled Free-Form Parts of AISI H13 Steel. J Braz. Soc. Mech. Sci. Eng. 2018, 40, 334. [Google Scholar] [CrossRef]
Figure 1.
Illustration of three parameters to be tested in the experiment with H representing the height of the support, S representing the distance between each support, T is the fixed thickness of the wall, and α representing the angle of the support measured from the horizontal.
Figure 1.
Illustration of three parameters to be tested in the experiment with H representing the height of the support, S representing the distance between each support, T is the fixed thickness of the wall, and α representing the angle of the support measured from the horizontal.

Figure 2.
Machining process for thin walls: (a) sections of supports are removed. (b) section of wall is machined. (c) sections of supports on opposing side of wall are removed. (d) section of wall is machined on opposing side of wall.
Figure 2.
Machining process for thin walls: (a) sections of supports are removed. (b) section of wall is machined. (c) sections of supports on opposing side of wall are removed. (d) section of wall is machined on opposing side of wall.

Figure 3.
Supported wall [α = 65°, H = 30 mm, S = 50 mm] showing: (a) as printed. (b) halfway through machining. (c) after machining.
Figure 3.
Supported wall [α = 65°, H = 30 mm, S = 50 mm] showing: (a) as printed. (b) halfway through machining. (c) after machining.

Figure 4.
Drawing showing CMM patch scan locations 1 through 6 for measuring thickness, and datum locations for part orientation.
Figure 4.
Drawing showing CMM patch scan locations 1 through 6 for measuring thickness, and datum locations for part orientation.

Figure 5.
Unsupported thin wall geometric comparison to α = 65° supported thin wall at CMM patch locations 1, 2, and 3.
Figure 5.
Unsupported thin wall geometric comparison to α = 65° supported thin wall at CMM patch locations 1, 2, and 3.

Figure 6.
Unsupported thin wall roughness comparison to α = 65° support thin wall measured at a height of 27 mm and centered along length of wall, separated by Side A and Side B of each sample.
Figure 6.
Unsupported thin wall roughness comparison to α = 65° support thin wall measured at a height of 27 mm and centered along length of wall, separated by Side A and Side B of each sample.

Figure 7.
Influence of support angle (α) on wall thickness measured at CMM patch location 1, 2, and 3.
Figure 7.
Influence of support angle (α) on wall thickness measured at CMM patch location 1, 2, and 3.

Figure 8.
Effect of support angle (α) on surface roughness measured at a height of 27 mm and centered along length of thin wall, separated by Side A and Side B of each sample.
Figure 8.
Effect of support angle (α) on surface roughness measured at a height of 27 mm and centered along length of thin wall, separated by Side A and Side B of each sample.

Figure 9.
Influence of support spacing (S) on wall thickness measured at CMM patch locations 1, 2, and 3.
Figure 9.
Influence of support spacing (S) on wall thickness measured at CMM patch locations 1, 2, and 3.

Figure 10.
Effect of support spacing (S) on surface roughness measured at a height of 27 mm and centered along length of thin wall, separated by Side A and Side B of each sample.
Figure 10.
Effect of support spacing (S) on surface roughness measured at a height of 27 mm and centered along length of thin wall, separated by Side A and Side B of each sample.

Figure 11.
Influence of support height (H) on wall thickness measured at CMM patch locations 1, 2, and 3.
Figure 11.
Influence of support height (H) on wall thickness measured at CMM patch locations 1, 2, and 3.

Figure 12.
Effect of support height (H) on surface roughness measured at a height of 27 mm and centered along length of thin wall, separated by Side A and Side B of each sample.
Figure 12.
Effect of support height (H) on surface roughness measured at a height of 27 mm and centered along length of thin wall, separated by Side A and Side B of each sample.

Figure 13.
Change in wall thickness measured after each Ad = 2 mm step-down machining pass at a single point located at the top of an unsupported thin wall.
Figure 13.
Change in wall thickness measured after each Ad = 2 mm step-down machining pass at a single point located at the top of an unsupported thin wall.

Figure 14.
Comparison of average final geometry relative to print time for all parameters [α, S, H] representing support angle, support spacing, and support height, respectively.
Figure 14.
Comparison of average final geometry relative to print time for all parameters [α, S, H] representing support angle, support spacing, and support height, respectively.

Figure 15.
Comparison of average surface roughness on Side A and B relative to print time for all parameters [α, S, H] representing support angle, support spacing, and support height, respectively.
Figure 15.
Comparison of average surface roughness on Side A and B relative to print time for all parameters [α, S, H] representing support angle, support spacing, and support height, respectively.


Table 1.
Experimental conditions tested for sacrificial support structures.
| Condition | Unsupported | Sacrificial Supports | ||||||
|---|---|---|---|---|---|---|---|---|
| Angle (α) (°) | - | 45 | 65 | 85 | 65 | 65 | 65 | 65 |
| Spacing (S) (mm) | 30 | 30 | 30 | 30 | 10 | 50 | 30 | 30 |
| Height (H) (mm) | - | 30 | 30 | 30 | 30 | 30 | 10 | 20 |
| Thickness (T) (mm) | 0.5 | 0.5 | 0.5 | 0.5 | 0.5 | 0.5 | 0.5 | 0.5 |
Table 2.
Additive powder chemical composition.
| C | Cr | Cu | Fe | Mn | Mo | N | Ni | O | P | S | Si | |
|---|---|---|---|---|---|---|---|---|---|---|---|---|
| Min wt% | 0 | 17.5 | 0 | Bal | 0 | 2.25 | 0 | 12.5 | 0 | 0 | 0 | 0 |
| Max wt% | 0.03 | 18.0 | 0.5 | Bal | 2 | 2.5 | 0.1 | 13.0 | 0.1 | 0.025 | 0.01 | 0.75 |
Table 3.
Machining parameters for thin wall samples.
| Tool Dia. (mm) | Flute Count | Speed (s) (RPM) | Feed (f) (mm/min) | Axial Depth of Cut (Ad) (mm) | Radial Depth of Cut (Rd) (mm) |
|---|---|---|---|---|---|
| 12.7 | 5 | 1720 | 200 | 2 | 0.475 |
Publisher’s Note: MDPI stays neutral with regard to jurisdictional claims in published maps and institutional affiliations. |
© 2022 by the authors. Licensee MDPI, Basel, Switzerland. This article is an open access article distributed under the terms and conditions of the Creative Commons Attribution (CC BY) license (https://creativecommons.org/licenses/by/4.0/).
Share and Cite
MDPI and ACS Style
Vaughan, D.; Saldana, C.; Kurfess, T.; Nycz, A. Implementation of Sacrificial Support Structures for Hybrid Manufacturing of Thin Walls. J. Manuf. Mater. Process. 2022, 6, 70. https://doi.org/10.3390/jmmp6040070
AMA Style
Vaughan D, Saldana C, Kurfess T, Nycz A. Implementation of Sacrificial Support Structures for Hybrid Manufacturing of Thin Walls. Journal of Manufacturing and Materials Processing. 2022; 6(4):70. https://doi.org/10.3390/jmmp6040070
Chicago/Turabian StyleVaughan, Derek, Christopher Saldana, Thomas Kurfess, and Andrzej Nycz. 2022. "Implementation of Sacrificial Support Structures for Hybrid Manufacturing of Thin Walls" Journal of Manufacturing and Materials Processing 6, no. 4: 70. https://doi.org/10.3390/jmmp6040070