
What’s in My Toolkit? A Review of Technologies for Assessing Changes in Habitats Caused by Marine Energy Development


Abstract
:1. Introduction
2. Materials and Methods
2.1. Literature Review
2.2. Information Synthesis
3. Results
4. Discussion
5. Conclusions
Author Contributions
Funding
Institutional Review Board Statement
Informed Consent Statement
Data Availability Statement
Acknowledgments
Conflicts of Interest
Appendix A
- AECOM Canada Ltd. (2009). Environmental assessment registration document—Fundy Tidal Energy Demonstration Project—Volume I: environmental assessment. Halifax, NS, Canada: p 247.
- AECOM Canada Ltd. (2010). Fundy Ocean Research Centre for Energy (FORCE) environmental assessment addendum to the report: environmental assessment registration document—Fundy Tidal Energy Demonstration Project, Volumes 1 and 2 dated 10 June 2009. Halifax, NS, Canada: p. 52.
- Ajemian, M. J., J. J. Wetz, B. Shipley-Lozano and G. W. Stunz (2015). Rapid assessment of fish communities on submerged oil and gas platform reefs using remotely operated vehicles. Fisheries Research, 167: 143–155.
- Alcorn, R., E. Amon, S. Armstrong, B. Batten, D. Bull, B. Cahill, E. Cotilla-Sanchez, G. Dalton, D. Hellin, S. Henkel, A. Husky, J. Klure, B. Langley, B. Polagye, J. Rea, M. Sanders, A. Stewart, G. Sutton and J. Weber (2017). The Pacific Marine Energy Center South Energy Test Site (PMEC-SETS) final report: final site selection, preliminary facility design, and cost & schedule estimates. Pacific Marine Energy Center (PMEC): p. 604.
- Andaloro, F., M. Ferraro, E. Mostarda, T. Romeo and P. Consoli (2013). Assessing the suitability of a remotely operated vehicle (ROV) to study the fish community associated with offshore gas platforms in the Ionian Sea: a comparative analysis with underwater visual censuses (UVCs). Helgoland Marine Research, 67(2): 241–250.
- Andersen, K., A. Chapman, N. Hareide, A. Folkestad, E. Sparrevik and O. Langhamer (2009). Environmental monitoring at the Maren Wave Power Test Site off the Island of Runde, Western Norway: planning and design. 8th European Wave and Tidal Energy Conference, Uppsala, Sweden.
- Aquafact International Services Ltd. (2010). Marine environmental appraisal of an ocean energy test site in Inner Galway Bay. Galway, Ireland: p. 51.
- Aquatera Ltd. (2011). Environmental monitoring report—2011 installation of monopile at Voith Hydro test berth, Fall of Warness, Orkney Report. Heidenheim, Germany: p. 39.
- Aquatera Ltd. (2015). SSF Scapa Flow sites benthic ROV survey St Margaret’s Hope. Stromness, Orkney, UK: p. 26.
- Argyll Tidal Limited (2013). Environmental appraisal (EA) for the Argyll Tidal Demonstrator Project. Nautricity: p. 207.
- Atkins Portugal (2014). Environmental characterisation study of the ENONDAS S.A. pilot zone—executive summary. Lisbon, Portugal: p. 30.
- Atlantic Marine Geological Consulting Ltd. (2009). Geological report for the proposed in stream tidal power demonstration project in Minas Passage, Bay of Fundy, Nova Scotia. Appendix 3: geology, bathymetry, ice and seismic conditions. Hantsport, NS, Canada: p. 76.
- Bacouillard, L., N. Baux, J. C. Dauvin, N. Desroy, K. J. Geiger, F. Gentil and E. Thiebaut (2020). Long-term spatio-temporal changes of the muddy fine sand benthic community of the Bay of Seine (eastern English Channel). Marine Environmental Research, 161: 105062.
- Bald, J., A. del Campo, J. Franco, I. Galparsoro, M. Gonzalez, C. Hernandez, P. Liria, I. Menchaca, I. Muxika, O. Solaun, A. Uriarte, Y. Torre Encisco and D. Marina (2015). The Environmental impact study of the Biscay Marine Energy Platform (BIMEP) project. Marine Energy Week. Bilbao, Spain.
- Bald, J., A. del Campo, J. Franco, I. Galparsoro, M. González, C. Hernández, P. Liria, I. Menchaca, I. Muxika, O. Solaun, A. Uriarte and M. Uyarra (2012). The Biskay Marine Energy Platform (BIMEP), environmental impacts and monitoring plan. 4th International Conference on Ocean Energy. Dublin, Ireland: p. 6.
- Bald, J., J. Franco, I. Menchaca, Y. Torre Encisco and D. Marina (2017). Impact on seabirds of new offshore wind energy test and demonstration projects in the Biscay Marine Energy Platform (BiMEP, N. Spain). Marine Energy Week. Bilbao, Spain.
- Bald, J., I. Galparsoro, M. González, C. Hernandez, P. Liria, J. Mader, I. Muxika, I. Adarraga, I. Cruz, M. Markiegui, J. Martinez, J. Maria Ruiz, Y. Torre Encisco and D. Marina (2015). The Biscay Marine Energy Platform (BIMEP) preoperational environmental monitoring plan. Marine Energy Week. Bilbao, Spain.
- Bald, J., C. Hernandez, I. Galparsoro, J. Rodriguez, I. Muxika, I. Cruz, M. Markiegui, J. Martinez, J. Maria Ruiz, Y. Torre Encisco and D. Marina (2015). Environmental impacts over the seabed and benthic communities of submarine cable installation in the Biscay Marine Energy Platform (bimep). Marine Energy Week. Bilbao, Spain.
- Bald, J., C. Hernandez, I. Galparsoro, J. Rodriguez, I. Muxika, Y. Torre Encisco and D. Marina (2014). Environmental impacts over the seabed and benthic communities of underwater cable installation in the Biscay Marine Energy Platform (BIMEP). EIMR International Conference, Stornoway, UK.
- Bald, J., C. Hernandez, A. Uriarte, J. Antonio Castillo, P. Ruiz, N. Ortega, Y. Torre Encisco and D. Marina (2015). Acoustic characterization of submarine cable installation in the Biscay Marine Energy Platform (bimep. Marine Energy Week. Bilbao, Spain.
- Barrie, J. V. and K. W. Conway (2014). Seabed characterization for the development of marine renewable energy on the Pacific margin of Canada. Continental Shelf Research, 83: 45–52.
- Batten, B. (2014). Northwest National Marine Renewable Energy Center at Oregon State University Pacific Marine Energy Center South Energy Test Site scoping document 2. Corvallis, OR, USA: p. 147.
- Bender, A., O. Langhamer and J. Sundberg (2020). Colonisation of wave power foundations by mobile mega- and macrofauna—A 12 year study. Marine Environmental Research, 161: 105053.
- Bender, A. and J. Sundberg (2018). Effects of wave energy generators on Nephrops norvegicus. 4th Asian Wave and Tidal Energy Conference (AWTEC), Taipei, Taiwan.
- Bibby HydroMap (2015). Deep Green project and export cable route—Offshore survey. Volume 1—Operation Report. London, UK: p. 126.
- Bicknell, A. W. J., B. J. Godley, E. V. Sheehan, S. C. Votier and M. J. Witt (2016). Camera technology for monitoring marine biodiversity and human impact. Frontiers in Ecology and the Environment, 14(8): 424–432.
- Birchenough, S. N. R., S. G. Bolam and R. E. Parker (2013). SPI-ing on the seafloor: characterising benthic systems with traditional and in situ observations. Biogeochemistry, 113: 105–117.
- Birchenough, S. N. R., S. E. Boyd, R. A. Coggan, D. S. Limpenny, W. J. Meadows and H. L. Rees (2006). Lights, camera and acoustics: Assessing macrobenthic communities at a dredged material disposal site off the North East coast of the UK. Journal of Marine Systems, 62(3–4): 204–216.
- BMT Oceanica Pty Ltd. (2015). CETO 6 Garden Island marine environmental management plan. Wembley, Australia: p. 360.
- BMT Oceanica Pty Ltd. (2016). CETO 6 Garden Island project state referral form. Wembley, Australia: p. 56.
- Bond, T., J. Prince, D. L. McLean and J. C. Partridge (2020). Comparing the utility of industry ROV and hybrid-AUV imagery for surveys of fish along a subsea pipeline. Marine Technology Society Journal, 54(3): 33–42.
- BioPower Systems Pty Ltd. (2016). The Port Fairy pilot wave energy project environmental management plan version 2.2. Sydney, Australia: p. 38.
- Broadhurst, M., S. Barr and C. D. L. Orme (2014). In-situ ecological interactions with a deployed tidal energy device; an observational pilot study. Ocean & Coastal Management, 99: 31–38.
- Broadhurst, M. and C. D. Orme (2014). Spatial and temporal benthic species assemblage responses with a deployed marine tidal energy device: a small scaled study. Marine Environmental Research, 99: 76–84.
- Callaway, R. (2016). Historical data reveal 30-year persistence of benthic fauna associations in heavily modified waterbody. Frontiers in Marine Science, 3: 13.
- Carey, D. A., M. Hayn, J. D. Germano, D. I. Little, and B. Bullimore (2015). Marine habitat mapping of the Milford Haven Waterway, Wales, UK: Comparison of facies mapping and EUNIS classification for monitoring sediment habitats in an industrialized estuary. Journal of Sea Research, 100: 99–119.
- Carl Bro Group Ltd. (2002). Marine Energy Test Center environmental statement. Glasgow, UK: p. 57.
- Carlier, A., X. Caisey, J. Gaffet, M. Lejart, S. Derrien-Courtel, E. Catherine, E. Quimbert, and O. Soubigou (2014). Monitoring benthic habitats and biodiversity at the tidal energy site of Paimpol-Brehat (Brittany, France). Proceedings of the 2nd International Conference on Environmental Interactions of Marine Renewable Energy Technologies (EIMR2014), Stornoway, Scotland, UK.
- CEF Consultants Ltd. (2010). Fundy Tidal Energy Demonstration Project lobster catch monitoring: analysis of results from two fall surveys: September 25–October 3 and November 5—18, 2009. Hantsport, Nova Scotia, Canada: p. 44.
- Claisse, J. T., M. S. Love, E. L. Meyer-Gutbrod, C. M. Williams and D. J. Pondella II (2019). Fishes with high reproductive output potential on California offshore oil and gas platforms. Bulletin of Marine Science, 95(4): 515–534.
- Centre for Marine and Coastal Studies Ltd. (CMACS) (2015). Deep Green project Holyhead Deep benthic technical report, CMACS. Eastham, UK: p. 106.
- Coates, D. A., Y. Deschutter, M. Vincx and J. Vanaverbeke (2014). Enrichment and shifts in macrobenthic assemblages in an offshore wind farm area in the Belgian part of the North Sea. Marine Environmental Research, 95: 1–12.
- Cochrane, G. R., L. G. Hemery and S. K. Henkel (2017). Oregon OCS seafloor mapping: Selected lease blocks relevant to renewable energy. U.S. Geological Survey Open-File Report 2017-1045 and Bureau of Ocean Energy Management OCS Study BOEM 2017-018: p. 57.
- Cochrane, S. K. J., T. H. Pearson, M. Greenacre, J. Costelloe, I. H. Ellingsen, S. Dahle and B. Gulliksen (2012). Benthic fauna and functional traits along a Polar Front transect in the Barents Sea—Advancing tools for ecosystem-scale assessments. Journal of Marine Systems, 94: 204–217.
- Cooper, L. W., M. L. Guarinello, J. M. Grebmeier, A. Bayard, J. R. Lovvorn, C. A. North and J. M. Kolts (2019). A video seafloor survey of epibenthic communities in the Pacific Arctic including Distributed Biological Observatory stations in the northern Bering and Chukchi seas. Deep Sea Research Part II: Topical Studies in Oceanography, 162: 164–179.
- Cordier, T., F. Frontalini, K. Cermakova, L. Apotheloz-Perret-Gentil, M. Treglia, E. Scantamburlo, V. Bonamin and J. Pawlowski (2019). Multi-marker eDNA metabarcoding survey to assess the environmental impact of three offshore gas platforms in the North Adriatic Sea (Italy). Marine Environmental Research, 146: 24–34.
- Cossu, R., C. Heatherington, I. Penesis, R. Beecroft and S. Hunter (2020). Seafloor site characterization for a remote island OWC device near King Island, Tasmania, Australia. Journal of Marine Science and Engineering, 8: 13.
- Cruz-Marrero, W., D. W. Cullen, N. R. Gay and B. G. Stevens (2019). Characterizing the benthic community in Maryland’s offshore wind energy areas using a towed camera sled: Developing a method to reduce the effort of image analysis and community description. PLoS ONE, 14(5): e0215966.
- Culha, M., H. Somek and O. Aksoy (2019). Impact of offshore aquaculture on molluscan biodiversity in Ildir Bay, Aegean Sea, Turkey. Journal of Environmental Biology, 40: 76–83.
- Currie, D. R. and L. R. Isaacs (2005). Impact of exploratory offshore drilling on benthic communities in the Minerva gas field, Port Campbell, Australia. Marine Environmental Research, 59(3): 217–233.
- Davies, B. F. R., M. J. Attrill, L. Holmes, A. Rees, M. J. Witt and E. V. Sheehan (2020). Acoustic Complexity Index to assess benthic biodiversity of a partially protected area in the southwest of the UK. Ecological Indicators, 111.
- Davison, A. and T. Mallows (2005). Strangford Lough marine current turbine environmental statement final report. Edinburgh, Scotland, UK: p. 141.
- De Backer, A., G. Van Hoey, D. Coates, J. Vanaverbeke and K. Hostens (2014). Similar diversity-disturbance responses to different physical impacts: three cases of small-scale biodiversity increase in the Belgian part of the North Sea. Marine Pollution Bulletin, 84: 251–262.
- Degraer, S., R. Brabant, B. Rumes, L. Vigin and (eds.) (2019). Environmental impacts of offshore wind farms in the Belgian part of the North Sea: marking a decade of monitoring, research and innovation. Brussels, Belgium: p. 134.
- Dempster, T., P. Sanchez-Jerez, J. T. Bayle-Sempere, F. Gimenez-Casalduero and C. Valle (2002). Attraction of wild fish to sea-cage fish farms in the south-western Mediterranean Sea: spatial and short-term temporal variability. Marine Ecology Progress Series, 242: 237–252.
- Devine Tarbell & Associates (2006). Roosevelt Island Tidal Energy Project (FERC No. 12611) study plans. Syracuse, NY, USA: p. 97.
- Diaz, R. J., G. R. Cutter and D. M. Dauer (2003). A comparison of two methods for estimating the status of benthic habitat quality in the Virginia Chesapeake Bay. Journal of Experimental Marine Biology and Ecology, 285–286: 371–381.
- Doray, M., E. Josse, P. Gervain, L. Reynal and J. Chantrel (2007). Joint use of echosounding, fishing and video techniques to assess the structure of fish aggregations around moored Fish Aggregating Devices in Martinique (Lesser Antilles). Aquatic Living Resources, 20(4): 357–366.
- DP Energy Ireland Ltd. (2014). Fair Head Tidal Energy Park consent application—Appendices. Volume 4. Belfast, Northern Ireland, UK: p. 1269.
- Dunham, A., J. R. Pegg, W. Carolsfeld, S. Davies, I. Murfitt and J. Boutillier (2015). Effects of submarine power transmission cables on a glass sponge reef and associated megafaunal community. Marine Environmental Research, 107: 50–60.
- Eerkes-Medrano, D., J. Drewery, F. Burns, P. Cárdenas, M. Taite, D. W. McKay, D. Stirling and F. Neat (2020). A community assessment of the demersal fish and benthic invertebrates of the Rosemary Bank Seamount marine protected area (NE Atlantic). Deep Sea Research Part I: Oceanographic Research Papers, 156: 103180.
- Envirosphere Consultants Limited (2009). Appendix 4: Benthic communities—seabed biological communities in the Minas Passage. Environmental assessment registration document—Fundy Tidal Energy Demonstration Project Volume I: Environmental Assessment. AECOM. Hantsport, Nova Scotia, Canada: p. 56.
- European Marine Energy Centre (2011). Scapa Flow Scale Site: Environmental description. Stromness, Orkney, UK: p. 35.
- European Marine Energy Centre (2014). EMEC Fall of Warness Test Site: Environmental appraisal. REP 443-04-01 20141120. Stromness, Orkney, UK: p. 326.
- European Marine Energy Centre (2019). Scapa Flow Scale Test Site: Environmental description. Stromness, Orkney, UK: p. 47.
- FaB Test (2014). FaB Test: Falmouth Bay Test Site marine renewables commissioning site guide to deployments & application process requirements. Exeter, UK: p. 23.
- Fields, S., S. Henkel and G. C. Roegner (2019). Video sleds effectively survey epibenthic communities at dredged material disposal sites. Environmental Monitoring and Assessment, 191(6): 404.
- Foubister, L. (2005). EMEC Tidal Test Facility Fall of Warness Eday, Orkney: Environmental statement. Stromness, Orkney, UK: p. 176.
- Fujii, T. (2015). Temporal variation in environmental conditions and the structure of fish assemblages around an offshore oil platform in the North Sea. Marine Environmental Research, 108: 69–82.
- Gates, A. R., T. Horton, A. Serpell-Stevens, C. Chandler, L. J. Grange, K. Robert, A. Bevan and D. O. B. Jones (2019). Ecological role of an offshore industry artificial structure. Frontiers in Marine Science, 6: 675.
- Germano, J. D., D. C. Rhoads, R. M. Valente, D. A. Carey and M. Solan (2011). The use of sediment profile imaging (SPI) for environmental impact assessments and monitoring studies: Lessons learned from the past four decades. Oceanography and Marine Biology: An Annual Review, 49: 235–297.
- Goldfinger, C., S. Henkel, C. Romsos, A. Havron and B. Black (2014). Benthic habitat characterization offshore the Pacific Northwest—Volume 1: Evaluation of continental shelf geology. US Department of the Interior, Bureau of Ocean Energy Management, Pacific OCS Region, OCS Study BOEM 2014–662: p. 161.
- Gonzalez, S., J. K. Horne and E. Ward (2019). Temporal variability in pelagic biomass distributions at wave and tidal sites and implications for standardization of biological monitoring. International Marine Energy Journal, 2(1): 15–28.
- Greene, H. G. (2015). Habitat characterization of a tidal energy site using an ROV: Overcoming difficulties in a harsh environment. Continental Shelf Research, 106: 85–96.
- Griffin, R. A., R. E. Jones, N. E. L. Lough, C. P. Lindenbaum, M. C. Alvarez, K. A. J. Clark, J. D. Griffiths and P. A. T. Clabburn (2020). Effectiveness of acoustic cameras as tools for assessing biogenic structures formed by Sabellaria in highly turbid environments. Aquatic Conservation: Marine and Freshwater Ecosystems, 30(6): 1121–1136.
- Guarinello, M. L. and D. A. Carey (2020). Multi-modal approach for benthic impact assessments in moraine habitats: a case study at the Block Island wind farm. Estuaries and Coasts: 1–16.
- Guida, V., A. Drohan, H. Welch, J. McHenry, D. Johnson, V. Kentner, J. Brink, D. Timmons, J. Pessutti, S. Fromm and E. Estela-Gomez (2017). Habitat mapping and assessment of northeast wind energy areas. US Department of Interior, Bureau of Ocean Energy Management, Office of Renewable Energy Programs, OCS Study BOEM 2017-088: p. 312.
- Halcrow Group Limited (2006). South West of England regional development agency Wave Hub environmental statement. South West of England Regional Development Agency, Exeter, UK: p. 278.
- Hayes, P. and N. C. Lacey (2019). Epifauna associated with subsea pipelines in the North Sea. ICES Journal of Marine Science, 77(3): 1137–1147.
- HDR (2018). Benthic monitoring during wind turbine installation and operation at the Block Island wind farm, Rhode Island. U.S. Department of the Interior, Bureau of Ocean Energy Management, Office of Renewable Energy Programs, OCS Study BOEM 2018-047: p. 155.
- HDR (2020). Benthic and epifaunal monitoring during wind turbine installation and operation at the Block Island wind farm, Rhode Island—Project Report. Volumes 1 & 2. U.S. Department of the Interior, Bureau of Ocean Energy Management, Office of Renewable Energy Programs, OCS Study BOEM 2020-044: p. 263.
- Hemery, L. G., S. K. Henkel and G. R. Cochrane (2018). Benthic assemblages of mega epifauna on the Oregon continental margin. Continental Shelf Research, 159: 24–32.
- Hemery, L. G., K. K. Politano and S. K. Henkel (2017). Assessing differences in macrofaunal assemblages as a factor of sieve mesh size, distance between samples, and time of sampling. Environmental Monitoring and Assessment, 189: 413.
- Henkel, S. (2016). Assessment of benthic effects of anchor presence and removal. Northwest National Marine Renewable Energy Center (NNMREC), Corvallis, OR, USA: p. 22.
- Henkel, S., C. Goldfinger, C. Romsos, L. Hemery, A. Havron and K. Politano (2014). Benthic habitat characterization offshore the Pacific Northwest—Volume 2: Evaluation of continental shelf benthic communities. US Department of the Interior, Bureau of Ocean Energy Management, Pacific OCS Region, BOEM 2014-662: p. 218.
- Holte, B. and L. Buhl-Mortensen (2020). Does grab size influence sampled macrofauna composition? A test conducted on deep-sea communities in the northeast Atlantic. Marine Environmental Research, 154: 104867.
- Horne, J., D. Jacques, S. Parker-Stetter, H. Linder and J. Nomura (2013). Evaluating acoustic technologies to monitor aquatic organisms at renewable energy sites final report. U.S. Department of the Interior, Bureau of Ocean Energy Management, BOEM 2014-057: p. 102.
- Hyland, J., D. Hardin, M. Steinhauer, D. Coats, R. Green and J. Neff (1994). Environmental impact of offshore oil development on the outer continental shelf and slope off Point Arguello, California. Marine Environmental Research, 37(2): 195–229.
- Ingram, E. C., R. M. Cerrato, K. J. Dunton and M. G. Frisk (2019). Endangered Atlantic sturgeon in the New York wind energy area: Implications of future development in an offshore wind energy site. Scientific Reports, 9: 12432.
- Insight Marine Projects (2014). FaBTest geophysical survey: Report of survey. University of Exeter, REP-0191/J64567: p. 57.
- Integral Consulting (2017). Benthic habitat mapping field and data report Sequim Bay April/May 2017: Standardized and cost-effective benthic habitat mapping and monitoring tools for MHK environmental assessments. U.S. Department of Energy (DOE) Office of Energy Efficiency and Renewable Energy (EERE), DE-EE007826: p. 318.
- Integral Consulting (2017). Environmental monitoring program report 2 results of phases I–IV. Shell Exploration & Production Company, Anchorage, AK, USA: p. 410.
- Integral Consulting (2019). Benthic habitat mapping field and data report PacWave June 2019: Standardized and cost-effective benthic habitat mapping and monitoring tools for MHK environmental assessments. US Department of Energy (DOE) Office of Energy Efficiency and Renewable Energy (EERE), DE-EE007826: p. 281.
- Jarvis, S., J. Allen, N. Proctor, A. Crossfield, O. Dawes, A. Leighton, L. McNeill and W. Musk (2004). North Sea wind farms NSW lot 1 benthic fauna. Institute of Estuarine and Coastal Studies (IECS), ZBB607.2-F-2004: p. 91.
- Kahn, A. S., C. W. Pennelly, P. R. McGill and S. P. Leys (2020). Behaviors of sessile benthic animals in the abyssal northeast Pacific Ocean. Deep Sea Research Part II: Topical Studies in Oceanography, 173: 104729.
- Keenan, G., C. Sparling, H. Williams and F. Fortune (2011). SeaGen environmental monitoring programme final report. Royal Haskoning, Edinburgh, Scotland, UK: p. 81.
- Kregting, L., B. Elsaesser, R. Kennedy, D. Smyth, J. O’Carroll and G. Savidge (2016). Do changes in current flow as a result of arrays of tidal turbines have an effect on benthic communities? PLoS ONE, 11(8): e0161279.
- Kregting, L., P. Schmitt, L. Lieber, R. Culloch, N. Horne and D. Smyth (2018). Environmental impact report of the H2020 project PowerKite. Queen’s University Belfast, Northern Ireland, UK: p. 30.
- Krone, R., L. Gutow, T. J. Joschko and A. Schroder (2013). Epifauna dynamics at an offshore foundation—Implications of future wind power farming in the North Sea. Marine Environmental Research, 85: 1–12.
- LaFrance, M., J. W. King, B. A. Oakley and S. Pratt (2014). A comparison of top-down and bottom-up approaches to benthic habitat mapping to inform offshore wind energy development. Continental Shelf Research, 83: 24–44.
- Langhamer, O. (2010). Effects of wave energy converters on the surrounding soft-bottom macrofauna (west coast of Sweden). Marine Environmental Research, 69: 374–381.
- Langhamer, O. and D. Wilhelmsson (2007). Wave power devices as artificial reefs. European Wave and Tidal Energy Conference. Porto, Portugal: p. 8.
- Langhamer, O. and D. Wilhelmsson (2009). Colonisation of fish and crabs of wave energy foundations and the effects of manufactured holes—A field experiment. Marine Environmental Research, 68(4): 151–157.
- Langhamer, O., D. Wilhelmsson and J. Engström (2009). Artificial reef effect and fouling impacts on offshore wave power foundations and buoys—A pilot study. Estuarine, Coastal and Shelf Science, 82(3): 426–432.
- Laroche, O., S. A. Wood, L. A. Tremblay, J. I. Ellis, G. Lear and X. Pochon (2018). A cross-taxa study using environmental DNA/RNA metabarcoding to measure biological impacts of offshore oil and gas drilling and production operations. Marine Pollution Bulletin, 127: 97–107.
- Leclerc, J. C., F. Viard, E. González Sepúlveda, C. Díaz, J. Neira Hinojosa, K. Pérez Araneda, F. Silva, A. Brante and E. Briski (2019). Habitat type drives the distribution of non-indigenous species in fouling communities regardless of associated maritime traffic. Diversity and Distributions, 26(1): 62–75.
- Lindeboom, H. J., H. J. Kouwenhoven, M. J. N. Bergman, S. Bouma, S. Brasseur, R. Daan, R. C. Fijn, D. de Haan, S. Dirksen, R. van Hal, R. Hille Ris Lambers, R. ter Hofstede, K. L. Krijgsveld, M. Leopold and M. Scheidat (2011). Short-term ecological effects of an offshore wind farm in the Dutch coastal zone; a compilation. Environmental Research Letters, 6: 035101.
- Long, S., B. Sparrow-Scinocca, M. E. Blicher, N. Hammeken Arboe, M. Fuhrmann, K. M. Kemp, R. Nygaard, K. Zinglersen and C. Yesson (2020). Identification of a soft coral garden candidate vulnerable marine ecosystem (VME) using video imagery, Davis Strait, West Greenland. Frontiers in Marine Science, 7: 460.
- Love, M. S., J. T. Claisse and A. Roeper (2019). An analysis of the fish assemblages around 23 oil and gas platforms off California with comparisons with natural habitats. Bulletin of Marine Science, 95(4): 477–514.
- Love, M. S., L. Kui and J. T. Claisse (2019). The role of jacket complexity in structuring fish assemblages in the midwaters of two California oil and gas platforms. Bulletin of Marine Science, 95(4): 597–616.
- Love, M. S., M. M. Nishimoto, S. Clark, M. McCrea and A. Scarborough Bull (2017). The organisms living around energized submarine power cables, pipe, and natural sea floor in the inshore waters of Southern California. Bulletin, Southern California Academy of Sciences, 116(2): 61–87.
- Love, M. S., M. M. Nishimoto, L. Snook and L. Kui (2019). An analysis of the sessile, structure-forming invertebrates living on California oil and gas platforms. Bulletin of Marine Science, 95(4): 583–596.
- Marine Institute (2015). Galway Bay Marine and Renewable Energy Test Site environmental screening report. Marine Institute, Galway, Ireland: p. 30.
- Mattila, J. (2012). Ecological impacts of a wave energy converter in Hammarudda, Åland Islands—A preliminary assessment after one year of operation. Abo Akademi University, Turku, Finland: p. 11.
- Mauffrey, F., T. Cordier, L. Apotheloz-Perret-Gentil, K. Cermakova, T. Merzi, M. Delefosse, P. Blanc and J. Pawlowski (2021). Benthic monitoring of oil and gas offshore platforms in the North Sea using environmental DNA metabarcoding. Molecular Ecology, 30(13): 3007–3022.
- Mavraki, N., I. De Mesel, S. Degraer, T. Moens and J. Vanaverbeke (2020). Resource niches of co-occurring invertebrate species at an offshore wind turbine indicate a substantial degree of trophic plasticity. Frontiers in Marine Science, 7: 379.
- McIlvenny, J., D. Tamsett, P. Gillibrand and L. Goddijn-Murphy (2016). On the sediment dynamics in a tidally energetic channel: The Inner Sound, Northern Scotland. Journal of Marine Science and Engineering, 4(2): 31.
- McIntyre, M. L., D. F. Naar, K. L. Carder, B. T. Donahue, and D. J. Mallinson (2006). Coastal bathymetry from hyperspectral remote sensing data: Comparisons with high resolution multibeam bathymetry. Marine Geophysical Researches, 27(2): 129–136.
- McLean, D. L., M. D. Taylor, A. Giraldo Ospina and J. C. Partridge (2019). An assessment of fish and marine growth associated with an oil and gas platform jacket using an augmented remotely operated vehicle. Continental Shelf Research, 179: 66–84.
- McLean, D. L., M. D. Taylor, J. C. Partridge, B. Gibbons, T. J. Langlois, B. E. Malseed, L. D. Smith and T. Bond (2018). Fish and habitats on wellhead infrastructure on the north west shelf of Western Australia. Continental Shelf Research, 164: 10–27.
- McLean, D. L., B. I. Vaughan, B. E. Malseed and M. D. Taylor (2020). Fish-habitat associations on a subsea pipeline within an Australian Marine Park. Marine Environmental Research, 153: 104813.
- Mendoza, M. and S. K. Henkel (2017). Benthic effects of artificial structures deployed in a tidal estuary. Plankton & Benthos Research, 12(3): 179–189.
- Meyer, H. K., E. M. Roberts, H. T. Rapp and A. J. Davies (2019). Spatial patterns of arctic sponge ground fauna and demersal fish are detectable in autonomous underwater vehicle (AUV) imagery. Deep Sea Research Part I: Oceanographic Research Papers, 153: 103137.
- Meyer-Gutbrod, E. L., L. Kui, M. M. Nishimoto, M. S. Love, D. M. Schroeder and R. J. Miller (2019). Fish densities associated with structural elements of oil and gas platforms in southern California. Bulletin of Marine Science, 95(4): 639–656.
- Meyer-Gutbrod, E. L., M. S. Love, J. T. Claisse, H. M. Page, D. M. Schroeder and R. J. Miller (2019). Decommissioning impacts on biotic assemblages associated with shell mounds beneath southern California offshore oil and gas platforms. Bulletin of Marine Science, 95(4): 683–701.
- Meyer-Gutbrod, E. L., M. S. Love, D. M. Schroeder, J. T. Claisse, L. Kui and R. J. Miller (2020). Forecasting the legacy of offshore oil and gas platforms on fish community structure and productivity. Ecological Applications, 30(8): e02185.
- MeyGen (2011). MeyGen Tidal Energy Project—Phase 1 Non-Technical Summary. MeyGen Limited, London, UK: p. 40.
- MeyGen (2012). MeyGen Tidal Energy Project Phase 1: Environmental Statement. MeyGen Limited, London, UK: p. 544.
- Minerex Geophysics Limited (2010). Appendix 5—Belmullet Wave Energy Connection, Belderra Strand County Mayo—Geophysical Survey Report Status. Atlantic Marine Energy Test Site Environmental Impact Statement, Sustainable Energy Authority of Ireland, Dublin, Ireland: p. 26.
- Minesto (2016). Deep Green Holyhead Deep Project Phase I (0.5 MW)—Environmental Statement. Minesto, L-100194-S14-EIAS-001: p. 487.
- Mireles, C., C. J. B. Martin and C. G. Lowe (2019). Site fidelity, vertical movement, and habitat use of nearshore reef fishes on offshore petroleum platforms in southern California. Bulletin of Marine Science, 95(4): 657–681.
- Moore, C. G. (2009). Preliminary assessment of the conservation importance of benthic epifaunal species and habitats of the Pentland Firth and Orkney Islands in relation to the development of renewable energy schemes. Scottish Natural Heritage, Report No. 319: p. 41.
- Morgan, N. B., S. Goode, E. B. Roark and A. R. Baco (2019). Fine Scale Assemblage Structure of Benthic Invertebrate Megafauna on the North Pacific Seamount Mokumanamana. Frontiers in Marine Science, 6: 715.
- Nall, C. R., M. L. Schlappy and A. J. Guerin (2017). Characterisation of the biofouling community on a floating wave energy device. Biofouling, 33(5): 379–396.
- Navarrete, S. A., M. Parragué, N. Osiadacz, F. Rojas, J. Bonicelli, M. Fernández, C. Arboleda-Baena, R. Finke and S. Baldanzi (2020). Susceptibility of Different Materials and Antifouling Coating to Macrofouling Organisms in a High Wave-Energy Environment. Journal of Ocean Technology, 15(1): 72–91.
- Navarrete, S. A., M. Parragué, N. Osiadacz, F. Rojas, J. Bonicelli, M. Fernández, C. Arboleda-Baena, A. Perez-Matus and R. Finke (2019). Abundance, composition and succession of sessile subtidal assemblages in high wave-energy environments of Central Chile: Temporal and depth variation. Journal of Experimental Marine Biology and Ecology, 512: 51–62.
- Nishimoto, M. M., L. Washburn, M. S. Love, D. M. Schroeder, B. M. Emery and L. Kui (2019). Timing of juvenile fish settlement at offshore oil platforms coincides with water mass advection into the Santa Barbara Channel, California. Bulletin of Marine Science, 95(4): 559–582.
- O’Carroll, J. P. J., R. M. Kennedy, A. Creech and G. Savidge (2017). Tidal Energy: The benthic effects of an operational tidal stream turbine. Marine Environmental Research, 129: 277–290.
- O’Donnell, K. P., R. A. Wahle, M. Bell and M. Dunnington (2007). Spatially referenced trap arrays detect sediment disposal impacts on lobsters and crabs in a New England estuary. Marine Ecology Progress Series, 348: 249–260.
- O’Reilly, R., R. Kennedy, A. Patterson and B. F. Keegan (2006). Ground truthing sediment profile imagery with traditional benthic survey data along an established disturbance gradient. Journal of Marine Systems, 62(3–4): 189–203.
- O’Carroll, J. P. J., R. M. Kennedy and G. Savidge (2017). Identifying relevant scales of variability for monitoring epifaunal reef communities at a tidal energy extraction site. Ecological Indicators, 73: 388–397.
- Oakes, C. T. and D. J. Pondella (2009). The Value of a Net-Cage as a Fish Aggregating Device in Southern California. Journal of the World Aquaculture Society, 40(1): 1–21.
- Ocean Power Technologies (2010). Reedsport OPT Wave Park Settlement Agreement. FERC Project No. 12711. Ocean Power Technologies, Monroe Township, NJ, USA: p. 263.
- Ocean Renewable Power Company (ORPC) Maine (2011). Final Pilot License Application Cobscook Bay Tidal Energy Project Appendix B: Safeguard Plans. FERC Project No. 12711. Portland, ME, USA: p. 392.
- Ocean Renewable Power Company (ORPC) Maine (2014). Cobscook Bay Tidal Energy Project: 2013 Environmental Monitoring Report. FERC Project No. 12711. Portland, ME, USA: p. 502.
- Ocean Renewable Power Company (ORPC) Maine, (2016). Cobscook Bay Tidal Energy Project: 2015 Environmental Monitoring Report. FERC Project No. 12711. Portland, ME, USA: 65.
- Oregon State University (2019). Volume II S PacWave South Applicant Prepared Environmental Assessment. FERC PROJECT NO. 14616. Corvallis, OR, USA: p. 330.
- Oregon State University (OSU) and Northwest national Marine Renewable Energy Center (NNMREC) (2012). Wave Energy Test Project—Final Environmental Assessment. Appendix E, monitoring plans. US Department of Energy (DOE), DOE/EA-1917: p. 18.
- Page, H. M., J. E. Dugan, D. S. Dugan, J. B. Richards and D. M. Hubbard (1999). Effects of an offshore oil platform on the distribution and abundance of commercially important crab species. Marine Ecology Progress Series, 185: 47–57.
- Page, H. M., S. F. Zaleski, R. J. Miller, J. E. Dugan, D. M. Schroeder and B. Doheny (2019). Regional patterns in shallow water invertebrate assemblages on offshore oil and gas platforms along the Pacific continental shelf. Bulletin of Marine Science, 95(4): 617–638.
- Pandian, P. K., J. P. Ruscoe, M. Shields, J. C. Side, R. E. Harris, S. A. Kerr and C. R. Bullen (2009). Seabed habitat mapping techniques: an overview of the performance of various systems. Mediterranean Marine Science, 10(2): 29–43.
- Patterson, A., R. Kennedy, R. O’Reilly and B. F. Keegan (2006). Field test of a novel, low-cost, scanner-based sediment profile imaging camera. Limnology and Oceanography: Methods, 4: 30–37.
- Pattison, L., A. Serrick and C. Brown (2020). Testing 360 degree imaging technologies for improved animal detection around tidal energy installations. Offshore Energy Research Association of Nova Scotia (OERA), Halifax, NS, Canada: p. 97.
- Pearce, B., J. M. Fariñas-Franco, C. Wilson, J. Pitts, A. deBurgh and P. J. Somerfield (2014). Repeated mapping of reefs constructed by Sabellaria spinulosa Leuckart 1849 at an offshore wind farm site. Continental Shelf Research, 83: 3–13.
- Plumlee, J. D., K. M. Dance, M. A. Dance, J. R. Rooker, T. C. TinHan, J. B. Shipley and R. J. D. Wells (2020). Fish assemblages associated with artificial reefs assessed using multiple gear types in the northwest Gulf of Mexico. Bulletin of Marine Science, 96(4): 655–678.
- Public Utility District No. 1 of Snohomish County (2012). Admiralty Inlet Pilot Tidal Project: Benthic Habitat Monitoring Plan. FERC Project No. 12690, Snohomish, WA, USA: p. 14.
- Public Utility District No. 1 of Snohomish County (2013). Admiralty Inlet Final Environmental Assessment. Report No. 20130809-3010. FERC Project No. 12690-005, Snohomish, WA, USA: p. 248.
- Punzo, E., P. Strafella, G. Scarcella, A. Spagnolo, A. M. De Biasi and G. Fabi (2015). Trophic structure of polychaetes around an offshore gas platform. Marine Pollution Bulletin, 99(1–2): 119–125.
- Raineault, N. A., A. C. Trembanis, D. C. Miller and V. Capone (2013). Interannual changes in seafloor surficial geology at an artificial reef site on the inner continental shelf. Continental Shelf Research, 58: 67–78.
- Ramalho, S. P., L. Lins, K. Soetaert, N. Lampadariou, M. R. Cunha, A. Vanreusel and E. Pape (2020). Ecosystem Functioning Under the Influence of Bottom-Trawling Disturbance: An Experimental Approach and Field Observations from a Continental Slope Area in the West Iberian Margin. Frontiers in Marine Science, 7: 457.
- Raoult, V., L. Tosetto, C. Harvey, T. M. Nelson, J. Reed, A. Parikh, A. J. Chan, T. M. Smith and J. E. Williamson (2020). Remotely operated vehicles as alternatives to snorkellers for video-based marine research. Journal of Experimental Marine Biology and Ecology, 522: 151253.
- Rassweiler, A., A. K. Dubel, G. Hernan, D. J. Kushner, J. E. Caselle, J. L. Sprague, L. Kui, T. Lamy, S. E. Lester and R. J. Miller (2020). Roving Divers Surveying Fish in Fixed Areas Capture Similar Patterns in Biogeography but Different Estimates of Density When Compared With Belt Transects. Frontiers in Marine Science, 7: 272.
- Reedsport OPT Wave Park, L. (2010). Reedsport OPT Wave Park Settlement Agreement Appendices and Exhibits. Volume IV. FERC Project No. 12713. Reedsport, OR, USA: p. 223.
- Reubens, J. T., S. Degraer and M. Vincx (2011). Aggregation and feeding behaviour of pouting (Trisopterus luscus) at wind turbines in the Belgian part of the North Sea. Fisheries Research, 108: 223–227.
- Revelas, E. C., C. Jones, B. Sackmann and N. Maher (2020). A Benthic habitat monitoring approach for marine and hydrokinetic sites: Standardized and cost-effective benthic habitat mapping and monitoring tools for MHK environmental assessments. US Department of Energy (DOE) Office of Energy Efficiency and Renewable Energy (EERE), DE-EE007826: p. 178.
- Rhodes, N., T. Wilms, H. Baktoft, G. Ramm, J. L. Bertelsen, H. Flávio, J. G. Støttrup, B. M. Kruse and J. C. Svendsen (2020). Comparing methodologies in marine habitat monitoring research: An assessment of species-habitat relationships as revealed by baited and unbaited remote underwater video systems. Journal of Experimental Marine Biology and Ecology, 526: 151315.
- Robertson, C. M., A. W. J. Demopoulos, J. R. Bourque, F. Mienis, G. C. A. Duineveld, M. S. S. Lavaleye, R. K. K. Koivisto, S. D. Brooke, S. W. Ross, M. Rhode and A. J. Davies (2020). Submarine canyons influence macrofaunal diversity and density patterns in the deep-sea benthos. Deep Sea Research Part I: Oceanographic Research Papers, 159: 103249.
- Rollings, E. D., C. Eastham, C. (2016). MeyGen Tidal Energy Project Phase 1 Project Environmental Monitoring Programme. MEY-1A-70-HSE-018-I-PEMP. MeyGen Limited, London, UK: p. 201.
- Romano, E., M. C. Magno and L. Bergamin (2018). Grain size of marine sediments in the environmental studies, from sampling to measuring and classifying. A critical review of the most used procedures. Acta IMEKO, 7(2): 10–15.
- Rosenberg, R., M. Magnusson and H. C. Nilsson (2009). Temporal and spatial changes in marine benthic habitats in relation to the EU Water Framework Directive: the use of sediment profile imagery. Marine Pollution Bulletin, 58(4): 565–572.
- Rosenberg, R., H. C. Nilsson, B. Hellman and S. Agrenius (2000). Depth Correlated Benthic Faunal Quantity and Infaunal Burrow Structures on the Slopes of a Marine Depression. Estuarine, Coastal and Shelf Science, 50(6): 843–853.
- Røstad, A., S. Kaartvedt, T. A. Klevjer and W. Melle (2006). Fish are attracted to vessels. ICES Journal of Marine Science, 63(8): 1431–1437.
- Rouse, S., N. C. Lacey, P. Hayes and T. A. Wilding (2019). Benthic Conservation Features and Species Associated With Subsea Pipelines: Considerations for Decommissioning. Frontiers in Marine Science, 6: 200.
- Royal HaskoningDHV (2013). The Kyle Rhea Tidal Stream Array Environmental Statement: Volume 3—Appendices. Marine Scotland, Aberdeen, Scotland, UK: p. 829.
- Royal HaskoningDHV (2014). Perpetuus Tidal Energy Centre Non-Technical Summary. PTEC Limited, Isle of Wight, UK: p. 34.
- Šaškov, A., T. G. Dahlgren, Y. Rzhanov and M.-L. Schläppy (2015). Comparison of manual and semi-automatic underwater imagery analyses for monitoring of benthic hard-bottom organisms at offshore renewable energy installations. Hydrobiologia, 756: 139–153.
- Schmitt, P., R. Culloch and L. Lieber (2016). Environmental Monitoring Baseline Report of the H2020 project PowerKite. Queen’s University Belfast, Northern Ireland, UK: p. 16.
- Schramm, K. D., M. J. Marnane, T. S. Elsdon, C. Jones, B. J. Saunders, J. S. Goetze, D. Driessen, L. A. F. Fullwood and E. S. Harvey (2020). A comparison of stereo-BRUVs and stereo-ROV techniques for sampling shallow water fish communities on and off pipelines. Marine Environmental Research, 162: 105198.
- Schultz, A. L., H. A. Malcolm, R. Ferrari and S. D. A. Smith (2019). Wave energy drives biotic patterns beyond the surf zone: Factors influencing abundance and occurrence of mobile fauna adjacent to subtropical beaches. Regional Studies in Marine Science, 25: 100467.
- Schutter, M., M. Dorenbosch, F. M. F. Driessen, W. Lengkeek, O. G. Bos and J. W. P. Coolen (2019). Oil and gas platforms as artificial substrates for epibenthic North Sea fauna: Effects of location and depth. Journal of Sea Research, 153: 101782.
- ScottishPower Renewables Ltd. (2010). Sound of Islay Demonstration Tidal Array Environmental Statement. Marine Scotland, Aberdeen, Scotland, UK: p. 445.
- Sempere-Valverde, J., E. Ostalé-Valriberas, G. M. Farfán and F. Espinosa (2018). Substratum type affects recruitment and development of marine assemblages over artificial substrata: A case study in the Alboran Sea. Estuarine, Coastal and Shelf Science, 204: 56–65.
- Sheehan, E. V., D. Bridger, S. J. Nancollas and S. J. Pittman (2020). PelagiCam: a novel underwater imaging system with computer vision for semi-automated monitoring of mobile marine fauna at offshore structures. Environmental Monitoring and Assessment, 192(1): 11.
- Sheehan, K. (2009). Wave Energy Test Site Galway Bay. Marine Institute, Galway, Ireland: p. 13.
- Shumchenia, E. J., M. L. Guarinello and J. W. King (2016). A Re-assessment of Narragansett Bay Benthic Habitat Quality Between 1988 and 2008. Estuaries and Coasts, 39: 1463–1477.
- Simone, M. and J. Grant (2020). Visually-based alternatives to sediment environmental monitoring. Marine Pollution Bulletin, 158: 111367.
- Smith, R. and M. A. Adonizio (2011). Roosevelt Island Tidal Energy (RITE) Environmental Assessment Project Final Report. New York State Energy Research and Development Authority, NYSERDA 9892-1, New York, NY, USA: p. 56.
- Soldal, A. V., I. Svellingen, T. Jorgensen and S. Lokkeborg (2002). Rigs-to-reefs in the North Sea: hydroacoustic quantification of fish in the vicinity of a semi-cold platform. ICES Journal of Marine Science, 59: S281-S287.
- Sparling, C. E., E. Cox and D. J. F. Russell (2013). DP Energy Seal Telemetry. SMRU Ltd. report SMRUL-DPE-2013-013: p. 14.
- Spencer, M. L., A. W. Stoner, C. H. Ryer and J. E. Munk (2005). A towed camera sled for estimating abundance of juvenile flatfishes and habitat characteristics: Comparison with beam trawls and divers. Estuarine, Coastal and Shelf Science, 64(2–3): 497–503.
- Stewart, P. L. (2009). Seabed Video and Photographic Survey—Berth A and Cable Route—Minas Passage Tidal Energy Study Site, July & August, 2009. Fundy Ocean Research Centre for Energy (FORCE), Hantsport, NS, Canada: p. 106.
- Stewart, P. L. (2009). Seabed Video and Photographic Survey—Berth C and Cable Route—Minas Passage Tidal Energy Study Site, February, March, June, and July, 2009. Fundy Ocean Research Centre for Energy (FORCE), Hantsport, NS, Canada: p. 161.
- Stewart, P. L. and H. A. Levy (2010). Seabed Video and Photographic Survey—Berth B and Cable Route—Minas Passage Tidal Energy Study Site, July & August, 2009. Fundy Ocean Research Centre for Energy (FORCE), Hantsport, NS, Canada: p. 115.
- Streich, M. K., M. J. Ajemian, J. J. Wetz and G. W. Stunz (2017). A Comparison of Fish Community Structure at Mesophotic Artificial Reefs and Natural Banks in the Western Gulf of Mexico. Marine and Coastal Fisheries: Dynamics, Management, and Ecosystem Science, 9(1): 170–189.
- Sustainable Energy Authority of Ireland (SEAI) (2011). Appendix 3 Ecological assessment for the proposed Atlantic Marine Energy Test Site. Atlantic Marine Energy Test Site Environmental Impact Statement, Sustainable Energy Authority of Ireland, Dublin, Ireland: p 324.
- Sustainable Energy Authority of Ireland (SEAI) (2011). Chapter 6 Flora and Fauna. Atlantic Marine Energy Test Site Environmental Impact Statement, Sustainable Energy Authority of Ireland, Dublin, Ireland: p. 40.
- Sustainable Energy Authority of Ireland (SEAI) (2011). Chapter 8—Soils, geology and groundwater. Atlantic Marine Energy Test Site Environmental Impact Statement, Sustainable Energy Authority of Ireland, Dublin, Ireland: p 16.
- Sutula, M., L. Green, G. Cicchetti, N. Detenbeck and P. Fong (2014). Thresholds of Adverse Effects of Macroalgal Abundance and Sediment Organic Matter on Benthic Habitat Quality in Estuarine Intertidal Flats. Estuaries and Coasts, 37: 1532–1548.
- Taormina, B., M. Laurans, M. P. Marzloff, N. Dufournaud, M. Lejart, N. Desroy, D. Leroy, S. Martin and A. Carlier (2020). Renewable energy homes for marine life: Habitat potential of a tidal energy project for benthic megafauna. Marine Environmental Research, 161: 105131.
- Taormina, B., M. P. Marzloff, N. Desroy, X. Caisey, O. Dugornay, E. Metral Thiesse, A. Tancray and A. Carlier (2020). Optimizing image-based protocol to monitor macroepibenthic communities colonizing artificial structures. ICES Journal of Marine Science, 77(2): 835–845.
- Taormina, B., A. Percheron, M. P. Marzloff, X. Caisey, N. Quillien, M. Lejart, N. Desroy, O. Dugornay, A. Tancray and A. Carlier (2020). Succession in epibenthic communities on artificial reefs associated with marine renewable energy facilities within a tide-swept environment. ICES Journal of Marine Science, 77(7–8): 2656–2668.
- Tassetti, A. N., A. Minelli, C. Ferra, S. Guicciardi, A. Gaetani and G. Fabi (2020). An integrated approach to assess fish spatial pattern around offshore gas platforms: A pilot study in the Adriatic Sea. Marine Environmental Research, 162: 105100.
- Taylor, J. C., A. B. Paxton, C. M. Voss, B. Sumners, C. A. Buckel, J. Vander Pluym, E. B. Ebert, T. S. Viehman, S. R. Fegley, E. A. Pickering, A. M. Adler, C. Freeman and C. H. Peterson (2016). Benthic Habitat Mapping and Assessment in the Wilmington-East Wind Energy Call Area: Final Report. U.S. Department of the Interior, Bureau of Ocean Energy Management (BOEM), OCS Study BOEM 2016-003 and NOAA Technical Memorandum 196: p. 171.
- Terrill, S., S. Kramer, P. Nelson and D. Zajanc (2009). Baseline Data and Power Analyses for the OWET Dungeness Crab and Fish Baseline Study. Oregon Wave Energy Trust, Portland, OR, USA: p. 40.
- Thuringer, P. and R. Reidy (2006). Summary Report on Environmental Monitoring Related to the Pearson College—ENCANA—Clean Current Tidal Power Demonstration Project at Race Rocks Ecological Reserve: Final Report. Archipelago Marine Research Ltd., Victoria, BC, Canada: p. 54.
- Tiano, J. C., K. J. van der Reijden, S. O’Flynn, O. Beauchard, S. van der Ree, J. van der Wees, T. Ysebaert and K. Soetaert (2020). Experimental bottom trawling finds resilience in large-bodied infauna but vulnerability for epifauna and juveniles in the Frisian Front. Marine Environmental Research, 159: 104964.
- Tidal Lagoon Swansea Bay plc (2014). Swansea Bay Tidal Lagoon Adaptive Environmental Management Plan—Revision 4. Tidal Lagoon Power, Swansea, Wales, UK: p. 212.
- Todd, V. L. G., E. W. Lavallin and P. I. Macreadie (2018). Quantitative analysis of fish and invertebrate assemblage dynamics in association with a North Sea oil and gas installation complex. Marine Environmental Research, 142: 69–79.
- Todd, V. L. G., L. D. Williamson, S. E. Cox, I. B. Todd and P. I. Macreadie (2020). Characterizing the first wave of fish and invertebrate colonization on a new offshore petroleum platform. ICES Journal of Marine Science, 77(3): 1127–1136.
- Tolimieri, N., M. E. Clarke, J. Clemons, W. Wakefield and A. Powell (2020). The abundance and habitat use of demersal fishes on a rocky offshore bank using the ROPOS remotely operated vehicle. Deep Sea Research Part I: Oceanographic Research Papers, 157: 103193.
- Uhlenkott, K., A. Vink, T. Kuhn and P. Martínez Arbizu (2020). Predicting meiofauna abundance to define preservation and impact zones in a deep-sea mining context using random forest modelling. Journal of Applied Ecology, 57(7): 1210–1221.
- Umehara, A., S. Nakai, T. Okuda, M. Ohno and W. Nishijima (2019). Benthic quality assessment using M-AMBI in the Seto Inland Sea, Japan. Marine Environmental Research, 148: 67–74.
- U.S. Department of Energy (DOE) (2012). Oregon State University and Northwest National Marine Renewable Energy Center Wave Energy Test Project—Final Environmental Assessment. US Department of Energy (DOE), DOE/EA-1917, Golden, CO, USA: p. 166.
- van Deurs, M., T. M. Grome, M. Kaspersen, H. Jensen, C. Stenberg, T. K. Sørensen, J. Støttrup, T. Warnar and H. Mosegaard (2012). Short- and long-term effects of an offshore wind farm on three species of sandeel and their sand habitat. Marine Ecology Progress Series, 458: 169–180.
- van Hal, R., A. B. Griffioen and O. A. van Keeken (2017). Changes in fish communities on a small spatial scale, an effect of increased habitat complexity by an offshore wind farm. Marine Environmental Research, 126: 26–36.
- Van Hoey, G., S. N. R. Birchenough and K. Hostens (2014). Estimating the biological value of soft-bottom sediments with sediment profile imaging and grab sampling. Journal of Sea Research 86: 1–12.
- Verdant Power (2019). Roosevelt Island Tidal Energy Project FERC No. P-12611 Article 401 RMEE Plan Amendments. Verdant Power LLC, New York, NY, USA: p. 168.
- Waggitt, J. J., P. W. Cazenave, R. Torres, B. J. Williamson and B. E. Scott (2016). Quantifying pursuit-diving seabirds’ associations with fine-scale physical features in tidal stream environments. Journal of Applied Ecology, 53: 1653–1666.
- Want, A., R. Crawford, J. Kakkonen, G. Kiddie, S. Miller, R. E. Harris and J. S. Porter (2017). Biodiversity characterisation and hydrodynamic consequences of marine fouling communities on marine renewable energy infrastructure in the Orkney Islands Archipelago, Scotland, UK. Biofouling, 33(7): 567–579.
- Wetz, J. J., M. J. Ajemian, B. Shipley and G. W. Stunz (2020). An assessment of two visual survey methods for documenting fish community structure on artificial platform reefs in the Gulf of Mexico. Fisheries Research, 225: 105492.
- Wilhelmsson, D., T. Malm and M. C. Öhman (2006). The influence of offshore windpower on demersal fish. ICES Journal of Marine Science, 63: 775–784.
- Williamson, B., S. Fraser, L. Williamson, V. Nikora and B. Scott (2019). Predictable changes in fish school characteristics due to a tidal turbine support structure. Renewable Energy, 141: 1092–1102.
- Williamson, B. J., S. Fraser, P. Blondel, P. S. Bell, J. J. Waggitt and B. E. Scott (2017). Multisensor Acoustic Tracking of Fish and Seabird Behavior Around Tidal Turbine Structures in Scotland. IEEE Journal of Oceanic Engineering, 42(4): 948–965.
- Wilson, S. J., T. J. Fredette, J. D. Germano, J. A. Blake, P. L. Neubert and D. A. Carey (2009). Plan-view photos, benthic grabs, and sediment-profile images: Using complementary techniques to assess response to seafloor disturbance. Marine Pollution Bulletin, 59(1–3): 26–37.
- Zhulay, I., K. Iken, P. E. Renaud and B. A. Bluhm (2019). Epifaunal communities across marine landscapes of the deep Chukchi Borderland (Pacific Arctic). Deep Sea Research Part I: Oceanographic Research Papers, 151: 103065.
References
- European Parliament and European Council. Water Framework Directive 2000/06/EC; OJL 3277, 22.12.2000; European Parliament and European Council: Brussels, Belgium, 2000; p. 73. [Google Scholar]
- European Parliament and European Council. Habitat Directive 92/43/EEC; OJL 206, 22.7.1992; European Parliament and European Council: Brussels, Belgium, 1992; p. 50. [Google Scholar]
- European Parliament and European Council. Marine Strategy Framework Directive 2008/56/EC; OJL 164, 25.6.2008; European Parliament and European Council: Brussels, Belgium, 2008; p. 40. [Google Scholar]
- Clean Water Act of 1972. 33 U.S.C. § 1251 et seq, 1972.
- Endangered Species Act of 1973. 16 U.S.C. ch. 35 § 1531 et seq, 1973.
- Fish and Wildlife Coordination Act of 1980. 16 USC § 2901 et seq, 1980.
- Magnuson-Stevens Fishery Conservation and Management Act of 2007. 16 USC § 1801 et seq, 2007.
- Bender, A.; Francisco, F.G.; Sundberg, J. A review of methods and models for environmental monitoring of marine renewable energy. In Proceedings of the European Wave and Tidal Energy Conference (EWTEC), Cork, Ireland, 27 August–1 September 2017. [Google Scholar]
- Hemery, L.G. 2020 State of the Science Report, Chapter 6: Changes in Benthic and Pelagic Habitats Caused by Marine Renewable Energy Devices; Copping, A.E., Hemery, L.G., Eds.; Ocean Energy Systems (OES): Richland, WA, USA, 2020; pp. 104–125. [Google Scholar]
- Gray, J.S.; Elliott, M. Ecology of Marine Sediments: From Science to Management, 2nd ed.; Oxford University Press: Oxford, UK, 2009. [Google Scholar]
- Holte, B.; Buhl-Mortensen, L. Does grab size influence sampled macrofauna composition? A test conducted on deep-sea communities in the northeast Atlantic. Mar. Environ. Res. 2020, 154, 104867. [Google Scholar] [CrossRef] [PubMed]
- Callaway, R. Historical Data Reveal 30-Year Persistence of Benthic Fauna Associations in Heavily Modified Waterbody. Front. Mar. Sci. 2016, 3, 141. [Google Scholar] [CrossRef] [Green Version]
- Grimm, V.; Wissel, C. Babel, or the ecological stability discussions: An inventory and analysis of terminology and a guide for avoiding confusion. Oecologia 1997, 109, 323–334. [Google Scholar] [CrossRef] [PubMed]
- Kingsford, M.; Battershill, C. Studying Temperate Environments; Canterbury University Press: Christchurch, New Zealand, 1998; p. 335. [Google Scholar]
- Hubert, W.A.; Pope, K.L.; Dettmers, J.M. Passive Capture Techniques, 3rd ed.; Zale, A.V., Parrish, D.L., Sutton, T.M., Eds.; American Fisheries Society: Bethesda, MD, USA, 2012. [Google Scholar]
- Thistle, D. The Deep-Sea Floor: An Overview. In Ecosystems of the Deep Oceans; Tyler, P.A., Ed.; Elsevier Science B.V.: Amsterdam, The Netherlands, 2002; pp. 5–37. [Google Scholar]
- Birchenough, S.N.R.; Boyd, S.E.; Coggan, R.A.; Limpenny, D.S.; Meadows, W.J.; Rees, H.L. Lights, camera and acoustics: Assessing macrobenthic communities at a dredged material disposal site off the North East coast of the UK. J. Mar. Syst. 2006, 62, 204–216. [Google Scholar] [CrossRef]
- International Organization for Standardization (ISO). Water Quality–Guidelines for Quantitative Sampling and Sample Processing of Marine Soft-Bottom Macrofauna; ISO: Geneva, Switzerland, 2014; p. 40. [Google Scholar]
- International Organization for Standardization (ISO). Water Quality–Guidance on Marine Biological Surveys of Hard-Substrate Communities; ISO: Geneva, Switzerland, 2007; p. 28. [Google Scholar]
- Environmental Protection Agency (EPA). Evaluation of Dredged Material Proposed for Discharge in Waters of the U.S.–Testing Manual; U.S. EPA: Washington, DC, USA, 1998; p. 176.
- Environmental Protection Agency (EPA). Guidance on Choosing a Sampling Design for Environmental Data Collection for Use in Developing a Quality Assurance Project Plan; U.S. EPA: Washington, DC, USA, 2002; p. 178.
- Minerals Management Service (MMS). Notice to Lessees and Operators (NTL) of Federal Oil and Gas Leases in the Pacific Outer Continental Shelf Region–Biological Survey and Report Requirements; U.S. MMS: Sterling, VI, USA, 2006; p. 8.
- Minerals Management Service (MMS). Notice to Lessees and Operators of Federal Oil, Gas and Sulphur Leases and Pipeline Right-of-Way Holders in the Outer Continental Shelf, Gulf of Mexico OCS Region–Shallow Hazards Program; U.S. MMS: New Orleans, LA, USA, 2008; p. 18.
- Minerals Management Service (MMS). Notice to Lessees and Operators of Federal Oil, Gas and Sulphur Leases and Pipeline Right-of-Way Holders in the Outer Continental Shelf, Gulf of Mexico OCS Region–Biologically-Sensitive Underwater Features and Areas; U.S. MMS: New Orleans, LA, USA, 2009; p. 22.
- Minerals Management Service (MMS). Notice to Lessees and Operators of Federal Oil, Gas and Sulphur Leases and Pipeline Right-of-Way Holders in the Outer Continental Shelf, Gulf of Mexico OCS Region–Deepwater Benthic Communities; U.S. MMS: New Orleans, LA, USA, 2009; p. 9.
- Bureau of Ocean Energy Management (BOEM). Guidelines for Providing Benthic Habitat Survey Information for Renewable Energy Development on the Atlantic Outer Continental Shelf Pursuant to 30 CFR Part 585; U.S. BOEM: Sterling, VI, USA, 2019; p. 9.
- Bureau of Ocean Energy Management (BOEM). Guidelines for Providing Information on Fisheries for Renewable Energy Development on the Atlantic Outer Continental Shelf Pursuant to 30 CFR Part 585; U.S. BOEM: Sterling, VI, USA, 2019; p. 14.
- Bureau of Ocean Energy Management (BOEM). Guidelines for Providing Geophysical, Geotechnical, and Geohazard Information Pursuant to 30 CFR Part 585; U.S. BOEM: Sterling, VI, USA, 2020; p. 32.
- Centre for Environment Fisheries and Aquaculture Science (CEFAS). Guidelines for the Conduct of Benthic Studies at Aggregate Dredging Sites; Burnham Laboratory: Burnham-on-Crouch, UK, 2002; p. 199. [Google Scholar]
- Centre for Environment Fisheries and Aquaculture Science (CEFAS). Guidelines for Data Acquisition to Support Marine Environmental Assessments for Offshore Renewable Energy Projects; CEFAS contract report ME5403-Modul 15; CEFAS, Lowestoft: Suffolk, UK, 2011; p. 97. [Google Scholar]
- Davies, J.; Baxter, J.; Bradley, M.; Connor, D.; Khan, J.; Murray, E.; Sanderson, W.; Turnbull, C.; Vincent, M. Marine Monitoring Handbook; Joint Nature Conservation Committee: Peterborough, UK, 2001. [Google Scholar]
- Garel, E.; Rey, C.C.; Ferreira, Ó.; van Koningsveld, M. Applicability of the “Frame of Reference” approach for environmental monitoring of offshore renewable energy projects. J. Environ. Manag. 2014, 141, 16–28. [Google Scholar] [CrossRef] [Green Version]
- Gonzalez, S.; Horne, J.K.; Ward, E. Temporal variability in pelagic biomass distributions at wave and tidal sites and implications for standardization of biological monitoring. Int. Mar. Energy J. 2019, 2, 15–28. [Google Scholar] [CrossRef]
- Copping, A.E.; Gorton, A.M.; Freeman, M.C.; Rose, D.; Farr, H. Data Transferability and Collection Consistency in Marine Renewable Energy: An Update to the 2018 Report; PNNL-27995 Rev. 1; Pacific Northwest National Lab.(PNNL): Richland, WA, USA, 2020; p. 49.
- Dempster, T.; Sanchez-Jerez, P.; Bayle-Sempere, J.T.; Gimenez-Casalduero, F.; Valle, C. Attraction of wild fish to sea-cage fish farms in the south-western Mediterranean Sea: Spatial and short-term temporal variability. Mar. Ecol. Prog. Ser. 2002, 242, 237–252. [Google Scholar] [CrossRef]
- Greene, H.G. Habitat characterization of a tidal energy site using an ROV: Overcoming difficulties in a harsh environment. Cont. Shelf Res. 2015, 106, 85–96. [Google Scholar] [CrossRef]
- Mack, L.; Attila, J.; Aylagas, E.; Beermann, A.; Borja, A.; Hering, D.; Kahlert, M.; Leese, F.; Lenz, R.; Lehtiniemi, M.; et al. A synthesis of marine monitoring methods with the potential to enhance the status assessment of the Baltic Sea. Front. Mar. Sci. 2020, 7, 823. [Google Scholar] [CrossRef]
- Thomas, R. Marine Biology: An Ecological Approach; ED-Tech Press: Waltham Abbey Essex, UK, 2019. [Google Scholar]
- Whiting, J.M.; Copping, A.E.; Freeman, M.C.; Woodbury, A.E. Tethys knowledge management system: Working to advance the marine renewable energy industry. Int. Mar. Energy J. 2019, 2, 29–38. [Google Scholar] [CrossRef]
- Copping, A.E.; Sather, N.; Hanna, L.; Whiting, J.; Zydlewski, G.; Staines, G.; Gill, A.; Hutchison, I.; O’Hagan, A.M.; Simas, T.; et al. Annex IV 2016 State of the Science Report: Environmental Effects of Marine Renewable Energy Development around the World; Ocean Energy Systems (OES): Richland, WA, USA, 2016; p. 224. [Google Scholar]
- Copping, A.E.; Hemery, L.G. OES-Environmental 2020 State of the Science Report: Environmental Effects of Marine Renewable Energy Development around the World; Ocean Energy Systems (OES): Richland, WA, USA, 2020; p. 327. [Google Scholar]
- Love, M.S.; Nishimoto, M.M.; Snook, L.; Kui, L. An analysis of the sessile, structure-forming invertebrates living on California oil and gas platforms. Bull. Mar. Sci. 2019, 95, 583–596. [Google Scholar] [CrossRef]
- Schutter, M.; Dorenbosch, M.; Driessen, F.M.F.; Lengkeek, W.; Bos, O.G.; Coolen, J.W.P. Oil and gas platforms as artificial substrates for epibenthic North Sea fauna: Effects of location and depth. J. Sea Res. 2019, 153, 101782. [Google Scholar] [CrossRef]
- Todd, V.L.G.; Lavallin, E.W.; Macreadie, P.I. Quantitative analysis of fish and invertebrate assemblage dynamics in association with a North Sea oil and gas installation complex. Mar. Environ. Res. 2018, 142, 69–79. [Google Scholar] [CrossRef]
- McIlvenny, J.; Tamsett, D.; Gillibrand, P.; Goddijn-Murphy, L. On the Sediment Dynamics in a Tidally Energetic Channel: The Inner Sound, Northern Scotland. J. Mar. Sci. Eng. 2016, 4, 31. [Google Scholar] [CrossRef] [Green Version]
- Rosenberg, R.; Magnusson, M.; Nilsson, H.C. Temporal and spatial changes in marine benthic habitats in relation to the EU Water Framework Directive: The use of sediment profile imagery. Mar. Pollut. Bull. 2009, 58, 565–572. [Google Scholar] [CrossRef] [PubMed]
- Tiano, J.C.; van der Reijden, K.J.; O’Flynn, S.; Beauchard, O.; van der Ree, S.; van der Wees, J.; Ysebaert, T.; Soetaert, K. Experimental bottom trawling finds resilience in large-bodied infauna but vulnerability for epifauna and juveniles in the Frisian Front. Mar. Environ. Res. 2020, 159, 104964. [Google Scholar] [CrossRef] [PubMed]
- Meyer-Gutbrod, E.L.; Love, M.S.; Claisse, J.T.; Page, H.M.; Schroeder, D.M.; Miller, R.J. Decommissioning impacts on biotic assemblages associated with shell mounds beneath southern California offshore oil and gas platforms. Bull. Mar. Sci. 2019, 95, 683–701. [Google Scholar] [CrossRef]
- Ajemian, M.J.; Wetz, J.J.; Shipley-Lozano, B.; Stunz, G.W. Rapid assessment of fish communities on submerged oil and gas platform reefs using remotely operated vehicles. Fish. Res. 2015, 167, 143–155. [Google Scholar] [CrossRef]
- Gates, A.R.; Horton, T.; Serpell-Stevens, A.; Chandler, C.; Grange, L.J.; Robert, K.; Bevan, A.; Jones, D.O.B. Ecological Role of an Offshore Industry Artificial Structure. Front. Mar. Sci. 2019, 6, 675. [Google Scholar] [CrossRef] [Green Version]
- Broadhurst, M.; Orme, C.D. Spatial and temporal benthic species assemblage responses with a deployed marine tidal energy device: A small scaled study. Mar. Environ. Res. 2014, 99, 76–84. [Google Scholar] [CrossRef] [PubMed]
- Hemery, L.G.; Henkel, S.K.; Cochrane, G.R. Benthic assemblages of mega epifauna on the Oregon continental margin. Cont. Shelf Res. 2018, 159, 24–32. [Google Scholar] [CrossRef]
- Krone, R.; Gutow, L.; Joschko, T.J.; Schroder, A. Epifauna dynamics at an offshore foundation–Implications of future wind power farming in the North Sea. Mar. Environ. Res. 2013, 85, 1–12. [Google Scholar] [CrossRef] [PubMed]
- Cochrane, G.R.; Hemery, L.G.; Henkel, S.K. Oregon OCS Seafloor Mapping: Selected Lease Blocks Relevant to Renewable Energy; U.S. Geological Survey Open-File Report 2017-1045 and Bureau of Ocean Energy Management OCS Study BOEM 2017-018; USGS: Reston, VI, USA, 2017; p. 57.
- HDR. Benthic Monitoring during Wind Turbine Installation and Operation at the Block Island Wind Farm, Rhode Island; OCS Study BOEM 2018-047; U.S. BOEM: Sterling, VI, USA, 2018; p. 155.
- Connor, D.W.; Allen, J.H.; Golding, N.; Howell, K.L.; Lieberknecht, L.M.; Northen, K.O.; Reker, J.B. The Marine Habitat Classification for Britain and Ireland; Version 04.05; Joint Nature Conservation Committee: Peterborough, UK, 2004; p. 49.
- Centre for Marine and Coastal Studies Ltd. (CMACS). Deep Green Project Holyhead Deep Benthic Technical Report; CMACS Ltd.: Eastham, UK, 2015; p. 106. [Google Scholar]
- Kregting, L.; Elsaesser, B.; Kennedy, R.; Smyth, D.; O’Carroll, J.; Savidge, G. Do Changes in Current Flow as a Result of Arrays of Tidal Turbines Have an Effect on Benthic Communities? PLoS ONE 2016, 11, e0161279. [Google Scholar] [CrossRef] [Green Version]
- Horne, J.; Jacques, D.; Parker-Stetter, S.; Linder, H.; Nomura, J. Evaluating Acoustic Technologies to Monitor Aquatic Organisms at Renewable Energy Sites: Final Report; BOEM 2014-057; U.S. BOEM: Sterling, VI, USA, 2013; p. 102.
- Ocean Renewable Power Company (ORPC) Maine. Cobscook Bay Tidal Energy Project: 2013 Environmental Monitoring Report; FERC PROJECT NO. P-12711-005; ORPC: Portland, ME, USA, 2014; p. 502. [Google Scholar]
- Foubister, L. EMEC Tidal Test Facility Fall of Warness Eday, Orkney: Environmental Statement; EMEC: Stromness, UK, 2005; p. 176. [Google Scholar]
- Bender, A.; Sundberg, J. Effects of Wave Energy Generators on Nephrops norvegicus. In Proceedings of the Asian Wave and Tidal Energy Conference (AWTEC), Taipei, Taiwan, 9–13 September 2018. [Google Scholar]
- Fields, S.; Henkel, S.; Roegner, G.C. Video sleds effectively survey epibenthic communities at dredged material disposal sites. Environ. Monit. Assess. 2019, 191, 404. [Google Scholar] [CrossRef] [PubMed] [Green Version]
- Pearce, B.; Fariñas-Franco, J.M.; Wilson, C.; Pitts, J.; deBurgh, A.; Somerfield, P.J. Repeated mapping of reefs constructed by Sabellaria spinulosa Leuckart 1849 at an offshore wind farm site. Cont. Shelf Res. 2014, 83, 3–13. [Google Scholar] [CrossRef]
- Van Hoey, G.; Birchenough, S.N.R.; Hostens, K. Estimating the biological value of soft-bottom sediments with sediment profile imaging and grab sampling. J. Sea Res. 2014, 86, 1–12. [Google Scholar] [CrossRef]
- O’Carroll, J.P.J.; Kennedy, R.M.; Creech, A.; Savidge, G. Tidal Energy: The benthic effects of an operational tidal stream turbine. Mar. Environ. Res. 2017, 129, 277–290. [Google Scholar] [CrossRef]
- Pattison, L.; Serrick, A.; Brown, C. Testing 360 Degree Imaging Technologies for Improved Animal Detection around Tidal Energy Installations; OERA: Halifax, NS, Canada, 2020; p. 97. [Google Scholar]
- Page, H.M.; Dugan, J.E.; Dugan, D.S.; Richards, J.B.; Hubbard, D.M. Effects of an offshore oil platform on the distribution and abundance of commercially important crab species. Mar. Ecol. Prog. Ser. 1999, 185, 47–57. [Google Scholar] [CrossRef]
- Thuringer, P.; Reidy, R. Summary Report on Environmental Monitoring Related to the Pearson College-ENCANA-Clean Current Tidal Power Demonstration Project at Race Rocks Ecological Reserve: Final Report; Archipelago Marine Research Ltd.: Victoria, BC, Canada, 2006; p. 54. [Google Scholar]
- Spanier, E.; Cobb, J.S.; Clancy, M. Impacts of remotely operated vehicles (ROVs) on the behavior of marine animals: An example using American lobsters. Mar. Ecol. Prog. Ser. 1994, 104, 257–266. [Google Scholar] [CrossRef]
- Stoner, A.W.; Ryer, C.H.; Parker, S.J.; Auster, P.J.; Wakefield, W.W. Evaluating the role of fish behavior in surveys conducted with underwater vehicles. Can. J. Fish. Aquat. Sci. 2008, 65, 1230–1243. [Google Scholar] [CrossRef]
- Cruz-Marrero, W.; Cullen, D.W.; Gay, N.R.; Stevens, B.G. Characterizing the benthic community in Maryland’s offshore wind energy areas using a towed camera sled: Developing a method to reduce the effort of image analysis and community description. PLoS ONE 2019, 14, e0215966. [Google Scholar] [CrossRef] [PubMed]
- Sheehan, E.V.; Bridger, D.; Nancollas, S.J.; Pittman, S.J. PelagiCam: A novel underwater imaging system with computer vision for semi-automated monitoring of mobile marine fauna at offshore structures. Environ. Monit. Assess. 2020, 192, 11. [Google Scholar] [CrossRef]
- Taylor, J.C.; Paxton, A.B.; Voss, C.M.; Sumners, B.; Buckel, C.A.; Vander Pluym, J.; Ebert, E.B.; Viehman, T.S.; Fegley, S.R.; Pickering, E.A.; et al. Benthic Habitat Mapping and Assessment in the Wilmington-East Wind Energy Call Area: Final Report; OCS Study BOEM 2016-003 and NOAA Technical Memorandum 196; U.S. BOEM: Sterling, VI, USA, 2016; p. 171.
- DP Energy Marine. West Islay Tidal Energy Park Environmental Statement; DP Marine Energy Ltd.: Buttevant, Ireland, 2013; p. 139. [Google Scholar]
- Foster-Smith & Foster-Smith. Kyle Rhea Benthic Video Survey; SeaGeneration (Kyle Rhea) Ltd.: Exeter, UK, 2012; p. 35. [Google Scholar]
- Soldal, A.V.; Svellingen, I.; Jorgensen, T.; Lokkeborg, S. Rigs-to-reefs in the North Sea: Hydroacoustic quantification of fish in the vicinity of a “semi-cold” platform. ICES J. Mar. Sci. 2002, 59, S281–S287. [Google Scholar] [CrossRef] [Green Version]
- Spencer, M.L.; Stoner, A.W.; Ryer, C.H.; Munk, J.E. A towed camera sled for estimating abundance of juvenile flatfishes and habitat characteristics: Comparison with beam trawls and divers. Estuar. Coast. Shelf Sci. 2005, 64, 497–503. [Google Scholar] [CrossRef]
- Oregon State University (OSU); Northwest National Marine Renewable Energy Center (NNMREC). Wave Energy Test Project-Final Environmental Assessment. Appendix E, Monitoring Plans; OSU: Corvallis, OR, USA, 2012; p. 18. [Google Scholar]
- Verdant Power. Benthic Habitat Characterization; FERC No. 12611; U.S. FERC: Washington, DC, USA, 2006; p. 97.
- Integral Consulting. Environmental Monitoring Program Report 2: Results of Phases I-IV; Shell Exploration & Production Company: Anchorage, AK, USA, 2017; p. 410. [Google Scholar]
- Revelas, E.C.; Jones, C.; Sackmann, B.; Maher, N. A Benthic Habitat Monitoring Approach for Marine and Hydrokinetic Sites; Final Technical Report United States 10.2172/1638512 GFO; Integral Consulting, Inc.: Seattle, WA, USA, 2020. [Google Scholar]
- Smokorowski, K.E.; Randall, R.G. Cautions on using the Before-After-Control-Impact design in environmental effects monitoring programs. FACETS 2017, 2, 212–232. [Google Scholar] [CrossRef] [Green Version]
- Methratta, E.T.; Dardick, W.R. Meta-analysis of finfish abundance at offshore wind farms. Rev. Fish. Sci. Aquac. 2019, 27, 242–260. [Google Scholar] [CrossRef]
- Punzo, E.; Strafella, P.; Scarcella, G.; Spagnolo, A.; De Biasi, A.M.; Fabi, G. Trophic structure of polychaetes around an offshore gas platform. Mar. Pollut. Bull. 2015, 99, 119–125. [Google Scholar] [CrossRef]
- Bailey, H.; Brookes, K.L.; Thompson, P.M. Assessing environmental impacts of offshore wind farms: Lessons learned and recommendations for the future. Aquat. Biosyst. 2014, 10, 8. [Google Scholar] [CrossRef] [Green Version]
- Ellis, J.I.; Schneider, D.C. Evaluation of a gradient sampling design for environmental impact assessment. Environ. Monit. Assess. 1997, 48, 157–172. [Google Scholar] [CrossRef]
- Aquatera Ltd. SSF Scapa Flow Sites Benthic ROV Survey St Margaret’s Hope; P584 Version 1; Aquatera Ltd.: Stromness, UK, 2015; p. 26. [Google Scholar]
- Argyll Tidal Limited. Environmental Appraisal (EA) for the Argyll Tidal Demonstrator Project; RES Ltd., East Kilbride: Lanarkshire, UK, 2013; p. 207. [Google Scholar]
- Sustainable Energy Authority of Ireland (SEAI). Chapter 6 Flora and Fauna. In Atlantic Marine Energy Test Site Environmental Impact Statement; Sustainable Energy Authority of Ireland: Dublin, Ireland, 2011; p. 40. [Google Scholar]
- Umehara, A.; Nakai, S.; Okuda, T.; Ohno, M.; Nishijima, W. Benthic quality assessment using M-AMBI in the Seto Inland Sea, Japan. Mar. Environ. Res. 2019, 148, 67–74. [Google Scholar] [CrossRef]
- Degraer, S.; Brabant, R.; Rumes, B.; Vigin, L. (Eds.) Environmental Impacts of Offshore Wind Farms in the Belgian Part of the North Sea: Marking a Decade of Monitoring, Research and Innovation; Royal Belgian Institute of Natural Sciences: Brussels, Belgium, 2019; p. 134. [Google Scholar]


| Field of Information | Description |
|---|---|
| Technology | Specific technology/gear used. |
| Source reviewed | Citation (reference) of document reviewed. |
| Document name | Name given to the document internally. |
| Study goal | Brief description of the general aim of the study in the document reviewed. |
| Site characteristics | Brief description of the site: depth, relative distance to shore, bottom type if known, current speed, etc. |
| Reason for selecting technology | Brief description, if provided, of why authors selected the technology. |
| Brand and model | If specified, the brand and model of technology used. |
| Characteristics | If provided, a list of specific characteristics such as size, penetration depth, frequency, resolution, etc. |
| Methods | Brief description of the steps used to implement the technology. |
| Sampling design | Numbers of stations, transects, replicates, and the like. |
| Data processing | Brief description of how samples were handled from collection to analysis of results. |
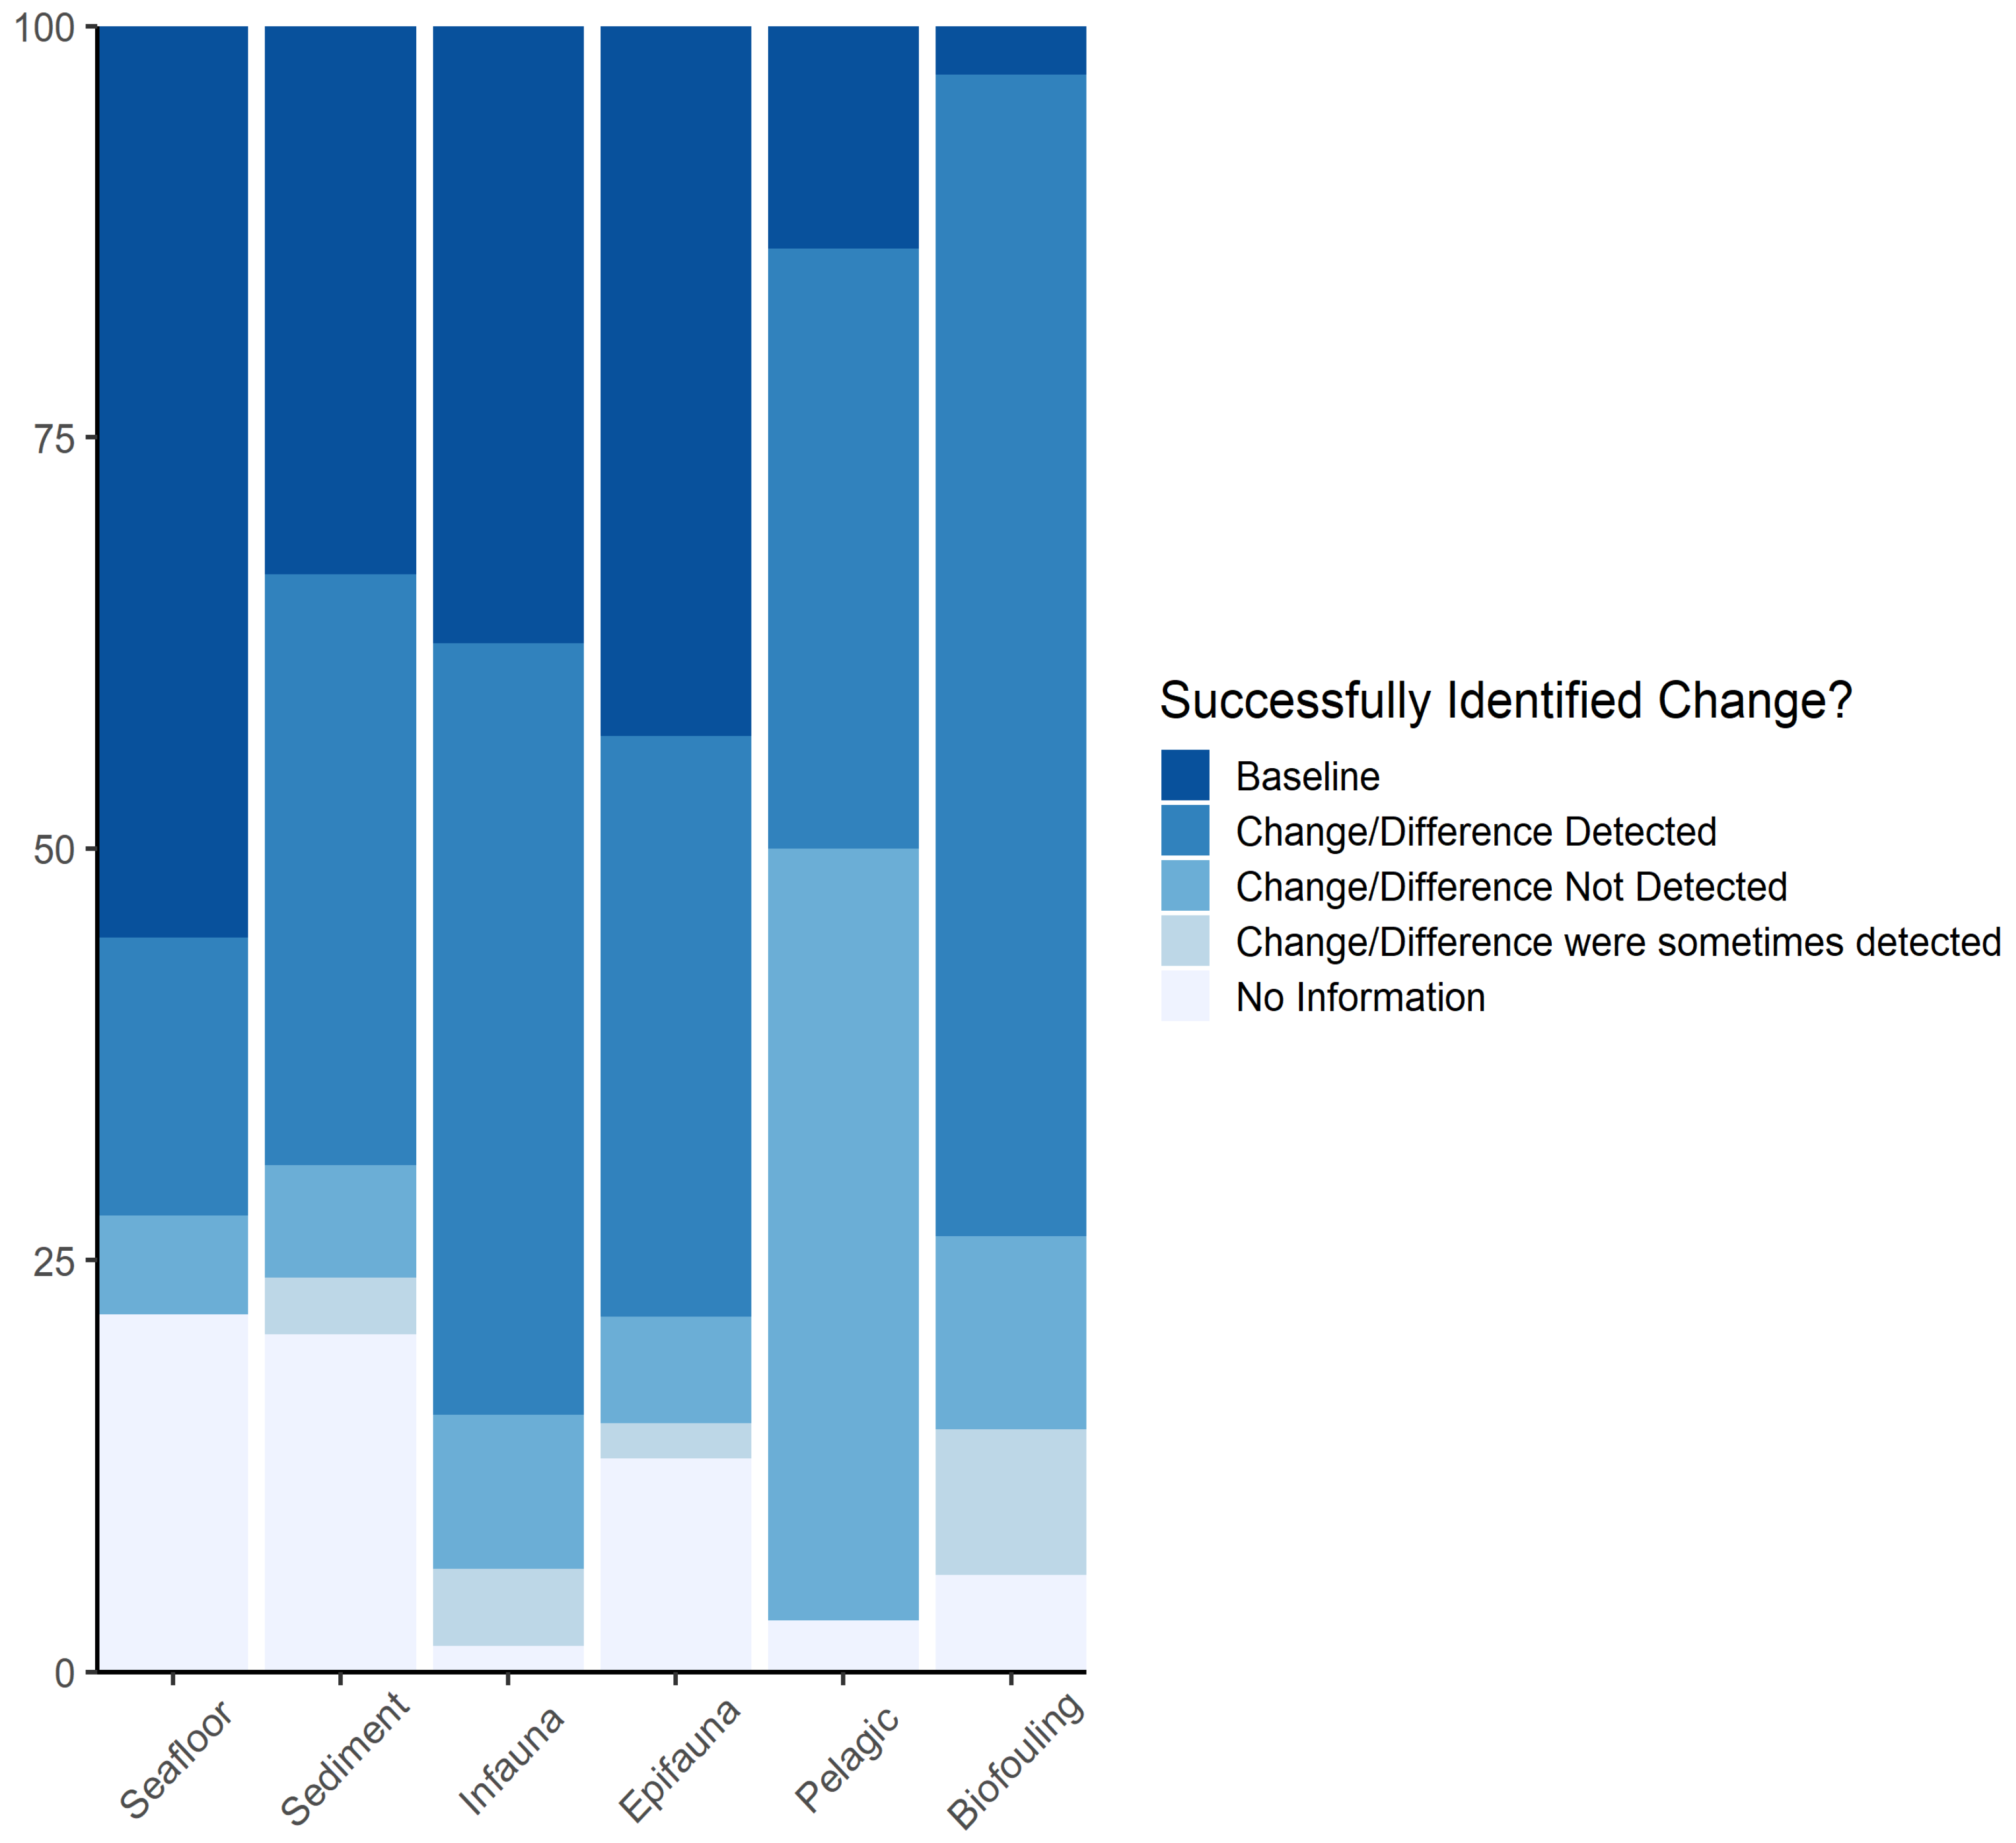
| Successful identification of change | Brief description of the differences observed and the timeline, if any spatial and/or temporal changes and/or differences in habitat were observed. |
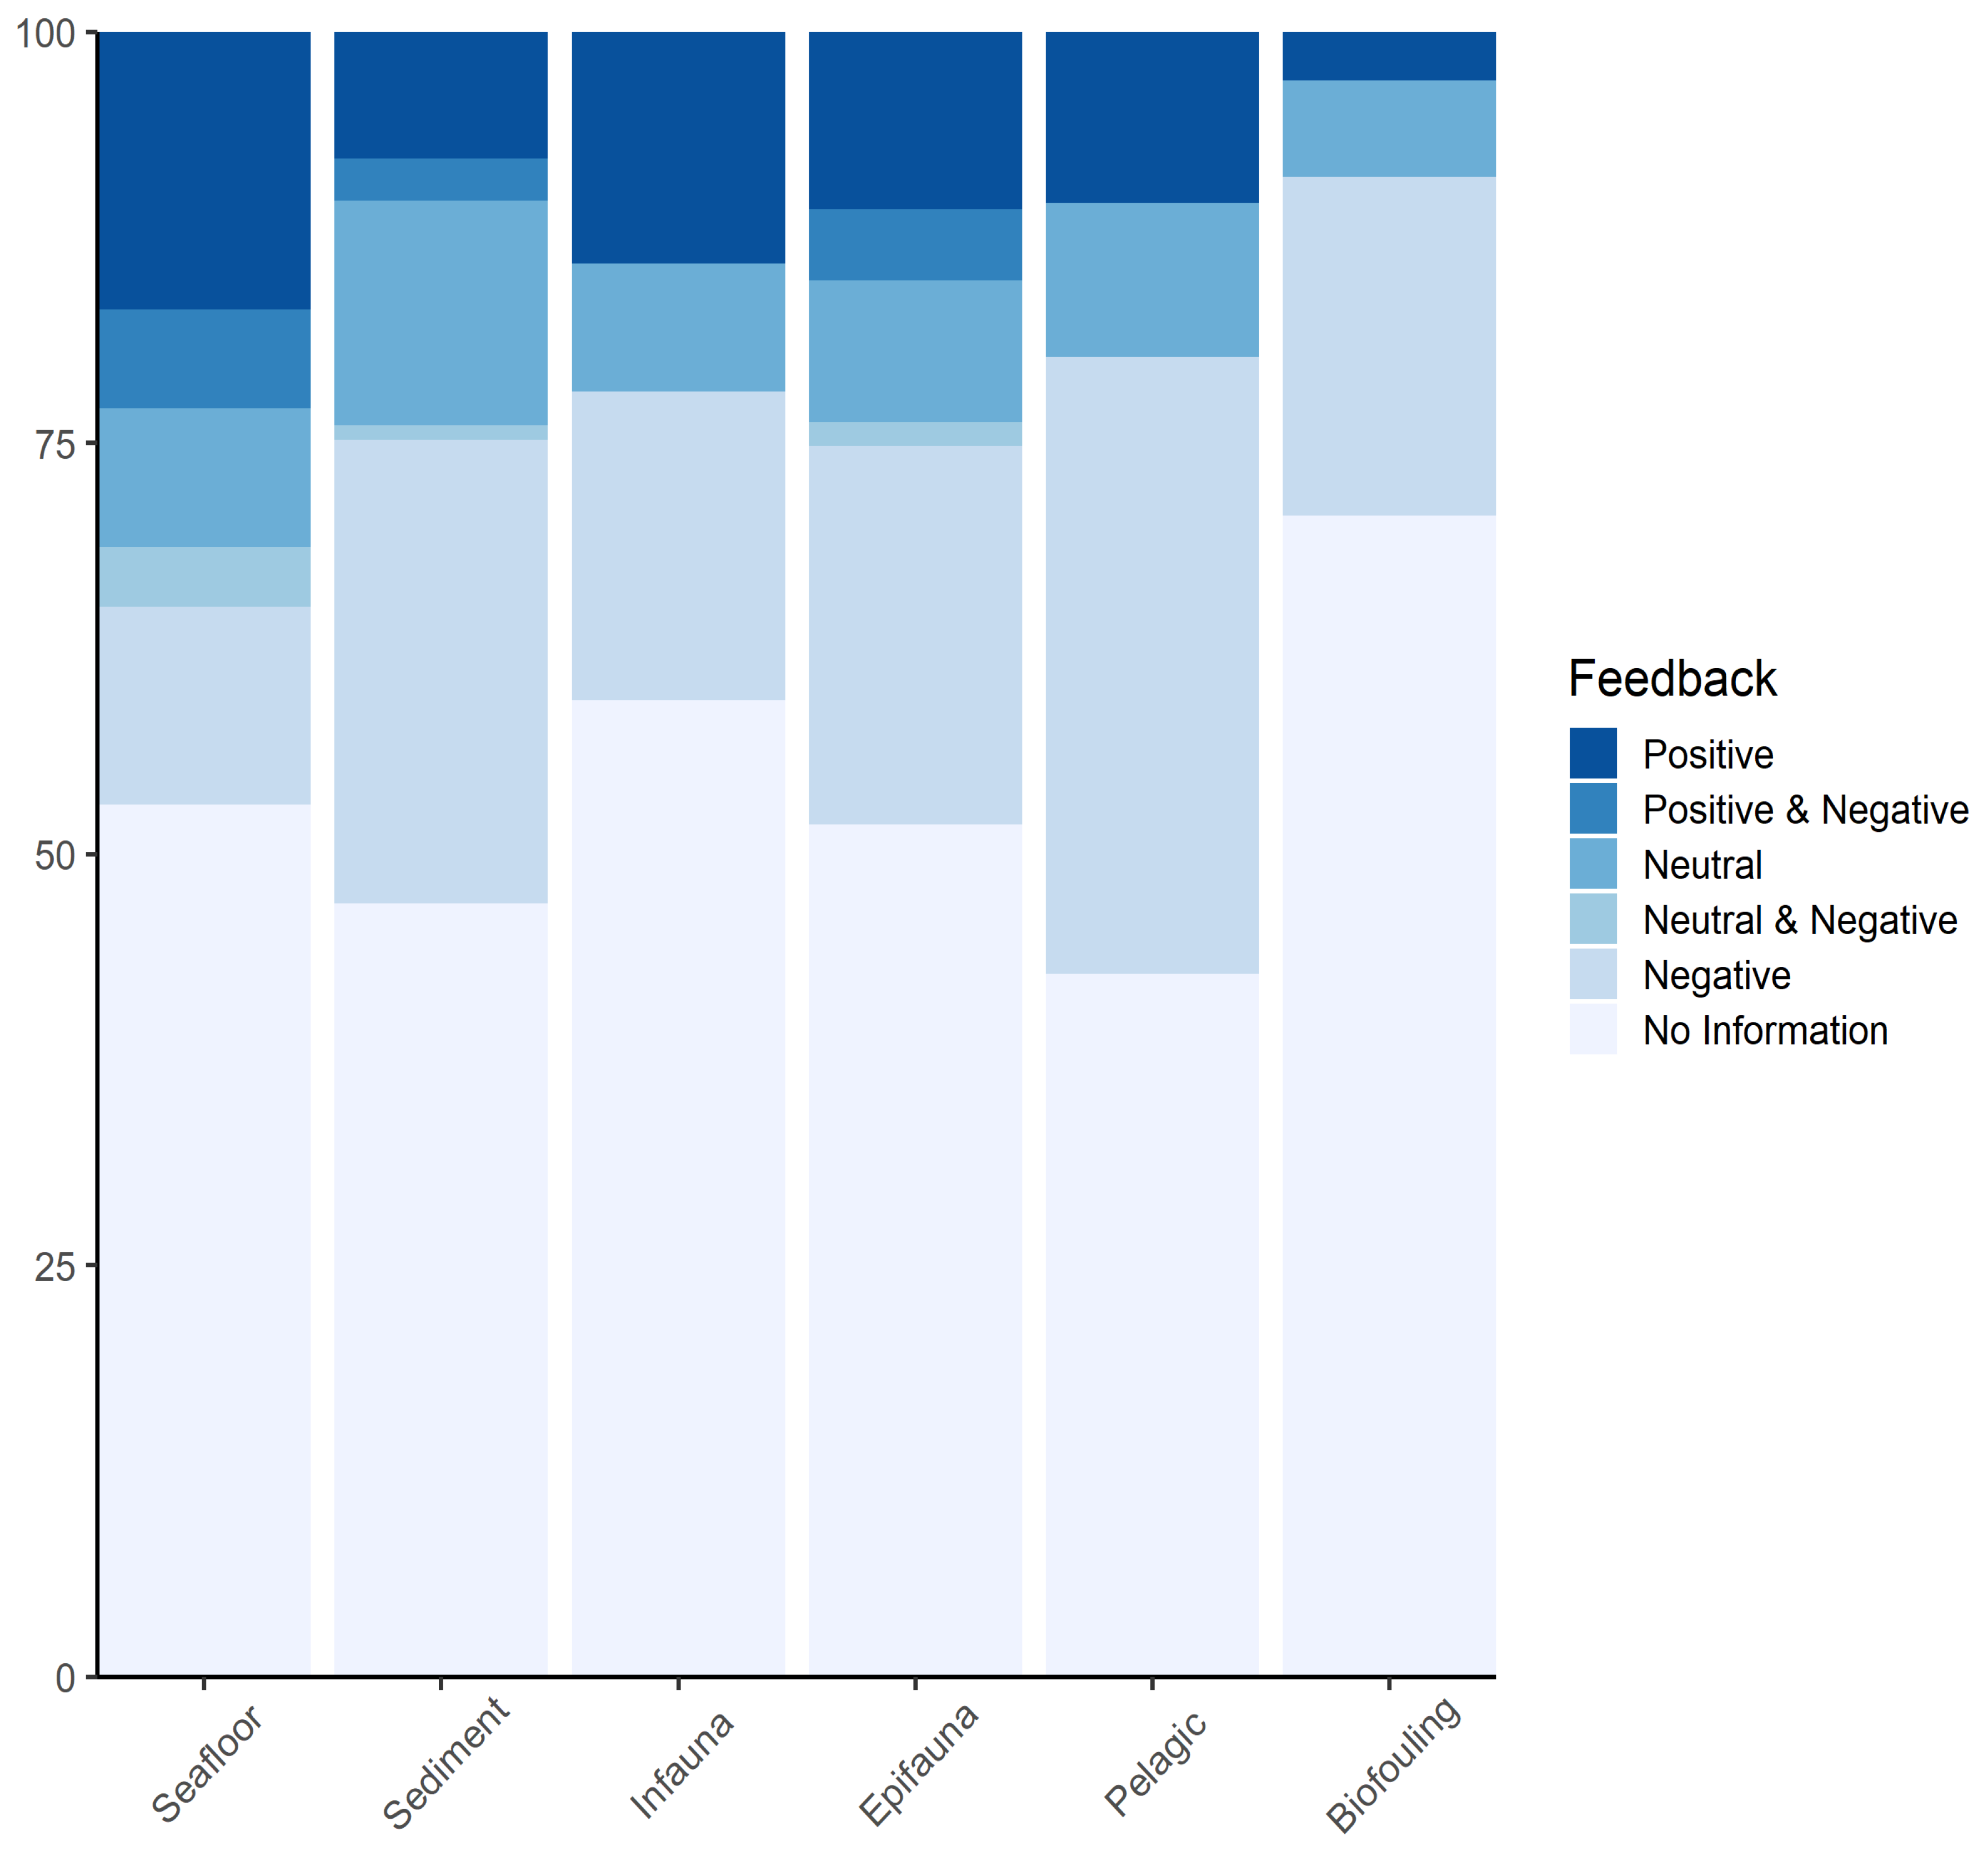
| Feedback after use | If provided, pros and cons of using the technology for achieving the study’s goal. |
| Usability for modeling | Note about whether the data obtained can be used for modeling (as dependent or independent variables). |
| Notes | Any additional notes upon reviewing documents. |
| Field of Information | Group Options |
|---|---|
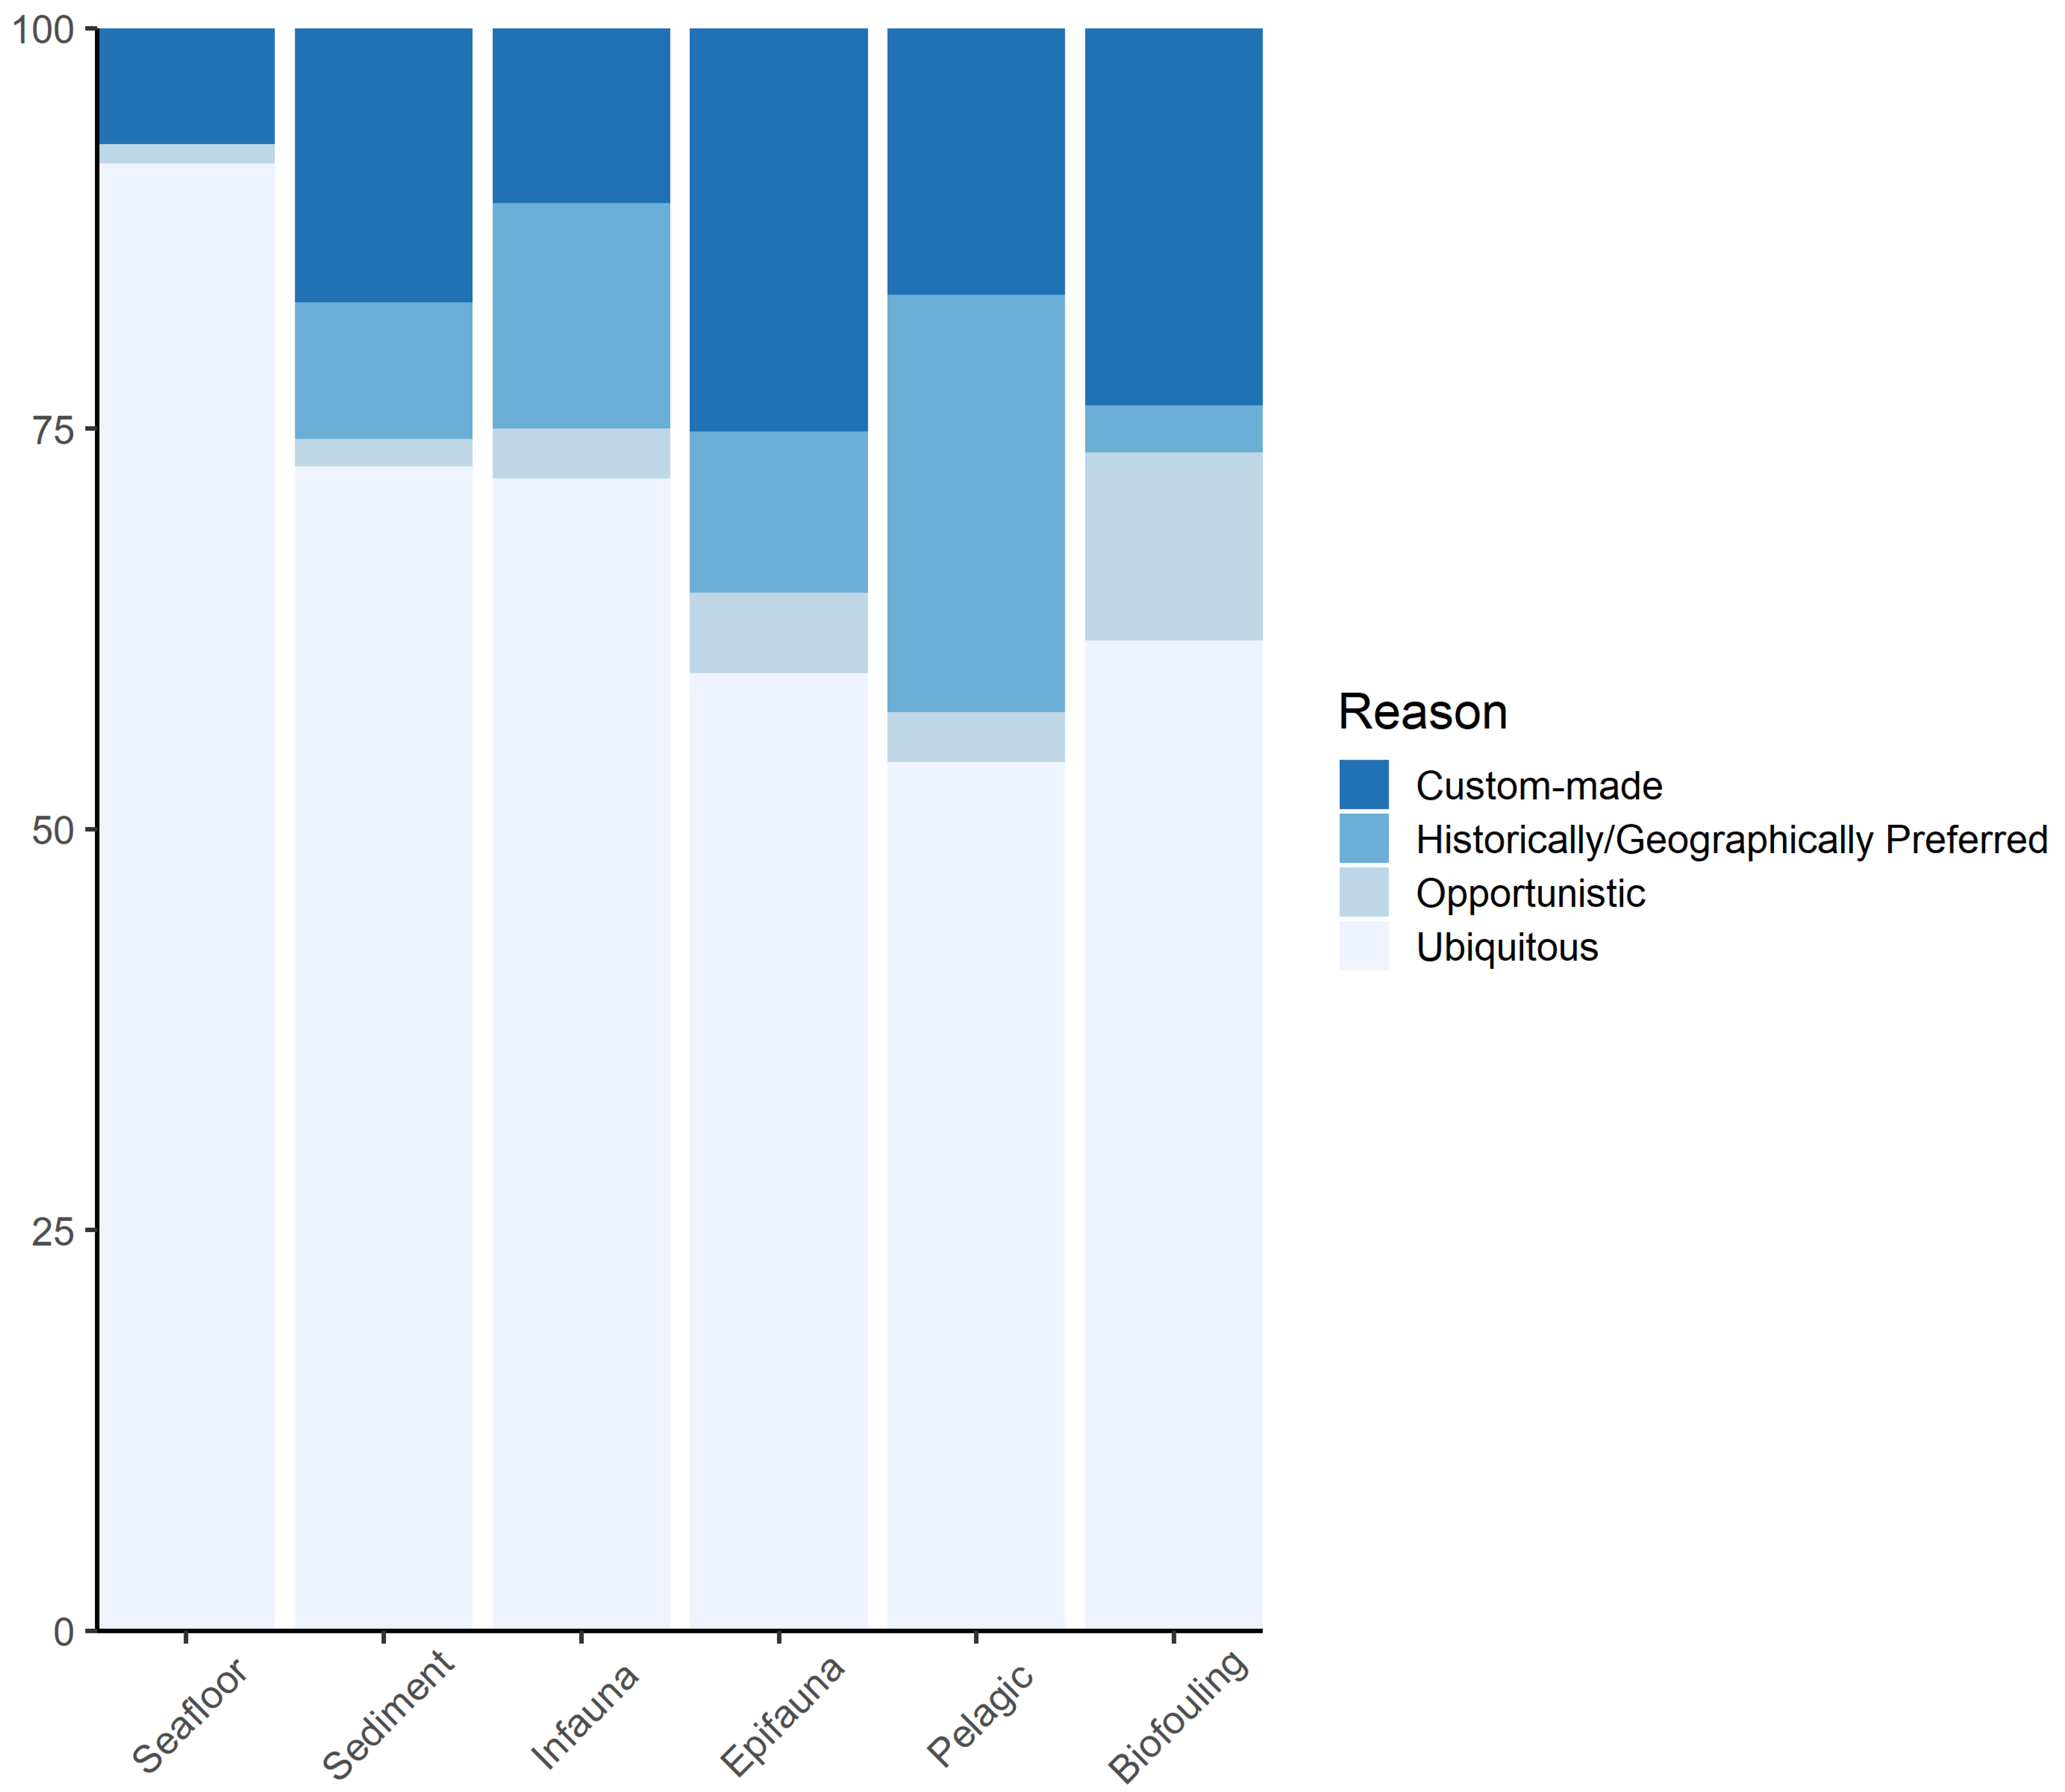
| Reason for selecting technology | Custom-made; historically or geographically preferred; opportunistic; ubiquitous. |
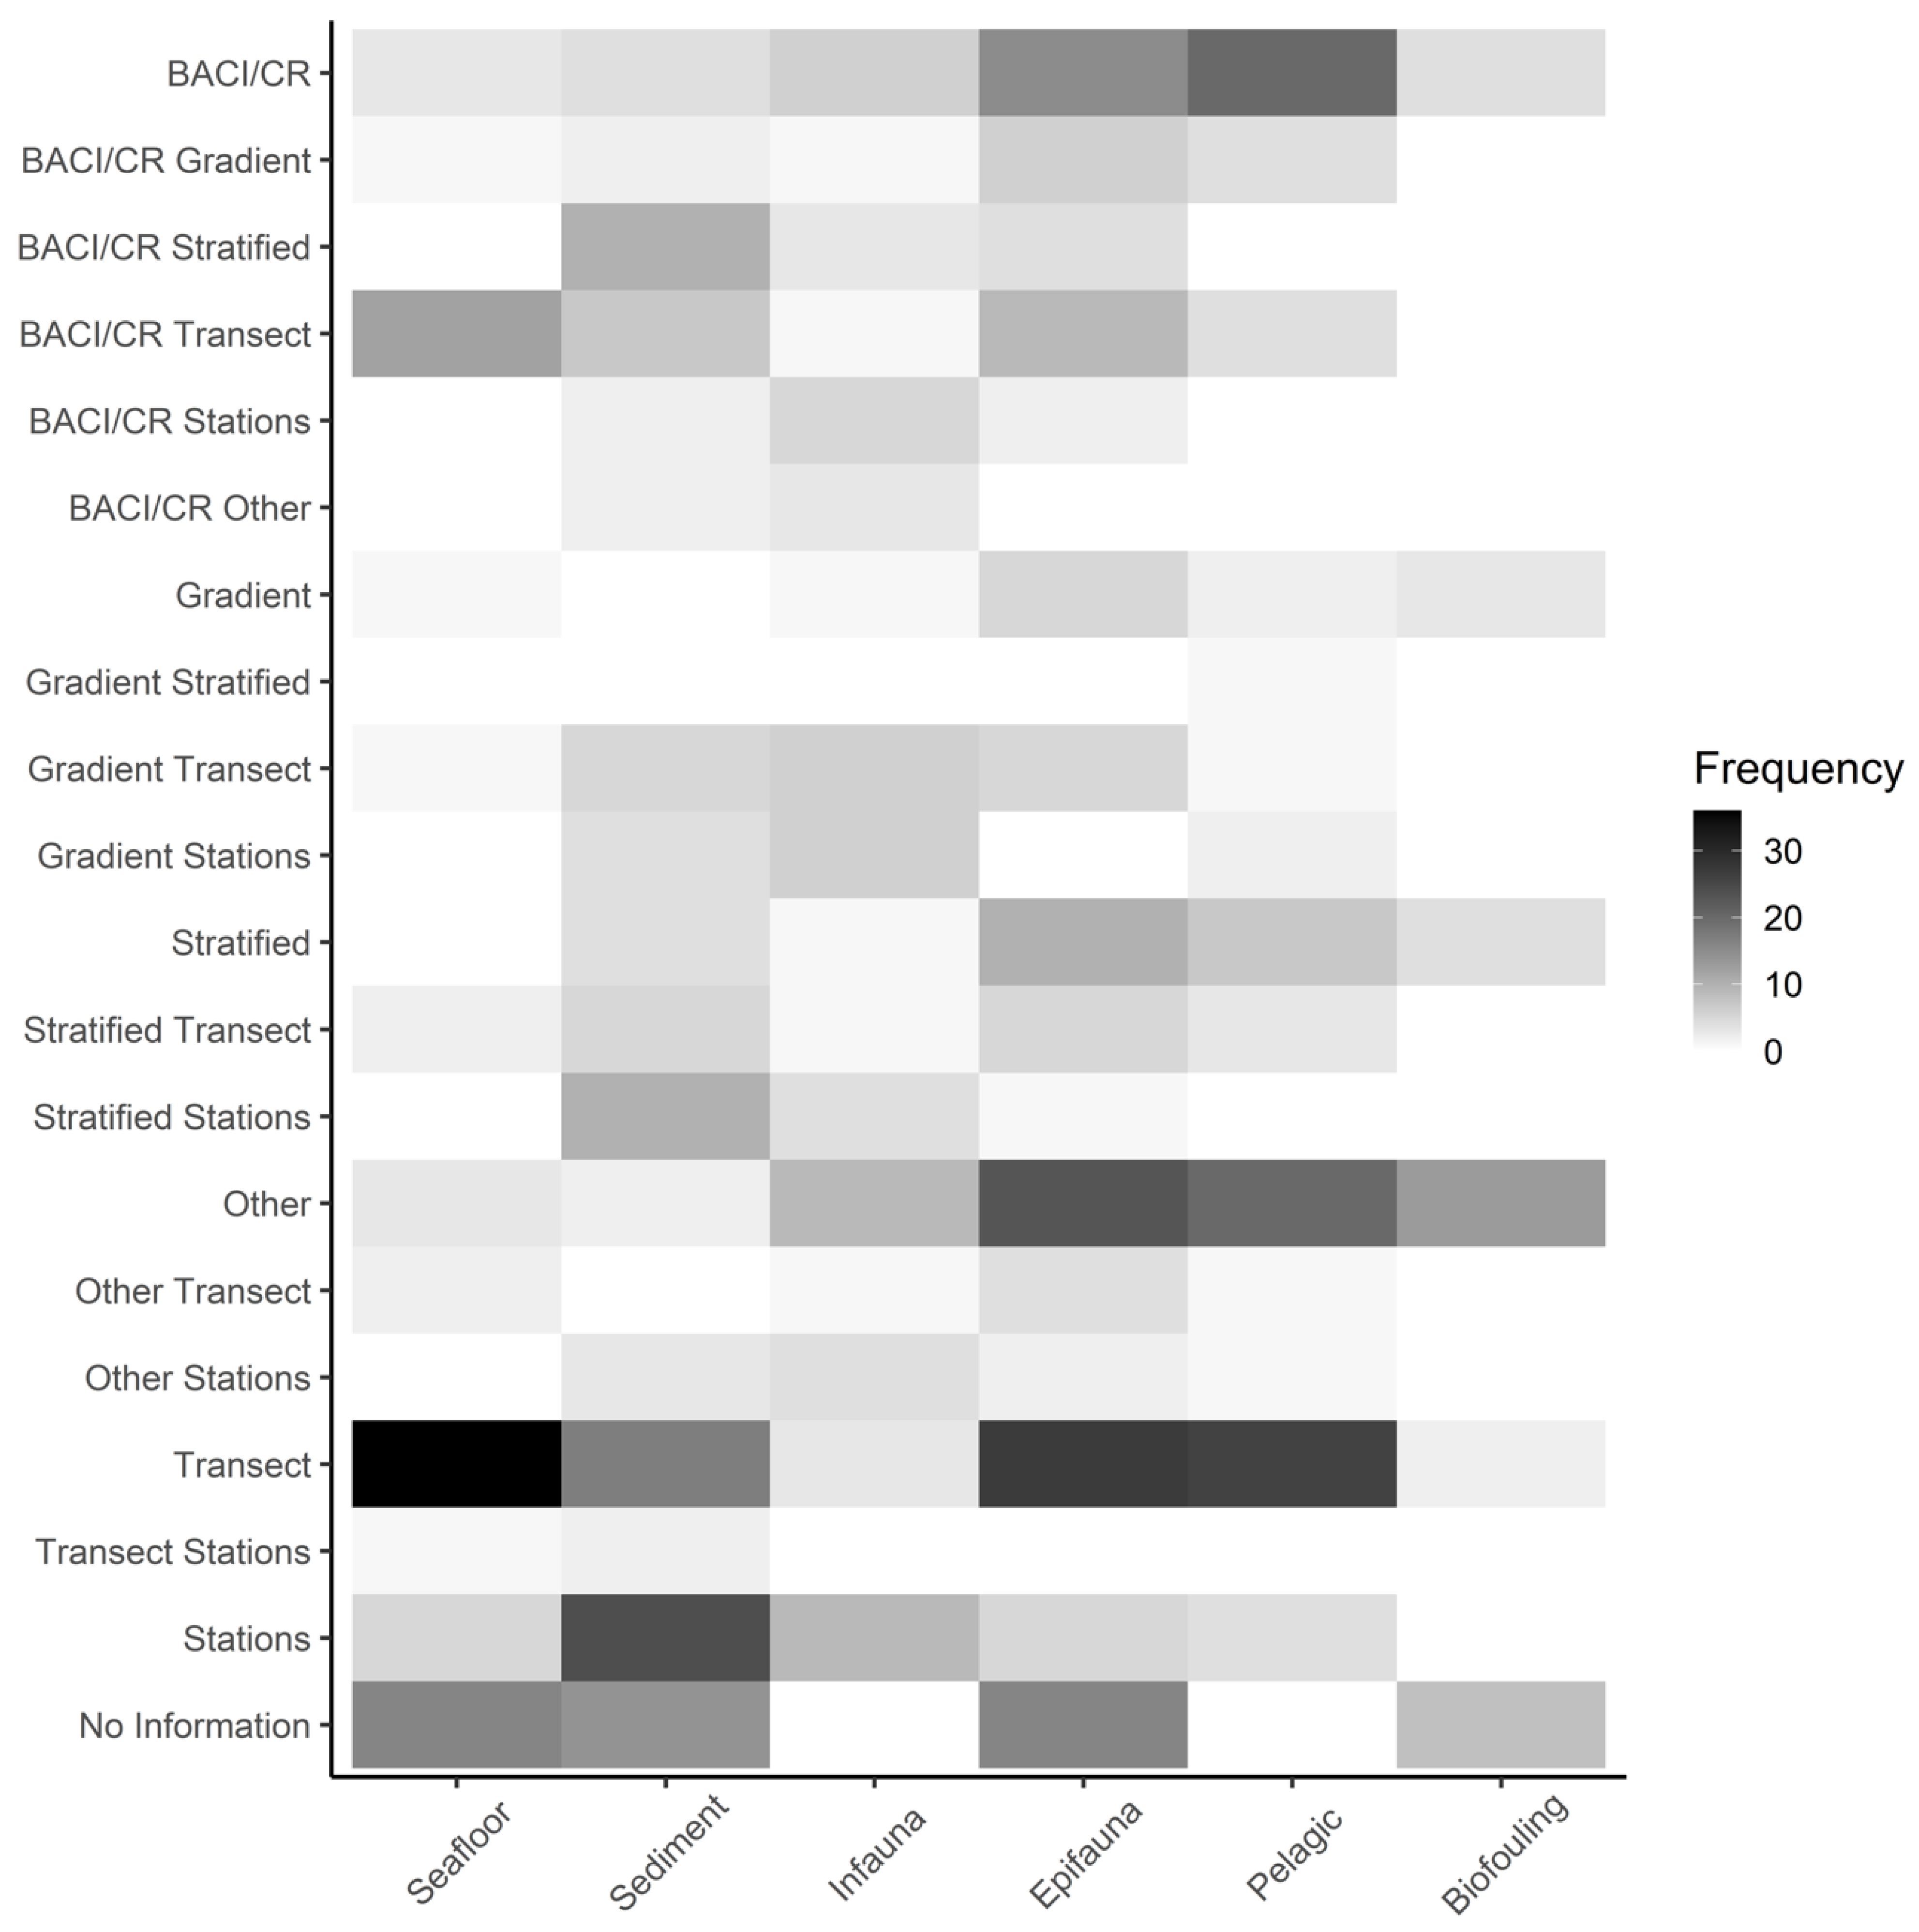
| Sampling design | Before after control impact or control/response; gradient; stratified; transects; stations; other; no information. |
| Successful identification of change | Baseline characterization; change/differences detected; no change/differences detected; no information. |
| Feedback after use | Positive; neutral; negative; no information. |
| Acoustic | Net and Trawl |
|---|---|
| Acoustic backscatter | Beam trawl |
| Acoustic camera | Benthic trawl |
| Acoustic Doppler current profiler [ADCP] | Bongo net |
| Acoustic Doppler velocimeter [ADV] | Box trawl |
| Acoustic ground-discrimination systems [AGDS] | Campelen trawl |
| Autonomous underwater vehicle [AUV] (+bathymetric sonar) | Drifting gillnet |
| Boomer seismic profiles | Electric pulse trawl |
| Compressed high intensity radar pulse [CHIRP] | Fyke net |
| Dual-frequency echosounder | Gill net |
| Fisheries echosounder | Hyperbenthic sledge |
| High-definition sonar (dual-frequency identification sonar) | Midwater trawler |
| Multibeam echosounder | Otter trawl |
| Multibeam sonar | Pelagic trawl |
| Passive acoustic telemetry | Plumb-staff beam trawl |
| Side-scan sonar | Riley push-net |
| Single-beam echosounder | Seine |
| Split-beam sonar | Semi-pelagic net trawl |
| Sub-bottom profiler | Split-beam trawl |
| Synthetic Aperture Sonars [SAS] | Trammel bottom net |
| Corer | Trap |
| Box corer | Amphipod trap |
| Circular box corer | Fish trap |
| Corer | Modified crab pot |
| Craib corer | Potting equipment |
| Diver (+corer) | Recruitment cage |
| Diver (+ pipe corer) | Trap |
| Diver (+ piston corer) | Visual |
| Gravity corer | 360-degree camera |
| Gray O’Hare box corer | Benthic video sled |
| HAPS corer | Baited remote underwater vehicle [BRUV] |
| Hessler–Sandia box corer | BRUV (+ stereo-video) |
| Modified Gray O’Hare box corer | Camera |
| Multicorer | Diver (+ photo) |
| Pipe corer | Diver (+ video) |
| Reineck box corer | Diver (+ visual) |
| Vibro corer | Drop camera |
| Dredge | HabCam bottom photos |
| Modified dredge | Hybrid AUV |
| Modified scallop dredge | Lagrangian floating imaging platform |
| Pipe dredge | Midwater video system |
| Triple-D dredge | Mounted underwater cameras |
| Grab | Photo |
| Day grab | Quadrats |
| Diver (+ manual dig) | Remotely operated vehicle [ROV] |
| Double Van Veen grab | ROV (+ stereo-video) |
| Ekman grab | Sediment profile imaging [SPI] |
| Hamon grab | SPI (+ plan view) |
| Mini-Hamon grab | SPIScan |
| Shipek grab | Submersible |
| Smith–McIntyre grab | Time-lapse photography |
| Ted Young-modified Van Veen grab | Towed camera |
| Van Veen grab | Onshore transect survey |
| Hook & Line | Onshore visual survey |
| Angling | Video |
| Surface longline | Video sled |
| Trolling line | Remote Sensing |
| Vertical longline | Light Detection and Ranging [LiDAR] |
| Scrape Samples | Other |
| Diver (+ scraper) | Clam rake |
| Free diver (+ scraper) | Diver (+ depth logger) |
| Scrape sample | Diver (+ sampling) |
| Plates | Fluorometer |
| Biofouling plate | Net bag via diver collection |
| Settlement plate | Niskin bottle + eDNA |
| Structure substitute (mesocosm experiment) | Penetrometer |
| Habitat | Technology Category | Most Common Analyses | Most Common Software |
|---|---|---|---|
| Seafloor | Acoustic | Benthic terrain modeler, digital elevation model | R (raster), HYPACK®/HYSWEEP®, CARIS HIPS & SIPS™, QPS Fledermaus Software, ArcGIS®/ArcVIEW® |
| Visual | Categorized by indices, PCA, generalized linear model | Image Analyst, BIIGLE 2.0, MATLAB, R, SigmaPlot | |
| Sediment | Acoustic | Benthic terrain modeler, digital elevation model | R (raster), HYPACK®/HYSWEEP®, CARIS HIPS & SIPS™, QPS Fledermaus Software, ArcGIS®/ArcVIEW® |
| Corer/Grab/Dredge | ANOVA, Tukey’s HSD post hoc, cluster, (n)MDS, ANOSIM, DISTLM, particle size analysis, PCA | PRIMER, R (vegan, random forest) | |
| Visual | Categorized by indices, PCA, generalized linear model | Image Analyst, BIIGLE 2.0, MATLAB, R, SigmaPlot | |
| Infauna | Corer/Grab/Dredge | ANOVA, Tukey’s HSD post hoc, cluster, (n)MDS, DIVERSE, SIMPER, SIMPROF, ANOSIM, DISTLM | PRIMER, R (vegan, random forest) |
| Visual | Categorized by indices, ANOVA, (n)MDS, DIVERSE, PCA, generalized linear model, SIMPROF, SIMPER, PERMDISP, PERMANOVA | Image Analyst, BIIGLE 2.0, MATLAB, PRIMER, R, SigmaPlot | |
| Epifauna | Acoustic | Generalized linear model, generalized additive model, ANOVA | Echoview Software, QPS Fledermaus Software, R, MATLAB |
| Net/Dredge | Cluster, ANOVA, Tukey’s HSD post hoc, (n)MDS, DIVERSE, SIMPER, SIMPROF, ANOSIM | PRIMER | |
| Plate/Scrape/Visual | PCA, (n)MDS, PERMANOVA, PERMDISP, ANOSIM, ANOVA, SIMPER, generalized linear model, Mann–Whitney U-tests | PRIMER, SigmaPlot, SPSS, EventMeasure Stereo, VLC media player, ImageJ | |
| Pelagic | Acoustic | Generalized linear model, generalized additive model, ANOVA | Echoview Software, QPS Fledermaus Software, R, MATLAB |
| Plate/Scrape/Visual | PCA, (n)MDS, PERMANOVA, PERMDISP, ANOSIM, ANOVA, SIMPER, generalized linear model, Mann–Whitney U-tests | PRIMER, SigmaPlot, SPSS, EventMeasure Stereo, VLC media player, ImageJ | |
| Biofouling | Plate/Scrape/Visual | PCA, (n)MDS, PERMANOVA, PERMDISP, ANOSIM, ANOVA, SIMPER, generalized linear model, Mann–Whitney U-tests | PRIMER, SigmaPlot, SPSS, EventMeasure Stereo, VLC media player, ImageJ |
| Technology | Habitat Category | Used in High Wave | Used in High Current | Limitations | Unwanted Impacts | Cost * | Analysis Software |
|---|---|---|---|---|---|---|---|
| Acoustic camera | Pelagic | Yes | Yes | Water turbidity and entrained air bubbles were noted to disrupt data | None if frequencies used are out of hearing thresholds for sensitive organisms | $35,000 to $85,000 | Manufacturer’s proprietary software or third-party software |
| ADCP | Pelagic | Yes | Yes | Water turbidity and entrained air bubbles can disrupt data, as well as lack of particles in extremely clear water. | None if frequencies used are out of hearing thresholds for sensitive organisms | $5000 to $30,000 | Manufacturer’s proprietary software or third-party software |
| Beam trawl | Epifauna | Dependent on sea state | Yes | Limited capability on hard bottom (risks of net getting caught on rocks) | Trawl contact with seafloor may leave deep scars | $500 to $2500 | Any statistical analysis software |
| Box corer | Sediment Infauna | Dependent on sea state | Yes, but use is targeted for slack tides or lower flow conditions. | Device weight needs to be sufficient to withstand currents and for adequate seafloor penetration; sediment characteristics will affect the ability of the technology to adequately collect samples | Bow wave may displace flocculent material and mobile fauna may disperse | $6000 to $55,000 | Any statistical analysis software |
| Day grab | Sediment Infauna | Dependent on sea state | Yes, but use is targeted for slack tides or lower flow conditions. | Device weight needs to be sufficient to withstand currents and for adequate seafloor penetration; sediment characteristics will affect the ability of the technology to adequately collect samples | None | $5000 to $10,500 | Any statistical analysis software |
| Diver (scuba or free) | Epifauna Pelagic Biofouling | Dependent on sea state | Yes, but use is targeted for slack tides or lower flow conditions. | High waves and current can impact safety | Diver motion may affect animals’ behavior | $500 to $4500 | Any image & statistical analysis software |
| Drop camera | Seafloor Sediment Epifauna | Dependent on sea state | Yes, but use is targeted for slack tides or lower flow conditions. | High waves and current can impact stability; high turbidity impact image quality | Associated lights may affect animals’ behavior | $350 to $15,000 | Any image & statistical analysis software |
| Fisheries echosounder | Pelagic | Yes | Yes | Water turbidity and entrained air bubbles can disrupt data; individual fish are hard to discern when they move in schools | None if frequencies used are out of hearing thresholds for sensitive organisms | $38,000 to $300,000 | Manufacturer’s proprietary software or third-party software |
| Multibeam echosounder | Seafloor | Yes | Yes | Requires low sea-states to produce higher quality data; can be used in conjunction with other devices for more accurate data | None if frequencies used are out of hearing thresholds for sensitive organisms | $100,000 to $450,000 | Manufacturer’s proprietary software or third-party software |
| Photo (out of water) | Biofouling | Not applicable | Not applicable | Require structure to be pulled out of water | Biofouling communities are exposed to air | <$2000 | Any image & statistical analysis software |
| ROV | Seafloor Epifauna Pelagic Biofouling | Dependent on sea state | Yes, but use is targeted for slack tides or lower flow conditions. | High waves and current can impact stability; high turbidity impact image quality | ROV motion and lights may affect animals’ behavior | $3000 to $6,000,000 | Any image & statistical analysis software |
| Scrape samples | Biofouling | Yes | Yes | High waves and currents can limit sample collection | Destructive sampling method but limited footprint | <$20 | Any statistical analysis software |
| Sediment profile imaging | Sediment Infauna | Dependent on sea state | Yes, but use is targeted for slack tides or lower flow conditions. | Image clarity affected by water turbidity; different sediment composition affects penetration depth and SPI may over-penetrate soft sediments | None | $5000 to $90,000 | Any image & statistical analysis software |
| Side-scan sonar | Seafloor | Yes | Yes | Requires low sea-states to produce higher quality data, can be used in conjunction with other devices for more accurate data | None if frequencies used are out of hearing thresholds for sensitive organisms | $2000 to $45,500 | Manufacturer’s proprietary software or third-party software |
| Smith–McIntyre grab | Infauna | Dependent on sea state | Yes, but use is targeted for slack tides or lower flow conditions. | Device weight needs to be sufficient to withstand currents and for adequate seafloor penetration; sediment characteristics will affect the ability of the technology to adequately collect samples; may kite in deep water | None | $9000 | Any statistical analysis software |
| Sub-bottom profiler | Seafloor | Yes | Yes | Energy loss/disruption as it propagates through high-energy water column can affect received data signal | None if frequencies used are out of hearing thresholds for sensitive organisms | $12,000 to $160,000 | Manufacturer’s proprietary software or third-party software |
| Towed camera | Epifauna | Dependent on sea state | Yes, but use is targeted for slack tides or lower flow conditions. | High waves and current can impact stability; high turbidity impact image quality | Sled motion and lights may scare away mobile animals; sled contact with seafloor may leave scars | $300 to $4000 | Any image & statistical analysis software |
| Van Veen grab | Sediment Infauna | Dependent on sea state | Yes, but use is targeted for slack tides or lower flow conditions. | Device weight needs to be sufficient to withstand currents and for adequate seafloor penetration; sediment characteristics will affect the ability of the technology to adequately collect samples; high waves and currents can impact ability to get samples near an object or foundation. | None | $1400 to $13,500 | Any statistical analysis software |
| Infauna Epifauna | Strong Currents | Mild Currents | High Waves | Low/No Waves | Deeper 30 m | Shallower 30 m | Obstructions | Free Passage | Coarse Seabed | Soft Seabed |
|---|---|---|---|---|---|---|---|---|---|---|
| Strong Currents | Dredge | Dredge, heavy core, heavy grab | Dredge, heavy core, heavy grab | Dredge, heavy core, heavy grab | Dredge | Heavy core, heavy grab | Dredge | Heavy core, heavy grab | ||
| Mild Currents | Dredge | Any corer, any grab, dredge, SPI | Any corer, any grab, dredge, SPI | Any corer, any grab, diver, dredge, SPI | Diver, dredge | Any corer, any grab, diver, dredge, SPI | Day grab, dredge, Van Veen grab | Any corer, any grab, diver, SPI | ||
| High Waves | Hook & line | Fisheries echosounder, hook & line, trawl | Dredge | Dredge | Dredge | Dredge | Dredge | - | ||
| Low/No Waves | Drop camera, fisheries echosounder, heavy ROV, trawl | Any ROV, divers, drop camera, fisheries echosounder, seine, towed camera, trawl | Any corer, any grab, dredge, SPI | Any corer, any grab, diver, dredge, SPI | Diver, dredge | Any corer, any grab, diver, dredge, SPI | Day grab, dredge, Van Veen grab | Any corer, any grab, diver, SPI | ||
| Deeper 30 m | Drop camera, fisheries echosounder, heavy ROV, trawl | Any ROV, drop camera, fisheries echosounder, towed camera, trawl | Fisheries echosounder, hook & line, trawl | Any ROV, drop camera, fisheries echosounder, towed camera, trawl | Dredge | Any corer, any grab, dredge, SPI | Day grab, dredge, Van Veen grab | Any corer, any grab, SPI | ||
| Shallower 30 m | Drop camera, fisheries echosounder, heavy ROV, trawl | Any ROV, diver, drop camera, fisheries echosounder, seine, towed camera, trawl | Hook & line, trawl | Any ROV, diver, drop camera, fisheries echosounder, seine, towed camera, trawl | Diver, dredge | Any corer, any grab, diver, dredge, SPI | Day grab, dredge, Van Veen grab | Any corer, any grab, diver, SPI | ||
| Obstructions | Drop camera | Diver, drop camera | Hook & line | Diver, drop camera | Drop camera | Diver, drop camera | Diver | Diver, SPI | ||
| Free Passage | Drop camera, fisheries echosounder, heavy ROV, trawl | Any ROV, diver, drop camera, fisheries echosounder, seine, towed camera, trawl | Fisheries echosounder, trawl | Any ROV, diver, drop camera, fisheries echosounder, seine, towed camera, trawl | Any ROV, dredge, drop camera, fisheries echosounder, trap, trawl | Any ROV, diver, drop camera, dredge, fisheries echosounder, trap, trawl | Day grab, dredge, Van Veen grab | Any corer, any grab, dredge, diver, SPI | ||
| Coarse Seabed | Dredge, drop camera, fisheries echosounder, heavy ROV | Any ROV, diver, dredge, drop camera, fisheries echosounder, towed camera | Dredge, fisheries echosounder, hook & line | Any ROV, diver, dredge, drop camera, fisheries echosounder, towed camera | Any ROV, dredge, drop camera, trap | Any ROV, diver, dredge, drop camera, trap | Any ROV, diver, drop camera, trap | Any ROV, diver, dredge, drop camera, towed camera, trawl | ||
| Soft Seabed | Drop camera, fisheries echosounder, heavy ROV, trawl | Any ROV, diver, drop camera, fisheries echosounder, seine, towed camera, trawl | Fisheries echosounder, trawl | Any ROV, diver, drop camera, fisheries echosounder, seine, towed camera, trawl | Any ROV, dredge, drop camera, fisheries echosounder, trawl | Any ROV, camera sled, diver, dredge, drop camera, fisheries echosounder, seine, towed camera, trawl | Any ROV, diver, drop camera, traps | Any ROV, camera sled, diver, dredge, drop camera, fisheries echosounder, seine, towed camera, trawl |
Publisher’s Note: MDPI stays neutral with regard to jurisdictional claims in published maps and institutional affiliations. |
© 2022 by the authors. Licensee MDPI, Basel, Switzerland. This article is an open access article distributed under the terms and conditions of the Creative Commons Attribution (CC BY) license (https://creativecommons.org/licenses/by/4.0/).
Share and Cite
Hemery, L.G.; Mackereth, K.F.; Tugade, L.G. What’s in My Toolkit? A Review of Technologies for Assessing Changes in Habitats Caused by Marine Energy Development. J. Mar. Sci. Eng. 2022, 10, 92. https://doi.org/10.3390/jmse10010092
Hemery LG, Mackereth KF, Tugade LG. What’s in My Toolkit? A Review of Technologies for Assessing Changes in Habitats Caused by Marine Energy Development. Journal of Marine Science and Engineering. 2022; 10(1):92. https://doi.org/10.3390/jmse10010092
Chicago/Turabian StyleHemery, Lenaïg G., Kailan F. Mackereth, and Levy G. Tugade. 2022. "What’s in My Toolkit? A Review of Technologies for Assessing Changes in Habitats Caused by Marine Energy Development" Journal of Marine Science and Engineering 10, no. 1: 92. https://doi.org/10.3390/jmse10010092