Review

A Summary of Environmental Monitoring Recommendations for Marine Energy Development That Considers Life Cycle Sustainability

1
Coastal Sciences Division, Pacific Northwest National Laboratory, Sequim, WA 98382, USA
2
Earth System Science Division, Pacific Northwest National Laboratory, Richland, WA 99354, USA
*
Author to whom correspondence should be addressed.
J. Mar. Sci. Eng. 2022, 10(5), 586; https://doi.org/10.3390/jmse10050586
Submission received: 5 April 2022 / Revised: 23 April 2022 / Accepted: 24 April 2022 / Published: 26 April 2022

Abstract

:
Recommendations derived from papers documenting the Triton Field Trials (TFiT) study of marine energy environmental monitoring technology and methods under the Triton Initiative (Triton), as reported in this Special Issue, are summarized here. Additionally, a brief synopsis describes how to apply the TFiT recommendations to establish an environmental monitoring campaign, and provides an overview describing the importance of identifying the optimal time to perform such campaigns. The approaches for tracking and measuring the effectiveness of recommendations produced from large environmental monitoring campaigns among the stakeholder community are discussed. The discussion extends beyond the initial scope of TFiT to encourage discussion regarding marine energy sustainability that includes life cycle assessment and other life cycle sustainability methodologies. The goal is to inspire stakeholder collaboration across topics associated with the marine energy industry, including diversity and inclusion, energy equity, and how Triton’s work connects within the context of the three pillars of energy sustainability: environment, economy, and society.

1. Introduction

As society transitions to clean energy solutions to reduce the impacts of climate change and minimize biodiversity loss, associated ecological changes will occur at sites where renewable marine and wind energy sources are extracted [1,2,3]. Marine energy (ME) devices harness energy from waves, tidal currents, ocean currents, ocean thermal gradients, and river currents [4]. The types of energy devices, such as wave and tidal energy converters, are as unique as the environments proposed to host these new clean-energy technologies. ME developments may extend beyond the footprint of existing oil and gas extraction in terrestrial and marine habitats to maximize the amount of energy generated [5]. As ME sites are explored through the resource characterization process, there is an opportunity to characterize the biodiversity and resilience within these important marine ecosystems. ME devices may create new habitats where an increase in biodiversity thrives, or they may cause a loss in biodiversity resulting from deleterious effects [6]. The Triton Initiative (Triton) aims to support the development of advanced and cost-effective environmental monitoring technologies for ME applications to understand these potential effects better. The novelty of the Triton Field Trials (TFiT) research conducted under the auspices of the US Department of Energy’s Water Power Technology Office has been the opportunity to perform environmental monitoring using diverse technologies and methodologies involving ME devices to evaluate their environmental impacts.
Currently, only a few ME deployment locations existing in the United States are used to advance research and development, and demonstrate the technical readiness of devices for commercial ME deployments [7]. Although the evaluation of environmental impacts from these devices is a high priority for industry and regulators, opportunities to perform environmental monitoring have been limited because of the lack of deployed devices, resulting in high levels of uncertainty for regulators. Uncertainty of what will happen to the environment when an ME device is deployed leads to lengthy project-review periods used to gather sufficient knowledge about the environmental baseline and evaluate mitigation for potential risk—both of which result in significant project costs for developers [8,9]. To reduce uncertainty, data collection around operational ME devices is required (1) to fill knowledge gaps and (2) to validate models. TFiT was created to address these uncertainties as part of the Triton Initiative’s efforts to support the development of advanced and cost-effective environmental monitoring technologies for ME applications [7]. Throughout 2020 and 2021, TFiT explored ways to promote consistent environmental data collection and enable transferability across ME device types and locations, while emphasizing cost-effectiveness [7]. TFiT studies contribute datasets and recommendations to regulators and other stakeholders in the ME industry. In turn, TFiT outcomes and recommendations can be used to help future projects to assess the environmental risk posed by ME installations, reducing uncertainty, and informing the permitting and authorization process in a more efficient manner [7].
In this Special Issue, recommendations for monitoring technologies and methodologies are evaluated for four common environmental concerns: collision risk [10], underwater noise [11], electromagnetic fields (EMFs) [12], and changes in habitat [13,14]. The research reviewed technologies and methods to measure the impacts of ME devices in the open ocean and riverine environments around current energy converter (CEC) devices and a wave energy converter (WEC). During the course of performing these other tests, TFiT research identified a potential new stressor—anthropogenic light [15]. Furthermore, the TFiT recommendations provided empirical data that can inform models (as identified in [16]) and field-tested technology approaches for measuring various stressors (as identified in [17]).
During the conception of TFiT, emphasis was placed on creating pathways for outreach and engagement to engage with and distribute the recommendations to decision makers, industry partners, and other academic and research institutions [18]. The dissemination strategy started with publishing all TFiT-derived recommendations in this open-access Special Issue for stakeholders to access in one location.

Holistic Sustainability Considerations for Marine Energy

Marine environments contain substantial renewable energy potential, equivalent to meeting the world’s current electricity demand many times over [19]. Meanwhile, concerns about climate change have motivated the global energy transition from fossil fuels to more carbon-neutral renewable sources. Although ME is still in the early stages of development compared to solar and wind energy capture, with increasing investment and technology advancements, ME could become an important contributor to a low-carbon energy future [20]. ME is also a key component of the broader Blue Economy, defined as “the sustainable use of ocean resources for economic growth, improved livelihoods, and jobs while preserving the health of ocean ecosystems” [21]. The Triton Initiative and TFiT are vital components of ensuring that ME development and deployment meet the lofty goals set forth by the Blue Economy [22]. Early monitoring efforts for environmental impacts, such as TFiT, are essential for addressing environmental issues and concerns at the forefront of the energy transition to renewable sources. However, a holistic sustainability assessment covering environmental, economic, and social dimensions is also essential for minimizing the tradeoffs and maximizing the benefits of ME implementation that support the energy transition, community wellbeing, and economic prosperity.
In researching environmental monitoring practices, Triton identified several gaps in the research about implementing environmental monitoring practices and considerations for holistic sustainability for ME. Due to the novelty of ME devices, uncertainty around their impacts, and the lack of established ME test sites and subsequent data transferability, there is a need for site-specific spatial and temporal monitoring, along with inclusion of life cycle sustainability assessments, to address uncertainty comprehensively. Communication and involvement among stakeholders play a critical role in understanding the effectiveness of such monitoring and sustainability efforts [23]. This paper addresses these gaps by offering summaries of current published monitoring recommendations, a use case for temporal planning for monitoring, considerations for measuring communication and outreach effectiveness, and a discussion of the broader impacts on energy sustainability.

2. Special Issue Summary and Discussion

The following discussion integrates the TFiT research into existing interests among the ME community at large. A high-level summary of the TFiT recommendations, along with discussions in the context of the implementation of TFiT recommendations and measuring the effectiveness of the recommendations, is provided. Awareness for adding temporal parameters to environmental monitoring campaigns to maximize data collection is addressed. In conclusion, a broad discussion on ME sustainability and where the TFiT campaign contributes to this area of interest is included.

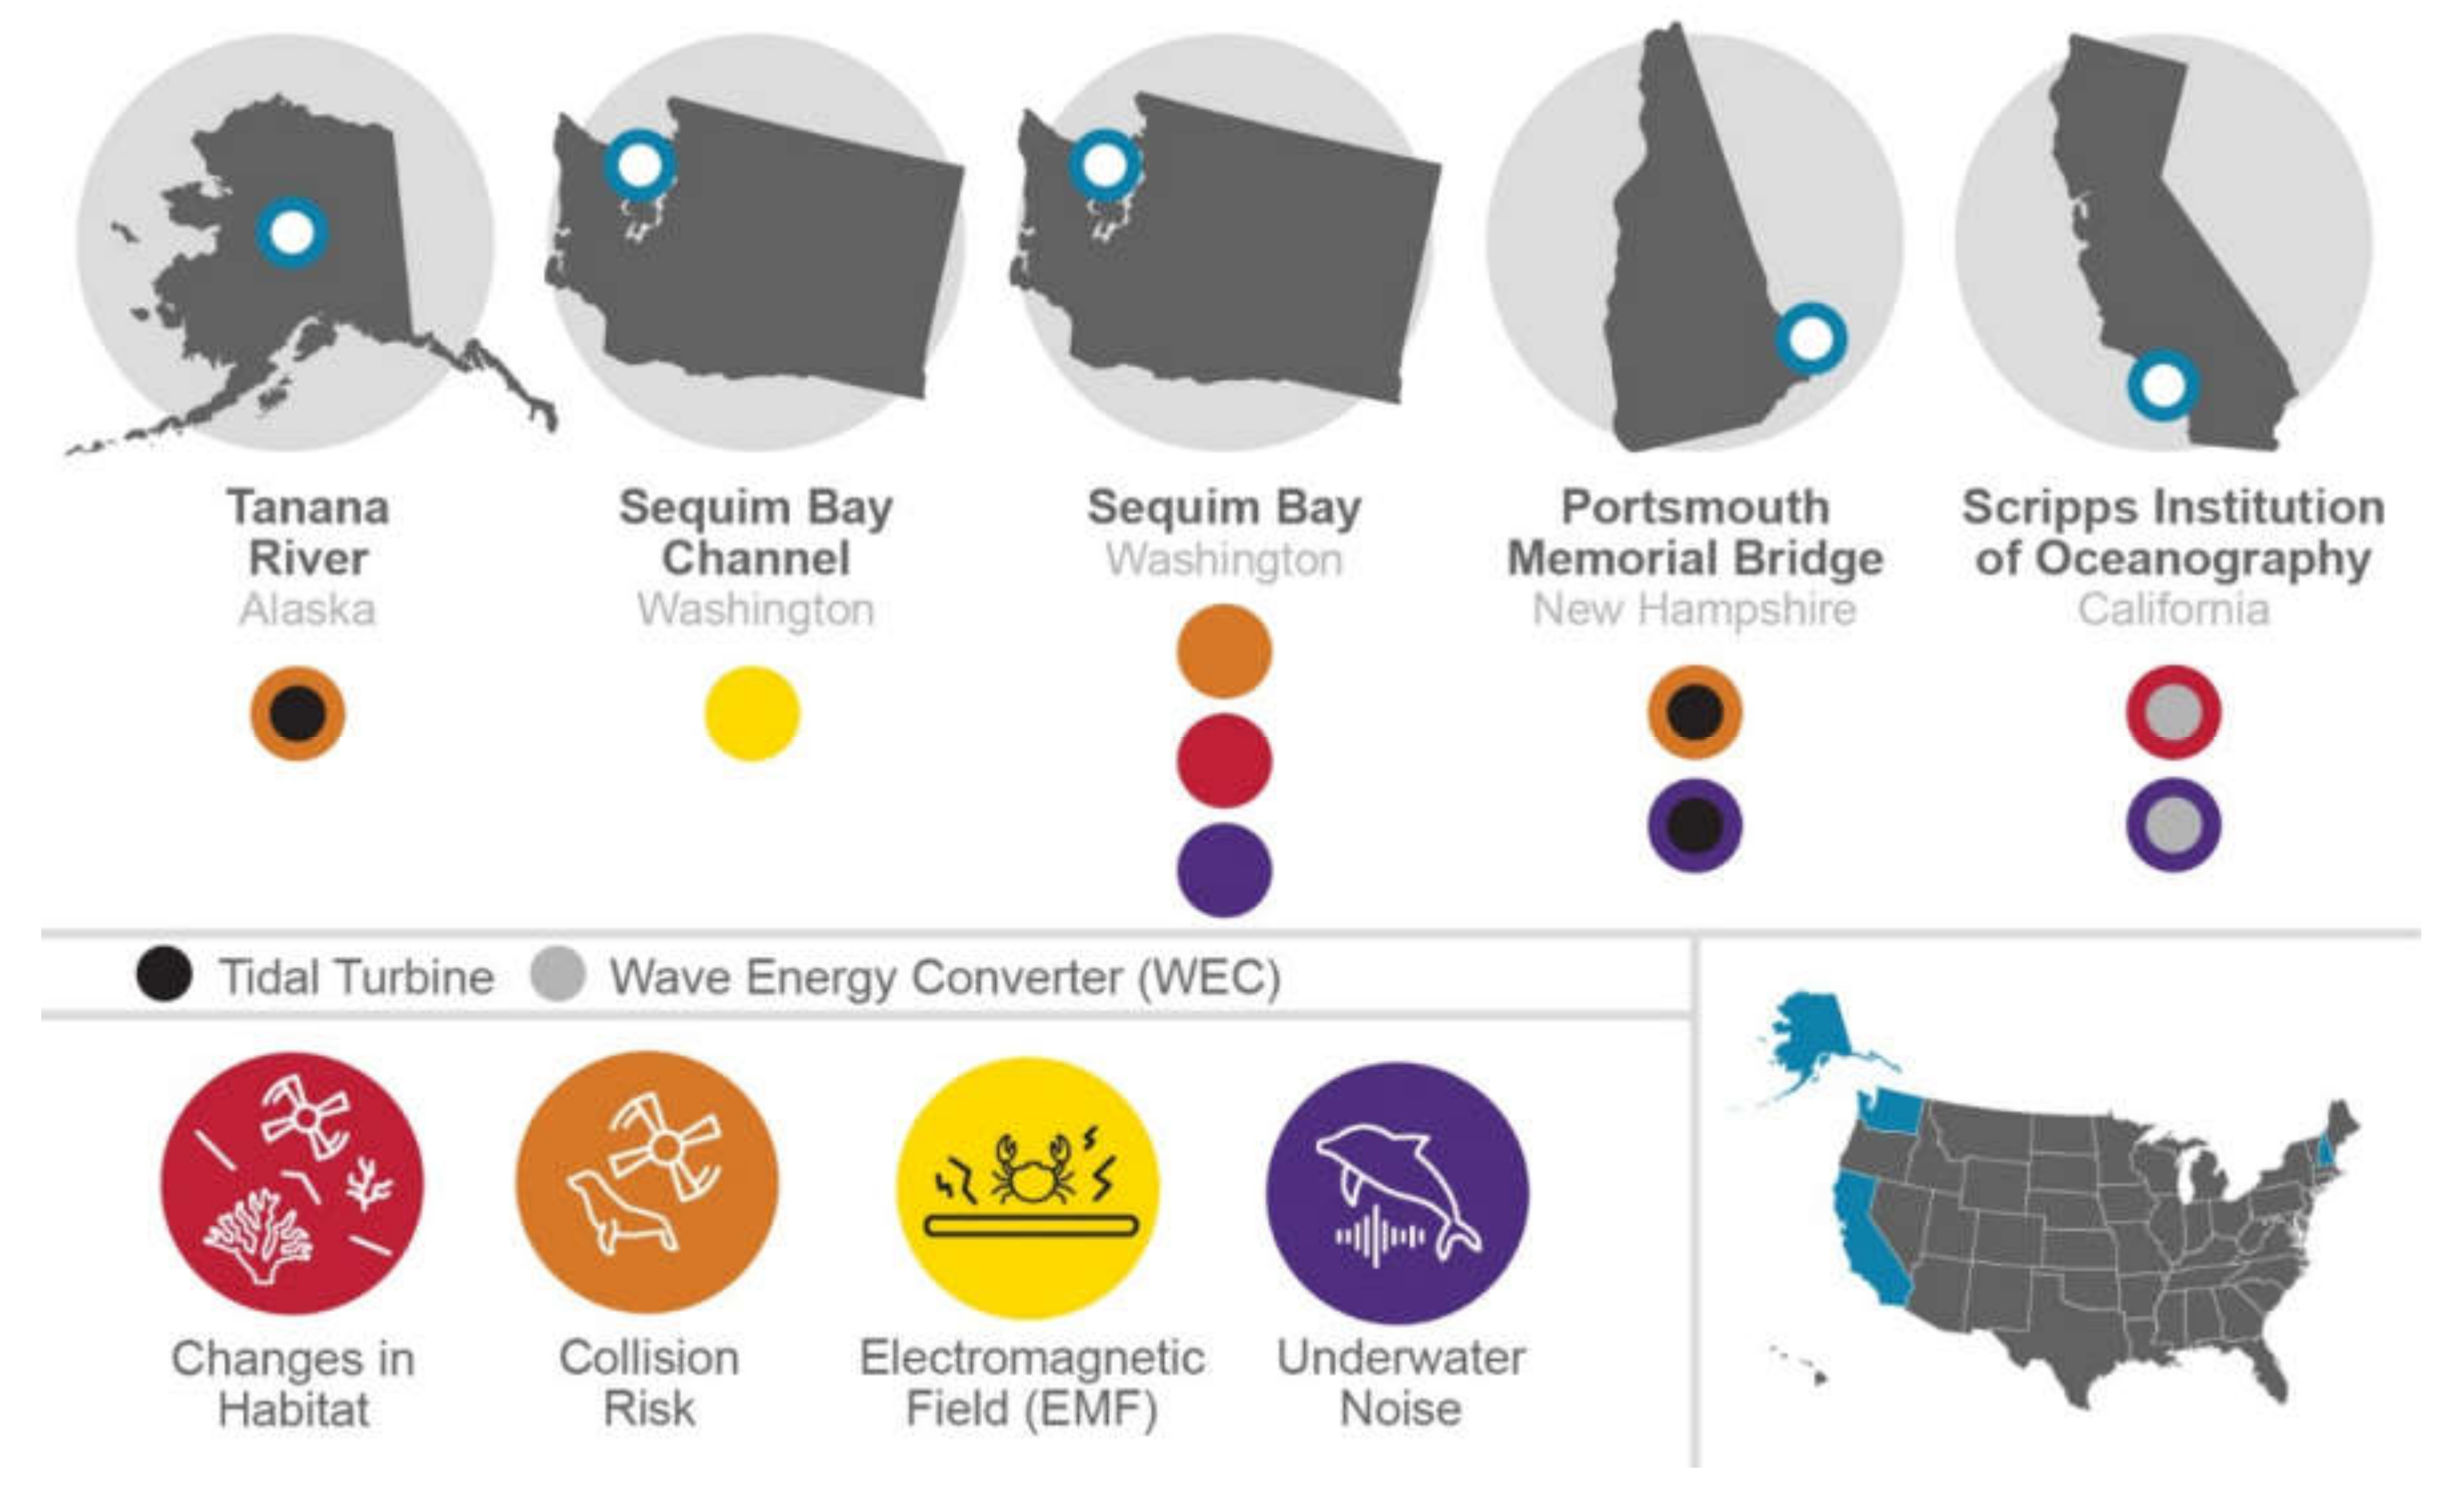
2.1. Summary of TFiT Recommendations

The papers in this Special Issue address collision risk, underwater noise, EMFs, changes in habitat, anthropogenic light, physical and biological modeling, and science communication, outreach, and engagement, and provide the recommendations summarized below. Additionally, we provide a high-level overview of the four stressors tested in the field, including the test sites and types of ME devices, to showcase the complexity of environmental monitoring efforts included in the TFiT (Figure 1).

2.1.1. Collision Risk Recommendation Summary

The collision risk technology included an underwater acoustic imaging camera deployed at two tidal turbines: one testing in the Tanana River in Alaska, and the other at Portsmouth Memorial Bridge in New Hampshire (Figure 1). The use of acoustic cameras is recommended where turbid water precludes the use of video cameras to inform decisions made about collision risk [10]. The selection of an acoustic camera should be informed by the size of the fish expected in the field setting as well as the detection range needed. This information will allow researchers to choose an acoustic camera that has the appropriate operating frequency and image resolution for the intended test environment. The image quality of fish targets can be degraded if the fish are moving faster than the acoustic cameras can create the associated images. Attenuation and low signal-to-noise ratios for fish targets can occur when conditions feature suspended water column debris and entrained air. Acoustic cameras are effective in turbid water conditions in place of video cameras, but have target detection and classification limitations that researchers should be aware of and prepare for. Prior knowledge of these limitations will help researchers to choose the acoustic camera best suited to mitigating these undesirable conditions. Models that inform decisions made about collision risk, such as encounter rate models, have been introduced, but have only rarely been parameterized with empirical data. Fish behaviors such as avoidance and evasion are important for informing models, and acoustic cameras provide evidence of these behaviors. However, challenges remain for acoustic camera use, and further testing and methodological refinement are needed to gather fish behavior data to inform models most effectively.

2.1.2. Underwater Noise Recommendation Summary

The International Electrotechnical Commission (IEC) 62600-40 Technical Specification (TS) provides a valuable framework and guidance for selecting equipment and conducting data collection, analysis, and presentation of results for underwater noise measurements and acoustic characterization of CECs [11]. The IEC 62600-40 TS should be followed to the greatest extent possible to collect the most transferable data and analysis for comparisons across sites and devices [11]. An underwater noise field effort deployed a drifting hydrophone at the Portsmouth Memorial Bridge in New Hampshire and performed calibration tests in Sequim Bay (Figure 1). Still, given the logistical challenges and data limitations, some modifications to field and analysis efforts will be needed to acquire meaningful data. For instance, moving the measurement zones to accommodate flow characteristics and avoid site-specific obstacles (e.g., reefs, piers, pilings) might be required [11]. Additionally, for acoustic measurements of CECs, flow shield mitigation strategies are critical [24,25]. Another mitigation strategy is to use the ability to record at night with reduced boat traffic to improve data quality and enable recording during peak flows that occur during dark hours, along with higher turbine power generation states. Furthermore, in situ acoustic measurements can be used to parameterize underwater noise-modeling efforts for future device deployments and provide important validation of model outputs at active project sites.

2.1.3. Electromagnetic Fields Recommendation Summary

The power cables to connect ME and offshore wind devices to land are shielded from the electrical component of the EMF, but the magnetic component persists [26]. Technologies used to measure background versus anthropogenic EMFs are not as advanced as other underwater environmental monitoring technologies. The EMF tests did not test around an ME device; rather, they focused on gathering EMF background and powered cable measurements to validate the technology and methods used in Sequim Bay (Figure 1). Two sensors were evaluated: one sensor measured the magnitude of the total magnetic field, and provided more reliable measurements of the magnetic field than a modified but less expensive sensor [12]. Test results indicate that taking a background magnetic field survey is important for assessing both the impacts of the cable and what natural fluctuations organisms may encounter in the benthic or pelagic habitat. To minimize EMF uncertainty, modeling different types of typical ME cables using background magnetic field surveys is recommended [12]. Modeling results may also aid in designing cable layouts for future installations. For modeling to contribute effectively to determining the EMF stressor, acquiring EMF background data to inform the localized natural EMF measurements is essential.

2.1.4. Changes in Habitat Recommendation Summary

Because of the high diversity of possible habitat changes and technologies available to monitor these changes, it is recommended that surveyors identify early which habitat categories and potential effects they will monitor, so that they can select the appropriate technology [14]. Technologies and sampling methods that are adaptable and designed for working efficiently in energetic environments should be favored, along with sampling designs and statistical analyses carefully thought out to identify differences in faunal assemblages and spatiotemporal changes in habitats. Many technologies come in various sizes and shapes, and the best options for monitoring high-energy environments may be the most adaptable ones. Changes in habitat technology deployment included a 360-degree underwater video camera near a wave energy converter during testing at the Scripps Institution of Oceanography in California [13] (Figure 1). The 360-degree video lander approach provides a useful solution for monitoring the artificial reef and fish-aggregating device effects of ME installations, without the constraints and limitations inherent to remotely operated vehicles and scuba divers [13]. Despite some challenges (e.g., the stitching process being tricky for beginners), 360-degree cameras are useful tools for monitoring animals’ interactions with ME devices. In addition, many different modeling approaches used in ecology in general can be applied to various aspects related to changes in habitats, but very few have been used in the ME context, and input data are often missing.

2.1.5. Anthropogenic Light Recommendation Summary

Light generated by humans is known to disturb animals that rely on ambient light levels for critical life functions. Minimal information is known about this potential stressor and how it relates to ocean renewable energy and associated marine navigation systems. This research provided an important, initial review of the potential stressor, introducing early mitigation strategies for reducing the impact of light at night [15]. Lighting for ME devices should be minimized where possible to reduce their ecological impacts, especially when the light is directed upward or into the water [15]. The use of timers, dimmers, flashing lights, lower lighting intensities, and light-emitting diode lights are all recommended best practices. Wildlife-friendly lighting spectra may also be employed where appropriate. The minimum number and intensity of lights should be used when lighting open-ocean structures for ME devices. General area floodlighting should be avoided, and the specific environment should be considered so that species of interest are minimally affected. Anthropogenic lighting affects the environment in various ways, and different species perceive light spectra uniquely [27]. A better understanding of the ecosystem-level effects of lighting and the threshold sensitivities of various species is necessary. The development of high-sensitivity instrumentation can help researchers studying the effects of lighting better measure the light and improve the reporting of lighting characteristics [28].

2.1.6. Physical and Biological Modeling Recommendation Summary

A comprehensive approach to stressor–receptor interaction research, monitoring, and modeling can advance the pace of ME development [16]. Predictive models can be used to evaluate the potential effects of ME projects, extend the utility of existing monitoring data, and prioritize future monitoring. The collection of empirical data for both physiological and biological processes is necessary to improve physical and biological models. Given the limited number of operating devices, it is essential for the ME industry to test its ability to collect data to inform and validate models used to address stressor–receptor effects. An investment to coordinate modeling and monitoring protocols includes identifying the most appropriate models for the device and its setting, and employing data collection methods that will best inform the models—standardizing data types and formats to streamline the process and facilitate reuse of data and comparability between sites. Most modeling studies focus on single stressor–receptor interactions, thereby missing opportunities to leverage monitoring information and more comprehensively address the physical and biological effects of ME devices. Developing a modeling process that accounts for all stressor–receptor interactions will streamline research and monitoring requirements and provide a holistic approach to determining ME devices’ environmental effects. The published models of ME devices’ environmental effects vary from well-developed to theoretical, and include few observational data with operating devices present. There are no universally appropriate models for all ME projects, but coordinating modeling approaches within and across projects makes the best use of available data.

2.1.7. Communication Recommendation Summary

Increased access to information about various sections of the ME industry is needed [18]. It is highly recommended that ME projects implement communications and outreach frameworks tailored to target audiences, such as research partners and industry stakeholders, to effectively disseminate research to support the informed advancement of the ME industry. Initial communication frameworks may start small and build content based on what most effectively reaches target audiences. Framework elements may include building a website that highlights the project mission and team, curating content for one social media platform, launching a newsletter, or gathering data through surveys and platform analytics to track success. Additionally, it is advisable for projects that implement a communication, outreach, and engagement framework to publish their results and lessons learned. By sharing the ways ME projects improve communications with industry stakeholders and decision makers, science communication efforts can most effectively contribute to the advancement of the ME industry. For example, Triton found its pilot communications framework to be a valuable method for communicating the project’s mission and disseminating results and project information to key audiences. Given the breadth of Triton’s audiences and end-users of research results and products, diverse tactics—including websites, blogs, newsletters, social media, and webinars—were needed to reach each target audience. Metrics of success were tailored to each communications channel based on available data, and more extensive survey work is still needed to quantify audience understanding and perceptions. Partnerships with research collaborators were valuable for bolstering communications content and increasing exposure to information.

2.2. Applying the TFiT Recommendations

TFiT’s environmental monitoring data collection around active ME devices enabled the first-of-its-kind technology and methods recommendations, and provided a real-world scenario for collaboration between developers, test sites, and researchers. TFiT recommendations can inform which technologies and methods provide the most meaningful data as they develop the environmental monitoring requirements around ME projects necessary to expedite the permitting process. Monitoring has become a major feature of environmental assessment and natural resource management over recent decades, largely as part of a shift toward ensuring the sustainability of ecosystems and maintaining their ecological resilience in the face of increasing anthropogenic pressures [29,30]. Multiple decades of data collection and significant funds were contributed to permit the PacWave Open Water Marine Energy Test Facility (PacWave) in Newport, Oregon [31]. The PacWave South site can test 20 utility-scale WECs, and is able to test arrays of devices simultaneously. The opportunity to collect environmental data around an array of devices will be the next significant accomplishment for monitoring stressor–receptor interactions. PacWave’s Federal Energy Regulatory Commission (FERC) license and Bureau of Ocean Energy Management lease are approved for 25 years. The license and lease support the testing of diverse devices at the site, offering short- and long-term environmental monitoring opportunities. The PacWave license established protection, mitigation, and enhancement measures (PM&Es) with specific environmental protocols for monitoring. This monitoring will inform environmental and biological changes over the 25-year lease period, allowing for comparison to the decadal body of knowledge collected about various species and the environment during the Environmental Assessment (EA) published in April 2020 [31]. TFiT recommendations may be adapted for use in conjunction with PacWave PM&Es. Furthermore, the TFiT recommendations may be incorporated into the ME industry’s momentum towards in-water testing of different categories of marine energy devices and installation environments.

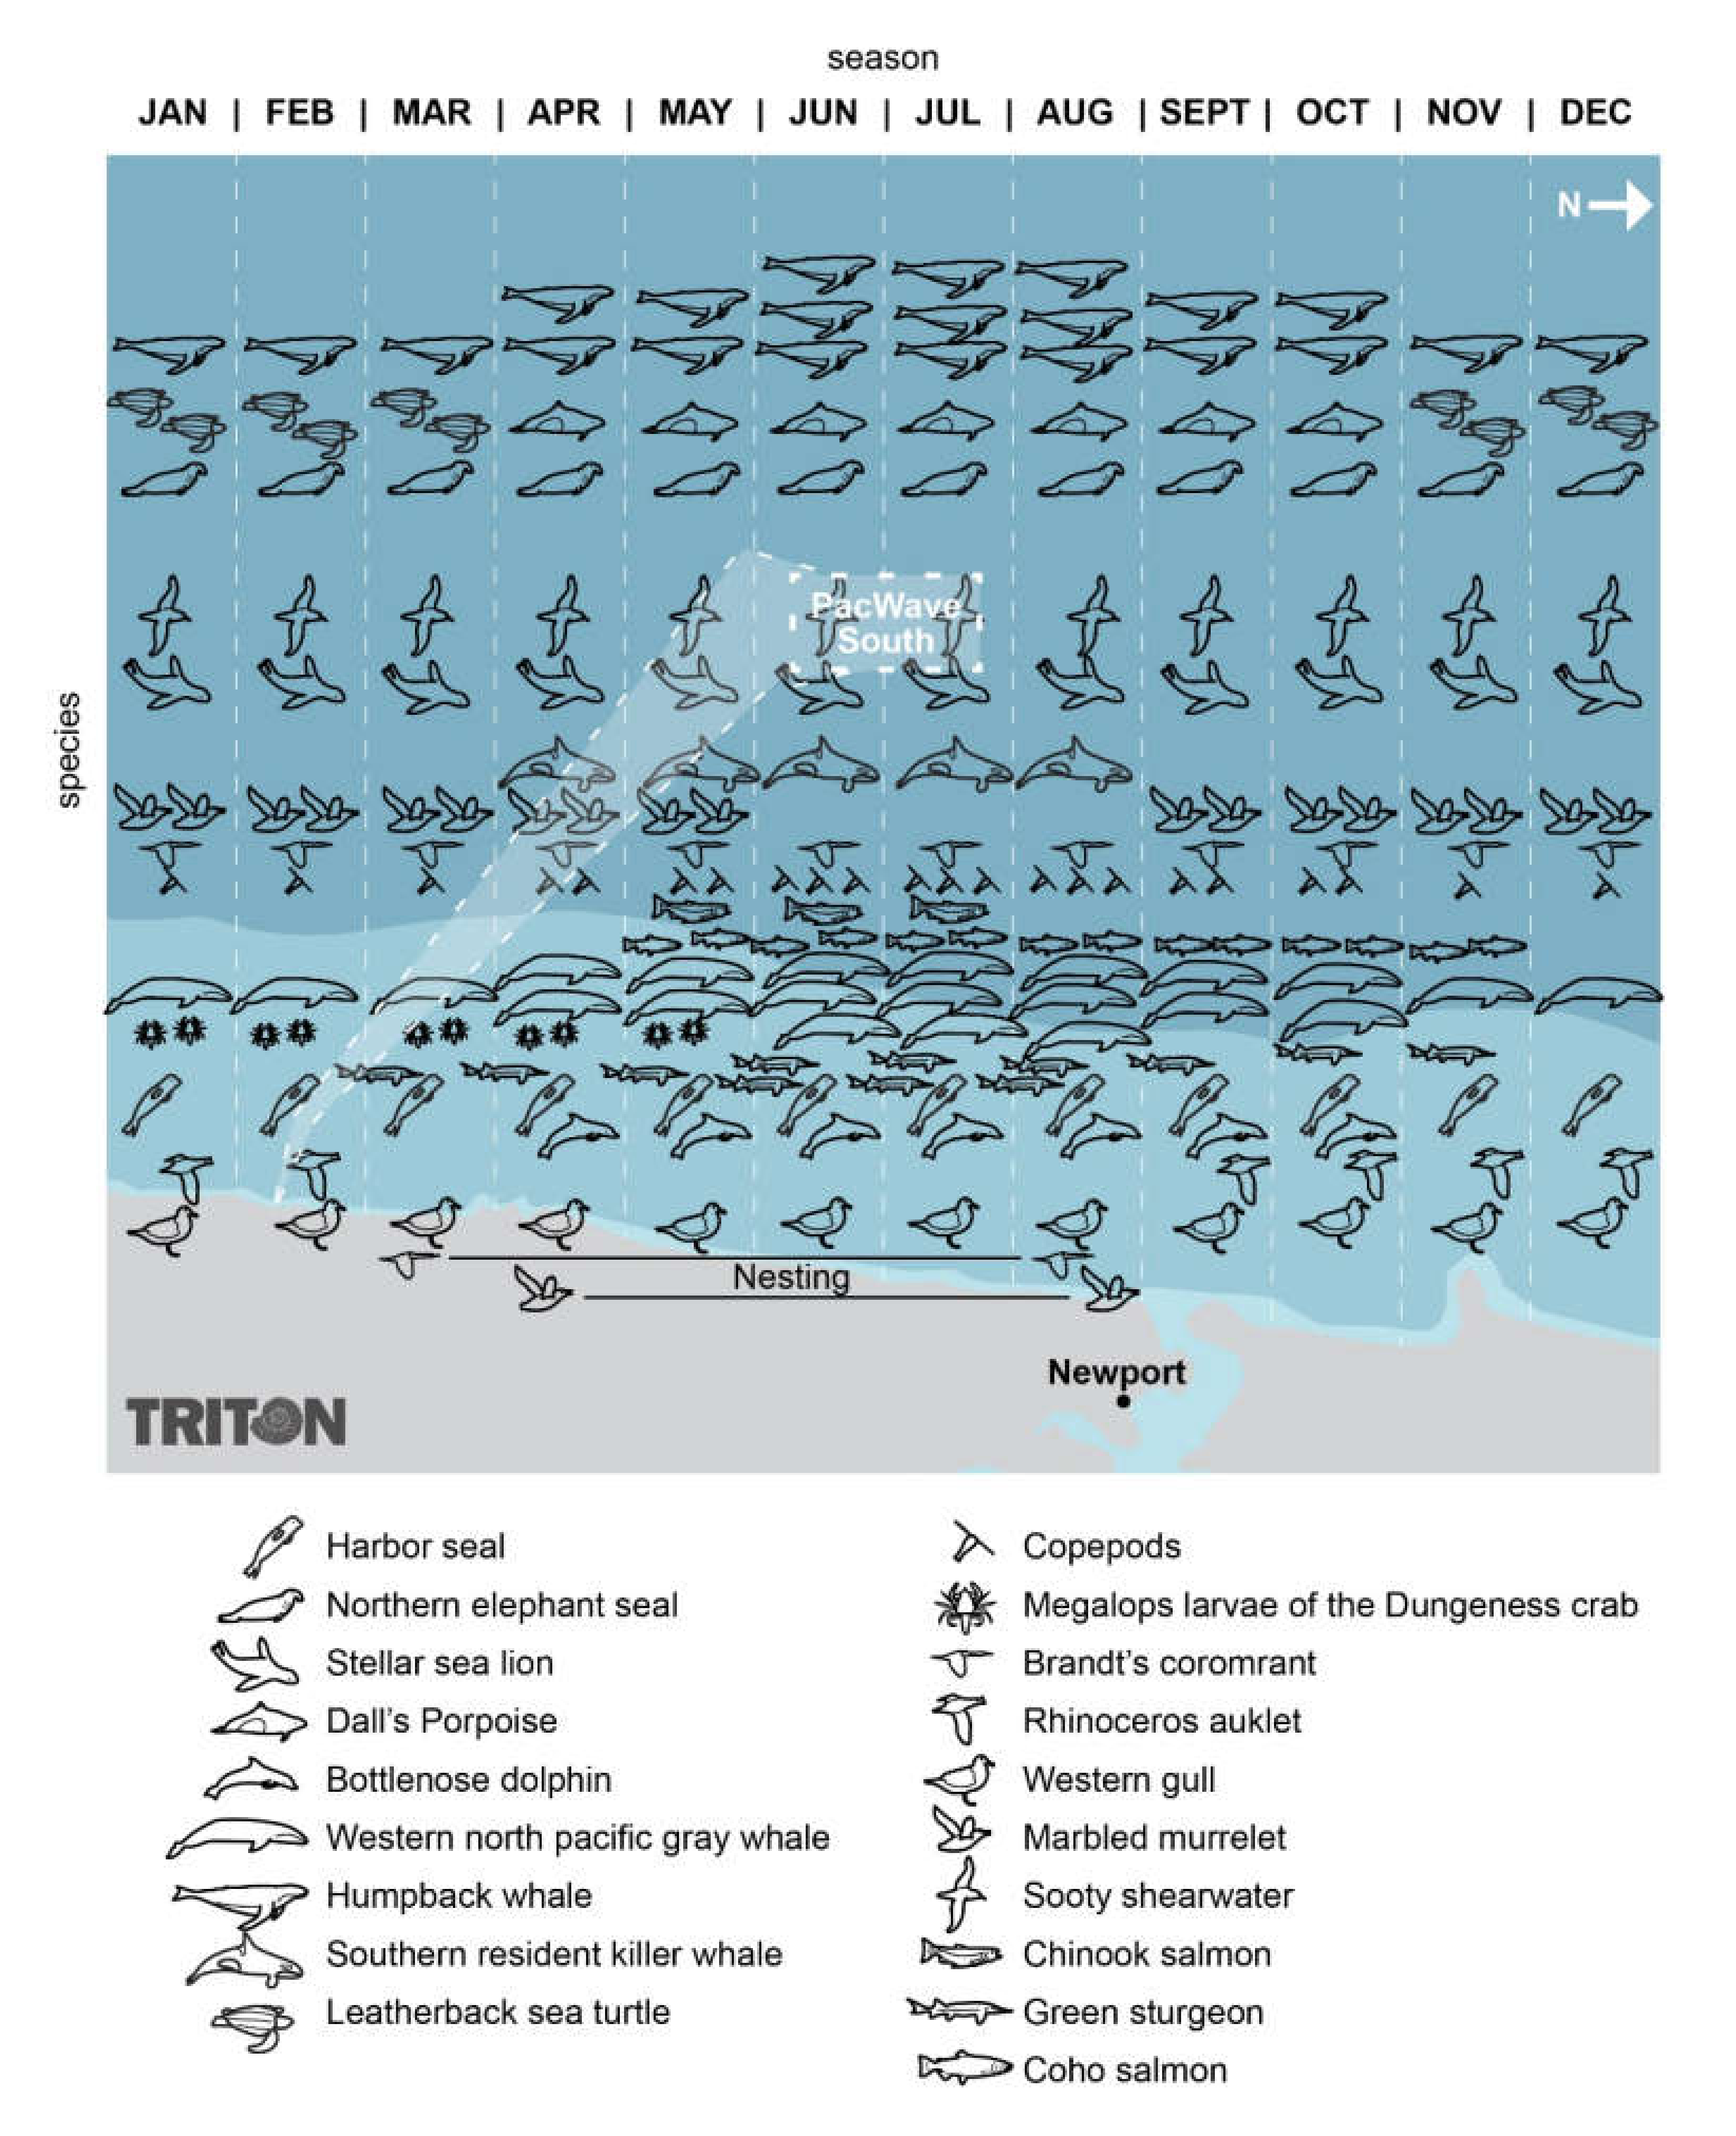
2.3. Temporal Planning for Environmental Monitoring

Aligning environmental monitoring campaigns to capture temporal movements and changes within the biological community at an ME site is necessary to observe, measure, and record different environmental variables of the operational parameters [32]. The TFiT research approach adopted flexibility to perform monitoring when devices were in the water. As a result, the opportunity to integrate timing as a parameter for optimizing biological movement or response was not prioritized. Here, we compile the PacWave EA data as a case study to conceptualize a spatiotemporal-influenced environmental monitoring campaign based on several species that use the PacWave site throughout the year [31], and how this information may be used in context with the TFiT recommendations.
Marine species use different habitats at various times of the year and for different biological and ecological purposes in the ocean and coastal environments [33,34]. Timing environmental monitoring campaigns to capture the movement of species in environments using ME devices is a scientifically accepted parameter related to informing permits and lease agreements associated with ME development [35]. For example, the PacWave EA documented various studies of the area ecology and biodiversity spanning from 1978 to the approval of the FERC Environmental Assessment for Hydropower License at the site [31]. Temporal planning may also consider the duration of an animal’s exposure to a specific stressor. One such example may include observing seabirds that use diving behavior to forage. These birds may be exposed to collision risk or underwater noise stressors while diving near an operational WEC. Deployment of hydrophones and underwater acoustic cameras near the WEC using similar technologies to [10,11] for short-term deployments may provide information necessary for understanding seabird diving behavior around WECs and the exposure time to underwater noise and collision risk stressors. Data may be used in ecological models to understand population effects over time [16]. Collectively, these data may inform mitigations to reduce localized impacts and promote ecological resilience [36].
Figure 2 presents a small portion of the biodiversity in the marine and coastal habitats around PacWave South, as documented in the EA. The PacWave South site is a static site over time, highlighted by the white-dashed lines that represent three operational areas: (1) the offshore cabled berths for ME device testing, (2) the underground cables connecting offshore devices to the shoreline, and (3) the shoreline and power transmission area. The seasonal distribution of species per month during a year is provided on the x-axis, and an increase in the number of species icons in a month represents an increase in population numbers during that month. For example, copepod abundance increases in June through August, as represented by three copepod icons. Then, the number of copepod icons decreases from November to March, representing the lower copepod numbers found during the winter season [31].
The y-axis represents where species may be found in relation to the three operational areas per the documented observations in [31]. However, any species may be found in other areas and distributed throughout the PacWave site. For example, the migratory movement of the humpback whale population to the Oregon coast is highest, as represented by three humpback whales, from June to August [37]. The humpback whale icon in Figure 2 shows the annual migratory movement in pelagic waters west of the test site. The population decreases in September and October (as represented by two humpback whale icons), and decreases again from November to February (as represented by one icon), as the humpbacks migrate to winter reproductive habitats far from the PacWave area. In March and April, humpback numbers increase (as represented by three humpback whale icons) as the whales return during their northward seasonal migration [37,38]. Humpback whales may move through the three operational areas of the PacWave South site, even though this image shows them west of the site.
When timed with migratory behavior, environmental monitoring data may be adopted by endangered species management authorities. For example, in Figure 2, Chinook salmon occur in the PacWave area from May to June, and their main predator is the southern resident killer whale [31]. Both are listed as endangered species. This represents a scenario where the inclusion of a temporal parameter would aid the regulatory community by providing an opportunity to observe endangered species around ME devices. In combination with the integration of TFiT-tested technologies [10,11,12,13], temporal data may provide insight into stressor–receptor interactions necessary for removing barriers to the implementation of marine energy.
Over time, as oceanic conditions change due to climate change, there may be temporal changes in species distribution around the PacWave South test site. Although not the responsibility of the marine energy industry, monitoring over the next 25-year duration of the project lease offers a unique and valuable research opportunity to observe changes beyond those created by the ME test facility, and to continue technological innovation and development for environmental monitoring. Furthermore, the short- and long-term assessments will demonstrate the adaptability and resilience of biodiverse animal communities in the habitat shared with ME devices.

2.4. Measuring the Effectiveness of TFiT Recommendations

The process for which TFiT was designed to generate a robust representative data record for each stressor interaction of concern, in turn, can be used to assess the actual environmental risk posed by ME installations and help future projects to complete the permitting process in a more efficient manner [7]. For each article, the number of views and citations will be an important metric for tracking dissemination and reach. Additionally, monitoring the literature over time to observe whether there is an increase in the recommended technologies implemented for marine energy environmental monitoring is a valuable metric for success. Beyond journal statistics and literature reviews, the measurable effectiveness of these recommendations can be challenging to quantify, and doing so relies on feedback from end-users to provide insights into how recommendations influence decisions within the industry on what types of environmental monitoring technologies and methodologies to implement, and for what additional guidance they may provide for future applications and the needs of the industry. Multiple avenues will be used to disseminate recommendations and engage with audiences more broadly, including more traditional approaches such as technical conferences and events, as well as more informal, publicly available webinars.
Triton launched a webinar series titled Triton Talks, specifically designed for broadcasting the TFiT recommendations and as a forum for dialog with ME stakeholders. The webinar series comprises monthly, topic-specific informational sessions, led by Triton task leads, who dive into specific TFiT stressor research topics, and the results are reported in accompanying articles in this Journal of Marine Science and Engineering Special Issue. The webinars offer a transparent look at the TFiT research process for each stressor, from its inception through the field trials and analysis of results that led to recommendations, ending with an open question-and-answer session. The webinar series invites both technical and nontechnical audiences to engage with Triton researchers and ask questions during the talk. Each webinar is posted on the Triton website for the purpose of continuing discussion with ME stakeholders. Post-webinar surveys are used to gauge understanding and collect feedback that enables quantitative analysis.
Without qualitative and quantitative data provided by communication, outreach, and engagement efforts, uncertainty remains around how recommendations will be used among the ME stakeholders. Careful tracking of audience attendance, live discussions and questions, and responses to strategic survey questions provide opportunities to gain insights into how audiences access and implement the recommendations, any resulting increase in understanding or change in action, and about additional topics of interest to the target audiences [18]. An important component of tracking effectiveness involves audience composition analysis. Target audiences for TFiT recommendations are end-users within the ME industry, including ME stakeholders such as developers, regulators, and consultants, who make permitting decisions. Additionally, the recommendations may influence research partners such as environmental monitoring technology and sensor developers, subject matter experts, academic institutions, and state and federal government agencies. From topic-specific webinar attendance reports, survey responses, and ancillary data on who engages and offers feedback, we gain insight into how audiences plan to use the recommendations.
Each webinar and accompanying survey, along with the tracking of additional data, is intended to make available all information about use cases, which is a valuable tool for evaluating the reach and practical implementation of recommendations. The impacts can then be maximized through feedback loops in which methods of dissemination and engagement are tailored based on feedback data and audience composition. Data from feedback efforts also inform how to design the associated workshop on implementing recommendations for end-users.

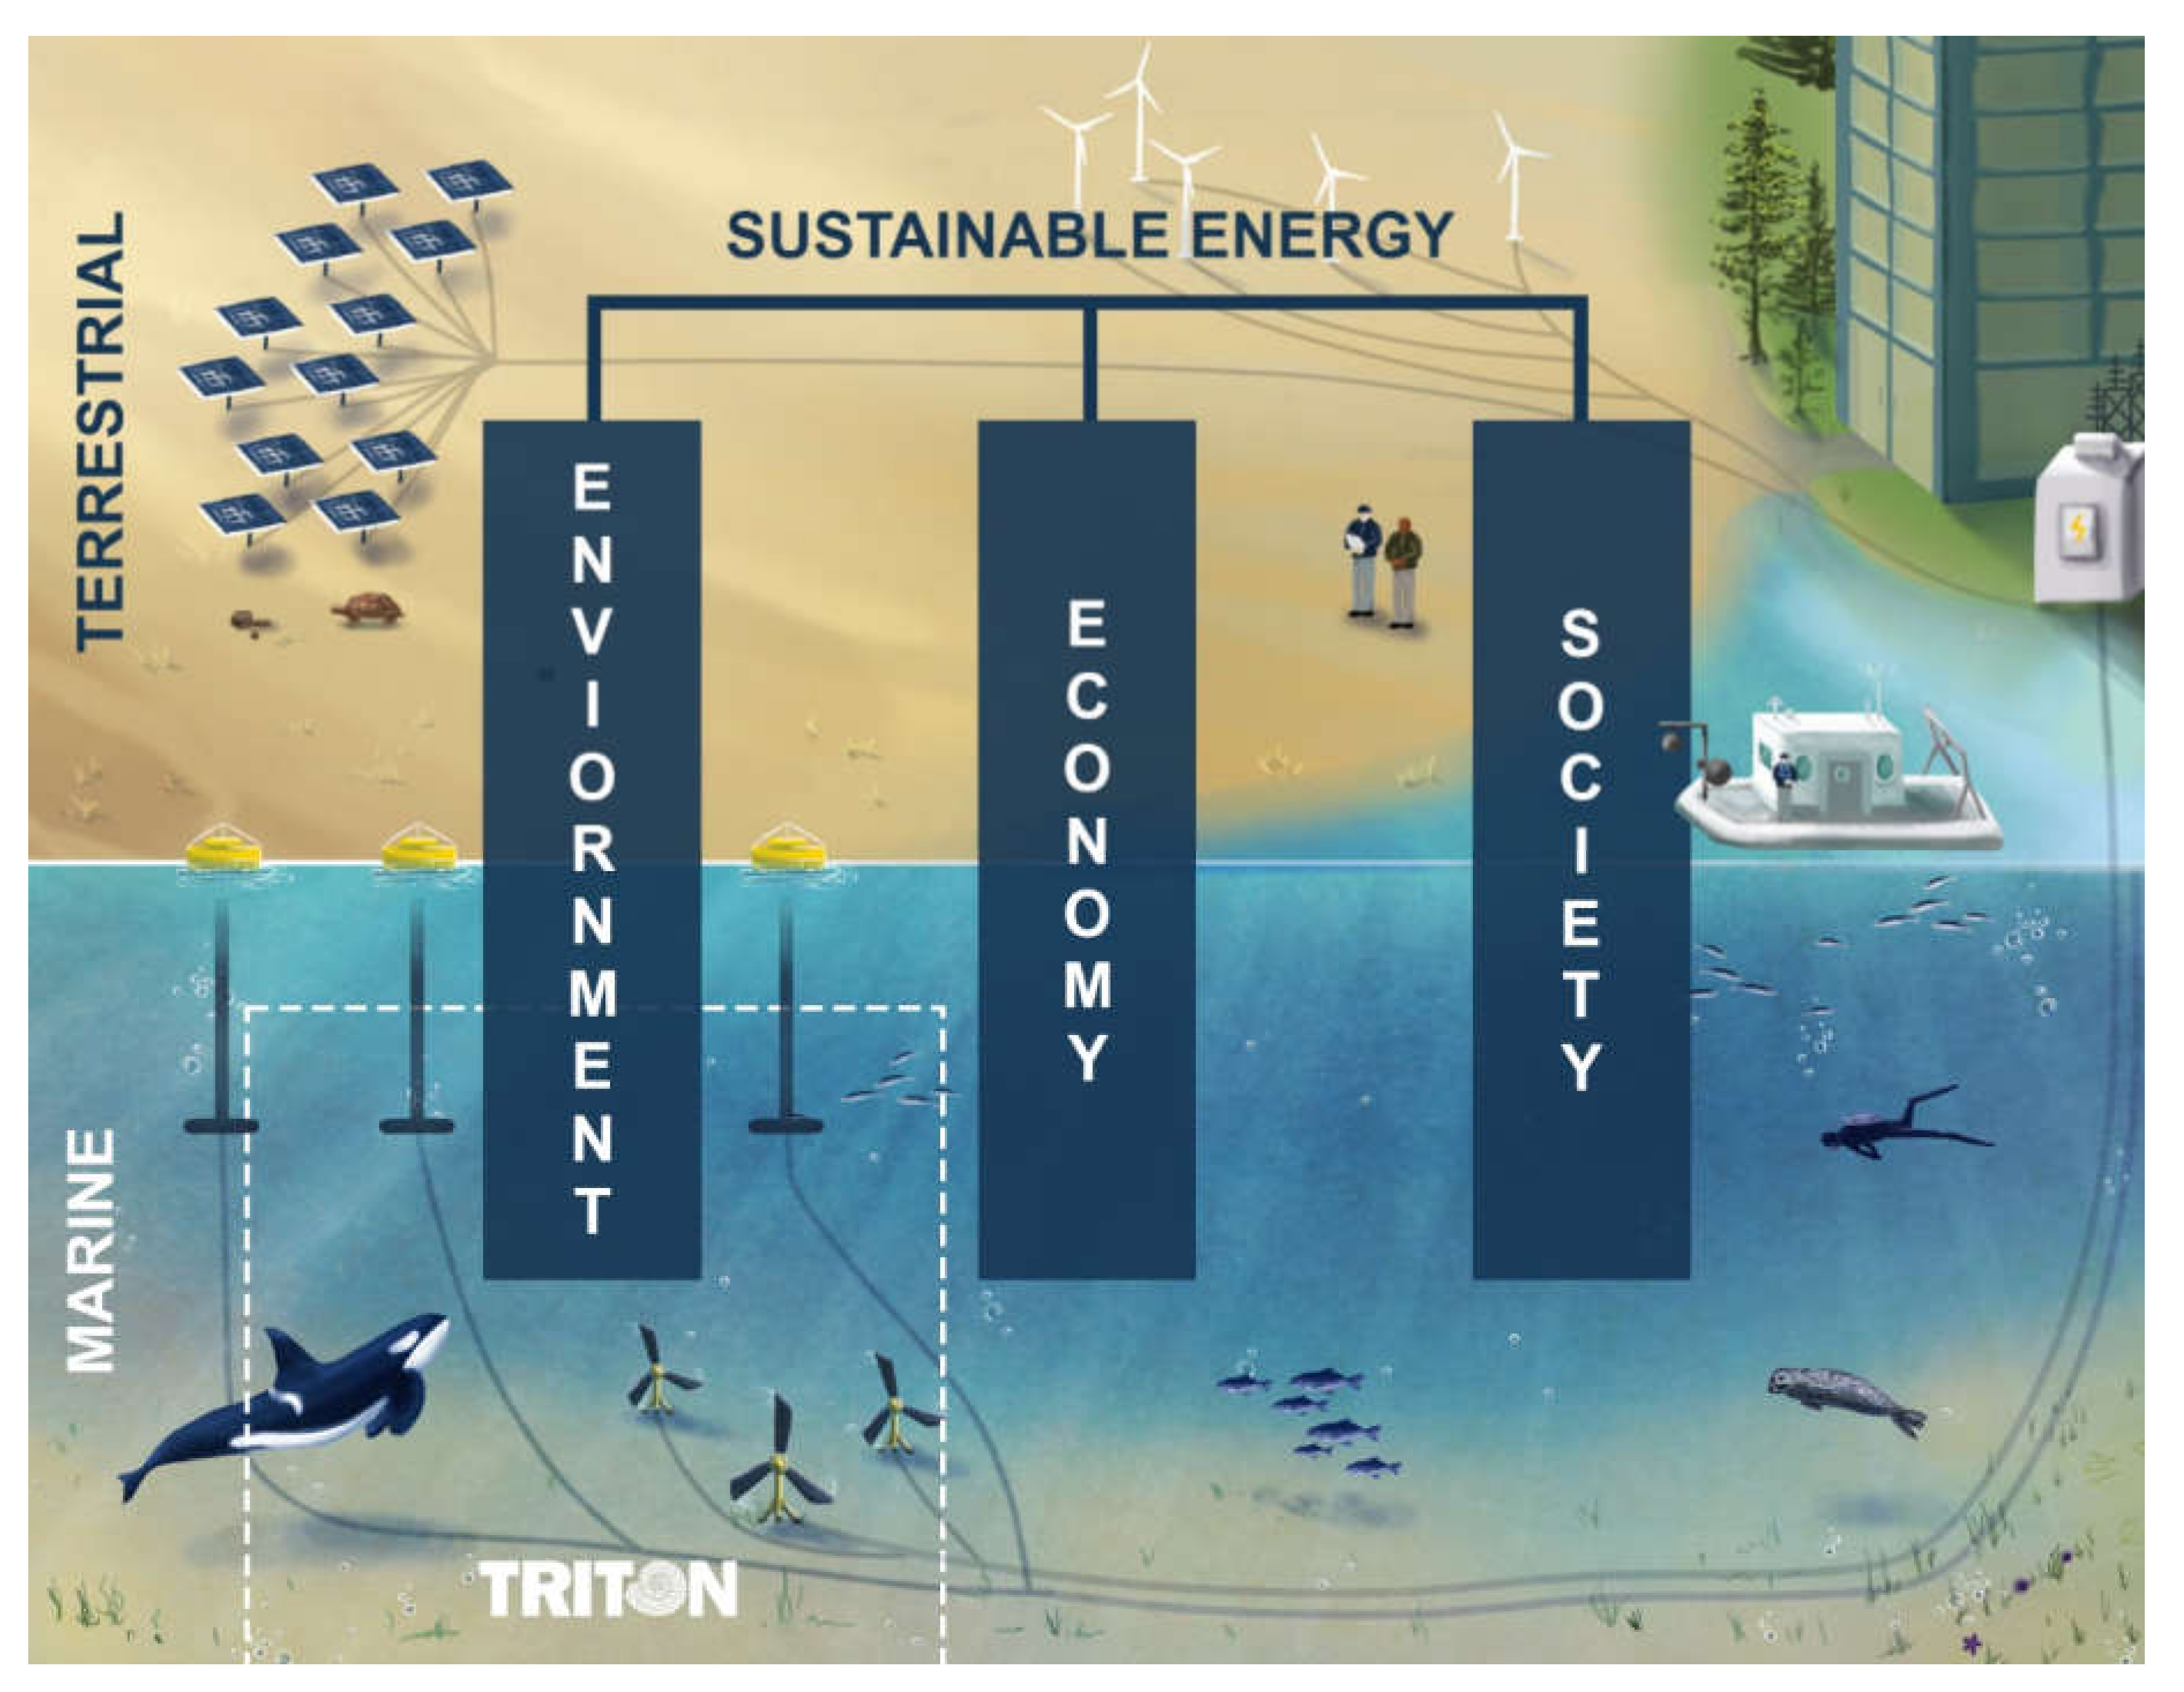
2.5. Energy Sustainability

Inherent in developing, testing, and evaluating all new renewable energy systems is the implicit consideration of sustainability. However, care must be taken to not make assumptions and unintentionally overlook impacts and tradeoffs that challenge overall sustainable development. Hence, a comprehensive life cycle sustainability approach is invaluable to the process of designing and developing ME technologies as early as possible to avoid overlooked tradeoffs and unintended consequences prior to full-scale deployment. TFiT is an example of constructive efforts undertaken to thoroughly understand the direct marine environmental and ecosystem impacts of these novel renewable energy systems before they are fully deployed. However, to wholly exploit this focused research and reveal the life cycle implications of proposed ME technology and system deployment, the findings of TFiT highlighted in this Special Issue must be integrated and evaluated within a holistic sustainability viewpoint that considers direct and indirect life cycle environmental, economic, and social impacts, benefits, and tradeoffs (Figure 3).

2.5.1. What Is Sustainability?

Sustainability has been broadly defined as the “conditions under which humans and nature can exist in production harmony, and fulfill the social, economic and other requirements of present and future generations” [39]. This definition established what have been widely considered the three pillars, or triple-bottom-line, of sustainability: environment, economy, and society. These three pillars are inherently and intricately interconnected, with positive and negative internal and external feedback loops. For example, well-intentioned efforts to promote and develop green energy in major US cities have had negative social impacts on disadvantaged communities in the regions, also known as climate gentrification [40]. On the other hand, many examples exist of how improving the environmental performance of a product or system can also reduce internal economic costs within the production process, while avoiding future liability for external impacts and costs [41].
Most products, processes, and activities in our global society have complex life cycles, with upstream and downstream flows and interactions from raw material extraction to manufacturing and distribution, through use and maintenance, to the end-of-life stage (Figure 4). Assessing these systems through a life cycle thinking perspective is essential to help avoid overlooking or displacing impacts from one stage of the life cycle to another. Likewise, considering a comprehensive suite of impact categories helps avoid impact tradeoffs from one impact category to another. Quantitative frameworks have been developed that correspond to the three pillars of sustainability: life cycle assessment (LCA) for environmental impacts, life cycle costing (LCC) and techno-economic analysis (TEA) for economic feasibility, and social life cycle assessment (S-LCA) for social impact evaluation. These and other methods comprise a so-called sustainability toolkit for broad application by a variety of industries and product systems [42].
LCA assesses the environmental burdens and impacts as the only internationally standardized life cycle environmental assessment method (ISO 14040 Series). LCA has emerged as a valuable decision-support tool across the research, industry, and policy domains [43]. LCC and TEA take a broader economic view of the traditional cost–benefit analysis to include operation, maintenance, and end-of-life financial burdens, as well as the ability to include external costs and liabilities. LCC and TEA are the natural economic counterparts to environmental LCA. They are increasingly used in tandem with LCA to include broader consideration of the sustainability dimensions, while increasing the relevance of environmental results to decision makers, who must balance limited financial resources [44]. S-LCA evaluates social impacts and benefits. However, it is in a nascent stage compared to LCA and LCC, and has substantial work left to do relative to data collection standards and standardized impact indicators, categories, and methods [45,46]. Life-cycle sustainability assessments attempt to combine all of these life cycle methodologies into a single framework for a more comprehensive quantitative sustainability evaluation. However, some have pointed out that “most published (life cycle) works do not consider the economic needs of the populations and their perspective in the potential changes in the surrounding environment”, requiring the integration of the populations into the decision-making process [47]. Therefore, more research and development in the field of life cycle sustainability engineering is required to achieve a truly comprehensive sustainability evaluation methodology that includes outreach and engagement with the affected populations. In the meantime, we must use the tools available to us when considering all pillars to help ensure the most sustainably developed future possible.

2.5.2. Environmental Pillar

Principal drivers of renewable energy are reduced greenhouse gas (GHG) emissions and global warming potential (GWP), as well as the self-replenishing nature of the energy source. However, other environmental impacts of importance include an increase in the frequency and intensity of extreme weather events (such as heat waves, droughts, and floods), ozone depletion, smog formation, acidification, eutrophication, human health (cancerous and noncancerous), airborne particulate matter, ecotoxicity, resource depletion, land use, and water use. Focusing on assessing and mitigating a subset of these environmental impacts can leave tradeoff hotspots and unintended consequences. Having a life cycle perspective is vital to ensuring that there are no unaccounted-for impacts within a product system’s direct and indirect sphere of influence, such as electric vehicles charging from a high-GHG-emission electricity source. A comprehensive suite of environmental impacts must be considered so that mitigating for one environmental impact category does not drastically increase environmental damage in another. Thus, balancing, minimizing, and mitigating the life cycle environmental impacts of products and services establishes the environmental pillar of sustainable energy (Figure 3).
An example of this unintended tradeoff potential from the renewable energy industry is the adoption and promotion of the first generation of biofuels [48]. Ethanol biofuel was primarily introduced to the US market in the early 2000s as an oxygenated additive/component (for antiknock properties, improved thermal efficiency, and nitrogen oxides emission reduction) in gasoline to replace methyl tert-butyl ether, because of environmental contamination [49]. Ethanol and other biofuels quickly gained popularity as cleaner, renewable, and GHG-mitigating alternatives to gasoline as climate change concerns grew stronger [50]. However, in addition to the food vs. fuel debate, LCA showed that ethanol from corn feedstock did not significantly reduce GHG emissions per unit of fuel when considering land-use impacts, and showed that first-generation corn ethanol significantly increased other impact categories, such as eutrophication potential from agricultural nutrient runoff [51]. Subsequent research and policy have promoted the development of advanced biofuels requiring the use of LCA to verify impact reductions against baseline values [52].
Furthermore, the principles of industrial ecology and circularity help to define a roadmap for the development of new technologies, such that our engineered systems mimic the more circular ecosystems found in nature [53,54]. The practice of design for sustainability (or design for X) is one where early in the research, development, design, and testing of a product system, life cycle thinking and sustainability are included to ensure that design decisions made prior to full-scale deployment do not have unintended consequences that are too late or costly to address. Design for environment, design for recycling, design for disassembly, and design for remanufacture are just a few of the methods that may be used to improve the final rollout of novel technologies and systems [55].
In the context of ME, additional considerations for LCA might include changes in oceanographic systems, water-flow alteration, sediment and nutrient transport, biofouling, artificial reef structures, reserve effect and pollution risk, and behavioral responses [2,56,57,58,59]. ME may also help to foster healthy environments and coexistence, with proper design and operation verified through continuous testing and monitoring programs. Ensuring such marine environmental health amid ME deployment and operation would have follow-on economic and social benefits related to continued opportunities for the recreation, tourism, and commercial fishing industries, while also providing cleaner renewable energy sources for coastal communities. ME may also help to foster healthy environments and coexistence, with proper design and operation verified through continuous testing and monitoring programs combined with LCA studies. Ensuring such marine environmental health amid ME development, testing, deployment, and operation through LCA would help to promote economic and social benefits while minimizing life cycle environmental impact tradeoffs and providing cleaner renewable energy sources for coastal communities.

2.5.3. Social Pillar

At the core of sustainability is the sustainment and development of human beings and their collective and individual welfare (health, safety, happiness, and prosperity). As such, the importance of social sustainability in the broader context of sustainability must not be overlooked. Though least developed in the field of life cycle engineering, social life cycle studies, as well as the fields of environmental justice and energy equity, are rapidly advancing. S-LCA impact categories encompass various stakeholder groups (e.g., local community, value chain actor, consumer, worker, and society), and include community engagement, living conditions, fair competition, transparency, equal opportunity, and economic development [60]. Though its roots in the United States are in the Civil Rights Movement of the 1960s, environmental justice was first formalized in the National Environmental Policy Act process in the 1990s, and was more recently highlighted for further consideration [61]. The US Environmental Protection Agency defines environmental justice as “the fair treatment and meaningful involvement of all people regardless of race, color, national origin, or income with respect to the development, implementation and enforcement of environmental laws, regulations and policies”, and has developed the EJSCREEN tool for mapping and screening environmental and demographic indicators [62]. Energy, environmental, and climate equity and justice more broadly include the marginalization of disadvantaged communities in terms of insufficient investment in clean energy infrastructure and access to energy-efficient housing and transportation.
Thus far, the literature on the social impacts of ME has focused on public opinions and social acceptance. Support and opposition to ME both often stem from environmental and social factors constituting the social pillar (Figure 3). For example, ME support may be driven by a desire to reduce climate change and the harmful environmental effects of fossil fuels (Table 1). Alternatively, ME opposition may be driven by a desire to protect marine biodiversity and ecosystems. Similarly, ME support may be driven by desires for improved energy affordability and new job creation, while it may be opposed because of its impacts on marine-based employment and tourism [56].
Some opposition related to renewable energy installations has been referred to as “not in my back yard” (NIMBY), where there is general support for increasing renewable energy production but resistance to development in locations near stakeholders’ communities. An example has been opposition to offshore wind development efforts, where coastal communities opposed development efforts because they felt that the turbines interfered with the natural beauty of the ocean [63]. However, NIMBY has been criticized as being a simplistic term intended to discredit the often well-founded objections of local residents [56].
Historical examples of what has been referred to as the “resource curse” (or the “paradox of plenty”) are found across the nation and around the globe. Traditionally associated with fossil and mineral resource extraction, an example of the resource curse is when a region is rich in resources, yet the local communities do not benefit from their extraction and use, while being burdened with harsh labor conditions and significant environmental and social impacts and fallout [64]. Coastal communities located near oil developments often have not received any of the promised socioeconomic benefits of the oil development, but have experienced reduced access to ocean-based livelihoods [65].
The life cycle of ME technology includes the pre-deployment testing and improvement cycle, along with associated examples of environmental, economic, social, and cross-cutting impacts and benefits. By including a pre-deployment testing and improvement cycle in the ME life cycle, unintended consequences and tradeoffs can be identified, mitigated, and avoided.
Table 1. ME deployment incurs various positive and negative effects on the surrounding community. This table provides a high-level summary of the potential social effects of ME deployment. However, communities are as unique as potential ME devices, and they have varied perceptions and values, so analysis should be developed with stakeholder input.
Social Considerations of ME
PositiveNegative
  • Improved health if displacing fossil fuels: In general, ME operation and maintenance phase impacts will not be on people.
  • Public participation [47]: In ME projects, opposition may be more related to the planning and decision-making processes than to the projects themselves. Public engagement may require additional time and resources, but will provide valuable information related to community concerns and potential conflicts early in the planning stage, when it is easier to implement changes or consider alternatives, and may lead to a greater and more robust level of support for the project. Trust is a major factor in public acceptance [56].
  • Local ownership [56], energy independence, consumer choice [56].
  • Green jobs.
  • Noise [47]: For wind turbines, noise concerns are focused on coastal communities. For ME, noise concerns are focused on anthropogenic underwater noise affecting marine ecosystems by changing coastal soundscapes [66].
  • Use restrictions: Alteration of navigation routes [47] and potential fishing, recreational use, and other maritime industry disruptions.
  • Visual interruption of the landscape [47]: This may cause follow-on economic impacts related to tourism, property value, etc. [56].
  • Construction impacts related to noise, transportation, pollution, etc. [47].
The principal driver of ME deployment is the national and global energy transition to clean renewable energy sources; therefore, social considerations of ME technologies can be improved through connection to the wider literature on the just transition to a socially beneficial energy source. Energy justice seeks to ensure that all individuals “have access to energy that is affordable, safe, sustainable and able to sustain a decent lifestyle, as well as the opportunity to participate in and lead energy decision-making processes with authority to make change” [67].
Jenkins et al. (2016) offer three energy justice tenets to identify (1) where the inequities occur, (2) who they affect, and (3) how the inequity affects them [68]. The first tenet, distributive justice, relates to understanding the unequal allocation of energy burdens and benefits, and their associated responsibilities and consequences. The second tenet, recognition justice, relates to uncovering the practice of cultural domination, exposing disregard for people and their concerns, and addressing misrecognition to allow for a more inclusive energy system. The third tenet, procedural justice, deals with the fairness of the decision-making process, and assesses whether public participation, information disclosure, decision-making transparency, and due diligence processes exist and are accessible to everyone. McCauley and Heffron (2018) added restorative justice as a fourth tenet to account for a retrospective and proactive assessment of the energy system, and to respond to those historically affected by the energy system. Therefore, justice-informed ME deployment should include analysis of energy affordability, energy insecurity, energy vulnerability, and energy access to ensure that people have access to low-GHG-emitting energy sources [69].

2.5.4. Economic Pillar

The economic pillar of sustainability (Figure 3) is vital to the success of sustainable development in a capitalist society, because little can be accomplished without ensuring that the traditional bottom line, profit margin, and competitive market are maintained. Economic factors have been the primary driver of development activities throughout history; therefore, economic tools are the most well established and well used across the three pillars. Although this historical imbalance in economic prioritization has led to many of today’s environmental and social challenges, sustainability practitioners cannot neglect the importance of economic feasibility in their research and development efforts while including the economic and social welfare of all stakeholders and communities. Furthermore, care must be taken not to externalize or ignore indirect costs and liabilities when considering the life cycle economics of ME development.
ME has two primary economic dimensions: (1) ME powers existing and future growth in marine areas that require a safe, reliable, and affordable energy source; and (2) ME enables economic development drivers for all stakeholders. While the focus of technological development has often been limited to the payback for investors, ME has the potential to provide economic benefits more holistically. There are economic dimensions to all ME life cycle stages and stakeholders involved, including investors, communities where ME is located, and those working on ME development, testing, installation, maintenance, and disposal. As ocean resources grow in importance, efforts such as the Blue Economy have emerged to sustainably develop new ocean sectors so as to promote healthy oceans [21].
Marine and coastal areas are of particular importance. In the United States, 40% of the population lives in coastal areas, despite these areas accounting for less than 10% of the total land [70]. This also does not account for the human populations living near lakes or rivers, where ME can also be implemented. Coastal communities are diverse, ranging from densely populated cities to isolated and islanded communities. Energy prices may be extremely high in coastal communities [71]. These communities are often more susceptible to climate change impacts such as sea-level rise, flooding, and hurricanes. Installation of ME in coastal areas may encourage economic development in response to the impending need for climate-related solutions. For coastal populations, ME can improve the resilience of isolated coastal and island communities, while creating economic development drivers through high-quality and well-paying jobs. As Blue Economy sectors move farther offshore and maritime transportation grows, ME will provide an essential opportunity for economic development in these sectors [22].

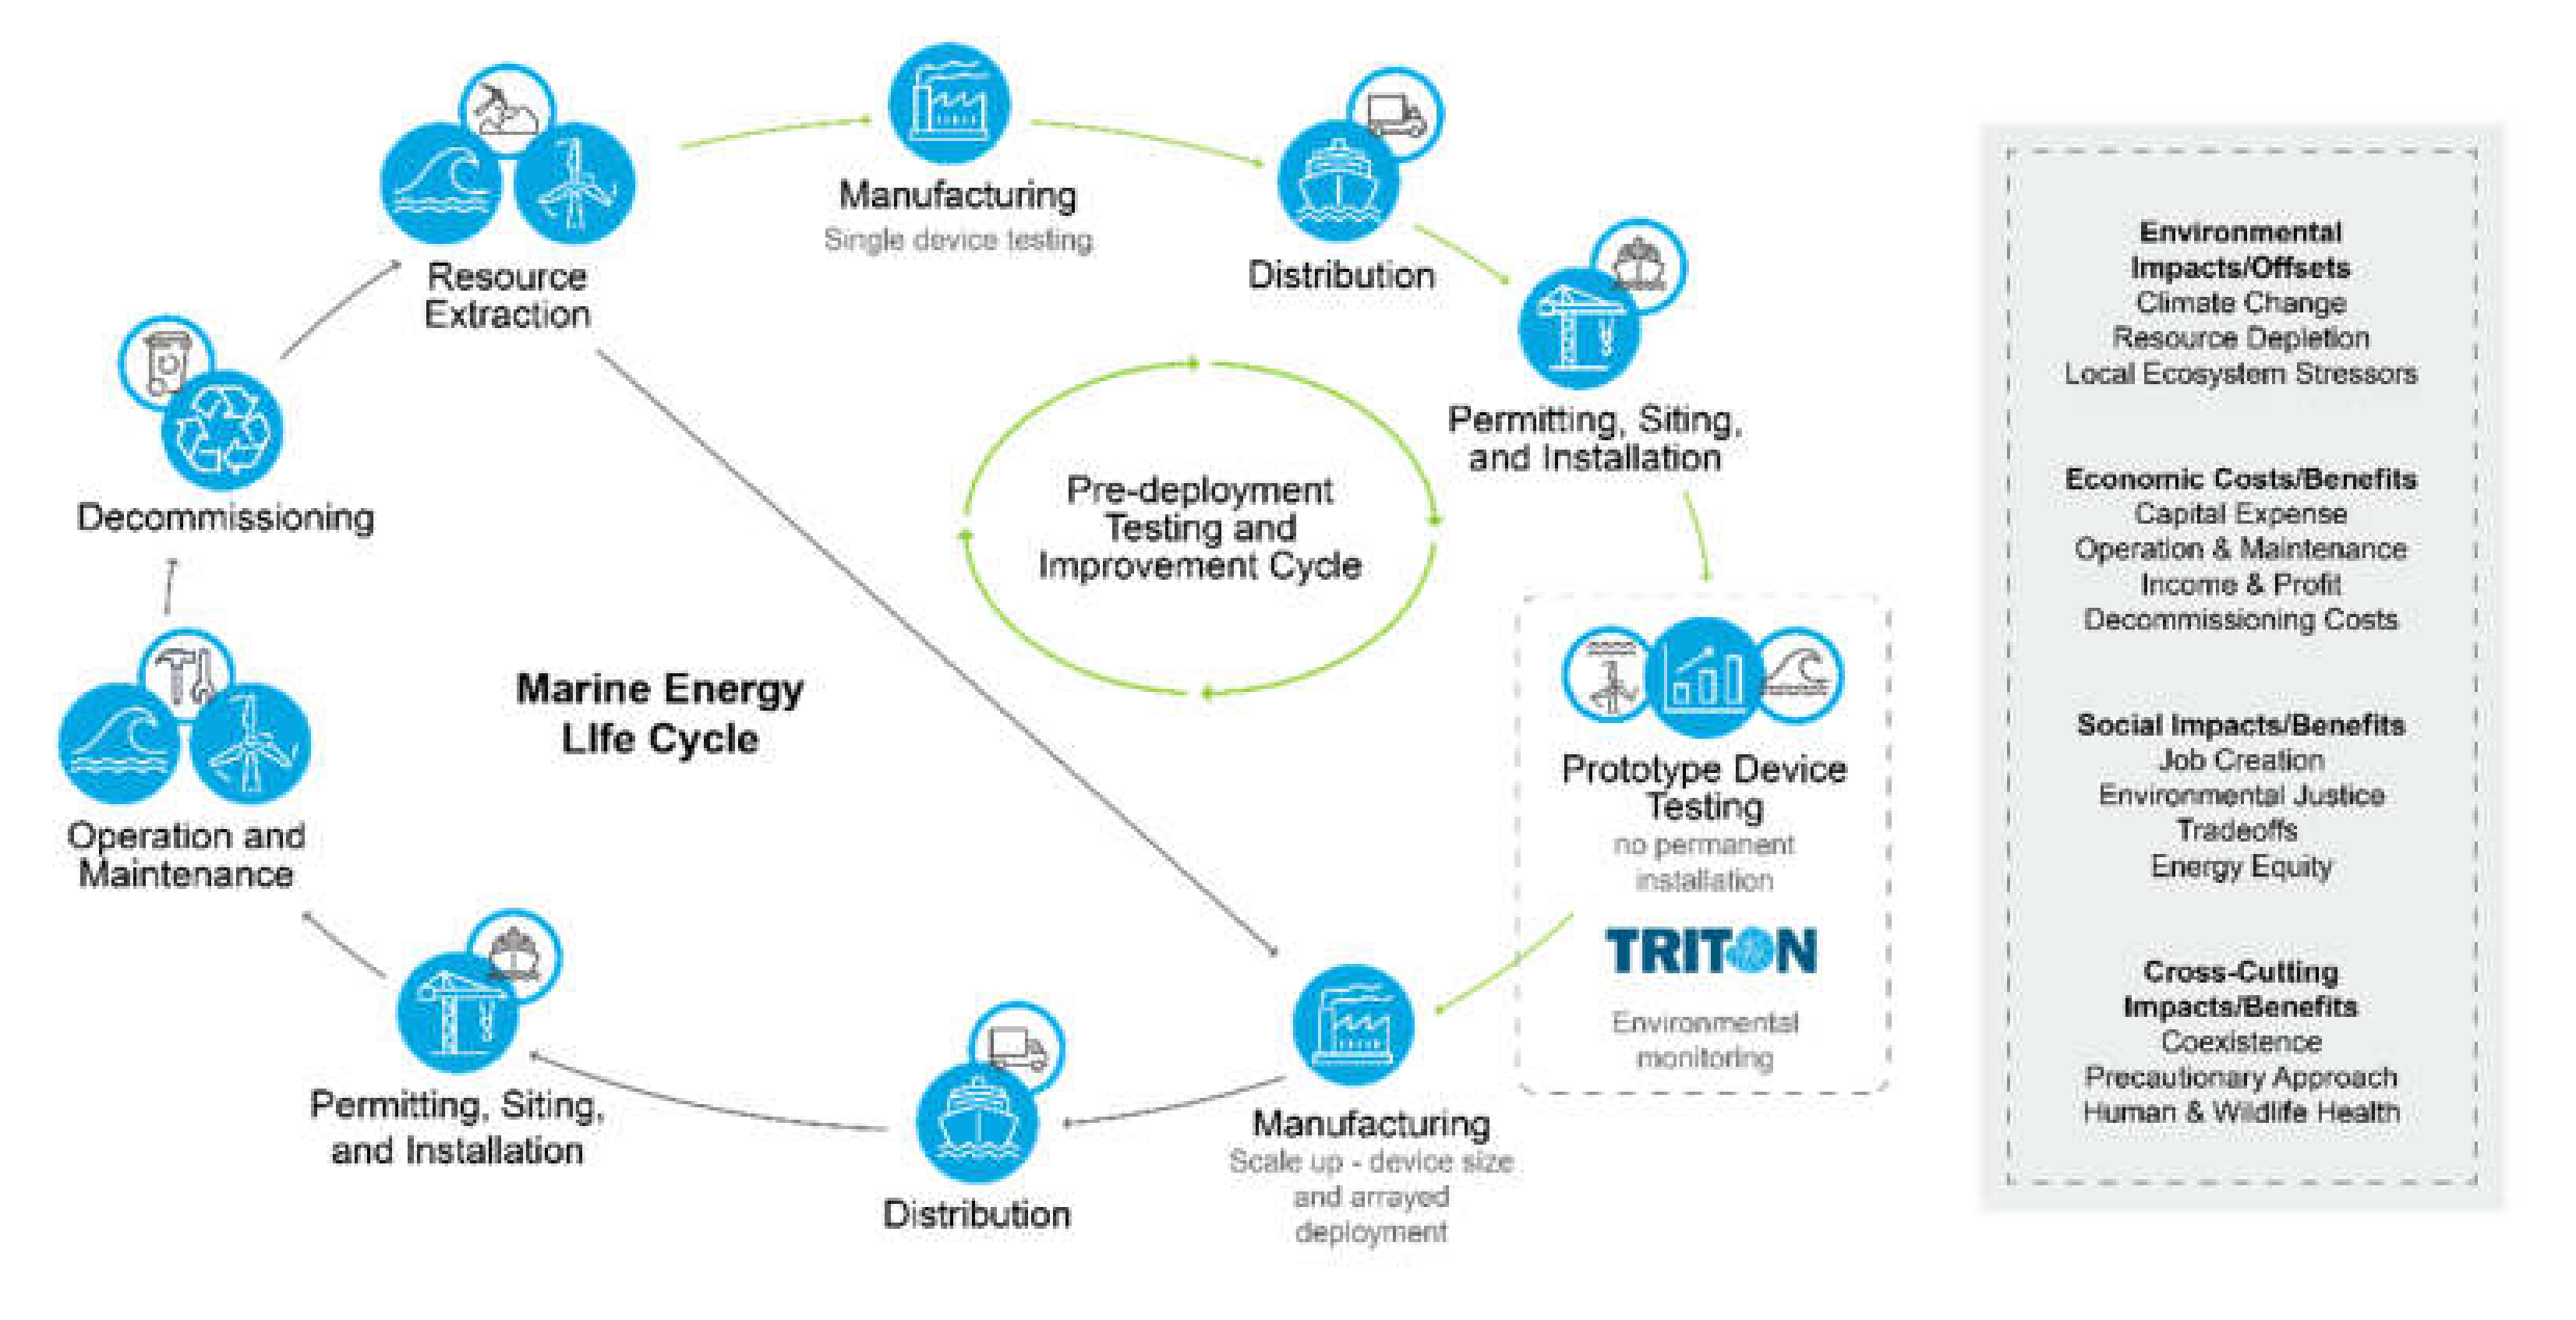
2.5.5. Sustainability Marine Monitoring Device Connection

Although the energy transition is driven by desires for a cleaner energy system, it is not without impacts. Therefore, efforts such as TFiT to evaluate, monitor, and report direct environmental and ecosystem impacts of the deployment of new ME technologies early in the design and development stages are vital to detecting and mitigating impacts prior to full-scale deployment. However, the efforts of TFiT cover only a portion of the environmental pillar in the marine environment (Figure 3). LCAs of individual ME devices have most often focused on GWP (from GHG emissions) and embodied energy (or the life cycle energy inputs required to manufacture and deploy the technology before operation—a common indicator of a range of environmental impacts). These LCAs indicate that ME technologies generally perform well in the GWP and embodied energy impact categories compared to other (renewable and fossil) electrical energy sources [72,73,74]. However, when quantifying other important environmental impact categories—such as acidification, ecotoxicity, eutrophication, land occupation, and resource depletion—tradeoffs in ME technologies have been found in metal depletion, smog formation, terrestrial ecotoxicity, and other impact categories [75]. These more comprehensive LCAs can help identify impact hotspots for mitigation in the ME design and operational process. Furthermore, environmental impacts in the marine environment that are not yet standardized for inclusion in LCA, such as those identified in this Special Issue, should be formalized for impact characterization and modeling in future LCA studies [76]. Other studies have addressed these marine impacts in light of the social acceptance of ME technologies [56]. Reliability and sizing LCC studies have also demonstrated the economic feasibility of ME devices when optimally configured for grid integration [77,78,79]. Finally, studies have shown that the levelized cost of energy for ME technologies tailored to the specific location of deployment are viable for early market adoption, but cost reductions are required for full market adoption [80].

3. Conclusions

This article summarizes the TFiT recommendations for performing environmental monitoring using various technologies and methods to measure four stressor interactions related to ME devices: collision risk, underwater noise, electromagnetic fields, and changes in habitat. Further discussion of the deployment of ME technologies and the findings of TFiT applied to the context of life cycle and environmental, economic, and social sustainability aims to inspire marine energy research to consider broader impacts and address them when possible. The lessons learned and proposed considerations are as follows:

3.1. Environmental Monitoring Recommendations

  • Establish agreed-upon technologies and methods with ME stakeholders that offer similar data outputs to improve the communication of results to regulators, because transferability of environmental monitoring data is vital to advancing understanding.
  • Continue using environmental monitoring to develop evaluation approaches that can realistically and accurately assess impacts and their effects on the users, and to inform future research requirements for the industry.
  • Time environmental monitoring campaigns around the temporal movement of critical species to achieve effective and accurate monitoring outcomes and recommendations.
  • Collaborate with stakeholders to build trust through community engagement and participatory justice processes. Conduct monitoring transparently, and ensure that results are openly accessible and understandable to general audiences to facilitate community involvement in the decision-making process and enable relationship building.

3.2. Energy Sustainability Recommendations

  • Capture life cycle environmental, economic, and social benefits, impacts, and tradeoffs related to ME. Expand LCA to include marine-specific impacts related to ME, and identify hotspots for improvement in existing impact categories. Use the broader sustainability toolkit to capture environmental, economic, and social benefits, impacts, and tradeoffs related to ME, to enable implementation that maximizes benefits and minimizes burdens. Evaluation of social impacts is essential to ensuring that the energy transition does not continue historical patterns of injustice.
  • Develop ME devices and installations using the principles of design for environment, design for repair, and design for recycling. Implement these practices early in the design process. Identify which metric results would allow technologies to move from testing to deployment early in the process.
  • Establish testing locations and a permitting process to allow for impact monitoring, including job creation, equity and inclusion, and climate solution integrations.

Author Contributions

A.M.A. and J.H.H. conceptualized this article; A.M.A. determined content; A.M.A., T.M.H. and S.R.M. developed initial outline; A.M.A., T.M.H., S.R.M., C.M.G. and J.H.H. collectively wrote, reviewed, and edited; A.M.A. provided supervision and project administration. All authors have read and agreed to the published version of the manuscript.

Funding

This research was funded by the United States Department of Energy’s Water Power Technologies Office, contract number DE-AC05-76RL01830.

Institutional Review Board Statement

Not applicable.

Informed Consent Statement

Not applicable.

Data Availability Statement

Not applicable.

Acknowledgments

We acknowledge Stephanie King for her graphic design work on Figure 1, Figure 2, Figure 3 and Figure 4. We are extremely grateful for your creativity and willingness to make so many graphics for this Special Issue. We appreciate Susan Ennor for her ability to provide technical editing and consistency among all of the TFiT articles. The lead authors from the other articles in this Special Issue provided a short summary of the main highlights from their research for Section 2.1 Thank you, Triton team; once again you have demonstrated true grit for producing scientifically robust recommendations for the marine energy community. This entire Special Issue would not have been possible without the support of Samantha Eaves, our US Department of Energy Water Power Technologies Office sponsor. The entire Triton team expresses our deep thanks for your encouragement and participation in the growth of this incredible ME program.

Conflicts of Interest

The authors declare no conflict of interest. The funders had no role in the design of the study; in the collection, analyses, or interpretation of data; in the writing of the manuscript, or in the decision to publish the results.

References

  1. Hernandez, R.R.; Jordaan, S.M.; Kaldunski, B.; Kumar, N. Aligning climate change and Sustainable Development Goals with an innovation systems roadmap for renewable power. Front. Sustain. 2020, 11. [Google Scholar] [CrossRef]
  2. Boehlert, G.W.; Gill, A.B. Environmental and ecological effects of ocean renewable energy development: A current synthesis. Oceanography 2010, 23, 68–81. [Google Scholar] [CrossRef] [Green Version]
  3. Dale, V.H.; Efroymson, R.A.; Kline, K.L. The land use–climate change–energy nexus. Landsc. Ecol. 2011, 26, 755–773. [Google Scholar] [CrossRef]
  4. Kilcher, L.; Fogarty, M.; Lawson, M. Marine Energy in the United States: An Overview of Opportunities; Office of Energy Efficiency & Renewable Energy: Washington, DC, USA, 2021. [Google Scholar]
  5. McDonald, R.I.; Fargione, J.; Kiesecker, J.; Miller, W.M.; Powell, J. Energy sprawl or energy efficiency: Climate policy impacts on natural habitat for the United States of America. PLoS ONE 2009, 4, e6802. [Google Scholar] [CrossRef] [PubMed] [Green Version]
  6. Inger, R.; Attrill, M.J.; Bearhop, S.; Broderick, A.C.; James Grecian, W.; Hodgson, D.J.; Mills, C.; Sheehan, E.; Votier, S.C.; Witt, M.J. Marine renewable energy: Potential benefits to biodiversity? An urgent call for research. J. Appl. Ecol. 2009, 46, 1145–1153. [Google Scholar] [CrossRef]
  7. Eaves, S.L.; Staines, G.; Harker-Klimeš, G.; Pinza, M.; Geerlofs, S. Triton Field Trials: Promoting Consistent Environmental Monitoring Methodologies for Marine Energy Sites. J. Mar. Sci. Eng. 2022, 10, 177. [Google Scholar] [CrossRef]
  8. Barr, Z.; Roberts, J.; Peplinski, W.; West, A.; Kramer, S.; Jones, C. The Permitting, Licensing and Environmental Compliance Process: Lessons and Experiences within US Marine Renewable Energy. Energies 2021, 14, 5048. [Google Scholar] [CrossRef]
  9. Peplinski, W.J.; Roberts, J.; Klise, G.; Kramer, S.; Barr, Z.; West, A.; Jones, C. Marine energy environmental permitting and compliance costs. Energies 2021, 14, 4719. [Google Scholar] [CrossRef]
  10. Staines, G.J.; Mueller, R.P.; Seitz, A.C.; Evans, M.D.; O’Byrne, P.W.; Wosnik, M. Capabilities of an acoustic camera to inform fish collision risk with current energy converter turbines. J. Mar. Sci. Eng. 2022, 10, 483. [Google Scholar] [CrossRef]
  11. Haxel, J.H.; Staines, G.; Martinez, J.; Zang, X.; Deng, Z. Underwater noise measurements at a tidal turbine marine energy site. J. Mar. Sci. Eng. 2022, in press. [Google Scholar]
  12. Grear, M.; McVey, J.; Cotter, E.; Williams, N.; Cavagnaro, R. Methods for quantifying background electromagnetic fields at a marine energy site. J. Mar. Sci. Eng. 2022, in press. [Google Scholar]
  13. Hemery, L.G.; Mackereth, K.F.; Gunn, C.M. Pablo, E.B. Use of a 360-degree underwater camera to characterize artificial reef and fish aggregating effects around marine energy devices. J. Mar. Sci. Eng. 2022, in press. [Google Scholar]
  14. Hemery, L.G.; Mackereth, K.F.; Tugade, L.G. What’s in My Toolkit? A Review of Technologies for Assessing Changes in Habitats Caused by Marine Energy Development. J. Mar. Sci. Eng. 2022, 10, 92. [Google Scholar] [CrossRef]
  15. Reilly, C.E.; Larson, J.; Amerson, A.M.; Staines, G.J.; Haxel, J.H.; Pattison, P.M. Minimizing Ecological Impacts of Marine Energy Lighting. J. Mar. Sci. Eng. 2022, 10, 354. [Google Scholar] [CrossRef]
  16. Buenau, K.E.; Garavelli, L.; Hemery, L.G.; García Medina, G. A Review of Modeling Approaches for Understanding and Monitoring the Environmental Effects of Marine Renewable Energy. J. Mar. Sci. Eng. 2022, 10, 94. [Google Scholar] [CrossRef]
  17. Copping, A.E.; Hemery, L.G.; Overhus, D.M.; Garavelli, L.; Freeman, M.C.; Whiting, J.M.; Gorton, A.M.; Farr, H.K.; Rose, D.J.; Tugade, L.G. Potential environmental effects of marine renewable energy development—the state of the science. J. Mar. Sci. Eng. 2020, 8, 879. [Google Scholar] [CrossRef]
  18. Gunn, C.M.; Amerson, A.M.; Adkisson, K.L.; Haxel, J.H. A Framework for Effective Science Communication and Outreach Strategies and Dissemination of Research Findings for Marine Energy Projects. J. Mar. Sci. Eng. 2022, 10, 130. [Google Scholar] [CrossRef]
  19. IRENA. Innovation Outlook: Ocean Energy Technologies; International Renewable Energy Agency: Abu Dhabi, United Arab Emirates, 2020. [Google Scholar]
  20. Jeffrey, H.; Jay, B.; Winskel, M. Accelerating the development of marine energy: Exploring the prospects, benefits and challenges. Technol. Forecast. Soc. Chang. 2013, 80, 1306–1316. [Google Scholar] [CrossRef]
  21. World Bank. The Potential of the Blue Economy: Increasing Long-term Benefits of the Sustainable Use of Marine Resources for Small Island Developing States and Coastal Least Developed Countries; World Bank: Washington, DC, USA, 2017. [Google Scholar]
  22. Geerlofs, S. Marine energy and the new blue economy. In Preparing a Workforce for the New Blue Economy; Elsevier: Amsterdam, The Netherlands, 2021; pp. 171–178. [Google Scholar]
  23. Zanker, M.; Ricci, F.; Jannach, D.; Terveen, L. Measuring the impact of personalization and recommendation on user behaviour. Int. J. Hum. -Comput. Stud. 2010, 68, 469–471. [Google Scholar] [CrossRef]
  24. Wilson, B.; Lepper, P.A.; Carter, C.; Robinson, S.P. Rethinking underwater sound-recording methods to work at tidal-stream and wave-energy sites. In Marine Renewable Energy Technology and Environmental Interactions; Springer: Berlin/Heidelberg, Germany, 2014; pp. 111–126. [Google Scholar]
  25. Chang, G.; Harker-Klimeš, G.; Raghukumar, K.; Polagye, B.; Haxel, J.; Joslin, J.; Spada, F.; Staines, G. Clearing a Path to Commercialization of Marine Renewable Energy Technologies Through Public–Private Collaboration. Front. Mar. Sci. 2021, 1180. [Google Scholar] [CrossRef]
  26. Perrow, M. Wildlife and Wind Farms—Conflicts and Solutions; Pelagic Publishing: Exeter, UK, 2019; Volume 4. [Google Scholar]
  27. Seymoure, B.; Buxton, R.; White, J.; Linares, C.; Fristrup, K.; Crooks, K.; Wittemyer, G.; Angeloni, L. Anthropogenic light disrupts natural light cycles in critical conservation areas. SSRN 2019. [Google Scholar] [CrossRef]
  28. Jägerbrand, A.K.; Bouroussis, C.A. Ecological impact of artificial light at night: Effective strategies and measures to deal with protected species and habitats. Sustainability 2021, 13, 5991. [Google Scholar] [CrossRef]
  29. Bunn, S.; Abal, E.; Smith, M.; Choy, S.; Fellows, C.; Harch, B.; Kennard, M.; Sheldon, F. Integration of science and monitoring of river ecosystem health to guide investments in catchment protection and rehabilitation. Freshw. Biol. 2010, 55, 223–240. [Google Scholar] [CrossRef] [Green Version]
  30. Hadwen, W.L.; Boon, P.I.; Arthington, A.H. Not for all seasons: Why timing is critical in the design of visitor impact monitoring programs for aquatic sites within protected areas. Australas. J. Environ. Manag. 2012, 19, 241–254. [Google Scholar] [CrossRef] [Green Version]
  31. Federal Energy Regulatory Commission. Environmental Assessment for Hydropower License: PacWave South Project; FERC Project No. 14616-001; Federal Energy Regulatory Commission: Washington, DC, USA, 2020. [Google Scholar]
  32. Ramos, T.B.; Caeiro, S.; de Melo, J.J. Environmental indicator frameworks to design and assess environmental monitoring programs. Impact Assess. Proj. Apprais. 2004, 22, 47–62. [Google Scholar] [CrossRef]
  33. Goossens, S.; Wybouw, N.; Van Leeuwen, T.; Bonte, D. The physiology of movement. Mov. Ecol. 2020, 8, 1–13. [Google Scholar] [CrossRef]
  34. Houser, D.S. A method for modeling marine mammal movement and behavior for environmental impact assessment. IEEE J. Ocean. Eng. 2006, 31, 76–81. [Google Scholar] [CrossRef]
  35. McDonald-Madden, E.; Runge, M.C.; Possingham, H.P.; Martin, T.G. Optimal timing for managed relocation of species faced with climate change. Nat. Clim. Chang. 2011, 1, 261–265. [Google Scholar] [CrossRef]
  36. Wu, P.P.-Y.; Mengersen, K.; McMahon, K.; Kendrick, G.A.; Chartrand, K.; York, P.H.; Rasheed, M.A.; Caley, M.J. Timing anthropogenic stressors to mitigate their impact on marine ecosystem resilience. Nat. Commun. 2017, 8, 1–11. [Google Scholar] [CrossRef] [Green Version]
  37. Calambokidis, J.; Steiger, G.H.; Rasmussen, K.; Urbán, J.; Balcomb, K.C.; Salinas, M.; Jacobsen, J.K.; Baker, C.S.; Herman, L.M.; Cerchio, S. Migratory destinations of humpback whales that feed off California, Oregon and Washington. Mar. Ecol. Prog. Ser. 2000, 192, 295–304. [Google Scholar] [CrossRef] [Green Version]
  38. Martien, K.K.; Hancock-Hanser, B.L.; Lauf, M.; Taylor, B.L.; Archer, F.I.; Urbán, J.; Steel, D.; Baker, C.S.; Calambokidis, J. Progress Report on Genetic Assignment of Humpback Whales from the California-Oregon Feeding Aggregation to the Mainland Mexico and Central America Wintering Grounds; U.S.Department of Commerce, NOAA Technical Memorandum NMFS-SWFSC-635: Washington, DC, USA, 2020. [Google Scholar]
  39. Hughes, S. National Environmental Policy Act of 1969 (P.L. 91-190): Bibliography; Congressional Research Service, Library of Congress: Washington, DC, USA, 1975. [Google Scholar]
  40. Shokry, G.; Connolly, J.J.; Anguelovski, I. Understanding climate gentrification and shifting landscapes of protection and vulnerability in green resilient Philadelphia. Urban Clim. 2020, 31, 100539. [Google Scholar] [CrossRef]
  41. Nakano, K.; Hirao, M. Collaborative activity with business partners for improvement of product environmental performance using LCA. J. Clean. Prod. 2011, 19, 1189–1197. [Google Scholar] [CrossRef]
  42. Elhmoud, E.R.; Kutty, A.A. Sustainability assessment in aviation industry: A mini-review on the tools, models and methods of assessment. In Proceedings of the 2nd African International Conference on Industrial Engineering and Operations Management, Harare, Zimbabwe, 7–10 December 2020; pp. 7–10. [Google Scholar]
  43. Klöpffer, W. Life cycle sustainability assessment of products. Int. J. Life Cycle Assess. 2008, 13, 89–95. [Google Scholar] [CrossRef]
  44. Gundes, S. The use of life cycle techniques in the assessment of sustainability. Procedia-Soc. Behav. Sci. 2016, 216, 916–922. [Google Scholar] [CrossRef] [Green Version]
  45. Sala, S.; Vasta, A.; Mancini, L.; Dewulf, J.; Rosenbaum, E. Social Life Cycle Assessment: State of the art and challenges for supporting product policies. JRC Tech. Rep. 2015. [Google Scholar] [CrossRef]
  46. Freeman, M.C. 2020 State of the Science Report, Chapter 9: Social and Economic Data Collection for Marine Renewable Energy; Pacific Northwest National Lab.(PNNL): Richland, WA, USA, 2020. Available online: https://www.osti.gov/servlets/purl/1633195/ (accessed on 14 March 2022).
  47. Rivera, G.; Felix, A.; Mendoza, E. A review on environmental and social impacts of thermal gradient and tidal currents energy conversion and application to the case of chiapas, Mexico. Int. J. Environ. Res. Public Health 2020, 17, 7791. [Google Scholar] [CrossRef]
  48. Miller, S.A.; Landis, A.E.; Theis, T.L. Feature: Environmental trade-offs of biobased production. Environ. Sci. Technol. 2007, 41, 5176–5182. [Google Scholar] [CrossRef] [Green Version]
  49. Danilov, A. Progress in research on fuel additives. Pet. Chem. 2015, 55, 169–179. [Google Scholar] [CrossRef]
  50. Srinivasan, C.A.; Saravanan, C. Study of combustion characteristics of an SI engine fuelled with ethanol and oxygenated fuel additives. J. Sustain. Energy Environ. 2010, 1, 85–91. [Google Scholar]
  51. Mohr, A.; Raman, S. Lessons from first generation biofuels and implications for the sustainability appraisal of second generation biofuels. Energy Policy 2013, 63, 114–122. [Google Scholar] [CrossRef]
  52. Unnasch, S. GHG Emissions Reductions Due to the RFS2: A 2018 Update; Life Cycle Associates LLC.: Portola Valley, CA, USA, 2019; Available online: https://ethanolrfa.org/file/758/LCARFSGHGUpdatefinal.pdf (accessed on 14 March 2022).
  53. Jelinski, L.W.; Graedel, T.E.; Laudise, R.A.; McCall, D.W.; Patel, C.K. Industrial ecology: Concepts and approaches. Proc. Natl. Acad. Sci. USA 1992, 89, 793–797. [Google Scholar] [CrossRef] [PubMed] [Green Version]
  54. Graedel, T. Resource Reuse and Recycling: Limitations and Potential Opportunities. Field Actions Sci. Rep. J. Field Actions 2021, 14–19. [Google Scholar]
  55. Benabdellah, A.C.; Zekhnini, K.; Cherrafi, A.; Garza-Reyes, J.A.; Kumar, A. Design for the environment: An ontology-based knowledge management model for green product development. Bus. Strategy Environ. 2021, 30, 4037–4053. [Google Scholar] [CrossRef]
  56. Bonar, P.A.; Bryden, I.G.; Borthwick, A.G. Social and ecological impacts of marine energy development. Renew. Sustain. Energy Rev. 2015, 47, 486–495. [Google Scholar] [CrossRef]
  57. Hemery, L.G. 2020 State of the Science Report, Chapter 6: Changes in Benthic and Pelagic Habitats Caused by Marine Renewable Energy Devices; Pacific Northwest National Lab.(PNNL): Richland, WA, USA, 2020. [Google Scholar]
  58. Copping, A.E.; Hemery, L.G. OES-Environmental 2020 State of the Science Report; Pacific Northwest National Lab.(PNNL): Richland, WA, USA, 2020. [Google Scholar]
  59. Whiting, J.M.; Chang, G. 2020 State of the Science Report, Chapter 7: Changes in Oceanographic Systems Associated with Marine Renewable Energy Devices; Pacific Northwest National Lab.(PNNL): Richland, WA, USA, 2020. [Google Scholar]
  60. Benoît Norris, C.; Traverso, M.; Valdivia, S.; Vickery-Niederman, G.; Franze, J.; Azuero, L.; Ciroth, A.; Mazijn, B.; Aulisio, D. The Methodological Sheets for Sub-Categories in Social Life Cycle Assessment (S-LCA); United Nations Environment Programme (UNEP) and Society for Environmental Toxicology and Chemiastry (SETAC): Nairobi, Kenya, 2013; Available online: https://www.lifecycleinitiative.org/wp-content/uploads/2013/11/S-LCA_methodological_sheets_11.11.13.pdf (accessed on 14 March 2022).
  61. Hirsch, R. The Environmental Justice Movement as a Model Politics of Risk. Polity 2021, 53, 616–644. [Google Scholar] [CrossRef]
  62. Thomas-Burton, T. EPA resources and strategies to address environmental justice challenges. Int. Public Health J. 2021, 13, 495–502. [Google Scholar]
  63. Bisbee, D.W. NEPA Review of Offshore Wind Farms: Ensuring Emission Reduction Benfits Outweigh Visual Impacts. BC Envtl. Aff. L. Rev. 2004, 31, 349. [Google Scholar]
  64. Ross, M.L. The Politics of the Resource Curse. Oxf. Handb. Politics Dev. 2018, 200. [Google Scholar] [CrossRef]
  65. Andrews, N.; Bennett, N.J.; Le Billon, P.; Green, S.J.; Cisneros-Montemayor, A.M.; Amongin, S.; Gray, N.J.; Sumaila, U.R. Oil, fisheries and coastal communities: A review of impacts on the environment, livelihoods, space and governance. Energy Res. Soc. Sci. 2021, 75, 102009. [Google Scholar] [CrossRef]
  66. Pine, M.K.; Schmitt, P.; Culloch, R.M.; Lieber, L.; Kregting, L.T. Providing ecological context to anthropogenic subsea noise: Assessing listening space reductions of marine mammals from tidal energy devices. Renew. Sustain. Energy Rev. 2019, 103, 49–57. [Google Scholar] [CrossRef] [Green Version]
  67. Carley, S.; Konisky, D.M. The justice and equity implications of the clean energy transition. Nat. Energy 2020, 5, 569–577. [Google Scholar] [CrossRef]
  68. Jenkins, K.; McCauley, D.; Heffron, R.; Stephan, H.; Rehner, R. Energy justice: A conceptual review. Energy Res. Soc. Sci. 2016, 11, 174–182. [Google Scholar] [CrossRef] [Green Version]
  69. McCauley, D.; Heffron, R. Just transition: Integrating climate, energy and environmental justice. Energy Policy 2018, 119, 1–7. [Google Scholar] [CrossRef] [Green Version]
  70. NOAA. What Percentage of the American Population Lives near the Coast? Available online: https://oceanservice.noaa.gov/facts/population.html (accessed on 14 March 2022).
  71. Rinker, M.W.; Airhart, K.M.; Anderson, D.M.; Garavelli, L.; Garayburu Caruso, O.A.; Grear, M.E.; Harris, T.M.; Huesemann, M.H.; Michener, S.R.; TeGrotenhuis, W.E.; et al. Kelp Energy Products and Marine Renewable Energy for Coastal Alaska Communities; PNNL-31092; Pacific Northwest National Laboratory (PNNL): Richland, WA, USA, 2021. [Google Scholar]
  72. Douglas, C.; Harrison, G.; Chick, J. Life cycle assessment of the Seagen marine current turbine. Proc. Inst. Mech. Eng. Part M J. Eng. Marit. Environ. 2008, 222, 1–12. [Google Scholar] [CrossRef] [Green Version]
  73. Zhai, Q.; Zhu, L.; Lu, S. Life cycle assessment of a buoy-rope-drum wave energy converter. Energies 2018, 11, 2432. [Google Scholar] [CrossRef] [Green Version]
  74. Paredes, M.G.; Padilla-Rivera, A.; Güereca, L.P. Life cycle assessment of ocean energy technologies: A systematic review. J. Mar. Sci. Eng. 2019, 7, 322. [Google Scholar] [CrossRef] [Green Version]
  75. Thomson, R.C.; Chick, J.P.; Harrison, G.P. An LCA of the Pelamis wave energy converter. Int. J. Life Cycle Assess. 2019, 24, 51–63. [Google Scholar] [CrossRef] [Green Version]
  76. Woods, J.S.; Veltman, K.; Huijbregts, M.A.; Verones, F.; Hertwich, E.G. Towards a meaningful assessment of marine ecological impacts in life cycle assessment (LCA). Environ. Int. 2016, 89, 48–61. [Google Scholar] [CrossRef] [Green Version]
  77. Lee, M.; Lu, C.; Huang, H. Reliability and cost analyses of electricity collection systems of a marine current farm—A Taiwanese case study. Renew. Sustain. Energy Rev. 2009, 13, 2012–2021. [Google Scholar] [CrossRef]
  78. Bricker, J.D.; Esteban, M.; Takagi, H.; Roeber, V. Economic feasibility of tidal stream and wave power in post-Fukushima Japan. Renew. Energy 2017, 114, 32–45. [Google Scholar] [CrossRef]
  79. Segura, E.; Morales, R.; Somolinos, J. Economic-financial modeling for marine current harnessing projects. Energy 2018, 158, 859–880. [Google Scholar] [CrossRef]
  80. Jenne, D.S.; Yu, Y.-H.; Neary, V. Levelized Cost of Energy Analysis of Marine and Hydrokinetic Reference Models. No. NREL/CP-5000-64013. In Proceedings of the 3rd Marine Energy Technology Symposium, Golden, CO, USA, 27–29 April 2015; pp. 1–9. [Google Scholar]
Figure 1. Technology and field trial locations for each stressor. Illustration modified from [7] to include energy device types (illustration by Stephanie King).
Jmse 10 00586 g001
Figure 2. The placement of each species is spatially representative of the various regions where they might be found at the PacWave marine energy test site in Newport, OR. At different times of the year, some species are in higher abundance. During these periods of time it may be more beneficial to target specific species to monitor their behavior and physiological responses to the marine energy device, or changes related to a specific environmental stressor in the space where species are most likely to be found. This illustration does not include the entirety of species included in the environmental impact assessment that informed the permitting process for this test site (illustration by Stephanie King, PNNL).
Jmse 10 00586 g002
Figure 3. The three pillars of sustainability and sustainable energy applied to marine energy (ME), with the segment of the marine environment covered by the Triton Initiative highlighted. The TFiT results are a vital to ensuring minimal impact on the marine environment by ME deployment. However, life cycle environmental, economic, and social considerations for marine and terrestrial settings must be evaluated and considered (illustration by Stephanie King, PNNL).
Jmse 10 00586 g003
Figure 4. The life cycle of marine energy (ME) technology, including the pre-deployment testing and improvement cycle, with example environmental, economic, social, and cross-cutting impacts and benefits. By including a pre-deployment testing and improvement cycle in the ME life cycle, unintended consequences and tradeoffs can be identified, mitigated, and avoided (illustration by Stephanie King, PNNL).
Jmse 10 00586 g004
Publisher’s Note: MDPI stays neutral with regard to jurisdictional claims in published maps and institutional affiliations.

