
A Cyclic Macro-Element Framework for Consolidation-Dependent Three-Dimensional Capacity of Plate Anchors


Abstract
:1. Introduction
2. Modelling Framework
2.1. Geometry and Definitions
2.2. Modelling Strategy
2.3. Macro-Element Model for the Anchor
2.4. One-Dimensional Shear and Consolidation Model for Representative Soil Element
2.4.1. One-Dimensional Consolidation Model
2.4.2. One-Dimensional Undrained Shearing Model
2.5. Soil–Anchor Compatibility Conditions
3. Modelling Analysis
3.1. Case 1: One-Dimensional Anchor Loading
3.1.1. Geometry and Model Parameters
3.1.2. Model Predictions
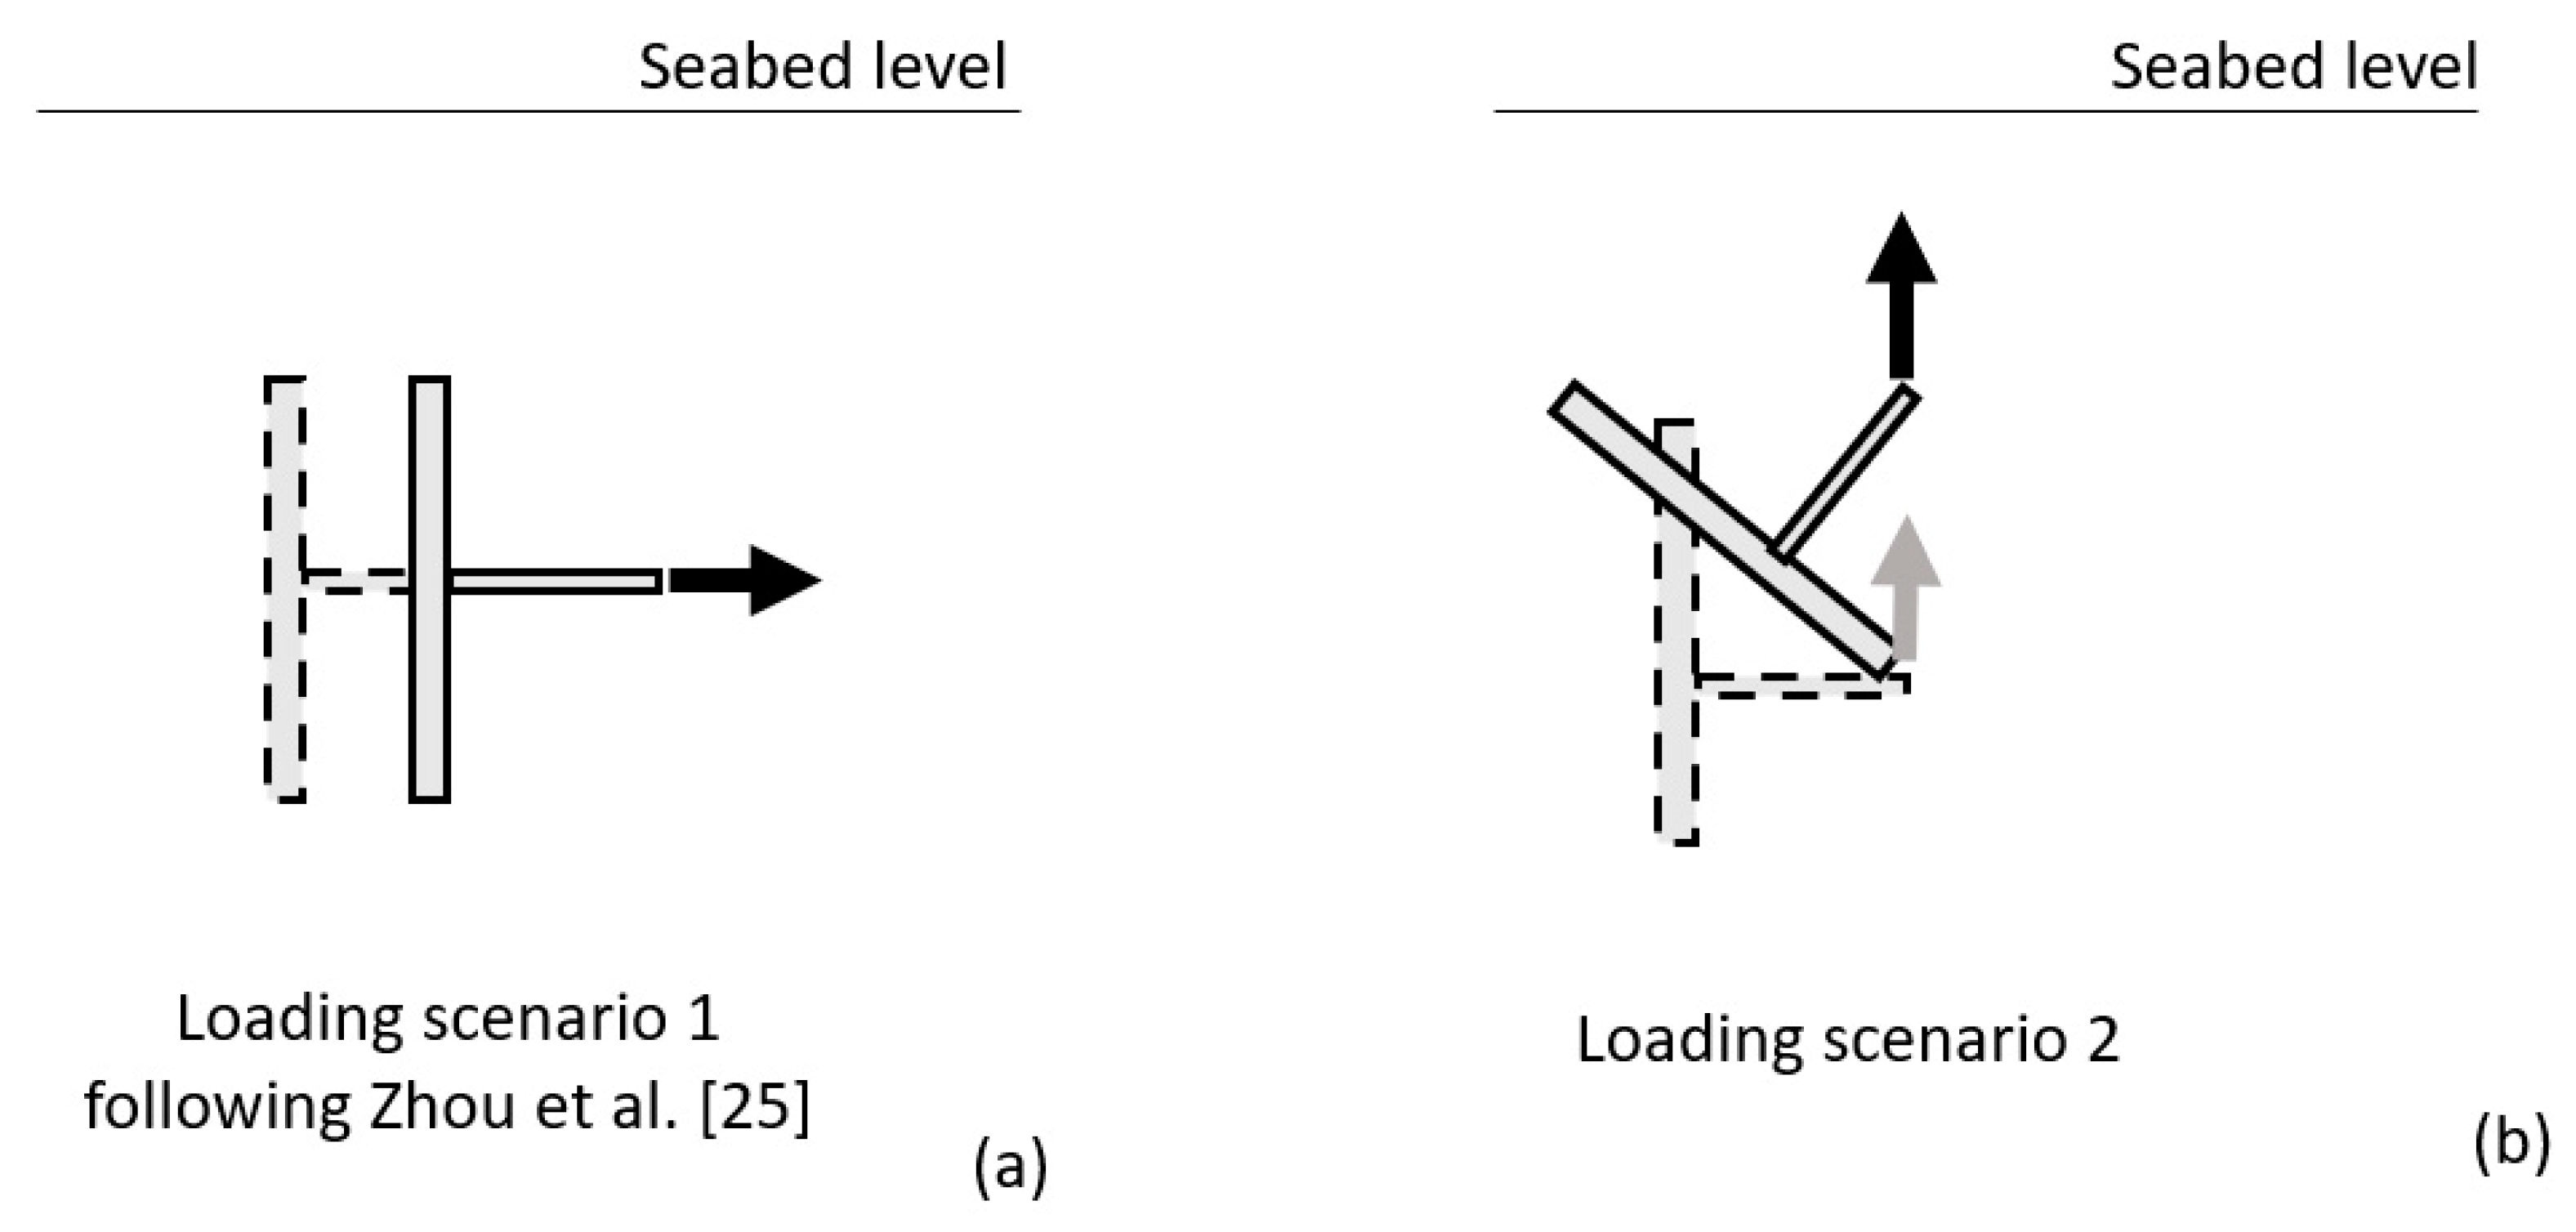
3.2. Case 2: Three-Dimensional Anchor Loading
3.2.1. Geometry and Model Parameters
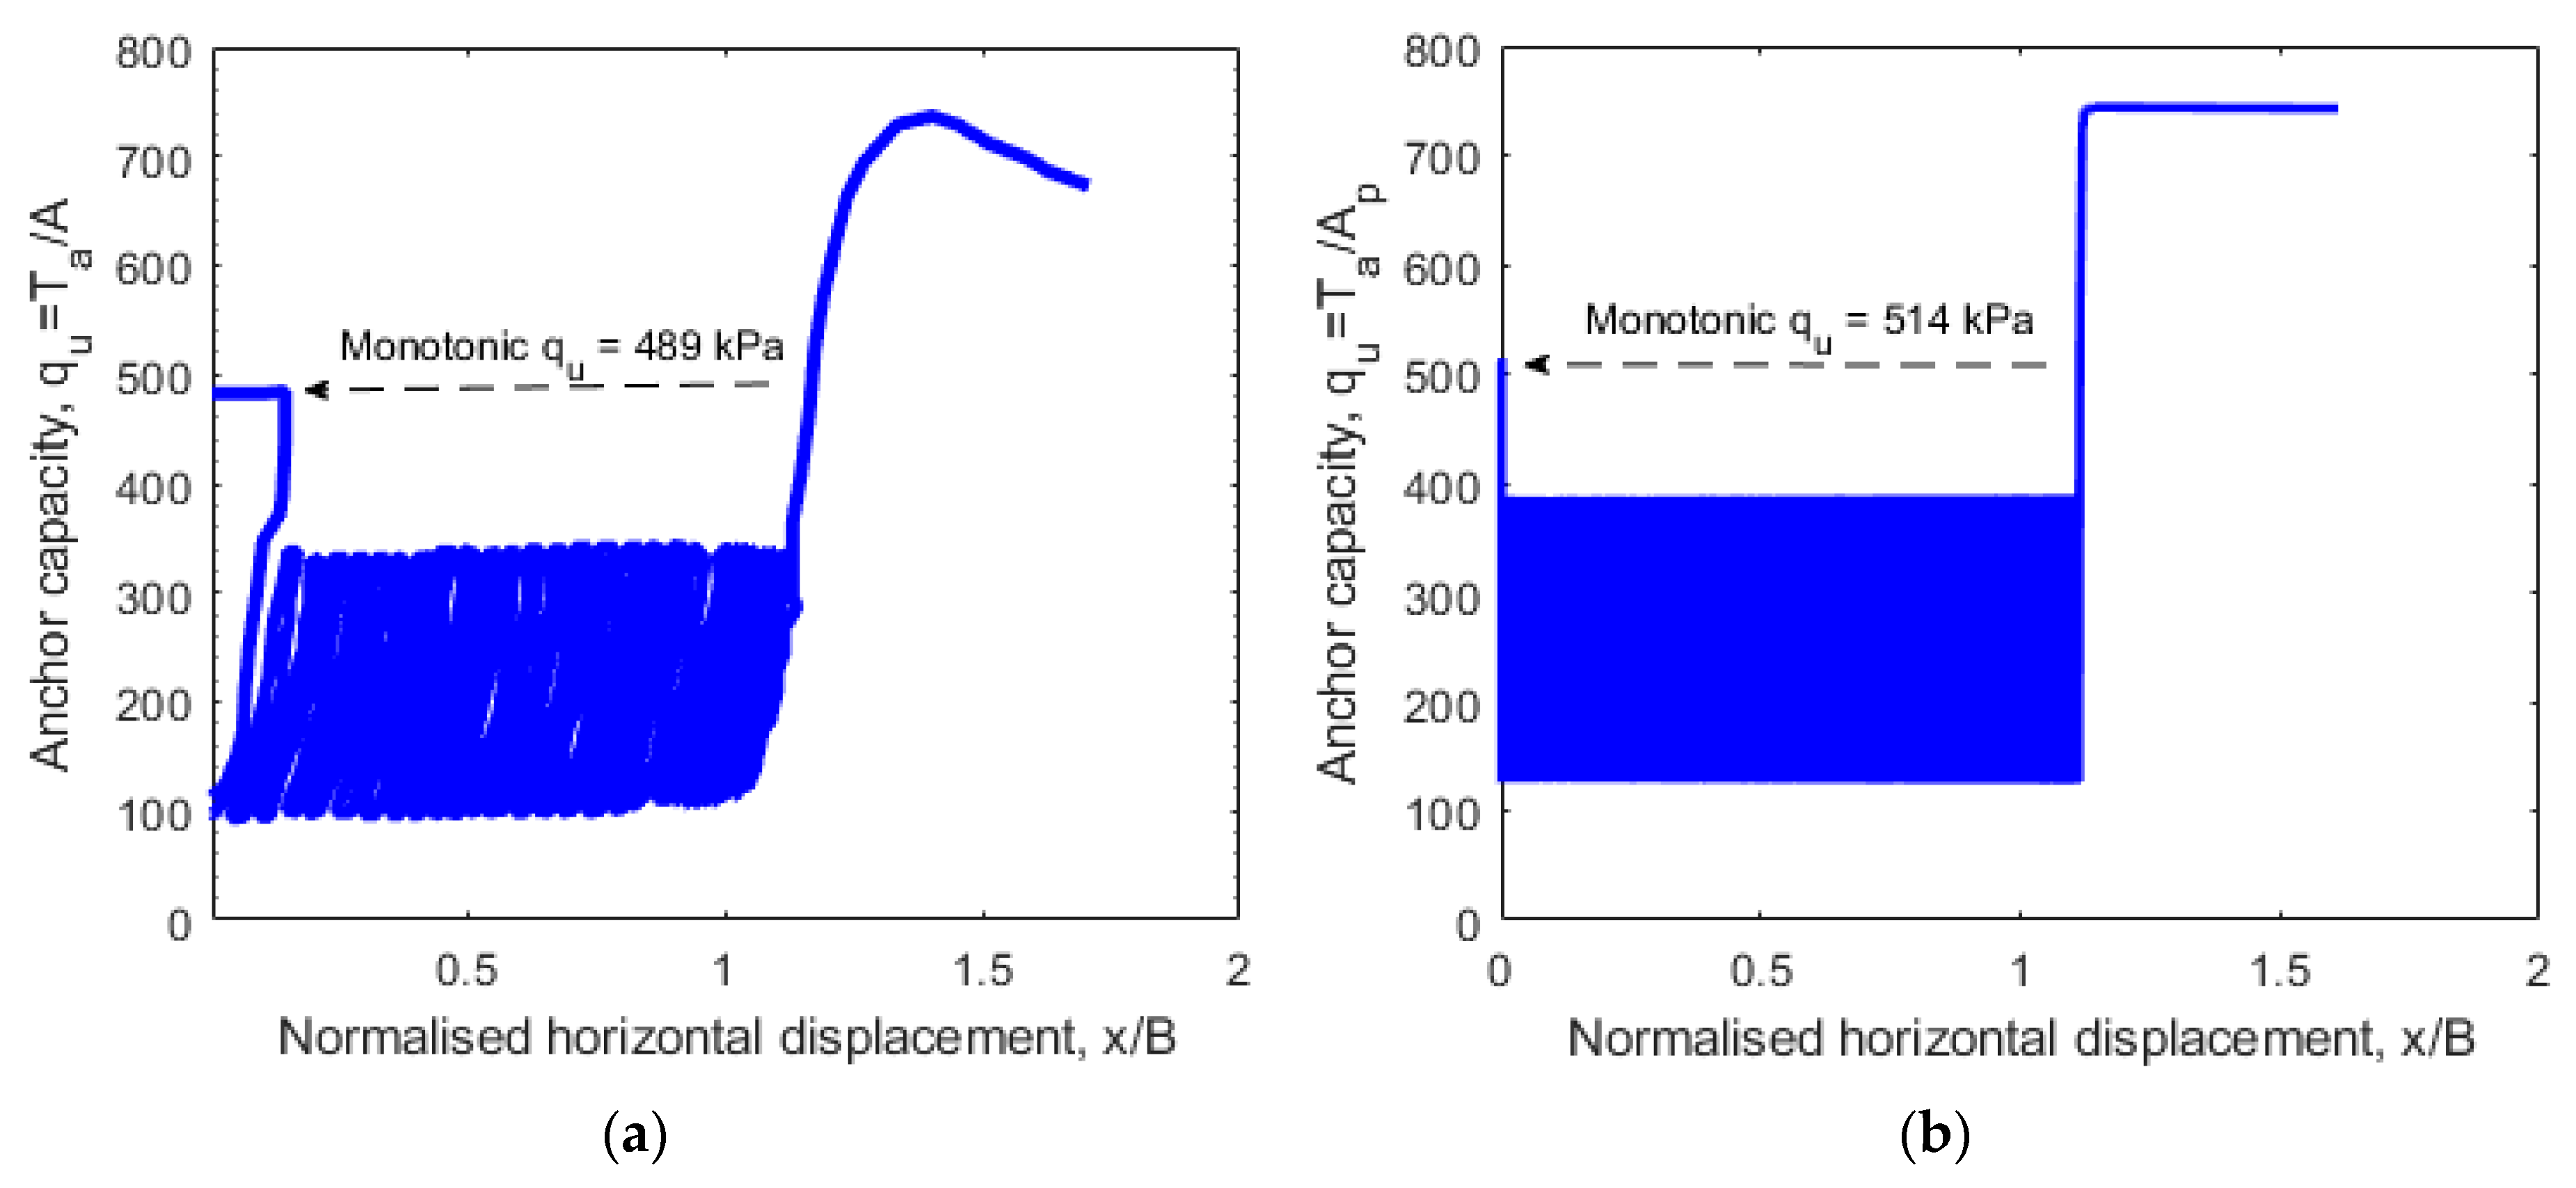
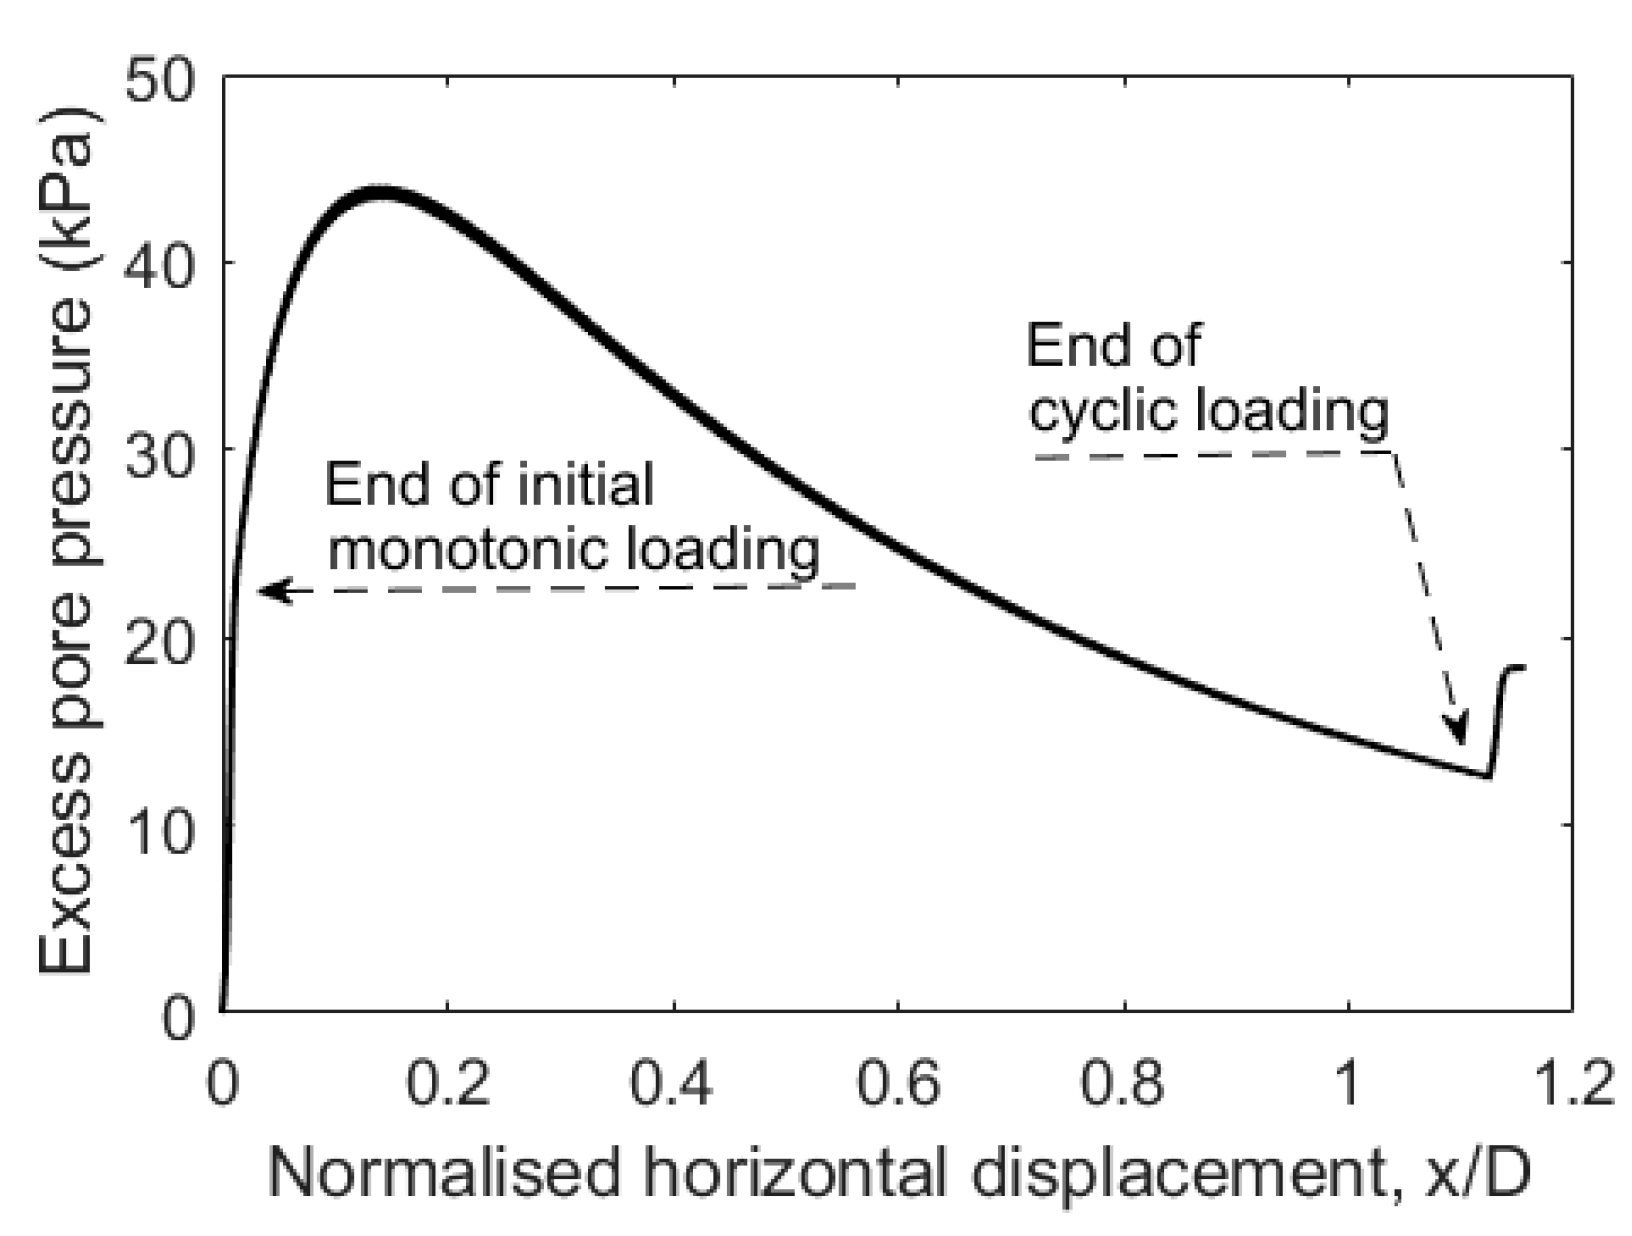
3.2.2. Model Predictions
5. Conclusions
Author Contributions
Funding
Institutional Review Board Statement
Informed Consent Statement
Acknowledgments
Conflicts of Interest
References
- Europe, W. Floating Offshore Wind Vision Statement; Wind Europe: Brussels, Belgium, 2017. [Google Scholar]
- Gaudin, C.; O’Loughlin, C.D.; Bienen, B. Geotechnical modelling for offshore renewables. In Proceedings of the 9th International Conference on Physical Modelling in Geotechnics (ICPMG 2018), London, UK, 17–20 July 2018; CRC Press: Boca Raton, FL, USA, 2018; Volume 1, p. 33. [Google Scholar]
- Tian, Y.; Gaudin, C.; Randolph, M.F.; Cassidy, M.J. Influence of padeye offset on bearing capacity of three-dimensional plate anchors. Can. Geotech. J. 2015, 52, 682–693. [Google Scholar] [CrossRef]
- Cassidy, M.J.; Gaudin, C.; Randolph, M.F.; Wong, P.C.; Wang, D.; Tian, Y. A plasticity model to assess the keying of plate anchors. Géotechnique 2012, 62, 825–836. [Google Scholar] [CrossRef]
- Yang, M.; Aubeny, C.P.; Murff, J.D. Behavior of suction embedded plate anchors during keying process. J. Geotech. Geoenviron. Eng. 2012, 138, 174–183. [Google Scholar] [CrossRef]
- Chow, S.H.; O’loughlin, C.D.; Corti, R.; Gaudin, C.; Diambra, A. Drained cyclic capacity of plate anchors in dense sand: Experimental and theoretical observations. Géotechnique Lett. 2015, 5, 80–85. [Google Scholar] [CrossRef] [Green Version]
- Chow, S.H.; Diambra, A.; O’Loughlin, C.D.; Gaudin, C.; Randolph, M.F. Consolidation effects on monotonic and cyclic capacity of plate anchors in sand. Géotechnique 2020, 70, 720–731. [Google Scholar] [CrossRef]
- Feng, T.; Xu, H.; Song, J.; Zhang, J.; Zhou, M.; Zhang, F. Finite-Element Analysis of Keying Process of Plate Anchors in Three-Layer Soft-Stiff-Soft Clay Deposits. Adv. Civ. Eng. 2019, 1–11. [Google Scholar] [CrossRef]
- Muir Wood, D.M. Geotechnical Modelling; CRC Press: Boca Raton, FL, USA, 2003. [Google Scholar]
- Skau, K.S.; Grimstad, G.; Page, A.M.; Eiksund, G.R.; Jostad, H.P. A macro-element for integrated time domain analyses representing bucket foundations for offshore wind turbines. Mar. Struct. 2018, 59, 158–178. [Google Scholar] [CrossRef]
- Page, A.M.; Grimstad, G.; Eiksund, G.R.; Jostad, H.P. A macro-element pile foundation model for integrated analyses of monopile-based offshore wind turbines. Ocean Eng. 2018, 167, 23–35. [Google Scholar] [CrossRef]
- Nova, R.; Montrasio, L. Settlements of shallow foundations on sand. Géotechnique 1991, 41, 243–256. [Google Scholar] [CrossRef]
- Gottardi, G.; Houlsby, G.T.; Butterfield, R. Plastic response of circular footings on sand under general planar loading. Géotechnique 1999, 49, 453–469. [Google Scholar] [CrossRef]
- Cremer, C.; Pecker, A.; Davenne, L. Cyclic macro-element for soil–structure interaction: Material and geometrical non-linearities. Int. J. Numer. Anal. Methods Geomech. 2001, 25, 1257–1284. [Google Scholar] [CrossRef]
- Gourvenec, S.; Stanier, S.A.; White, D.J.; Morgan, N.; Banimahd, M.; Chen, J. Whole-life assessment of subsea shallow foundation capacity. In Offshore Site Investigation Geotechnics 8th International Conference Proceeding; Society for Underwater Technology: London, UK, 2017; Volume 787, pp. 787–795. [Google Scholar]
- Laham, N.I.; Kwa, K.A.; White, D.J.; Gourvenec, S.M. Episodic direct simple shear tests to measure changing strength for whole-life geotechnical design. Géotechnique Lett. 2020, 1–24. [Google Scholar] [CrossRef]
- Corti, R.; Gourvenec, S.M.; Randolph, M.F.; Diambra, A. Application of a memory surface model to predict whole-life settlements of a sliding foundation. Comput. Geotech. 2017, 88, 152–163. [Google Scholar] [CrossRef] [Green Version]
- Houlsby, G.T.; Cassidy, M.J. A simplified mechanically based model for predicting partially drained behaviour of penetrometers and shallow foundations. Géotechnique Lett. 2011, 1, 65–69. [Google Scholar] [CrossRef]
- Flessati, L.; di Prisco, C.; Callea, F. Numerical and theoretical analyses of settlements of strip shallow foundations on normally consolidated clays under partially drained conditions. Géotechnique 2020, 1–21. [Google Scholar] [CrossRef]
- Andersen, K.H. Cyclic soil parameters for offshore foundation design. Front. Offshore Geotech. III 2015, 3–82. [Google Scholar]
- Yu, H.; Zeng, X.; Li, B.; Lian, J. Centrifuge modeling of offshore wind foundations under earthquake loading. Soil Dyn. Earthq. Eng. 2015, 77, 402–415. [Google Scholar] [CrossRef]
- Singh, S.P.; Ramaswamy, S.V. Effect of shape on holding capacity of plate anchors buried in soft soil. J. Geomech. Geoengng 2008, 3, 157–166. [Google Scholar] [CrossRef]
- Ponniah, D.A.; Finlay, T.W. Cyclic behaviour of plate anchors. Can. Geotech. J. 1988, 25, 374–381. [Google Scholar] [CrossRef]
- Zhou, Z.; White, D.J.; O’Loughlin, C.D. An effective stress framework for estimating penetration resistance accounting for changes in soil strength from maintained load, remoulding and consolidation. Géotechnique 2019, 69, 57–71. [Google Scholar] [CrossRef] [Green Version]
- Zhou, Z.; O’Loughlin, C.D.; White, D.J.; Stanier, S.A. Improvements in plate anchor capacity due to cyclic and maintained loads combined with consolidation. Géotechnique 2020, 70, 732–749. [Google Scholar] [CrossRef]
- Peccin da Silva, A.; Diambra, A.; Karamitros, D.; Chow, S.H. Macro-element modelling of plate anchor kinematics under cyclic loading in clay. In Proceedings of the International Symposium on Frontiers in Offshore Geotechnics (ISFOG), Austin, TX, USA, 16–19 August 2020. [Google Scholar]
- Peccin da Silva, A.; Diambra, A.; Karamitros, D.; Chow, S.H. A non-associative macro-element model for vertical plate anchors in clay. Can. Geotech. J. 2021. [Google Scholar] [CrossRef]
- Bransby, M.F.; O’Neill, M. Drag anchor fluke soil interaction in clays. In Proceedings of the 7th International Symposium on Numerical Models in Geomechanics, Graz, Vienna, 1999; pp. 489–494. [Google Scholar]
- O’Neill, M.P.; Bransby, M.F.; Randolph, M.F. Drag anchor fluke-soil interaction in clay. Can. Geotech. J. 2003, 40, 78–94. [Google Scholar] [CrossRef]
- Elkhatib, S.; Randolph, M.F. The effect of interface friction on the performance of drag-in plate anchors. In Proceedings of the 5th International Symposium on Frontiers in Offshore Geotechnics, Perth, Australia, 2005; pp. 171–177. [Google Scholar]
- Murff, J.D.; Randolph, M.F.; Elkhatib, S.; Kolk, H.J.; Ruinen, R.; Strom, P.J.; Thorne, C. Vertically loaded plate anchors for deepwater applications. In Proceedings of the 5th Int. Symp. on Frontiers in Offshore Geotechnics, Perth, Australia, 2005; pp. 31–48. [Google Scholar]
- Aubeny, C.P.; Chi, C.-M. Mechanics of drag embedment anchors in a soft seabed. J. Geotech. Geoenviron. Eng. 2010, 136, 57–68. [Google Scholar] [CrossRef]
- Gourvenec, S.M.; Vulpe, C.; Murthy, T.G. A method for predicting the consolidated undrained bearing capacity of shallow foundations. Géotechnique 2014, 64, 215–225. [Google Scholar] [CrossRef] [Green Version]
- Fu, D.; Gaudin, C.; Tian, C.; Bienen, B.; Cassidy, M.J. Effects of preloading with consolidation on undrained bearing capacity of skirted circular footings. Géotechnique 2015, 65, 231–246. [Google Scholar] [CrossRef]
- Corti, R.; Diambra, A.; Muir Wood, D.; Escribano Leiva, D.; Nash, D. Memory surface hardening model for granular soils under repeated loading conditions. J. Eng. Mech. 2016, 142. [Google Scholar] [CrossRef] [Green Version]
- Wood, D.M. Soil Behaviour and Critical State Soil Mechanics; Cambridge University Press: Cambridge, UK, 1990. [Google Scholar]
- Been, K.; Jefferies, M.G. A state parameter for sands. Géotechnique 1985, 35, 99–112. [Google Scholar] [CrossRef]
- Gajo, A.; Muir Wood, D. Severn-Trent sand: A kineatic-hardening constitutive model: The q-p formulation. Géotechnique 1999, 49, 595–614. [Google Scholar] [CrossRef]
- Manzari, M.T.; Dafalias, Y.F. A critical state two-surface plasticity model for sands. Géotechnique 1997, 47, 255–272. [Google Scholar] [CrossRef]
- Rowe, R.K.; Davis, H. The behaviour of plate anchors in clay. Géotechnique 1982, 32, 9–23. [Google Scholar] [CrossRef] [Green Version]
- Chow, S.H.; O’Loughlin, C.D.; Zhou, Z.; White, D.J.; Randolph, M.F. Penetrometer testing in a calcareous silt to explore changes in soil strength. Géotechnique 2020, 70, 1160–1173. [Google Scholar] [CrossRef]
- Elkhatib, S. The Behaviour of Drag-in Plate Anchors in Soft Cohesive Soils. Ph.D. Thesis, The University of Western Australia, Perth, Australia, 2006. [Google Scholar]


| PARAMETERS FOR ANCHOR | |||
|---|---|---|---|
| Parameter | Description | Value | Remarks |
| D | Diameter of anchor (m) | 5.25 | Zhou et al. [25] |
| m | Shape of loading surface (moment) | -- | |
| n | Shape of loading surface (horizontal) | -- | |
| q | Shape of loading surface (vertical) | 1 | |
| Nv | Normalised normal capacity factor | 9 | Rowe and Davis [40] |
| Nh | Normalised sliding capacity factor | -- | |
| Nm | Normalised rotational capacity factor | -- | |
| ξ | Plastic potential parameter (vertical) | -- | |
| χ | Plastic potential parameter (horizontal) | -- | |
| ω | Plastic potential parameter (moment) | -- | |
| R0 | Hardening parameter | 80 | Calibrated |
| PARAMETERS FOR SOIL | |||
| cv | Coefficient of consolidation (m2/h) | 11 | |
| ν | Poisson’s ratio | 0.1 | |
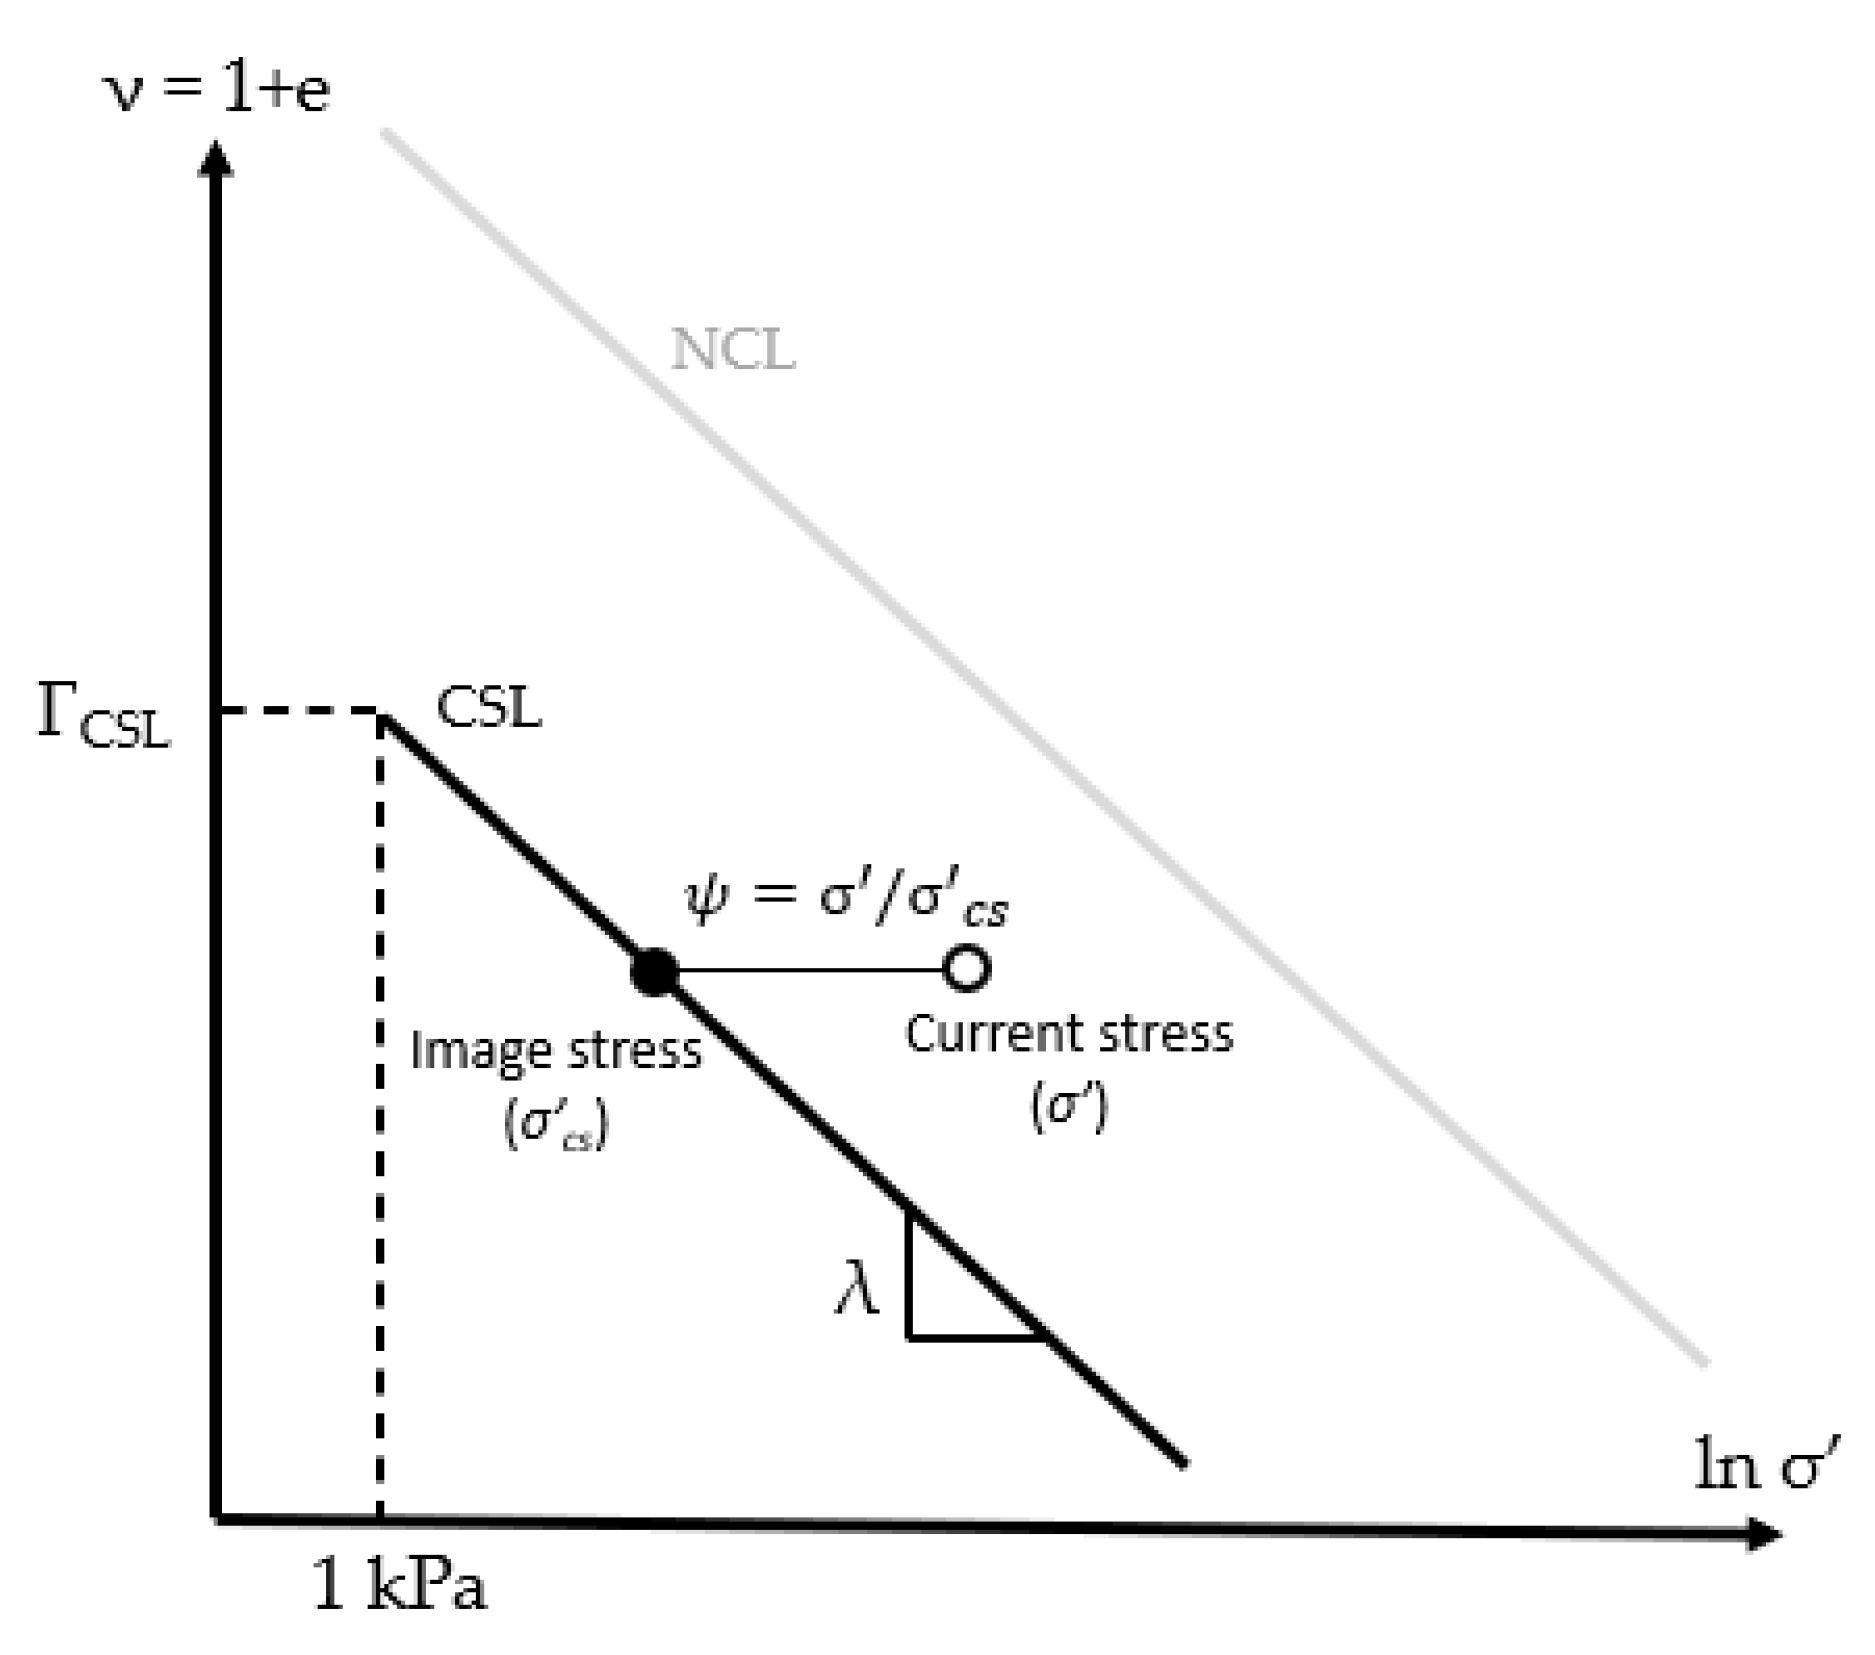
| λ | Slope of NCL and CSL | 0.287 | Chow et al. [41] |
| κ | Slope of the swelling line | 0.036 | Chow et al. [41] |
| ΓNCL | Specific volume at σv’ = 1 kPa on the NCL | 4.0 | Chow et al. [41] |
| φcs | Critical state friction angle (°) | 40 | Chow et al. [41] |
| ΓCSL | Specific volume at σv’ = 1 kPa on the CSL | 3.8 | |
| T50 | Dimensionless time factor for 50% consolidation | 0.02 | |
| a | Consolidation curve fitting | 1.15 | |
| A | Flow rule multiplier | 0.2 | |
| kd | State parameter multiplier in flow rule | 5.0 | |
| kr | Link between state parameter and strength | 2.0 | |
| C | Hyperbolic relationship parameter | 0.0002 |
| Parameter | Description | Value | Remarks |
|---|---|---|---|
| B | Anchor breadth (m) | 4.64 | Cassidy et al. [4] |
| L | Anchor width (m) | 7.92 | Cassidy et al. [4] |
| en | Padeye normal eccentricity (m) | 2.59 | Cassidy et al. [4] |
| ep | Padeye offset (m) | 0.492 | Cassidy et al. [4] |
| m | Shape of loading surface (moment) | 2 | Peccin da Silva et al. [27] |
| n | Shape of loading surface (horizontal) | 4 | Peccin da Silva et al. [27] |
| q | Shape of loading surface (vertical) | 4 | Peccin da Silva et al. [27] |
| Nv | Normalised normal capacity factor | 14 | Peccin da Silva et al. [27] |
| Nh | Normalised sliding capacity factor | 3 | Peccin da Silva et al. [27] |
| Nm | Normalised rotational capacity factor | 2 | Peccin da Silva et al. [27] |
| ξ | Plastic potential parameter (vertical) | 1.6 | Peccin da Silva et al. [27] |
| χ | Plastic potential parameter (horizontal) | 1.1 | Peccin da Silva et al. [27] |
| ω | Plastic potential parameter (moment) | 1.5 | Peccin da Silva et al. [27] |
| R0 | Hardening parameter | 1.0 | Peccin da Silva et al. [27] |
| PARAMETERS FOR SOIL | |||
| cv | Coefficient of consolidation (m2/h) | 11 | From Case 1 |
| λ | Slope of NCL and CSL | 0.287 | From Case 1 |
| κ | Slope of the swelling line | 0.036 | From Case 1 |
| ΓNCL | Specific volume at σv’ = 1 kPa on the NCL | 4.0 | From Case 1 |
| Φcs | Critical state friction angle (°) | 40 | From Case 1 |
| ΓCSL | Specific volume at σv’ = 1 kPa on the CSL | 3.8 | From Case 1 |
| T50 | Dimensionless time factor for 50% consolidation | 0.02 | From Case 1 |
| a | Consolidation curve fitting | 1.15 | From Case 1 |
| A | Flow rule multiplier | 0.2 | From Case 1 |
| kd | State parameter multiplier in flow rule | 5.0 | From Case 1 |
| kr | Link between state parameter and strength | 2.0 | From Case 1 |
| C | Hyperbolic relationship parameter | 0.0002 | From Case 1 |
Publisher’s Note: MDPI stays neutral with regard to jurisdictional claims in published maps and institutional affiliations. |
© 2021 by the authors. Licensee MDPI, Basel, Switzerland. This article is an open access article distributed under the terms and conditions of the Creative Commons Attribution (CC BY) license (http://creativecommons.org/licenses/by/4.0/).
Share and Cite
Peccin da Silva, A.; Diambra, A.; Karamitros, D.; Chow, S.H. A Cyclic Macro-Element Framework for Consolidation-Dependent Three-Dimensional Capacity of Plate Anchors. J. Mar. Sci. Eng. 2021, 9, 199. https://doi.org/10.3390/jmse9020199
Peccin da Silva A, Diambra A, Karamitros D, Chow SH. A Cyclic Macro-Element Framework for Consolidation-Dependent Three-Dimensional Capacity of Plate Anchors. Journal of Marine Science and Engineering. 2021; 9(2):199. https://doi.org/10.3390/jmse9020199
Chicago/Turabian StylePeccin da Silva, Anderson, Andrea Diambra, Dimitris Karamitros, and Shiao Huey Chow. 2021. "A Cyclic Macro-Element Framework for Consolidation-Dependent Three-Dimensional Capacity of Plate Anchors" Journal of Marine Science and Engineering 9, no. 2: 199. https://doi.org/10.3390/jmse9020199