Article

A Coupled Macroscopic and Mesoscopic Creep Model of Soft Marine Soil Using a Directional Probability Entropy Approach

1
Guangdong Engineering Research Centre for Major Infrastructure Safety, School of Civil Engineering, Sun Yat-Sen University, Guangzhou 510275, China
2
Department of Infrastructure Engineering, The University of Melbourne, Melbourne, VIC 3010, Australia
*
Author to whom correspondence should be addressed.
J. Mar. Sci. Eng. 2021, 9(2), 224; https://doi.org/10.3390/jmse9020224
Submission received: 22 January 2021 / Revised: 14 February 2021 / Accepted: 16 February 2021 / Published: 19 February 2021
(This article belongs to the Section Coastal Engineering)

Abstract

:
To mitigate the risk of structural failure in coastal engineering caused by soft marine soil creep, this study presents a coupled macroscopic and mesoscopic creep model of soft marine soil to predict long-term deformation behavior of the soil. First, the mesoscopic characteristics of soft marine soil (e.g., pore, particle, and morphological characteristics) under different external pressures were obtained using a scanning electron microscope. Then, both the mesoscopic and macroscopic characteristics of soil were quantified using directional probability entropy and then used as inputs to develop the model. The model predictions agree with the experimental data. In addition, the experimental results indicate linear negative correlations between porosity and pore ratio with stress—the relationships between the fractal dimension of pore distribution and probability entropy of particle orientation under stress are generally nonlinear. Further, results of sensitivity analysis indicate that the probability entropy of particle orientation is one of the most critical parameters governing long-term creep deformation behavior of soft marine soil.

1. Introduction

Soft marine soil is a complex multiphase mixture with unique grain composition, organic matter content, and mechanical properties. Soft marine soil has high water content [1], relatively low shear compressive strength, high pore ratio [2,3], and rheological characteristics [4]. At present, the construction of large engineering structures (e.g., offshore platforms [5], soft ground [6], artificial islands) faces great challenges when soft soil is encountered. In particular, the strain on soft soil increases with time under condition of constant stress (i.e., “creep”) [7]. Soft marine soil creep could potentially threaten the safety of engineering structures. Thus, understanding the mechanical behavior of soft marine soil is of critical importance for the safety of engineering structures [8,9].
The macroscale mechanical properties of soft marine soil are largely determined by the unique mesoscopic characteristics of soil [10]. Currently, mesoscopic structure of soft marine soil is mainly characterized using mesoscopic techniques (e.g., scanning electron microscope and optical microscopy techniques) employing both qualitative and quantitative analysis [11,12]. For example, soil particle orientation and arrangement can be characterized using a scanning electron microscope combined with computer image processing [13].
The study of the creep of soft soil can also be extended to mesoscopic scale [14]. By introducing a meso-structure model of soft marine soil and the multifractal characteristics of pores into fractal theory, the relationship between the characteristics of soft marine soil meso-structure and external load on the multifractal spectrum can be established. Theoretical approaches to modeling creep behavior of soft soil to understand the characteristics of its mesoscopic structure can be classified as empirical and semiempirical [15,16,17]. However, current theoretical models remain limited in ability to reproduce the experimentally observed creep deformation behavior of soft marine soil, as they do not take into account the evolution in mesoscopic structure.
At present, some studies on the creep or soft soil use the entropy method [18]. In this study, the meso-structure of soft marine soil under creep conditions is obtained through the evolution process of directional probability entropy, distribution dimension, porosity, and pore ratio under stress. Then, a theoretical creep model based on the directional probability entropy is established to describe the macroscopic mechanical behavior of soft marine soil as a result of meso-structure evolution over time. The model couples macroscopic and mesoscopic creep of soft marine soil based on directional probability entropy. Finally, the model is compared with the experimental data to determine its reliability.

2. Materials and Methods

2.1. Macroscopic and Mesoscopic Creep Model for Soft Marine Soil

The macroscopic engineering of soft marine soil is greatly influenced and controlled by its meso-structure, and the complex physical and mechanical properties of soft marine soil control its meso-structural characteristics. Soft marine soil creep is the external reflection of change in soil structure, so understanding the mesoscopic structure of the soft marine soil is important to elucidate its creep behavior.
The evolution law of soft marine soil structure and stress was studied by extracting the meso-structure parameters of soft marine soil during the creep. The quantitative relationships between porosity, porosity ratio, pore distribution, directional probability entropy with pore stress distribution were also determined. A schematic diagram describing the coupled macroscopic and mesoscopic creep model for soft marine soil is shown in Figure 1.

2.1.1. Modeling Mesoscopic Structure of Soft Marine Soil

The characteristics of pore, particle, and morphology can be used to describe the mesoscopic structure of soft marine soil [11]. Pore characteristics can in turn be described by pore ratio, porosity, number of pores, and average area of pores. Porosity, which reflects the degree of looseness in the soil structure, can be obtained from a mesoscopic structure image and calculated using the ratio between the total pore area and the total image area. Particle characteristic parameters include particle number and average area of particles. The average area of particles can be defined as the ratio of the total particle area to the number of particles, and reflects the size of the solid particle area inside the soil.
The characteristics of mesoscopic morphology are determined by shape factor, directional probability entropy, and fractal dimension distribution. The shape factor, which represents the deviation of the particle shapes from a standard shape, depends on flatness, shape coefficient, and roundness. The shape coefficient F can be expressed by C/S, where C is the circumference equal to the area of the particles or pores and S is the circumference of the particles or pores. With increase in the value of shape coefficient, the shape of a particle or pore approaches a circle.
In the study of soft marine soil meso-morphological characteristics, a change in the distribution intensity of a unit in a certain direction, is given by the directional distribution frequency Pi(α) of the unit of location i in location n within the range of 0~180°:
p i ( α ) = m i M × 100 % ,  
where mi is the long-axis direction of the elliptic element in location i, M is the number of units or pores, and α is the direction range, the value ranges from 0° to 180°.
Therefore, directional probability entropy (Hm) can be used to represent the order of mesoscopic structural elements in soft marine soil:
H m = i = 1 n p i ( α ) log n p i ( α ) .
Directional probability entropy reflects the degree of particle arrangement. A low directional probability entropy value indicates good alignment of the particles in the arrangement. The directional probability entropy is closely related to some other mesoscopic parameters of soft marine soil.
In addition to the above mesoscale expression methods, the following mesoscale parameters are also common in mesoscale studies. The capacity dimension is used to describe the distribution of the particle or pore fractal dimension in geotechnical engineering [19]. In a mesoscopic soil image, multiple particles along a square image with side length a are segmented into dimensions (L/a) × (L/a) along an orthogonal grid, and the grid contains particles (or parts of particles) of a total of N(a). Thus, a should be changed within a certain range to obtain corresponding sequence values, such as N(a1), N(a2), N(a3) … N(an). Therefore, the fractal dimension (Dd) of the soil particle or pore distribution can be expressed as:
D d = lim a 0 ln N ( a ) ln a = k ,
where k is the edge length and the slope of the linear part of the logarithm function of the sequence value.
Fractal dimension of distribution can comprehensively reflect the proportion and distribution of pores or particles. Generally, a small fractal dimension indicates the particles are more chaotic and loosely distributed in the soil.

2.1.2. Modeling Macroscopic Creep Deformation of Soft Marine Soil

In this study, the creep deformation behavior of soft marine soil resulting from the interaction of elasticity, viscosity, and plasticity was modeled using the Nishihara model. The Nishihara model is a typical viscoelastic plastic model developed based on the Kelvin model and Bingham model [20].
The Kelvin model is composed of spring elements and sticky pot elements in parallel [20]. Under one-dimensional condition, creep strain can be expressed as:
ε = σ E 1 ( 1 e E 1 φ 1 t ) ,
where σ and ɛ are the stress and strain, respectively, at a point in the soil, E1 is Kelvin modulus of elasticity, φ1 is the Kelvin coefficient of viscosity, and t is time.
Based on the Kelvin model, the creep strain initially increases rapidly and then gradually decreases to zero (i.e., creep strain remains constant).
The Bingham model is a typical viscoelastic plastic model composed of springs, Saint-Venant bodies, and clay pots [20]. Under a one-dimensional condition, creep strain can be described as:
ε = σ E 0 + σ σ 0 φ 2 t ,
where, E0 is the modulus of elasticity, φ2 is the Bingham viscosity coefficient, and σ0 is the critical stress.
Equation (5) indicates that, initially, the soil undergoes elastic deformation when the stress level is relatively low. With increase in strain over time, the viscoplastic deformation behavior can be seen.
Under a one-dimensional condition, the Nishihara model can be described as:
ε = σ E 0 + σ E 1 ( 1 e E 1 φ 1 t ) + σ σ 0 φ 2 t ,
such that, when σ < σ0, only the first two terms are retained on the right side of the equation. Of course, the model can also be simplified by making a = σ/E0, b = σ/E1, c = E1/φ1, and d = (σσ0)/φ2.

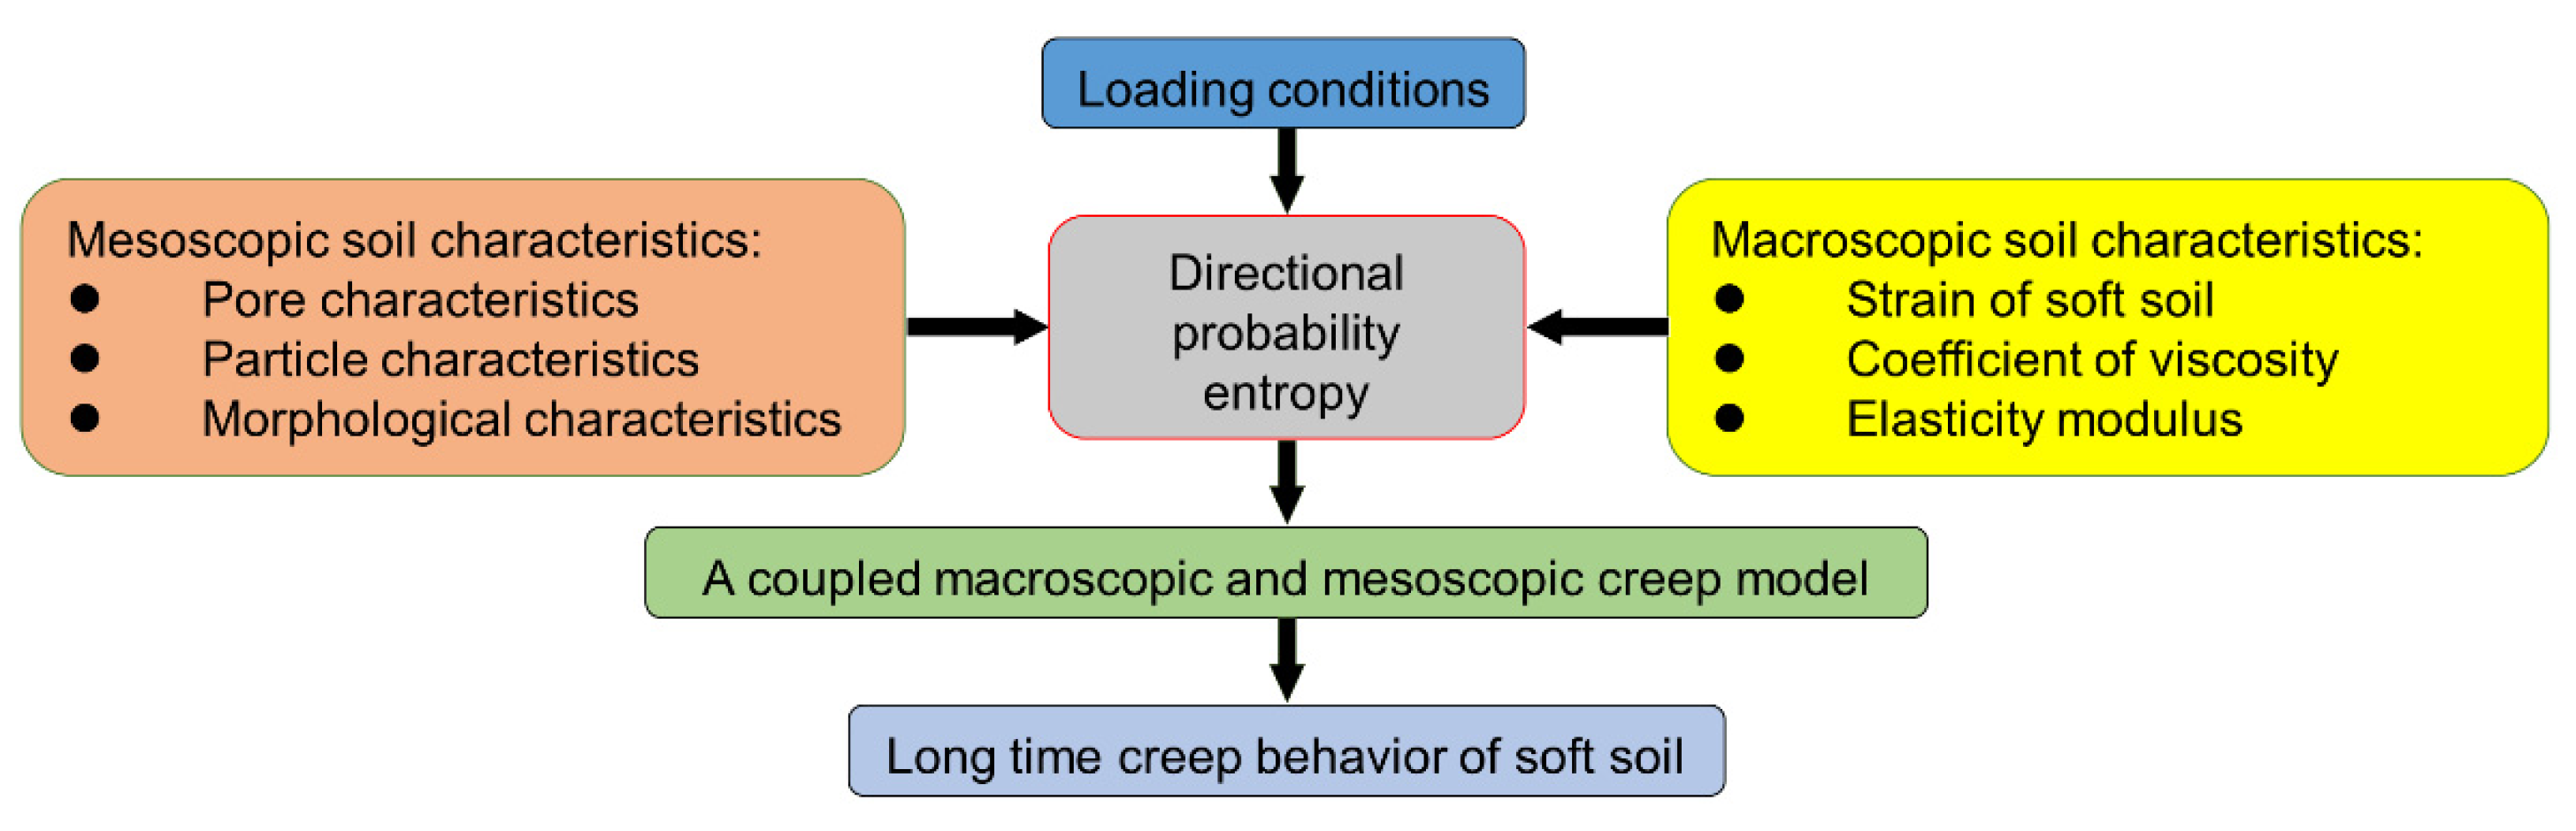
2.1.3. Developing Coupled Macroscopic and Mesoscopic Creep Model of Soft Marine Soil

If directional probability entropy is used as the bridge between macroscopic parameters and mesoscopic parameters, the relationship between each parameter value in the model and directional probability entropy can be obtained by fitting the experimental data. According to these relations and experimental results, the coupled macroscopic and mesoscopic creep model of soft marine soil can be obtained.
Using the Nishihara model (Equation (6)), the relationship between elastic modulus and viscosity coefficient with directional probability entropy can be established; that is, E0 = f0(Hm), E1 = f1(Hm), φ1 = f2(Hm), and φ2 = f3(Hm). In this way, macroscopic parameters and mesoscopic parameters can be combined to form a coupled macroscopic and mesoscopic creep model of soft marine soil (when σ < σ0, it can be expressed as Equation (7); when σ > σ0, it can be expressed as Equation (8)):
ε = σ E 0 ( H m ) + σ E 1 ( H m ) ( 1 e E 1 ( H m ) φ 1 ( H m ) t ) ,
ε = σ E 0 ( H m ) + σ E 1 ( H m ) ( 1 e E 1 ( H m ) φ 1 ( H m ) t ) + σ σ o φ 2 ( H m ) t .
Thus, a coupled macroscopic and mesoscopic creep model of soft marine soil is obtained. The contents that remain to be determined in this model include E0 = f0(Hm), E1 = f1(Hm), φ1 = f2(Hm), and φ2 = f3(Hm). Firstly, macro and meso parameters of soft marine soil creep are obtained from experiments, then these functions can be obtained through sorting.

2.2. Experimental Study

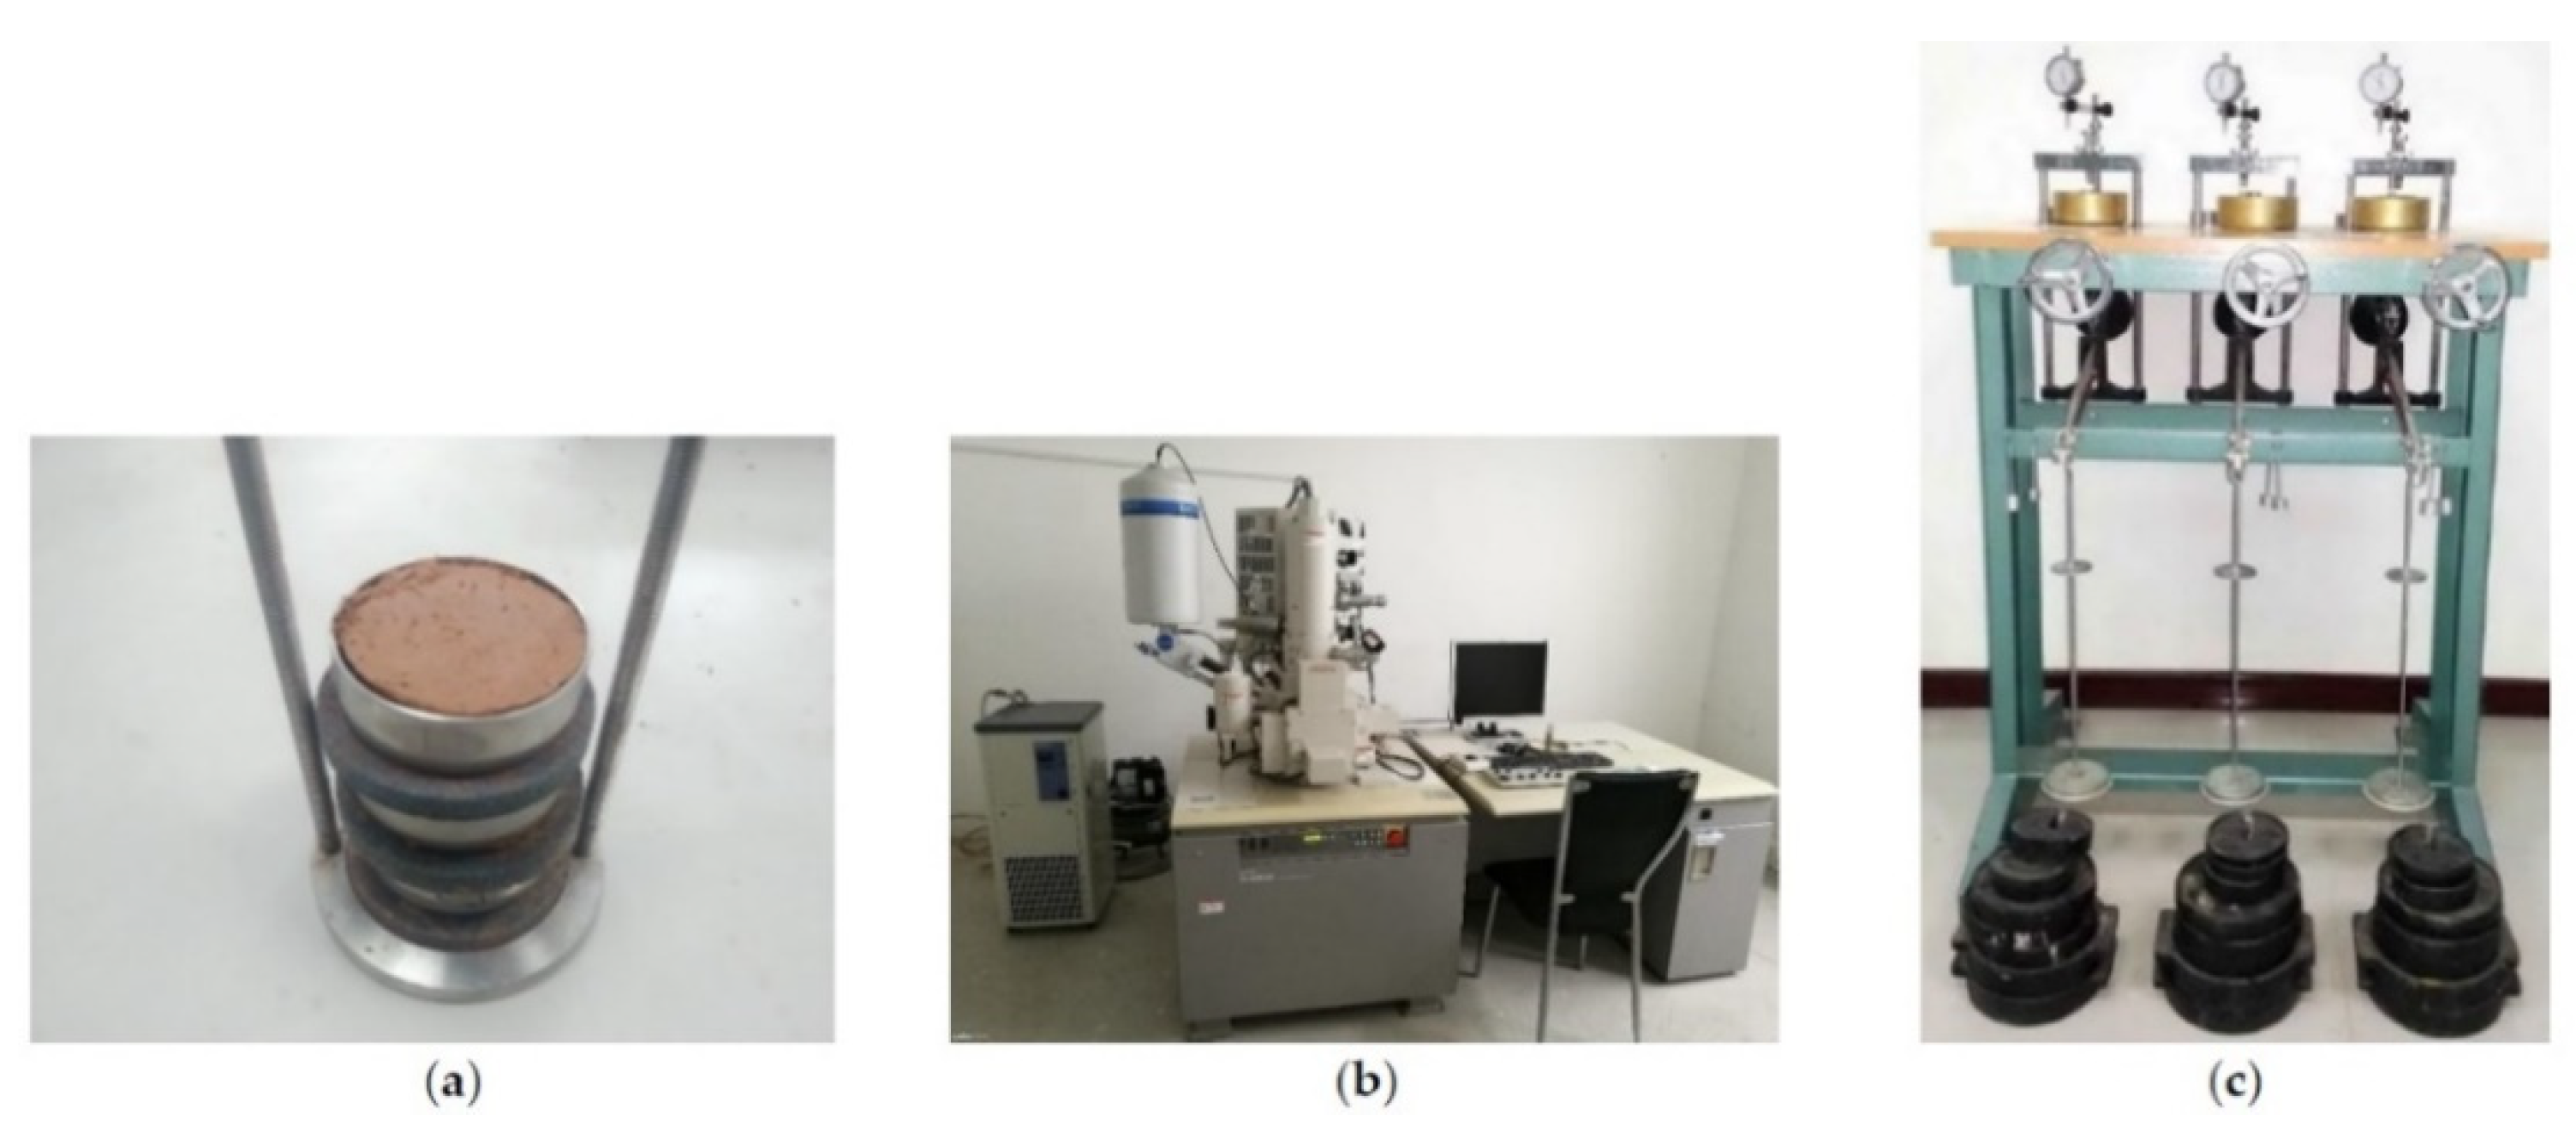
2.2.1. Preparing the Specimens

The sampling place was the Pearl River Estuary. The soil of the sampling site is soft marine soil. A total of 11 samples were taken according to standard of geotechnical test methods (GB/T 50123-1999). As shown in Figure 2a, the samples taken were gray-black saturated soft muddy clay, with a height of 20 mm and a diameter of 61.8 mm for each sample. They were then tested at the Geotechnical Engineering and Information Technology Research Centre, Sun Yat-sen University. The experimental results indicate that the density of the specimen is 1.74 g/cm3, the moisture content is 42.8%, the porosity ratio is 1.175, the saturation is 97%, the liquid limit is 35.8%, and the plastic limit is 21.6%.

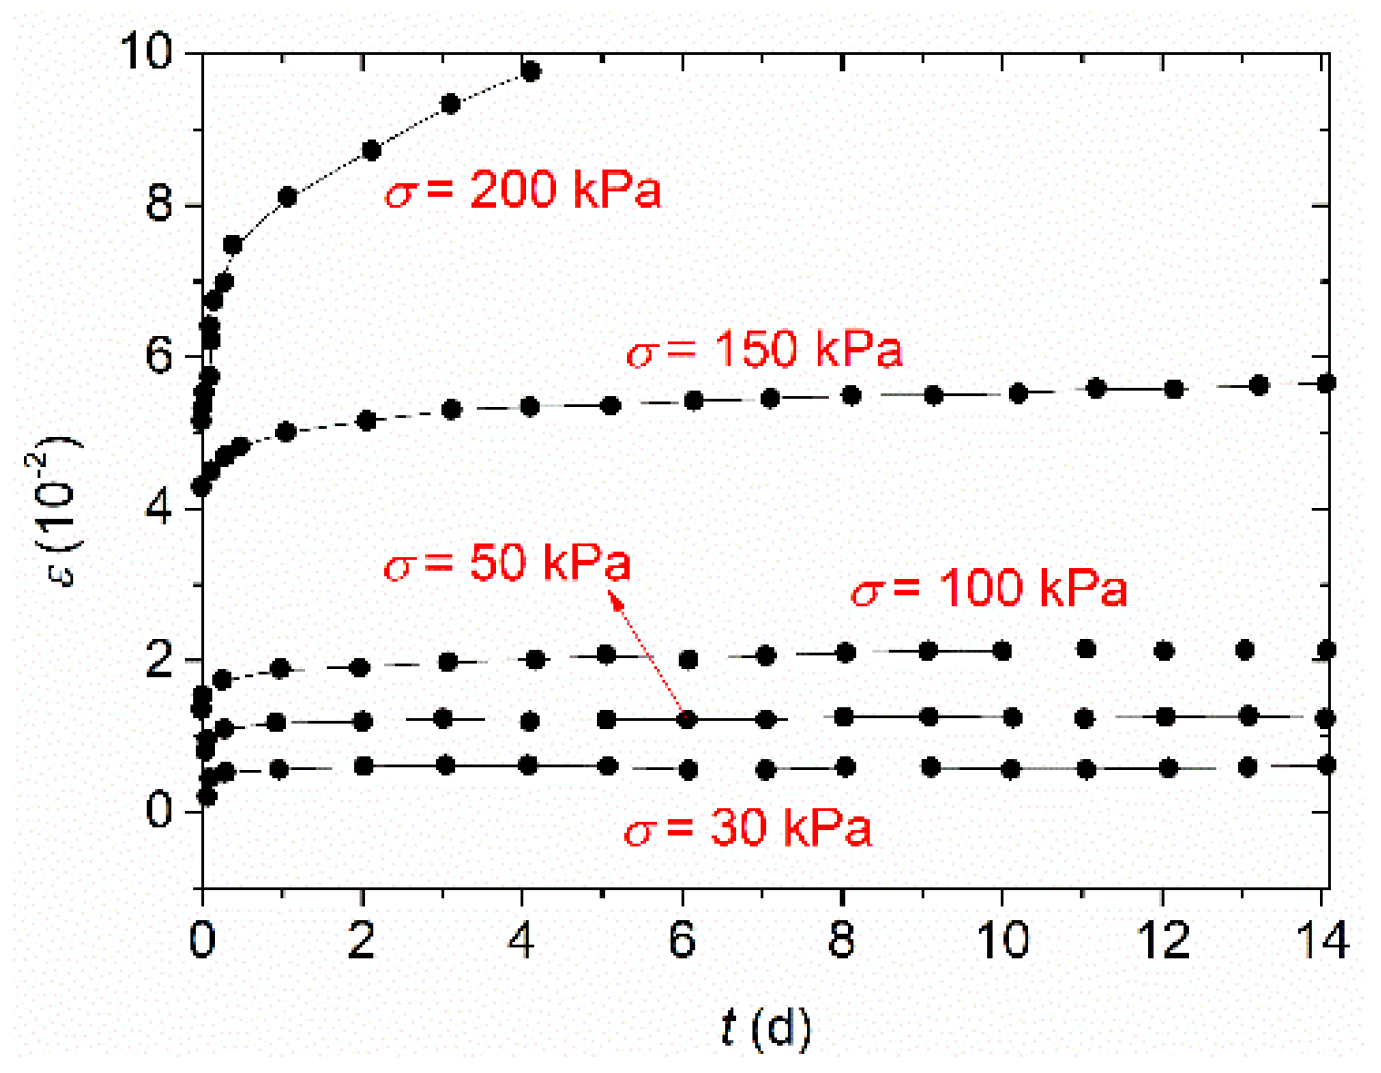
2.2.2. Measuring Macroscopic Creep Deformation of Soft Marine Soil

A prepared soil sample was firstly cut with a ring knife to remove excess soil, then wetted with water and covered with the filter paper on both sides of the sample before being weighed. The soil sample was put into the consolidation apparatus with permeable stones placed above and below the soil. As shown in Figure 2c, soft marine soil creep was tested using a consolidation apparatus. Creep deformation of soil samples was studied under 0, 30, 50, 100, 150, 200, 250, 300, 350, 400, and 450 kPa compressive loads, respectively. The macroscopic parameters required for sample determination are ɛ, E0, E1, φ1, and φ2, and these parameters are all obtained by creep experiment.

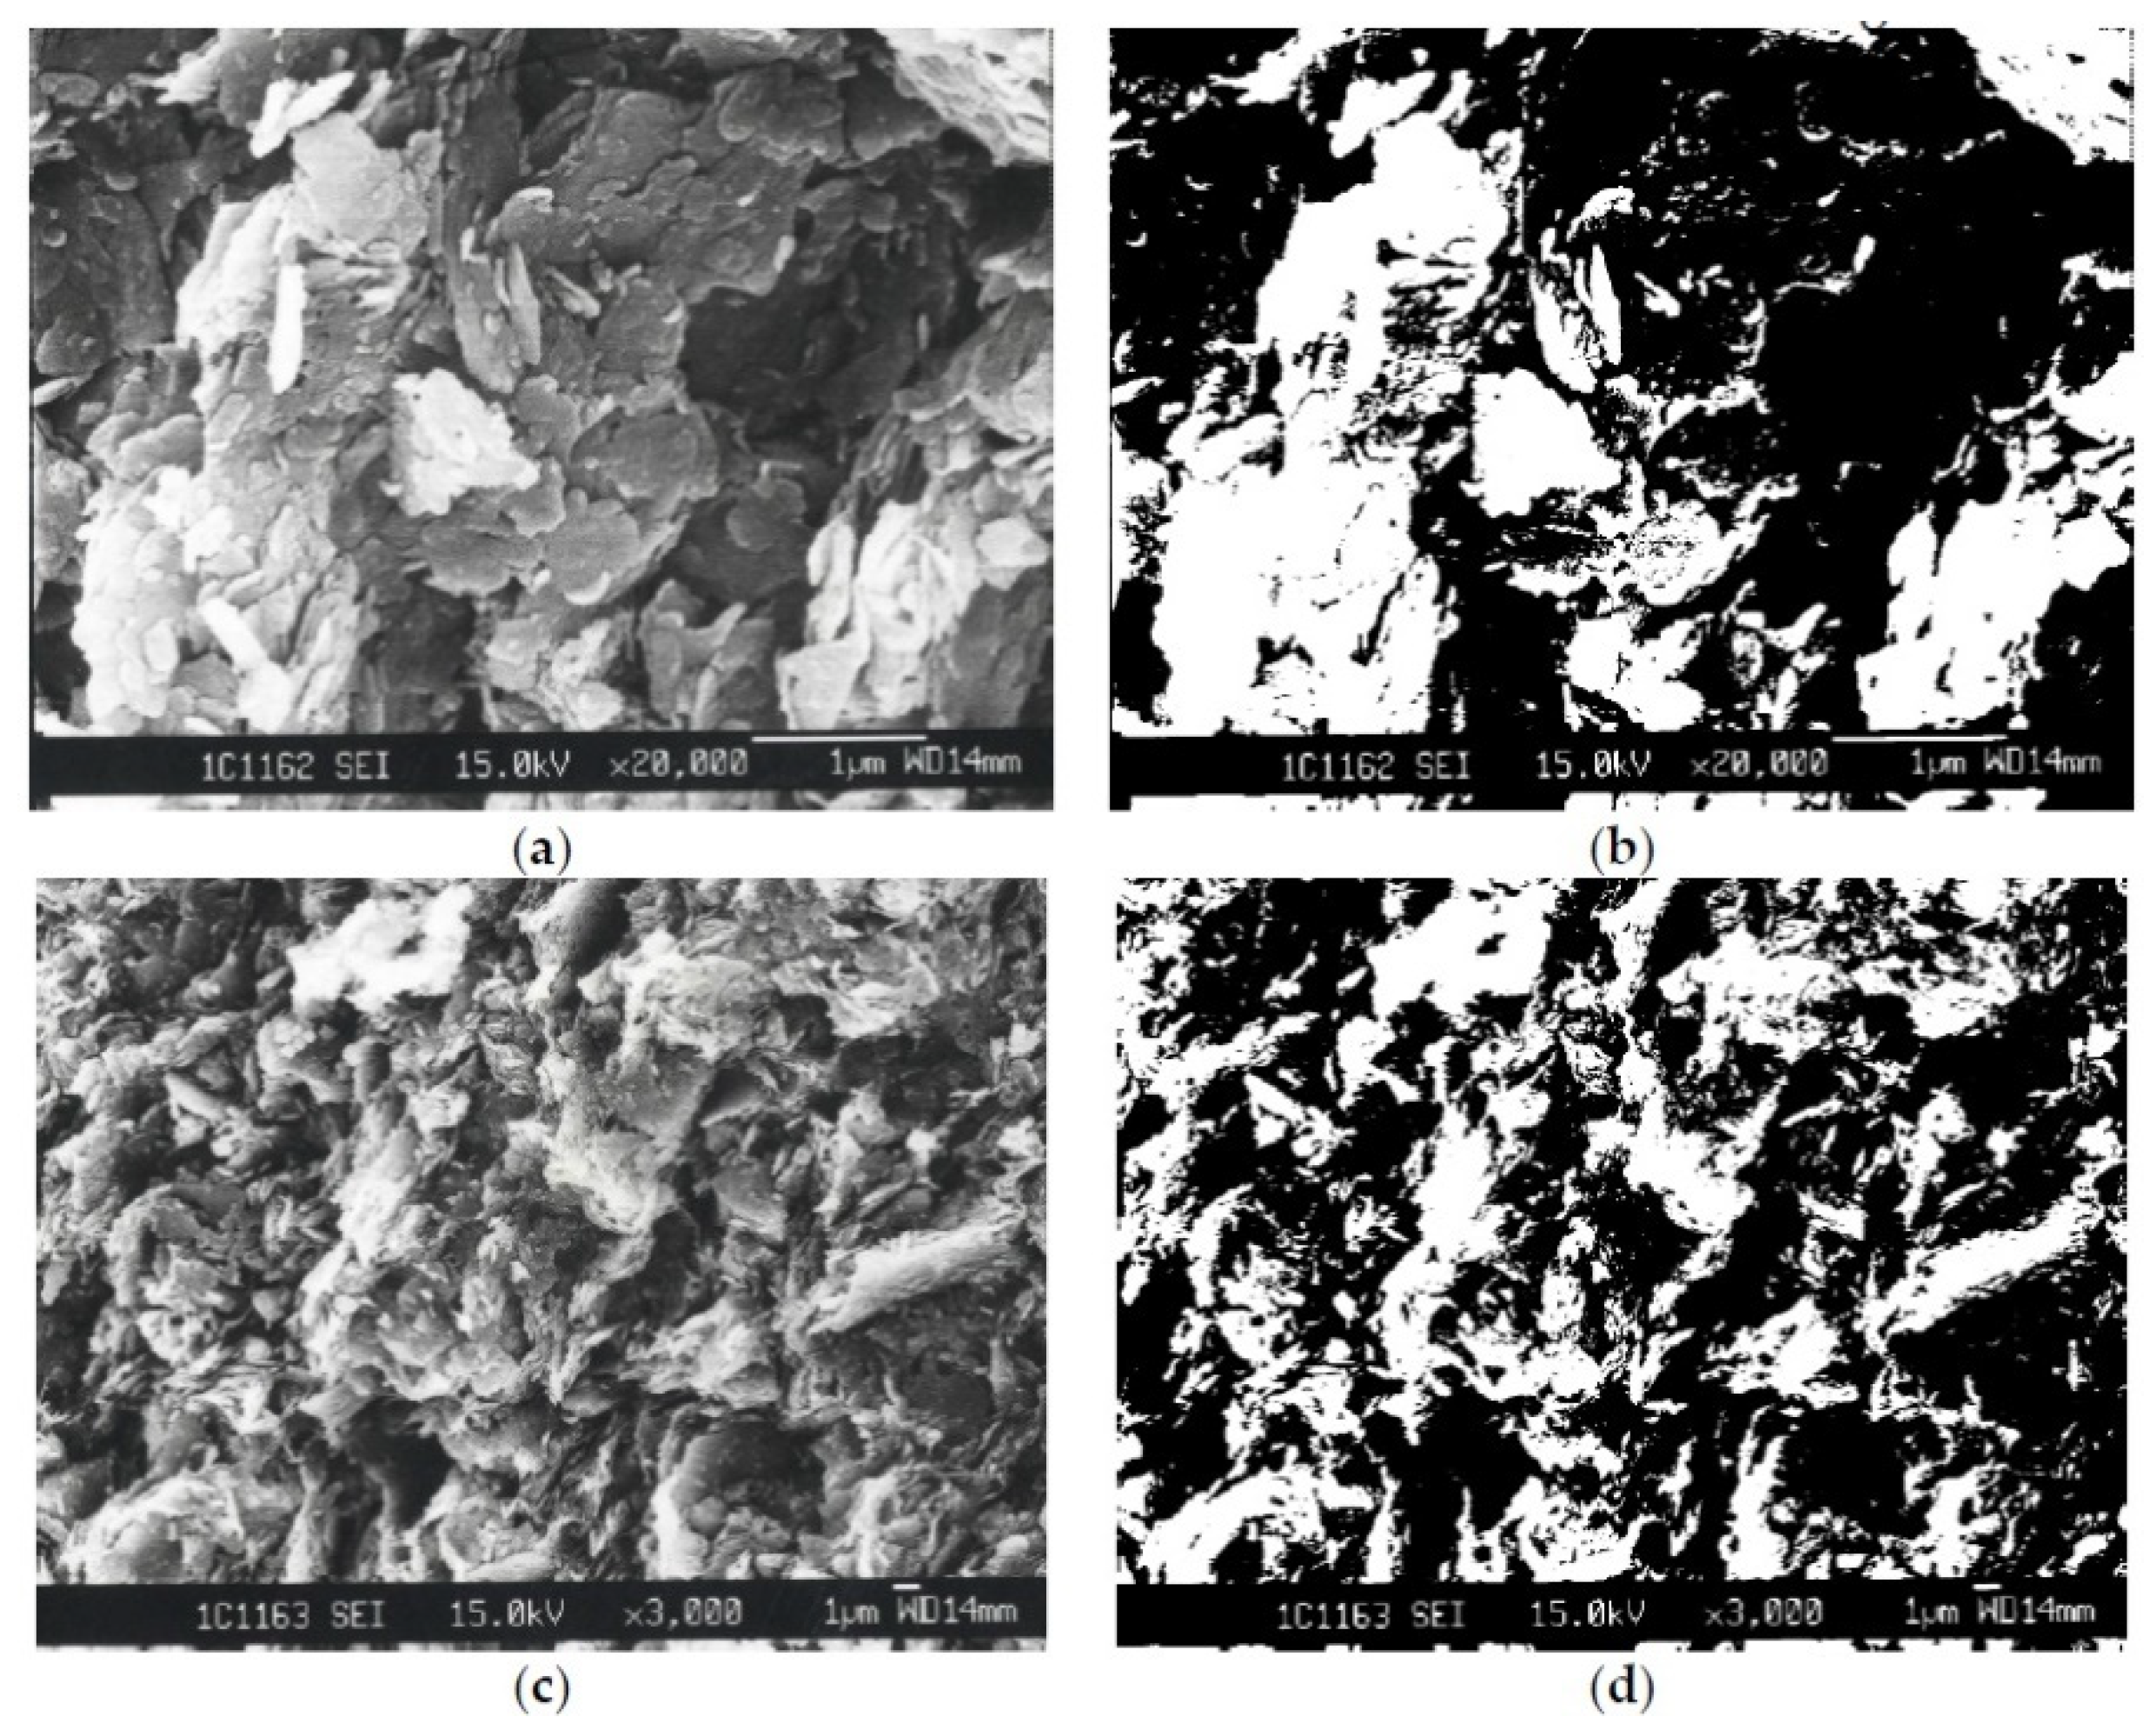
2.2.3. Measuring Mesoscopic Structure of Soft Marine Soil Samples

The sample used for soft marine soil mesoscopic structure tests is thin section. After the creep test (the next section), about 2 g of soil sample was cut from the middle of the soil sample. The mesoscopic soil samples were freeze-dried in a vacuum and placed in the EVO-MA10(W) scanning electron microscope (SEM, Figure 2b) of the Instrumental Analysis and Research Center of Sun Yat-sen University. The appropriate magnification was selected to obtain the meso-structural images. Then, the image is processed by gray scale and binarization, and the binarization image is obtained (for the processing of grayscale and binarization, refer to References [21,22]). The Photoshop software was used to measure the number, diameter and area of particles and pores, and calculate the area and perimeter of each particle to get the corresponding particle shape coefficient value. Finally, fractal dimension and directional probability entropy were calculated according to Equations (1)–(3).

3. Results and Discussion

3.1. Mesoscopic Structure of Soft Marine Soil

3.1.1. Extracting Mesoscopic Parameters during Soft Marine Soil Creep

To eliminate the influence of uneven brightness on an image, the image needs to be firstly treated before processing. Then, mesoscopic structural parameters were measured from soft marine soil images through image binarization, which converts greyscale images into black and white images with white particles and black pores. An image of the soil meso-structure before and after binarization is shown in Figure 3.

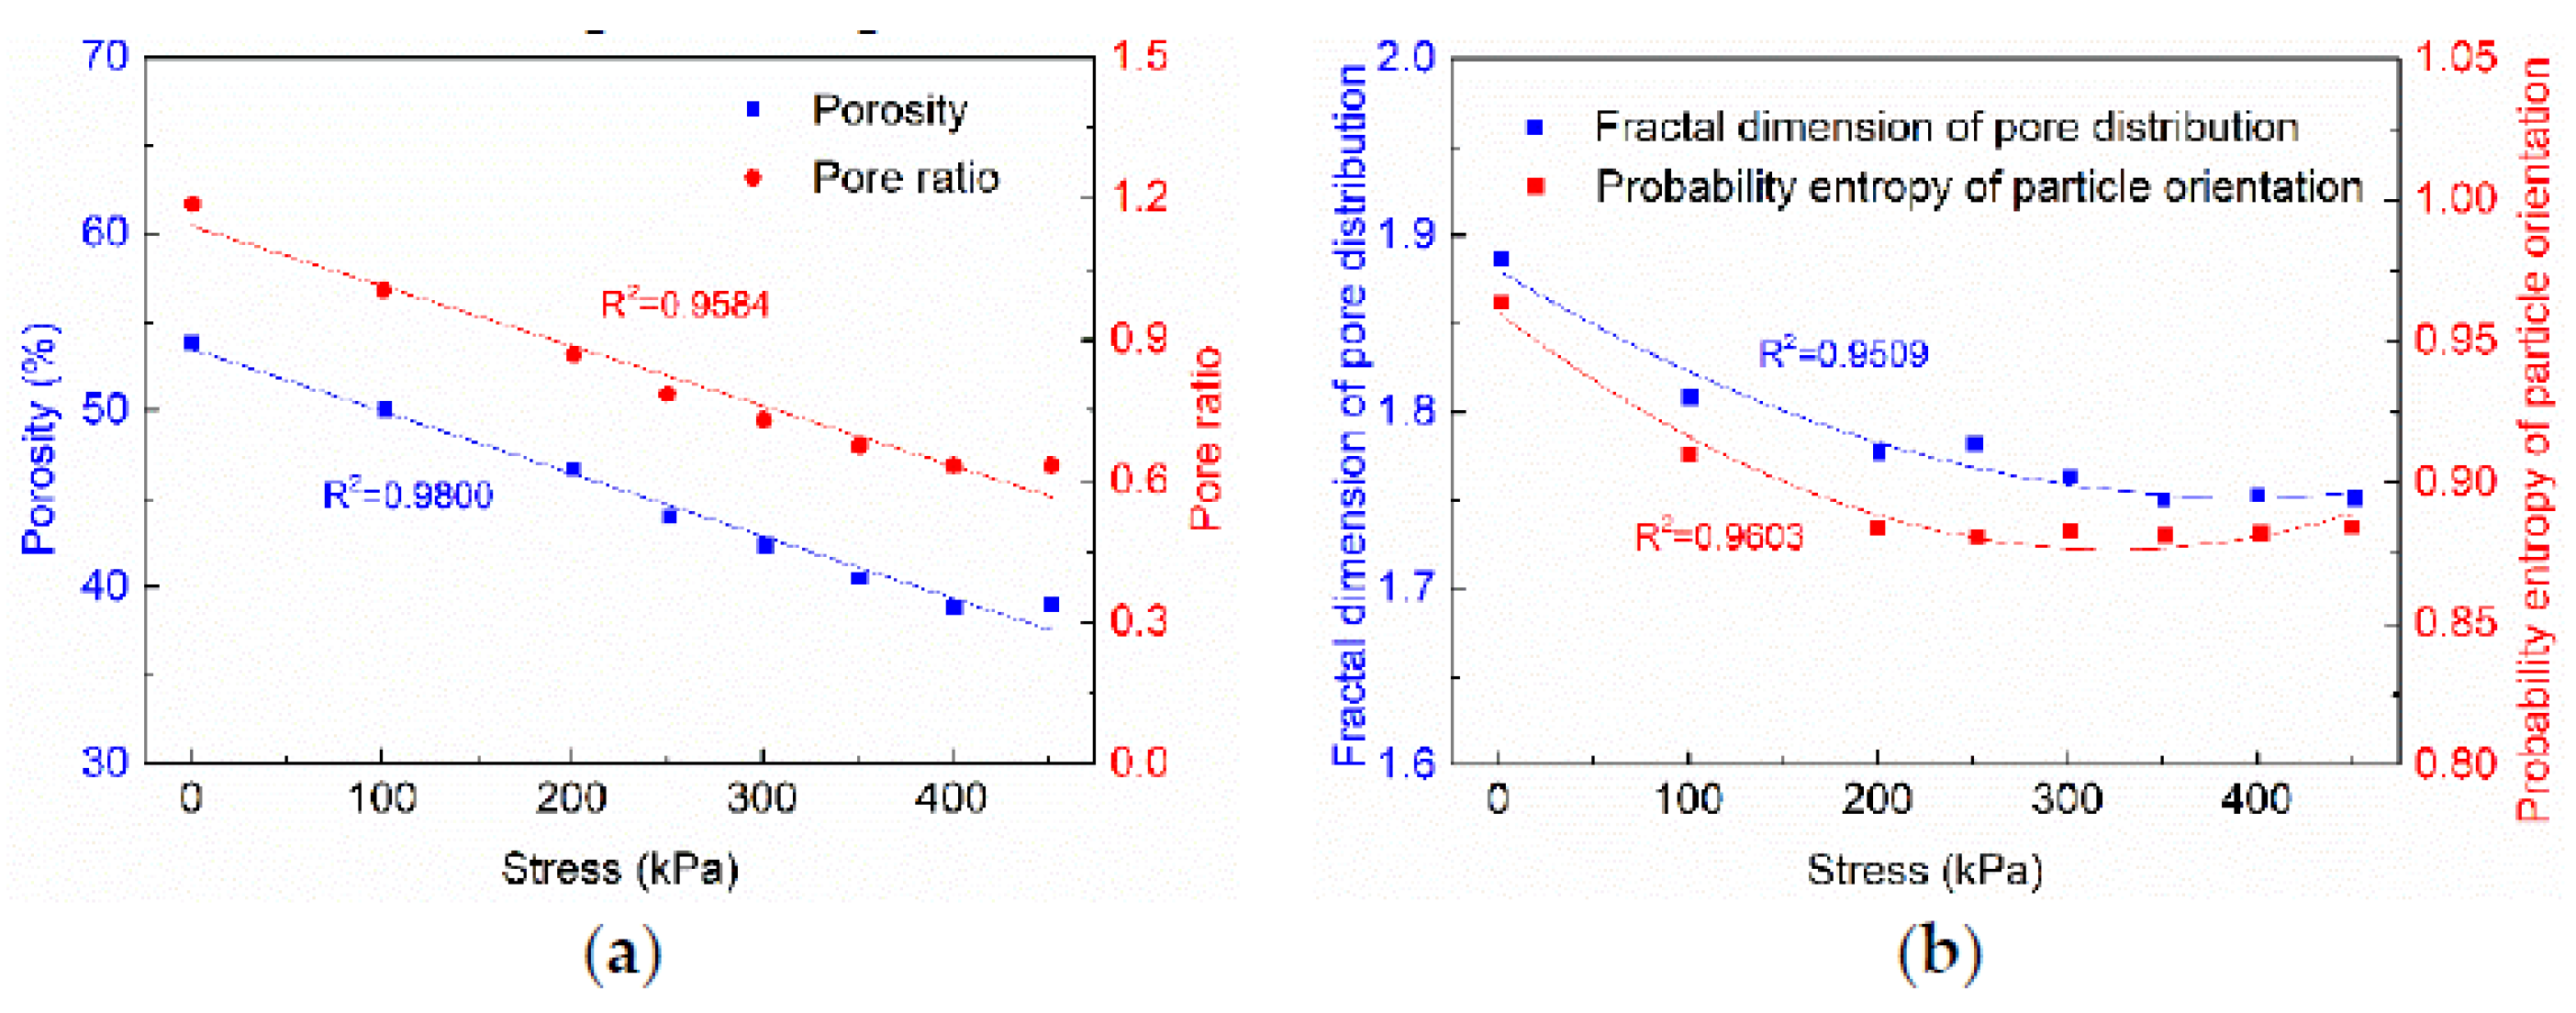
3.1.2. Measuring Change in Pore Characteristics of Soft Marine Soil

The pore characteristic parameters were extracted from the processed images. Figure 4 indicates the porosity, pore ratio, pore number, and average area of pores under different stresses, with corresponding standard deviations of 5.4316, 0.1975, 68.5165, and 6.9404, respectively. The figure shows that with the increase in stress, the pore number generally increased whereas the average area of pores decreased. This result is due to the occupation of large pores by soil particles under high stress.

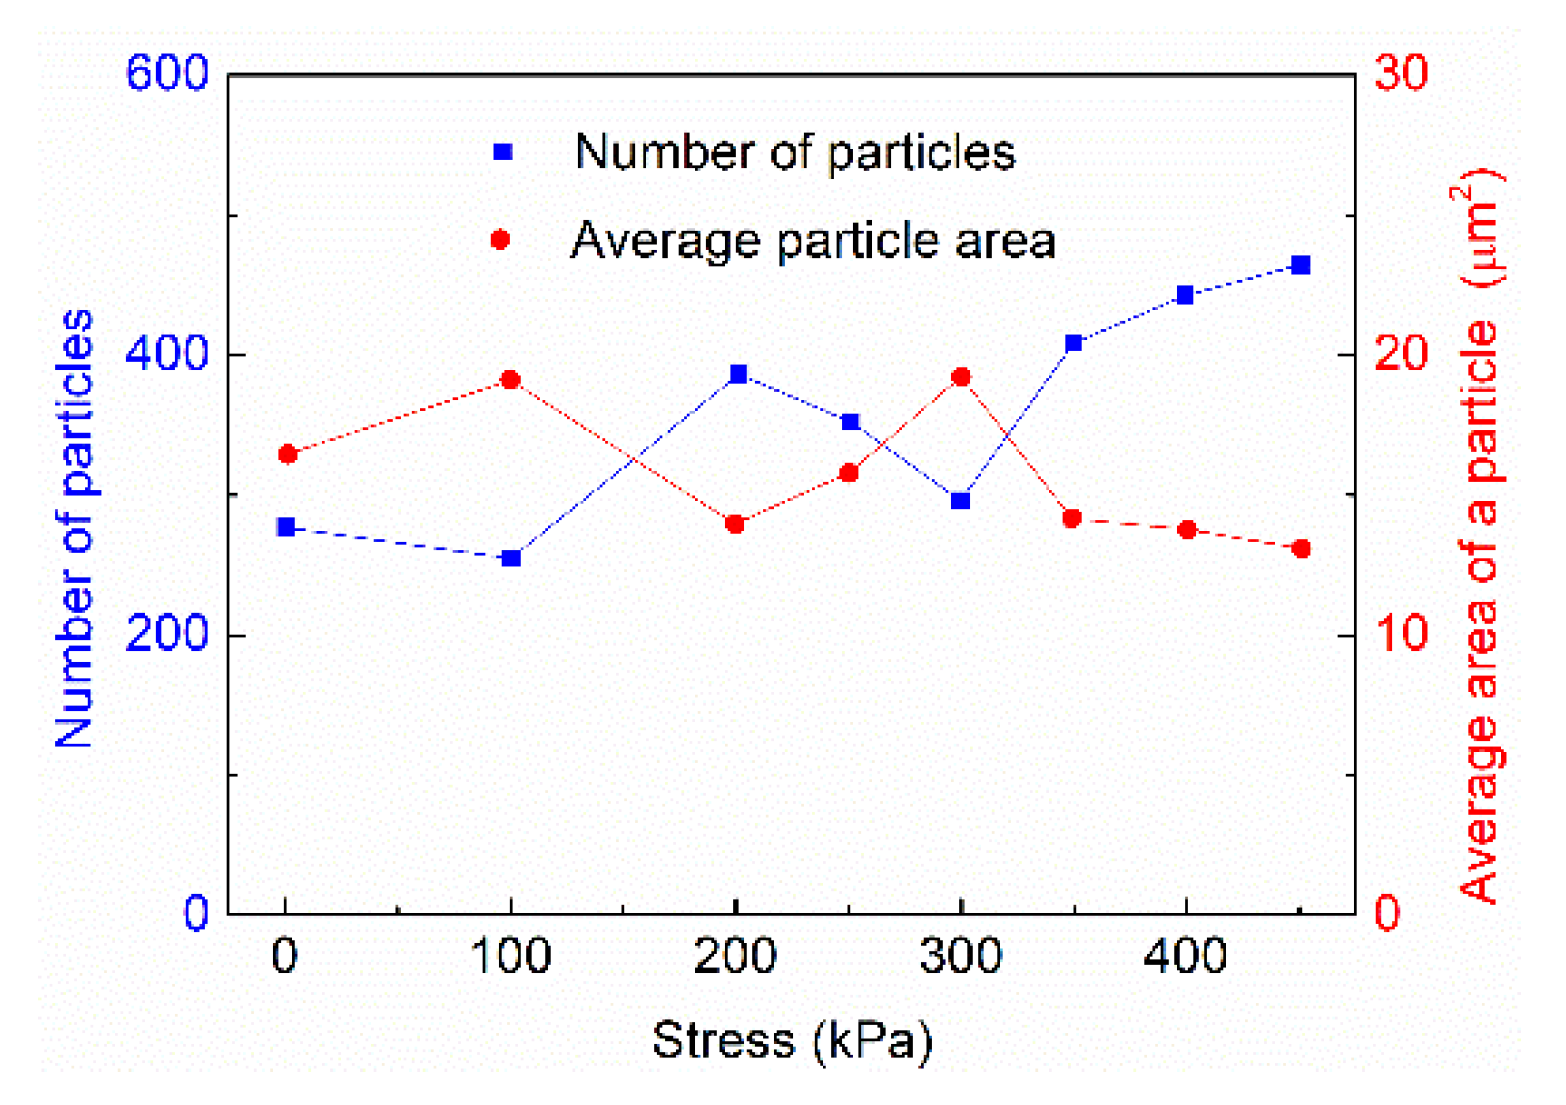
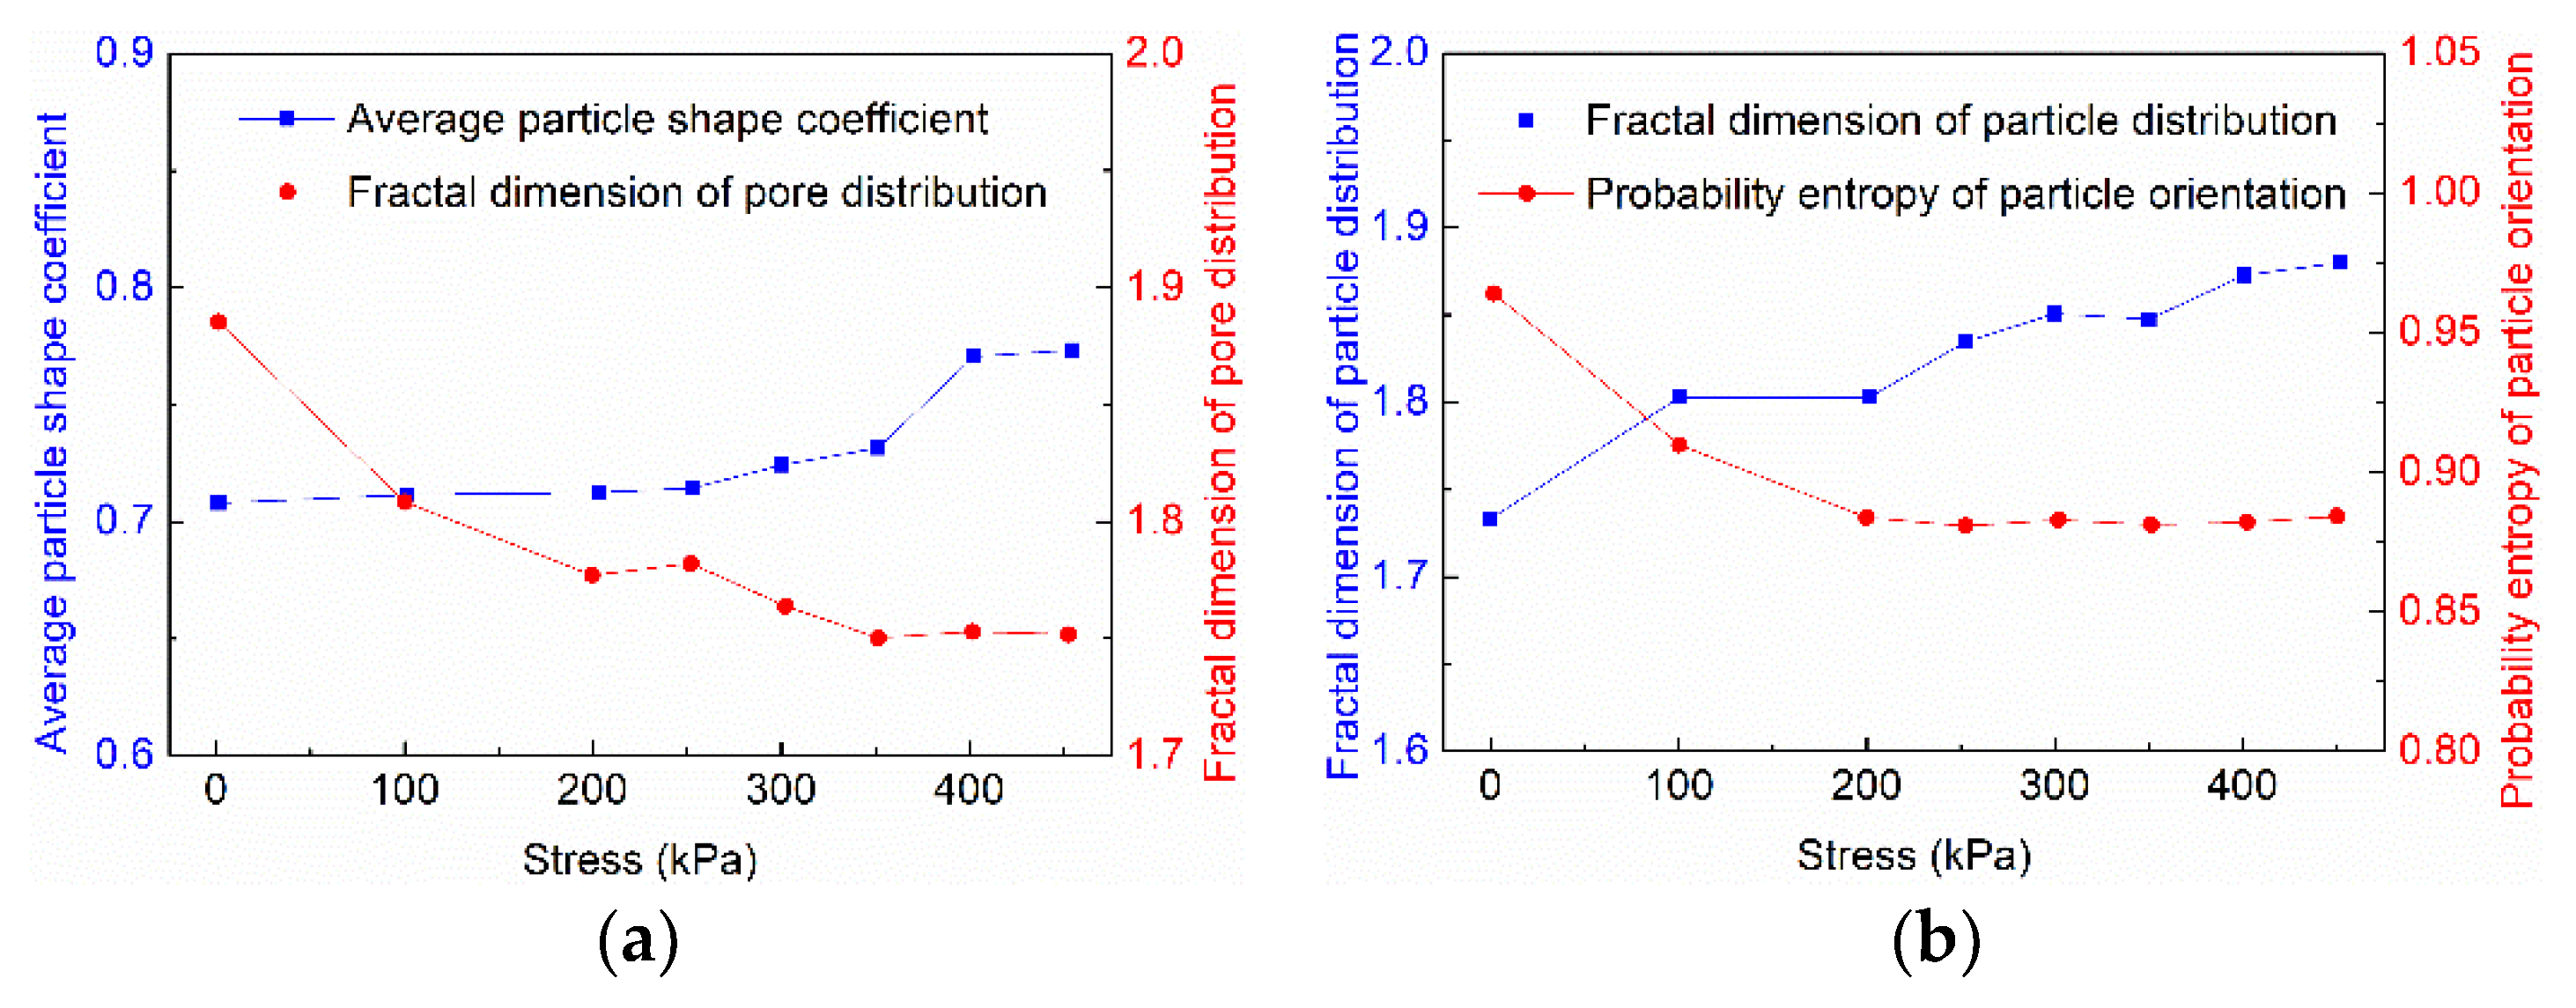
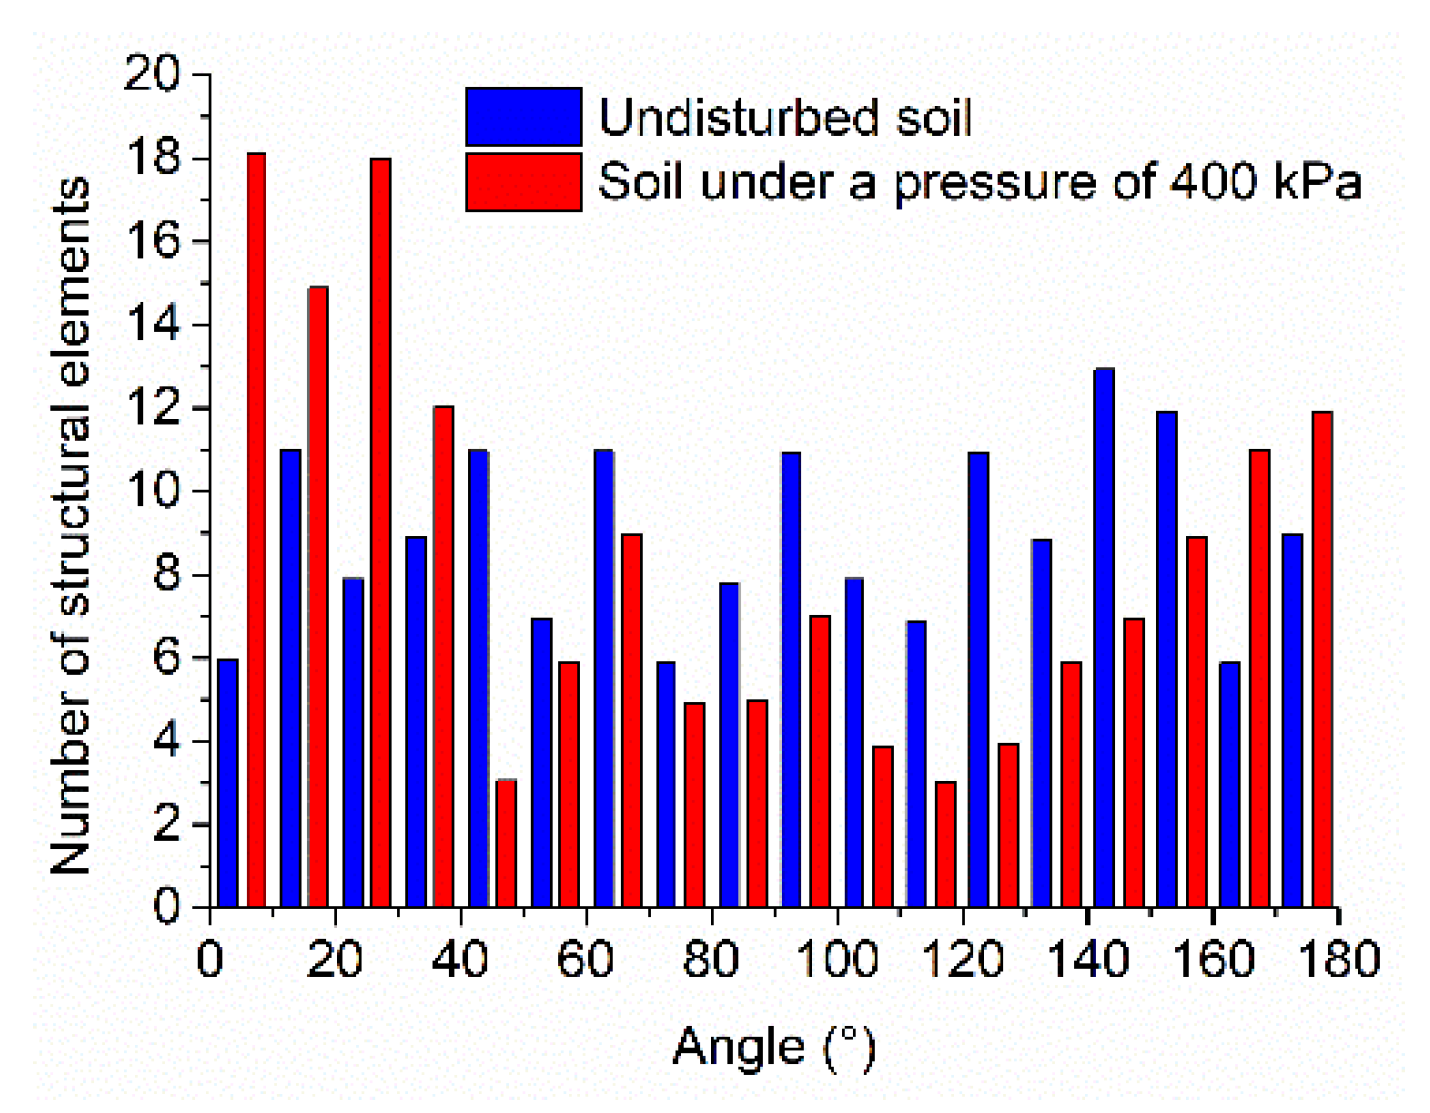
3.1.3. Measuring Change in Particle Characteristics of Soft Marine Soil

Particle characteristic parameters were extracted from the processed images. The graph of particle number and average area of particles with stress is shown in Figure 5, and was used to analyze the change in particle characteristic parameters with increasing stress.
It can be seen that the number of particles increased with increasing stress, which is similar to the trend in the number of pores, while the average area of particles decreased with increasing stress. These results are due to the fact that, under the action of stress, particles break into several smaller particles. Although the area occupied by the particles per unit area increased, the average area of particles decreased. When stress on the soil is greater than 300 kPa, the number of particles increased steadily as stress increased. A similar relationship between the average area of particles and stress is also seen. The average area of particles increased with stress, which reflects the small particles in the soil tending to aggregate and form large particles. The decrease in average area of particles with the increase in stress demonstrated that large particles are crushed and become small particles. Therefore, under a relatively low stress level, particle breakage was not obvious while the small particles were compressed together into large particles. In contrast, under a relatively high stress level, large particles were crushed and became small particles, and therefore the number of particles increased steadily with stress.

3.1.4. Directional Probability Entropy of Mesoscopic Soil Characteristics

Based on the morphological parameters obtained from image processing, Figure 6a indicates the stress-dependent average particle shape coefficient and fractal dimension of pore distribution. Figure 6b indicates the fractal dimension of particle distribution and probability entropy of particle orientation under different stresses.
The study of the change in average particle shape coefficient and fractal dimension of pore distribution under the stress showed that with increase in stress, the fractal dimension of the pore distribution decreased and gradually tended to stabilize with increases in average particle shape coefficient. This indicates that the density of the pore distribution in the soil gradually decreased, the porosity in the soil decreased, and the compactness of the soil gradually increased during the creep process. Under the action of stress, soil particles were squeezed into the pore space with time, leading to a less dense distribution of pores.
In addition, the study of the particle orientation angle distribution (Figure 7) and orientation probability entropy shows that undisturbed soil particles were initially not clearly systematically arranged. However, under a high stress level, the angular distribution of particles mainly concentrated toward the directions of 0~30° and 170~180°, indicating that the particle arrangement changed when the long axes of the particles became perpendicular to the direction of the applied stress. The entropy of the orientation probability of the structural units in the original state of the soil sample was the highest, suggesting that the orientation and arrangement of soil sample particles in the original state were most variable. With the increase in stress, directional probability entropy of particles decreased and gradually stabilized, and fractal dimension of particle distribution increased. This result indicates that during soft marine soil creep, particle orientations transition from being chaotic to orderly, reflecting a more regular particle arrangement.

3.1.5. Mesoscopic Structure-Stress Evolution Model of the Soft Marine Soil Creep Process

The purpose of this section is to quantify the relationship between mesoscopic parameters and stress (Figure 8). The reason these groups of data were selected for fitting is that the data points have obvious regularity. There is a strong negative linear relationship between porosity and stress (R2 = 0.9800) as well as between pore ratio and stress (R2 = 0.9584). In addition, there is a nonlinear relationship between fractal dimension of the pore distribution and stress (fitted equation: Dd = 8.335 × 10⁻⁷σ2 − 6.54 × 10⁻⁴σ + 1.8803) as well as probability entropy of particle orientation and stress (fitted equation: Hm = 8.03 × 10⁻⁷σ2 − 5.20 × 10⁻⁴σ + 0.9603). The results show that the creep of soft marine soil is caused by directional redistribution of particles under stress, which includes crushing, moving and rotating of particles under stress. The porosity ratio and porosity represent the number of pores in the soil and reflect the consolidation of the soft marine soil structure. Directional probability entropy reflects the degree of ordering in the particle arrangement. The fractal dimension of the distribution is a comprehensive reflection of the proportion and distribution of pores or particles.
Based on the results in Figure 8, the nonlinear relationship between the fractal dimension of the pore distribution (Dd) and stress, as well as probability entropy of particle orientation (Hm) and stress, can be described as:
H m = m 1 σ 2 + m 2 σ + m 3 ,
D d = d 1 σ 2 + d 2 σ + d 3 ,
where m1, m2, m3, d1, d2, and d3 are fitted constants.
Of course, the above equations can also be obtained by the relationship between porosity or pore ratio and stress, which will not be studied in this study.
The porosity and pore ratio can reflect the microstructure of soft marine soil. However, the directional probability entropy of particles is a comprehensive parameter that reflects the distribution of particles, which reflects not only the degree of particle arrangement but also the creep mechanism of soft marine soil from a mesoscopic point of view. The effects of stress on porosity, porosity ratio, fractal dimension distribution, and directional probability entropy can be quantified. To summarize, in this section the directional probability entropy expression of soft marine soil was obtained according to the mesoscopic parameters.

3.2. Macroscopic Parameters of Soft Marine Soil

Figure 9 indicates the results of some representative creep experiments (the curve for vertical loads greater than 200 kPa is consistent with the trend of 200 kPa). The values of parameters a, b, c, and d can be firstly obtained by fitting experimental data. The fitted results are shown in Table 1. The values of the elastic modulus, Kelvin elastic modulus, Kelvin viscosity coefficient, and Bingham viscosity coefficient under different stresses obtained for the soft marine soil creep model are shown in Table 2, using the relationship in Equation (6).

3.3. Coupled Macroscopic and Mesoscopic Creep Model for Soft Marine Soil

Using the data in Table 2 and Equations (6) (a = σ/E0, b = σ/E1 and c = E1/φ1) and (9), and combination to quadratic formula, the corresponding equations to describe the elastic modulus, Kelvin elastic modulus, Kelvin viscosity coefficient, Bingham viscosity coefficient, and directional probability entropy in the soft marine soil creep model were obtained:
E 0 ( H m ) = h 11 H m 2 + h 12 H m + h 13 ,
E 1 ( H m ) = h 21 H m 2 + h 22 H m + h 23 ,
φ 1 ( H m ) = h 31 H m 2 + h 32 H m + h 33 .
According to Table 1, Table 2, and Equation (9), the above parameters were obtained: h11 = 0.0102, h12 = −3.0044, h13 = 244.16; and h21 = −0.0150, h22 = −3.5590, h23 = −34.44; and h31 = −0.0237, h32 = 5.5168, h33 = −168.42.
Finally, obtained values of the parameters were substituted into Equation (7) (these functions can be substituted into Equation (8) for a similar result) to obtain a coupled macroscopic and mesoscopic creep model for soft marine soil based on directional probability entropy; that is, Equation (14) to predict the creep curves of soft marine soil under different stress levels:
ε = σ h 11 H m 2 + h 12 H m + h 13 + σ h 21 H m 2 + h 22 H m + h 23 ( 1 e h 21 H m 2 + h 22 H m + h 23 h 31 H m 2 + h 32 H m + h 33 t ) ,
where, Hm = 8.03 × 10⁻⁷σ2 − 5.20 × 10⁻⁴σ + 0.9603. The innovation of these equations is that the relationship between macroscopic creep and mesoscopic structure is established by using the direction probability, and a coupled macro-meso creep model of soft marine soil is obtained.
Combined with the above research on the mesoscopic structure and macroscopic parameters of soft marine soil, some parameters of soft marine soil (h11, h12, h13, Hm, etc.) were obtained and substituted into Equation (14) to obtain a creep model of soft marine soil. The model was then compared with the actual experiment. Here, Equation (14) is a coupled macro- and meso-creep model established according to the variable Hm. Of course, the model can also be established according to Dd; the steps are consistent with those described in this study, which will not be repeated here.
Taking the settlement data of soft marine soil subgrade of an expressway near the Pearl River Estuary in South China as an example, the developed coupled macroscopic and mesoscopic creep model for soft marine soil was verified.

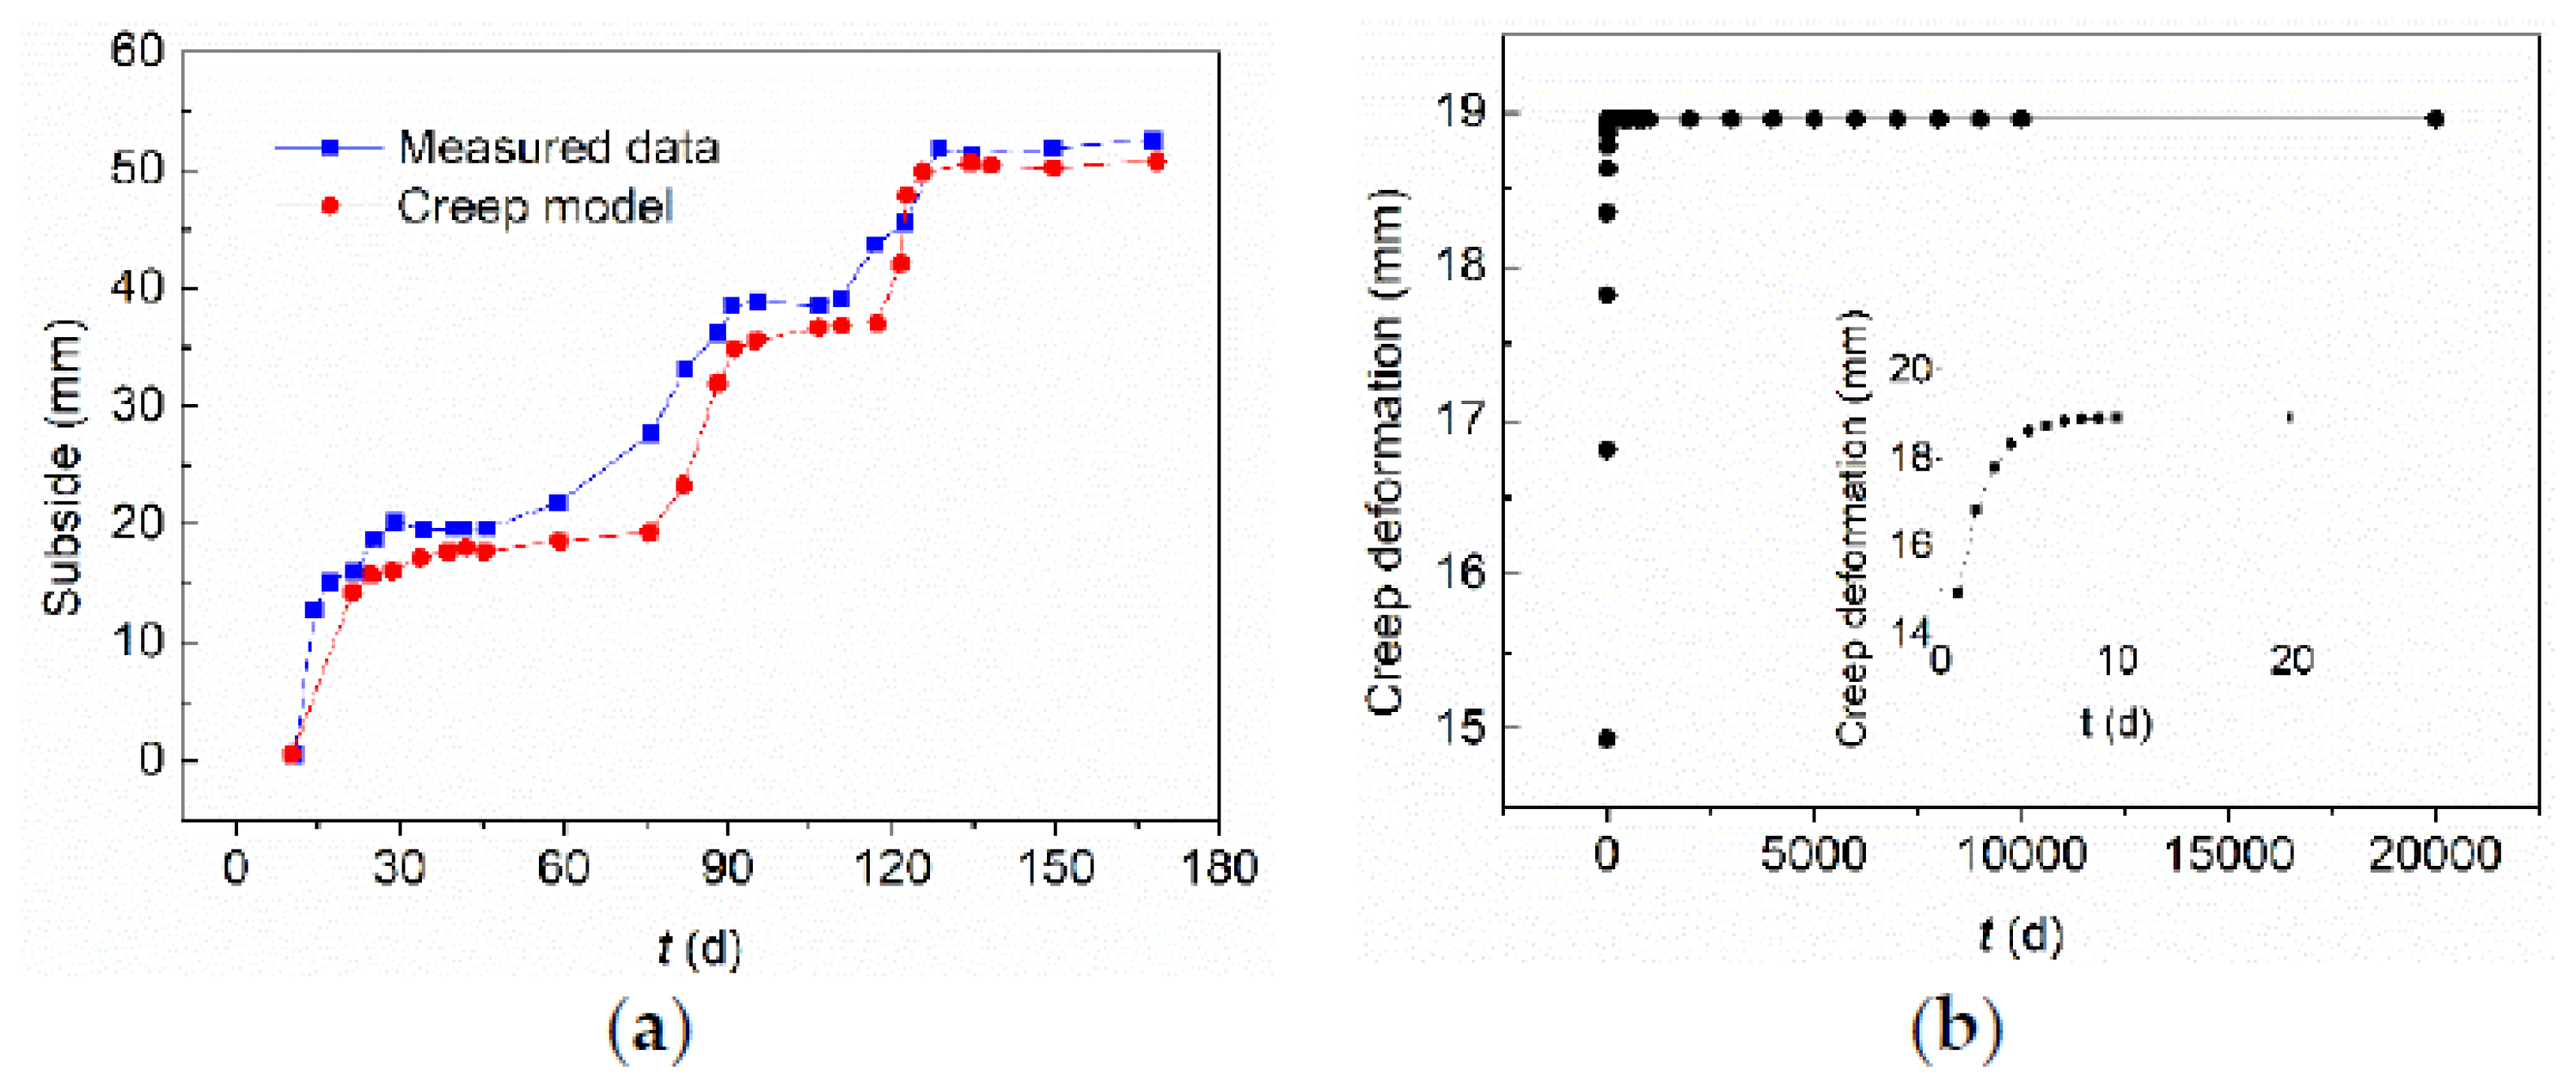
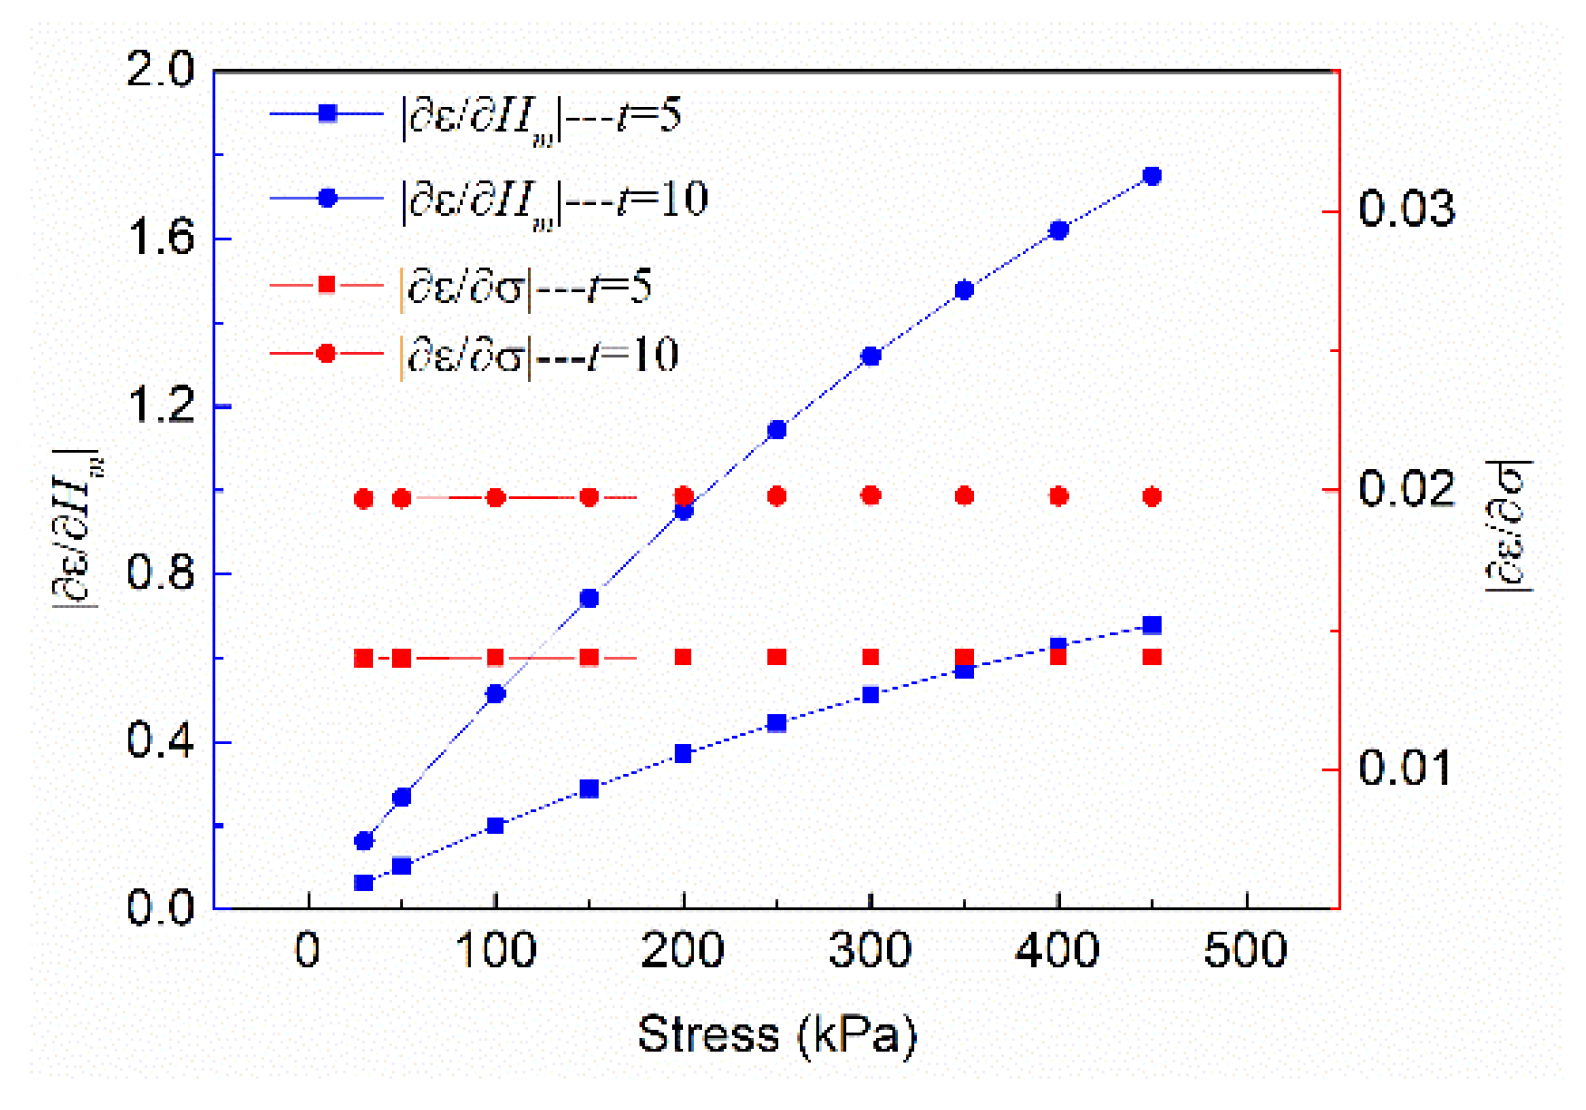
3.4. Verification and Sensitivity Analysis of Coupled Macroscopic and Mesoscopic Creep Model

Figure 10a compares the time-dependent settlement predicted by the developed coupled macroscopic and mesoscopic creep model and measured data. The settlement data on the stratum surface at the center of the subgrade was used to validate the model. The stress of soft marine soil at the center of the subgrade is about 300 kPa under normal service conditions, which is used in Equation (14) to calculate the strain value of the creep model. The relative errors between the settlement from the creep model and the measured data are shown in Table 3. The table shows that model predictions agree with the settlement data reasonably well.
After validation, the developed model was implemented to predict the long-term deformation behavior of the soft marine soil under a stress of 200 kPa, as shown in Figure 10b. The results show that the settlement of soft marine soil took a very short period of time to reach to equilibrium, and the results were consistent with that in Figure 9. They also show that the creep effect of the new model is very close to that of the actual soft marine soil.
In order to understand the sensitivity of the creep model to macro and meso parameters, partial derivatives of Equation (14) with respect to σ and Hm were obtained as follows:
{ ε H m = σ E 0 ( H m ) E 0 ( H m ) 2 σ E 1 ( H m ) E 1 ( H m ) 2 ( 1 e E 1 ( H m ) φ 1 ( H m ) t ) + σ E 1 ( H m ) e E 1 ( H m ) φ 1 ( H m ) t E 1 ( H m ) φ 1 ( H m ) E 1 ( H m ) φ 1 ( H m ) φ 1 ( H m ) 2 t ε σ = 1 E 0 ( H m ) + 1 E 1 ( H m ) ( 1 e E 1 ( H m ) φ 1 ( H m ) t ) .
The absolute value of the partial derivative was calculated according to Equation (15), as shown in Figure 11 (the curves in the figure were calculated based on t being 5 and 10, respectively; when t takes on other values, the relationship between the curves was similar to that in Figure 11). The absolute value of ε H m is always greater than the absolute value of ε σ ; thus, it can be seen that the sensitivity of the creep model to Hm is greater than its sensitivity to σ. It can also be seen that the sensitivity of the creep model to mesoscopic parameters is greater than its sensitivity to macroscopic parameters.

4. Conclusions

In the present study, a coupled macroscopic and mesoscopic creep model of soft marine soil was established, and its reliability verified by experimental data. Finally, the model was applied to predict the long-term deformation characteristics of soft marine soil. The following discusses some of the major findings.
(1)
With the increase in stress, pore numbers generally increase whereas the average area of the pores decreases. There is a strong negative linear relationship between porosity and pore ratio with stress, whereas the relationships between fractal dimension of pore distribution and probability entropy of particle orientation with stress are generally nonlinear. In addition, the relationship between macroscopic parameters and directional probability entropy conforms to that of a quadratic equation.
(2)
A coupled macroscopic and mesoscopic creep model of soft marine soil based on directional probability entropy was established. The soft marine soil model can reproduce the experimental observations and predict long-term creep behavior of soil, and its sensitivity to mesoscopic parameters was greater than its sensitivity to macroscopic parameters.
(3)
The results of this study illustrate the influence of creep of soft marine soil on subgrade damage from macroscopic and mesoscopic perspectives. This provides a theoretical basis of the design and construction parameters determination and optimization of similar coastal engineering involving soft marine soil subgrade. The research results are also helpful to determine the long-term deformation of similar subgrade.

Author Contributions

Conceptualization, C.Z.; methodology, Z.L.; software, G.C.; validation, G.C.; formal analysis, L.Z.; data curation, W.L. and G.C.; writing—original draft preparation, W.L. and G.C.; writing—review and editing, G.C., L.Z. and Z.L.; supervision, C.Z. and Z.L.; funding acquisition, C.Z. All authors have read and agreed to the published version of the manuscript.

Funding

This research was funded by Ministry of Science and Technology of the People’s Republic of China, grant numbers 2017YFC0804605, 2017YFC1501201 and 2017YFC1501203; National Natural Science Foundation of China, grant numbers 41472257 and 41530638; Guangdong Science and Technology Department, grant numbers 2015B090925016, 2016B010124007 and 2015TQ01Z344; and Guangzhou Science and Technology Bureau, grant number 201803030005.

Institutional Review Board Statement

Not applicable.

Informed Consent Statement

Not applicable.

Data Availability Statement

The data presented in this study are available on request from the corresponding author. The data are not publicly available due to privacy.

Conflicts of Interest

The authors declare no conflict of interest.

References

  1. Mubeen, M.M. Stabilization of soft clay in irrigation projects. J. Int. Comm. Irrig. Drain. 2005, 54, 175–187. [Google Scholar] [CrossRef]
  2. Sas, W.; Gluchowski, A.; Gabrys, K.; Sobol, E.; Szymanski, A. Resilient Modulus Characterization of Compacted Cohesive Subgrade Soil. Appl. Sci. 2017, 7, 370. [Google Scholar] [CrossRef] [Green Version]
  3. Kong, B.W.; Xia, F.; Yu, B.Q.; Xia, T.D.; Ding, Z. Pore Size Changes in Marine Soft Soil under Various Freezing Conditions. J. Mar. Sci. Eng. 2020, 8, 170. [Google Scholar] [CrossRef] [Green Version]
  4. Oliveira, P.J.V.; Correia, A.A.S.; Lemos, L.J.L. Numerical modelling of the effect of curing time on the creep behaviour of a chemically stabilised soft soil. Comput. Geotech. 2017, 91, 117–130. [Google Scholar] [CrossRef]
  5. Plodpradit, P.; Kwon, O.; Dinh, V.; Murphy, J.; Kim, K.D. Suction Bucket Pile-Soil-Structure Interactions of Offshore Wind Turbine Jacket Foundations Using Coupled Dynamic Analysis. J. Mar. Sci. Eng. 2020, 8, 416. [Google Scholar] [CrossRef]
  6. Park, M. A Study on the Improvement Effect and Field Applicability of the Deep Soft Ground by Ground Heating Method. Appl. Sci.-Basel 2018, 8, 852. [Google Scholar] [CrossRef] [Green Version]
  7. Rowe, R.K.; Li, A.L. Geosynthetic-reinforced embankments over soft foundations. Geosynth. Int. 2005, 12, 50–85. [Google Scholar] [CrossRef]
  8. Hodder, M.S.; White, D.J.; Cassidy, M.J. An effective stress framework for the variation in penetration resistance due to episodes of remoulding and reconsolidation. Geotechnique 2013, 63, 30–43. [Google Scholar] [CrossRef]
  9. Krost, K.; Gourvenec, S.M.; White, D.J. Consolidation around partially embedded seabed pipelines. Geotechnique 2011, 61, 167–173. [Google Scholar] [CrossRef]
  10. Sukmak, P.; Sukmak, G.; Horpibulsuk, S.; Setkit, M.; Kassawat, S.; Arulrajah, A. Palm oil fuel ash-soft soil geopolymer for subgrade applications: Strength and microstructural evaluation. Road Mater. Pavement Des. 2019, 20, 110–131. [Google Scholar] [CrossRef]
  11. Yoobanpot, N.; Jamsawang, P.; Horpihulsuk, S. Strength behavior and microstructural characteristics of soft clay stabilized with cement kiln dust and fly ash residue. Appl. Clay Sci. 2017, 141, 146–156. [Google Scholar] [CrossRef]
  12. Ng, C.W.W.; Akinniyi, D.; Zhou, C. Influence of structure on the compression and shear behaviour of a saturated lateritic clay. Acta Geotech. 2020, 15, 3433–3441. [Google Scholar] [CrossRef]
  13. Shan, Y.; Mo, H.H.; Yu, S.M.; Chen, J.S. Analysis of the Maximum Dynamic Shear Modulus and Particle Arrangement Properties of Saturated Soft Clay Soils. Soil Mech. Found. Eng. 2016, 53, 226–232. [Google Scholar] [CrossRef]
  14. Perisic, G.A.; Ovalle, C.; Barrios, A. Compressibility and creep of a diatomaceous soil. Eng. Geol. 2019, 258. [Google Scholar] [CrossRef]
  15. Ezaoui, A.; Tatsuoka, F.; Duttine, A.; Di Benedetto, H. Creep failure of geomaterials and its numerical simulation. Geotech. Lett. 2011, 1, 41–45. [Google Scholar] [CrossRef]
  16. Mirjalili, M.; Kimoto, S.; Oka, F.; Hattori, T. Long-term consolidation analysis of a large-scale embankment construction on soft clay deposits using an elasto-viscoplastic model. Soils Found. 2012, 52, 18–37. [Google Scholar] [CrossRef] [Green Version]
  17. Degago, S.A.; Grimstad, G. Discussion of “Experimental investigation on the creep behavior of an unsaturated clay”. Can. Geotech. J. 2015, 52, 253. [Google Scholar] [CrossRef]
  18. Xiao, S.; Cheng, X.; Yang, Z. A Thermodynamic Constitutive Model for Saturated Sand. Entropy 2019, 21, 136. [Google Scholar] [CrossRef] [Green Version]
  19. Li, B.; Wong, R.C.K. A mechanistic model for anisotropic thermal strain behavior of soft mudrocks. Eng. Geol. 2017, 228, 146–157. [Google Scholar] [CrossRef] [Green Version]
  20. Liu, H.Z.; Xie, H.Q.; He, J.D.; Xiao, M.L.; Zhuo, L. Nonlinear creep damage constitutive model for soft rocks. Mech. Time-Depend. Mat. 2017, 21, 73–96. [Google Scholar] [CrossRef]
  21. Zois, E.N.; Raptis, I.; Anastassopoulos, V. Off-line metrology on SEM images using gray scale morphology. Microchim. Acta 2006, 155, 323–326. [Google Scholar] [CrossRef]
  22. Saladra, D.; Kopernik, M. Qualitative and quantitative interpretation of SEM image using digital image processing. J. Microsc. Oxford 2016, 264, 102–124. [Google Scholar] [CrossRef] [PubMed]
Figure 1. Schematic diagram describing the developed coupled macroscopic and mesoscopic creep model for soft marine soil.
Jmse 09 00224 g001
Figure 2. Samples and experimental apparatus: (a) prepared samples; (b) scanning electron microscope; (c) creep test of soil using the consolidation apparatus.
Jmse 09 00224 g002
Figure 3. Image of mesoscopic parameter extraction: (a) 20,000× image before binarization; (b) 20,000× image after binarization; (c) 3000× image before binarization; (d) 3000× image after binarization.
Jmse 09 00224 g003
Figure 4. Stress-dependent pore characteristics of soft marine soil: (a) porosity and pore ratio; (b) pore number and average area of pores.
Jmse 09 00224 g004
Figure 5. Stress-dependent particle characteristics of soft marine soil (e.g., number of particles and average area of particles).
Jmse 09 00224 g005
Figure 6. Relation between morphological characteristics and stress: (a) average particle shape coefficient and fractal dimension of pore distribution; (b) fractal dimension of particle distribution and probability entropy of particle orientation.
Jmse 09 00224 g006
Figure 7. Directional particle distribution of structural elements under a stress of 400 kPa.
Jmse 09 00224 g007
Figure 8. Meso-structure-stress evolution model of soft marine soil: (a) porosity and pore ratio; (b) fractal dimension of pore distribution and probability entropy of particle orientation.
Jmse 09 00224 g008
Figure 9. Creep curves of soft marine soil under different stresses.
Jmse 09 00224 g009
Figure 10. Validation of the model: (a) settlement curves for the measured and modeled settlement; (b) long-term creep deformation prediction of soft marine soil.
Jmse 09 00224 g010
Figure 11. Model sensitivity analysis.
Jmse 09 00224 g011
Table 1. Parameters of the fitting equation at each stress level.
Stress/kPaa/×10−2b/×10−2c/×10−2d/×10−2R2
300.18120.39478.073/0.9463
500.73510.50045.667/0.9276
1001.30300.61775.150/0.9735
1504.32400.88011.9100.03400.9922
2005.11602.47206.7340.57490.9957
Table 2. Soft marine soil creep model parameters at each stress level.
Stress/kPaE0/× kPaE1/× kPaφ1/× kPaφ2/× kPa
3016,556.297600.711004.26/
506801.809992.011763.19/
1007674.6016,189.093143.51/
1503469.0117,043.528923.3123,564.07
2003909.308090.611201.4621,742.91
Table 3. Relative errors between the measured and modeled settlement.
Serial NumberError (%)Serial NumberError (%)Serial NumberError (%)
10.00 100.00 196.89
210.08 111.88 208.65
33.46 126.26 218.70
40.00 1313.56 222.44
58.69 144.63 231.78
612.49 151.51 243.15
77.48 164.70 253.44
810.07 175.16 Average Error5.37
95.53 183.74
Publisher’s Note: MDPI stays neutral with regard to jurisdictional claims in published maps and institutional affiliations.

