
Long-Term Variations in Species Composition of Bloom-Forming Toxic Pseudo-nitzschia Diatoms in the North-Western Sea of Japan during 1992–2015


National Scientific Center of Marine Biology, Far Eastern Branch, Russian Academy of Sciences, ul. Palchevskogo 17, 690041 Vladivostok, Russia
J. Mar. Sci. Eng. 2021, 9(6), 568; https://doi.org/10.3390/jmse9060568
Submission received: 5 April 2021
/
Revised: 14 May 2021
/
Accepted: 19 May 2021
/
Published: 24 May 2021
(This article belongs to the Special Issue Long-term Phytoplankton Dynamics in Ecosystem)
Abstract
:This review aimed to summarize original and published data on the bloom events caused by toxic diatoms of the genus Pseudo-nitzschia and to assess long-term variations in the composition of bloom-forming species in the northwestern Sea of Japan during 1992−2015. This information is crucial to understanding the potential threat of toxic blooms and their effects. A change in species composition was observed within the genus Pseudo-nitzschia: it was dominated by Pseudo-nitzschia multiseries during 1992–1993, 2002, and a shift towards the dominance of Pseudo-nitzschia multistriata and Pseudo-nitzschia calliantha occurred in 2005–2015. We assume that the increased sea surface temperature recorded from Amursky Bay in the period of 1998–2009 compared to the data of 1980–1989 might be one of the causative factors for the shift observed. The absence of highly toxic Pseudo-nitzschia multiseries among the bloom-forming species is considered as one of the possible explanations for the lack of damage from the blooms of Pseudo-nitzschia over the past 15 years in the study area.
1. Introduction
Pseudo-nitzschia H. Peragallo (1900) is a worldwide distributed genus of pennate diatoms. Species of this genus are widely known as potential domoic acid (DA) producers and also as an important component of phytoplankton communities [1]. Long-term series of observations on changes in dominant diatoms of the genus Pseudo-nitzschia are crucial for understanding the potential threat of toxic blooms and their effects. In recent years, extensive datasets of long-term variations in the density of phytoplankton, including species belonging to the genus Pseudo-nitzschia from different areas, were studied to document the temporal variations in phytoplankton communities associated with environmental factors and climate change events [2,3,4,5,6]. Nevertheless, long-term population dynamics of bloom-forming Pseudo-nitzschia species are rarely reported for the Northwest Pacific [7].
In terms of species diversity, Russian waters of the northwestern Sea of Japan are among the most productive areas in the Northwest Pacific [8], which is explained by its position, being in the mixing zone of the floras of arctic/boreal and tropical phytogeographic regions [9]. Harmful algal bloom events were permanently recorded from the Russian coastal waters of the Sea of Japan near the areas of aquaculture farms and popular coastal tourist sites since 1992 [10]. Nevertheless, in the study area, no economic or social impacts connected with toxigenic Pseudo-nitzschia species were observed.
Diatoms of the genus Pseudo-nitzschia are a dominant group of toxic plankton microalgae in the northwestern Sea of Japan, constituting up to 75–98% of the total phytoplankton density in bloom seasons [11,12]. Extensive datasets on species and genetic diversity, certain bloom events, and domoic acid concentration in cultures of the dominant Pseudo-nitzschia species isolated from the northwestern Sea of Japan were accumulated over the past three decades [11,12,13,14,15]. However, no studies on long-term changes in the composition of Pseudo-nitzschia species that cause blooms in this body of water were carried out to date.
The purpose of the present work was to summarize original data and those available in literature concerning bloom events caused by toxic diatoms of the genus Pseudo-nitzschia and to assess long-term variations in the composition of bloom-forming species near the city of Vladivostok, Sea of Japan, during the period from 1992 to 2015.
2. Study Area and Sampling
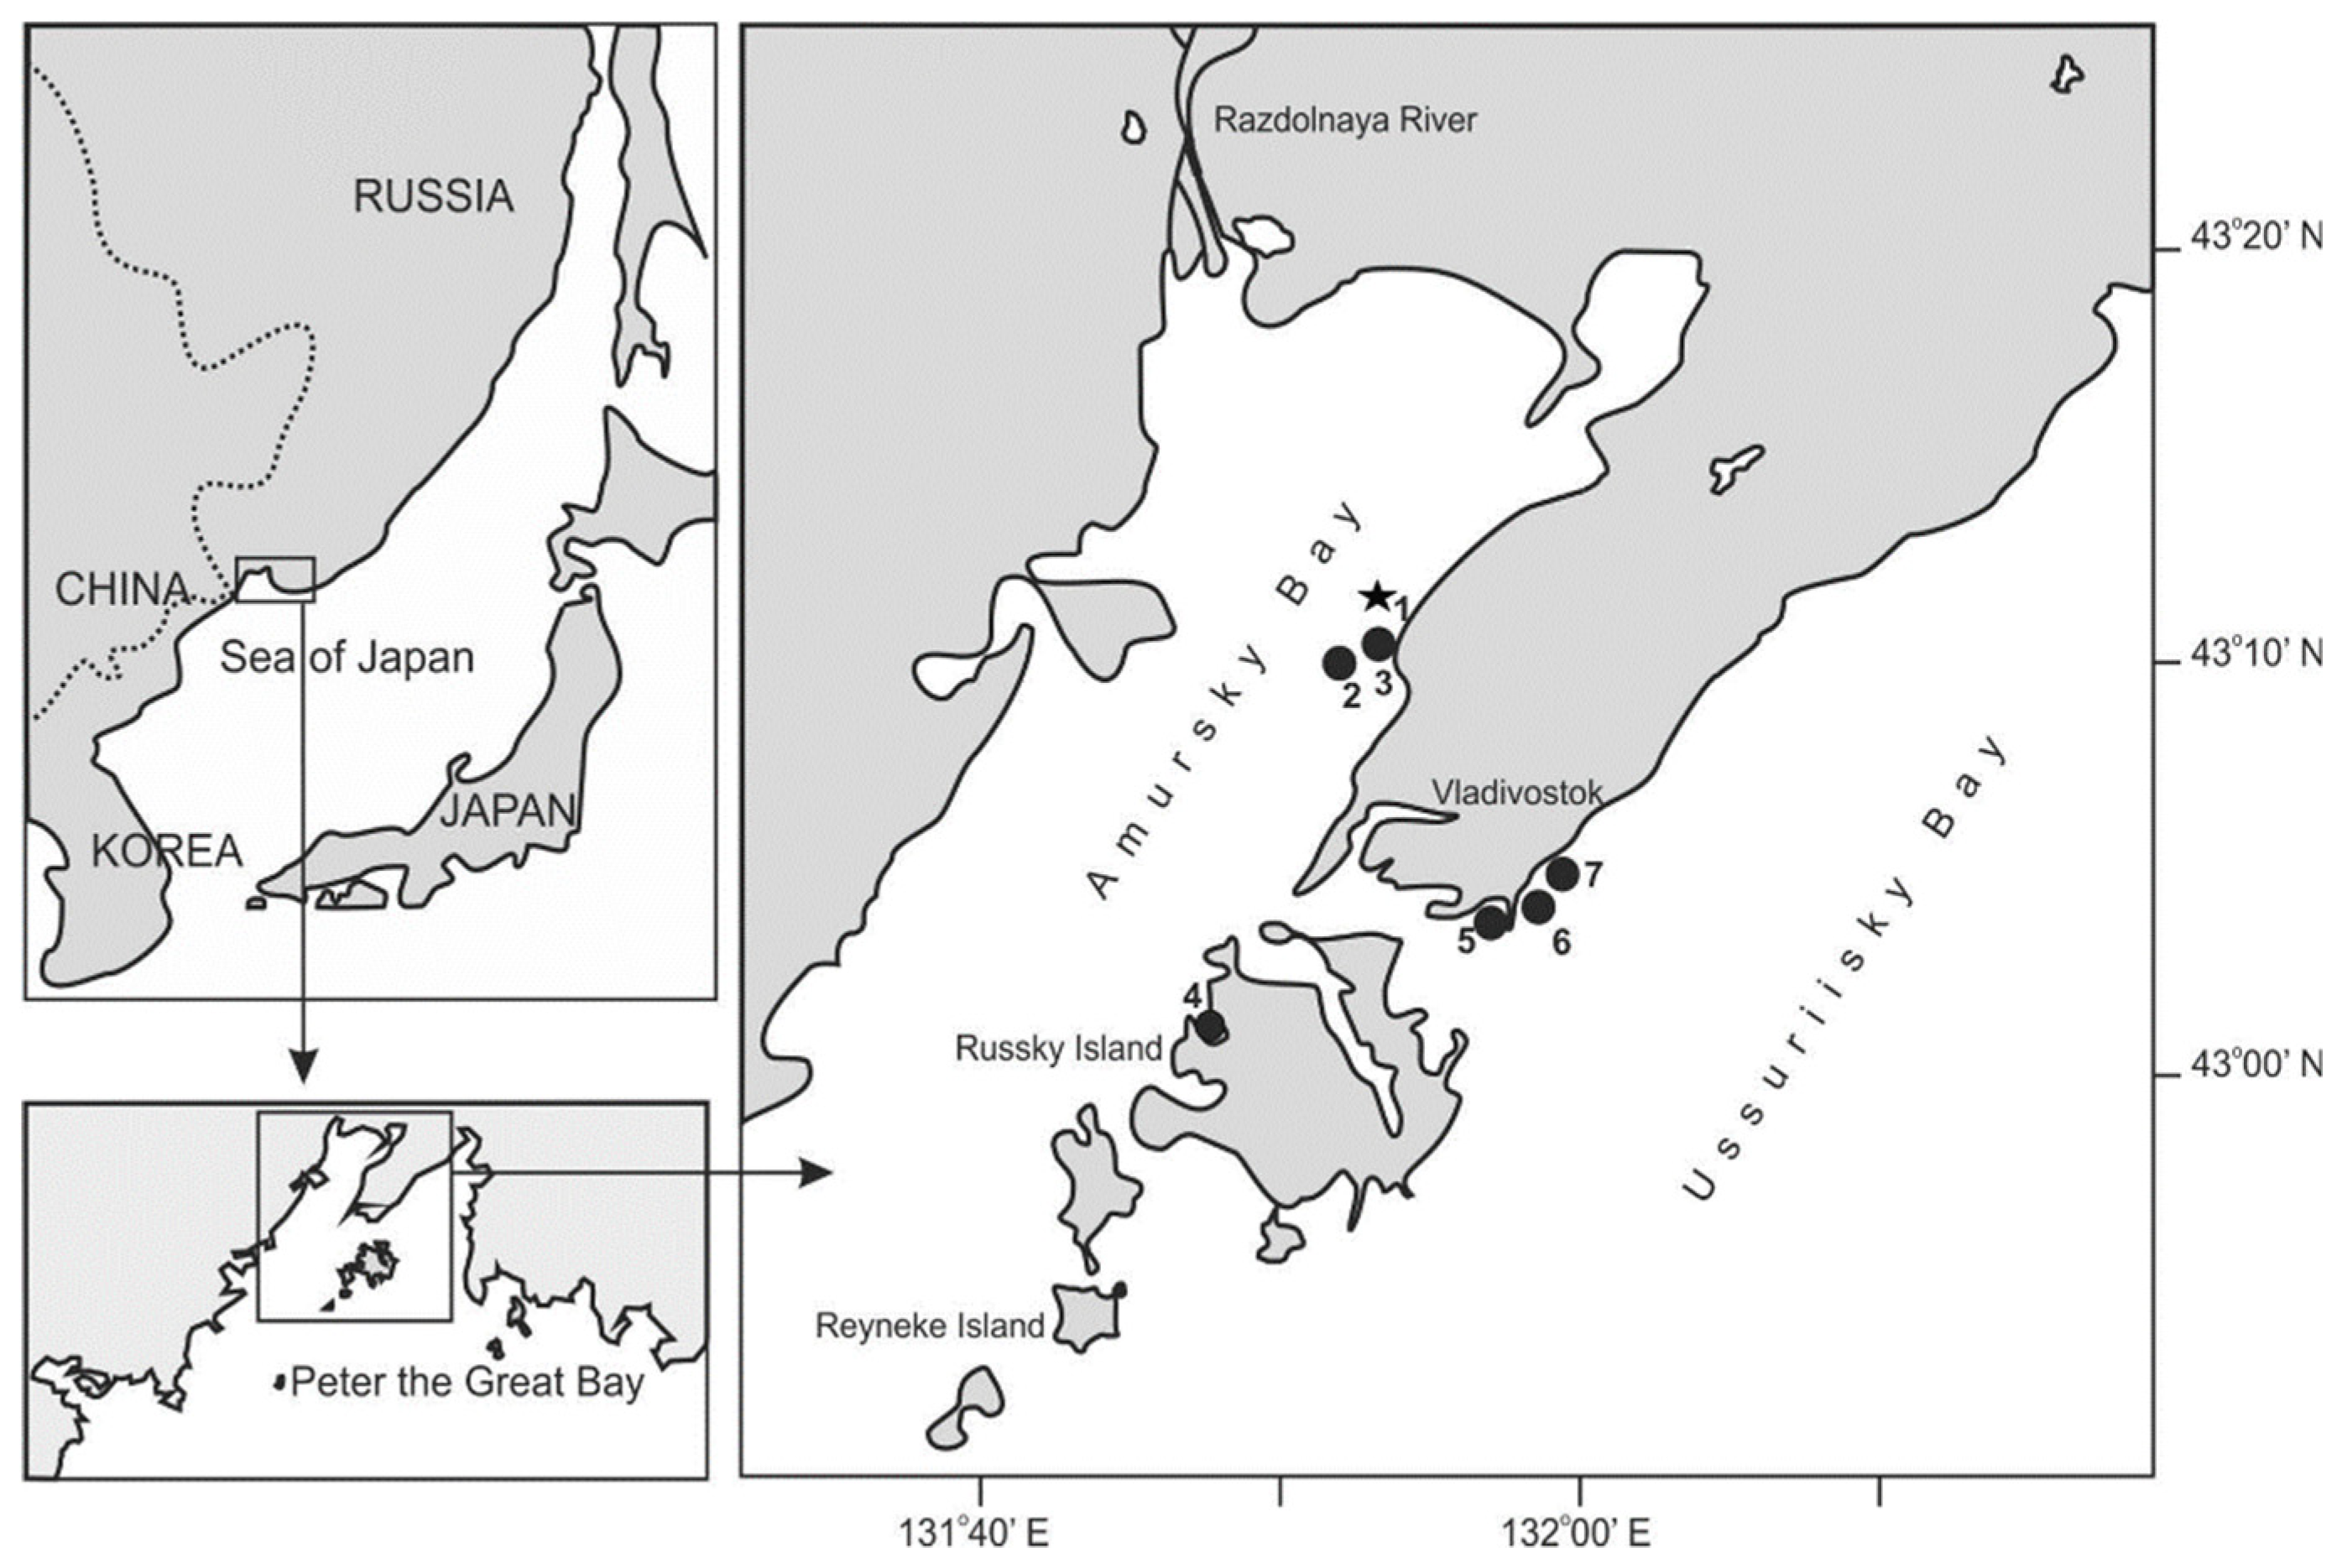
The work was based on phytoplankton samples collected during the period from June 1992 to December 2015 in Peter the Great Bay, northwestern Sea of Japan. Peter the Great Bay is divided by the Muraviev-Amursky Peninsula and a group of islands into two smaller bodies of water: the Amursky and Ussuriisky bays (Figure 1). The most complete dataset on species composition and density of species belonging to the genus Pseudo-nitzschia in the study area was obtained for the coastal waters off the city of Vladivostok in Amursky and Ussuriisky bays [11,12,15,16]. In these bays, seven sampling stations were set (Figure 1, Table 1). The longest series of observations (the summer–autumn seasons from 1992 to 2005 and year-round samplings from 2007 to 2015) were made at monitoring station 1 in the northeastern part of Amursky Bay (Figure 1, Table 1). In Amursky Bay, phytoplankton samples were generally collected twice a month. In Ussuriisky Bay, phytoplankton was sampled once a month from the surface horizon in the autumn–winter periods of 2012, 2013, and 2015. The oceanographic characteristics of the sampling area were given elsewhere [17,18].
The sampling and the cell counting techniques are described in detail in the works of Stonik et al. [12,16]. Light microscopic (LM) and transmission electron microscopic (TEM) studies were used for counting and identification to species level [11,12, 14−16]. Based on the long-term datasets, we assumed a concentration of >1 × 10⁵ cells L−1 to be a provisional limit (a limit level), above which any increase in the density of Pseudo-nitzschia spp. would be considered as a fact of bloom [15].
3. Statistical Analysis
Spearman’s within-year correlation analysis was used during the period of blooms of Pseudo-nitzschia multistriata/calliantha in the autumn of 2005 to study the relationship of species density with water temperature and salinity and concentration of ammonium nitrogen in water [19]. Data on all above environmental factors necessary for such an analysis were only available for the autumn 2005. The relationship of species density with water temperature was studied based on year-round sampling at station 1 during 2007–2015 using Spearman’s correlation analysis of the whole data set. The data were statistically processed with Statistica 7 software (StatSoft Inc., Tulsa, OK, USA).
The similarity in species composition and abundance among samples collected during 1993–2015 (station 1) was analyzed by calculating the Bray–Curtis similarity coefficient [20] based on relative abundance data for different species.
For graphical representation of the data set from the 1993–2015 sampling period (station 1), non-metric multidimensional scaling (NMDS) ordination was performed [21], which resulted in five groups. Based on samples scores from NMDS, a k-means cluster analysis was performed with Statistica v. 7.0 (StatSoft Inc., Tulsa, OK, USA). The significance of the resulting groups was tested using the one-way analysis of similarities (ANOSIM). NMDS and ANOSIM analyses were carried out using the software package PRIMER 6.1.12 (Primer-E Ltd., Plymouth, UK).
4. Results
4.1. The Bloom Events
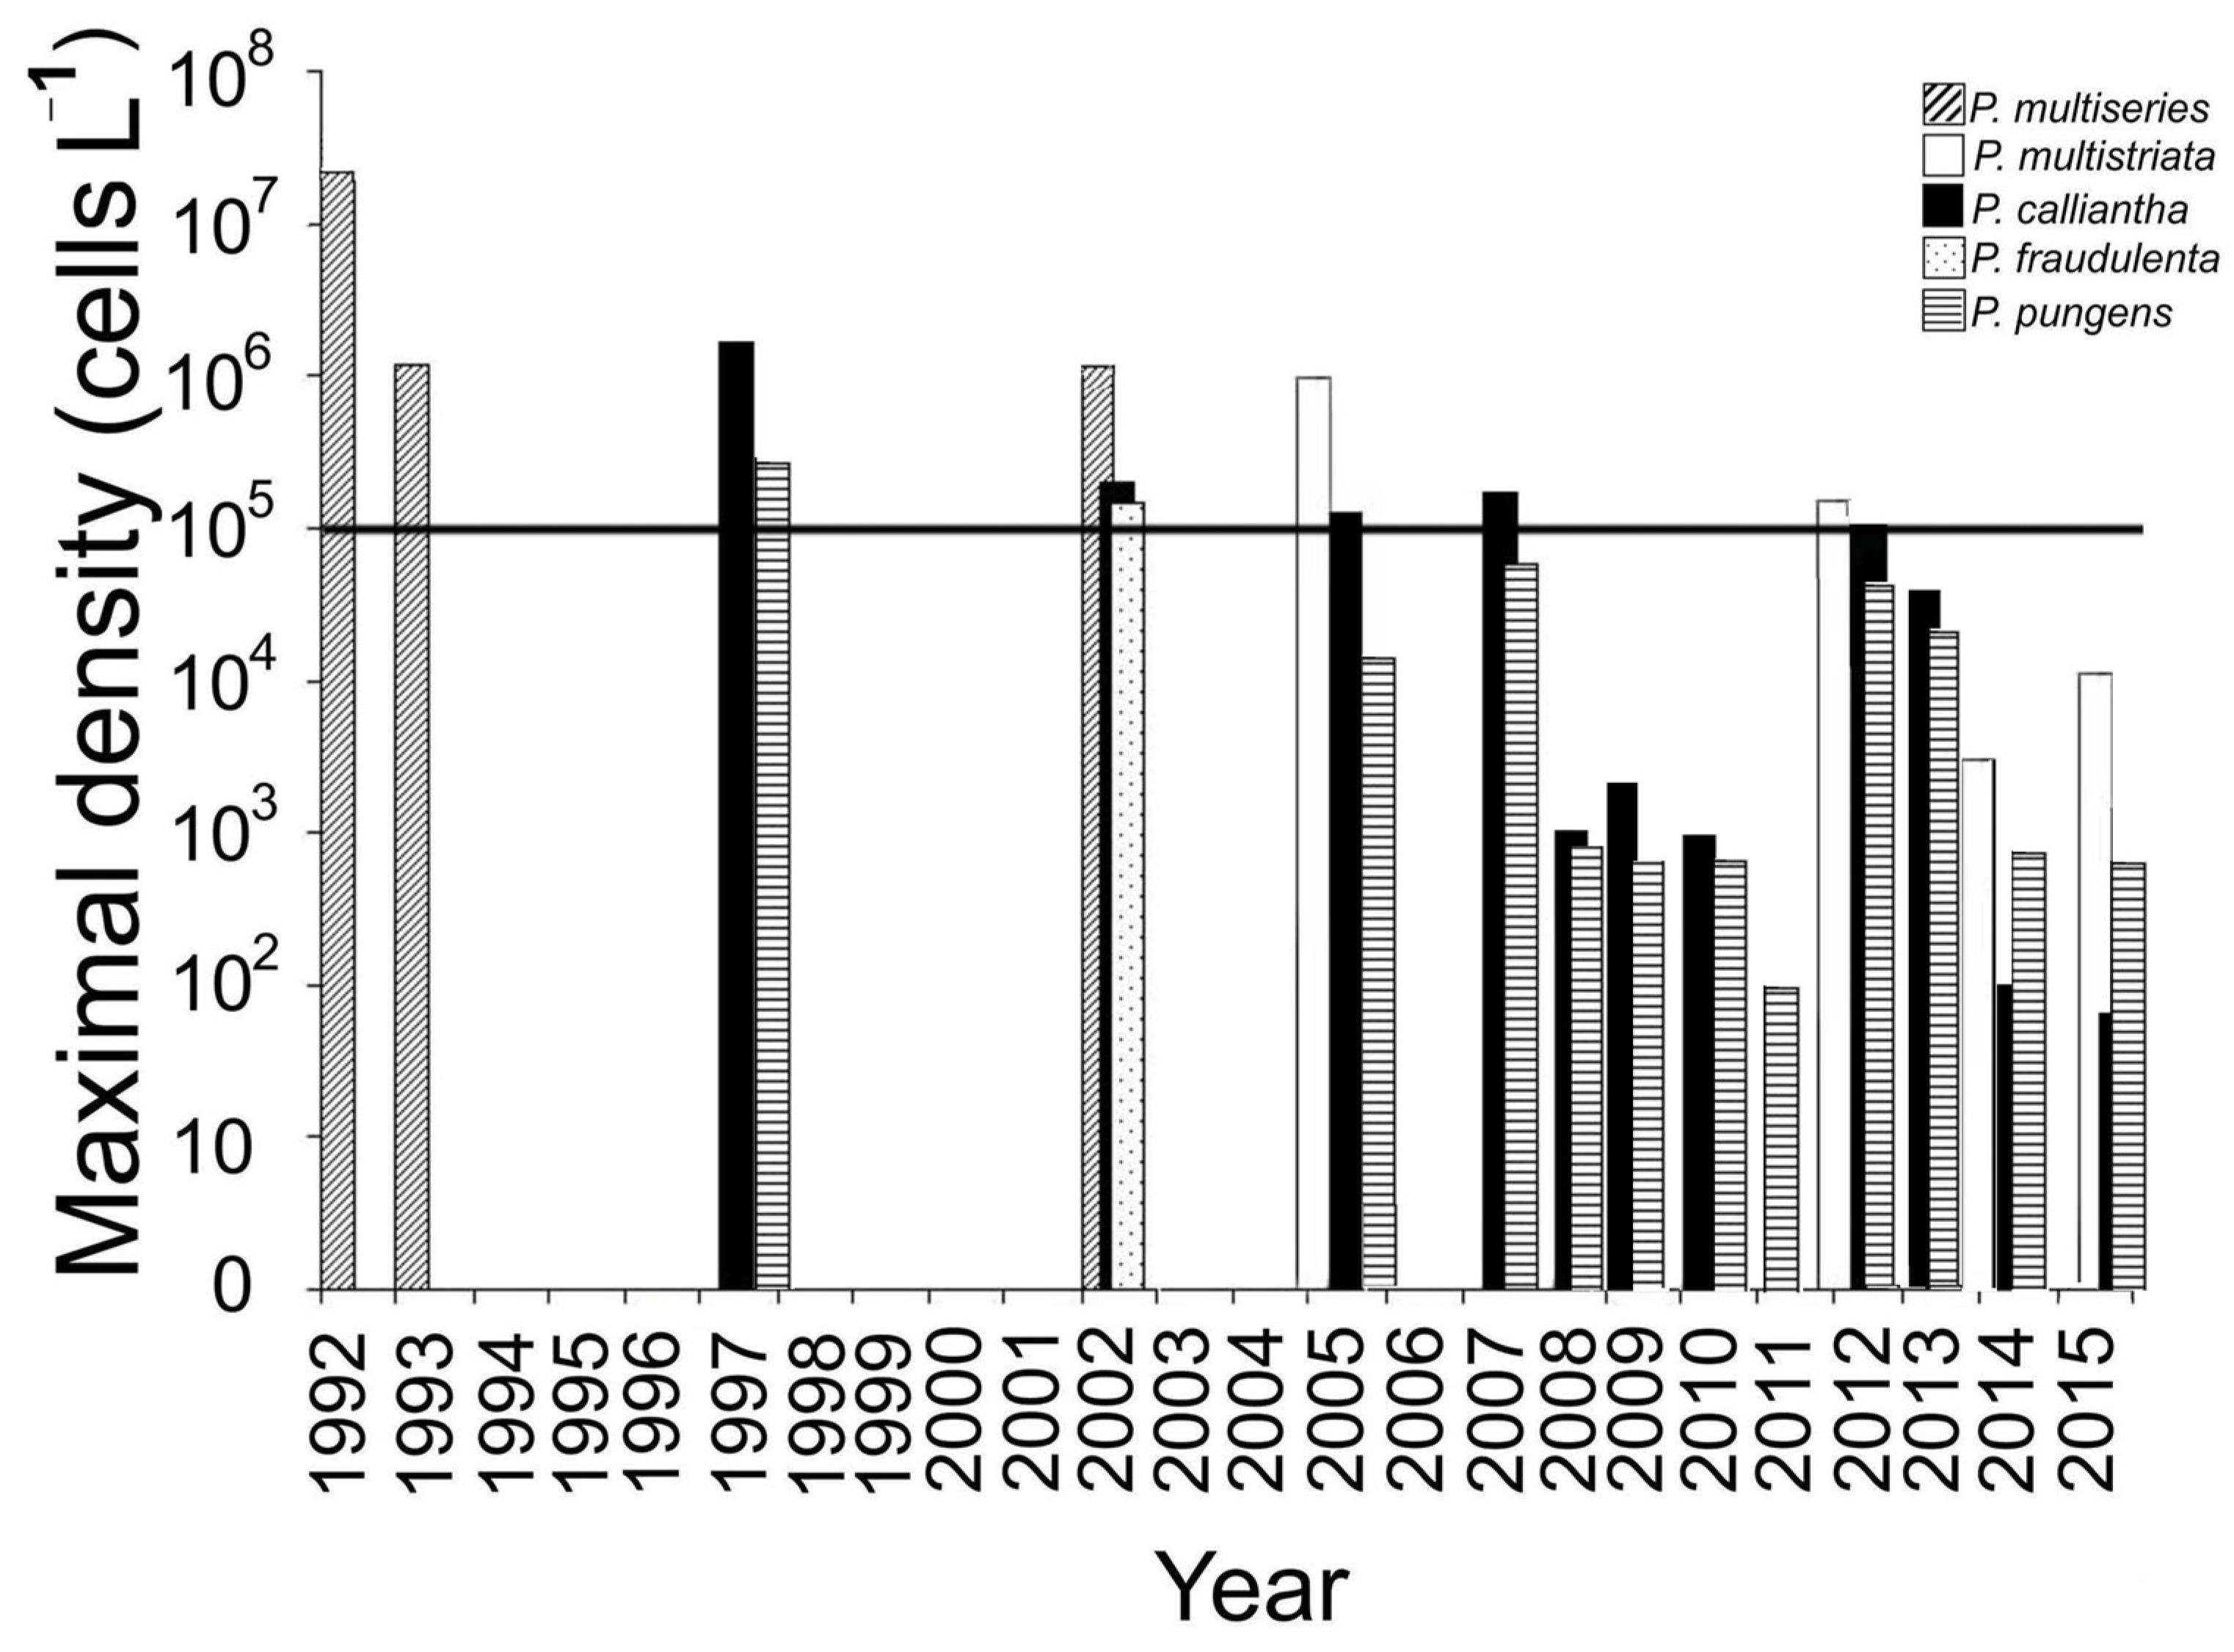
The dominant bloom-forming Pseudo-nitzschia spp. and their maximum concentrations during bloom events are shown in Figure 2 and Table 2. The species that caused bloom events in Peter the Great Bay were identified earlier using the morphological studies and a phylogenetic analysis of ribosomal genes [11,13,14,15,16,22]. An analysis of long-term data on Pseudo-nitzschia bloom events in Amursky Bay showed that Pseudo-nitzschia multiseries was the dominant species in these areas in the early 1990s. Thus, the most intense bloom event of Pseudo-nitzschia multiseries was recorded in June 1992 at station 2 at a temperature of 15.3–16.1 °C after heavy rains. The maximum density in the bloom spot reached 1.1–3.5 × 10⁷ cells L−1 (79–98% of the total phytoplankton density) [13]. In June 1993, a bloom of Pseudo-nitzschia multiseries (1–1.2 × 10⁶ cells L−1) occurred again in the northeastern Amursky Bay at station 1 at a temperature of 14.2–15.8 °C [16]. Subsequently, this species was recorded once more (at a highest concentration of 1.4 × 10⁶ cells L−1) in September 2002 at a temperature of 12.5–14 °C [12]. After 2002, Pseudo-nitzschia multiseries was not found in the study area. Pseudo-nitzschia pungens was found as a permanent component of phytoplankton throughout the study period, with maximum concentration (5.9 × 10⁵ cells L−1) in autumn 1997 at station 1.
Most of the bloom events observed in Amursky and Ussuriisky bays from 1997 to 2015 were caused by Pseudo-nitzschia calliantha (Table 2). In Amursky Bay, the maximum concentration of this species (2.7 × 10⁶ cells L−1) was registered in November 1997 at a water temperature of 5–6 °C and a salinity of 34.5‰. Among other species that caused blooms since 2002, Pseudo-nitzschia multistriata and Pseudo-nitzschia fraudulenta were also identified. The most intense bloom recorded after 2002 was caused by Pseudo-nitzschia multistriata (up to 0.9 × 10⁶ cells L−1 or 67% of the total Pseudo-nitzschia density) and Pseudo-nitzschia calliantha (1.2 × 10⁵ cells L−1 or 9%) in October 2005 at station 1 at a water temperature of 6–12 °C and a salinity of 31–33.5‰. After 2005, Pseudo-nitzschia density exceeded the limit level of 1 × 10⁵ cells ∙ L−1 in three cases: 1.7 × 10⁵ cells L−1 in September 2007, dominated by Pseudo-nitzschia calliantha; 2.5 × 10⁵ cells ∙ L−1 in September 2012, dominated by Pseudo-nitzschia multistriata; and 1.1 × 10⁵ cells L−1 in November 2012, dominated by Pseudo-nitzschia calliantha (Figure 2).
There were five cases of blooms caused by Pseudo-nitzschia calliantha in November 2012, 2013, and October 2015, and one bloom of Pseudo-nitzschia multistriata in October 2015 in Ussuriisky Bay (Table 2). The maximum cell density of Pseudo-nitzschia calliantha (1.4 × 10⁶ cells L−1) was recorded in November 2012 from station 5; the maximum concentration cell density of Pseudo-nitzschia multistriata (1.7 × 10⁵ cells L−1) was recorded in October 2015 from station 7.
The data obtained showed that the highest concentration values of Pseudo-nitzschia in Amursky and Ussuriisky bays in 2005–2015 were determined by blooms of Pseudo-nitzschia multistriata and Pseudo-nitzschia calliantha, whose maximum density reached 0.9 × 10⁶ cells L−1 and 1.4 × 10⁶ cells L−1, respectively [15,19].
Thus, in northwestern Sea of Japan, there was a shift in the dominant Pseudo-nitzschia species since 2002: blooms caused by Pseudo-nitzschia multiseries were no longer observed, and Pseudo-nitzschia calliantha and Pseudo-nitzschia multistriata became the causative organisms of Pseudo-nitzschia bloom events (Table 2, Figure 2).
The period 2007–2015, when the materials were taken year-round, was undoubtedly better studied in comparison with other periods of the study when some bloom events possibly could not be recorded by us due to the insufficient duration of the collections. However, from 2007 to 2015, we observed no bloom events caused by Pseudo-nitzschia multiseries, while most of the bloom events were caused by Pseudo-nitzschia calliantha and Pseudo-nitzschia multistriata. These observations confirm the conclusion of the current study of long-term changes in the species composition of bloom-forming Pseudo-nitzschia.
4.2. Long-Term Variations in Species Composition of Bloom-Forming Pseudo-nitzschia
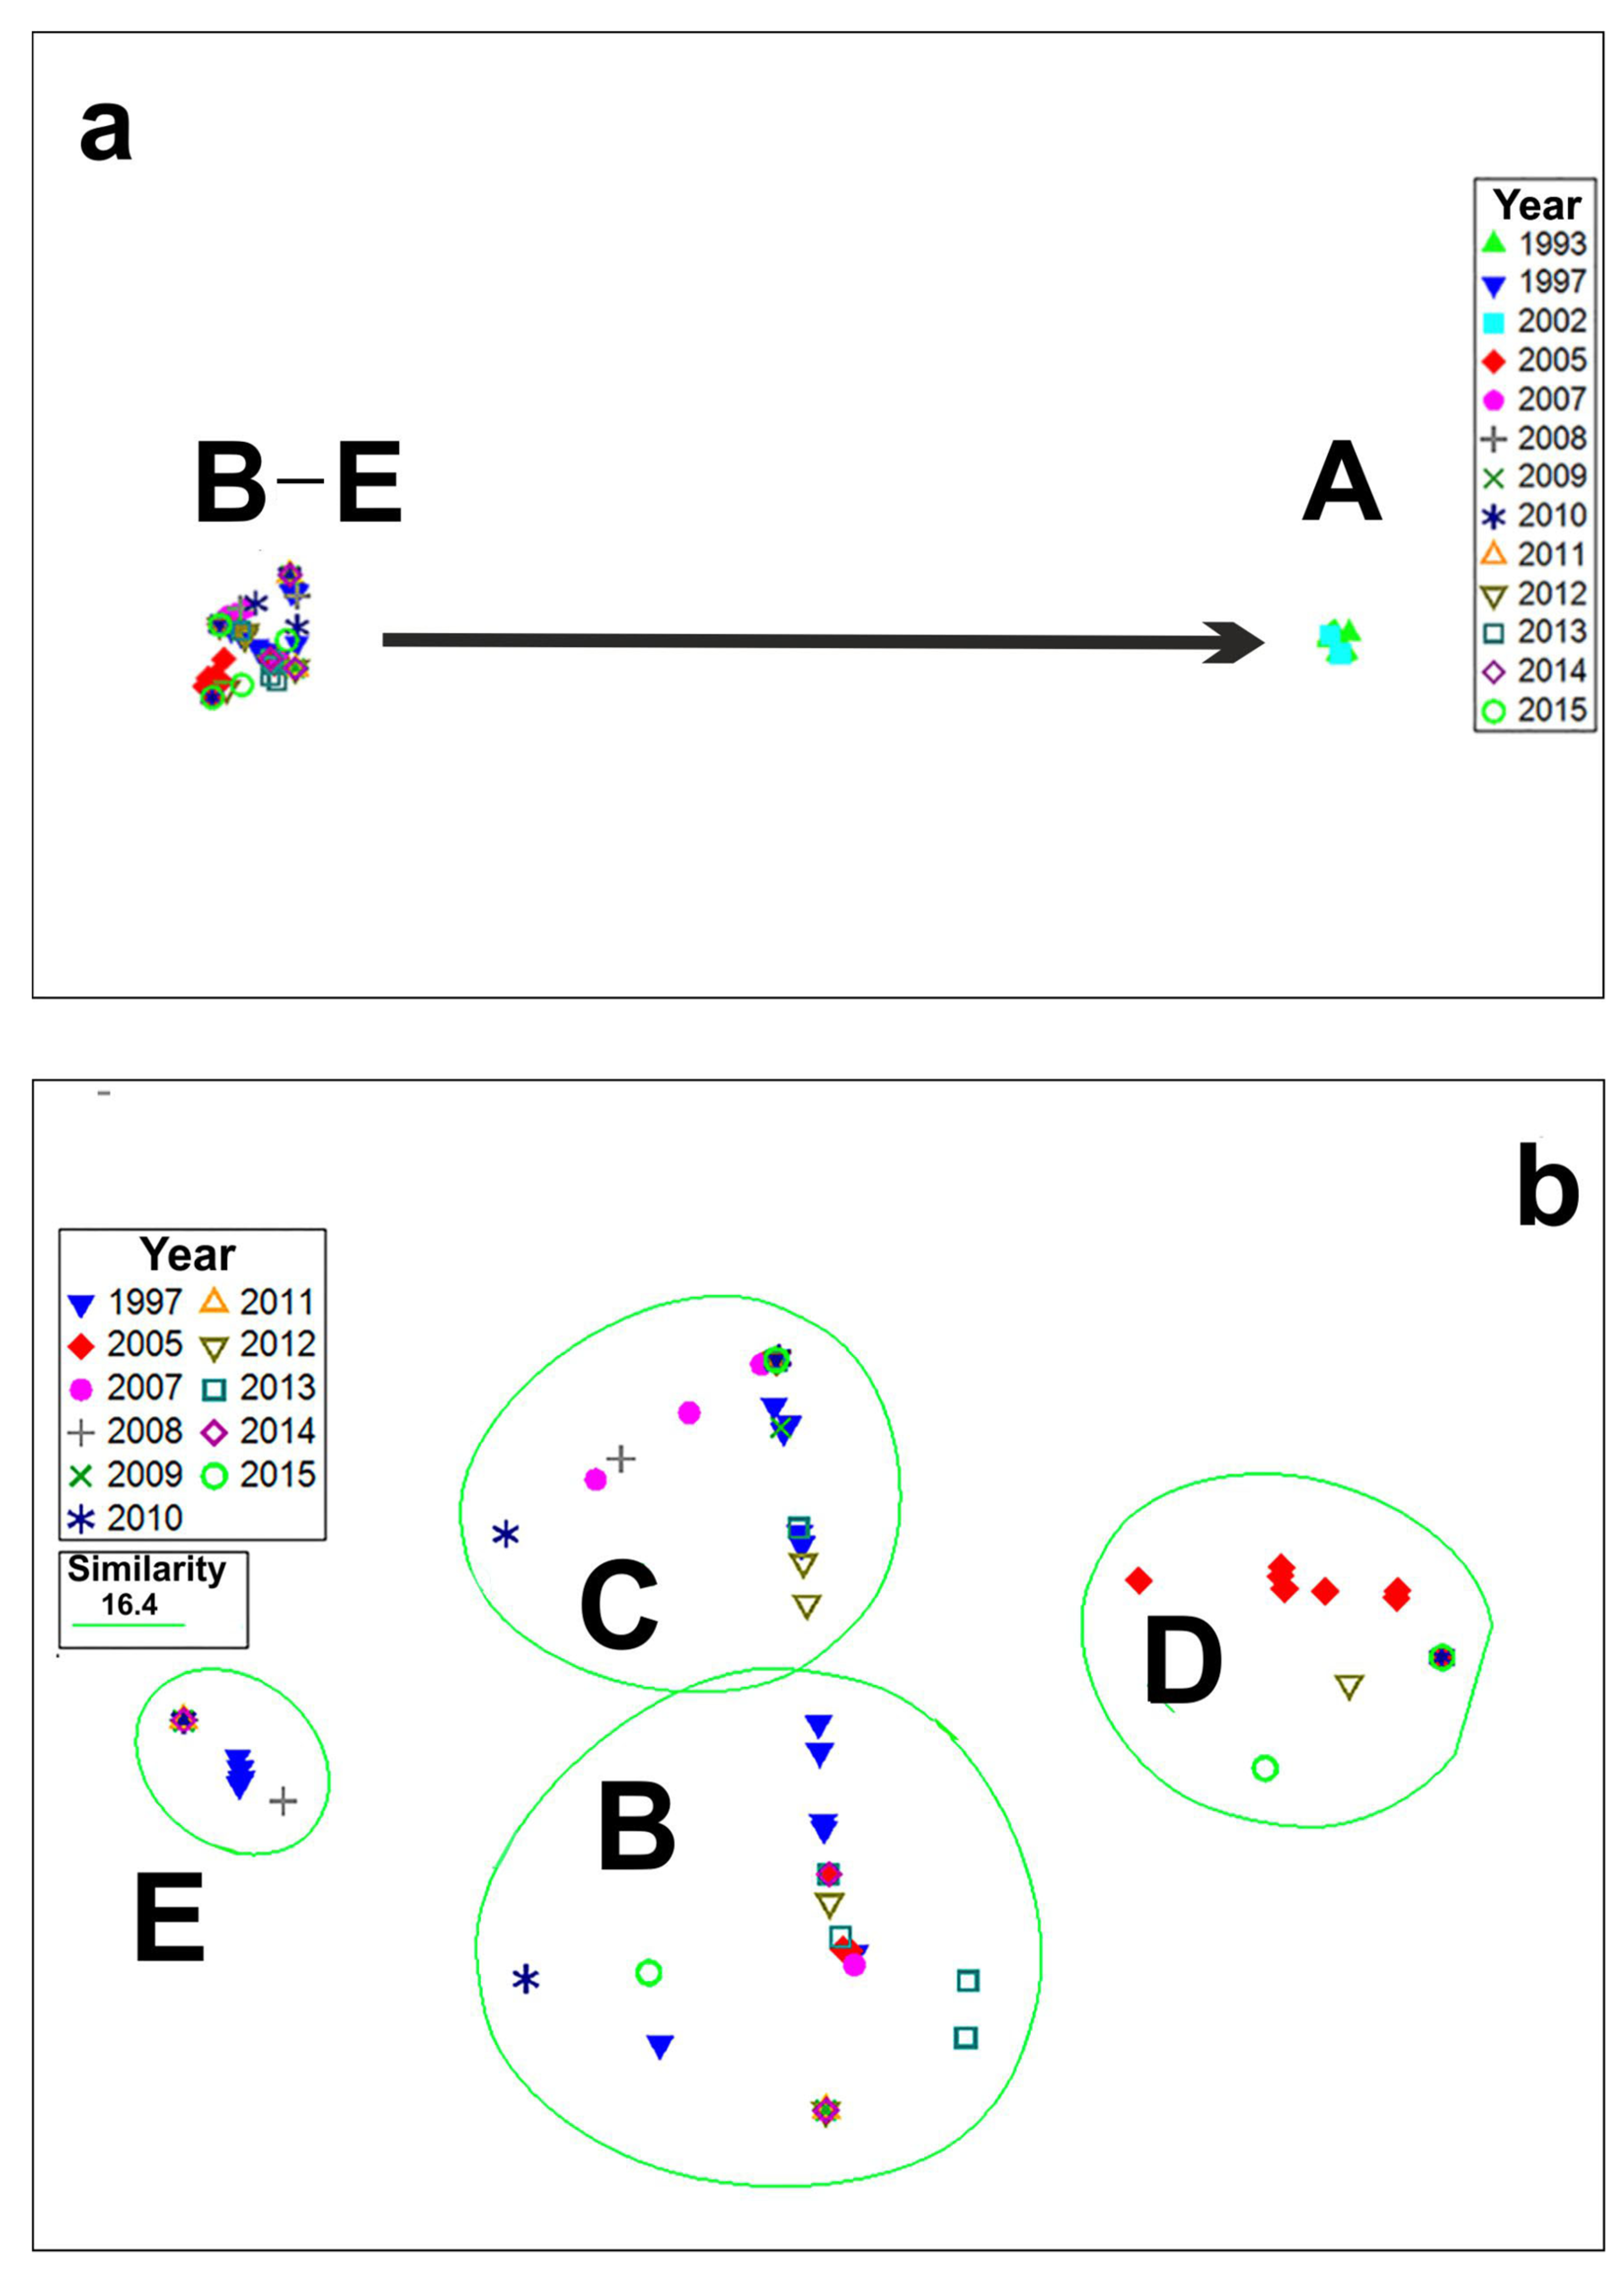
Phytoplankton samples from the permanent monitoring station 1 were analyzed to study long-term variations in species composition of bloom-forming Pseudo-nitzschia. The NMDS ordination plot graphically represents the variation in the species composition of Pseudo-nitzschia during blooms events in 1993–2015 (station 1). Five clusters (A–E) based on the dominant species were separated (Figure 3 and Figure 4). The optimal number of clusters resulted from a k-means cluster analysis was five; these clusters corresponded to groups resulted by NMDS analysis. The Euclidian distances between clusters ranged of 49.6 to 62.8. The resulting clusters also were supported by the one-way ANOSIM test (Global R = 0.997, number of permutations: 999, number of permuted R statistics greater than or equal to Global R: 0; for the results of the pair-wise test, see Table 3). The overlay of the MSD plot with the cluster dendrogram similarity lines indicated the respective maximum boundary values for discrimination of clusters. The maximum relative similarity of all clusters was about 0% (Bray–Curtis similarity), while the similarity between groups of clusters B, C, D, and cluster E was 3.8%. The maximum similarity was found between clusters B and C (16.4%).
Cluster A formed by the Pseudo-nitzschia multiseries-dominated collections of 1993 and 2002 was distinctive from all others (Figure 3a). It should be noted that blooms of this species with a cell density of more than 1 × 10⁶ cells L−1 were observed in 1993 and 2002 only (Figure 3a and Figure 4).
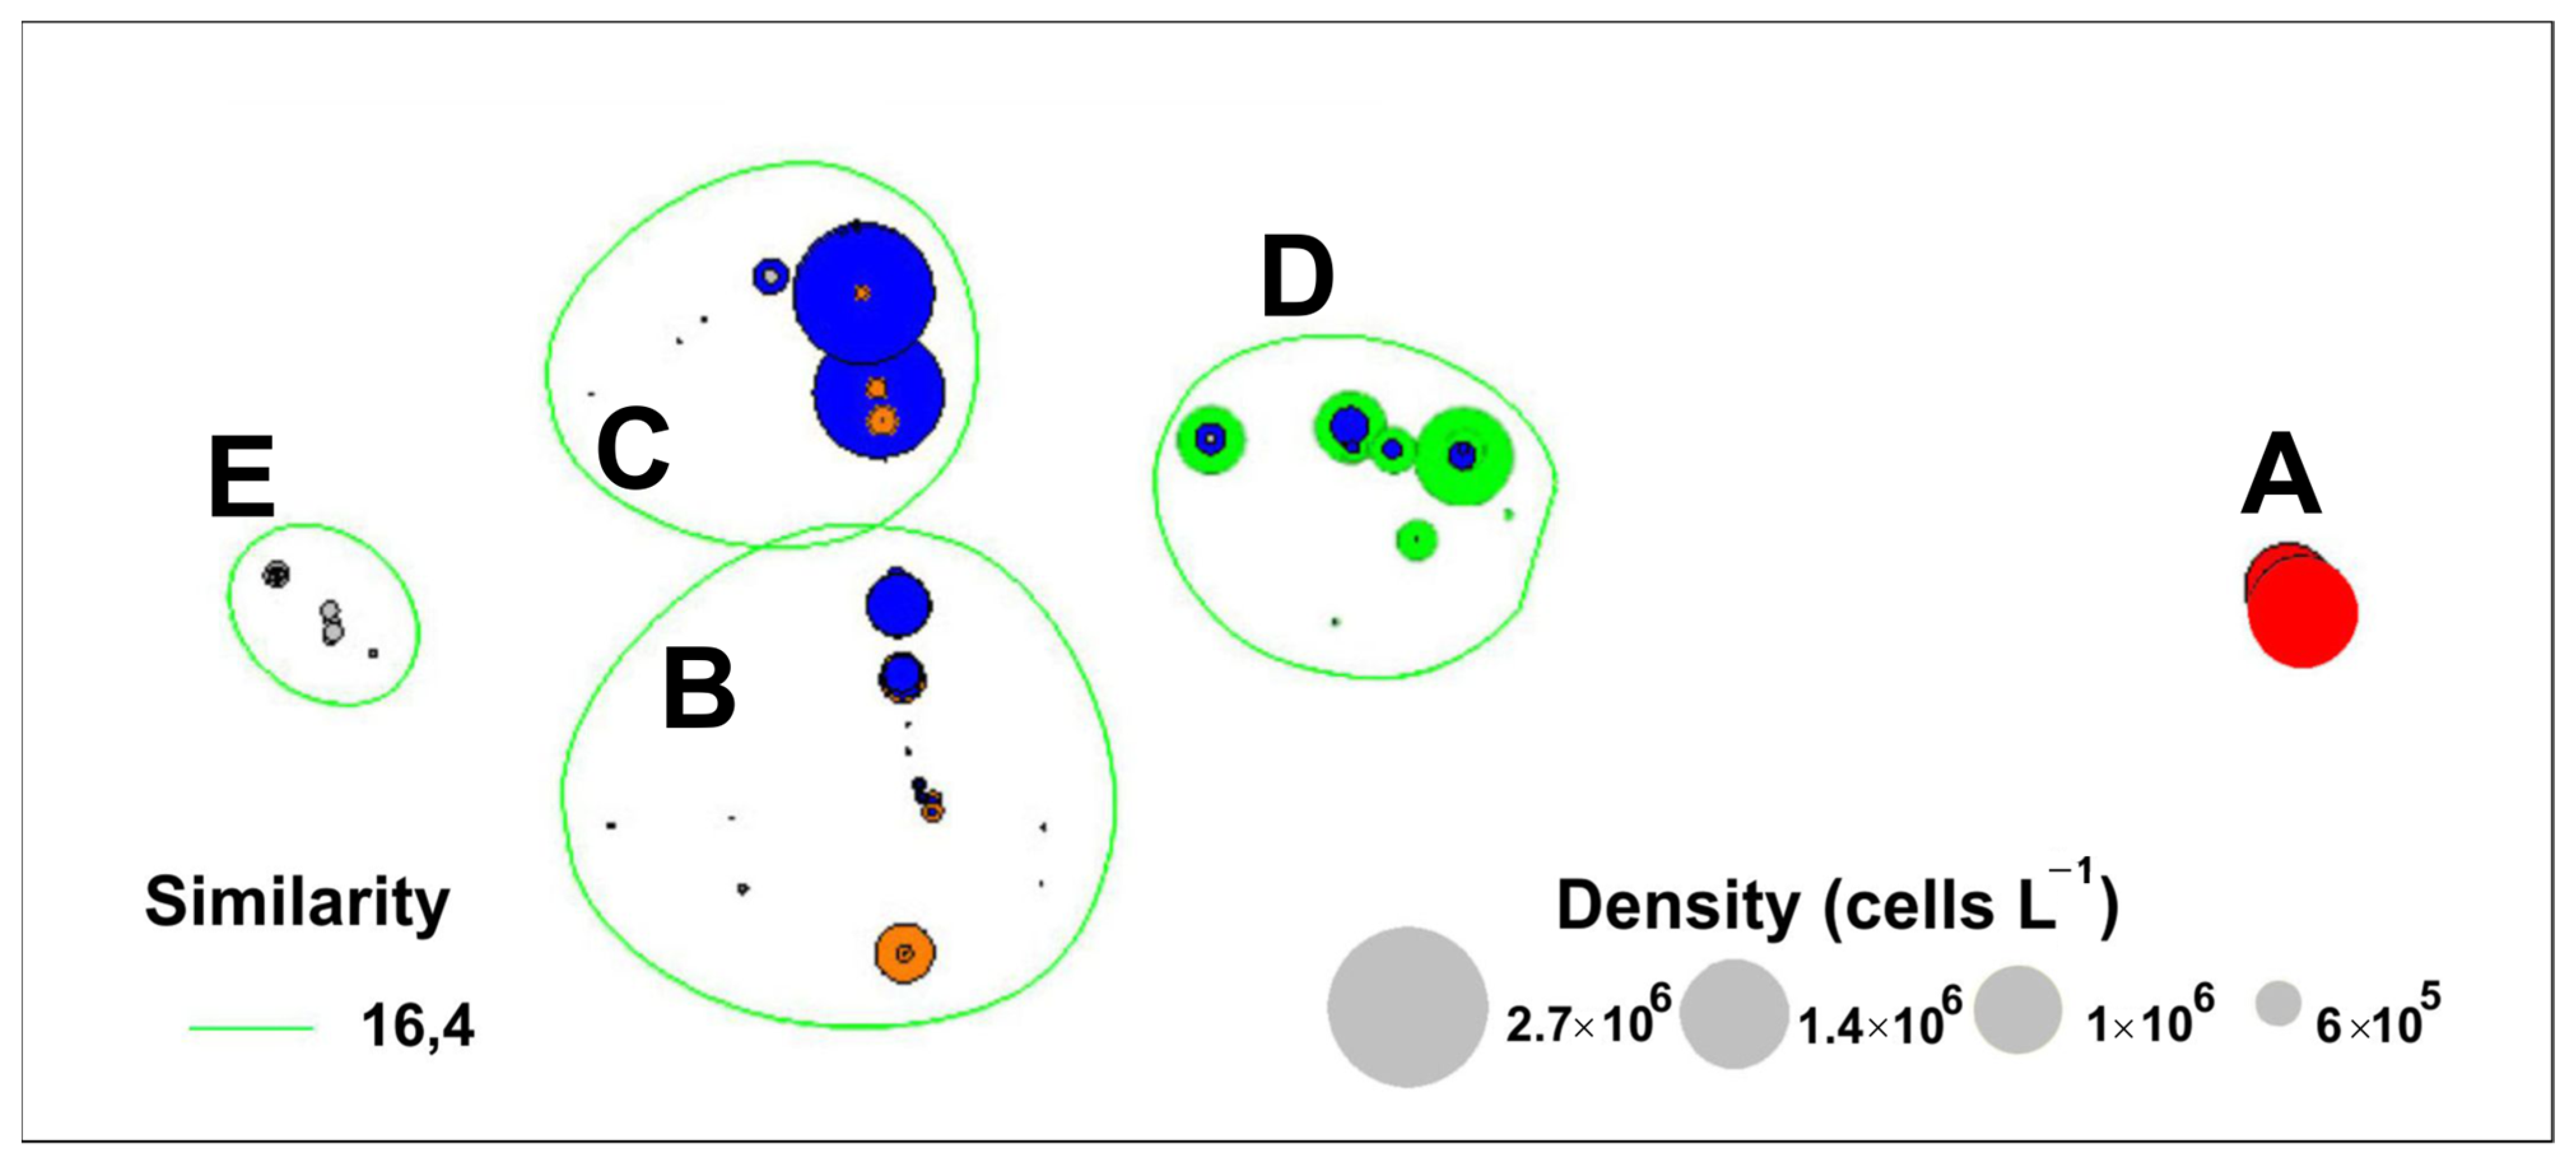
Clusters B (collections of 1997, 2005, 2007–2015) and C (collections of 1997, 2005, 2007–2010, 2012, 2013, 2015) combined samples dominated by Pseudo-nitzschia pungens and Pseudo-nitzschia calliantha (Figure 3b and Figure 4). The maximum concentration of Pseudo-nitzschia pungens (5.9 × 10⁵ cells L−1) was recorded in autumn 1997. In the following years, cell density of Pseudo-nitzschia pungens did not exceed 6 × 10⁴ cells L−1 and accounted for 60%–100% of total cell density of Pseudo-nitzchia. The most intensive bloom events of Pseudo-nitzschia calliantha were observed in autumn of 1997 (up to 2.7 × 10⁶ cells L−1). In the following years, this species was less abundant and reached up to 1 × 10⁵ cells L−1 in autumn of 2007 and 2012.
Cluster D was formed by Pseudo-nitzschia multistriata-dominated collections of 2005, 2010, 2012, and 2015 (Figure 3b and Figure 4). The most intensive bloom of P. multistriata was registered in autumn of 2005 with a maximum density of about 1 × 10⁶ cells L−1. Another bloom event caused by Pseudo-nitzschia multistriata was recorded in autumn of 2012 (up to 2.5 × 10⁵ cells L−1).
The last cluster (E) combined collections of 1997, 2007–2011, and 2014 dominated by other species of Pseudo-nitzchia (Pseudo-nitzschia delicatissima, and Pseudo-nitzschia sp.), with their densities of up to a few thousand cells L−1 (Figure 3b and Figure 4).
Thus, the analysis supports the conclusion that there was a change in bloom-forming species composition within the genus Pseudo-nitzschia; it was dominated by Pseudo-nitzschia multiseries during the early 1990s and 2002, and a shift towards the dominance of Pseudo-nitzschia multistriata and Pseudo-nitzschia calliantha occurred in 2005–2015.
4.3. A Shift towards the Dominance of Pseudo-nitzschia multistriata and Pseudo-nitzchia calliantha and Long-Term Variations in Water Temperature
A decrease in the density of Pseudo-nitzchia multiseries in different years in the past and in the first ten years of the current century was observed in different areas of the world ocean, including the northeastern coast of Canada [23], the coastal waters of Denmark [2,24,25], and California [26]. In the Northwest Pacific, Pseudo-nitzschia multiseries reached the highest concentration (1.1−3.5 × 10⁷ cells L−1) in the coastal waters of Russia and Korea [13,27] in the 1990s. DA accumulated to extremely high concentrations (30.8−33.5 mg kg−1) in bivalves, Mytilus edulis, from the waters of Korea during blooms of this species [27]. After 2002, no bloom events of this species were recorded from the area of our study.
Blooms caused by Pseudo-nitzschia multiseries in western Scottish Waters are known to frequently take place at low water temperatures during the cold season, while blooms of the Pseudo-nitzschia pseudodelicatissima complex (including Pseudo-nitzschia calliantha), Pseudo-nitzschia australis, and Pseudo-nitzschia pungens are associated mainly with the warm season [28]. The experiments with laboratory-reared cultures showed that Pseudo-nitzschia multiseries grows faster at lower temperatures (5 °C and 0 °C) [29,30,31] than does Pseudo-nitzschia pungens, which stops the cell division at 10 °C [31]. For this reason, some researchers [2] assumed an effect of seawater warming on reduction in the density of Pseudo-nitzschia multiseries and a competitive balance between this species and other Pseudo-nitzschia species.
As noted in the work of Lundholm et al. [2], the sharp decrease in Pseudo-nitzschia multiseries density may represent a combined effect of increased nutrient levels and water temperature. We did not find Pseudo-nitzchia multiseries in Amursky and Ussuriisky bays from 2005 to 2015, while blooms of Pseudo-nitzchia multistriata and Pseudo-nitzchia calliantha were observed. During the period of the most intense bloom caused by Pseudo-nitzchia multistriata and Pseudo-nitzchia calliantha in the autumn of 2005 in Amursky Bay, correlations of their density and the total density of Pseudo-nitzschia spp. with salinity, ammonium nitrogen concentration, and water temperature were studied [19]. Thus, Spearman’s correlation analysis revealed a negative relationship between total density of Pseudo-nitzschia and salinity and ammonium nitrogen concentration (Table 4). A weak positive relationship between the density of bloom-forming Pseudo-nitzschia species and the water temperature was supported (Table 4). In particular, a weak correlation was found between the water temperature and the density of Pseudo-nitzchia multistriata (Spearman’s correlation coefficient r = 0.432, p ≤ 0.05) and a weak correlation between the water temperature and the total density of Pseudo-nitzschia spp. (r = 0.428, p ≤ 0.05) [19]. Furthermore, a quite strong negative correlation between the density and the concentration of ammonium nitrogen in water was recorded for Pseudo-nitzchia calliantha (r = −0.691, p = 0.0005), which supports the data reported by a number of authors that the increase in Pseudo-nitzschia abundance seems to be a response to eutrophication [2,32,33,34].
Spearman’s correlation analysis of the whole data set was also performed in the current study based on data from year-round phytoplankton sampling from 2007 to 2015 (Table 5). The densities of Pseudo-nitzchia calliantha, Pseudo-nitzchia pungens, Pseudo-nitzchia multistriata, and the total density of Pseudo-nitzschia spp. were positively correlated with water temperature (p < 0.05).
Although the statistical positive correlation does not directly indicate a causal relation, the correlation implies that water temperature might be one of the causative factors for the increased cell concentrations of Pseudo-nitzchia multistriata and Pseudo-nitzchia calliantha in Amursky Bay after 2002.
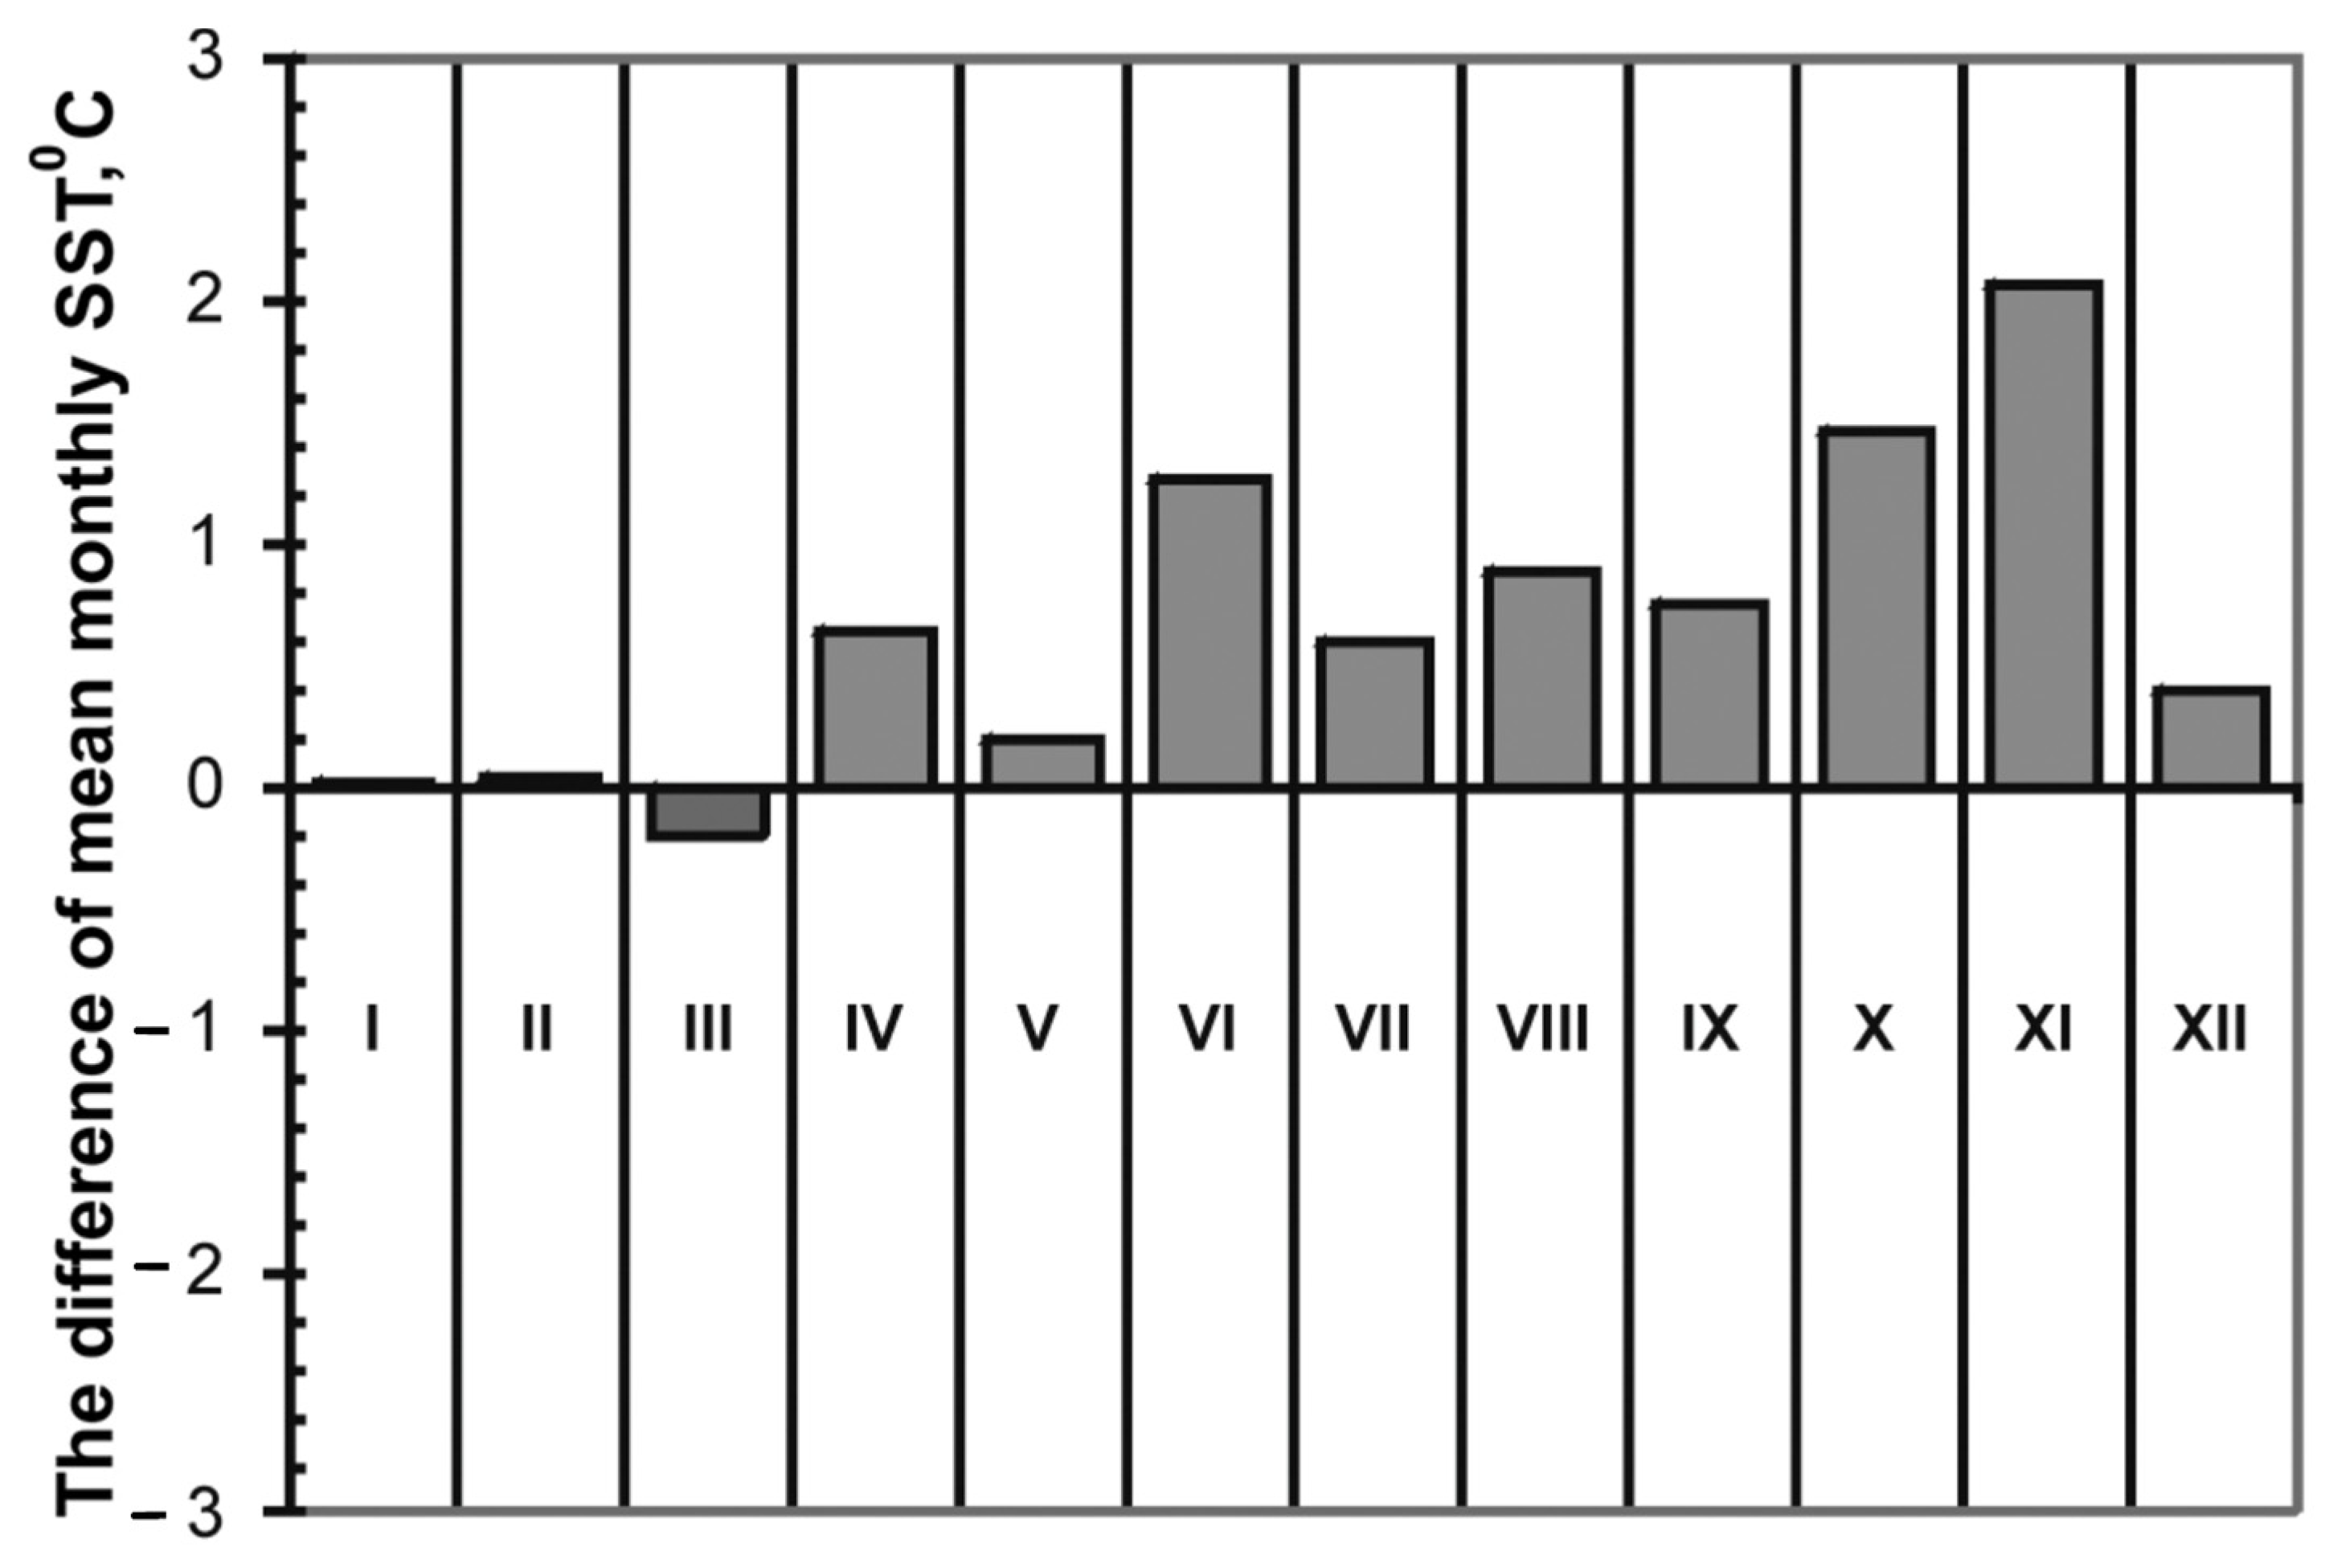
An earlier year-round study of phytoplankton investigated the dynamics of the Pseudo-nitzschia spp. density in Amursky Bay during 2007–2013 and revealed high cell densities in autumn, which can be considered as a season of Pseudo-nitzschia bloom events [15]. Zuenko and Rachkov [18] analyzed long-term climatic variations in water temperature in Amursky Bay over a more than 30 year period (1980−2013). During this period, waters of the bay showed a warming trend. Thus, a comparison of the average monthly sea surface temperatures (SST) in the period from 1980–1989 to 1998–2009 indicates a temperature increase in all months except March in Amursky Bay, with the most pronounced warming recorded in autumn (Figure 5), i.e., during the season of Pseudo-nitzschia spp. bloom in the northwestern Sea of Japan [15]. Thus, events of blooms caused by Pseudo-nitzchia multistriata and Pseudo-nitzchia calliantha were registered in Amursky Bay in autumn of 2005–2009, at a 0.9–1.4 °C increase in water temperature in comparison with the period of 1980–1989 (Table 6).
The climate of the Russian Far East is monsoon and is characterized by sharp variations in hydrometeorological processes during winter and summer monsoons. As regards the warm season of the year, when Pseudo-nitzschia bloom events occur, it should be noted that the initial summer monsoon phase shows a tendency to weaken due to the weakening of the Okhotsk High. This process is caused by an increase in the atmosphere’s thermal insulation properties (the so-called “greenhouse effect”). The inter-decadal fluctuations in the strength of the Okhotsk High are observed against the background of global trends, presumably due to the Arctic oscillation. The intensity of the summer monsoon in the final phase is determined by the distribution of atmospheric pressure in the North Pacific (Hawaiian) High pressure system, which also tends to weaken and is subject to inter-decadal fluctuations [18,35].
The relationships of the observed water temperature variations in Amursky Bay with large-scale climate changes were analyzed [18]. A conclusion was made that the water warming in Amursky Bay is induced mainly by the weakening summer monsoon, which determines weather conditions in Primorsky Krai, and the cross-shelf water exchange [18]. Based on these data, we assume that one of the factors responsible for the increase in the density of Pseudo-nitzchia multistriata and Pseudo-nitzchia calliantha off the Primorsky Krai coast may be the increased SST recorded from Amursky Bay in the period of 1998–2009 compared to the data of 1980–1989. This increase in water temperature is induced mainly by the long-term climatic changes such as, in particular, the weakening of the summer monsoon, which, in turn, is related to the long-term downward trend of the Okhotsk High index in 1990–2015 [18,35].
5. DA Content of Pseudo-nitzschia Cultures
Data on the DA content of Pseudo-nitzschia cultures from Russian waters of the Sea of Japan and coastal waters of Japan and Korea accumulated to date indicate that P. multiseries is the only highly toxic species in the Northwest Pacific (Table 7). Thus, according to an HPLC-fluorescence analysis, Pseudo-nitzchia multiseries isolated and cultured from Japanese and Russian waters had a high DA content with maximum concentrations of 5390 ng mL−1 and 317 ng mL−1 DA or 140 and 20.8 picogram cell−1, respectively [11,36]. The presence of DA in the cultures of Pseudo-nitzchia multistriata and Pseudo-nitzchia calliantha was confirmed for the laboratory-reared cultures isolated from the northwestern Sea of Japan [15]. The use of an Amnesic Shellfish Poisoning (ASP) direct Competative enzyme-linked assay (cELISA) kit (Biosence laboratories AS, Norway, Association of Official Agricultural Chemists (AOAC) official method 2006.02) showed that Pseudo-nitzchia multistriata and Pseudo-nitzchia calliantha strains isolated during their bloom events from the northwestern Sea of Japan produced relatively low levels of DA (up to 0.57 and 0.44 picogram cell−1, respectively). A low level of cellular DA (0.0004 picogram cell−1) was also found in the strains of Pseudo-nitzchia pungens var. pungens from the northwestern Sea of Japan. Thus, in recent years, numerous Pseudo-nitzschia bloom events in the area of our study were not accompanied by significant accumulation of DA in the diatom.
6. Conclusions
We consider the relatively low concentration of DA in the clones of Pseudo-nitzchia multistriata and Pseudo-nitzchia calliantha as an important factor to explain that no serious toxic events (poisoning of humans and marine animals and significant accumulation of DA in shellfish) were observed in the area of our study to date, despite these species being regularly recorded from the Russian waters of the northwestern Sea of Japan at concentrations corresponding to a bloom event (>105 cells L−1). Thus, the absence of Pseudo-nitzchia multiseries, the only highly toxic species registered in Peter the Great Bay among the dominant species, may be one of the possible causes of the absence of significant damage from algal blooms over the past 15 years.
Funding
This research received no external funding beside governmental.
Institutional Review Board Statement
This study was conducted according to the guidelines of the Declaration of Helsinki, and approved by the Ethics Committee of National Scientific Center of Marine Biology (NSCMB) FEB RAS, Russia (approval no. 1-160422 from Meeting No. 1 of the Commission on the biomedical ethics of NSCMB FEB RAS, 20 May 2021).
Informed Consent Statement
Not applicable.
Data Availability Statement
Not applicable.
Conflicts of Interest
The authors declare no conflict of interest.
References
- Bates, S.S.; Hubbard, K.A.; Lundholm, N.; Montresor, M.; Leaw, C.P. Pseudo-nitzschia, Nitzschia, and domoic acid: New research since 2011. Harmful Algae 2018, 79, 3–43. [Google Scholar] [CrossRef] [PubMed]
- Lundholm, N.; Clarke, A.; Ellegaard, M. A 100-year record of changing Pseudo-nitzschia species in a sill-fjord in Denmark related to nitrogen loading and temperature. Harmful Algae 2010, 9, 449–457. [Google Scholar] [CrossRef]
- Cabrini, M.; Fornasaro, D.; Cossarini, G.; Lipizer, M.; Virgilio, D. Phytoplankton temporal changes in a coastal northern Adriatic site during the last 25 years. Estuar. Coast. Shelf Sci. 2012, 115, 113–124. [Google Scholar] [CrossRef]
- Totti, C.; Romagnoli, T.; Accoroni, S.; Coluccelli, A.; Pellegrini, M.; Campanelli, A.; Grilli, F.; Marini, M. Phytoplankton communities in the northwestern Adriatic Sea: Interdecadal variability over a 30-years period (1988–2016) and relationships with meteoclimatic drivers. J. Mar. Syst. 2019, 193, 137–153. [Google Scholar] [CrossRef]
- Derolez, V.; Soudant, D.; Malet, N.; Chiantella, C.; Richard, M.; Abadie, E.; Aliaume, C.; Bec, B. Two decades of oligotrophication: Evidence for a phytoplankton community shift in the coastal lagoon of Thau (Mediterranean Sea, France). Estuar. Coast. Shelf Sci. 2020, 241, 106810. [Google Scholar] [CrossRef]
- Lefebvre, A.; Dezécache, C. Trajectories of changes in phytoplankton biomass, Phaeocystis globosa and diatom (incl. Pseudo-nitzschia sp.) abundances re-lated to nutrient pressures in the Eastern English Channel, Southern North Sea. J. Mar. Sci. Eng. 2020, 8, 401. [Google Scholar] [CrossRef]
- Huang, C.; Lin, X.; Lin, J.; Du, H.; Dong, Q. Population dynamics of Pseudo-nitzschia pungens in Zhelin Bay, China. J. Mar. Biol. Assoc. U. K. 2008, 89, 663–668. [Google Scholar] [CrossRef]
- Adrianov, A.V.; Kussakin, O.G. A Check-List of biota of the Peter the Great Bay, the Sea of Japan; Dalnauka: Vladivostok, Russia, 1998; p. 349. (In Russian) [Google Scholar]
- Semina, G.I. Phytoplankton of the Pacific Ocean; Publ. House Nauka: Moscow, Russia, 1974; p. 239. (In Russian) [Google Scholar]
- Orlova, T.; Morozova, T.; Kameneva, P.; Shevchenko, O. Harmful algal blooms on the Russian east coast and their possible economic impacts. In Proc. Workshop on Economic Impacts of Harmful Algal Blooms on Fisheries and Aquaculture; PICES Scientific Report, no. 47; Trainer, V.L., Yoshida, T., Eds.; PICES: Sidney, BC, Canada, 2014; pp. 41–58. [Google Scholar]
- Orlova, T.Y.; Stonik, I.V.; Aizdaicher, N.A.; Bates, S.S.; Léger, C.; Fehling, J. Toxicity, morphology and distribution of Pseudo-nitzschia calliantha, P. multistriata and P. multiseries (Bacillariophyta) from the northwestern Sea of Japan. Bot. Mar. 2008, 51, 297–306. [Google Scholar] [CrossRef]
- Stonik, I.V.; Orlova, T.Y.; Lundholm, N. Diversity of Pseudo-nitzschia H. Peragallo from the western North Pacific. Diatom Res. 2011, 26, 121–134. [Google Scholar] [CrossRef]
- Orlova, T.Y.; Zhukova, N.V.; Stonik, I.V. Bloom-forming Diatom Pseudo-nitzschia pungens in Amurskii Bay (the Sea of Japan): Morphology, ecology and biochemistry. In Harmful and Toxic Algal Blooms; Yasumoto, T., Oshima, Y., Fukuyo, Y., Eds.; Intergovernmental Oceanographic Commission of UNESCO: Paris, France, 1996; pp. 147–150. [Google Scholar]
- Stonik, I.V.; Isaeva, M.P.; Aizdaicher, N.A.; Balakirev, E.S.; Ayala, F.J. Morphological and genetic identification of Pseudo-nitzschia H. Peragallo, 1900 (Bacillariophyta) from the Sea of Japan. Russ. J. Mar. Biol. 2018, 44, 192–201. [Google Scholar] [CrossRef] [Green Version]
- Stonik, I.V.; Orlova, T.Y.; Chikalovets, I.V.; Aizdaicher, N.A.; Aleksanin, A.I.; Kachur, V.A.; Morozova, T.V. Pseudo-nitzschia species (Bacillariophyceae) and the domoic acid concentration in Pseudo-nitzschia cultures and bivalves from the northwestern Sea of Japan, Russia. Nova Hedwig. 2019, 108, 73–93. [Google Scholar] [CrossRef]
- Stonik, I.V.; Orlova, T.Y.; Shevchenko, O.G. Morphology and ecology of the species of the genus Pseudo-nitzschia (Bacillariophyta) from Peter the Great Bay, Sea of Japan. Russ. J. Mar. Biol. 2001, 27, 362–366. [Google Scholar] [CrossRef]
- Grigoriev, R.V.; Zuenko, Y.I. Climatic distribution of water temperature and salinity in the Amur Bay (Japan Sea). Izv. TINRO 2005, 143, 179–188, (In Russian with English Abstract). [Google Scholar]
- Zuenko, Y.I.; Rachkov, V.I. Climatic changes of temperature, salinity and nutrients in the Amur Bay of the Japan Sea. Izv. TINRO 2015, 183, 186–199, (In Russian with English Abstract). [Google Scholar]
- Stonik, I.V.; Orlova, T.Y.; Propp, L.N.; Demchenko, N.L.; Skriptsova, A.V. An autumn bloom of diatoms of the genus Pseudo-nitzschia H. Peragallo, 1900 in Amursky Bay, the Sea of Japan. Russ. J. Mar. Biol. 2012, 38, 211–217. [Google Scholar] [CrossRef]
- Clarke, K.; Green, R. Statistical design and analysis for a ‘biological effects’ study. Mar. Ecol. Prog. Ser. 1988, 46, 213–226. [Google Scholar] [CrossRef]
- Clarke, K.R.; Warwick, R.M. Software PRIMER; Primer-E Ltd.: Plymouth, UK, 2001. [Google Scholar]
- Stonik, I.V.; Orlova, T.Y.; Begun, A.A. Potentially toxic diatoms Pseudo-nitzschia fraudulenta and P. calliantha from Russian waters of East/Japan Sea and Sea of Okhotsk. Ocean Sci. J. 2008, 43, 25–30. [Google Scholar] [CrossRef]
- Bates, S.S.; Garrison, D.L.; Horner, R.A. Bloom dynamics and physiology of domoic-acid-producing Pseudo-nitzschia species. In Physiological Ecology of Harmful Algal Blooms; Proc. of the NATO Advanced Study Institute on “The Physiological Ecology of Harmful Algae Blooms”, Held at the Bermuda Biological Station for Research, Bermuda, 27 May–6 June 1996; Anderson, D.M., Cembella, A.D., Hallegraeff, G.M., Eds.; Springer: Berlin, Germany, 1966; Series G: Ecolological Sciences, 1996; Volume 41, pp. 267–292. [Google Scholar]
- Hasle, G.R. Pseudo-nitzschia pungens and P. multiseries (Bacillariophyceae): Nomenclatural history, morphology, and distribution. J. Phycol. 1995, 31, 428–435. [Google Scholar] [CrossRef]
- Hasle, G.R.; Lange, C.B.; Syvertsen, E.E. A review of Pseudo-nitzschia, with special reference to the Skagerrak, North Atlantic, and adjacent waters. Helgol. Mar. Res. 1996, 50, 131–175. [Google Scholar] [CrossRef] [Green Version]
- Jester, R.; Lefebvre, K.; Langlois, G.; Vigilant, V.; Baugh, K.; Silver, M.W. A shift in the dominant toxin-producing algal species in central California alters phycotoxins in food webs. Harmful Algae 2009, 8, 291–298. [Google Scholar] [CrossRef]
- Lee, J.H.; Baik, J.H. Neurotoxin-producing Pseudo-nitzschia multiseries (Hasle) Hasle, in the coastal waters of Southern Korea II. Production of domoic acid. Algae 1997, 12, 31–38. [Google Scholar]
- Fehling, J.; Davidson, K.; Bolch, C.; Tett, P. Seasonality of Pseudo-nitzschia spp. (Bacillariophyceae) in western Scottish waters. Mar. Ecol. Prog. Ser. 2006, 323, 91–105. [Google Scholar] [CrossRef] [Green Version]
- Lewis, N.I.; Bates, S.S.; McLachlan, J.L.; Smith, J.C. Temperature effects on growth, domoic acid production, and morphology of the diatom Nitzschia pungens f. multiseries. In Toxic Phytoplankton Blooms in the Sea; Smayda, T.J., Shimizu, Y., Eds.; Elsevier: Amsterdam, The Netherlands, 1993; pp. 601–606. [Google Scholar]
- Smith, J.C.; McLachlan, J.L.; Cormier, P.G.; Pauley, K.E.; Bouchard, N. Growth and domoic acid production and retention by Nitzschia pungens forma multiseries at low temperatures. In Toxic Phytoplankton Blooms in the Sea; Smayda, T.J., Shimizu, Y., Eds.; Elsevier: Amsterdam, The Netherlands, 1993; pp. 631–636. [Google Scholar]
- Cho, E.S.; Kotaki, Y.; Park, J.G. The comparison between toxic Pseudo-nitzschia multiseries (Hasle) Hasle and non-toxic P. pungens (Grunow) Hasle isolated from Jinhae Bay, Korea. Algae 2001, 16, 275–285. [Google Scholar]
- Smayda, T.J. Novel and nuisance phytoplankton blooms in the sea: Evidence for a global epidemic. In Toxic Marine Phytoplankton; Grane’li, E., Sundstrøm, B., Edler, L., Anderson, D.M., Eds.; Elsevier: New York, NY, USA, 1990; pp. 29–40. [Google Scholar]
- Hallegraeff, G.M. A review of harmful algal blooms and their apparent global increase. Phycologia 1993, 32, 79–99. [Google Scholar] [CrossRef] [Green Version]
- Parsons, M.L.; Dortch, Q. Sedimentological evidence of an increase in Pseudo-nitzschia (Bacillariophyceae) abundance in response to coastal eutrophication. Limnol. Oceanogr. 2002, 47, 551–558. [Google Scholar] [CrossRef]
- Shatilina, T.A.; Anzhina, G.I. Variability of the Far-Eastern monsoon intensity in 1948−2010. Izv. TINRO 2011, 167, 146–159, (In Russian with English Abstract). [Google Scholar]
- Lundholm, N.; Hansen, P.J.; Kotaki, Y. Effect of pH on growth and domoic acid production by potentially toxic diatoms of the genera Pseudo-nitzschia and Nitzschia. Mar. Ecol. Prog. Ser. 2004, 273, 1–15. [Google Scholar] [CrossRef]
- Kotaki, Y.; Koike, K.; Sato, S.; Ogata, T.; Fukuyo, Y.; Kodama, M. Confirmation of domoic acid production of Pseudo-nitzschia multiseries isolated from Ofunato Bay, Japan. Toxicon 1999, 37, 677–682. [Google Scholar] [CrossRef]
Figure 1.
Study area and sampling stations 1–7. Station 1 is a permanent monitoring station (indicated by asterisk).
Figure 1.
Study area and sampling stations 1–7. Station 1 is a permanent monitoring station (indicated by asterisk).

Figure 2.
Dominant species in the period Pseudo-nitzschia bloom events in Amursky Bay in 1992–2015. The bold horizontal line corresponds to a provisional limit for the bloom events.
Figure 2.
Dominant species in the period Pseudo-nitzschia bloom events in Amursky Bay in 1992–2015. The bold horizontal line corresponds to a provisional limit for the bloom events.

Figure 3.
Non-metric multidimensional scaling (NMDS) ordination analysis of cell density data of bloom-forming Pseudo-nitzschia species for different years of collection (n = 275). Five clusters (A–E) are separated. The cluster A formed by Pseudo-nitzschia multiseries is clearly distinctive (arrow) from clusters B–E formed by other bloom-forming species (a). Plot (b) shows detailed structure of clusters B–E.

Figure 4.
Non-metric multidimensional scaling (NMDS) ordination analysis of cell density (cells L−1) showing five clusters (A–E). The cell densities of Pseudo-nitzchia multiseries (red circles), Pseudo-nitzchia pungens (orange circles), Pseudo-nitzschia calliantha (blue circles), Pseudo-nitzchia multistriata (green circles), and other Pseudo-nitzchia species (grey circles) are given for clusters.

Figure 5.
Difference of mean monthly SST between 1980–1989 and 1998–2009 in Amursky Bay. Reproduced with permission from Federal Research Institute of Fisheries and Oceanography, Pacific Branch (TINRO) from (Climatic Changes of Temperature, Salinity and Nutrients in the Amur Bay of the Japan Sea. Zuenko Yu. I.; Rachkov V.I. Izvestiya TINRO 2015, 183, 186–199).


Table 1.
Time, location, and number of samples of the sampling stations 1–7 in Amursky and Ussuriisky bays, northwestern Sea of Japan. See Figure 1 for the location of samples.
Table 1.
Time, location, and number of samples of the sampling stations 1–7 in Amursky and Ussuriisky bays, northwestern Sea of Japan. See Figure 1 for the location of samples.
| Area | Station | Dates | No. of Samples | Latitude N | Longitude E |
|---|---|---|---|---|---|
| Amursky Bay | 1 | 20 April 1993–17 December 1993 | 14 | 43°12′ | 131°54′ |
| 1 | 4 June 1997–5 December 1997 | 21 | 43°12′ | 131°54′ | |
| 1 | 6 June 2002–11 September 2002 | 4 | 43°12′ | 131°54′ | |
| 1 | 14 June 2005–30 December 2005 | 31 | 43°12′ | 131°54′ | |
| 1 | 26 January 2007–29 December 2015 | 205 | 43°12′ | 131°54′ | |
| 2 | 25 June 1992–25 October 1992 | 9 | 43°10′ | 131°52′ | |
| 3 | 31 August 2002–20 November 2005 | 39 | 43°11′ | 131°54′ | |
| 4 | 10 May 2001–20 October 2002 | 11 | 43°01′ | 131°47′ | |
| Ussuriisky Bay | 5 | 13 November 2012–19 December 2012 | 2 | 43°04′ | 131°57′ |
| 5 | 11 November 2013–23 December 2013 | 2 | 43°04′ | 131°57′ | |
| 5 | 15 October 2015–5 November 2015 | 2 | 43°04′ | 131°57′ | |
| 6 | 11 November 2013–23 December 2013 | 2 | 43°05′ | 131°58′ | |
| 6 | 15 October 2015–5 November 2015 | 2 | 43°05′ | 131°58′ | |
| 7 | 13 November 2012–19 December 2012 | 2 | 43°11′ | 132°06′ | |
| 7 | 11 November 2013–23 December 2013 | 2 | 43°11′ | 132°06′ | |
| 7 | 15 October 2015–5 November 2015 | 2 | 43°11′ | 132°06′ |
Table 2.
Pseudo-nitzschia bloom events and sea surface temperature (SST) and salinity (SSS) in the northwestern Sea of Japan during 1992–2015.
Table 2.
Pseudo-nitzschia bloom events and sea surface temperature (SST) and salinity (SSS) in the northwestern Sea of Japan during 1992–2015.
| Species | Station | Dates | Maximum Concentration (Cells L−1) | Conditions | Data from |
|---|---|---|---|---|---|
| Amursky Bay | |||||
| Pseudo-nitzschia multiseries | 2 | June 1992 | 1.1–3.5 × 10⁷ | After heavy rains at SST of 15.3–16.1 °C | [13] |
| Pseudo-nitzschia multiseries | 1 | June 1993 | 1–1.2 × 10⁶ | SST of 14.2–15.8 °C | [16] |
| Pseudo-nitzschia multiseries | 1 | September 2002 | 1.4 × 10⁶ | SST of 12.5–14 °C | [12] |
| Pseudo-nitzschia calliantha Pseudo-nitzschia pungens | 1 | November 1997 | 2.7 × 1065.9 × 105 | SST of 5–6 °C and SSS of 34.5 | [16] |
| Pseudo-nitzschia fraudulenta Pseudo-nitzschia calliantha | 3 | October– November 2002 | 2.1 × 1051.5 × 105 | Water temperature of 6–16 °C and SSS of 28.8–33.5 | [22] |
| Pseudo-nitzschia multistriata Pseudo-nitzschia calliantha | 1 | October 2005 | 0.9 × 1061.2 × 105 | SST of 6–12 °C and SSS of 31–33.5. | [19] |
| Pseudo-nitzschia calliantha | 1 | September 2007 | 1.7 × 10⁵ | SST of 20 °C | [15] |
| Pseudo-nitzschia multistriata | 1 | September 2012 | 2.5 × 10⁵ | SST of 17.8 °C and SSS of 28. | [15] |
| Pseudo-nitzschia calliantha | 1 | November 2012 | 1.1 × 10⁵ | SST of 6.8 °C | [15] |
| Ussuriisky Bay | |||||
| Pseudo-nitzschia calliantha | 5 | November 2012 | 1.4 × 10⁶ | SST of 6 °C | Unpublished data |
| Pseudo-nitzschia calliantha | 6 | November 2012 | 1.1 × 10⁶ | SST of 6.5 °C | Unpublished data |
| Pseudo-nitzschia calliantha | 7 | November 2012 | 1.2 × 10⁶ | SST of 6 °C | Unpublished data |
| Pseudo-nitzschia calliantha | 7 | November 2013 | 1.9 × 10⁵ | SST of 5 °C | Unpublished data |
| Pseudo-nitzschia calliantha | 6 | October 2015 | 3.5 × 10⁵ | SST of 10.4 °C | Unpublished data |
| Pseudo-nitzschia multistriata | 7 | October 2015 | 1.7 × 10⁵ | SST of 14.3 °C | Unpublished data |
Table 3.
Results of one-way ANOSIM pair-wise test to compare the similarity between clusters resulted by non-metric multidimensional scaling (NMDS) and k-means analyses. The number permutations was 999 and the number of permuted statistics greater than or equal to R-statistics was zero for all cluster combinations.
| Cluster | R-Statistics | Significance Level |
|---|---|---|
| A, B | 1 | 0.1% |
| A, C | 1 | 0.1% |
| A, D | 1 | 0.1% |
| A, E | 1 | 0.1% |
| B, E | 0.999 | 0.1% |
| B, C | 0.976 | 0.1% |
| B, D | 1 | 0.1% |
| E, C | 0.997 | 0.1% |
| E, D | 1 | 0.1% |
| C, D | 1 | 0.1% |
Table 4.
Spearman’s coefficient of correlation between the cell density of bloom-forming Pseudo-nitzschia species and environmental factors based on data from phytoplankton sampling (n = 21) in Amursky Bay in autumn 2005. Statistically significant results (p ≤ 0.05) are marked in bold (data from Stonik et al. [19]).
| Factor | Pseudo-nitzschia spp. | Pseudo-nitzchia multistriata | Pseudo-nitzchia calliantha |
|---|---|---|---|
| NH4 | −0.521 | −0.487 | −0.691 |
| Salinity | −0.445 | −0.441 | −0.232 |
| Water temperature | 0.428 | 0.432 | 0.204 |
Table 5.
Spearman’s coefficient of correlation (r) between the cell density of bloom-forming Pseudo-nitzschia species and water temperature based on data from year-round phytoplankton sampling (n = 205) in Amursky Bay (station 1) during 2007–2015. Statistically significant results (p < 0.05) are presented.
| Species | r |
|---|---|
| Pseudo-nitzchia calliantha | 0.278 |
| Pseudo-nitzchia pungens | 0.188 |
| Pseudo-nitzchia multistriata | 0.154 |
| Pseudo-nitzschia spp. | 0.464 |
Table 6.
Pseudo-nitzschia bloom events in Amursky Bay during 2005–2009 and the difference of mean monthly SST in Amursky Bay between 1980–1989 and 1998–2009, adapted from [18].
Table 6.
Pseudo-nitzschia bloom events in Amursky Bay during 2005–2009 and the difference of mean monthly SST in Amursky Bay between 1980–1989 and 1998–2009, adapted from [18].
| Species and Temperature Differences | Months and Years of Bloom Events | |
|---|---|---|
| September | October | |
| Pseudo-nitzchia multistriata | nd | 2005 |
| Pseudo-nitzchia calliantha | 2007 | nd |
| Difference of mean monthly SST | 0.9 °C | 1.4 °C |
nd, not detected.
Table 7.
Maximum concentrations of domoic acid (DA) produced in laboratory-reared Pseudo-nitzschia cultures isolated from the northwestern Pacific Ocean during the period of their bloom.
Table 7.
Maximum concentrations of domoic acid (DA) produced in laboratory-reared Pseudo-nitzschia cultures isolated from the northwestern Pacific Ocean during the period of their bloom.
| Species | Maximum DA Concentration (Picogram DA Cell−1) |
|---|---|
| Pseudo-nitzchia multiseries | 20.8 (Peter the Great Bay, Russia a) |
| 1.03–2.4 (Jinhal and Chinhae bays, South Korea b) | |
| 1.15–140 (Okkiray Bay, Japan c) | |
| 5.7 (Ofunato Bay, Japan d) | |
| Pseudo-nitzchia pungens var. pungens | 0.0004 e |
| Pseudo-nitzchia calliantha | 0.44 e |
| Pseudo-nitzchia multistriata | 0.57 e |
Publisher’s Note: MDPI stays neutral with regard to jurisdictional claims in published maps and institutional affiliations. |
© 2021 by the author. Licensee MDPI, Basel, Switzerland. This article is an open access article distributed under the terms and conditions of the Creative Commons Attribution (CC BY) license (https://creativecommons.org/licenses/by/4.0/).
Share and Cite
MDPI and ACS Style
Stonik, I.V. Long-Term Variations in Species Composition of Bloom-Forming Toxic Pseudo-nitzschia Diatoms in the North-Western Sea of Japan during 1992–2015. J. Mar. Sci. Eng. 2021, 9, 568. https://doi.org/10.3390/jmse9060568
AMA Style
Stonik IV. Long-Term Variations in Species Composition of Bloom-Forming Toxic Pseudo-nitzschia Diatoms in the North-Western Sea of Japan during 1992–2015. Journal of Marine Science and Engineering. 2021; 9(6):568. https://doi.org/10.3390/jmse9060568
Chicago/Turabian StyleStonik, Inna V. 2021. "Long-Term Variations in Species Composition of Bloom-Forming Toxic Pseudo-nitzschia Diatoms in the North-Western Sea of Japan during 1992–2015" Journal of Marine Science and Engineering 9, no. 6: 568. https://doi.org/10.3390/jmse9060568
Note that from the first issue of 2016, this journal uses article numbers instead of page numbers. See further details here.