Article

Expression of Saccharomyces cerevisiae RER2 Gene Encoding Cis-Prenyltransferase in Trichoderma atroviride Increases the Activity of Secretory Hydrolases and Enhances Antimicrobial Features

by
Urszula Perlińska-Lenart
1,†,
Sebastian Graczyk
1,†,
Sebastian Piłsyk
1,
Jacek Lenart
2,‡,
Agata Lipko
1,
Ewa Swiezewska
1,
Przemysław Bernat
3 and
Joanna S. Kruszewska
1,*
1
Institute of Biochemistry and Biophysics, Polish Academy of Sciences, Pawińskiego 5a, 02-106 Warsaw, Poland
2
Mossakowski Medical Research Centre, Polish Academy of Sciences, Pawińskiego 5, 02-106 Warsaw, Poland
3
Department of Industrial Microbiology and Biotechnology, Faculty of Biology and Environmental Protection, University of Lodz, Banacha Street 12/16, 90-237 Lodz, Poland
*
Author to whom correspondence should be addressed.
These authors contributed equally to this work.
Jacek Lenart had passed away.
J. Fungi 2023, 9(1), 38; https://doi.org/10.3390/jof9010038
Submission received: 30 November 2022 / Revised: 22 December 2022 / Accepted: 23 December 2022 / Published: 26 December 2022

Abstract

:
Some Trichoderma spp. exhibit natural abilities to reduce fungal diseases of plants through their mycoparasitic and antagonistic properties. In this study, we created new Trichoderma atroviride strains with elevated antifungal activity. This effect was achieved by improving the activity of cis-prenyltransferase, the main enzyme in dolichol synthesis, by expressing the RER2 gene from Saccharomyces cerevisiae. Since dolichyl phosphate is the carrier of carbohydrate residues during protein glycosylation, activation of its synthesis enhanced the activities of dolichyl-dependent enzymes, DPM synthase and N-acetylglucosamine transferase, as well as stimulated glycosylation of secretory proteins. Cellulases secreted by the transformants revealed significantly higher levels or activities compared to the control strain. Consequently, the resulting Trichoderma strains were more effective against the plant pathogens Pythium ultimum.

1. Introduction

Some species of the filamentous fungus Trichoderma exhibit biocontrol activity against fungal plant pathogens. Preparations containing Trichoderma spp. are presently used commercially for biological control against plant pathogens such as Pythium spp., Phytophthora spp., Botrytis spp., Rhizoctonia and Fusarium spp. The antagonistic properties of Trichoderma are based on multiple mechanisms [1]. Biocontrol can result from a direct interaction between the pathogen and the biocontrol agent, which involves synthesis of hydrolases and metabolites acting synergistically. Trichoderma attached to the pathogenic fungus produces cell wall-degrading enzymes. They allow assimilation of the released carbohydrates and penetration into the hypha of the pathogen. A comparative transcriptomic analysis of three Trichoderma species, T. reesei, T. atroviride and T. virens, had shown different transcriptomic responses upon recognition before the physical contact with the alien hyphae [2]. The types of genes expressed distinguished T. atroviride and T. virens from T. reesei. T. reesei mainly expressed genes for nutrient acquisition, which could be explained by an attempt to compete for nutrients with the other fungus. T. virens and T. atroviride differ in their antifungal strategy, the former poisoning the pathogenic fungus with gliotoxin and the latter using antibiosis and hydrolytic enzymes. In addition, T. atroviride produces 6-pentyl-α-pyrone, a volatile compound with antifungal activity that is not formed by T. virens [2].
Since T. atroviride carries out a hydrolytic attack on the pathogen cell wall as a strategy of mycoparasitism, we attempted to improve its antifungal characteristics by enhancing its hydrolytic properties.
The hydrolytic enzymes secreted by Trichoderma are heavily glycosylated with both N- and O-linked carbohydrates [3], accounting for as much as 12–24% of their molecular mass [4]. The O-linked glycans are attached in a linker connecting the catalytic and substrate binding domains and are required for their proper relative positioning. N-glycosylation is connected with protein folding, and it is crucial for recognition of misfolded glycoproteins [5,6]. Any dysfunction of glycosylation results in the accumulation of affected proteins in the endoplasmic reticulum and down-regulation of their genes [7,8]. These data suggest that an enhanced glycosylation of secretory proteins in T. atroviride could improve their secretion. Glycoproteins would be folded correctly, more rapidly and in a higher proportion. Furthermore, such effective glycosylation could also improve the activity of the secretory enzymes by stabilizing them outside the cell as well [4,6,9,10,11].
Our previous results showed that, indeed, glycosylation processes and protein secretion in T. reesei were stimulated by overproduction of GDP-mannose and dolichyl phosphate mannose (DPM), O- and N-glycosylation substrates [12,13,14].
In this study, we present the effects of expression of the yeast RER2 gene coding for cis-prenyltransferase (dehydrodolichyl diphosphate synthase) (Figure 1) in the biocontrol T. atroviride strain P1.
Cis-prenyltransferase, a key enzyme in dolichol synthesis, is the first enzyme of the polyprenyl branch of the mevalonate pathway. This enzyme catalyzes the elongation of polyprenyl chain by sequential addition of isopentenyl diphosphate (IPP) to farnesyl diphosphate (FPP) [15,16]. The phosphorylated form of dolichols is indispensable as a carbohydrate carrier in protein glycosylation.
Transformants expressing RER2S.c gene had an elevated activity of cis-prenyltransferase and also of the dolichol-dependent DPM synthase as well as N-acetylglucosamine transferase. Moreover, they showed significantly higher levels of O- and N-glycosylation of secretory proteins. The activities of hydrolytic enzymes secreted to the cultivation medium were increased, and their maximum activity correlated with maximum glycosylation. Probably as a consequence of their higher hydrolytic activity, the new strains also had substantially improved antimicrobial ability.

2. Materials and Methods

2.1. Strains and Cultivation Media

T. atroviride strain P1 (“Trichoderma harzianum” ATCC 74058) was used as the recipient strain for transformation.
Escherichia coli strain JM 109 was used for plasmid propagation [17].
T. atroviride was cultivated at 28 °C on a rotary shaker (250 r.p.m.) in 2-l shake flasks containing 1 l of minimal medium (MM): 1 g MgSO4 × 7H2O, 6 g (NH4)2SO4, 10 g KH2PO4, 3 g sodium citrate × 2H2O and trace elements (25 mg FeSO4 × 7H2O, 2.7 mg MnCl2 × 4H2O, 6.2 mg ZnSO4 × 7H2O, 14 mg CaCl2 × 2H2O) per liter and 1% (w/v) lactose or glucose as a carbon source. The flasks were inoculated with 42 × 106 conidia/l medium.
Pythium ultimum the MUCL 16,164 from MUCL Culture Collection, Belgium, were grown on potato-dextrose agar (PDA) (BioShop, Burlington, ON, Canada).
S. cerevisiae strain BY4741 (Euroscarf: MATa; his3∆ 1; leu2∆ 0; met15∆ 0; ura3∆ 0) was used for DNA and RNA isolation. The yeast strain was grown in YPD medium (1% (w/v) yeast extract, 2% (w/v) bactopeptone and 2% (w/v) glucose).

2.2. Analysis of Fungal Growth

Fungal dry weight was determined by filtering culture samples through G1 sintered glass funnels, washing the biomass with water and drying to a constant weight at 110 °C.

2.3. Expression of the S. cerevisiae RER2 Gene in T. atroviride

T. atroviride P1 was cotransformed with the yeast RER2 gene fused under the A. nidulans gpdA gene promoter (glyceraldehyde-3 phosphate dehydrogenase) and trpC (indole-3-glycerol phosphate synthase) terminator using pAN52-1NotI plasmid (NCBI Acc. No. Z32697), as described previously [18]. The pRMLex_30 plasmid with E. coli hygromycin B phosphotransferase gene (hph) fused between promoter and terminator elements of Trichoderma pki1 (coding for pyruvate kinase) and cbh2 (encoding cellobiohydrolase II) genes was used as a partner in cotransformation [19]. Transformants were selected for hygromycine B resistance on plates containing 1.2 M sorbitol and 200 μg/mL hygromycin B.
The transformants were then cultivated in liquid MM medium for preparation of DNA.
Molecular biology methods

2.4. Nucleic Acids Isolation

Chromosomal DNA was isolated from T. atroviride using the Promega Wizard Genomic DNA Purification kit. Total RNA was isolated using the single-step method described by Chomczynski and Sacchi [20]. Other molecular biology procedures were performed according to standard protocols [21].

2.5. RER2 Copies Integrated into T. atroviride Genome

Quantitative real-time PCR (qRT-PCR) analysis was performed to estimate the copy number of the transgenes in the Trichoderma genome using the relative standard curve method [22,23,24]. Serial 1:10 dilutions of standard samples containing from 300,000 to 300 copies of the RER2 gene were prepared by mixing the wild-type Trichoderma genomic DNA with pGEM-RER2 plasmid. Each reaction contained an adequate amount of DNA calculated using the online tool (DNA Copy Number and Dilution Calculator, Thermo Fisher Scientific, Warsaw, Poland), 0.5 μM of each primer (Table S1) and 7.25 μL 3color 2xHS-qPCR Master Mix Sybr (A&A Biotechnology, Gdynia, Poland) in a total volume of 15 μL. All reactions were run on a LightCycler® 96 (Roche Diagnostics GmbH, Mannheim, Germany) using the following program: 360 s 95 °C, 40 times (15 s 95 °C; 60 s 60 °C), followed by a melting curve generated from 65 °C to 90 °C. Four technical replicates were used for both the standard curve and the test samples. The single product was amplified by all primer pars tested. Raw data were processed using LightCycler® 96 software Version 1.1.0.1320 (Roche Diagnostics GmbH, Mannheim, Germany), and the transgene copy number was calculated automatically.

2.6. Quantitative Reverse Transcription PCR (RT-qPCR)

One-step RT-qPCR assay was performed using a LightCycler® EvoScript RNA SYBR® Green I Master Kit (Roche Diagnostics GmbH, Mannheim, Germany) and was carried out in a 20 µL reaction, which consisted of 5 µL mRNA (25 pg), 0.4 µM each of forward and reverse primers (Table S1) and 4 µL of Master Mix, 5× concentrated containing enzymes for reverse transcription and PCR, RT-qPCR reaction buffer; dATP, dCTP, dGTP and dUTP; Mg(OAc)2; SYBR® Green I dye and proprietary additives. For the negative controls, mRNA was substituted with molecular grade water. The assay was performed using a LightCycler96® (Roche Diagnostics GmbH, Mannheim, Germany) with an initial incubation at 60 °C for 15 min for RT followed by preincubation at 95 °C for 10 min. Forty-five cycles of amplification were performed using a thermal cycling profile of 95 °C for 10 s, 58 °C for 30 s. Subsequently, a melting curve was recorded by holding at 95 °C for 10 s, cooling to 65 °C for 60 s and then heating at 0.1 °C/s up to 97 °C. The amplification and melting curve data were collected and analyzed using the LightCycler96® software 1.0.
Biochemical methods

2.7. Cell Membrane Preparation

Mycelium was harvested by filtration, washed with water and suspended in 50 mM Tris-HCl, pH 7.4, containing 15 mM MgCl2 and 9 mM 2-mercaptoethanol. Cells were homogenized in a beadbeater with glass beads (0.5 mm), and the homogenate was centrifuged at 5000× g for 10 min to remove cell debris and unbroken cells. The supernatant was centrifuged at 100,000× g for 1 h. The membrane pellet was homogenized in 50 mM Tris-HCl, pH 7.4, containing 3.5 mM MgCl2 and 6 mM β-mercaptoethanol and used as the source of enzyme. The whole procedure was performed at 4 °C [18].

2.8. Cis-Prenyltransferase (EC 2.5.1.20) Activity

The enzyme activity was assayed in the membrane fraction by incubation (final volume 250 µL) of 500 µg of membrane proteins with 4 µg FPP, 50 mM sodium phosphate buffer pH 7.4, 0.5 mM MgCl2, 20 mM 2-mercaptoethanol, 10 mM KF and 3 × 10⁵ cpm [14C]IPP (sp. act.: 52 Ci/mol) (ARC, St. Louis, MO, USA). After 90 min incubation at 30 °C, the reaction was terminated by addition of 4 mL of chloroform–methanol (3:2 v/v). The protein pellet was removed by centrifugation, and the supernatant was washed three times with 1/5 volume of 10 mM EDTA in 0.9% NaCl. The organic phase was concentrated under a stream of nitrogen and subjected to thin-layer chromatography on HPTLC RP-18 plates developed in 50 mM H3PO4 in acetone. The zone containing the radiolabeled polyprenols was scraped off, and the radioactivity was measured in a scintillation counter [18,25].

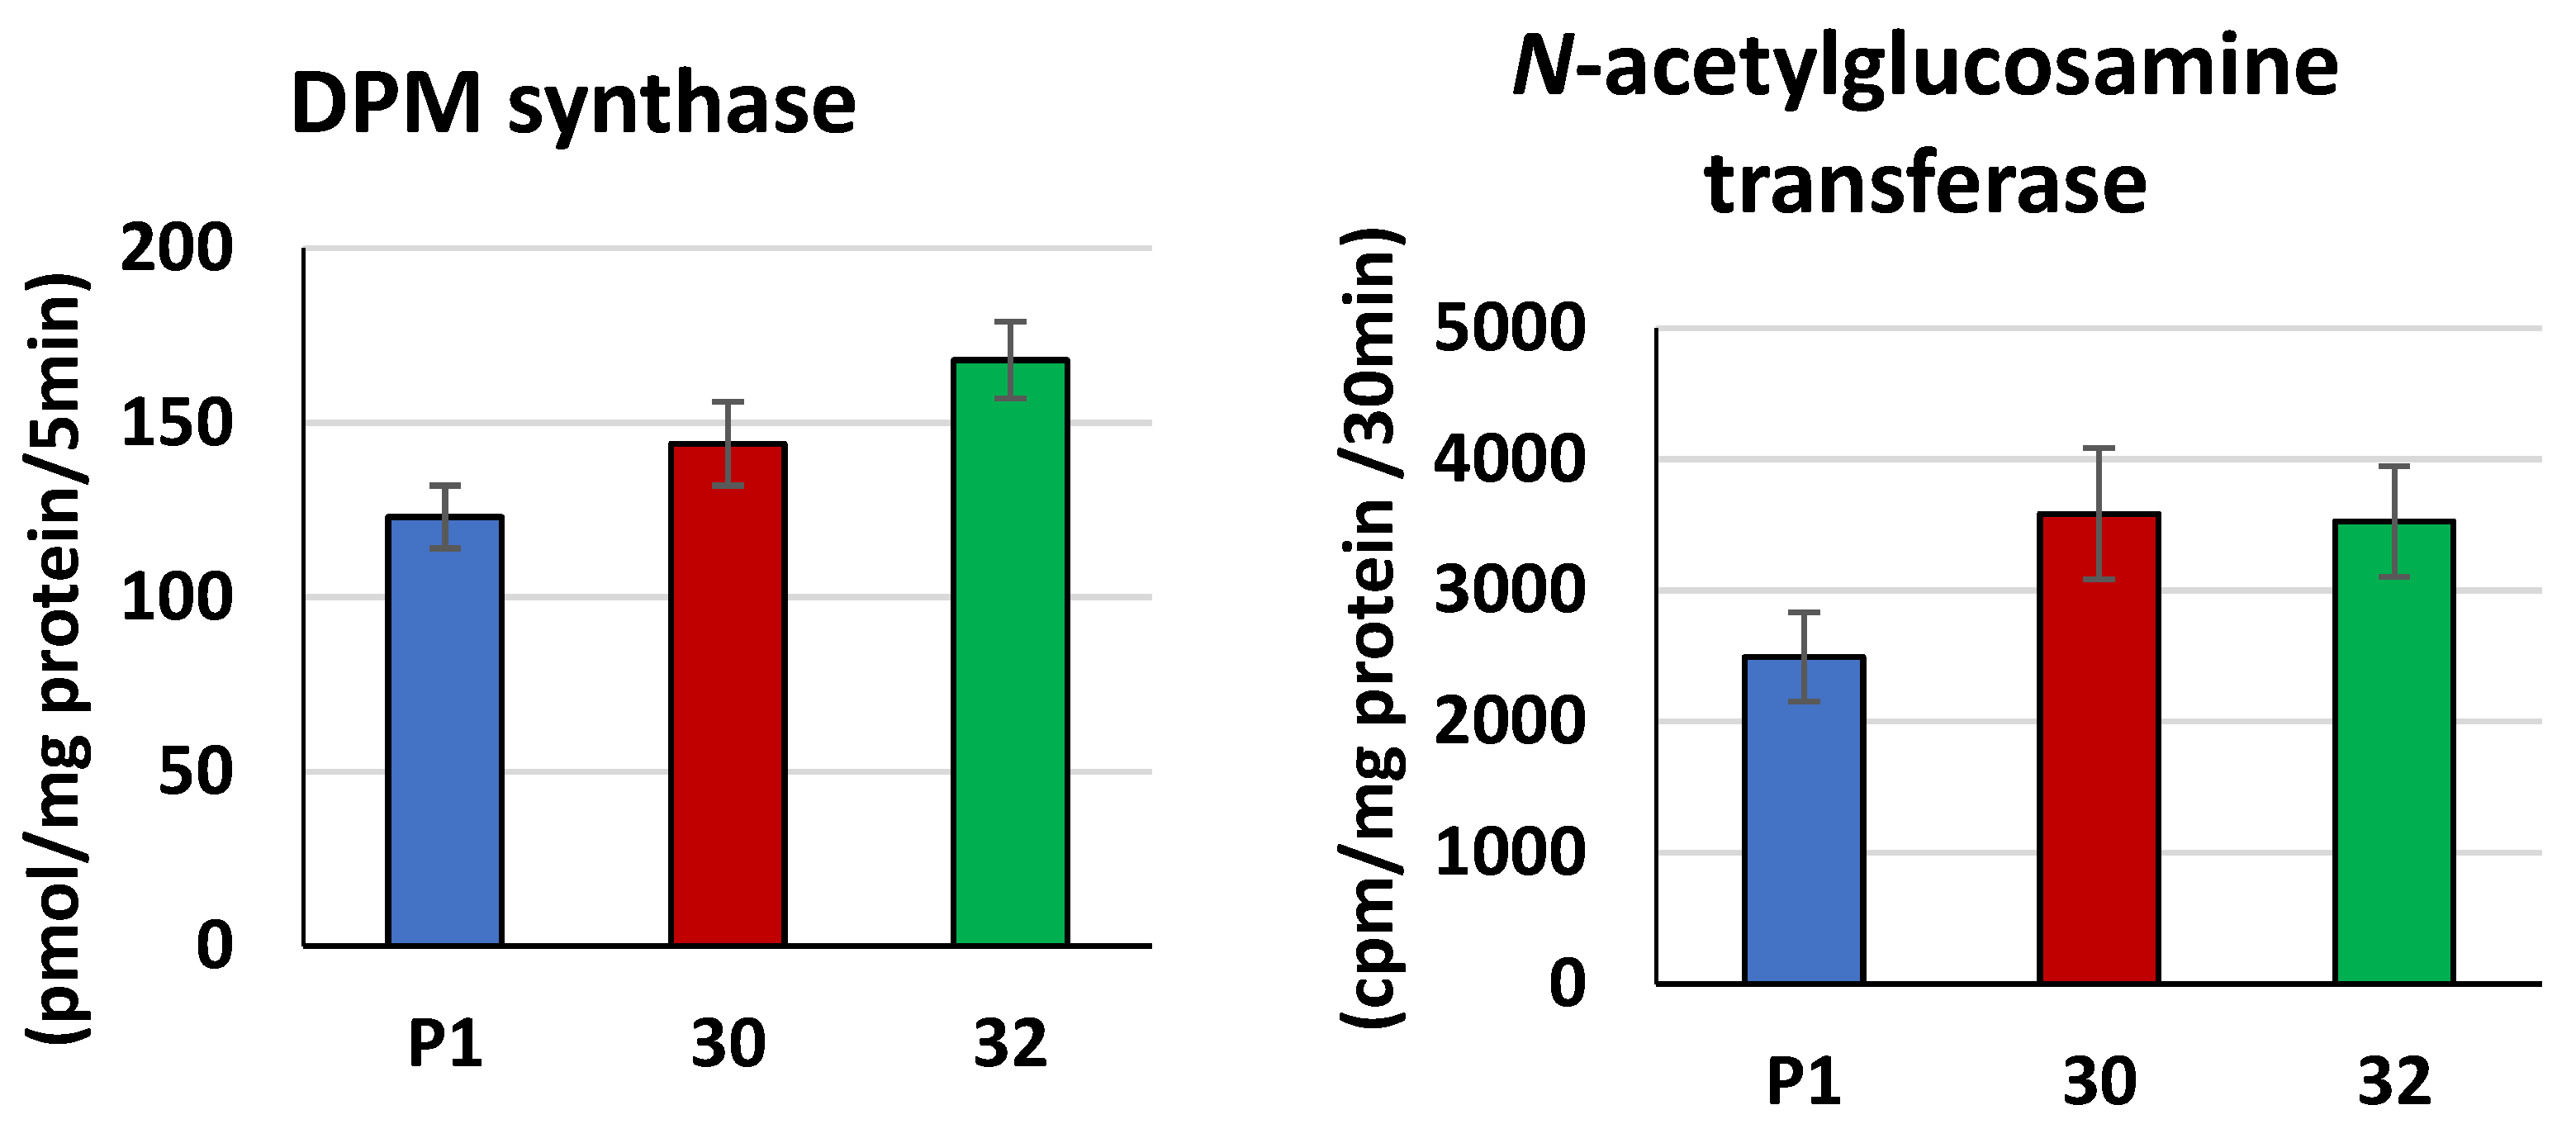
2.9. DPM Synthase (EC 2.4.1.83) Activity

DPM synthase activity was measured in the pelleted membrane fraction by incubating it with GDP [14C]Mannose (sp. act.: 50–60 Ci/mol) (ARC, St. Louis, MO, USA) and 5 ng of dolichyl phosphate (Dol-P) [26] according to Kruszewska et al. [27].

2.10. N-acetylglucosamine Transferase (EC 2.7.8.15) Activity

N-acetylglucosamine transferase activity was measured in the membrane fraction by incubation for 30 min at 30 °C of 200 µg of membrane proteins in a total volume of 50 µL containing 1 × 10⁵ cpm UDP [14C]N-acetylglucosamine (sp. act.: 249 Ci/mol) (ARC, St. Louis, MO, USA) and 5 ng of Dol-P in 40 mM Tris/HCl buffer pH 7.4 with 10 mM MgCl2 and 0.1% Nonidet P-40 [28]. The reaction was stopped by the addition of 4 mL of chloroform–methanol (3:2 v/v). Formation of radioactive dolichyl diphosphate N-acetylglucosamine and dolichyl diphosphate chitobiose was measured in the organic fraction in a scintillation counter.

2.11. FPP Synthase (EC2.5.1.10) Activity

The FPP synthase activity was measured in cell-free extract obtained from transformants and the control T. atroviride P1 strain. After 168 h of cultivation, mycelia of Trichoderma were harvested by filtration, washed with water and suspended in 50 mM phosphate buffer, pH 7.5, containing 1 mM MgCl2 and 5 mM iodoacetamide. Cells were homogenized in a beadbeater with glass beads (0.5 mm), and the homogenate was centrifuged at 5000× g for 10 min to remove cell debris and unbroken cells. The resulting supernatant was centrifuged again at 100,000× g for 1 h to remove the membrane pellet, and the obtained supernatant was used as the source of FPP synthase. The whole procedure was performed at 4 °C.
The FPP synthase activity was measured in 100 µL of reaction mixture containing 50 mM phosphate buffer, pH 7.5, 1 mM MgCl2, 5 mM iodoacetamide, 60 µM isopentenyl diphosphate (IPP), 1 × 10⁵ cpm [14C] IPP (sp. act.: 52 mCi/mM) (ARC, St. Louis, MO, USA), 120 µM dimethylallyldiphosphate (DMAPP) and 150 µg protein [29,30]. After a 5-min incubation at 37 °C, samples were ice-chilled, and 0.5 mL of water was added, followed by 1 mL of hexane and 0.2 mL of 1 M HCl to dephosphorylate the products. The samples were shaken for 30 min at 37 °C. The mixture was ice-chilled and mixed vigorously. The upper phase was washed three times with water and subjected to TLC on silica gel 60 plates in benzene-ethyl acetate, 7:1. Radioactive spots were localized by autoradiography, identified by co-chromatography with unlabeled standards and then scraped off, and the radioactivity was measured in a scintillation counter [29,30].

2.12. Squalene Synthase (EC 2.5.1.21) Activity

Squalene synthase activity was analyzed in the membrane fractions obtained from Trichoderma transformants and the control strain by incubation of 200 µg of membrane fraction with 100 mM potassium phosphate buffer pH 7.4, 5 mM MgCl2, 5 mM CHAPS, 10 mM DTT, 2 mM NADPH and 10 µM [3H]FPP in a total volume of 100 µL. Incubation was performed at 37 °C for 20 min, and then the reaction was stopped with 10 µL of 1 M EDTA pH 9.2, and 10 µL of unlabeled 0.5% squalene was added as a carrier. The reaction mixture was applied onto a Silica Gel 60 (Merck) thin-layer chromatography plate and developed in 5% (v/v) toluene in hexane. The radioactive zone containing squalene (Rf = 0.5) was scraped off and measured in a scintillation counter [31,32].

2.13. Protein Concentration Assay

Protein concentration was estimated according to Lowry et al. [33].

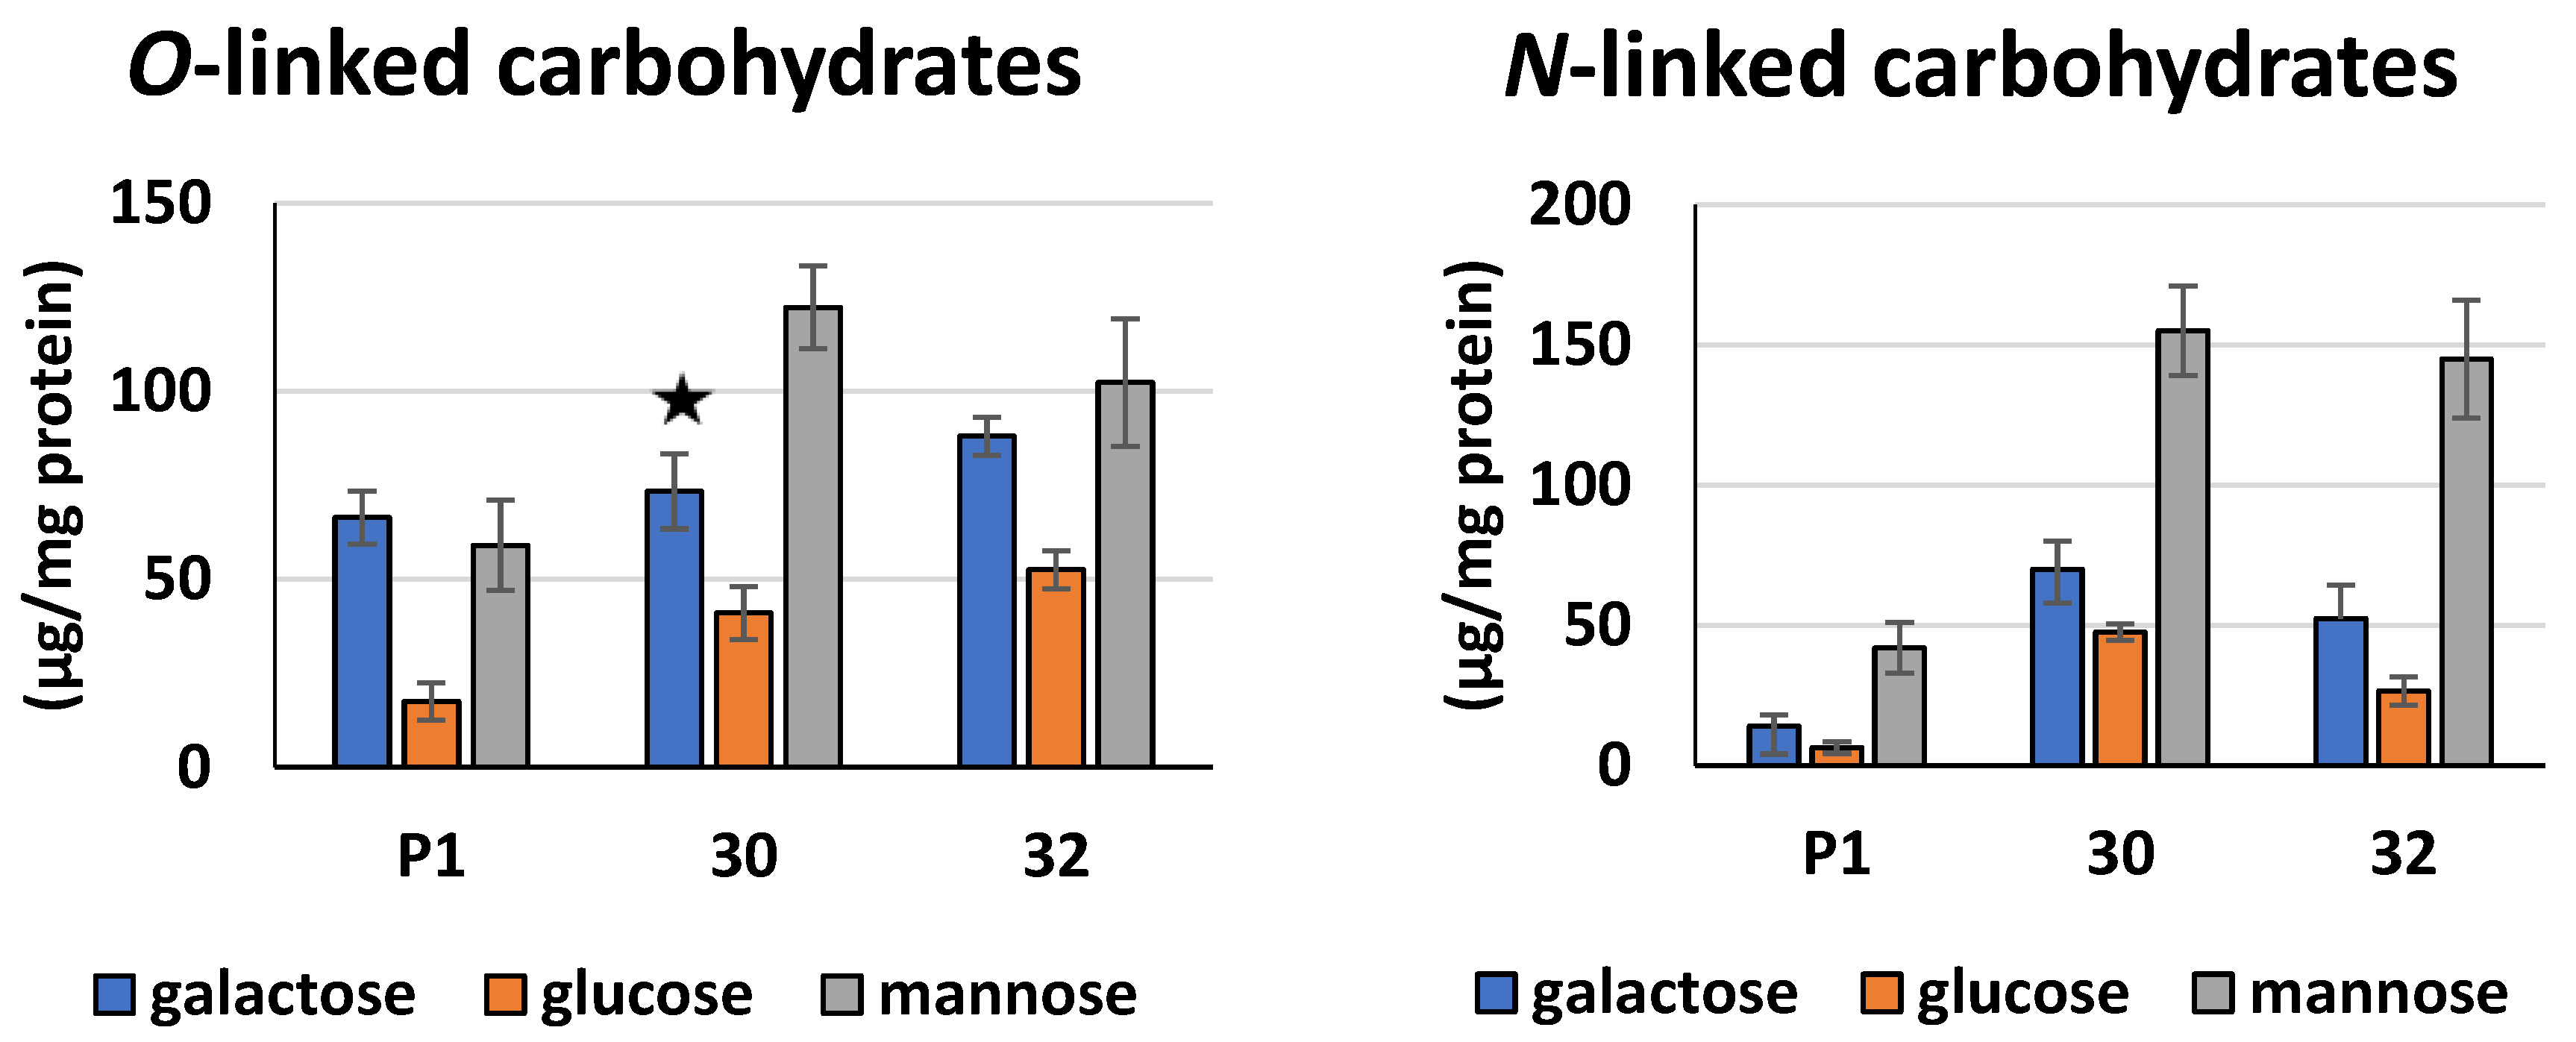
2.14. Identification and Quantification of Saccharides Bound to Secreted Proteins

The saccharides bound to proteins isolated from T. atroviride culture filtrates were assayed by the phenol-sulfuric acid procedure [34]. Secreted proteins were precipitated with two volumes of 96% ethanol, washed twice with 70% ethanol and dissolved in distilled water [35]. O-linked carbohydrates were removed from the protein pellet using mild alkaline hydrolysis according to Duk et al. [36] and analyzed in the supernatant, and then the concentration of N-linked carbohydrates was measured in the pellet. The calibration curve was prepared with D-mannose.
O- and N- linked carbohydrates obtained as above were hydrolyzed with 2 M TFA (trifluoroacetic acid) at 100 °C for 16 h. Monosaccharides were determined by high-performance anion-exchange chromatography using the Dionex ICS-3000 Ion Chromatography System with a Carbo Pac PA10 analytical column. Neutral sugars were eluted with 18 mM NaOH at 0.25 mL/min [37].

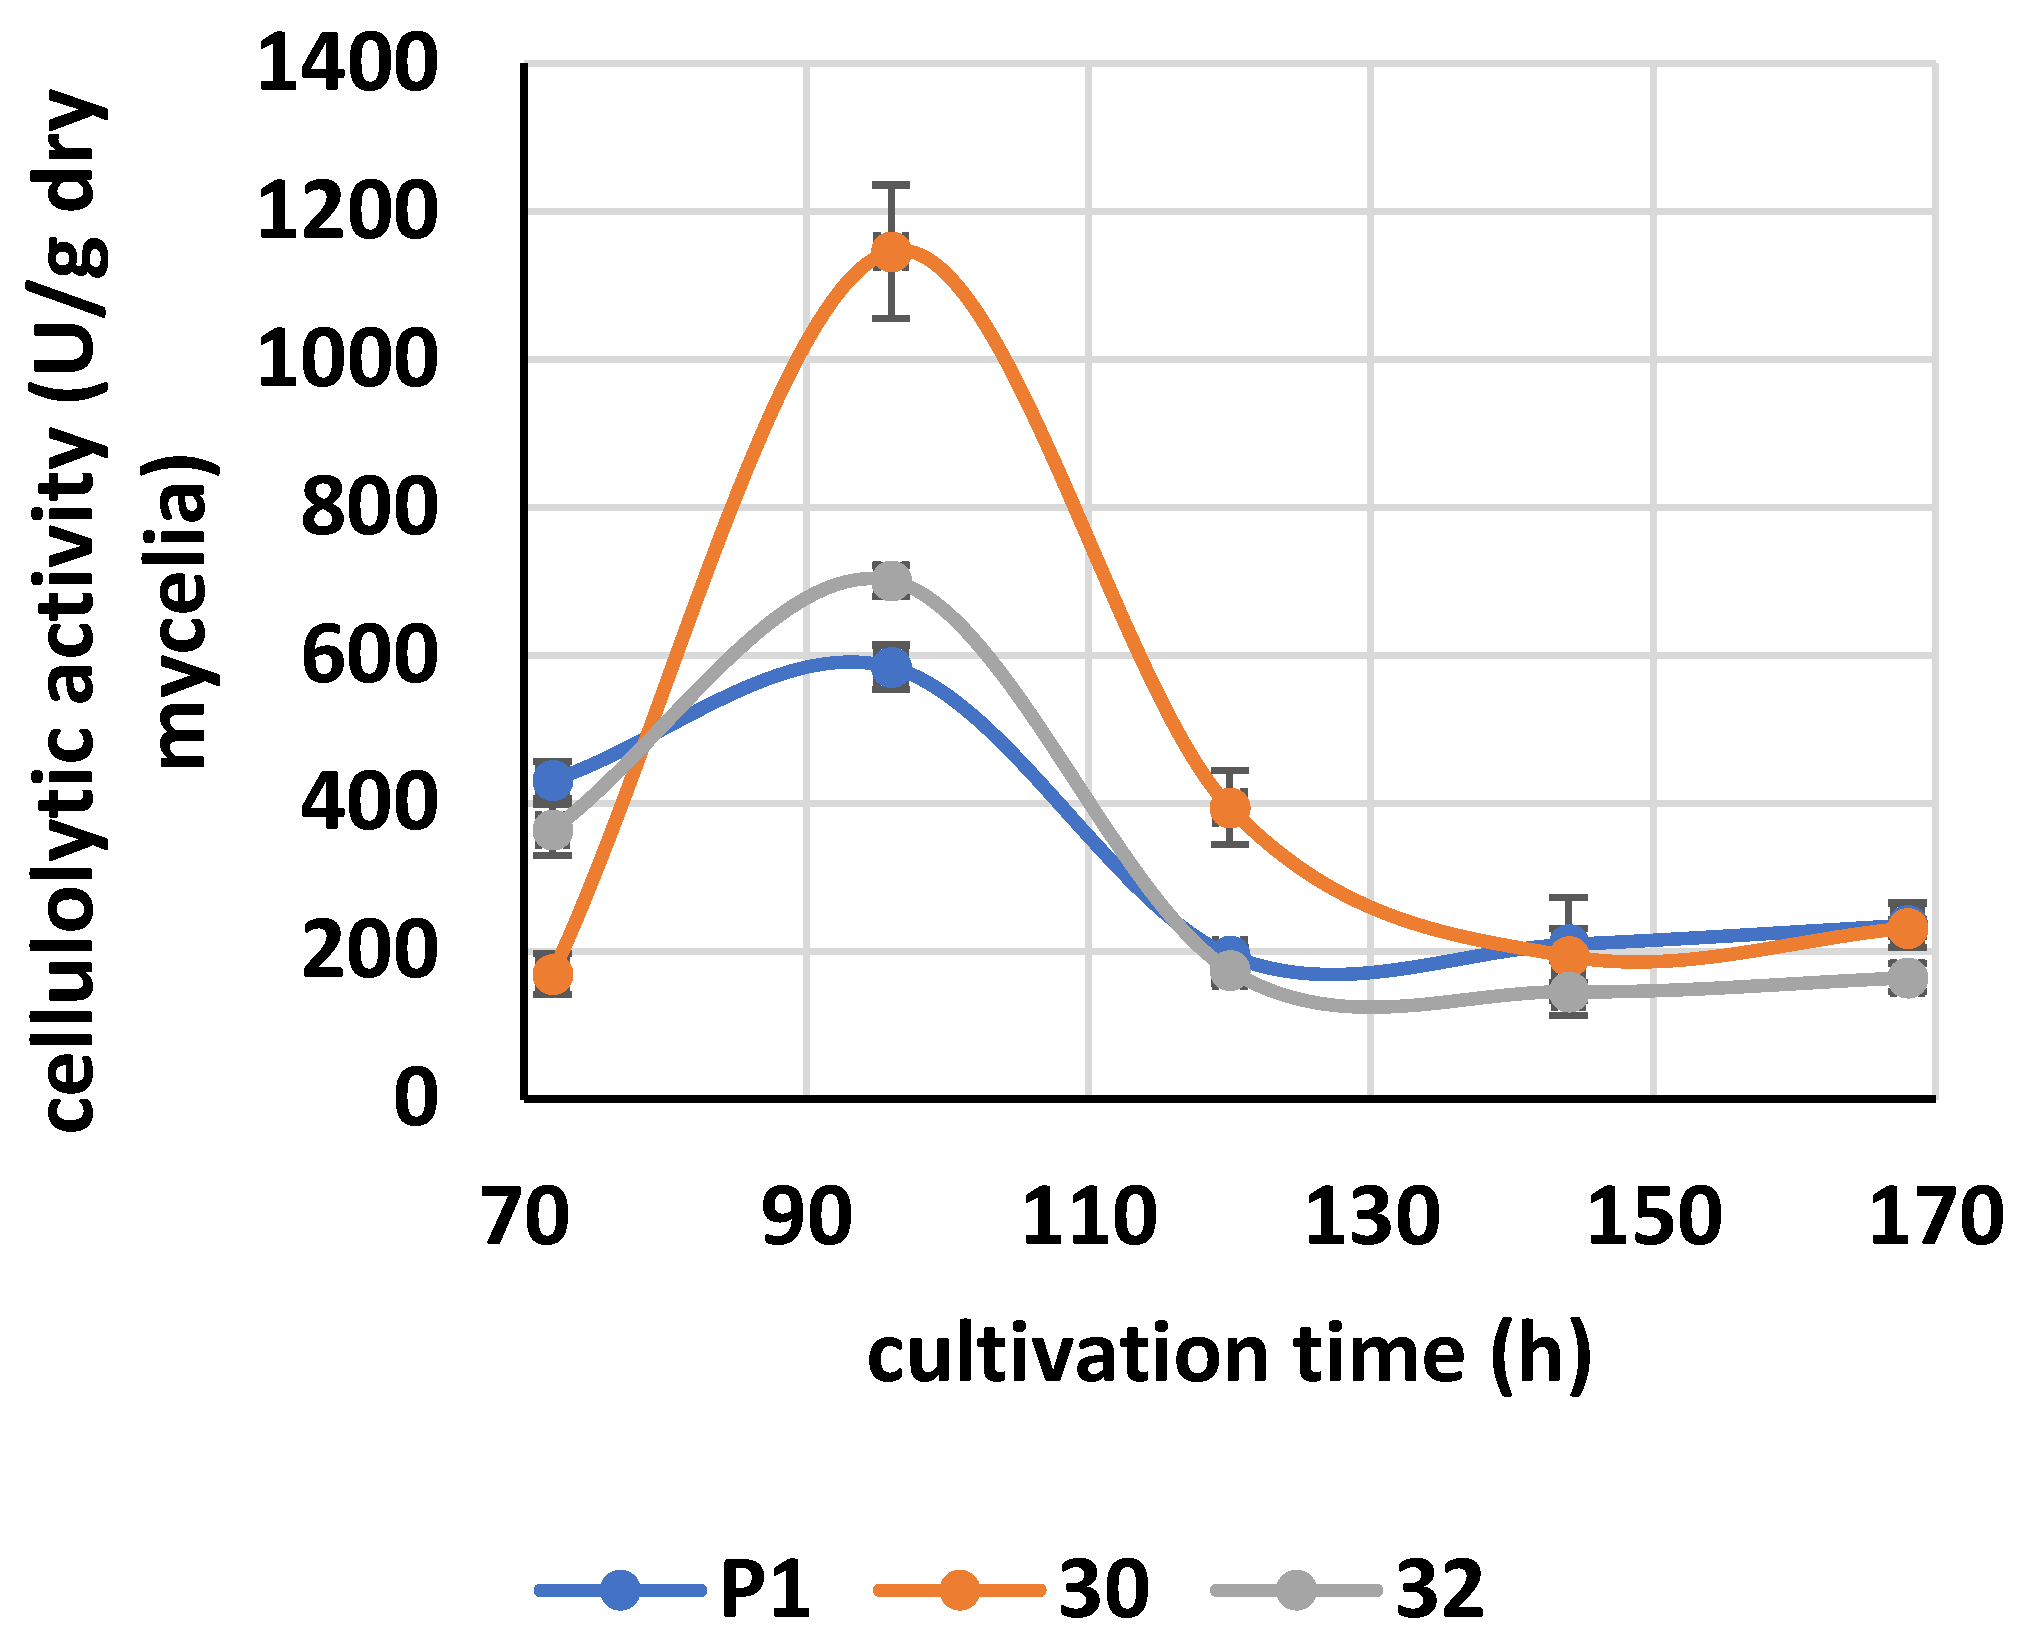
2.15. Cellulase Activity

The activity of cellulases was measured in the cultivation medium by incubation of 0.5 mL of carboxymethylcellulose (10 g/L) in 50 mM sodium citrate buffer (pH 5.0) at 50 °C for 2 h with 0.2 mL of culture filtrate. The reaction was stopped by boiling for 5 min. The amount of reducing sugars formed was determined by the method of Bernfeld [38] and estimated using a standard curve prepared with glucose. One unit of activity was defined as the amount of enzyme that liberated 1 µg of glucose from the substrate per 2 h.

2.16. Extraction and Purification of Polyisoprenoids

Trichoderma biomass was harvested by filtration, suspended in 60% KOH with 0.25% pyrogallol and hydrolyzed at 100 °C for 1 h. Lipophylic products were extracted with di-ethyl ether and evaporated to dryness, and then dissolved in hexane and applied onto a silica gel column equilibrated with hexane. The column was washed with 3% diethyl ether in hexane, and the polyisoprenoid fraction was eluted with 10% and 20% diethyl ether in hexane; the two eluates were pooled, evaporated to dryness, dissolved in isopropanol and subjected to HPLC/UV analysis as described earlier [39], with modifications. Briefly, a linear gradient of methanol: water (9:1, v/v) in methanol:isopropanol:hexane (2:1:1, v/v/v) was used for elution. Fractions containing polyisoprenoids (polyprenols and dolichols) were collected (based on comparison of their retention times with those of yeast dolichols used as external standards) and analyzed. For quantitative analysis, Dol13 was added to the biomass as an internal standard before hydrolysis. The polyprenol and dolichol standards were from the Collection of Polyprenols (IBB PAS).

2.17. Squalene Determination

Sterols were extracted according to the method proposed by Bernat et al. [40] with some modifications. First, 30 mg of lyophilized biomass was transferred into Eppendorf tubes containing glass beads, 0.66 mL of methanol and 0.33 mL of chloroform. The homogenization process using a ball mill (FastPrep-24, MP-Biomedicals) was carried out for 2 min. Next, the sample was centrifuged (2 min, 6000× g). The mixture was transferred to another Eppendorf tube. In order to facilitate the separation of two layers, 0.2 mL of H2O was added. The lower layer was collected and evaporated. Then, samples were diluted in 1 mL of methanol:chloroform (4:1, v/v). Sterols were measured using an Agilent 1200 HPLC system (Santa Clara, CA, USA) and a 3200 Q-TRAP mass spectrometer (Sciex, Framingham, MA, USA) equipped with the atmospheric pressure chemical ionization (APCI) source operating in the positive ionization mode. Then, 10 μL of the lipid extract was injected onto a Kinetex C18 column (50 mm × 2.1 mm, particle size: 5 μm; Phenomenex, Torrance, CA, USA) heated to 40 °C with a flow rate of 0.8 mL min−1. Water (A) and methanol (B) were applied as a mobile phase, both consisting of 5 mM ammonium formate. The solvent gradient was initiated at 40% B, increased to 100% B during 1 min and maintained at 100% B for 3 min before returning to the initial solvent composition over 2 min. The following instrumental settings were applied: curtain gas 25.0, ion spray voltage to 5500 nebulizer gas 50, auxiliary gas 50 and ion source temperature of 550 °C, entrance potential to 10.0. The monitored multiple reaction monitoring (MRM) pairs were 411.4–231.4, 411.4–163.3 for squalene. The data analysis was performed with the Analyst™ v1.5.2 software (Sciex, Framingham, MA, USA).

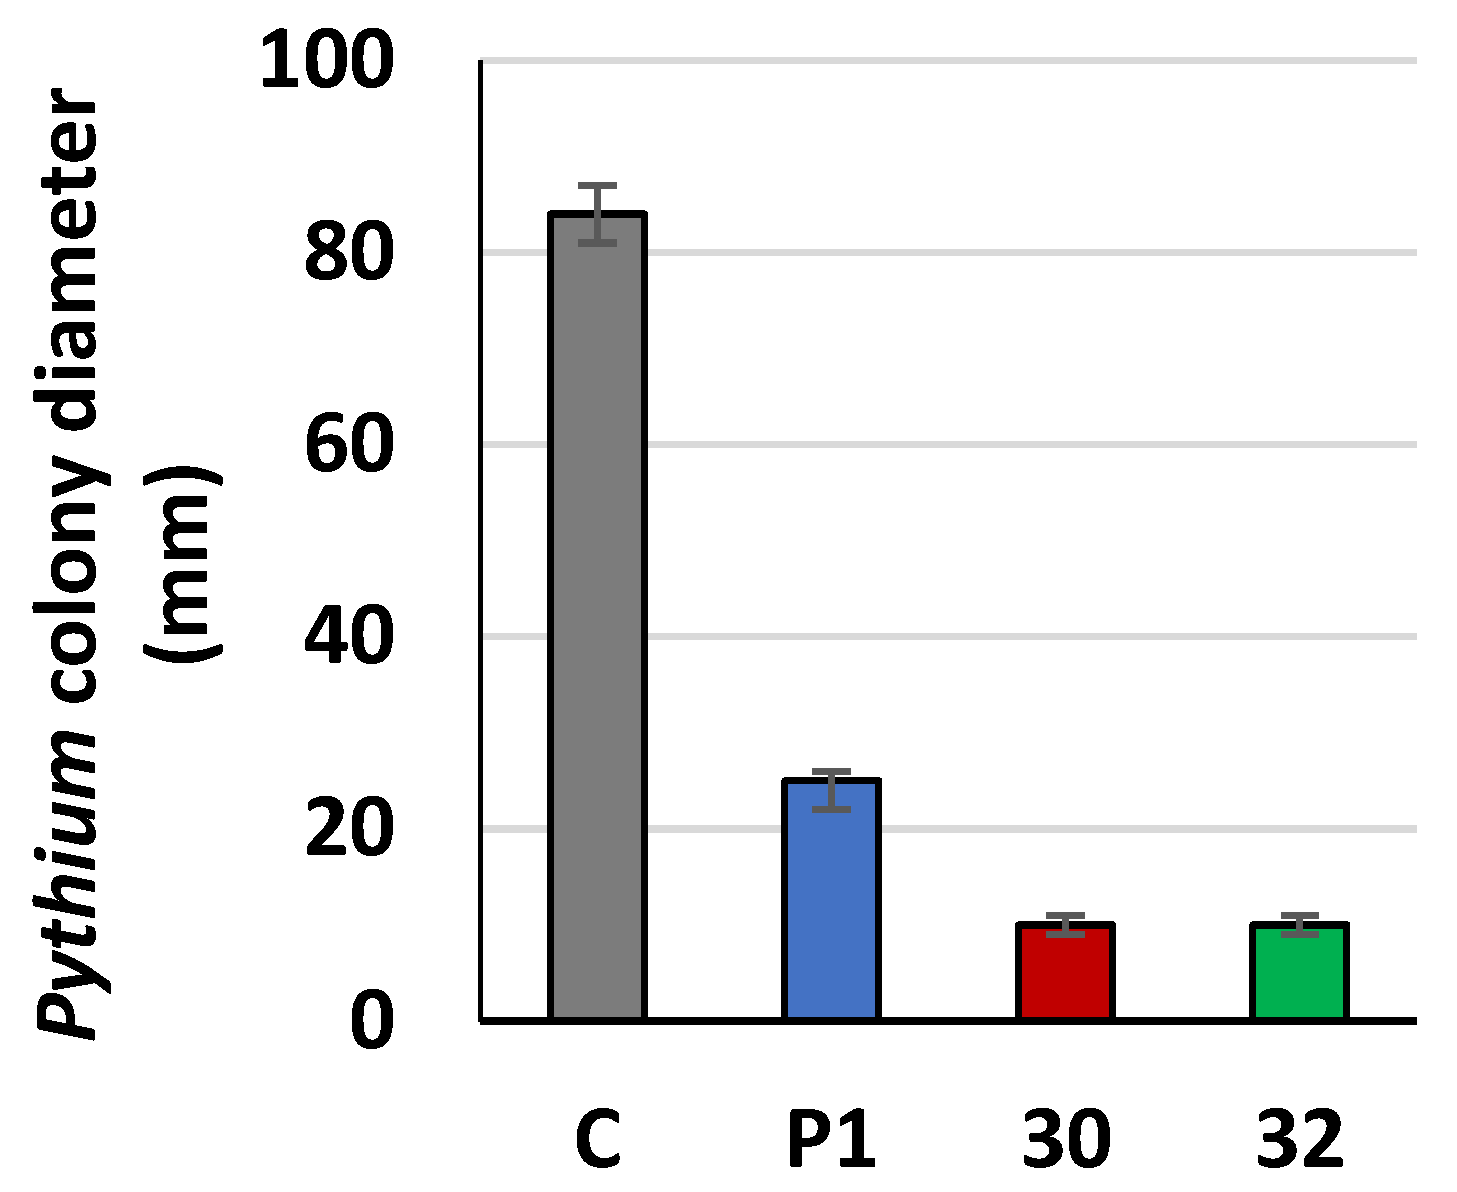
2.18. Plate Confrontation Assay

Mycelial disks (5 mm) of T. atroviride RER2 transformants and P. ultimum were placed at opposite sides (7 cm apart) of agar plates with MM supplemented with 1% glucose. The plates were incubated at 28 °C, and photographs were taken after 3 days of incubation. Three replicates were prepared for each experiment and for each transformant.

2.19. Growth Inhibition of Fungal Pathogen by Agents Secreted by Trichoderma to Cultivation Medium

To determine its antagonistic activity, Trichoderma was grown on solid minimal medium with lactose covered with cellophane. Following the removal of the cellophane with Trichoderma, the effect of postculture medium containing secreted hydrolytic enzymes and metabolites on growth of P. ultimum was analyzed. A 5 mm mycelial disk of P. ultimum was placed in the center of the Trichoderma-pretreated plate. Plates were incubated at 28 °C for eight days, and the area of growth was measured. As a control, P. ultimum was cultivated on non-pretreated plates.

2.20. Statistical Analysis

For statistical analysis, we used the Student’s t test to compare the mean and standard deviation obtained for the mutants and the control strain. Standard significance level p-value of 0.05 was used.

3. Results

3.1. Expression of S. cerevisiae RER2 Gene in T. atroviride

The biocontrol T. atroviride strain P1 was transformed with the RER2 gene from S. cerevisiae, and stable transformants were isolated, as detailed in Section 2 The presence of the yeast gene in the genome of the transformants was analyzed by PCR using RER2U (5′ CGGGATTCATGGAAACGGATAGTG GTATA 3′) and RER2L (5′ CGGATATCTTAATTCAACTTTTTTTCTTTC AAATC 3′) primers [18] and genomic DNA isolated from the transformants (Figure S1). As a positive and negative control, the PCR reactions were performed on the templates of DNA from S. cerevisiae and untransformed T. atroviride, respectively. Two transformants, RER30/11 and RER32/11, were obtained and subjected to further analysis. A copy number of RER2 gene integrated into the Trichoderma genome was estimated by quantitative real-time PCR (qRT-PCR) analysis using the relative standard curve method [22,23,24]. It was established that transformants differ in the number of copies of the RER2 gene integrated into their genome. Two copies were found in the RER30/11 strain, while only one copy was found in the RER32/11 transformant.
To quantify RER2 expression in the transformed strains, mRNA was isolated, and reverse transcription qPCR analysis was performed. A significant expression of the RER2 gene was observed in both transformants (Figure 2). The expression was tightly dependent on the number of RER2 copies.
Furthermore, expression of the native rer2 gene from Trichoderma was increased in the transformants compared to the control strain P1.
Thus, the PCR analyses showed that the RER2 gene was integrated into the genome of the T. atroviride transformants and expressed in both transformants. Moreover, expression of the native rer2 gene was slightly elevated, and expression of nus1, encoding subunit of the cis-prenyltransferase complex, was decreased in these strains compared to the control.

3.2. Biochemical Characterization of T. atroviride RER2 Transformants

To reach higher activity of cis-prenyltransferase, RER2 gene from S. cerevisiae was used for expression in T. atroviride since activity of cis-prenyltransferase from yeast is several times higher compared to the homolog from Trichoderma [18,25,41].
Expression of the RER2 gene increased the activity of cis-prenyltransferase in the membrane fraction obtained from the RER2 transformants compared to the control strain P1. The higher increase, by 93%, was observed for the RER30/11 strain, while RER32/11 revealed a 30% increase (Figure 3). The higher activity of cis-prenyltransferase in the RER30/11 transformant is consistent with the higher expression of the RER2 gene in this strain (Figure 2).
Cis-prenyltransferase uses farnesyl diphosphate (FPP) synthesized by FPP synthase as a substrate. The increased activity of cis-prenyltransferase in the transformants consumes more substrate, and this in turn could stimulate FPP synthase for more intensive production. Analysis of the FPP synthase activity confirmed this assumption: it was increased by 23 (RER32/11) and 29% (RER30/11) in the transformants compared to the control strain (Figure 3). FPP is also consumed by squalene synthase. Our study revealed that activity of squalene synthase was increased by 74 and 29% for RER30/11 and RER32/11, respectively, compared to the control strain (Figure 3).
The higher activities of cis-prenyltransferase and squalene synthase are reflected in a higher content of dolichols and squalene in the mycelia of the RER2 transformants (Figure 4). Concentration of dolichols was 30% and 21% elevated in the RER30/11 and RER32/11 transformants, respectively, compared to the control strain. Concentration of squalene was also increased. A higher increase, by 52%, was observed for the RER30/11 strain, while RER32/11 revealed only a 5% increase, and the latter difference was not statistically significant. Increase in concentration of the both products, dolichols and squalene, is consistent with higher activity of the corresponding enzymes, cis-prenyltransferase and squalene synthase, respectively (Figure 3 and Figure 4).
Since cis-prenyltransferase produces dolichols and phosphorylated dolichols (Dol-P) serve as acceptors of carbohydrate residues for glycosylation, we examined the activity of dolichyl phosphate mannose (DPM) synthase producing the active form of mannose, DPM, for O- and N-glycosylation of proteins. Both transformants revealed higher activity of DPM synthase compared to the control (Figure 5). A higher increase, by 37%, was found in the membrane fraction of RER32/11, while in RER30/11, the activity was elevated only by 17%. We also analyzed the activity of N-acetylglucosamine transferase, the first enzyme in the synthesis of Dol-PP-oligosaccharide, used for N-glycosylation. Its activity was elevated by ca. 40% in both transformants compared to the control (Figure 5).
A higher production of DPM and DolPP-N-acetylglucosamine seemed likely to enhance the glycosylation of secretory proteins. In turn, it is hypothesized that the enhanced glycosylation of cellulases could influence their enzymatic activity.
To analyze the glycosylation of secretory proteins, Trichoderma was cultivated in minimal medium with lactose as a carbon source. Proteins were precipitated from culture medium after 72 or 96 h of cultivation, and the amount of O- and N-linked carbohydrates was determined.
A nearly 70% increase in the content of O-linked carbohydrates was found for both transformants compared to the control, while the amount of N-linked sugars was elevated more than fourfold (Figure 6). A qualitative analysis of the O- and N-linked polysaccharides by high-performance anion-exchange chromatography showed that mannose was the dominant sugar in both types of polycarbohydrates. A higher amount of glucose and mannose in the N-linked polycarbohydrates was found for RER30/11 strain, and it was, respectively, 7.4-fold and 3.7-fold that of the control. The O-linked carbohydrates of both transformed strains contained nearly the same amount of galactose as the control, while the amount of mannose was 1.75-fold and 2.1-fold higher for the RER32/11 and RER30/11 transformants, respectively (Figure 6).

3.3. Cellulolytic Activity of RER2-Expressing T. atroviride

The aim of this study was to elevate the secreted hydrolytic activity of T. atroviride.
Activity of cellulases was measured in the medium during cultivation.
Higher activity was found in the cultivation medium of RER30/11 (Figure 7). It was two-fold higher compared to the control strain. The activity registered in the medium of RER32/11 was much lower, but still it was 1.2-fold higher than that in the control.
The activity of cellulases reached the maximum after 96 h of cultivation.
The higher enzymatic activity of cellulases, secreted by the transformants was taken as an indicator for a pronounced inhibition of the growth of pathogenic Oomycete, particularly of Pythium ultimum containing a high proportion of cellulose in its cell wall. To prove this hypothesis, Trichoderma was cultivated on agar plates covered with cellophane, which was permeable to low-molecular-weight metabolites and hydrolases. After removing the cellophane together with the mycelia, the plant pathogen P. ultimum was cultivated on the pretreated plates. The growth of P. ultimum was inhibited by 70% on plates previously overgrown by the control strain, while on the plates pretreated by the transformants, the inhibition reached 89% (Figure 8).
In addition, we made a confrontation assay between the new Trichoderma strains and P. ultimum (Figure 9). Trichoderma and Pythium were cultivated on a single plate from separate inocula. We observed that Pythium was overgrown more rapidly by both transformants than by the control P1 strain and that the RER30/11 transformant was the most efficient.

4. Discussion

The aim of this study was to construct novel strains of T. atroviride with elevated hydrolytic capabilities. It is well known that during a direct attack, Trichoderma degrades the cell wall of a fungal pathogen with a variety of secreted extracellular enzymes [42]. Based on this knowledge, we decided to increase the hydrolytic activity of the new strains. Our previous studies have shown an interdependence between the level of glycosylation of secretory proteins and their hydrolytic activity. Furthermore, we observed that improved processing of secretory proteins in the endoplasmic reticulum elevated their secretion [12,13,31]. We improved glycosylation by increasing synthesis of dolichols by cis-prenyltransferase.
The basal activity of cis-prenyltransferase in T. atroviride was much lower than that in S. cerevisiae [18,25,41]. Therefore, the use of RER2 gene from S. cerevisiae for expression in Trichoderma was very promising for achieving high activity of cis-prenyltransferase in the transformed strains. In addition, Rer2 protein from yeast had to form a functional complex with Nus1p from Trichoderma, giving increased activity of cis-prenyltransferase in the RER2 transformants of T. reesei [18]. It was shown that Nus1protein together with Rer2p were required for cis-prenyltransferase activity [43].
The glycosylation of secretory proteins has been postulated to protect them against proteolysis, and, moreover, it has been shown to directly affect the conformation and stability of the secreted enzymes [4,6,9,10,11]. In addition, it has been reported that O-glycosylation is necessary for secretion of hydrolases by Trichoderma [44]. CBHI (cellobiohydrolase I), the main protein secreted by Trichoderma, consists of a catalytic domain and a cellulose binding module joined by a highly O-glycosylated linker peptide. The catalytic domain has four N-linked motifs, three of which are glycosylated. The type and extent of glycan on the catalytic domain are influenced by both the strain and culture condition [45]. In addition, the amount of carbohydrates bound to secretory proteins varies during cultivation [18].
In the present report, the highest glycosylation of secretory proteins appeared after 96 h of cultivation of the RER2-transformed strains and correlated with their highest hydrolytic activity.
The hydrolases secreted by Trichoderma to the medium strongly inhibited the growth of P. ultimum, an Oomycetes whose cell wall contains mainly 1,3-β glucans, 1,6-β-glucans and 1,4-β-glucans (cellulose). Chitin, the major constituent of the “typical” fungal cell wall, has been detected in small amounts in few Oomycetes [46]. Since the cellulolytic activity secreted by the Trichoderma transformants was significantly elevated compared to the nontransformed strain, it resulted in substantially higher antimicrobial activity of these strains against P. ultimum.
In summary, these results show that posttranslational modification of secretory proteins is a promising target for improving the effectiveness of the direct attack of Trichoderma on fungal pathogens. This study and our previous results confirm that simple genetic manipulations to enhance the activity of glycosylation-related enzymes, such as DPM synthase, guanylyltransferase, farnesyl pyrophosphate synthase and cis-prenyltransferase, produce pleiotropic effects that ultimately result in a higher activity and/or secretion of hydrolytic enzymes [12,13,14,31,47]. These results are in contrast to more direct attempts to enhance the hydrolytic activity of Trichoderma by overexpression of genes coding for a single lytic enzyme [48,49]. The biocontrol effects of such manipulations were rarely significant, probably because polymers such as cellulose, glucan and chitin require several hydrolytic enzymes for degradation. By improving protein glycosylation, we obtained a more general effect not limited to a single enzyme.

Supplementary Materials

The following supporting information can be downloaded at: https://www.mdpi.com/article/10.3390/jof9010038/s1. Table S1: Primers used in this studies; Figure S1: The presence of the yeast RER2 gene in the genome of the transformants analyzed by PCR.

Author Contributions

Conceptualization: J.S.K.; Methodology: J.S.K., J.L., E.S. and P.B.; Investigation: U.P.-L., S.G., S.P., J.L., A.L. and P.B.; Writing—Original Draft Preparation: J.S.K.; Writing—Review and Editing: J.S.K.; Supervision: J.S.K.; Project Administration: J.S.K. All authors have read and agreed to the published version of the manuscript.

Funding

This work was supported by the EC Operational Programme “Innovative Economy”, grant UDA-POIG.01.03.01-14-038/09 to J.S.K.

Institutional Review Board Statement

Not applicable.

Informed Consent Statement

Not applicable.

Data Availability Statement

Not applicable.

Conflicts of Interest

The authors declare no conflict of interest.

References

  1. Benitez, T.; Rincon, A.M.; Limon, M.C.; Codon, A.C. Biocontrol mechanisms of Trichoderma strains. Internat. Microbiol. 2004, 7, 249–260. [Google Scholar]
  2. Atanasova, L.; Le Crom, S.; Gruber, S.; Coulpier, F.; Seidl-Seiboth, V.; Kubicek, C.P.; Druzhinina, I.S. Comparative transcriptomics reveals different strategies of Trichoderma mycoparasitism. BMC Genom. 2013, 14, 121. [Google Scholar] [CrossRef] [PubMed] [Green Version]
  3. Palamarczyk, G.; Maras, M.; Contreras, R.; Kruszewska, J. Protein secretion and glycosylation in Trichoderma. In Trichoderma and Glocladium; Kubicek, C.P., Harman, G.E., Eds.; Taylor and Francis Ltd.: London, UK, 1998; Volume 1, pp. 121–138. [Google Scholar]
  4. Hui, J.P.; White, T.C.; Thibault, P. Identification of glycan structure and glycosylation sites in cellobiohydrolase II and endoglucanases I and II from Trichoderma reesei. Glycobiology 2002, 12, 837–849. [Google Scholar] [CrossRef] [PubMed] [Green Version]
  5. Parodi, A.J. Protein glucosylation and its role in protein folding. Annu. Rev. Biochem. 2000, 69, 69–93. [Google Scholar] [CrossRef] [PubMed]
  6. Williamson, G.; Belshaw, N.J.; Williamson, M.P. O-glycosylation in Aspergillus glucoamylase. Conformation and role in binding. Biochem. J. 1992, 282, 423–428. [Google Scholar] [CrossRef] [Green Version]
  7. Guillemette, T.; van Peij, N.N.M.E.; Goosen, T.; Lanthaler, K.; Robson, G.D.; van den Hondel, C.A.M.J.J.; Stam, H.; Archer, D.B. Genomic analysis of the secretion stress response in the enzyme-producing cell factory Aspergillus niger. BMC Genom. 2007, 8, 158. [Google Scholar] [CrossRef] [Green Version]
  8. Pakula, T.M.; Laxell, M.; Huuskonen, A.; Usitalo, J.; Saloheimo, M.; Penttila, M. The effects of drugs inhibiting protein secretion in the filamentous fungus Trichoderma reesei. Evidence for down-regulation of genes that encode secreted proteins in the stressed cells. J. Biol. Chem. 2003, 278, 45011–45020. [Google Scholar] [CrossRef] [Green Version]
  9. Eneyskaya, E.V.; Kulminskaya, A.A.; Savelev, A.N.; Shabalin, K.A.; Golubev, A.M.; Neustroev, K.N. α-Mannosidase from Trichoderma reesei participates in the post-secretory deglycosylation of glycoproteins. Biochem. Biophys. Res. Comm. 1998, 245, 43–49. [Google Scholar] [CrossRef]
  10. Harrison, M.J.; Wathugala, I.M.; Tenkanen, M.; Packer, N.H.; Nevalainen, K.M.H. Glycosylation of acetylxylan esterase from Trichoderma reesei. Glycobiology 2002, 12, 291–298. [Google Scholar] [CrossRef] [Green Version]
  11. Xu, C.; Ng, D.T.W. Glycosylation-directed quality control of protein folding. Nat. Rev. Mol. Cell Biol. 2015, 16, 742–752. [Google Scholar] [CrossRef]
  12. Kruszewska, J.; Butterweck, A.H.; Kurzątkowski, W.; Migdalski, A.; Kubicek, C.P.; Palamarczyk, G. Overexpression of the Saccharomyces cerevisiae mannosylphosphodolichol synthase—Encoding gene in Trichoderma reesei results in an increased level of protein secretion and abnormal cell ultrastructure. Appl. Environm. Microbiol. 1999, 65, 2382–2387. [Google Scholar] [CrossRef] [PubMed]
  13. Perlińska-Lenart, U.; Orłowski, J.; Laudy, A.E.; Zdebska, E.; Palamarczyk, G.; Kruszewska, J.S. Glycoprotein hypersecretion alters the cell wall in Trichoderma reesei strains expressing the Saccharomyces cerevisiae dolichylphosphate mannose synthase gene. Appl. Environm. Microbiol. 2006, 72, 7778–7784. [Google Scholar] [CrossRef] [PubMed] [Green Version]
  14. Zakrzewska, A.; Palamarczyk, G.; Krotkiewski, H.; Zdebska, E.; Saloheimo, M.; Penttilä, M.; Kruszewska, J.S. Overexpression of the gene encoding GTP-mannose-1-phosphate guanyltransferase, mpg1, increases cellular GDP-mannose levels and protein mannosylation in Trichoderma reesei. Appl. Environm. Microbiol. 2003, 69, 4383–4389. [Google Scholar] [CrossRef] [Green Version]
  15. Daleo, G.R.; Hopp, H.E.; Romero, P.A.; Lezica, R. Biosynthesis of dolichol phosphate by subcellular fractions from liver. FEBS Lett. 1977, 81, 411–414. [Google Scholar] [CrossRef] [PubMed] [Green Version]
  16. Adair, W.L.J.; Cafmeyer, N. Characterization of the Saccharomyces cerevisiae cis-prenyltransferase required for dolichyl phosphate biosynthesis. Arch. Biochem. Biophys. 1987, 259, 589–596. [Google Scholar] [CrossRef]
  17. Yanish-Perron, C.; Vieira, J.; Messing, J. Improved M13 phage cloning vectors and host strains: Nucleotide sequences of the M13mp18 and pUC 19 vectors. Gene 1985, 33, 103–119. [Google Scholar] [CrossRef] [PubMed]
  18. Perlińska-Lenart, U.; Bańkowska, R.; Palamarczyk, G.; Kruszewska, J.S. Overexpression of the Saccharomyces cerevisiae RER2 gene in Trichoderma reesei affects dolichol dependent enzymes and protein glycosylation. Fungal Genet. Biol. 2006, 43, 422–429. [Google Scholar] [CrossRef]
  19. Mach, R.L.; Schindler, M.; Kubicek, C.P. Transformation of Trichoderma reesei based on hygromycin B resistance using homologous expression signals. Curr. Genet. 1994, 25, 567–570. [Google Scholar] [CrossRef]
  20. Chomczynski, P.; Sacchi, N. Single-step method of RNA isolation by acid guanidinum thiocyanate-phenol-chloroform extraction. Anal. Biochem. 1987, 162, 156–159. [Google Scholar] [CrossRef]
  21. Sambrook, J.; Fritsch, E.F.; Maniatis, T. Molecular Cloning: A Laboratory Manual, 2nd ed.; Cold Spring Harbor Laboratory: Cold Spring Harbor, NY, USA, 1989; Volume 1, pp. 7.37–7.52. [Google Scholar]
  22. Joshi, M.; Pittman, K.H.; Haisch, C.; Verbanac, K. Real-time PCR to determine transgene copy number and to quantitate the biolocalization of adoptively transferred cells from EGFP-transgenic mice. Biotechniques 2008, 45, 247–258. [Google Scholar] [CrossRef] [Green Version]
  23. Ma, L.; Chung, W.K. Quantitative analysis of copy number variants based on Real-Time LightCycler PCR. Curr. Protoc. Hum. Genet. 2015, 80, 7.21.1–7.21.8. [Google Scholar] [CrossRef] [PubMed]
  24. Salas-Marina, M.; Isordia-Jasso, M.I.; Islas-Osuna, M.A.; Delgado-Sanchez, P.; Jimenez-Bremont, J.F.; Rodroguez-Kessler, M.; Rosales-Saavedra, M.T.; Herrera-Estrella, A.; Casas-Flores, S. The Epl1 and Sm1 proteins from Trichoderma atroviride and Trichoderma virens differentially modulate systemic disease resistance against different life style pathogens in Solanum lycopersicum. Front. Plant Sci. 2015, 6, 77. [Google Scholar] [CrossRef] [PubMed] [Green Version]
  25. Grabińska, K.; Sosińska, G.; Orłowski, J.; Świeżewska, E.; Berges, T.; Karst, F.; Palamarczyk, G. Functional relationships between the Saccharomyces cerevisiae cis-prenyltransferases required for dolichol biosynthesis. Acta Biochim. Pol. 2005, 52, 221–232. [Google Scholar] [CrossRef] [Green Version]
  26. Danilov, L.L.; Chojnacki, T. A simple procedure for preparing dolichyl monophosphate by the use of POCl3. FEBS Lett. 1981, 131, 310–312. [Google Scholar] [CrossRef] [Green Version]
  27. Kruszewska, J.; Messner, R.; Kubicek, C.P.; Palamarczyk, G. O-glycosylation of proteins by membrane fraction of Trichoderma reesei QM9414. J. Gen. Microbiol. 1989, 135, 301–307. [Google Scholar]
  28. Palamarczyk, G.; Hemming, F.W. The formation of mono-N-acethylhexosamine derivatives of dolichol phosphate by pig liver microsomal fractions. Biochem. J. 1975, 148, 243–251. [Google Scholar] [CrossRef]
  29. Szkopińska, A.; Grabińska, K.; Delourme, D.; Karst, F.; Rytka, J.; Palamarczyk, G. Polyprenol formation in the yeast Saccharomyces cerevisiae: Effect of farnesyl diphosphate synthase overexpression. J. Lipid Res. 1997, 38, 962–968. [Google Scholar] [CrossRef]
  30. Karst, F.; Płochocka, D.; Meyer, S.; Szkopińska, A. Farnesyl diphosphate synthase activity affects ergosterol level and proliferation of yeast Saccharomyces cerevisiae. Cell Biol. Int. 2004, 28, 193–197. [Google Scholar] [CrossRef]
  31. Graczyk, S.; Perlińska-Lenart, U.; Górka-Nieć, W.; Lichota, R.; Piłsyk, S.; Zembek, P.; Lenart, J.; Bernat, P.; Gryz, E.; Augustyniak, J.; et al. Increased activity of the sterol branch of the mevalonate pathway elevates glycosylation of secretory proteins and improves antifungal properties of Trichoderma atroviride. Fungal Genet. Biol. 2020, 137, 103334. [Google Scholar] [CrossRef]
  32. Shechter, I.; Klinger, E.; Rucker, M.L.; Engstrom, R.G.; Spirito, J.A.; Islam, M.A.; Boettcher, B.R.; Weinstein, D.B. Solubilization, purification and characterization of a truncated form of rat hepatic squalene synthase. J. Biol. Chem. 1992, 267, 8628–8635. [Google Scholar] [CrossRef]
  33. Lowry, O.H.; Rosebrough, N.J.; Farr, A.L.; Randall, R.J. Protein measurement with the Folin phenol reagent. J. Biol. Chem. 1951, 193, 265–275. [Google Scholar] [CrossRef] [PubMed]
  34. Dubois, M.; Gilles, K.A.; Hamilton, J.K.; Robers, P.A.; Smith, F. Colorimetric method for determination of sugar and related substrates. Anal. Biochem. 1956, 28, 350–356. [Google Scholar]
  35. Ma, J.; Stoter, G.; Verweij, J.; Shellens, J.H. Comparison of ethanol plasma-protein precipitation with plasma ultrafiltration and trichloroacetic acid protein precipitation for the measurement of unbound platinum concentrations. Cancer Chemother. Pharmacol. 1996, 38, 391–394. [Google Scholar] [CrossRef] [PubMed]
  36. Duk, M.; Ugorski, M.; Lisowska, E. β-elimination of O-glycans from glycoproteins transferred to Immobilon P membranes: Method and some applications. Anal. Biochem. 1997, 253, 98–102. [Google Scholar] [CrossRef] [PubMed]
  37. Zdebska, E.; Kościelak, J. A single-sample method for determination of carbohydrate and protein contents in glycoprotein bands separated by sodium dodecyl sulfate-polyacrylamide gel electrophoresis. Anal. Biochem. 1999, 275, 171–179. [Google Scholar] [CrossRef]
  38. Bernfeld, P. Amylases, α and β. Methods Enzymol. 1955, 1, 149–158. [Google Scholar]
  39. Gawarecka, K.; Swiezewska, E. Analysis of plant polyisoprenoids. Methods Mol. Biol. 2014, 1153, 135–147. [Google Scholar]
  40. Bernat, P.; Gajewska, E.; Szewczyk, R.; Słaba, M.; Długoński, J. Tributyltin (TBT) induces oxidative stress and modifies lipid profile in the filamentous fungus Cunninghamella elegans. Environ. Sci. Pollut. Res. Int. 2014, 214, 228–4235. [Google Scholar] [CrossRef] [Green Version]
  41. Sato, M.; Sato, K.; Nishikawa, S.; Hirata, A.; Kato, J.; Nakano, A. The yeast RER2 gene, identified by endoplasmic reticulum protein localization mutations, encodes cis-prenyltransferase, a key enzyme in dolichol synthesis. Mol. Cell. Biol. 1999, 19, 471–483. [Google Scholar] [CrossRef] [Green Version]
  42. Montero, M.; Sanz, L.; Rey, M.; Llobell, A.; Monte, E. Cloning and characterization of bgn16·3, coding for a β-1,6-glucanase expressed during Trichoderma harzianum mycoparasitism. J. Appl. Microbiol. 2007, 103, 1291–1300. [Google Scholar] [CrossRef]
  43. Park, E.J.; Grabińska, K.A.; Guan, Z.; Stranecky, V.; Hartmannova, H.; Hodanova, K.; Beresova, V.; Sovova, J.; Jozsef, L.; Ondruskova, N.; et al. Mutation of Nogo-B receptor, a subunit of cis-prenyltransferase, causes a congenital disorder of glycosylation. Cell Metab. 2014, 20, 1–10. [Google Scholar] [CrossRef] [PubMed] [Green Version]
  44. Kubicek, C.P.; Panda, T.; Schreferl-Kunar, G.; Messner, R.; Gruber, F. O-linked—But not N-linked—Glycosylation is necessary for secretion of endoglucanase I and II by Trichoderma reesei. Can. J. Microbiol. 1987, 33, 698–703. [Google Scholar] [CrossRef]
  45. Harrison, M.J.; Nouwens, A.S.; Jardine, D.R.; Zachara, N.E.; Gooley, A.A.; Nevalainen, H.; Packer, N.H. Modified glycosylation of cellobiohydrolase I from a high cellulase-producing mutant strain of Trichoderma reesei. Eur. J. Biochem. 1998, 256, 119–127. [Google Scholar] [CrossRef] [PubMed]
  46. Latijnhouwers, M.; de Wit, P.J.G.M.; Govers, F. Oomycetes and fungi: Similar weaponry to attack plants. Trends Microbiol. 2003, 11, 462–469. [Google Scholar] [CrossRef] [PubMed]
  47. Zembek, P.; Perlińska-Lenart, U.; Brunner, K.; Reithner, B.; Palamarczyk, G.; Mach, R.L.; Kruszewska, J.S. Elevated activity of dolichyl phosphate mannose synthase enhances biocontrol abilities of Trichoderma atroviride. Mol. Plant-Microbe Interact. 2011, 24, 1522–1529. [Google Scholar] [CrossRef]
  48. Baek, J.M.; Howell, C.R.; Kenerley, C.M. The role of an extracellular chitinase from Trichoderma virens Gv29-8 in the biocontrol of Rhizoctonia solani. Curr. Genet. 1999, 35, 41–50. [Google Scholar] [CrossRef]
  49. Djonovic, S.; Pozo, M.J.; Kenerley, C.M. Tvbgn3, a β-1,6-glucanase from the biocontrol fungus Trichoderma virens, is involved in mycoparasitism and control of Pythum ultimum. Appl. Environm. Microbiol. 2006, 72, 7661–7670. [Google Scholar] [CrossRef]
Figure 1. Metabolic pathways analyzed in this study. Abbreviations presented in the figure: HMGR—3 hydroxy-3-methylglutaryl–CoA reductase (regulatory enzyme of the mevalonate pathway); FPP synthase—farnesyl diphosphate synthase; SS—squalene synthase; cis-PT (Rer2)—cis-prenyltransferase; Nus1-cis-PT complex subunit; DPM synthase—dolichyl phosphate mannose synthase. The names of the pathways are marked in green, and the names of the enzymes analyzed in this study in red.
Jof 09 00038 g001
Figure 2. Transcript levels of RER2 genes from S. cerevisiae (RER2S.c) and T. atroviride (rer2T.a) and nus1 subunit of cis-prenyltransferase (nus1T.a) determined by RT-qPCR in the RER2 transformed T. atroviride. Trichoderma strains (30—RER30/11; 32—RER32/11) and control strain P1 were grown for 144 h in PDB medium, RNA was extracted and cDNA synthesized. qPCR reactions were performed using a LightCycler 96 instrument. The amplification and melting curve data were collected and analyzed using the LightCycler96® software 1.0. Data were obtained from three independent experiments, each determined in triplicate. Expression of the native rer2 gene in the transformed strains was normalized to rer2 expression in the control strain P1.
Jof 09 00038 g002
Figure 3. Activities of cis-prenyltransferase and squalene synthase in membrane fraction or FPP synthase in cell-free extracts from RER2 transformed T. atroviride. Trichoderma strains (30—RER30/11; 32—RER32/11) and control strain P1 were processed and analyzed for enzymatic activity, as described in Section 2. Data are presented as mean ± standard deviation from six independent experiments, each determined in triplicate. Differences are statistically significant (p < 0.05; t test).
Jof 09 00038 g003
Figure 4. Concentration of dolichols and squalene in the mycelia from RER2 transformed T. atroviride. Trichoderma strains (30—RER30/11; 32—RER32/11) and control strain P1 were processed and analyzed for the concentration of products synthesized by cis-prenyltransferase and squalene synthase, dolichols and squalene, respectively. Data are presented as mean ± standard deviation from three independent experiments, each determined in triplicate. Differences are statistically significant (p < 0.05; t test).
Jof 09 00038 g004
Figure 5. Activities of DPM synthase and N-acetylglucosamine transferase in membrane fraction from RER2 transformed T. atroviride. Trichoderma strains (30—RER30/11; 32—RER32/11) and control strain P1 were processed and analyzed for enzymatic activity as described in Section 2. Data are presented as mean ± standard deviation from six (DPM synthase) or four (N-acetylglucosamine transferase) independent experiments, each determined in triplicate. Differences are statistically significant (p < 0.05; t test).
Jof 09 00038 g005
Figure 6. Content of O- and N-linked carbohydrates in proteins secreted by RER2 transformed T. atroviride after 96 h of cultivation. O- and N-linked carbohydrates were released selectively from proteins secreted by transformants (30—RER30/11; 32—RER32/11) and control strain P1 and determined by high-performance anion-exchange chromatography. Data are presented as mean ± standard deviation from three independent experiments. ★—differences statistically insignificant (p < 0.05; t test).
Jof 09 00038 g006
Figure 7. Activities of cellulases in cultivation medium from RER2-transformed T. atroviride. Concentration of reducing sugars released from carboxymethylcellulose by cellulases secreted into cultivation medium by the transformants (30—RER30/11; 32—RER32/11) and the parental strain P1 were measured. Data are presented as mean ± standard deviation from six independent experiments. Differences are statistically significant (p < 0.05; t test).
Jof 09 00038 g007
Figure 8. Growth inhibition of P. ultimum cultivated on plates pretreated with RER2 transformed T. atroviride. Trichoderma strains (30—RER30/11; 32—RER32/11) and control P1strain were cultivated for three days on MM plates covered with cellophane and then removed with the cellophane. P. ultimum was inoculated on the pretreated plates, and its rate of growth was determined as colony diameter after two days. As a control (C), P. ultimum was cultivated on non-pretreated plates. Data are presented as mean ± standard deviation from six independent experiments. Differences are statistically significant (p < 0.05; t test).
Jof 09 00038 g008
Figure 9. Plate confrontation assay of T. atroviride against P. ultimum. Mycelial disks of RER30/11 (30), RER32/11 (32) transformants and the control strain (P1) and P. ultimum were placed at opposite sides of agar plates and incubated at 28 °C. Pictures were taken three days after inoculation. Arrows mark the overgrown zone between the two fungi. The overgrown zones were measured, and results are presented as mean ± standard deviation from three separate plates. Differences are statistically significant (p < 0.05; t test).
Jof 09 00038 g009
Disclaimer/Publisher’s Note: The statements, opinions and data contained in all publications are solely those of the individual author(s) and contributor(s) and not of MDPI and/or the editor(s). MDPI and/or the editor(s) disclaim responsibility for any injury to people or property resulting from any ideas, methods, instructions or products referred to in the content.

