Article

Associations between Lifestyle Behaviors and Quality of Life Differ Based on Multiple Sclerosis Phenotype

1
Neuroepidemiology Unit, Centre of Epidemiology and Biostatistics, Melbourne School of Population and Global Health, The University of Melbourne, Parkville, VIC 3010, Australia
2
Menzies Institute for Medical Research, University of Tasmania, Hobart, TAS 7005, Australia
3
Accelerated Cure Project for Multiple Sclerosis, Waltham, MA 02451, USA
*
Author to whom correspondence should be addressed.
J. Pers. Med. 2021, 11(11), 1218; https://doi.org/10.3390/jpm11111218
Submission received: 4 October 2021 / Revised: 29 October 2021 / Accepted: 15 November 2021 / Published: 17 November 2021
(This article belongs to the Special Issue Personalized Diagnosis and Therapy for Multiple Sclerosis)

Abstract

:
Multiple sclerosis (MS), a neuroinflammatory disorder, occurs as non-progressive or progressive phenotypes; both forms present with diverse symptoms that may reduce quality of life (QoL). Adherence to healthy lifestyle behaviors has been associated with higher QoL in people with MS; whether these associations differ based on MS phenotype is unknown. Cross-sectional self-reported observational data from 1108 iConquerMS participants were analysed. Associations between lifestyle behaviors and QoL were assessed by linear regression, and phenotype differences via moderation analyses. Diet, wellness, and physical activity, but not vitamin D or omega-3 supplement use, were associated with QoL. Specifically, certain diet types were negatively associated with QoL in relapsing-remitting MS (RRMS), and positively associated in progressive MS (ProgMS). Participation in wellness activities had mixed associations with QoL in RRMS but was not associated in ProgMS. Physical activity was positively associated with QoL in RRMS and ProgMS. Phenotype differences were observed in diet and wellness with physical QoL, and physical activity with most QoL subdomains. Our findings show lifestyle behaviors are associated with QoL and appear to differ based on MS phenotype. Future studies assessing timing, duration, and adherence of adopting lifestyle behaviors may better inform their role in MS management.

Graphical Abstract

1. Introduction

Multiple sclerosis (MS), a chronic neuroinflammatory disorder, is commonly diagnosed in adults, predominantly women, aged 20 to 30 years [1]. On initial diagnosis, 85% of people with MS (pwMS) are diagnosed with relapsing-remitting MS (RRMS) presenting with acute attacks of new or increasing neurologic symptoms, and 10–15% with primary progressive MS (PPMS) defined by deterioration of symptoms from onset without obvious relapses or remission [2]. Within 15–20 years of diagnosis, approximately 50–75% of RRMS cases convert to secondary progressive MS (SPMS) defined by gradual worsening of neurologic function alongside a general cessation of relapses [3].
Both RRMS and progressive MS (ProgMS) may manifest an array of physiological, psychological, and motor symptoms; the number and severity of these symptoms and associated impairment play a critical role in quality of life (QoL). Symptoms of fatigue, pain, cognitive impairment, depression, and disability are key predictors of worse QoL up to 10 years later [4]. Improvement of symptoms through adoption of healthy lifestyle behaviors has potential to improve QoL.
Healthy lifestyle behaviors, including diet, vitamin D and omega 3 supplementation, and participation in wellness and physical activities have previously been found to be associated with higher QoL. PwMS who adhered to either high quality, MS-specific, or anti-inflammatory diets, have reported improved mental and physical QoL [5,6,7]. Vitamin D supplementation improved QoL in pwMS with initial levels lower than 30 ng/mL [8] and was associated with improved physical QoL in pwMS reporting an average daily intake of over 5000 IU [9]. Less is known about the effects of omega-3 supplement use, though in an international cohort of over 2500 pwMS, those self-reporting frequent fish consumption and taking omega-3 supplements had better QoL [10]. Research on wellness activity participation, ranging from Tai Chi and exercise therapy to mindfulness, relaxation, and imagery has mixed evidence of associations with QoL, though participation is generally reported to be beneficial for physical and mental QoL [11,12,13,14]. The benefits of physical activity for wellbeing are well established, with primarily aerobic forms benefiting social, physical, and mental QoL in pwMS [15].
Though the benefits of healthy lifestyle behaviors on QoL are evident, whether the effects are similar across MS phenotypes is unclear as most studies report on populations of mixed phenotype. As people with ProgMS are generally less responsive to therapies, have greater disability and more severe symptoms than those with RRMS [16,17,18], it is probable that the effects of lifestyle behaviors on QoL also differ. Therefore, we aim to differentiate associations of lifestyle behaviors with QoL between phenotypes, which may provide insight into personalised management strategies specific to disease course.

2. Materials and Methods

2.1. Study Design and Participants

Commencing from 2014, recruitment to the iConquerMS observational study has been ongoing and open to pwMS and the general population aged ≥21 years. The study is promoted by the sponsoring organization, Accelerated Cure Project for MS, and partner organizations and individuals via online, print and in person communication. Consenting participants are requested to voluntarily complete a series of self-reported online surveys capturing demographics, health and clinical outcomes, as well as lifestyle behaviors, at 6 month intervals. Response to questions at any timepoint is optional.
De-identified baseline data from participants who registered in the study from November 2014 to July 2020 (n = 3374) was extracted. Inclusion criteria were participants reporting a clinician-confirmed MS diagnosis, confidence in MS diagnosis, and having completed diet and wellness, physical activity, QoL and disability surveys. RRMS, SPMS or PPMS phenotypes were included, and SPMS/PPMS consolidated. Clinically isolated syndrome, radiologically isolated syndrome, and not sure/don’t know MS phenotype, were excluded. Ethics approval ID #1956113.1.

2.2. Demographics and Clinical Outcomes

Age (from date of birth), sex (male, female), highest level of education (no formal education, elementary-middle school, high school, high school graduate, some college, associate degree, technical degree, bachelor’s degree, master’s degree, doctoral degree), partner status (never married, married, divorced, separated, widowed, cohabitation/domestic partner, prefer not to answer), employment status (employed outside home, employed at home, homemaker, student, worker’s compensation, unemployed looking for work, disabled), country of birth (global country list), ethnicity (American Indian/Alaska Native, Middle Eastern, South Asian, other Asian, Black/African American, Native Hawaiian/Pacific Islander, White, don’t know), and annual household income (<USD15,000 to >USD200,001 in increments of USD15,000) were queried and re-categorized.
MS duration was calculated by year of diagnosis and survey completion. Body mass index (BMI) was calculated by weight (kg)/height (m)2 then categorized into underweight, normal, overweight, and obese according to World Health Organisation classifications [19]; underweight and normal were combined due to small sample size in the former group. Disability was measured via the Patient Determined Disease Steps (PDDS), and scores collapsed to low (0–2), moderate (3–5) and high (6–8) disability as per guidelines [20].

2.3. Lifestyle Behaviors

Variables within diet (n = 23), wellness (n = 25), vitamins (n = 15) and supplements (n = 29) categories were each queried via tick-box options of “used” and/or “used and helpful” in the past 6 months to improve health and wellbeing; those not selecting either were considered not using. Two response options were combined for analysis (Yes = used/used and helpful vs. No = none selected). Variables were recategorized for diet and wellness (Table 1) then analysed as a binary variable (Yes = use/used and helpful of ≥1 option within category). Of the vitamins and supplements, only vitamin D and omega-3 were analysed.
Physical activity was assessed via the Godin-Shephard Leisure-Time Physical Activity Questionnaire (GLTPAQ), which queries frequency (0–7 days) of strenuous, moderate, and mild exercise for ≥ 15 min in the preceding seven days [21]. Total leisure activity score was calculated as per guidelines and categorized into sedentary (<14), moderately active (14–23), and active (≥24).

2.4. Outcome Measure

QoL was queried via the NeuroQoL Adult Short Form, comprising 13 subdomains, classified under physical, mental, and social QoL [22]. Each of 13 subdomains comprise between five to nine questions scored on a Likert scale. Scores were summated and converted to T-scores (Mean = 50, SD = 10) as per guidelines. For mobility, fine motor, anxiety, depression, positive affect, cognitive function, social participation, and social satisfaction subdomains, T-scores were derived from an average U.S. general population; and for fatigue, sleep disturbance, emotional dyscontrol, and stigma subdomains, T-scores were derived from an average population with a diagnosed neurological disorder (MS, epilepsy, stroke, amyotrophic lateral sclerosis, or Parkinson’s disease). Higher T-scores equate to higher measured concept. T-scores for the communication subdomain were unavailable, therefore raw total score for this subdomain was used for analysis and reporting.

2.5. Statistical Analysis

All analyses were conducted in Stata version 15.0 (StataCorp. 2017. Stata Statistical Software: Release 15. College Station, TX, USA: StataCorp LLC.). Associations between lifestyle behavior categories and QoL domain were assessed by multiple linear regression models, adjusted for age, sex, education, BMI, disability, and duration since MS diagnosis, estimating adjusted regression coefficients and 95% CI. An interaction term between MS phenotype and each lifestyle behavior was added to the regression model to assess differences between RRMS and ProgMS.

3. Results

3.1. Participant Characteristics Based on Phenotype

Of 3374 participants enrolled into iConquerMS, n = 1108 (33%) met the inclusion criteria. In the included population, compared to participants with RRMS, people with ProgMS were older, and more likely to be male, not in paid employment, with moderate or severe disability, and longer MS duration (Table 2A). For lifestyle behaviors, compared to RRMS, people with ProgMS were less likely to have used an anti-inflammatory diet, and less likely to be at an active level of physical activity.
For QoL, compared to the clinical for U.S. general population, pwMS reported similar T-score difference (<0.5 SD) in 9 of 13 QoL subdomains, excepting fine motor, mobility, and both social participation and satisfaction (Table 2B), in which people with ProgMS reported marginally lower T-scores. Compared to RRMS, people with ProgMS reported significantly worse QoL in 7 of 13 subdomains: lower mobility, fine motor, positive affect, and both social participation and satisfaction, and higher fatigue and stigma. Anxiety was higher in RRMS (Table 2B).

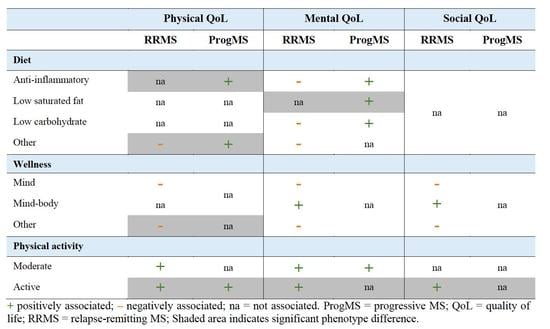
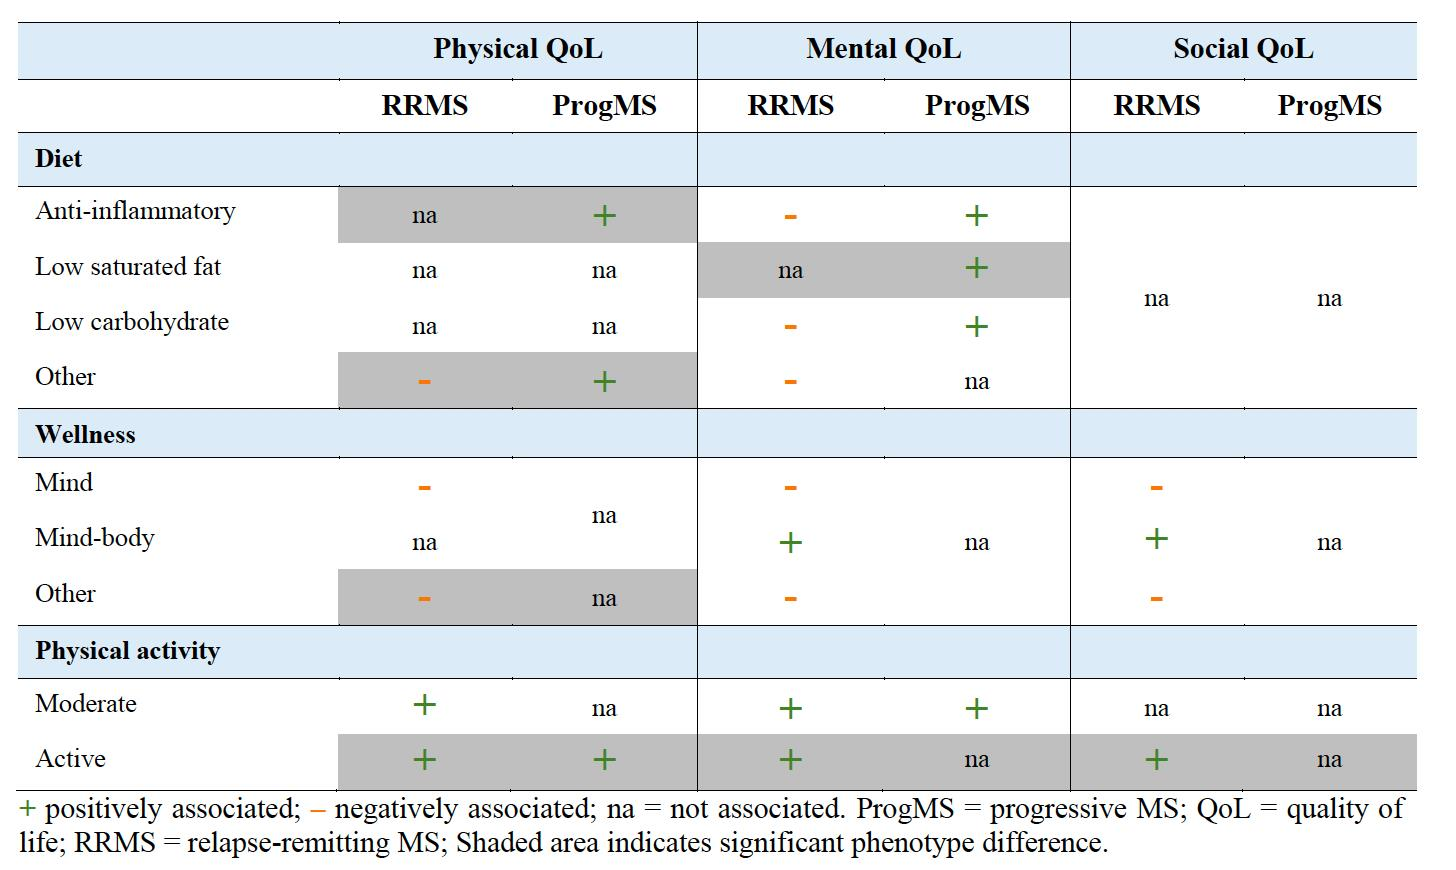
3.2. Associations between Lifestyle and Quality of Life Subdomains

Diet was associated with physical and mental, but not social, QoL (Table 3A). In people with RRMS, anti-inflammatory, low-carbohydrate and other diets were positively associated with stigma, and other diets additionally associated with lower fine motor and cognitive function. In ProgMS, anti-inflammatory diets were associated with higher mobility and positive affect; low-carbohydrate diet with higher positive affect; low-saturated fat diet with higher ease of communication; and other diet with higher mobility. Phenotype differences were observed in mobility and communication subdomains.
Wellness activities were associated with physical, mental, and social QoL (Table 3B). In RRMS, mind activities were associated with lower fine motor, cognitive function, communication, social participation, and social satisfaction, and with higher fatigue, anxiety, emotional dyscontrol, and stigma. Mind-body activities were associated with higher positive affect and social participation, and lower emotional dyscontrol. Other wellness activities were associated with lower physical, mental, and social QoL in 10 of 13 subdomains, excepting mobility, depression, and positive affect. No significant associations were observed between wellness activities and QoL in ProgMS. Phenotype differences were only observed between other wellness activities and the fine motor subdomain.
Physical activity was associated with physical, mental, and social QoL (Table 3C). In RRMS, physical activity was dose-dependently associated with higher mobility, positive affect, and social satisfaction; and with lower anxiety, depression, and stigma. Active level of physical activity was additionally associated with higher fine motor, cognitive function, communication, social participation, and lower fatigue, sleep disturbance, and emotional dyscontrol. In ProgMS, moderate physical activity was associated with higher positive affect, cognitive function, and lower communication; and active physical activity with higher mobility and lower fatigue. Phenotype differences were observed in 8 of 13 QoL subdomains.
Neither vitamin D nor omega-3 supplements use were associated with QoL (Table 3C).

4. Discussion

Lifestyle behaviors are known to be associated with QoL in pwMS. To inform potential lifestyle management strategies based on disease course, we assessed associations between diet, vitamin D and omega 3 supplementation, and participation in wellness and physical activities on QoL in pwMS, and whether these associations differed in nature and magnitude between MS phenotypes.
Compared to RRMS, people with ProgMS were older, less likely to be in paid employment, had longer disease duration and greater disability, and had a lower female/male ratio, consistent with previous reports [16,17]. Of lifestyle behaviors assessed, physical activity and QoL differed by phenotype. People with ProgMS were less physically active and had lower QoL in specific physical, mental, and social QoL subdomains, also consistent with prior studies [18,23], and expected given advanced disease stage and greater severity of symptoms adversely affecting QoL, and being likely barriers to performing daily activities and independent living.
High quality, anti-inflammatory, and MS-specific diets have been associated with better mental and physical QoL [5,6]. Our results were mixed and not always aligned with previously reported findings. We identified associations of four diet categories with mental and physical, but not social QoL domains. In RRMS, three of four diet categories were associated with higher stigma, a measure of perceived prejudice and discrimination because of disease, potentially reflective of people who feel greater stigmatisation being more inclined to make changes in their diet in attempt to improve or moderate their condition, or the stigma of adhering to dietary restrictions. Unexpectedly, no positive associations of diet with QoL in RRMS were found; the other diet category, comprising organic, low sodium/sugar and semi-vegetarian diets, was associated with both lower cognitive function and fine motor subdomain scores. Timing of adoption as well as duration and adherence of dietary modification may account for these observations.
In ProgMS, diet was associated with positive affect and ease of communication, perhaps indicative of higher mastery and self-control over MS management. Both anti-inflammatory and other diets were associated with improved mobility, consistent with proposed neuroinflammatory and microbiota-gut-brain-axis disease mechanisms. Though studies have reported associations between diet quality and MS-specific diets with lower depression and fatigue respectively [24,25], we did not observe associations in these symptom subdomains. Discrepancies may be attributable to outcome measure tools in addition to potential additive benefits of adhering to multiple lifestyle behaviors. Phenotype differences were evident only in mobility and communication subdomains. The positive association with mobility in ProgMS, an indicator of disease progression and key contributor to reduced QoL, suggests duration of dietary modification may be a factor, although our data do not allow us to make this conclusion.
No associations between vitamin D or omega-3 supplementation and QoL were observed. Prior studies report mixed evidence for a role of vitamin D supplementation on QoL, with positive associations apparent in pwMS with deficiencies or with an intake of more than 5000 IU/day in addition to sufficient sun-exposure [8,9,26]. Similarly, discrepancies between our observations and that reported for omega-3 and QoL [10], may reflect dose and source of omega-3, or dietary balance of omega-3 and -6. Baseline vitamin and mineral levels, or daily dose, frequency, and duration of supplement use were not captured in the current study.
Participation in wellness activities was associated with physical, mental, and social QoL only for people with RRMS. Mind-body activities, encompassing yoga, Tai Chi, Qigong, and exercise therapy, were associated with positive affect, emotional dyscontrol, and social participation, consistent with past reports of favourable effects of exercise therapy and Tai Chi on mental QoL [12,14]. The non-significant and negative associations observed with mind and other wellness activities with QoL subdomains, some contrary to previously reported [27], may be attributable to category inclusions, adherence to behavior, and/or non-specific symptom assessment. Alternatively, it may be that interactive group wellness activities having positive social interactions may be better interventions for improved mental and social QoL. Phenotype difference was only observed with other wellness and fine motor subdomains. Further investigation capturing information regarding adherence to lifestyle behaviors may provide better insight and is necessary to inform practice recommendations.
The benefits of physical activity on overall health are established [15,28] and supported by our data. We found dose-dependent associations in mobility, social satisfaction, and four mental subdomains in RRMS. Active levels of physical activity were positively associated across 13 QoL subdomains. That common symptoms of fatigue, mobility, anxiety, depression, and cognitive function also showed significant positive associations, highlights the potential value of incorporating regular physical activity in MS management. In people with ProgMS, moderate activity had positive associations for positive affect and cognitive function, and active levels for mobility and fatigue, also encouraging for symptom management through adoption of physical activity. The magnitude of associations was generally stronger in RRMS, especially in active levels. Significant phenotype differences were noted in fine motor, five of seven mental and both social subdomains, suggesting that physical interventions may be best implemented early in disease course, adapted to disease progression.
The strengths of our study are the inclusion of a large and diverse population of pwMS, with minimal participant bias due to the open nature of recruitment, enabling generalizability of findings. Moreover, the large number of participants of RRMS and ProgMS phenotype meant that separation based on disease stage was possible; most prior studies report on mixed phenotype populations. The dataset captures a breadth of clinical and lifestyle variables, enabling robust analysis of associations among a spectrum of behaviors and QoL.
Limitations include self-reported optional survey responses which impact data quality and missingness, and potential selection bias with only 35% participant inclusion for which we controlled by assessing biases between included and excluded participants and adjusting for variables that were significantly different (data not shown). Some participant biases, such as possible increased motivation of pwMS who completed all surveys, are unable to be adjusted for. The cross-sectional analysis limits the inference of causal relationships but provides insight to guide future longitudinal studies. Other factors including socioeconomics, access to health services, and support networks, may also contribute to QoL and should be considered in interpretation of the findings. The use of non-validated tools to capture lifestyle and health outcome variables limits interpretation and comparison with previously reported studies; however, the survey was developed by the multi-stakeholder iConquerMS Research Committee, comprising MS specialist health professionals and scientists, and pwMS, therefore results should be considered alongside other research for practice translation in pwMS. The non-exclusive lifestyle option selections, lack of capture of duration and adherence to behaviors, as well as researcher-defined broad re-categorizations, potentially masked associations; these and other recommendations are being considered for ongoing data capture.

5. Conclusions

Our study demonstrated that lifestyle behaviors concerning diet, wellness, and particularly physical activity, but not vitamin D or omega-3 intake, have positive associations with specific QoL subdomains in pwMS. Some differences in associations between RRMS and ProgMS phenotypes were observed, suggesting a need for phenotype-specific recommendations for MS management. Our findings suggest a role for modifiable lifestyle behaviors as a potential intervention for improving QoL in pwMS. Replication and validation through prospective studies are required to make specific recommendations; however, the presence and absence of associations by phenotype found in our study suggest areas that may be most rewarding for study among certain subgroups.

Author Contributions

Conceptualization, N.N.; methodology, N.N., M.Y.; formal analysis, M.Y.; investigation, H.K.S.; resources, H.K.S., S.L.N.; data curation, M.Y.; writing—original draft preparation, N.N., M.Y.; writing—review and editing, N.N., M.Y., G.A.J., S.S.-Y., S.L.N., H.K.S.; visualization, N.N.; supervision, N.N.; project administration, N.N.; funding acquisition, H.K.S., G.A.J. All authors have read and agreed to the published version of the manuscript.

Funding

Data collection and curation was funded by the Patient-Centered Outcomes Research Institute. Data access and research activity was funded by philanthropic gifts to the Neuroepidemiology Unit from Mr Wal Pisciotta and anonymous donors. Open access fee was funded by Accelerated Cure Project for Multiple Sclerosis.

Institutional Review Board Statement

This study was approved by The University of Melbourne, Melbourne School of Population and Global Health Human Ethics Advisory Group, project #1956113.1.

Informed Consent Statement

Written informed consent has been obtained from all participants.

Data Availability Statement

Restrictions apply to the availability of these data. Data was obtained from Accelerated Cure Project for Multiple Sclerosis and may be requested from HS with the approval of the iConquerMS Research Committee.

Acknowledgments

The authors gratefully acknowledge survey participants, and data collectors and curators of iConquerMS.

Conflicts of Interest

The authors declare no conflict of interest. The funders had no role in the design of the study; in the collection, analyses, or interpretation of data; in the writing of the manuscript, or in the decision to publish the results.

References

  1. McGinley, M.P.; Goldschmidt, C.H.; Rae-Grant, A.D. Diagnosis and treatment of multiple sclerosis: A review. JAMA 2021, 325, 765–779. [Google Scholar] [CrossRef]
  2. Brownlee, W.J.; Hardy, T.A.; Fazekas, F.; Miller, D.H. Diagnosis of multiple sclerosis: Progress and challenges. Lancet 2017, 389, 1336–1346. [Google Scholar] [CrossRef]
  3. Lublin, F.D.; Reingold, S.C.; Cohen, J.A.; Cutter, G.R.; Sørensen, P.S.; Thompson, A.J.; Wolinsky, J.S.; Balcer, L.J.; Banwell, B.; Barkhof, F. Defining the clinical course of multiple sclerosis: The 2013 revisions. Neurol. Clin. Neurophysiol. 2014, 83, 278–286. [Google Scholar] [CrossRef] [PubMed] [Green Version]
  4. Gil-González, I.; Martín-Rodríguez, A.; Conrad, R.; Pérez-San-Gregorio, M.Á. Quality of life in adults with multiple sclerosis: A systematic review. BMJ Open 2020, 10, e041249. [Google Scholar] [CrossRef] [PubMed]
  5. Evers, I.; Heerings, M.; de Roos, N.M.; Jongen, P.J.; Visser, L.H. Adherence to dietary guidelines is associated with better physical and mental quality of life: Results from a cross-sectional survey among 728 dutch ms patients. Nutr. Neurosci. 2021, 2021, 1–8. [Google Scholar] [CrossRef]
  6. Mousavi-Shirazi-Fard, Z.; Mazloom, Z.; Izadi, S.; Fararouei, M. The effects of modified anti-inflammatory diet on fatigue, quality of life, and inflammatory biomarkers in relapsing-remitting multiple sclerosis patients: A randomized clinical trial. Int. J. Neurosci. 2021, 131, 657–665. [Google Scholar] [CrossRef]
  7. Hadgkiss, E.J.; Jelinek, G.A.; Weiland, T.J.; Pereira, N.G.; Marck, C.H.; van der Meer, D.M. The association of diet with quality of life, disability, and relapse rate in an international sample of people with multiple sclerosis. Nutr. Neurosci. 2015, 18, 125–136. [Google Scholar] [CrossRef] [PubMed] [Green Version]
  8. Beckmann, Y.; Türe, S.; Duman, S.U. Vitamin d deficiency and its association with fatigue and quality of life in multiple sclerosis patients. EPMA J. 2020, 11, 65–72. [Google Scholar] [CrossRef] [PubMed]
  9. Simpson-Yap, S.; Jelinek, P.; Weiland, T.; Nag, N.; Neate, S.; Jelinek, G. Self-reported use of vitamin d supplements is associated with higher physical quality of life scores in multiple sclerosis. Mult. Scler. Relat. Disord. 2021, 49, 102760. [Google Scholar] [CrossRef]
  10. Jelinek, G.A.; Hadgkiss, E.J.; Weiland, T.J.; Pereira, N.G.; Marck, C.H.; van der Meer, D.M. Association of fish consumption and ω 3 supplementation with quality of life, disability and disease activity in an international cohort of people with multiple sclerosis. Int. J. Neurosci. 2013, 123, 792–800. [Google Scholar] [CrossRef]
  11. Simpson, R.; Booth, J.; Lawrence, M.; Byrne, S.; Mair, F.; Mercer, S. Mindfulness based interventions in multiple sclerosis-a systematic review. BMC Neurol. 2014, 14, 1–9. [Google Scholar] [CrossRef] [Green Version]
  12. Taylor, E.; Taylor-Piliae, R.E. The effects of tai chi on physical and psychosocial function among persons with multiple sclerosis: A systematic review. Complementary Ther. Med. 2017, 31, 100–108. [Google Scholar] [CrossRef] [PubMed]
  13. Benito-Villalvilla, D.; de Uralde-Villanueva, L.; Ríos-León, M.; Álvarez-Melcón, A.C.; Martín-Casas, P. Effectiveness of motor imagery in patients with multiple sclerosis: A systematic review. Rev. Neurol. 2021, 72, 157–167. [Google Scholar] [PubMed]
  14. Ghahfarrokhi, M.M.; Banitalebi, E.; Negaresh, R.; Motl, R.W. Home-based exercise training in multiple sclerosis: A systematic review with implications for future research. Mult. Scler. Relat. Disord. 2021, 55, 103177. [Google Scholar] [CrossRef] [PubMed]
  15. Alphonsus, K.B.; Su, Y.; D’Arcy, C. The effect of exercise, yoga and physiotherapy on the quality of life of people with multiple sclerosis: Systematic review and meta-analysis. Complementary Ther. Med. 2019, 43, 188–195. [Google Scholar] [CrossRef] [PubMed]
  16. Gross, H.J.; Watson, C. Characteristics, burden of illness, and physical functioning of patients with relapsing-remitting and secondary progressive multiple sclerosis: A cross-sectional us survey. Neuropsychiatr. Dis. Treat. 2017, 13, 1349. [Google Scholar] [CrossRef] [PubMed] [Green Version]
  17. Rooney, S.; Wood, L.; Moffat, F.; Paul, L. Prevalence of fatigue and its association with clinical features in progressive and non-progressive forms of multiple sclerosis. Mult. Scler. Relat. Disord. 2019, 28, 276–282. [Google Scholar] [CrossRef] [Green Version]
  18. Zhang, W.; Becker, H.; Stuifbergen, A. Comparing health promotion and quality of life in people with progressive versus nonprogressive multiple sclerosis. Int. J. MS Care 2020, 22, 239–246. [Google Scholar] [CrossRef]
  19. WHO. Body Mass Index. Available online: https://www.euro.who.int/en/health-topics/disease-prevention/nutrition/a-healthy-lifestyle/body-mass-index-bmi (accessed on 10 December 2020).
  20. Hohol, M.; Orav, E.; Weiner, H. Disease steps in multiple sclerosis: A simple approach to evaluate disease progression. Neurol. Clin. Neurophysiol. 1995, 45, 251–255. [Google Scholar] [CrossRef]
  21. Amireault, S.; Godin, G. The godin-shephard leisure-time physical activity questionnaire: Validity evidence supporting its use for classifying healthy adults into active and insufficiently active categories. Percept. Mot. Ski. 2015, 120, 604–622. [Google Scholar] [CrossRef]
  22. Cella, D.; Lai, J.-S.; Nowinski, C.; Victorson, D.; Peterman, A.; Miller, D.; Bethoux, F.; Heinemann, A.; Rubin, S.; Cavazos, J. Neuro-qol: Brief measures of health-related quality of life for clinical research in neurology. Neurology 2012, 78, 1860–1867. [Google Scholar] [CrossRef] [Green Version]
  23. Rezapour, A.; Kia, A.A.; Goodarzi, S.; Hasoumi, M.; Motlagh, S.N.; Vahedi, S. The impact of disease characteristics on multiple sclerosis patients’ quality of life. Epidemiol. Health 2017, 39, e2017008. [Google Scholar] [CrossRef] [PubMed] [Green Version]
  24. Taylor, K.L.; Simpson, S., Jr.; Jelinek, G.A.; Neate, S.L.; De Livera, A.M.; Brown, C.R.; O’Kearney, E.; Marck, C.H.; Weiland, T.J. Longitudinal associations of modifiable lifestyle factors with positive depression-screen over 2.5-years in an international cohort of people living with multiple sclerosis. Front. Psychiatry 2018, 9, 526. [Google Scholar] [CrossRef] [PubMed]
  25. Wahls, T.L.; Titcomb, T.J.; Bisht, B.; Eyck, P.T.; Rubenstein, L.M.; Carr, L.J.; Darling, W.G.; Hoth, K.F.; Kamholz, J.; Snetselaar, L.G. Impact of the swank and wahls elimination dietary interventions on fatigue and quality of life in relapsing-remitting multiple sclerosis: The waves randomized parallel-arm clinical trial. Mult. Scler. J.–Exp. Transl. Clin. 2021, 7, 5399. [Google Scholar] [CrossRef] [PubMed]
  26. Jagannath, V.A.; Filippini, G.; Di Pietrantonj, C.; Asokan, G.V.; Robak, E.W.; Whamond, L.; Robinson, S.A. Vitamin d for the management of multiple sclerosis. Cochrane Database Syst. Rev. 2018, 9, CD008422. [Google Scholar] [CrossRef] [PubMed]
  27. Shohani, M.; Kazemi, F.; Rahmati, S.; Azami, M. The effect of yoga on the quality of life and fatigue in patients with multiple sclerosis: A systematic review and meta-analysis of randomized clinical trials. Complementary Ther. Clin. Pract. 2020, 39, 101087. [Google Scholar] [CrossRef]
  28. Dauwan, M.; Begemann, M.J.; Slot, M.I.; Lee, E.H.; Scheltens, P.; Sommer, I.E. Physical exercise improves quality of life, depressive symptoms, and cognition across chronic brain disorders: A transdiagnostic systematic review and meta-analysis of randomized controlled trials. J. Neuron. 2021, 268, 1222–1246. [Google Scholar] [CrossRef] [PubMed] [Green Version]
Table 1. Lifestyle Behavior Categories.
LifestyleCategoryInclusions
DietAnti-inflammatoryAnti-inflammatory, fasting/calorie restriction, gluten-free, Mediterranean
Low-saturated fatsJelinek, Swank, low-fat, ovo-lactovegetarian, vegetarian, vegan, lacto-vegetarian, Ornish, Pritikin, pescatarian
Low-carbohydrate Atkins, ketogenic, paleo, Wahls, low-carbohydrate
Other Organic, low sodium, low sugar, semi-vegetarian
SupplementsVitamin DVitamin D
Omega-3Omega-3, DHA or EPA fatty acid, fish-oil, flaxseed/flaxseed oil
WellnessMind Meditation, mindfulness, guided imagery, relaxation exercise, stress management
Mind-bodyTai chi, yoga, qigong, exercise therapy
OtherAcupuncture, Ayurveda, biofeedback, brain training, chelation therapy, chiropractic/osteopathic manipulation, cognitive behavioral therapy, craniosacral therapy, deep breathing exercises, energy healing, hypnosis, massage, naturopathy, progressive relaxation, reflexology, traditional healing
Physical activitySedentary
Moderate
Active
leisure activity score <14
leisure activity score 14–23
leisure activity score >23
Table 2. (A). Characteristics of participants with RRMS and ProgMS. (B). Mean QoL T-scores of participants with RRMS and ProgMS.
(A)
DemographicsRRMS
n = 750
ProgMS
n = 358
pLifestyle BehaviorsRRMS
n = 750
ProgMS
n = 358
p
n (%)n (%) n (%)n (%)
Age, years (Mean, SD)49.9 (11)58.3 (9)<0.001Diet
Sex Anti-inflammatory
  Male126 (17%)113 (32%)Ref.  Not used464 (62%)245 (68%)Ref.
  Female621 (83%)244 (68%)<0.001  Used/helpful286 (38%)113 (32%)<0.05
Country of birth Low saturated fat
  US634 (85%)308 (86%)Ref.  Not used601 (80%)300 (84%)Ref.
  Other114 (15%)50 (14%)0.59  Used/helpful149 (20%)58 (16%)0.16
Ethnicity Low carbohydrate
  Caucasian688 (92%)337 (95%)Ref.  Not used576 (77%)280 (78%)Ref.
  Other/mixed 56 (8%)18 (5%)0.15  Used/helpful174 (23%)78 (22%)0.61
University degree Other
  Yes525 (70%)245 (68%)Ref.  Not used500 (67%)252 (70%)Ref.
  No222 (30%)113 (32%)0.55  Used/helpful250 (33%)106 (30%)0.23
Partnered Supplements
  Yes530 (71%)274 (77%)Ref.Vitamin D
  No214 (29%)84 (24%)0.06No108 (14%)65 (18%)Ref.
Paid employment Yes642 (86%)293 (82%)0.10
  Yes402 (54%)94 (27%)Ref.Omega-3
  No338 (46%)260 (74%)<0.001  Not used461 (61%)210 (59%)Ref.
Household income (USD)   Used/helpful289 (39%)148 (41%)0.36
  ≤$50,000144 (35%)67 (42%)Ref.Wellness
  $50,001–100,000121 (29%)49 (31%)0.56Mind
  ≥$100,001146 (35%)44 (28%)0.06  Not used473 (63%)231 (65%)Ref.
BMI   Used/helpful277 (37%)127 (36%)0.65
  Under/healthy331 (44%)166 (47%)Ref.Mind-body
  Overweight204 (27%)103 (29%)0.99  Not used456 (61%)224 (63%)Ref.
  Obese212 (28%)86 (24%)0.19  Used/helpful294 (39%)134 (37%)0.58
PDDS Other
  Normal/mild448 (60%)36 (10%)Ref.  Not used249 (33%)132 (37%)Ref.
  Moderate252 (34%)186 (52%)<0.001  Used/helpful501 (67%)226 (63%)0.24
  Severe50 (7%)135 (38%)<0.001Physical activity
MS duration (years)11.5 (9.1)16.1 (10.3)<0.001  Sedentary225 (30%)154 (43%)Ref.
  Moderate150 (20%)84 (24%)0.25
  Active375 (50%)120 (34%)<0.001
(B)
QoL SubdomainsRRMS
n = 750
ProgMS
n = 358
p
Mean (SD) T-scoreMean (SD) T-score
Physical
Mobility48.0 (9.0)38.30 (7.5)<0.001
Fine motor46.4 (8.7)41.0 (9.2)<0.001
Fatigue51.8 (9.5)53.3 (8.5)<0.05
Sleep disturbance 53.8 (9.0)53.4 (7.8)0.433
Mental
Anxiety51.8 (8.6)50.6 (7.6)<0.05
Depression47.7 (8.3)48.4 (7.9)0.185
Positive affect52.5 (8.2)51.1 (8.1)<0.01
Emotional dyscontrol48.6 (9.8)48.1 (9.2)0.394
Stigma49.0 (7.8)52.7 (6.9)<0.001
Cognitive function45.8 (10.7)46.6 (10.2)0.259
Communication a22.1 (3.4)21.9 (3.5)0.390
Social
Participation 46.8 (7.9)43.7 (6.4)<0.001
Satisfaction 45.3 (7.0)42.0 (5.5)<0.001
BMI = body mass index; MS = multiple sclerosis; PDSS = Patient Determined Disease Steps; ProgMS = progressive MS; Ref. = reference; RRMS = relapsing-remitting MS; SD = standard deviation; USD = United States Dollar. p values indicate statistical differences between RRMS and ProgMS, where bolded values indicate significance (p < 0.05). a Total raw score. Bolded mean scores indicate differences > 5 points on the T-scale metric (0.5 SD) than the clinical or US general population.
Table 3. (A). Associations between diet and QoL subdomains, in RRMS and ProgMS. (B). Associations between wellness activities and QoL subdomains, in RRMS and ProgMS. (C). Associations between supplement use, physical activity and QoL subdomains, in RRMS and ProgMS.
(A)
DietAnti-InflammatoryLow CarbohydrateLow-Saturated FatOther
QoLRRMSProgMSRRMSProgMSRRMSProgMSRRMSProgMS
Physical
Mobility−0.09 (−0.97, 0.79)1.51 (0.17, 2.84) *−0.34 (−1.35, 0.67)−0.77 (−0.73, 2.28)0.10 (−0.97, 1.18)0.62 (−1.09, 2.34)−0.64 (−1.56, 0.27)1.42 (0.07, 2.78)*
Fine motor−1.06 (−2.26, 0.14)0.69 (−1.12, 2.50)−1.09 (−2.47, 0.28)−0.84 (−2.87, 1.19)0.35 (−1.11, 1.81)1.42 (−0.90, 3.74)−1.24 (−2.50, −0.01)−0.20 (−2.05, 1.64)
Fatigue−0.28 (−1.57, 1.00)−0.02 (−1.96, 1.92)0.83 (−0.64, 2.30)−0.93 (−3.11, 1.24)0.59 (−0.97, 2.15)−1.53 (−4.01, 0.95)1.02 (−0.31, 2.34)−1.51 (−3.48, 0.47)
Sleep disturbance0.41 (−0.81, 1.64)0.38 (−1.47, 2.23)−0.16 (−1.56, 1.24)0.92 (−1.15, 2.99)0.15 (−1.33, 1.64)0.00 (−2.36, 2.37)0.16 (−0.21, 2.32)1.01 (−0.87, 2.89)
Mental
Anxiety0.08 (−1.11, 1.29)−0.01 (−1.81, 1.80)0.03 (−1.34, 1.40)−0.50 (−2.53, 1.53)0.89 (−0.56, 2.34)1.36 (−0.94, 3.65)0.69 (−0.55, 1.93)0.08 (−1.76, 1.93)
Depression0.24 (−0.94, 1.42)−1.08 (−2.85, 0.70)−0.11 (−1.46, 1.24)−1.31 (−3.31, 0.68)0.38 (−1.05, 1.81)1.50 (−0.75, 3.76)1.03 (−0.19, 2.25)−0.72 (−2.53, 1.09)
Positive affect0.45 (−0.73, 1.63)2.05 (0.27, 3.83)0.54 (−0.81, 1.88)2.22 (0.23, 4.21)0.14 (−1.29, 1.57)−0.03 (−2.31, 2.25)−0.17 (−1.39, 1.05)1.55 (−0.27, 3.36)
Emotional dyscontrol0.51 (−0.87, 1.91)−0.08 (−2.17, 2.02)0.20 (−1.38, 1.79)−1.73 (−4.08, 0.62)0.63 (−1.05, 2.32)−0.28 (−2.97, 2.40)0.91 (−0.53, 2.34)−0.00 (−2.14, 2.13)
Stigma 1.26 (0.22, 2.30)−0.12 (−1.68, 1.44)1.23 (0.04, 2.41)0.38 (−1.37, 2.13)0.55 (−0.71, 1.80)0.25 (−1.76, 2.25)1.36 (0.29, 2.43)−0.08 (−1.68, 1.52)
Cognitive function −0.77 (−2.27, 0.72)−0.32 (−2.58, 1.94)−1.04 (−2.75, 0.67)0.23 (−2.30, 2.77)−1.04 (−2.85, 0.77)1.64 (−1.25, 4.53)−1.92 (−3.46, −0.37)0.50 (−1.80, 2.79)
Communication a−0.20 (−0.68, 0.29)0.07 (−0.66, 0.80)−0.03 (−0.58, 0.52)−0.06 (−0.88, 0.76)−0.30 (−0.88, 0.29)1.23 (0.31, 2.15)*−0.48 (−0.98, 0.02)0.26 (−0.48, 1.00)
Social
Participation 0.27 (−0.73, 1.27)−0.00 (−1.51, 1.51)−0.49 (−1.63, 0.66)−0.28 (−1.98, 1.42)−0.53 (−1.75, 0.69)0.38 (−1.54, 2.31)−1.04 (−2.07, 0.01)0.50 (−1.03, 2.04)
Satisfaction 0.28 (−0.62, 1.18)0.77 (−0.59, 2.13)−0.27 (−1.29, 0.76)0.05 (−1.48, 1.57)0.15 (−0.95, 1.24)0.58 (−1.16, 2.33)−0.20 (−1.13, 0.73)0.51 (−0.87, 1.90)
(B)
WellnessMindMind−BodyOther
QoLRRMSProgMSRRMSProgMSRRMSProgMS
Physical
Mobility−0.82 (−1.71, 0.07)0.29 (−1.02, 1.61)0.20 (−0.69, 1.09)0.95 (−0.34, 2.24)−0.89 (−1.80, 0.03)0.48 (−0.81, 1.78)
Fine motor−1.70 (−2.90, −0.49)0.09 (−1.68, 1.86)−0.34 (−1.54, 0.87)0.57 (−1.18, 2.32)−1.75 (−2.99, −0.51)0.64 (−1.11, 2.39) *
Fatigue1.39 (0.10, 2.68)1.26 (−0.64, 3.16)−0.83 (−2.12, 0.45)−1.46 (−3.33, 0.41)2.35 (1.03, 3.68)0.85 (−1.03, 2.72)
Sleep disturbance1.09 (−0.13, 2.31)1.72 (−0.09, 3.53)−1.16 (−2.38, 0.07)−0.31 (−2.09, 1.47)1.72 (0.46, 2.99)0.57 (−1.22, 2.34)
Mental
Anxiety2.30 (1.10, 3.49)1.57 (−0.20, 3.33)−1.00 (−2.20, 0.20)−0.62 (−2.36, 1.12)1.87 (0.63, 3.11)0.42 (−1.32, 2.16)
Depression0.95 (−0.23, 2.13)1.28 (−0.46, 3.02)−1.06 (−2.24, 0.12)−0.39 (−0.22, 3.20)0.92 (−0.30, 2.14)0.23 (−1.49, 1.95)
Positive affect−0.40 (−1.58, 0.78)−0.73 (−2.48, 1.02)1.44 (0.27, 2.62)1.49 (−0.22, 3.20)−0.56 (−1.80, 0.66)0.11 (−1.61, 1.84)
Emotional dyscontrol2.03 (0.64, 3.42)1.58 (−0.47, 3.63)−1.63 (−3.02, −0.25)0.50 (−1.51, 2.52)2.16 (0.72, 3.59)1.16 (−0.87, 3.17)
Stigma 1.04 (0.01, 2.08)0.86 (−0.68, 2.40)0.15 (−0.89, 1.19)−0.40 (−1.91, 1.11)1.11 (0.04, 2.19)0.23 (−1.29, 1.75)
Cognitive function −1.67 (−3.16, −1.17)−1.38 (−3.59, 0.84)0.76 (−0.74, 2.26)0.26 (−1.92, 2.43)−3.20 (−4.74, −1.67)−0.89 (−3.06, 1.28)
Communicationa−0.53 (−1.01, −0.05)−0.42 (−1.13, 0.29)0.01 (−0.47, 0.50)0.12 (−0.58, 0.82)−0.56 (−1.06, −0.07)−0.39 (−1.10, 0.31)
Social
Participation −1.29(−2.29, −0.28)−0.89 (−2.37, 0.59)1.29 (0.29, 2.29)1.26 (−0.20, 2.71)−1.52 (−2.55, −0.49)−0.99 (−2.45, 0.47)
Satisfaction −0.99 (−1.90, −0.09)−0.62 (−1.95, 0.71)0.83 (−0.08, 1.72)1.11 (−0.20, 2.42)−1.24 (−2.18, −0.31)−0.48 (−1.80, 0.83)
(C)
SupplementsPhysical Activity
Vitamin D Omega−3ModerateActive
QoLRRMSProgMSRRMSProgMSRRMSProgMSRRMSProgMS
Physical
Mobility0.01 (−1.22, 1.24)0.40 (−1.20, 2.01)0.35 (−0.52, 1.25)0.33 (−0.94, 1.60)1.41 (0.19, 2.63)−0.31 (−1.88, 1.25)3.07 (2.04, 4.09)1.49 (0.05, 2.94)
Fine motor−0.39 (−2.05, 1.28)1.80 (−0.37, 3.97)−0.34 (−1.54, 0.86)0.76 (−0.96, 2.47)0.93 (−0.74, 2.61)−0.77 (−2.92, 1.38)2.45 (1.05, 3.86)−0.71 (−2.70, 1.27) *
Fatigue−1.57 (−3.35, 0.21)−0.92 (−3.24, 1.41)−0.61 (−1.90, 0.67)−0.91 (−2.75, 0.92)−1.48 (−3.25, 0.29)−1.35 (−3.63, 0.93)−4.14 (−5.63, −2.65)−2.11 (−4.21, −0.01)
Sleep disturbance−0.52 (−2.22, 1.17)−0.52 (−2.73, 1.70)−0.39 (−1.61, 0.83)−0.74 (−2.49, 1.01)−1.20 (−2.91, 0.51)−1.64 (−3.84, 0.55)−2.37 (−3.80, −0.94)−1.54 (−3.56, 0.48)
Mental
Anxiety0.12 (−1.53, 1.79)−1.05 (−3.22, 1.12)0.39 (−0.89, 1.50)−0.48 (−2.19, 1.23)−1.97 (−3.64, −0.31)−1.66 (−3.79, 0.48)−2.92 (−4.32, −1.52)0.37 (−1.60, 2.34) *
Depression−0.42 (−2.05, 1.22)−0.28 (−2.41, 1.85)0.38 (−0.80, 1.55)0.05 (−1.63, 1.73)−2.02 (−3.65, −0.39)−1.47 (−3.56, 0.62)−3.67 (−5.04, −2.30)−0.50 (−2.43, 1.43) *
Positive affect0.37 (−1.26, 2.01)−0.82 (−2.95, 1.31)−0.09 (−1.26, 1.09)−0.05 (−1.74, 1.63)2.51 (0.89, 4.13)2.61 (0.52, 4.69)4.35 (2.99, 5.71)0.59 (−1.32, 2.50) *
Emotional dyscontrol−0.28 (−2.20, 1.65)−1.09 (−3.60, 1.42)0.43 (−0.95, 1.82)0.30 (−1.68, 2.28)−1.27 (−3.41, 0.66)−2.15 (−4.63, 0.33)−3.11 (−4.73, −1.49)0.05 (−2.33, 2.24) *
Stigma −0.61 (−2.05, 0.83)−1.28 (−3.15, 0.60)0.41 (−0.61, 1.45)−0.23 (−1.71, 1.25)−2.30 (−3.73, −0.86)−1.51 (−3.36, 0.33)−3.11 (−4.32, −1.90)−0.30 (−2.01, 1.40) *
Cognitive function1.15 (−0.92, 3.23)2.00 (−0.70, 4.70)−0.07 (−1.56, 1.42)1.39 (−0.75, 3.52)1.49 (−0.60, 3.57)3.17 (0.50, 5.85)2.85 (1.10, 4.60)1.11 (−1.37, 3.57)
Communication a0.12 (−0.56, 0.78)0.73 (−0.14, 1.60)−0.28 (−0.76, 0.20)0.42 (−0.26, 1.11)0.37 (−0.30, 1.04)0.93 (0.07, 1.79)0.80 (0.23, 1.36)0.30 (−0.49, 1.10)
Social
Social participation0.69 (−0.70, 2.08)0.82 (−1.00, 2.63)−0.06 (−1.06, 0.94)0.44 (−0.99, 1.87)1.29 (−0.10, 2.70)0.95 (−0.83, 2.74)2.97 (1.81, 4.14)0.80 (−0.84, 2.45) *
Social satisfaction 1.01 (−0.24, 2.26)0.32 (−1.31, 1.95)0.73 (−0.16, 1.64)0.10 (−1.19, 1.39)1.64 (0.41, 2.89)1.49 (−0.09, 3.08)3.71 (2.67, 4.75)1.20 (−0.25, 2.66) *
ProgMS = progressive MS; QoL = quality of life; RRMS = relapsing-remitted MS; a Total raw score. Multivariate linear regression estimating adjusted regression coefficients (95% CI). Models adjusted for age, sex, BMI, education, disability, and duration since MS diagnosis. Bold values in (A) indicate significant (p < 0.05) associations between diet and QoL domains. Bold values in (B) indicate significant (p < 0.05) associations between wellness and QoL domains. Bold values in (C) indicate significant (p < 0.05) associations between physical activity and QoL subdomains. * Significant (* p < 0.05) difference between RRMS and ProgMS.
Publisher’s Note: MDPI stays neutral with regard to jurisdictional claims in published maps and institutional affiliations.

