Article

Variation in the Mercury Concentrations and Greenhouse Gas Emissions of Pristine and Managed Hemiboreal Peatlands

1
Latvian State Forest Research Institute ‘Silava’ (LSFRI Silava), Rigas Str. 111, LV-2169 Salaspils, Latvia
2
Department of Environmental Science, Faculty of Geography and Earth Sciences, University of Latvia, Jelgavas Str.1, LV-1004 Riga, Latvia
*
Author to whom correspondence should be addressed.
Land 2022, 11(9), 1414; https://doi.org/10.3390/land11091414
Submission received: 11 August 2022 / Revised: 24 August 2022 / Accepted: 25 August 2022 / Published: 28 August 2022

Abstract

:
We assessed total mercury (THg) concentrations and greenhouse gas (GHG) emissions in pristine and managed hemiboreal peatlands in Latvia, aiming to identify environmental factors that potentially affect their variation. The THg concentrations in soil ranged from <1 µg kg−1 to 194.4 µg kg−1. No significant differences between THg concentrations in disturbed and undisturbed peatlands were found, however, the upper soil layer in the disturbed sites had significantly higher THg concentration. During May–August, the mean CO2 emissions (autotrophic and heterotrophic respiration) from the soil ranged from 20.1 ± 5.0 to 104.6 ± 22.7 mg CO2-C m−2 h−1, N2O emissions ranged from −0.97 to 13.4 ± 11.6 µg N2O-N m−2 h−1, but the highest spatial variation was found for mean CH4 emissions—ranging from 30.8 ± 0.7 to 3448.9 ± 1087.8 µg CH4-C m−2 h−1. No significant differences in CO2 and N2O emissions between disturbed and undisturbed peatlands were observed, but CH4 emissions from undisturbed peatlands were significantly higher. Complex impacts of environmental factors on the variation of THg concentrations and GHG emissions were identified, important for peatland management to minimize the adverse effects of changes in the biogeochemical cycle of the biophilic elements of soil organic matter and contaminants, such as Hg.

1. Introduction

Organic soils, formed where the intensity of decomposition is lower than the production of organic matter, comprise approximately 2% of the ice-free land surface globally, and their majority is wetlands. Relatively pristine organic soils still occur in peatlands in northern European countries, mostly in Norway, Sweden and Finland [1]. Peatlands, which cover 4.23 million km2 worldwide, are terrestrial ecosystems (a type of wetlands) with or without vegetation that have naturally accumulated at least a 30-cm-thick layer of peat, formed from carbon-rich dead and decaying plant material under permanent water saturation and low oxygen (O2) conditions. In Europe, more than half of the soil organic carbon (C) stocks are present in peatlands [2]. Historically, a substantial area of peatlands has been drained for production purposes such as agriculture, forestry, grazing and peat extraction [3,4,5]. In Latvia, drained organic soils comprise 628.6 kha in total, including 425.1 kha of forest land, 39.7 kha of wetlands (peat extraction fields), 76.0 kha of grassland, 78.6 kha of cropland and 9.3 kha of settlements [6].
Peatlands provide many important ecosystem services, including water supply regulation and flood risk mitigation, global biodiversity preservation, climate change mitigation and material for energy production and recreation [4]. Peatlands play an important role in the control of atmospheric greenhouse gases (GHGs) such as carbon dioxide (CO2), methane (CH4) and nitrous oxide (N2O) and thus affect global climate change [7,8,9]. The dynamics of C balance and GHG flux in peatlands depend greatly on peatland hydrology [3]. Peatlands usually act as long-term C and GHG sinks [3,9,10,11]. In the anaerobic zones of submerged soils, CH4 is produced by methanogens and substantial quantities of C are emitted as CH4 in the terminal step of anaerobic organic matter mineralization [3,5,12]. Drainage immediately decreases the ground water (GW) level [13], which increases the availability of O2 and stops anaerobic decomposition and the associated emission of CH4 by decreasing CH4 production and increasing the oxidation of CH4 into CO2 by methanotrophs [3,12,14,15,16]. At the same time, aeration results in the aerobic decomposition of peat, releasing CO2 and N2O into the atmosphere [17]. Unmanaged peatlands generally emit negligible N2O [3], but after drainage, N2O emissions increase, especially in fertile sites such as nitrogen-rich minerotrophic peatlands [3,18,19] due to nitrification, a process that produces nitrate and N2O as by-products in oxic conditions [16].
The soil becomes a source of net GHG emissions when C and nitrogen (N) loss through organic matter decomposition is not balanced by input via biomass mortality. Soil respiration, especially heterotrophic respiration, is a major cause of soil C loss [20,21,22], while the main soil C input source is aboveground litter and fine root turnover [23]. Soil respiration and C input are mainly affected by the soil temperature, moisture regime and fertility [14,18,24,25,26], indicated by the share of organic matter [27] and the C/N ratio [28]. Heterotrophic CO2 emissions correlate with soil bulk density [18] and chemical composition, which determine the rate of organic matter decomposition [29]. Furthermore, a low C/N ratio increases soil N2O emissions [30,31], while the soil moisture regime, which is affected by GW level, influences the balance between CH4 emissions and removal via methanogenesis and methanotrophy [32].
In Latvia, most of the knowledge about the effect of peatland management on GHG emissions and C sequestration is recent and incomplete, especially concerning the most appropriate peatland management measures to mitigate climate change. There is evidence that draining peatlands does not necessarily reduce the soil C sink. Establishing a forest site of Myrtillosa turf. mel. with moderate nutrient-rich drained organic soil did not reduce the soil C stock of the former transitional mire, indicating that C stock can increase after drainage due to an increased above- and below-ground litter production [33]. In addition, direct GHG emission measurements with the chamber method revealed a neutral impact of draining nutrient-poor forest organic soils on GHG emissions [34]. In forest sites with nutrient-rich organic soil in Latvia, drained soil is not necessarily a source of CH4 emissions, while the estimated CH4 emissions from naturally wet soils are highly variable. Soil becomes a source of CH4 emissions when the GW level decreases below 20 cm, while the difference in N2O emissions from drained and naturally wet sites is not significant [35].
Another important environmental issue in the research focus on peatlands is the large store of mercury (Hg) in them that could function as a Hg source for over a century [36] even if deposition of Hg is significantly reduced [37]. Peatlands are often considered biogeochemical hot spots [38,39] of Hg transformation through biotic methylation processes, and they are significant sources of methylmercury (MeHg) to hydrologically connected aquatic ecosystems such as streams and lakes (e.g., [36,40,41,42,43,44,45]). However, a precondition of higher MeHg concentrations is elevated total Hg (THg) pools in peatlands, mostly resulting from increased atmospheric Hg deposition over the decades [46,47] and the high affinity of soil organic matter (SOM) to Hg, as well as abundant reduced sulphur (S) sites on organic matter molecules that provide strong binding sites for Hg [48]. One of the main pathways of Hg deposition is the wet and dry deposition of oxidized atmospheric Hg (Hg2+) by precipitation directly onto soils or indirectly from plant surfaces via throughfall [49,50]. In terrestrial ecosystems, litterfall has been revealed as the main pathway for the atmosphere–surface transfer of Hg [51,52]. After its deposition through litterfall, biogeochemical reactions limited by different environmental factors determine the further transformation and flow of Hg in ecosystems [52]. Concerns in Latvia have been raised over Hg concentrations in freshwater biota exceeding the threshold of 0.02 mg kg−1 (wet weight) set by the national environmental quality standard (Regulations Regarding the Quality of Surface Waters and Groundwaters) [53].
This study sought to compare GHG emissions and the THg concentration in the soil of undisturbed (pristine) and disturbed (managed) peatlands to examine the effect of management and identify the environmental parameters including soil general chemistry and vegetation composition affecting these aspects. In the context of this research, disturbed peatlands are peatlands where anthropogenic influences, such as drainage for agriculture, forestry or peat extraction, have lowered the originally high GW level and changed the vegetation composition. We hypothesize that peatland management is one of the major factors influencing both studied environmental threats—GHG emissions and THg concentration in soil.

2. Materials and Methods
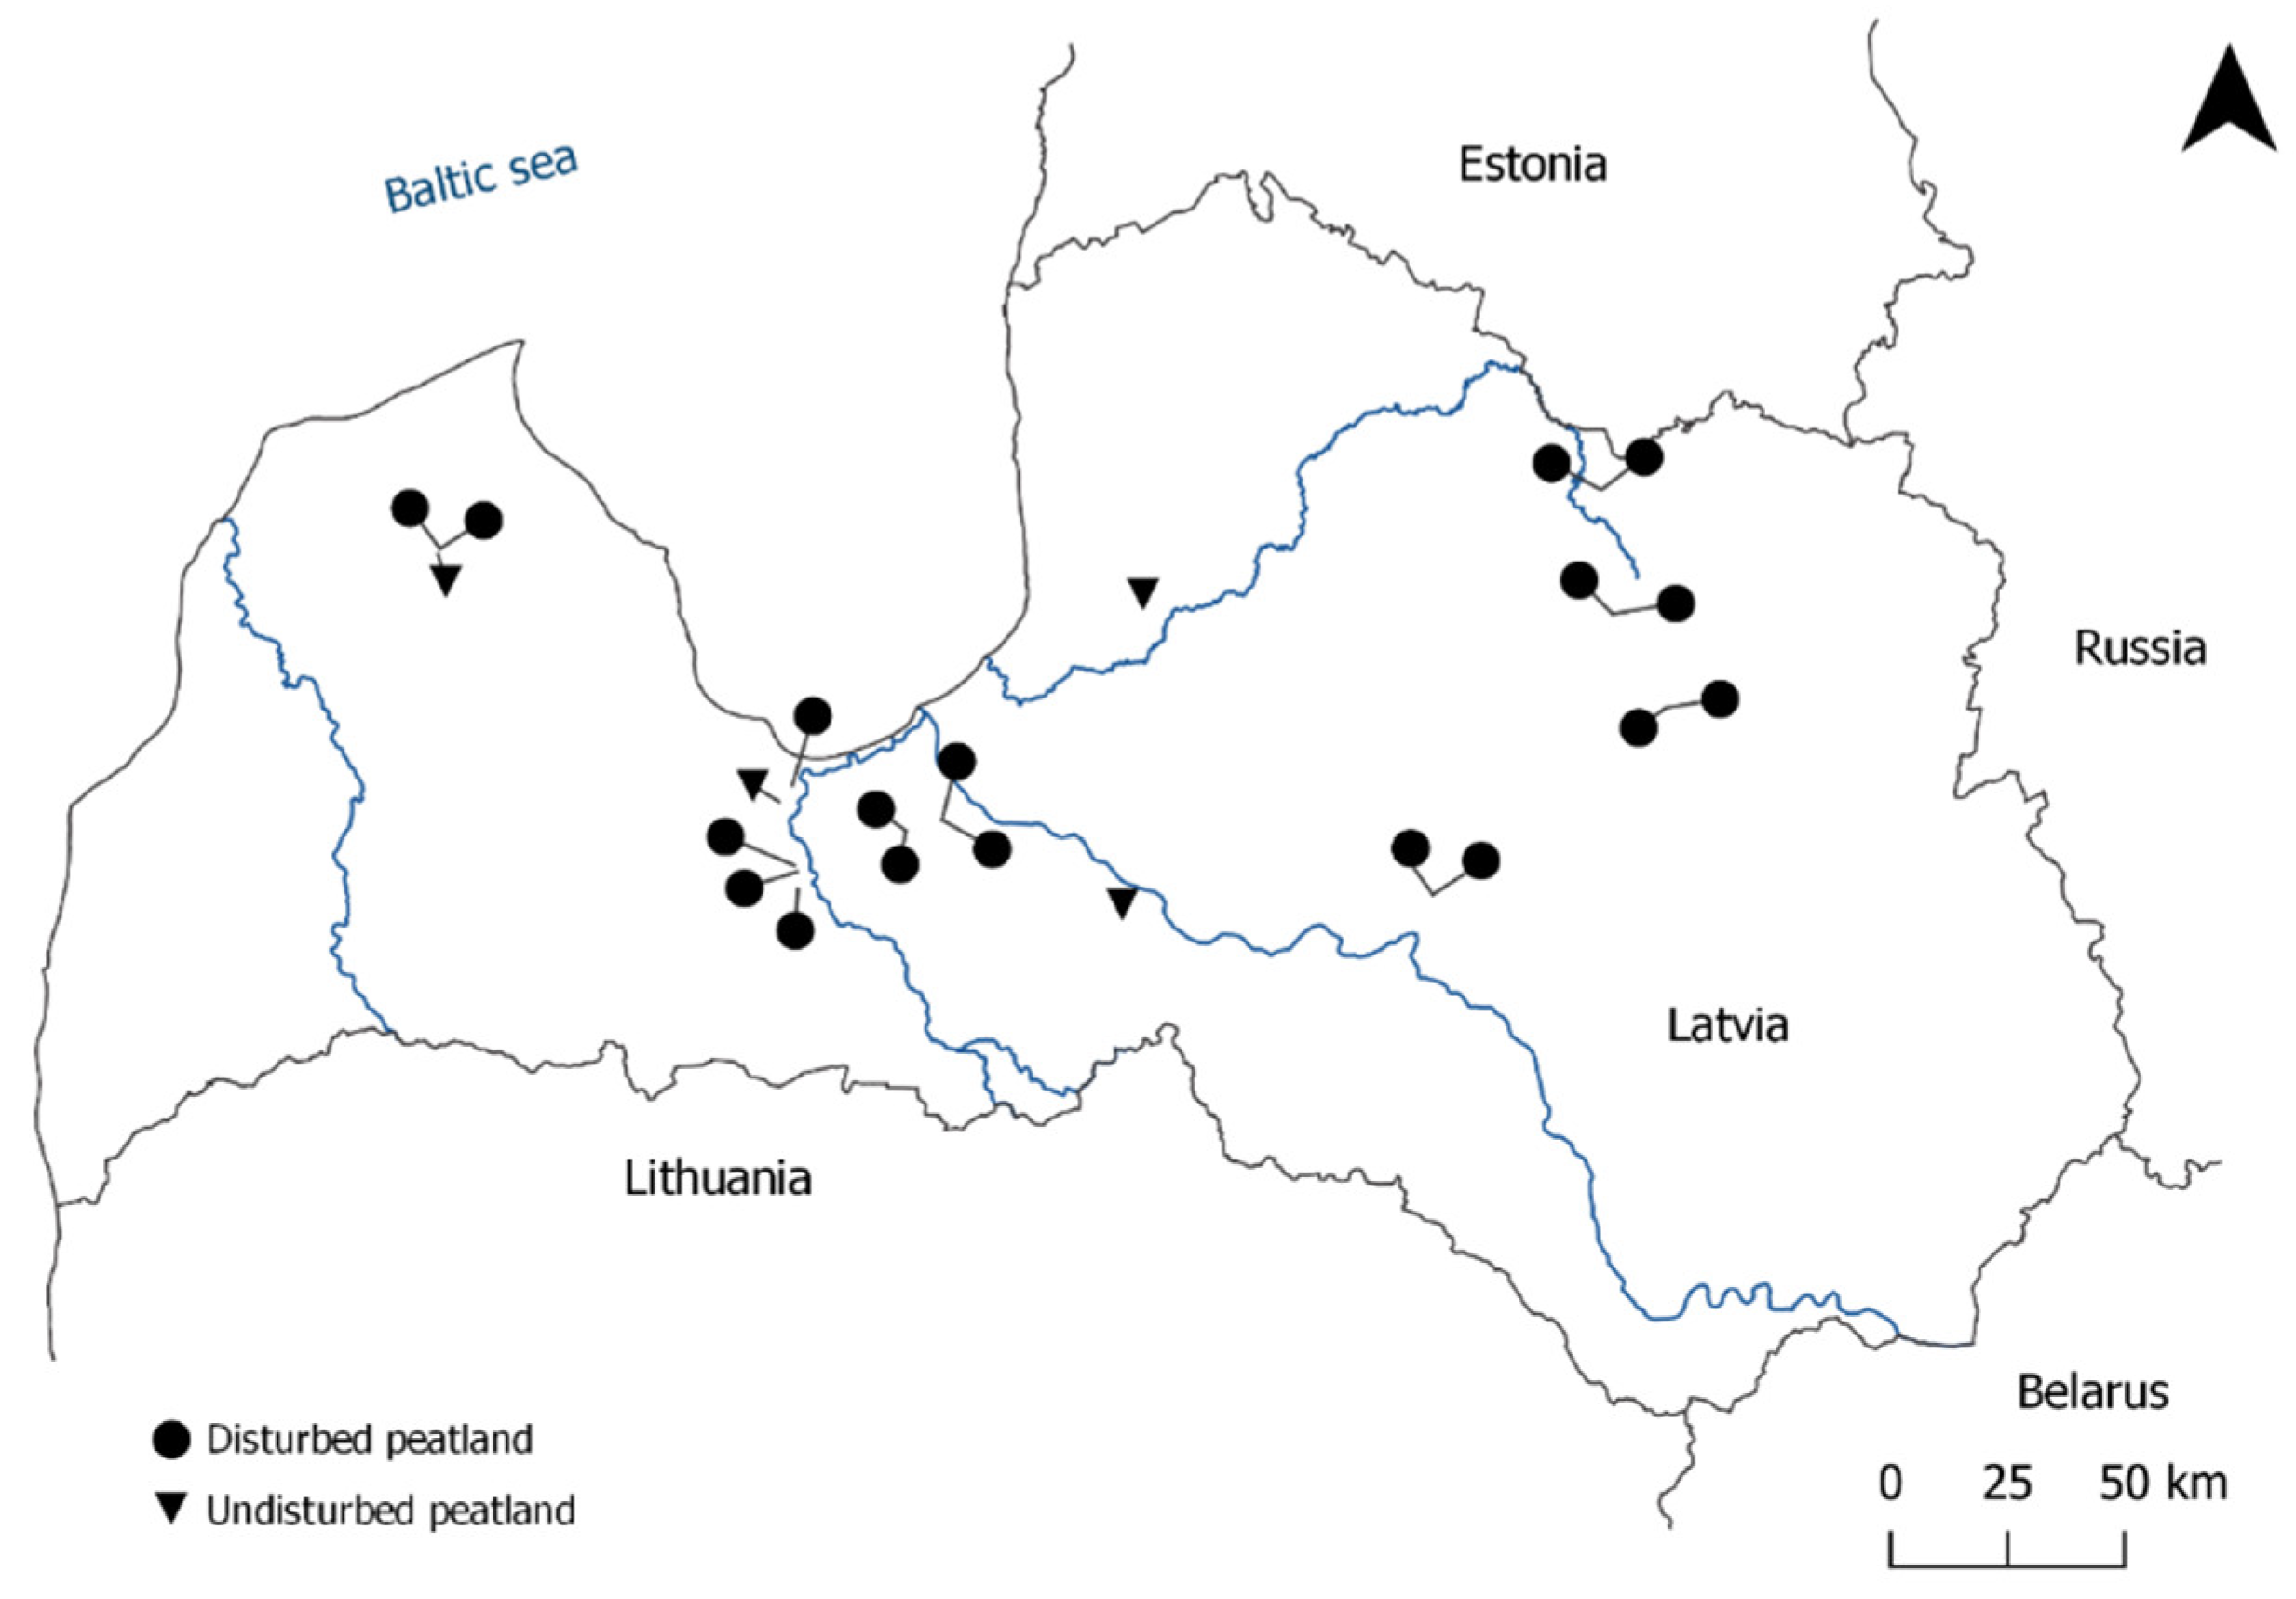
2.1. Research Sites

This study was conducted in 2019 in Latvia (in a hemiboreal zone). In Latvia, the mean annual precipitation in 2019 was 629.2 mm, which is 9% below the annual norm (692.3 mm). The mean annual air temperature in 2019 was +8.2 °C, the minimum mean monthly temperature was −4.0 °C (January 2019) and the maximum mean monthly temperature was 18.6 °C (June 2019) [54].
In total, 22 research sites were selected in peatlands located mostly in central and northern Latvia (Figure 1 and Figures S1–S11). At the research sites, the peat layer thickness was >50 cm.
In the context of this study, anthropogenic interventions that altered the natural peatland ecosystem, e.g., establishing drainage systems and lowering the GW level, extracting peat, using land for forestry and agricultural purposes and other management practices were considered disturbances. Undisturbed research sites were located in pristine (natural) peatland with no documented management history. In disturbed research sites, drainage systems (ditches) were established, and at most sites, peat had been extracted (Table 1).

2.2. GHG Sampling and Measurements

During the measurement period (May–August 2019), soil GHG flux monitoring was conducted with the closed opaque manual chamber method [55]. At each research site, five chamber collars were evenly distributed with at least 3 m between individual collars. The collars were installed in approximately 5 cm of soil at least one month before the collection of the first GHG flux samples. Root damage was avoided as much as possible and ground vegetation and the litter layer, if present, were left intact during collar installation and field surveys, therefore, the monitored GHG flux represents the total soil emissions, including the heterotrophic respiration and autotrophic respiration of above- and below-ground vegetation enclosed in the soil collar and chamber during GHG sampling. Once per month, 4 soil flux samples were taken from chambers at each of the collar positions within 30 min of each other (10 min between each sampling) after positioning chambers on the collars. Due to potential diurnal patterns of soil GHG emissions [55] dynamic schedule of study site visits were applied to randomise gas sample collection time of the day [56]. The samples were collected in 100 mL vials at 0.3 mbar underpressure and transported to the laboratory (University of Tartu) to be tested with gas chromatography [57].
During GHG sampling, several environmental factors were determined: the groundwater (GW) level was measured manually inside a PVC pipe installed up to 140 cm deep in the soil at each research site; soil moisture and temperature by measurement probe inserted 5 cm into the soil and the air (ambient) temperature was taken with Comet data logger with temperature sensor.

2.3. Soil Sampling and Chemical Analysis

To avoid disturbing the soil inside the GHG chamber collars, it was sampled at two fixed depths (0–10 cm and 50 cm) on the outside opposite sides of each of the five collars at the research site. To better represent each research site, soil composite samples were made to represent two depths at the research site level. The 0 cm reference was at the top of the peat layer (the H horizon). Soil samples were taken using a 50-cm-long stainless-steel soil sample probe, sterilized instruments and plastic containers. Soil sampling was conducted in June–August 2019. Soil samples were transported to the LVS EN ISO 17025:2018 accredited laboratory at the Latvian State Forest Research Institute Silava and were prepared for analyses according to the LVS ISO 11464:2005 standard.
The THg content in the soil samples was determined with thermal decomposition, amalgamation and atomic absorption spectrophotometry (Milestone DMA—80 AC-N) according to the United States Environmental Protection Agency (US EPA 7473). The soil sample analysis results of THg < 1 µg kg−1 (n = 5) were replaced by half of the method limit of detection (0.5 µg kg−1). The following parameters of general chemistry were determined: pH (KCl) according to the LVS EN ISO 10390:2022; organic C (OC, in g kg−1), total N (TN, in g kg−1) and total sulphur (TS, in mg kg−1) content was determined with the elementary analysis method per the LVS ISO 10694:2006, LVS ISO 13878:1998 and ISO 15178:2000, respectively; the HNO3-extractable phosphorus, potassium, calcium, magnesium and iron (respectively, P, K, Ca, Mg and Fe, in g kg−1) content was determined with the inductively coupled plasma-optical emission spectrometry (ICP-OES) method and the electrical conductivity (conductivity, in µS cm−1) was determined per the LVS ISO 11265:1994.
In addition, the OC/TN (C/N) ratio and OC/TS (C/S) ratios were calculated as proxies to characterize the decomposition of soil organic matter (SOM) [58,59]. To compare the Hg concentrations in soils and Hg storage, the relationships between THg and the major biophilic elements of the SOM (respectively, the THg/OC (Hg/C) ratio, the THg/TN (Hg/N) ratio and the THg/TS (Hg/S) ratio) were also calculated to overcome the effects of organic matter accumulation [51,52,58,60,61,62,63,64].

2.4. Vegetation Survey

A vegetation survey was conducted at all 22 research sites in summer (Table 1). At each study site, five circular sample plots were inventoried. The selected plots coincided with the edges of the installed chamber collars for GHG assessment. All vascular plant species, bryophytes and lichens were recorded, and the percentage coverages of each species were determined in the established plots. In total, 110 circular plots were described.

2.5. Statistical Analysis

A Wilcoxon rank-sum test with continuity correction was used to evaluate possible differences in THg concentrations, the values of the Hg/C, Hg/N and Hg/S ratios and the mean GHG emissions from the soil according to the pooled research soil in groups of management-induced disturbance and between soil depths (0–10 and 50 cm), with p < 0.05 considered significant. Correlations between THg concentrations, GHG emissions, the selected variables of soil general chemistry, environmental factors and vegetation cover were tested with Spearman’s ρ, using a significance level of p < 0.05.
Soil chemical variables, environmental factors and vegetation cover variables (X) were used to explain the variance of THg concentrations and GHG emissions from soil (Y) via partial least squares (PLS) regressions. PLS regression is a useful multivariate method to address chemical variables that are linearly related to each other as the method is robust against intercorrelations among X variables. In PLS, X variables are ranked according to their relevance to explaining Y, commonly expressed as variables important for projection (VIP values). VIP values exceeding 1.0 are considered important X variables [65,66,67].
Statistical analyses (Wilcoxon rank sum test with continuity correction, Spearman’s ρ and PLS) were performed with R [68]; the R package ‘mdatools’ was used for PLS. Figure 2 and Figure 3 were prepared with the R package ‘ggplot2’, Figure 4 was prepared with the R packages ‘corrplot’ and ‘Hmisc’, Figure 5 and Figure 6 were prepared with the R package ‘ggplot2’.
A canonical correspondence analysis (CCA) was applied to assess the differences in species composition related to environmental variables. The species abundance (per cent coverage) data were used in the ordination as the main matrix and the environmental variables—the research site (abandoned peat extraction site, commercial berry plantation or active peat extraction site and coniferous forest, grassland, raised bog, broad-leaved forest or transitional mire), THg, CH4, CO2, N2O, herbaceous cover, Sphagnum species coverage and total vegetation cover—as the second matrix. The CCA was carried out in PC-ORD 6 [69].

3. Results

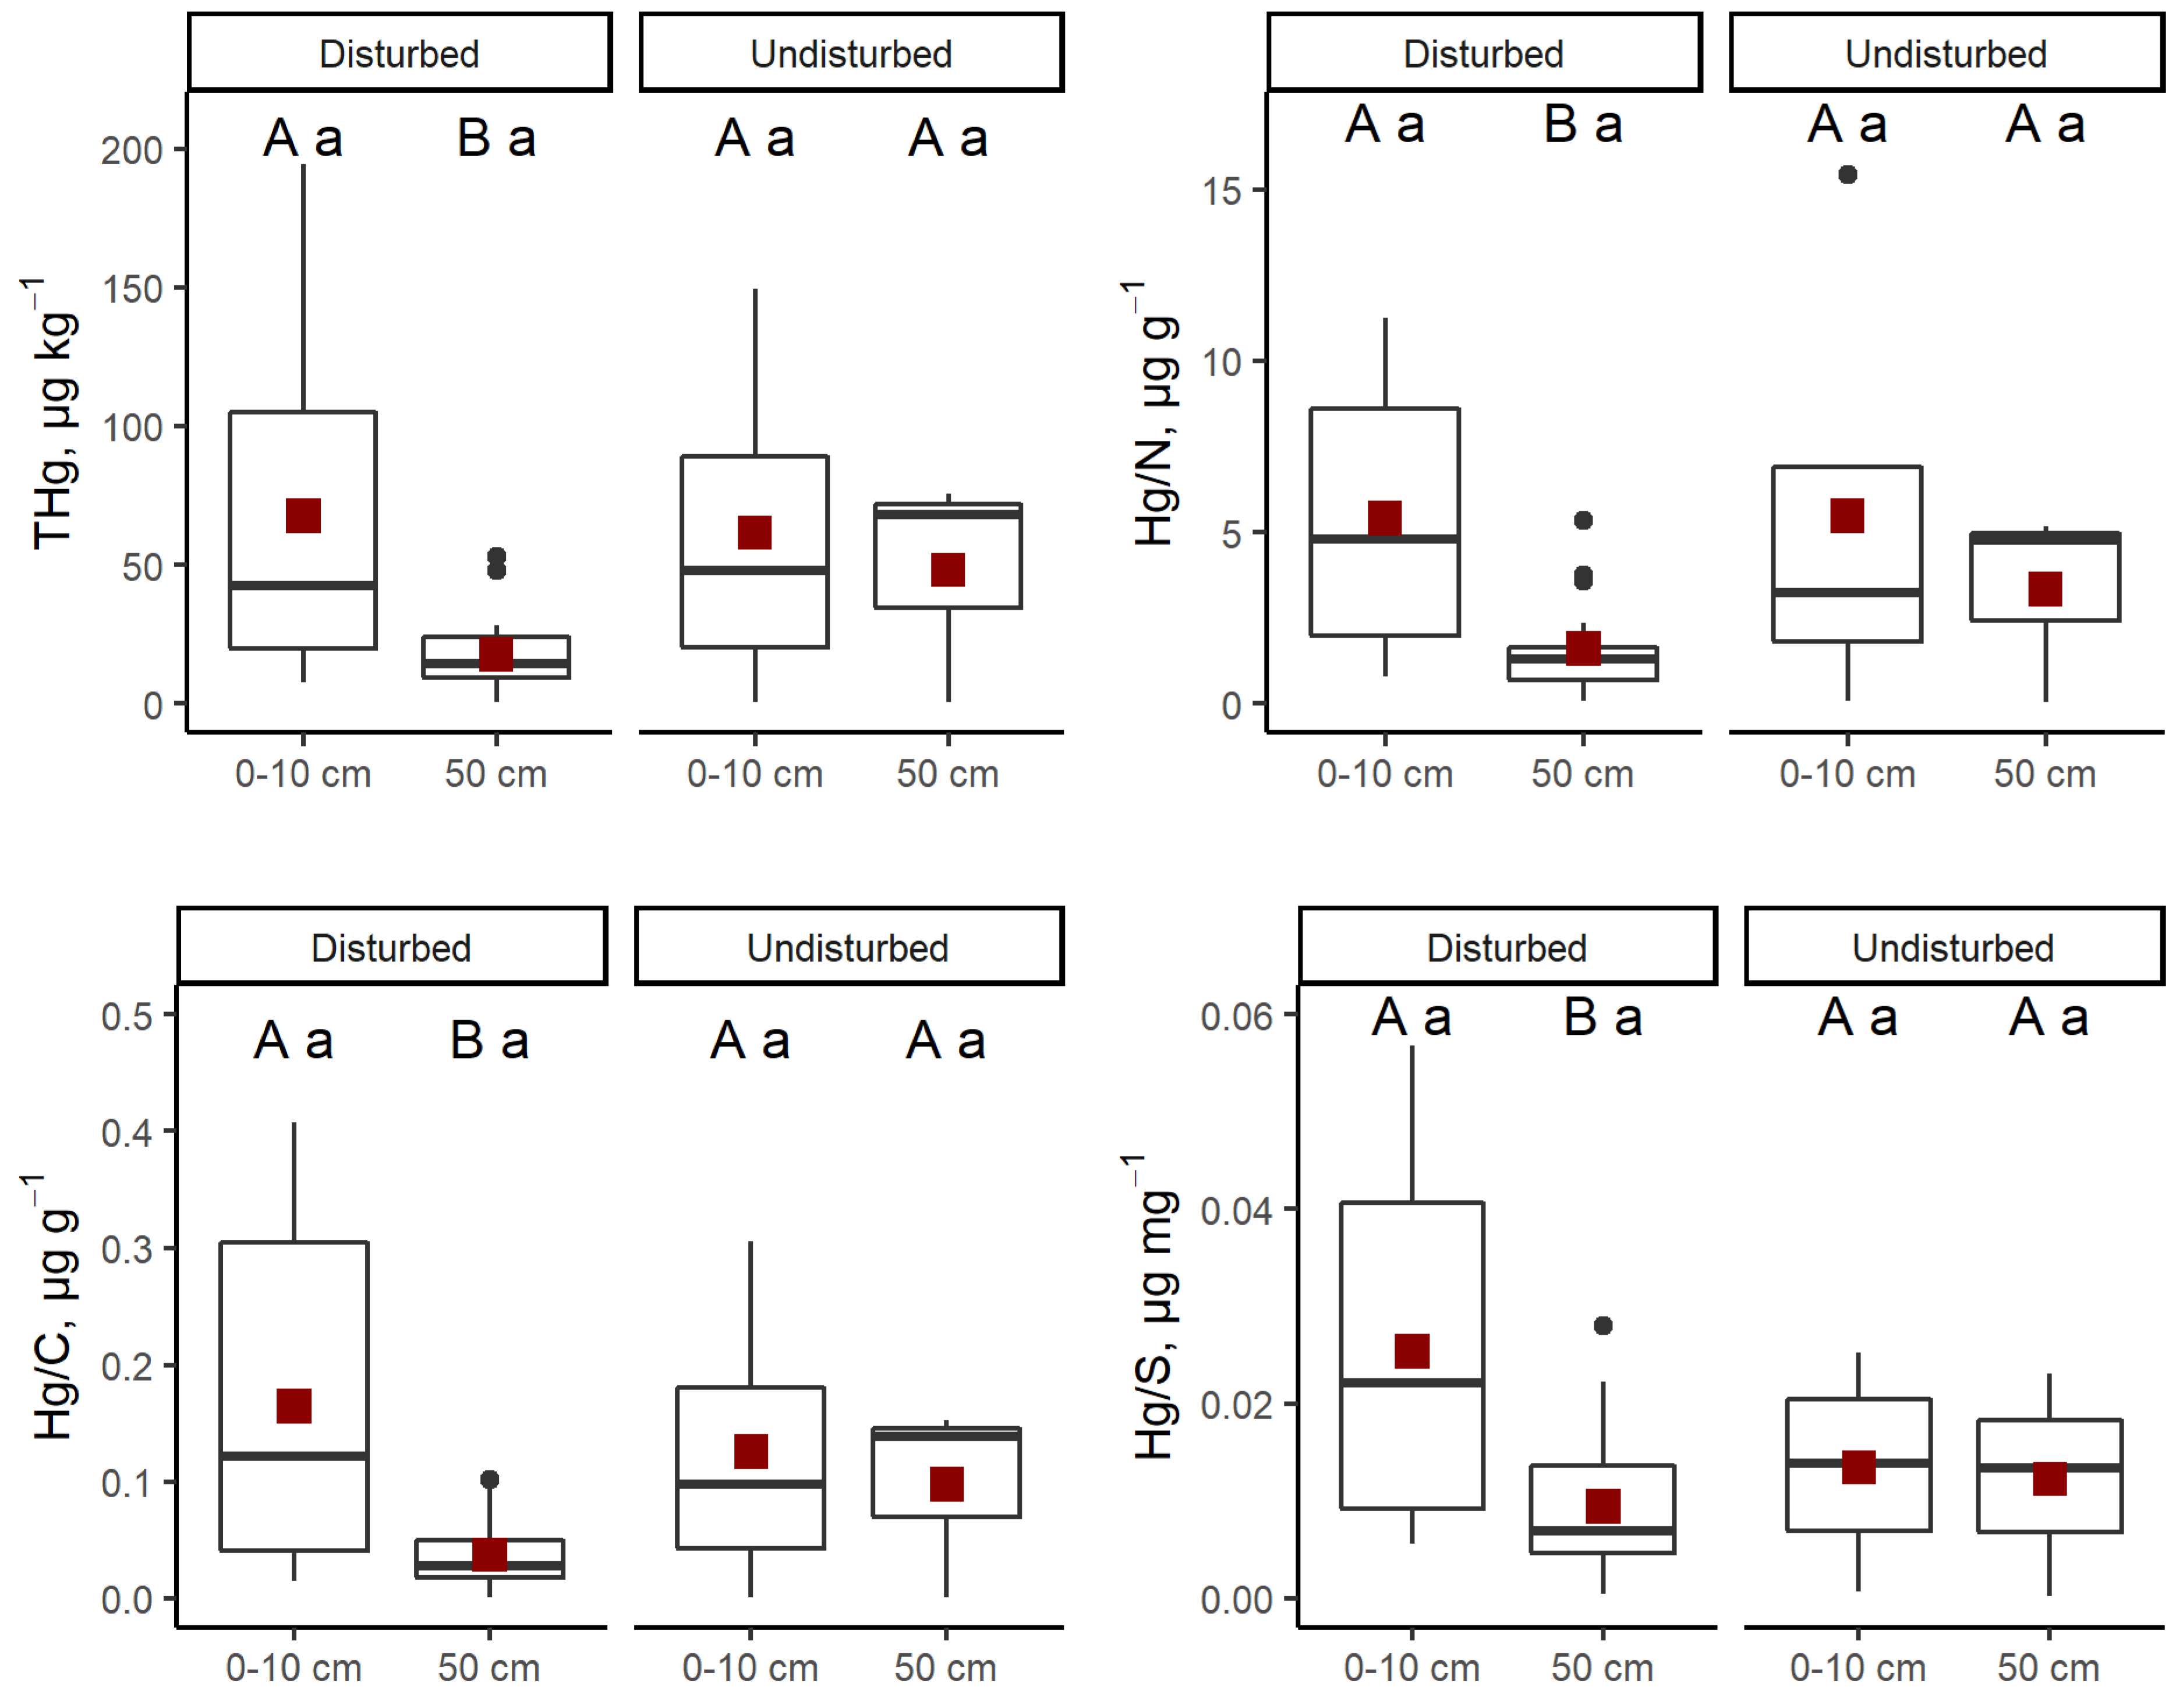
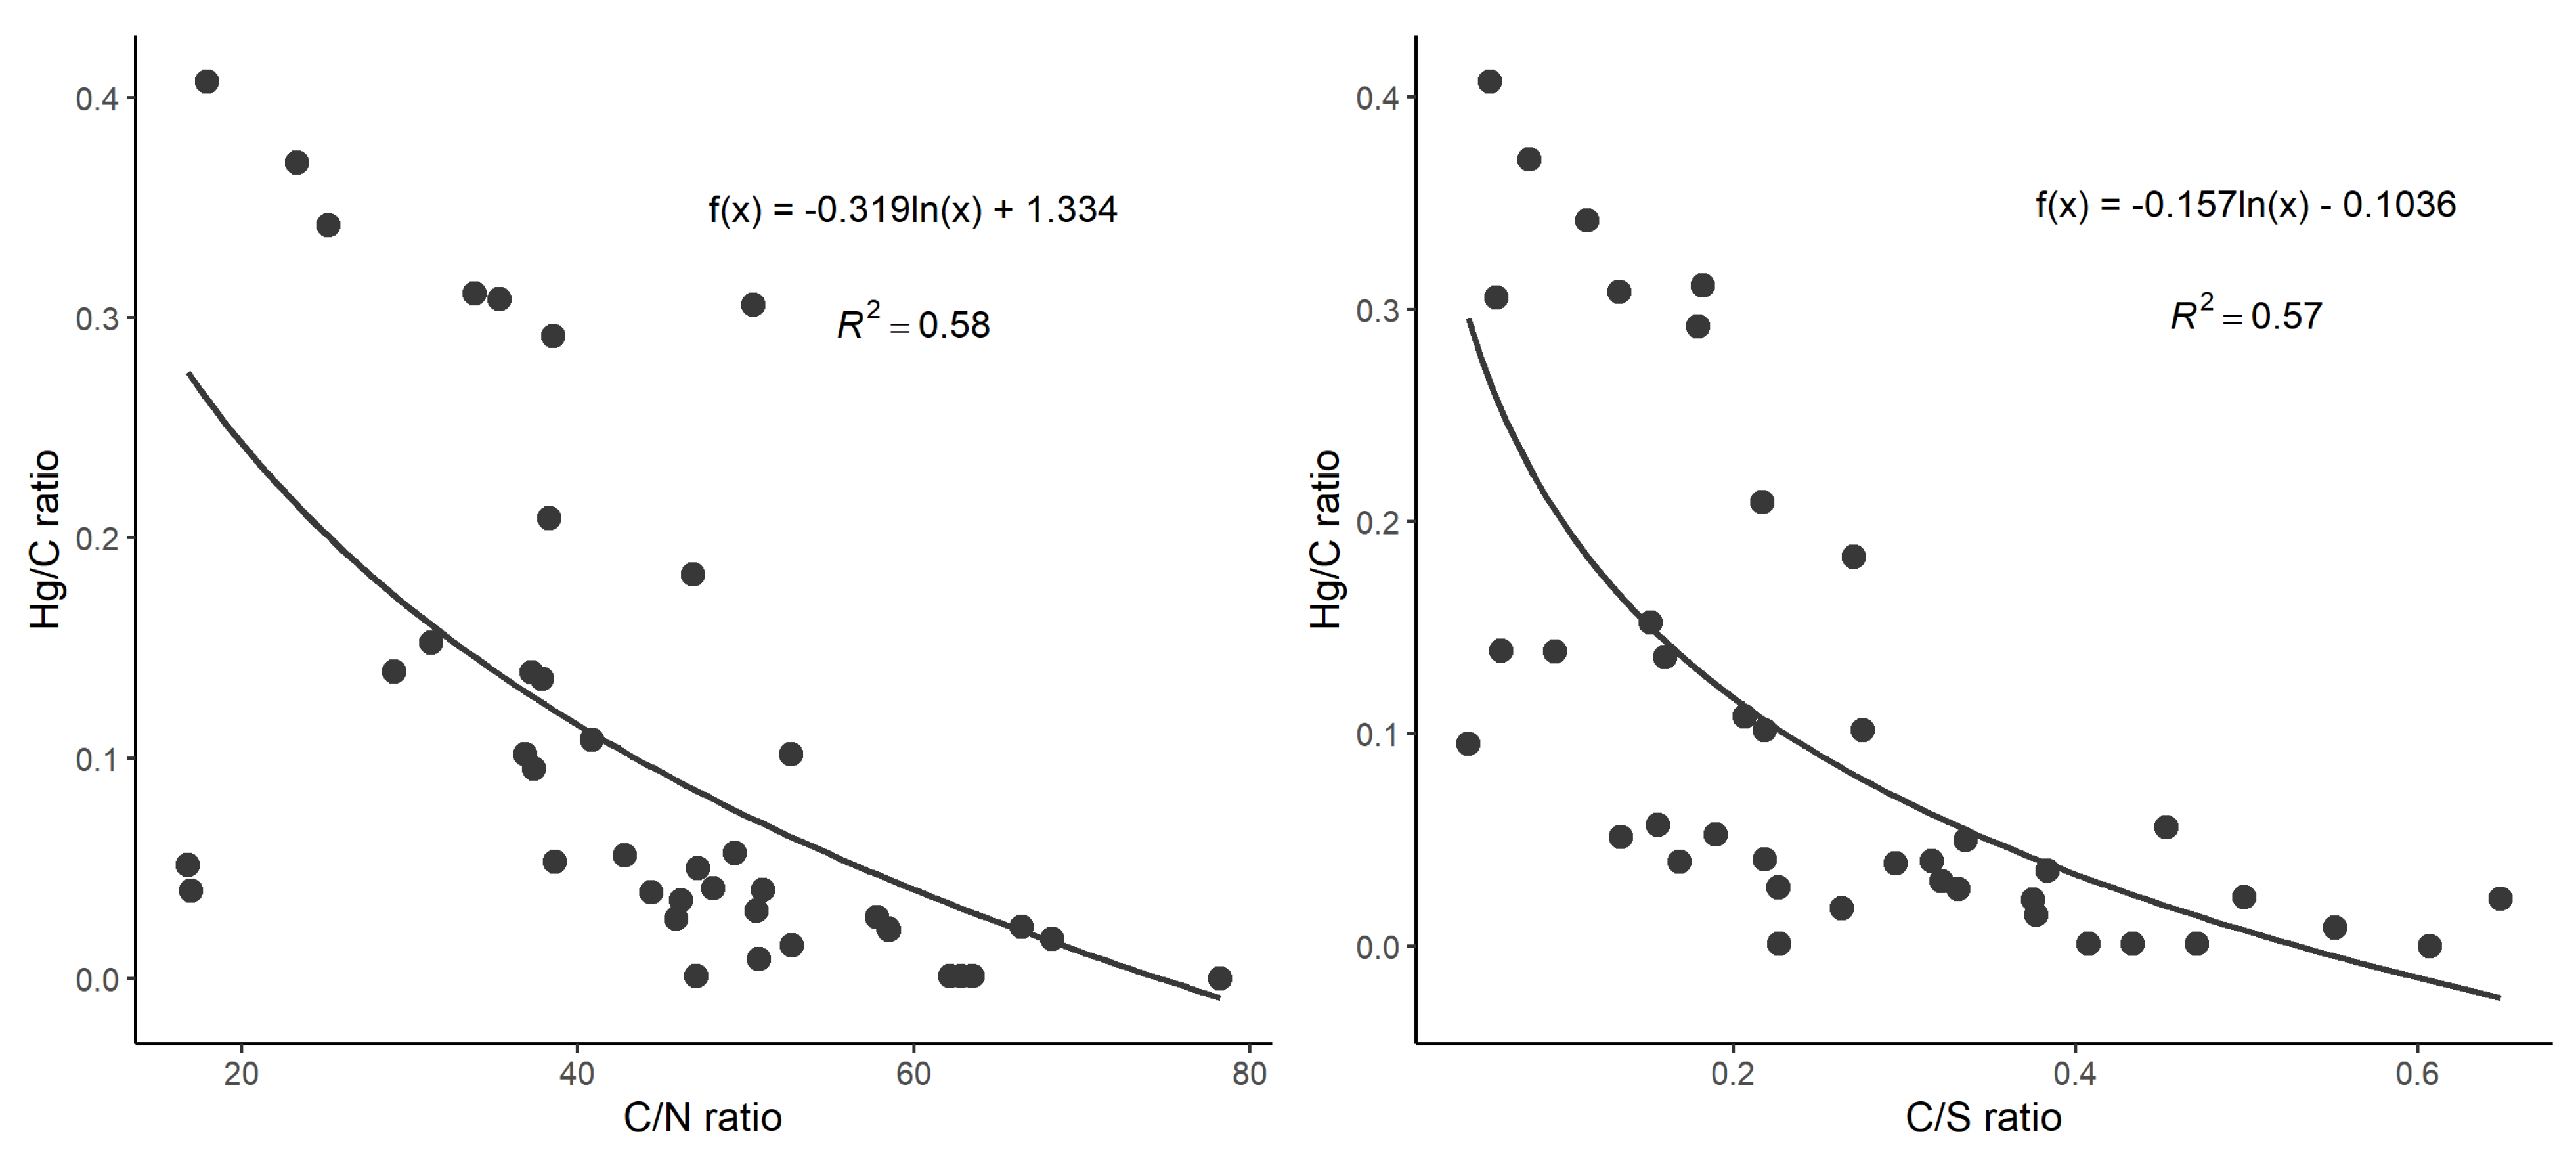
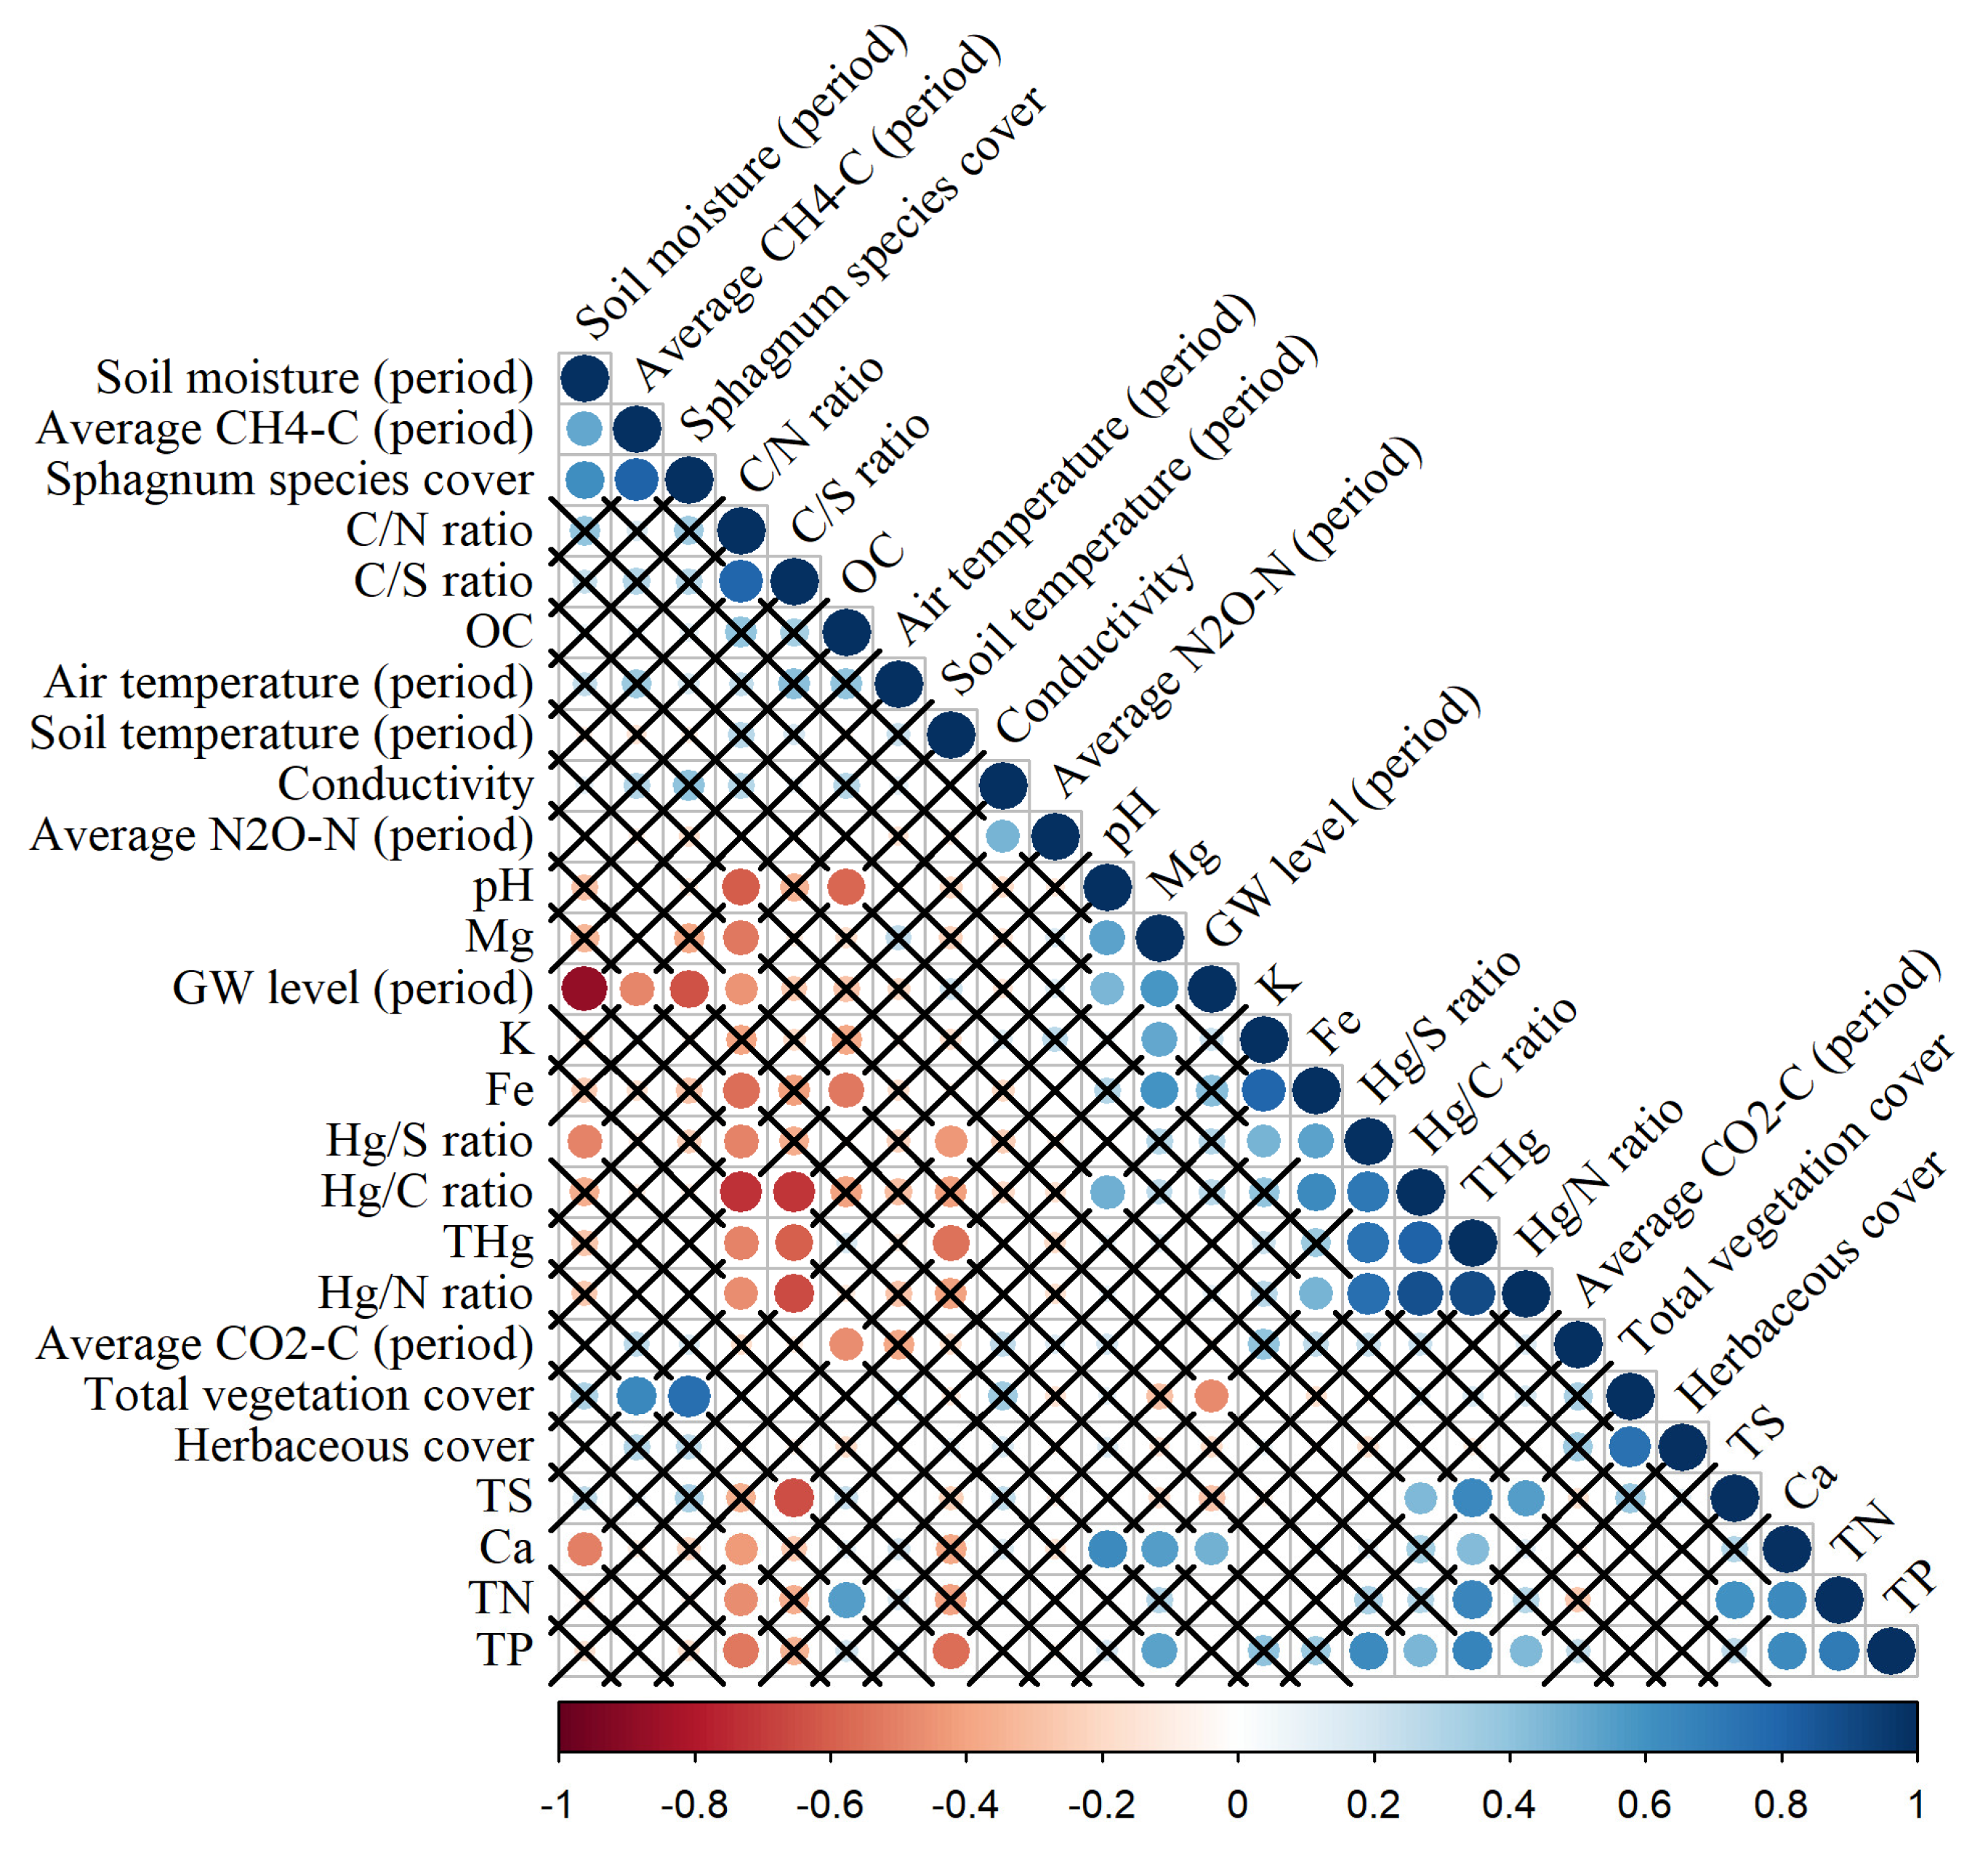
3.1. Management-Induced Disturbance and Environmental Factors’ Impact on the Soil THg Concentration

The spatial variation in soil THg concentrations at 0–10 cm deep across research sites was relatively high and ranged from <1 µg kg−1 in undisturbed pristine peatland (transitional mire) to 194.4 µg kg−1 in a research site disturbed by drainage that currently supports coniferous forest. At 50 cm deep, soil THg concentrations varied within a narrower range, from <1 µg kg−1 in both undisturbed and disturbed research sites to 75.8 µg kg−1 in undisturbed pristine peatland (raised bog). At the individual research site level, soil THg concentrations at 50 cm deep were mostly lower than at 0–10 cm deep, except at two disturbed research sites (an abandoned peat extraction site with ground vegetation and a commercial berry plantation) and one research site located in undisturbed pristine peatland (transitional mire). The difference between the soil THg concentrations at 0–10 cm and 50 cm deep (the concentration in the upper soil layer minus the concentration in the deeper soil layer), at each site, varied from −41.2 µg kg−1 in undisturbed pristine peatland (transitional mire) to 166.3 µg kg−1 in a research site disturbed by drainage and currently supporting a coniferous forest. When the mean THg concentrations in soil samples at 0–10 cm and 50 cm from all research sites were compared (Figure 2), statistically higher mean THg concentrations were found at 0–10 cm in disturbed research sites (67.6 ± 14.2 and 17.7 ± 3.7 µg kg−1, respectively, p = 0.004); the differences in mean THg concentrations at 0–10 cm and 50 cm deep in undisturbed research sites were not statistically significant. Neither at a depth of 0–10 cm nor at 50 cm were statistically significant differences in mean THg concentrations between disturbed and undisturbed research sites found (p = 0.902 and p = 0.313, respectively).
Figure 2. THg concentrations and relationships between Hg and the biophilic elements of soil organic matter (Hg/C, Hg/N and Hg/S ratios) in organic soil at 0–10 cm and 50 cm deep, grouped by management-induced disturbance. In the box plots, the median is shown by the bold line, the mean is shown by the dark red square, the box corresponds to the lower and upper quartiles, the whiskers show the minimal and maximal values (within 150% of the interquartile range from the median) and the black dots represent outliers of the datasets. Different uppercase letters show statistically significant differences (p < 0.05) between depths within the same group of management-induced disturbance; different lowercase letters show statistically significant differences (p < 0.05) between disturbed and undisturbed research sites within the same depth.
Land 11 01414 g002
At a depth of 0–10 cm, the mean value of the Hg/C ratio at all research sites was 0.16 ± 0.03 μg Hg g−1 C (up to 0.41 μg Hg g−1 C). At 50 cm, the Hg/C values occupied a narrower range (up to 0.15 μg Hg g−1 C), and the mean value at all research sites was 0.05 ± 0.01 μg Hg g−1 C. The mean value of the Hg/N ratio at all research sites was 5.42 ± 0.91 μg Hg g−1 N (from 0.08–15.42 μg Hg g−1 N) at a depth of 0–10 cm and 1.86 ± 0.39 μg Hg g−1 N (0.05–5.36 μg Hg g−1 N) at 50 cm. The mean value of the Hg/S ratio was 0.023 ± 0.004 μg Hg mg−1 S (up to 0.057 μg Hg mg−1 S) at 0–10 cm deep and 0.010 ± 0.002 μg Hg mg−1 S (up to 0.028 μg Hg mg−1 S) at 50 cm.
At both analysed depths, the management-induced disturbance was not identified as a factor that introduced significant variation in the Hg/C, Hg/N and Hg/S ratios. However, as was found for THg concentrations, comparing the mean values of the Hg/C, Hg/N and Hg/S ratios at 0–10 cm and 50 cm deep (Figure 2) revealed statistically higher mean ratio values at 0–10 cm in disturbed research sites (p = 0.002, p < 0.001, and p = 0.002, respectively). The differences in the mean values of the Hg/C, Hg/N and Hg/S ratios between 0–10 cm and 50 cm deep in undisturbed research sites were not statistically significant.
The relationships of the Hg/C ratio to the C/N and C/S ratios in the soil at 0–10 cm reflect a logarithmic increase of the Hg/C ratio with the decay of SOM (Figure 3). The Hg/C and the C/N and C/S ratios displayed negative significant correlations at 0–10 cm (Figure 3) and 50 cm deep.
Figure 3. Relationships of the Hg/C ratio to the C/N and C/S ratios in the soil at 0–10 cm deep.
Land 11 01414 g003
The general soil chemistry and GHG fluxes from the soil and vegetation cover of the peatlands were screened for relationships with the soil THg concentration (Figure 4). The soil THg concentration at 0–10 cm was positively correlated with TP (ρ = 0.66), TN (ρ = 0.65), TS (ρ = 0.65) and Ca concentrations (ρ = 0.43), but negatively correlated with the soil C/S ratio (ρ = −0.59), soil temperature during the measurement period (May–August) (ρ = −0.55) and the soil C/N ratio (ρ = −0.49) (Figure 4). Additionally, a PLS model revealed that the variation in the soil THg concentration at 0–10 cm between research sites was explained by soil chemistry parameters such as the TP, TN and TS concentrations and the soil C/S ratio (1.35 > VIP > 1.0), the soil temperature during the measurement period (VIP = 0.98) and the soil C/N ratio and Ca and Fe concentrations at 0–10 cm deep (VIP = 0.88, VIP = 0.77 and VIP = 0.65, respectively). The PLS model including these parameters had a goodness of fit (R2) of 0.66 and a goodness of prediction (Q2) of 0.57, indicating a moderate model. The variables that were negatively related to the THg concentration were the soil temperature during the measurement period and the C/S and C/N ratios.
Figure 4. Spearman’s correlations between the THg concentrations in soil at 0–10 cm deep, the mean GHG emissions from the soil during the measurement period (May–August 2019), the soil’s general physico-chemical parameters at 0–10 cm and different environmental factors and vegetation cover. Positive correlations are displayed in blue and negative correlations in red. Colour intensity and the size of the circle are proportional to the correlation coefficients. In the right side of the correlogram, the legend colour shows the correlation coefficients and the corresponding colours. Correlations with p > 0.05 are considered as insignificant (crosses are added).
Land 11 01414 g004
The soil THg concentration at 50 cm deep was positively correlated with CH4 emissions from the soil (ρ = 0.71) and the soil TS concentration at 50 cm (ρ = 0.59) but negatively correlated with the soil C/S ratio (ρ = −0.67) and the soil C/N ratio (ρ = −0.54).

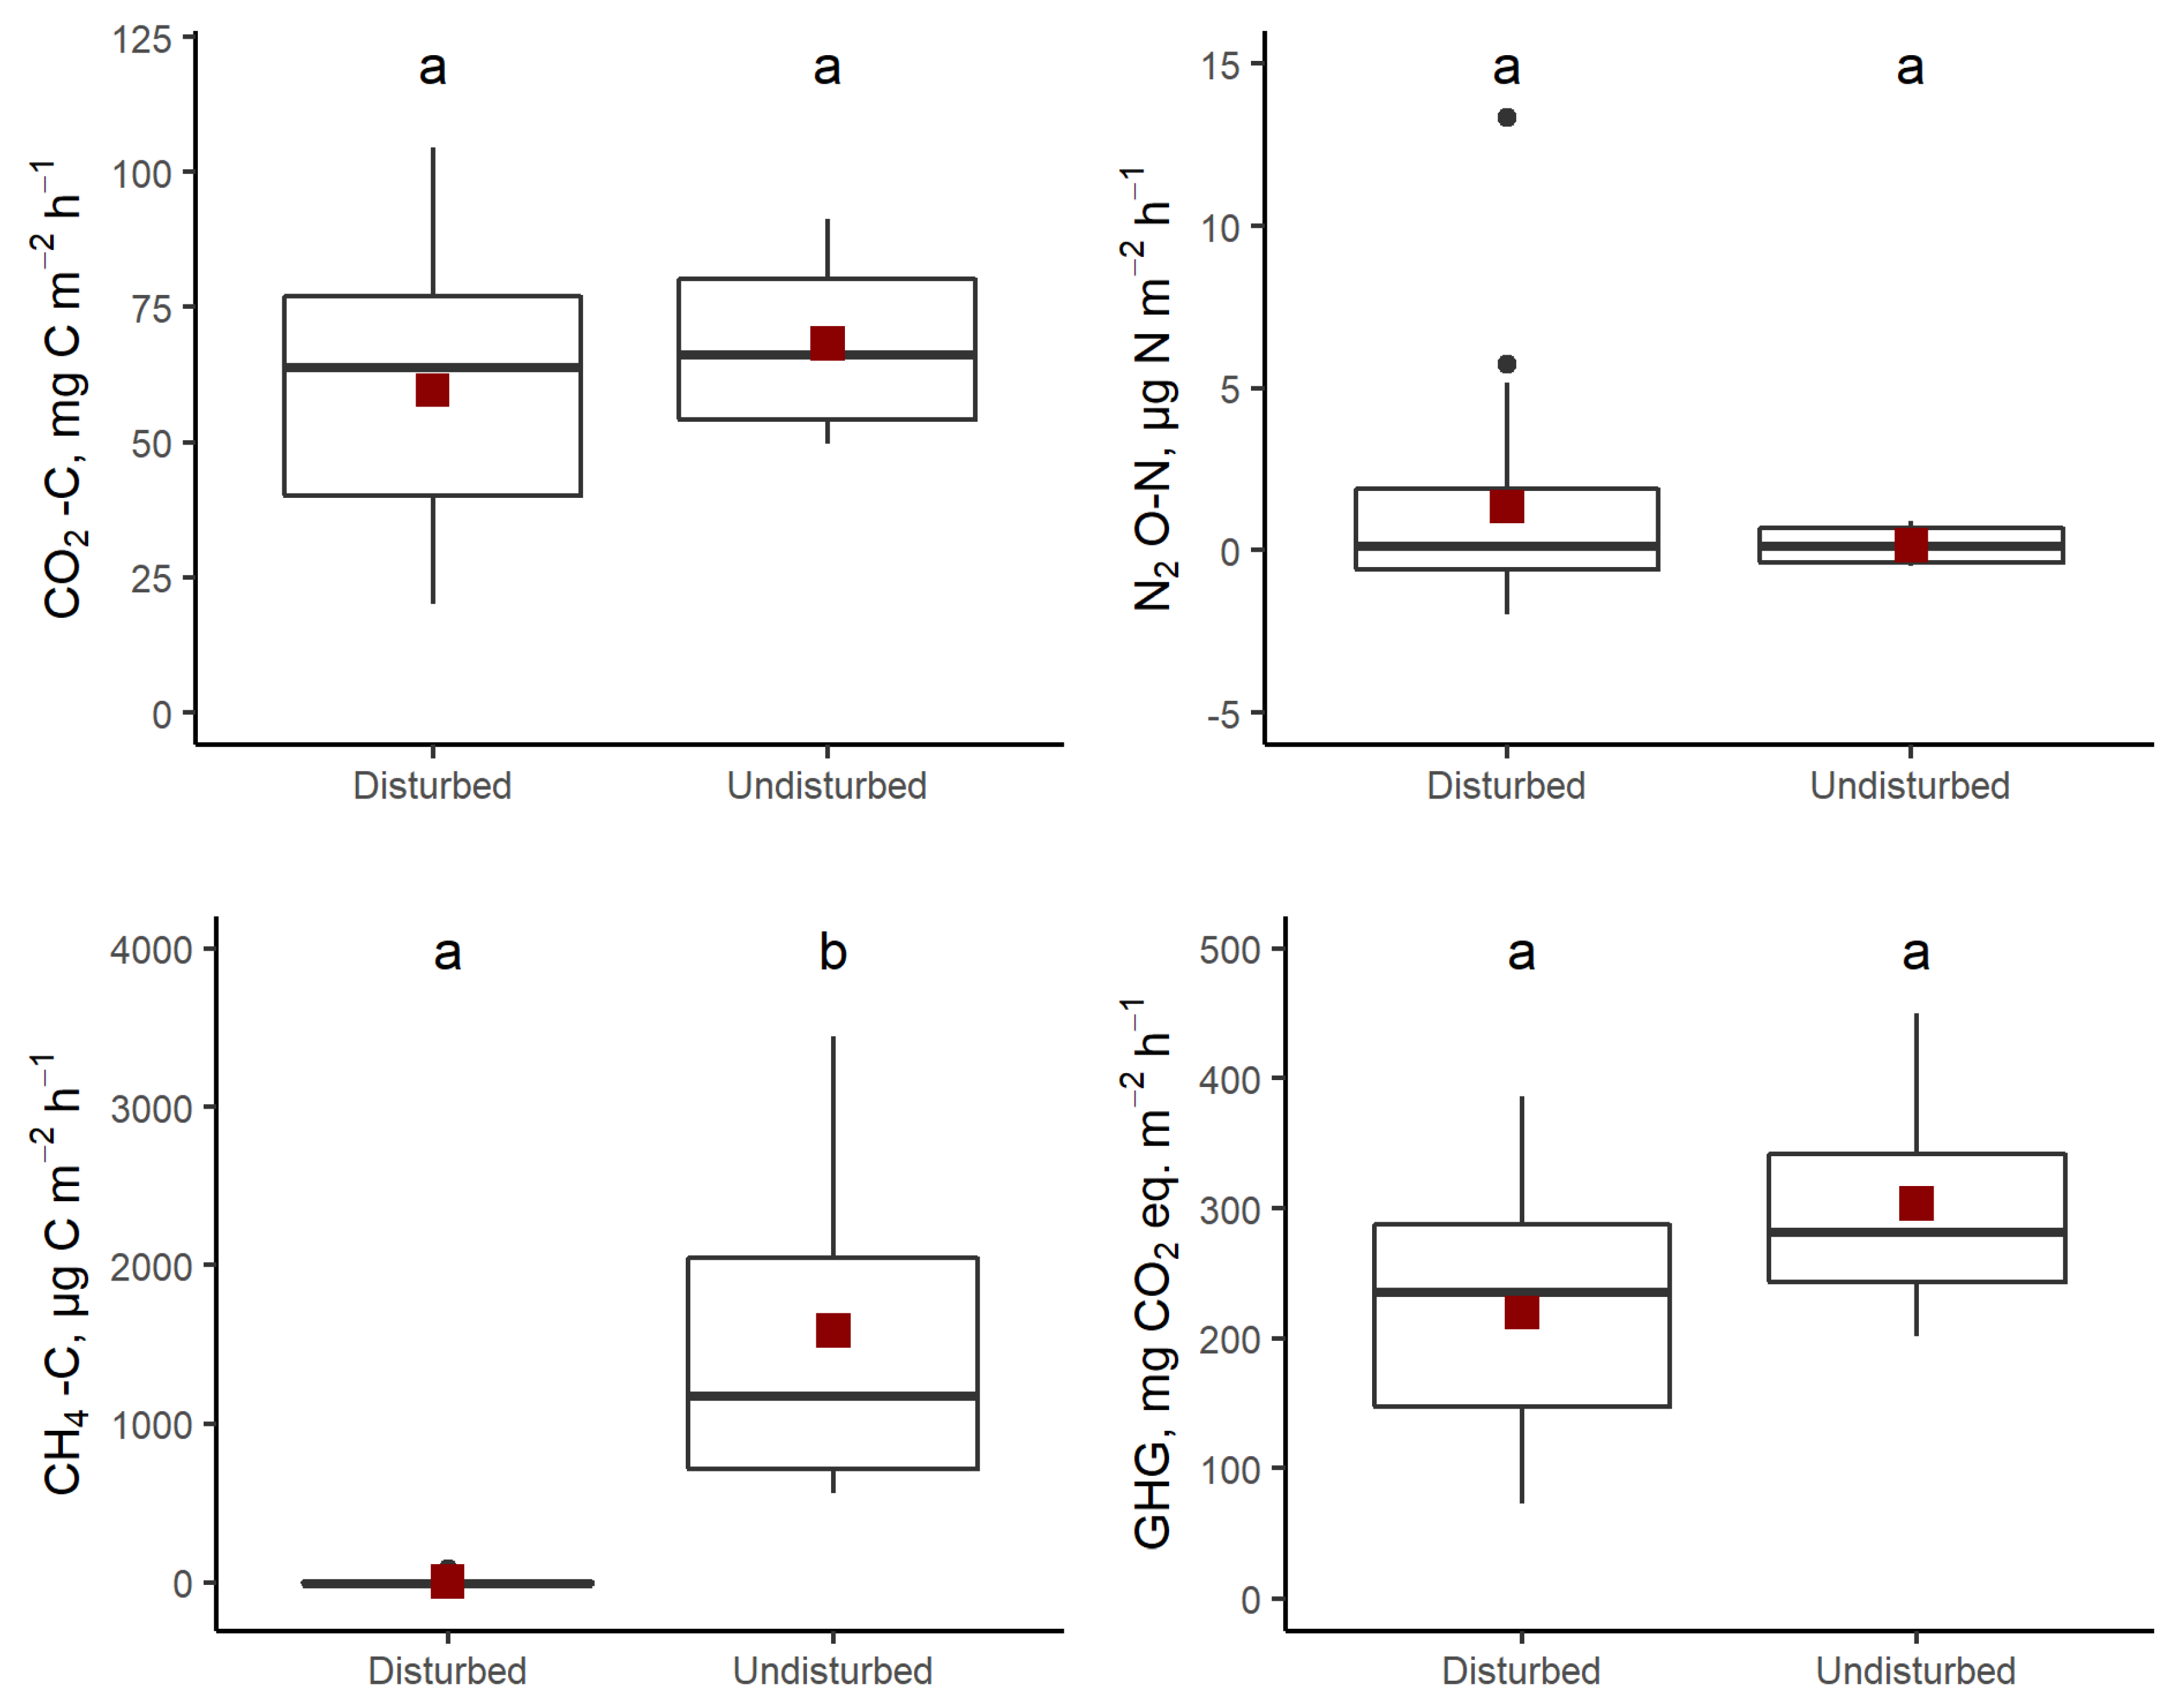
3.2. Management-Induced Disturbance and Environmental Factors’ Impact on GHG Emissions from the Soil

The mean CO2 emissions (sum of autotrophic and heterotrophic respiration) from research site soil during the measurement period (May–August) ranged from 20.1 ± 5.0 mg CO2-C m−2 h−1 (abandoned peat extraction site, bare peat) to 104.6 ± 22.7 mg CO2-C m−2 h−1 (research site disturbed by drainage and peat extraction, currently managed as grassland). The mean N2O emissions from research site soil ranged from −0.97 µg N2O-N m−2 h−1 (research site disturbed by drainage, currently coniferous forest) to 13.4 ± 11.6 µg N2O-N m−2 h−1 (research site disturbed by drainage and peat extraction, currently managed as a commercial blueberry plantation). The highest spatial variation across research sites was found for mean CH4 emissions—ranging from 30.8 ± 0.7 µg CH4-C m−2 h−1 (research site disturbed by drainage and peat extraction, currently coniferous forest) to 3448.9 ± 1087.8 µg CH4-C m−2 h−1 (undisturbed site, transitional mire).
Comparing the mean GHG emissions from the soil in undisturbed and disturbed research sites (Figure 5) revealed a statistically significant difference only for CH4 emissions (p < 0.001). The higher CH4 emissions of undisturbed research sites are related to soil moisture conditions. This is confirmed by the negative correlation between average CH4 emissions and GW level (ρ = −0.49) and sequentially positive correlations between average CH4 emissions and soil moisture (ρ = 0.52), Sphagnum species cover (ρ = 0.81) and total vegetation cover (ρ = 0.65) (Figure 4). A PLS model revealed that the variation in average CH4 emissions between the research sites was explained by the average soil moisture, Sphagnum species cover and total vegetation cover (1.6 > VIP > 1.0). Although the PLS model including these parameters, as well as those with a 1.0 > VIP > 0.5 PLS model (average GW level, average air temperature, herbaceous cover, soil conductivity at 0–10 cm deep and average CO2 emissions from the soil), had a goodness of fit (R2) of 0.61, the goodness of prediction (Q2) was 0.27, indicating a weak model.
Figure 5. GHG emissions from organic soils during the measurement period (May–August 2019) in hemiboreal Latvia. In the boxplots, the median is shown by the bold line, the mean is shown by the black dot, the box corresponds to the lower and upper quartiles, whiskers show the minimal and maximal values (within 150% of the interquartile range from the median) and dots outside the box and whiskers represent outliers of the datasets. Different lowercase letters show statistically significant differences (p < 0.05) between disturbed and undisturbed research sites.
Land 11 01414 g005
Soil CO2 emissions were negatively correlated with soil OC content (ρ = −0.47), but soil N2O emissions were positively correlated with soil electrical conductivity (ρ = 0.46) (Figure 4).

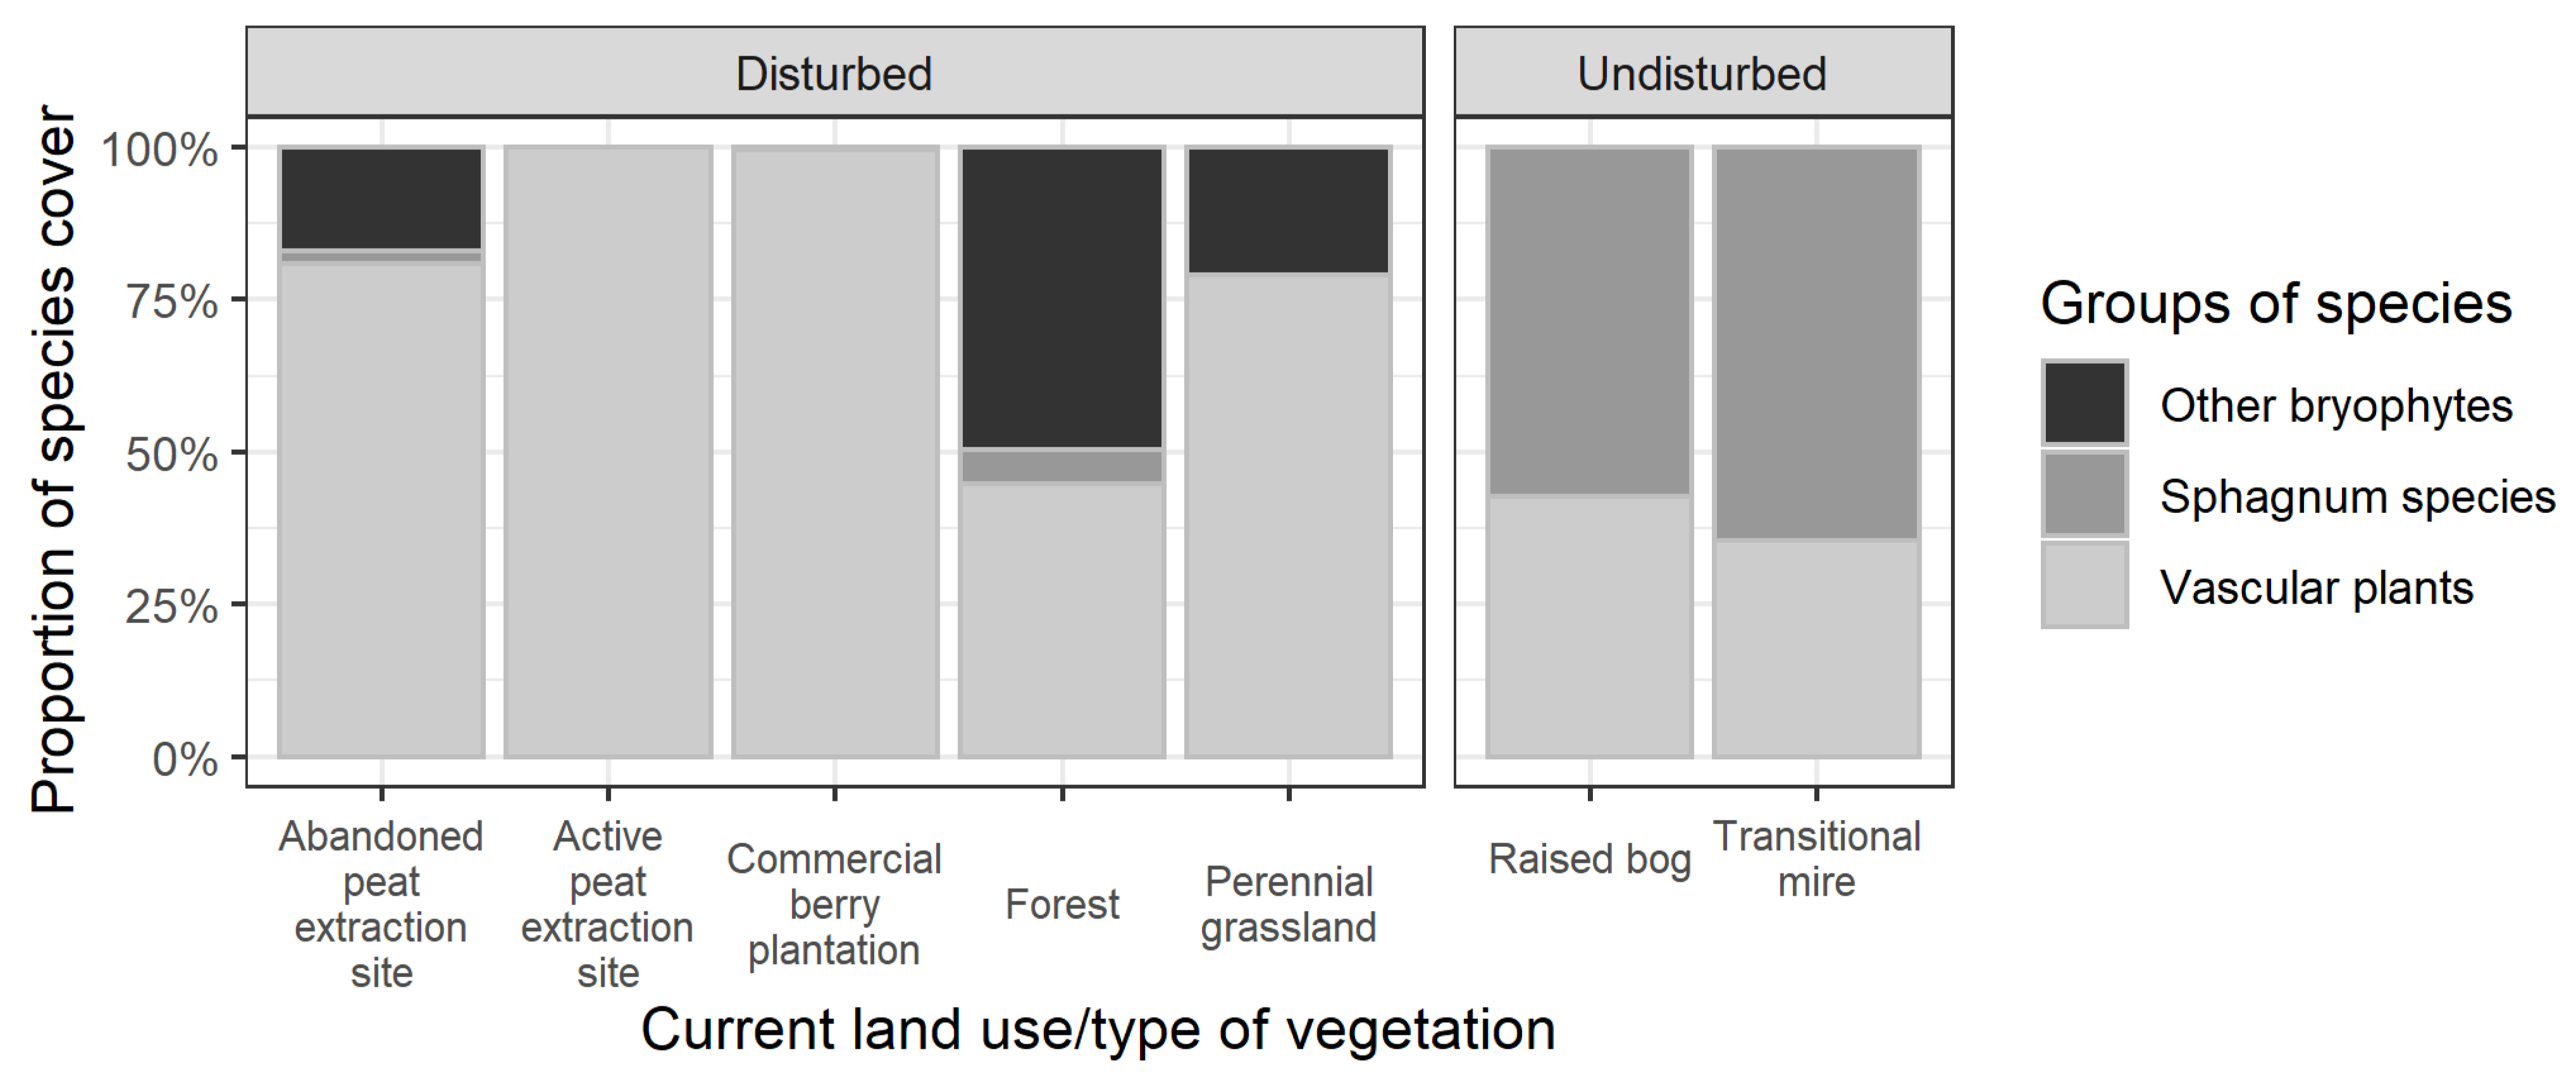
3.3. Vegetation Survey

In total, 103 species were recorded at the studied sites. The vascular flora was more diverse than the bryophytes and lichens. Altogether, 71 vascular plant species, 30 bryophyte species and two lichen species were recorded. Almost half of all determined bryophytes belonged to the Sphagnum genus (14 species). The undisturbed study sites were mostly covered by Sphagnum species, while the Sphagnum genus presented very low coverage at disturbed sites (Figure 6).
Figure 6. The proportion of species cover by different species groups and current land use or type of vegetation.
Land 11 01414 g006
CCA ordination showed the relationships between species, research sites and environmental variables. The eigenvalues for axes 1 and 2 were 0.926 and 0.906, respectively. The variable THg was correlated with axis 1 (the Pearson and Kendall correlations were 0.763). In turn, the variables CH4, Sphagnum species cover and Hg/C ratio were associated with axis 2 (the Pearson and Kendall correlations were −0.524, −0.618 and 0.645, respectively) (Figure 7).
Two distinct species groups (clusters) were recognized in the CCA ordination. One of the species clusters was more related to study plots in forest sites (coniferous forest and broad-leafed forest), indicating higher mean values of THg per studied stand. The other species group was related to undisturbed sites—transitional mires and raised bogs. The results showed that undisturbed mires tended to have more CH4 emissions, closer-to-soil-surface GW levels and greater Sphagnum species cover (Figure 7).

4. Discussion

4.1. Disturbance and Environmental Factors’ Impact on Soil THg Concentrations

The THg concentrations in hemiboreal organic soils in peatlands ranged from < 1 µg kg−1 to 194.4 µg kg−1 corresponding to concentrations found in uncontaminated soils [70,71,72]. Among peatland types, research sites disturbed by drainage and currently covered by coniferous forest had the highest average THg concentration in organic soil (103.0 ± 45.3 µg kg−1, average from 0–10 cm and 50 cm deep).
In disturbed research sites, the mean soil THg concentration at 0–10 cm was statistically higher than at 50 cm, but in undisturbed research sites, no depth-related trends were observed, as in Giulio et al.’s study of North Carolina peatland [73]. Management-induced disturbance was found not to be a factor that introduced significant variation in THg concentration or Hg/C, Hg/N and Hg/S ratios. However, Hg cycling across peatland ecosystems (including Hg(II) methylation and demethylation processes) and exchange across the peat to surface water or atmosphere, including the uptake of Hg by vegetation and re-emission of gaseous elemental Hg, is complex [36,74,75,76,77,78,79]. From an international perspective, the average THg concentrations observed at the research sites (81.7 ± 17.8 µg kg−1 at 0–10 cm deep and 28.6 ± 6.9 µg kg−1 at 50 cm deep) in Latvia align with the concentrations reported for many other peatlands, although the overall variation in THg concentrations across and within peatlands is relatively large [46,58,80].
The strong relationship between Hg and SOM controls the transport and transformations of Hg in terrestrial ecosystems [46,81]. In natural systems, Hg binding to SOM occurs via thiol or other reduced S groups (mostly, Hg2+ predominates by bonding to two thiol groups or one thiol and either an N- or an O-containing group) [46,48,81]. Positive correlations between the soil THg and TS and TN concentrations at 0–10 cm depth were observed. This highlights the S and N functional groups as the key ligands for Hg retention in organic soils. Furthermore, S can enhance the net formation of MeHg by influencing both the activity of some types of Hg-methylating bacteria (as SO42−) and the availability of Hg to methylating microorganisms (as S2−), including those that do not use S-reduction in their metabolism [43,82,83,84,85,86,87,88]. In peatlands, where climate effects increase GW level fluctuation, previously reduced S can be re-oxidized or the opposite, resulting in further S legacy effects with potential consequences for MeHg production [39,84].
During SOM decomposition, C is lost from SOM more rapidly than N and S; thus, the C/N and C/S ratios reflect the process of SOM decomposition [58,63]. An increasing soil Hg/C ratio with decreasing SOM decomposition proxies (C/N and C/S ratios) was observed both at 0–10 cm and 50 cm deep (Hg/C and the C/N and C/S ratios correlated negatively and significantly). Similar trends were observed in forest soils in a recent study by Navrátil et al. [58] and Méndez-López et al. [52], where the Hg/C ratio trends were explained by the greater availability of Hg binding sites as organic matter decomposed. Soil N and S are usually positively correlated with organic matter [63] as they are in our study. Thus, the Hg/N and Hg/S ratios show similar trends to the Hg/C ratio.
There was a negative correlation between the soil temperature and THg concentration, a similar trend as the one found in a EU-level study along north-south gradient [72]. This is explained by enhanced Hg volatilization rate to the atmosphere with the temperature increase [89], a process that may have negative environmental consequences as global warming continues. MacSween et al. [90] predict that atmospheric warming by 1–2 °C may increase global Hg emissions by up to 43%.
Hg deposition could be affected by many factors, including differences in vegetation type and species composition. For instance, different vegetation types could affect the interception and retention of Hg differently [91,92]. Our results showed that the THg concentration varied between studied sites with different plant species compositions. The CCA ordination showed the tendency towards higher THg concentrations in forest-covered peatlands (broad-leafed and coniferous forests), while more open areas with higher Sphagnum species cover (undisturbed sites) had lower THg concentrations. In addition, the CCA ordination also indicated differences between forest types. A higher Hg concentration at 0–10 cm was more common in coniferous forests, but the Hg/C ratio was higher in broad-leafed forests. In addition, our results indirectly point towards the idea that the forest canopy could effectively collect Hg from the atmosphere through the tree leaves and, by litterfall and throughfall, mercury could be sequestered within the soil [79,92,93,94,95] and that coniferous trees have a higher capacity for Hg accumulation than deciduous trees [96].
In summary, this research shows the importance of vegetation as an influential factor for the deposition of Hg in the soil and of further study to better understand different Hg content in various ecosystems, especially as forested areas are one of the key sinks of Hg deposition in terrestrial ecosystems [94].
Vegetation tissue is not only important for supplying Hg but also to stimulate microbial activity, including methylation [75,97]. Non-vascular plants such as Sphagnum mosses (dominant in nutrient-poor bogs), tend to support acetogenesis and acetate accumulation. Vascular plants (dominant in richer fens), especially sedges, which can produce easily-degraded and high-quality C substrates via root exudation, support the accumulation of acetate, a low molecular weight organic substance used by bacteria as a C source to produce MeHg, for example, to a lesser degree [98].

4.2. Disturbance and Environmental Factors’ Impact on Soil GHG Emissions

We compared GHG emissions (the sum of autotrophic and heterotrophic respiration, CH4 and N2O fluxes) from organic soil in undisturbed (pristine) and disturbed (managed) peatlands to examine the effect of management-induced disturbance and different environmental factors during the warmest season when, theoretically, the highest GHG emissions were expected as soil temperature is one of the main factors controlling GHG emissions [99]. Several studies have demonstrated that human-impacted peatlands (especially peatland-to-agriculture-converted sites) show significantly higher GHG emissions (mainly through N2O and CO2) than their natural counterparts [3,99,100], but our results revealed no significant differences in CO2 and N2O emissions between disturbed and undisturbed peatlands. Although slightly higher average CO2 emissions were observed in undisturbed peatlands, a higher total variation in CO2 emissions was observed in disturbed peatlands and, among peatland types, perennial grasslands showed the highest average CO2-C (95.1 ± 9.5 mg CO2-C m−2 h−1) flux. High variation in CO2 emissions monitored over a 2-yr period was observed among disturbed peatlands in Latvia also by previous study, furthermore, pristine peatlands tended to have even higher CO2 emissions than some types of disturbed peatlands [34]. Similarly, a study in Scotland [101] revealed that CO2 effluxes in lowland raised peat bog increased in the following order: undrained afforested < drained and afforested < pristine area of bog. Thus, our current results on CO2 emissions are in line with previous findings in Latvia and elsewhere demonstrating that management effects are not always consistent in this regard.
Several studies have concluded that soil temperature, OC content in the soil, soil C/N ratio, soil bulk density and water table depth are the main environmental and soil chemistry factors explaining the amount and quality of respiring tissue and decomposing material, thus controlling CO2 emissions within and between peatlands with different management history [18,99]. Our results show that variation in CO2 emissions negatively correlates with OC content in organic soil. Thus, in peatlands where intensive peat mineralization occurs and OC content in soil is lower, higher CO2 emissions are observed. No significant impact of GW level on CO2 emissions was observed, likely because the GW level at research sites fluctuated widely both in disturbed and undisturbed research sites (from 13 to >130 cm from the soil surface with average 60 ± 3 cm and from 4 to 32 cm from the soil surface with average 16 ± 2 cm, respectively), during the study period. Thus, not only in disturbed but also in pristine peatlands GW level decreased below 10-cm layer where a major part of the new organic matter (including fine root litter) with the highest potential rate of decomposition is located, and, with reduction of water saturation and increase in aeration, the decomposition rate of this new organic matter increased [18]. In the region, in pristine peatlands, natural lowering of GW level below 20 cm from soil surface is usual especially in summer months and at the beginning of the autumn (e.g., [34]).
No significant impact of soil C/N ratio and only a weak impact of soil temperature measured at 0–5 cm deep on CO2 emissions was observed during the study period. Weak correlation between soil temperature and CO2 emissions may be explained by the limited temperature range in our study (covering only warm season), in combination with high variety of management practices with potentially different impact on emissions covered in research site group of disturbed peatlands. This results in highly variable vegetation composition and vegetation cover and subsequently in high variety of quality and quantity of vegetation litter which have significant impact on GHG emissions from soil [102].
Similar to CO2 emissions, N2O emissions do not show significant differences between disturbed and undisturbed peatlands, although slightly higher average N2O emissions were observed in disturbed peatlands and, among peatland types, commercial berry plantations showed the highest average N2O emissions (5.1 ± 3.0 µg N2O-N m−2 h−1). Several studies have concluded that N content, C/N ratio and soil temperature are the main factors controlling N2O emissions [30,99]. No clear trends emerged. This could be explained by data obtained from peatlands with different current management and land-use history, potentially including fertilization and ploughing. The combination of these management methods may challenge the development of models to estimate N2O emissions [18]. Our results show that variation in N2O emissions positively correlates with soil conductivity, which is a good indicator of soluble salt concentrations in soil affecting the activity of soil microorganisms, which in turn influence such key soil processes as GHG emissions [103].
In contrast with CO2 and N2O emissions, CH4 emissions from undisturbed peatlands were significantly higher than those from disturbed sites. Pristine transitional mire was the largest emitter of CH4-C (2.1 ± 1.3 mg C m−2 h−1) during the study period. The higher CH4 emissions at undisturbed research sites are related to soil moisture conditions. Despite large fluctuations both at disturbed and undisturbed research sites, the mean GW level at undisturbed sites was still considerably higher. A lower water table directly reduces the production and increases the oxidation of CH4 in the soil [18]. Our results indicate that GW level has a more significant impact on CH4 emissions than on CO2 emissions. Furthermore, a positive correlation between average CH4 emissions and Sphagnum species cover was observed, although, in general, non-vascular plants such as Sphagnum mosses tend to inhibit terminal processes such as methanogenesis, while vascular plants, especially sedges, support increased methanogenesis by importing substrate to methanogenic microbes in anoxic soil layers and exporting CH4 to the atmosphere past the methanotrophic microbes [98,104]. Conversely, bryophytes have been proven to predict CH4 flux better than vascular plants, except for sedges. This is related to bryophytes’ ability to better indicate the GW level long-term, thus reflecting zones of CH4 production year-round [105].
Apart from contributing to the rather scarce data on GHG emissions from soils and THg concentrations in hemiboreal peatlands, our study also provides insight into differences between disturbed and undisturbed sites. In general, our results show that peatland management causes considerable changes in ecosystem processes, resulting in a high variation in environmental factors potentially affecting (directly and indirectly) GHG emissions from soil and THg concentration in peatland soils. Targeted ecosystem management to restore and enhance natural ecosystem functions is crucial to sustainable delivery of peatland ecosystem services. At the same time, the restoration efforts may simultaneously have contrasting effects on the cycling of biophilic elements of SOM (including C and N cycling) and contaminants, and the effects may differ in different biogeoclimatic regions. Not only current management decisions made on a local or regional scale, but also any broader policy aimed at promoting the restoration of a particular set of ecosystem functions should carefully consider all implications of the proposed measures. Complex, highly instrumented studies of ecosystem processes on a wider set of research sites where various parameters are assessed simultaneously and over a longer period of time will provide the much-needed basis for practical recommendations in peatland management.

5. Conclusions

Results revealed complex impacts of management-induced disturbance and environmental factors on the variation in THg concentrations and GHG emissions. The management-induced disturbance impact was mostly indirect, driving changes in environmental factors and vegetation cover. The most apparent impact of peatland disturbance was observed on CH4 emissions, which were significantly higher in pristine peatlands.
Our results highlight the need for complex studies in managed peatlands, including a wider set of research sites and vegetation surveys, to clearly identify factors that may enhance Hg accumulation and increase GHG emissions as these sites harbour a high diversity of environmental variables and vegetation. As both Hg cycling and GHG emissions are largely microorganism-driven processes, microbial analysis should be included in further studies.

Supplementary Materials

The following supporting information can be downloaded at: https://www.mdpi.com/article/10.3390/land11091414/s1, Figures S1–S11: Visualizations of research sites.

Author Contributions

Conceptualization, Z.L. and A.L.; methodology, Z.L. and A.L.; software, A.B. (Arta Bārdule) and L.G.-I.; data curation, L.G.-I., K.B. and A.B. (Aldis Butlers); writing—original draft preparation, A.B. (Arta Bārdule), Z.L., L.G.-I., I.K., Z.K., A.B. (Aldis Butlers) and K.B.; writing—review and editing, Z.L. and A.L.; visualization, A.B. (Arta Bārdule), L.G.-I., I.K. and Z.K.; supervision, Z.L.; project administration, Z.L. All authors have read and agreed to the published version of the manuscript.

Funding

This research was funded by the Latvian Council of Science, Project No. lzp-2018/1-0434: ‘Interaction of microbial diversity with methane turnover and mercury methylation in organic soils’.

Institutional Review Board Statement

Not applicable.

Informed Consent Statement

Not applicable.

Data Availability Statement

Not applicable.

Acknowledgments

Arta Bārdule’s and Aldis Butlers’ contribution was supported and additional GHG flux measurement data were provided by the European Regional Development Fund project ‘Development of greenhouse gas emission factors and decision support tools for management of peatlands after peat extraction’ (No. 1.1.1.1/19/A/064).

Conflicts of Interest

The authors declare no conflict of interest. The funders had no role in the design of the study; in the collection, analyses, or interpretation of data; in the writing of the manuscript, or in the decision to publish the results.

References

  1. Mokma, D.L. Organic Soils. In Encyclopedia of Soils in the Environment; Hillel, D., Ed.; Elsevier: Oxford, UK, 2005; pp. 118–129. ISBN 978-0-12-348530-4. [Google Scholar]
  2. European Environment Agency. Soil Organic Carbon. Available online: https://www.eea.europa.eu/data-and-maps/indicators/soil-organic-carbon-1/assessment/#_edn3 (accessed on 15 July 2022).
  3. Maljanen, M.; Sigurdsson, B.D.; Guðmundsson, J.; Óskarsson, H.; Huttunen, J.T.; Martikainen, P.J. Greenhouse Gas Balances of Managed Peatlands in the Nordic Countries – Present Knowledge and Gaps. Biogeosciences 2010, 7, 2711–2738. [Google Scholar] [CrossRef]
  4. Joosten, H.; Tapio-Biström, M.-L.; Tol, S. (Eds.) Peatlands: Guidance for Climate Change Mitigation through Conservation, Rehabilitation and Sustainable Use, 2nd ed.; Mitigation of Climate Change in Agriculture Series; Food and Agriculture Organization of the United Nations, Wetlands International: Rome, Italy, 2012; ISBN 978-92-5-107302-5. [Google Scholar]
  5. Abdalla, M.; Hastings, A.; Truu, J.; Espenberg, M.; Mander, Ü.; Smith, P. Emissions of Methane from Northern Peatlands: A Review of Management Impacts and Implications for Future Management Options. Ecol. Evol. 2016, 6, 7080–7102. [Google Scholar] [CrossRef]
  6. Latvia National Inventory Report. Available online: https://unfccc.int/documents/461908 (accessed on 15 July 2022).
  7. Sirin, A.; Laine, J. Peatlands and Greenhouse Gases. In Assessment on Peatlands, Biodiversity, and Climate Change; Global Environment Centre & Wetlands International, Wageningen: Kuala Lumpur, Malaysia, 2008; pp. 138–188. ISBN 978-983-43751-0-2. [Google Scholar]
  8. Grzybowski, M.; Glińska-Lewczuk, K. The Principal Threats to the Peatlands Habitats, in the Continental Bioregion of Central Europe – A Case Study of Peatland Conservation in Poland. J. Nat. Conserv. 2020, 53, 125778. [Google Scholar] [CrossRef]
  9. Schaller, C.; Hofer, B.; Klemm, O. Greenhouse Gas Exchange of a NW German Peatland, 18 Years After Rewetting. J. Geophys. Res. Biogeosci. 2022, 127, e2020JG005960. [Google Scholar] [CrossRef]
  10. Yu, Z.; Beilman, D.W.; Jones, M.C. Sensitivity of Northern Peatland Carbon Dynamics to Holocene Climate Change. In Geophysical Monograph Series; Baird, A.J., Belyea, L.R., Comas, X., Reeve, A.S., Slater, L.D., Eds.; American Geophysical Union: Washington, DC, USA, 2009; pp. 55–69. ISBN 978-1-118-66666-1. [Google Scholar]
  11. Haynes, K.M.; Kane, E.S.; Potvin, L.; Lilleskov, E.A.; Kolka, R.K.; Mitchell, C.P.J. Mobility and Transport of Mercury and Methylmercury in Peat as a Function of Changes in Water Table Regime and Plant Functional Groups. Glob. Biogeochem. Cycles 2017, 31, 233–244. [Google Scholar] [CrossRef]
  12. Le Mer, J.; Roger, P. Production, Oxidation, Emission and Consumption of Methane by Soils: A Review. Eur. J. Soil. Biol. 2001, 37, 25–50. [Google Scholar] [CrossRef]
  13. Jukaine; Vasander, H.; Laiho, R. Long-Term Effects of Water Level Drawdown on the Vegetation of Drained Pine Mires in Southern Finland. J. Appl. Ecol. 1995, 32, 785. [Google Scholar] [CrossRef]
  14. Ojanen, P.; Minkkinen, K.; Penttilä, T. The Current Greenhouse Gas Impact of Forestry-Drained Boreal Peatlands. For. Ecol. Manag. 2013, 289, 201–208. [Google Scholar] [CrossRef]
  15. Bonn, A.; Allott, T.; Evans, M.; Joosten, H.; Stoneman, R. (Eds.) Peatland Restoration and Ecosystem Services: Science, Policy and Practice, 1st ed.; Cambridge University Press: Cambridge, CA, USA, 2016; ISBN 978-1-107-02518-9. [Google Scholar]
  16. Korkiakoski, M.; Tuovinen, J.-P.; Penttilä, T.; Sarkkola, S.; Ojanen, P.; Minkkinen, K.; Rainne, J.; Laurila, T.; Lohila, A. Greenhouse Gas and Energy Fluxes in a Boreal Peatland Forest after Clear-Cutting. Biogeosciences 2019, 16, 3703–3723. [Google Scholar] [CrossRef]
  17. Barthelmes, A.; Couwenberg, J.; Risager, M.; Tegetmeyer, C.; Joosten, H. Peatlands and Climate in a Ramsar Context: A Nordic-Baltic Perspective; Nordic Council of Ministers: Copenhagen, Denmark, 2015; p. 244. [Google Scholar]
  18. Ojanen, P.; Minkkinen, K.; Alm, J.; Penttilä, T. Soil–Atmosphere CO2, CH4 and N2O Fluxes in Boreal Forestry-Drained Peatlands. For. Ecol. Manag. 2010, 260, 411–421. [Google Scholar] [CrossRef]
  19. Ojanen, P.; Minkkinen, K.; Alm, J.; Penttilä, T. Corrigendum to “Soil–Atmosphere CO2, CH4 and N2O Fluxes in Boreal Forestry-Drained Peatlands” [For. Ecol. Manage. 260 (2010) 411–421]. For. Ecol. Manag. 2018, 412, 95–96. [Google Scholar] [CrossRef]
  20. Bond-Lamberty, B.; Thomson, A. A Global Database of Soil Respiration Data. Biogeosciences 2010, 7, 1915–1926. [Google Scholar] [CrossRef]
  21. Hanson, P.J.; Edwards, N.T.; Garten, C.T.; Andrews, J.A. Separating Root and Soil Microbial Contributions to Soil Respiration: A Review of Methods and Observations. Biogeochemistry 2000, 48, 115–146. [Google Scholar] [CrossRef]
  22. Tian, H.; Lu, C.; Yang, J.; Banger, K.; Huntzinger, D.N.; Schwalm, C.R.; Michalak, A.M.; Cook, R.; Ciais, P.; Hayes, D.; et al. Global Patterns and Controls of Soil Organic Carbon Dynamics as Simulated by Multiple Terrestrial Biosphere Models: Current Status and Future Directions. Glob. Biogeochem. Cycles 2015, 29, 775–792. [Google Scholar] [CrossRef]
  23. Kriiska, K.; Frey, J.; Asi, E.; Kabral, N.; Uri, V.; Aosaar, J.; Varik, M.; Napa, Ü.; Apuhtin, V.; Timmusk, T.; et al. Variation in Annual Carbon Fluxes Affecting the SOC Pool in Hemiboreal Coniferous Forests in Estonia. For. Ecol. Manag. 2019, 433, 419–430. [Google Scholar] [CrossRef]
  24. Arnold, K.V.; Nilsson, M.; Hånell, B.; Weslien, P.; Klemedtsson, L. Fluxes of CO2, CH4 and N2O from Drained Organic Soils in Deciduous Forests. Soil Biol. Biochem. 2005, 37, 1059–1071. [Google Scholar] [CrossRef]
  25. Arnold, K.V.; Weslien, P.; Nilsson, M.; Svensson, B.H.; Klemedtsson, L. Fluxes of CO2, CH4 and N2O from Drained Coniferous Forests on Organic Soils. For. Ecol. Manag. 2005, 210, 239–254. [Google Scholar] [CrossRef]
  26. Ojanen, P.; Lehtonen, A.; Heikkinen, J.; Penttilä, T.; Minkkinen, K. Soil CO2 Balance and Its Uncertainty in Forestry-Drained Peatlands in Finland. For. Ecol. Manag. 2014, 325, 60–73. [Google Scholar] [CrossRef]
  27. Tang, J.; Bolstad, P.V.; Martin, J.G. Soil Carbon Fluxes and Stocks in a Great Lakes Forest Chronosequence. Glob. Change Biol. 2009, 15, 145–155. [Google Scholar] [CrossRef]
  28. Craine, J.M.; Wedin, D.A. Determinants of Growing Season Soil CO2flux in a Minnesota Grassland. Biogeochemistry 2002, 59, 303–313. [Google Scholar] [CrossRef]
  29. Straková, P.; Penttilä, T.; Laine, J.; Laiho, R. Disentangling Direct and Indirect Effects of Water Table Drawdown on Above- and Belowground Plant Litter Decomposition: Consequences for Accumulation of Organic Matter in Boreal Peatlands. Glob. Chang. Biol. 2012, 18, 322–335. [Google Scholar] [CrossRef]
  30. Klemedtsson, L.; Von Arnold, K.; Weslien, P.; Gundersen, P. Soil CN Ratio as a Scalar Parameter to Predict Nitrous Oxide Emissions. Glob. Chang. Biol. 2005, 11, 1142–1147. [Google Scholar] [CrossRef]
  31. Mäkiranta, P.; Hytönen, J.; Aro, L.; Maljanen, M.; Pihlatie, M.; Potila, H.; Shurpali, N.J.; Laine, J.; Lohila, A.; Martikainen, P.J.; et al. Soil Greenhouse Gas Emissions from Afforested Organic Soil Croplands and Cutaway Peatlands. Boreal Environ. Res. 2007, 12, 159–175. [Google Scholar]
  32. Jauhiainen, J.; Kazanaviciute, V.; Armolaitis, K.; Kull, A.; Līcīte, I.; Butlers, A.; Lupiķis, A.; Jēgers, N.; Medvedkins, E.; Saule, G.; et al. Report on Current Situation—Applied Emission Factors and Projections of Greenhouse Gas Emissions from Organic Soils; Latvia State Forest Research Institute “Silava”: Salaspils, Latvia, 2019; p. 65. [Google Scholar] [CrossRef]
  33. Lupikis, A.; Lazdins, A. Soil Carbon Stock Changes in Transitional Mire Drained for Forestry in Latvia: A Case Study. Res. Rural Dev. 2017, 1, 55–61. [Google Scholar]
  34. Lazdiņš, A.; Lupiķis, A. Restore Project Contribution to the Greenhouse Gas Emission Accounts in Latvia. In Sustainable and Responsible after-Use of Peat Extraction Areas; Priede, A., Gancone, A., Eds.; Baltijas krasti: Riga, Latvia, 2019; pp. 21–54. ISBN 978-9934-19-845-8. [Google Scholar]
  35. Butlers, A.; Bārdule, A.; Spalva, G.; Muižnieks, E. N2O and CH4 Emissions from Naturally Wet and Drained Nutrient-Rich Organic Forest Soils. Rural Dev. 2022, 2021, 196–200. [Google Scholar] [CrossRef]
  36. Osterwalder, S.; Bishop, K.; Alewell, C.; Fritsche, J.; Laudon, H.; Åkerblom, S.; Nilsson, M.B. Mercury Evasion from a Boreal Peatland Shortens the Timeline for Recovery from Legacy Pollution. Sci. Rep. 2017, 7, 16022. [Google Scholar] [CrossRef]
  37. Zhang, Y.; Jacob, D.J.; Horowitz, H.M.; Chen, L.; Amos, H.M.; Krabbenhoft, D.P.; Slemr, F.; St. Louis, V.L.; Sunderland, E.M. Observed Decrease in Atmospheric Mercury Explained by Global Decline in Anthropogenic Emissions. Proc. Natl. Acad. Sci. USA 2016, 113, 526–531. [Google Scholar] [CrossRef]
  38. McClain, M.E.; Boyer, E.W.; Dent, C.L.; Gergel, S.E.; Grimm, N.B.; Groffman, P.M.; Hart, S.C.; Harvey, J.W.; Johnston, C.A.; Mayorga, E.; et al. Biogeochemical Hot Spots and Hot Moments at the Interface of Terrestrial and Aquatic Ecosystems. Ecosystems 2003, 6, 301–312. [Google Scholar] [CrossRef]
  39. Blythe, J.L. The Effects of Legacy Sulphur Deposition on Methylmercury Production in Northern Peatlands. Master’s Thesis, The University of Western Ontario, London, ON, Canada, 27 January 2020. [Google Scholar]
  40. St. Louis, V.L.; Rudd, J.W.M.; Kelly, C.A.; Beaty, K.G.; Flett, R.J.; Roulet, N.T. Production and Loss of Methylmercury and Loss of Total Mercury from Boreal Forest Catchments Containing Different Types of Wetlands. Environ. Sci. Technol. 1996, 30, 2719–2729. [Google Scholar] [CrossRef]
  41. Branfireun, B.A.; Roulet, N.T. Controls on the Fate and Transport of Methylmercury in a Boreal Headwater Catchment, Northwestern Ontario, Canada. Hydrol. Earth Syst. Sci. 2002, 6, 785–794. [Google Scholar] [CrossRef]
  42. Mitchell, C.P.J.; Branfireun, B.A.; Kolka, R.K. Spatial Characteristics of Net Methylmercury Production Hot Spots in Peatlands. Environ. Sci. Technol. 2008, 42, 1010–1016. [Google Scholar] [CrossRef]
  43. Bergman, I.; Bishop, K.; Tu, Q.; Frech, W.; Åkerblom, S.; Nilsson, M. The Influence of Sulphate Deposition on the Seasonal Variation of Peat Pore Water Methyl Hg in a Boreal Mire. PLoS ONE 2012, 7, e45547. [Google Scholar] [CrossRef]
  44. Tjerngren, I.; Meili, M.; Björn, E.; Skyllberg, U. Eight Boreal Wetlands as Sources and Sinks for Methyl Mercury in Relation to Soil Acidity, C/N Ratio, and Small-Scale Flooding. Environ. Sci. Technol. 2012, 46, 8052–8060. [Google Scholar] [CrossRef]
  45. Liu, J.; Wang, Z.; Zhao, H.; Peros, M.; Yang, Q.; Liu, S.; Li, H.; Wang, S.; Bu, Z. Mercury and Arsenic in the Surface Peat Soils of the Changbai Mountains, Northeastern China: Distribution, Environmental Controls, Sources, and Ecological Risk Assessment. Environ. Sci. Pollut. Res. 2018, 25, 34595–34609. [Google Scholar] [CrossRef]
  46. Grigal, D.F. Mercury Sequestration in Forests and Peatlands: A Review. J. Environ. Qual. 2003, 32, 393–405. [Google Scholar] [CrossRef]
  47. European Environment Agency. Mercury Pollution Remains a Problem in Europe and Globally. Available online: https://www.eea.europa.eu/highlights/mercury-pollution-remains-a-problem (accessed on 15 July 2022).
  48. He, M.; Tian, L.; Braaten, H.F.V.; Wu, Q.; Luo, J.; Cai, L.-M.; Meng, J.-H.; Lin, Y. Mercury–Organic Matter Interactions in Soils and Sediments: Angel or Devil? Bull. Environ. Contam. Toxicol. 2019, 102, 621–627. [Google Scholar] [CrossRef]
  49. Schroeder, W.H.; Munthe, J. Atmospheric Mercury—An Overview. Atmos. Environ. 1998, 32, 809–822. [Google Scholar] [CrossRef]
  50. König, N.; Krinninger, M.; Schad, T.; Sanders, T.G.M.; Geppert, F.; Holzhausen, M. Entwicklung und Test von Methoden zur Messung der Nassen Quecksilberdeposition unter dem Kronendach von Wäldern; Umweltbundesamt: Dessau-Roßlau, Germany, 2021; p. 137. [Google Scholar]
  51. Wang, X.; Bao, Z.; Lin, C.-J.; Yuan, W.; Feng, X. Assessment of Global Mercury Deposition through Litterfall. Environ. Sci. Technol. 2016, 50, 8548–8557. [Google Scholar] [CrossRef]
  52. Méndez-López, M.; Gómez-Armesto, A.; Alonso-Vega, F.; Pontevedra-Pombal, X.; Fonseca, F.; de Figueiredo, T.; Arias-Estévez, M.; Nóvoa-Muñoz, J.C. The Role of Afforestation Species as a Driver of Hg Accumulation in Organic Horizons of Forest Soils from a Mediterranean Mountain Area in SW Europe. Sci. Total Environ. 2022, 827, 154345. [Google Scholar] [CrossRef]
  53. Latvian Environment, Geology and Meteorology Centre Report on Surface Water and Groundwater Condition in 2020. Available online: https://videscentrs.lvgmc.lv/files/Udens/udens_kvalitate/VPUK_2020_publicesanai_18032022.pdf (accessed on 27 July 2022).
  54. Latvian Environment, Geology and Meteorology Centre Characteristics of Weather Conditions. 2019. Available online: https://klimats.meteo.lv/laika_apstaklu_raksturojums/arhivs/2019/gads/ (accessed on 27 July 2022).
  55. Pavelka, M.; Acosta, M.; Kiese, R.; Altimir, N.; Brümmer, C.; Crill, P.; Darenova, E.; Fuß, R.; Gielen, B.; Graf, A.; et al. Standardisation of Chamber Technique for CO2, N2O and CH4 Fluxes Measurements from Terrestrial Ecosystems. Int. Agrophysics 2018, 32, 569–587. [Google Scholar] [CrossRef]
  56. Darenova, E.; Pavelka, M.; Acosta, M. Diurnal Deviations in the Relationship between CO2 Efflux and Temperature: A Case Study. CATENA 2014, 123, 263–269. [Google Scholar] [CrossRef]
  57. Loftfield, N.; Flessa, H.; Augustin, J.; Beese, F. Automated Gas Chromatographic System for Rapid Analysis of the Atmospheric Trace Gases Methane, Carbon Dioxide, and Nitrous Oxide. J. Environ. Qual. 1997, 26, 560–564. [Google Scholar] [CrossRef]
  58. Navrátil, T.; Nováková, T.; Shanley, J.B.; Rohovec, J.; Vaňková, M. Distribution and Pools of Mercury in Forest Soils near Recent and Historical Mercury Emission Sources in the Central Czech Republic. J. Geochem. Explor. 2021, 226, 106782. [Google Scholar] [CrossRef]
  59. Schuster, W.; Knorr, K.-H.; Blodau, C.; Gałka, M.; Borken, W.; Pancotto, V.A.; Kleinebecker, T. Control of Carbon and Nitrogen Accumulation by Vegetation in Pristine Bogs of Southern Patagonia. Sci. Total Environ. 2022, 810, 151293. [Google Scholar] [CrossRef]
  60. Åkerblom, S.; Meili, M.; Bringmark, L.; Johansson, K.; Kleja, D.B.; Bergkvist, B. Partitioning of Hg Between Solid and Dissolved Organic Matter in the Humus Layer of Boreal Forests. Water Air Soil Pollut. 2008, 189, 239–252. [Google Scholar] [CrossRef]
  61. Obrist, D.; Johnson, D.W.; Lindberg, S.E. Mercury Concentrations and Pools in Four Sierra Nevada Forest Sites, and Relationships to Organic Carbon and Nitrogen. Biogeosciences 2009, 6, 765–777. [Google Scholar] [CrossRef]
  62. Yu, X.; Driscoll, C.T.; Warby, R.A.F.; Montesdeoca, M.; Johnson, C.E. Soil Mercury and Its Response to Atmospheric Mercury Deposition across the Northeastern United States. Ecol. Appl. 2014, 24, 812–822. [Google Scholar] [CrossRef]
  63. Navrátil, T.; Shanley, J.; Rohovec, J.; Hojdová, M.; Penížek, V.; Buchtová, J. Distribution and Pools of Mercury in Czech Forest Soils. Water Air Soil Pollut. 2014, 225, 1829. [Google Scholar] [CrossRef]
  64. Navrátil, T.; Shanley, J.B.; Rohovec, J.; Oulehle, F.; Šimeček, M.; Houška, J.; Cudlín, P. Soil Mercury Distribution in Adjacent Coniferous and Deciduous Stands Highly Impacted by Acid Rain in the Ore Mountains, Czech Republic. Appl. Geochem. 2016, 75, 63–75. [Google Scholar] [CrossRef]
  65. Eriksson, L.; Johansson, E.; Kettapeh-Wold, S.; Wold, S. Introduction to Multi- and Megavariate Data Analysis Using Projection Methods (PCA & PLS); Umetrics: Umeå, Sweden, 1999. [Google Scholar]
  66. Wold, S.; Sjöström, M.; Eriksson, L. PLS-Regression: A Basic Tool of Chemometrics. Chemom. Intell. Lab. Syst. 2001, 58, 109–130. [Google Scholar] [CrossRef]
  67. Kucheryavskiy, S. Mdatools—R Package for Chemometrics. Chemom. Intell. Lab. Syst. 2020, 198, 103937. [Google Scholar] [CrossRef]
  68. R Core Team. R: A Language and Environment for Statistical Computing; R Foundation for Statistical Computing: Vienna, Austria, 2021. [Google Scholar]
  69. Peck, J.L.E. Multivariate Analysis for Community Ecologists: Step-by-Step Using PC-ORD; MjM Software Design: Gleneden Beach, OR, USA, 2010. [Google Scholar]
  70. Adriano, D.C. Mercury. In Trace Elements in Terrestrial Environments; Springer: New York, NY, USA, 2001; pp. 411–458. ISBN 978-1-4684-9505-8. [Google Scholar]
  71. Heavy Metals in Soils; Alloway, B.J. (Ed.) Environmental Pollution; Springer: Dordrecht, The Netherlands, 2013; Volume 22, ISBN 978-94-007-4469-1. [Google Scholar]
  72. Ballabio, C.; Jiskra, M.; Osterwalder, S.; Borrelli, P.; Montanarella, L.; Panagos, P. A Spatial Assessment of Mercury Content in the European Union Topsoil. Sci. Total Environ. 2021, 769, 144755. [Google Scholar] [CrossRef]
  73. Di Giulio, R.T.; Ryan, E.A. Mercury in Soils, Sediments, and Clams from a North Carolina Peatland. Water Air Soil Pollut. 1987, 33, 205–219. [Google Scholar] [CrossRef]
  74. Hu, H.; Wang, B.; Bravo, A.G.; Björn, E.; Skyllberg, U.; Amouroux, D.; Tessier, E.; Zopfi, J.; Feng, X.; Bishop, K.; et al. Shifts in Mercury Methylation across a Peatland Chronosequence: From Sulfate Reduction to Methanogenesis and Syntrophy. J. Hazard Mater. 2020, 387, 121967. [Google Scholar] [CrossRef]
  75. Heyes, A.; Moore, T.R.; Rudd, J.W.; Dugoua, J.J. Methyl Mercury in Pristine and Impounded Boreal Peatlands, Experimental Lakes Area, Ontario. Can. J. Fish. Aquat. Sci. 2000, 57, 2211–2222. [Google Scholar] [CrossRef]
  76. Zhu, W.; Song, Y.; Adediran, G.A.; Jiang, T.; Reis, A.T.; Pereira, E.; Skyllberg, U.; Björn, E. Mercury Transformations in Resuspended Contaminated Sediment Controlled by Redox Conditions, Chemical Speciation and Sources of Organic Matter. Geochim. Cosmochim. Acta 2018, 220, 158–179. [Google Scholar] [CrossRef]
  77. Ma, M.; Du, H.; Wang, D. Mercury Methylation by Anaerobic Microorganisms: A Review. Crit. Rev. Environ. Sci. Technol. 2019, 49, 1893–1936. [Google Scholar] [CrossRef]
  78. Ma, M.; Du, H.; Wang, D. A New Perspective Is Required to Understand the Role of Forest Ecosystems in Global Mercury Cycle: A Review. Bull. Environ. Contam. Toxicol. 2019, 102, 650–656. [Google Scholar] [CrossRef]
  79. Kolka, R.; Sebestyen, S.; Verry, E.S.; Brooks, K. (Eds.) Physical Properties of Organic Soils. In Peatland Biogeochemistry and Watershed Hydrology at the Marcell Experimental Forest; CRC Press: Boca Raton, FL, USA, 2011; pp. 159–200. ISBN 978-0-429-13000-7. [Google Scholar]
  80. Skyllberg, U.; Qian, J.; Frech, W.; Xia, K.; Bleam, W.F. Distribution of Mercury, Methyl Mercury and Organic Sulphur Species in Soil, Soil Solution and Stream of a Boreal Forest Catchment. Biogeochemistry 2003, 64, 53–76. [Google Scholar] [CrossRef]
  81. Skyllberg, U.; Xia, K.; Bloom, P.R.; Nater, E.A.; Bleam, W.F. Binding of Mercury(II) to Reduced Sulfur in Soil Organic Matter along Upland-Peat Soil Transects. J. Environ. Qual. 2000, 29, 855–865. [Google Scholar] [CrossRef]
  82. Branfireun, B.A.; Roulet, N.T.; Kelly, C.A.; Rudd, J.W.M. In Situ Sulphate Stimulation of Mercury Methylation in a Boreal Peatland: Toward a Link between Acid Rain and Methylmercury Contamination in Remote Environments. Glob. Biogeochem. Cycles 1999, 13, 743–750. [Google Scholar] [CrossRef]
  83. Jeremiason, J.D.; Engstrom, D.R.; Swain, E.B.; Nater, E.A.; Johnson, B.M.; Almendinger, J.E.; Monson, B.A.; Kolka, R.K. Sulfate Addition Increases Methylmercury Production in an Experimental Wetland. Environ. Sci. Technol. 2006, 40, 3800–3806. [Google Scholar] [CrossRef]
  84. Coleman Wasik, J.K.; Engstrom, D.R.; Mitchell, C.P.J.; Swain, E.B.; Monson, B.A.; Balogh, S.J.; Jeremiason, J.D.; Branfireun, B.A.; Kolka, R.K.; Almendinger, J.E. The Effects of Hydrologic Fluctuation and Sulfate Regeneration on Mercury Cycling in an Experimental Peatland. J. Geophys. Res. Biogeosci. 2015, 120, 1697–1715. [Google Scholar] [CrossRef]
  85. Johnson, N.W.; Mitchell, C.P.J.; Engstrom, D.R.; Bailey, L.T.; Coleman Wasik, J.K.; Berndt, M.E. Methylmercury Production in a Chronically Sulfate-Impacted Sub-Boreal Wetland. Environ. Sci. Process. Impacts 2016, 18, 725–734. [Google Scholar] [CrossRef]
  86. Braaten, H.F.V.; Lindholm, M.; de Wit, H.A. Five Decades of Declining Methylmercury Concentrations in Boreal Foodwebs Suggest Pivotal Role for Sulphate Deposition. Sci. Total Environ. 2020, 714, 136774. [Google Scholar] [CrossRef]
  87. Åkerblom, S.; Bishop, K.; Björn, E.; Lambertsson, L.; Eriksson, T.; Nilsson, M.B. Significant Interaction Effects from Sulfate Deposition and Climate on Sulfur Concentrations Constitute Major Controls on Methylmercury Production in Peatlands. Geochim. Cosmochim. Acta 2013, 102, 1–11. [Google Scholar] [CrossRef]
  88. Åkerblom, S.; Nilsson, M.B.; Skyllberg, U.; Björn, E.; Jonsson, S.; Ranneby, B.; Bishop, K. Formation and Mobilization of Methylmercury across Natural and Experimental Sulfur Deposition Gradients. Environ. Pollut. 2020, 263, 114398. [Google Scholar] [CrossRef]
  89. Kim, K.-H.; Yoon, H.-O.; Jung, M.-C.; Oh, J.-M.; Brown, R.J.C. A Simple Approach for Measuring Emission Patterns of Vapor Phase Mercury under Temperature-Controlled Conditions from Soil. Sci. World J. 2012, 2012, 1–8. [Google Scholar] [CrossRef]
  90. MacSween, K.; Edwards, G.C.; Howard, D.A. Up-Scaling Mercury Emissions from Terrestrial Surfaces as a Response to Sustained Temperature Increase. Atmos. Environ. 2020, 223, 117190. [Google Scholar] [CrossRef]
  91. Rydberg, J.; Klaminder, J.; Rosén, P.; Bindler, R. Climate Driven Release of Carbon and Mercury from Permafrost Mires Increases Mercury Loading to Sub-Arctic Lakes. Sci. Total Environ. 2010, 408, 4778–4783. [Google Scholar] [CrossRef]
  92. Zhou, J.; Obrist, D.; Dastoor, A.; Jiskra, M.; Ryjkov, A. Vegetation Uptake of Mercury and Impacts on Global Cycling. Nat. Rev. Earth Environ. 2021, 2, 269–284. [Google Scholar] [CrossRef]
  93. Zhou, J.; Wang, Z.; Zhang, X. Deposition and Fate of Mercury in Litterfall, Litter, and Soil in Coniferous and Broad-Leaved Forests. J. Geophys. Res. Biogeosci. 2018, 123, 2590–2603. [Google Scholar] [CrossRef]
  94. St. Louis, V.L.; Rudd, J.W.M.; Kelly, C.A.; Hall, B.D.; Rolfhus, K.R.; Scott, K.J.; Lindberg, S.E.; Dong, W. Importance of the Forest Canopy to Fluxes of Methyl Mercury and Total Mercury to Boreal Ecosystems. Environ. Sci. Technol. 2001, 35, 3089–3098. [Google Scholar] [CrossRef]
  95. Grigal, D.F.; Kolka*, R.K.; Fleck, J.A.; Nater, E.A. Mercury Budget of an Upland-Peatland Watershed. Biogeochemistry 2000, 50, 95–109. [Google Scholar] [CrossRef]
  96. Pleijel, H.; Klingberg, J.; Nerentorp, M.; Broberg, M.C.; Nyirambangutse, B.; Munthe, J.; Wallin, G. Mercury Accumulation in Leaves of Different Plant Types—The Significance of Tissue Age and Specific Leaf Area. Biogeosciences 2021, 18, 6313–6328. [Google Scholar]
  97. Enrico, M.; Roux, G.L.; Marusczak, N.; Heimbürger, L.-E.; Claustres, A.; Fu, X.; Sun, R.; Sonke, J.E. Atmospheric Mercury Transfer to Peat Bogs Dominated by Gaseous Elemental Mercury Dry Deposition. Environ. Sci. Technol. 2016, 50, 2405–2412. [Google Scholar] [CrossRef]
  98. Wang, B. Mercury Methylation in Boreal Peatlands; Swedish University of Agricultural Sciences: Uppsala, Sweden, 2020. [Google Scholar]
  99. Veber, G.; Kull, A.; Villa, J.A.; Maddison, M.; Paal, J.; Oja, T.; Iturraspe, R.; Pärn, J.; Teemusk, A.; Mander, Ü. Greenhouse Gas Emissions in Natural and Managed Peatlands of America: Case Studies along a Latitudinal Gradient. Ecol. Eng. 2018, 114, 34–45. [Google Scholar] [CrossRef]
  100. Orella, J.; Africa, D.R.; Bustillo, C.H.; Pascua, N.; Marquez, C.; Adornado, H.; Aguilos, M. Above-and-Belowground Carbon Stocks in Two Contrasting Peatlands in the Philippines. Forests 2022, 13, 303. [Google Scholar] [CrossRef]
  101. Yamulki, S.; Anderson, R.; Peace, A.; Morison, J.I.L. Soil CO2, CH4 and N2O Fluxes from an Afforested Lowland Raised Peatbog in Scotland: Implications for Drainage and Restoration. Biogeosciences 2013, 10, 1051–1065. [Google Scholar] [CrossRef]
  102. Leitner, S.; Sae-Tun, O.; Kranzinger, L.; Zechmeister-Boltenstern, S.; Zimmermann, M. Contribution of Litter Layer to Soil Greenhouse Gas Emissions in a Temperate Beech Forest. Plant Soil 2016, 403, 455–469. [Google Scholar] [CrossRef]
  103. Adviento-Borbe, M.A.A.; Doran, J.W.; Drijber, R.A.; Dobermann, A. Soil Electrical Conductivity and Water Content Affect Nitrous Oxide and Carbon Dioxide Emissions in Intensively Managed Soils. J. Environ. Qual. 2006, 35, 1999–2010. [Google Scholar] [CrossRef]
  104. Kettunen, A.; Kaitala, V.; Lehtinen, A.; Lohila, A.; Alm, J.; Silvola, J.; Martikainen, P.J. Methane Production and Oxidation Potentials in Relation to Water Table Fluctuations in Two Boreal Mires. Soil Biol. Biochem. 1999, 31, 1741–1749. [Google Scholar] [CrossRef]
  105. Bubier, J.L.; Moore, T.R.; Juggins, S. Predicting Methane Emission from Bryophyte Distribution in Northern Canadian Peatlands. Ecology 1995, 76, 677–693. [Google Scholar] [CrossRef]
Figure 1. Location of the research sites in Latvia.
Land 11 01414 g001
Figure 7. Canonical correspondence analysis (CCA) ordination of research site groups and environmental factors.
Land 11 01414 g007
Table 1. Characterization of the research sites in Latvia.
Management-Induced DisturbanceShort Description of Management-Induced DisturbanceCurrent Land Use/Type of VegetationResearch SiteLatitude,
Longitude
Short Description of Research Site
Undisturbed peatlandNatural (pristine) peatland—undrained, peat have not been extracted previouslyTransitional mireKalnezers Mire56.68218°, 24.73467°Transitional mire
Kazu Mire57.27769°, 24.82021°Transitional mire
Raised bogLielsala Mire57.34391°, 22.31912°Raised bog
Ķemeri Mire56.87991°, 23.53509°Raised bog
Disturbed peatlandDrained, peat has not been extracted previouslyForestNelaubitis 156.68866°, 25.81881°Middle-aged Norway spruce forest
Nelaubitis 256.68880°, 25.81911°Middle-aged Norway spruce forest
Drained, peat have been extracted previouslyAbandoned peat extraction site (bare peat)Cena Mire56.82469°, 23.98031°Abandoned peat extraction site not covered with vegetation (bare peat)
Medemas Mire56.84537°, 24.10886°Abandoned peat extraction site not covered with vegetation (bare peat)
Abandoned peat extraction site with ground vegetationCena Mire56.82370°, 23.97979°Abandoned peat extraction site with ground vegetation
Cepļa Mire57.22008°, 26.47591°Abandoned peat extraction site with ground vegetation
Active peat extraction site (bare peat)Kaigu Mire56.75713°, 23.59221°Active peat extraction site not covered with vegetation (bare peat)
Ušuru Mire57.03207°, 26.65576°Active peat extraction site not covered with vegetation (bare peat)
ForestViršu Mire56.84503°, 24.10710°Broadleaved (Silver birch) forest on peatland (12 years old)
Cepļa Mire57.21663°, 26.47955°Coniferous (Norway spruce) forest on peatland, >20 years old
Lielsala Mire57.35506°, 22.32453°Broadleaved (Silver birch) forest on peatland, >20 years old
Kaigu Mire56.74530°, 23.60078°Coniferous (Norway spruce) forest on peatland, >20 years old
Perennial grasslandKašķu Mire56.91085°, 23.58174°Perennial grassland on peatland
Lielsala Mire57.35663°, 22.32327°Perennial grassland on peatland
Commercial berry plantationKaigu Mire56.71175°, 23.60297°Commercial blueberry plantation on peatland
Kalna Mire57.45605°, 26.45604°Commercial cranberry plantation on peatland
Kalna Mire57.45563°, 26.45783°Commercial blueberry plantation on peatland
Ušuru Mire57.03258°, 26.65852°Commercial cranberry plantation on peatland
Publisher’s Note: MDPI stays neutral with regard to jurisdictional claims in published maps and institutional affiliations.

