Article

GHG Emissions from Drainage Ditches in Peat Extraction Sites and Peatland Forests in Hemiboreal Latvia

Latvian State Forest Research Institute ‘Silava’ (LSFRI Silava), Rigas Str. 111, LV-2169 Salaspils, Latvia
*
Author to whom correspondence should be addressed.
Land 2022, 11(12), 2233; https://doi.org/10.3390/land11122233
Submission received: 31 October 2022 / Revised: 23 November 2022 / Accepted: 5 December 2022 / Published: 7 December 2022

Abstract

:
We determined the magnitude of instantaneous greenhouse gas (GHG) emissions from drainage ditches in hemiboreal peatlands in Latvia during the frost-free period of 2021 and evaluated the main affecting factors. In total, 10 research sites were established in drained peatlands in Latvia, including active and abandoned peat extraction sites and peatland forests. Results demonstrated that in terms of global warming potential, the contribution of CO2 emissions to the total budget of GHG emissions from drainage ditches can exceed the CH4 contribution. The average CO2 and N2O emissions from drainage ditches in peatland forests were significantly higher than those from ditches in peat extraction sites, while there was no difference in average CH4 emissions from ditches between peatland forests and peat extraction sites. Emissions from ditches of all GHGs increased with increasing temperature. In addition, CO2 and N2O emissions from drainage ditches increased with decreasing groundwater (GW) level. They were also negatively correlated with water level in ditches, but positively with potassium (K) and total nitrogen (TN) concentrations in water. By contrast, CH4 emissions from drainage ditches increased with increasing GW level and water level in ditches but were negatively correlated with K and TN concentrations in water.

1. Introduction

Drainage ditch networks are common man-made elements of many landscapes with peat (organic) soils and are generally dug to lower GW levels for peat drying and subsequent extraction and/or to improve agricultural and forest productivity [1,2,3,4,5]. Establishment and maintenance of drainage systems ensure sufficient aeration of upper soil layers to support development and growth of vegetation, including trees [1], but simultaneously cause soil disturbances, which alter GHG emissions and removals at the landscape level [6,7]. In Latvia, drainage of agricultural lands began to be extended at the end of the 16th century and the start of the 17th century, but drainage of forest land started only in the first half of the 19th century [8]. The first records of peat extraction in Latvia date back to the second half of the 17th century and the early 18th century [9]. Currently, in Latvia, drained organic soils comprise 425.1 kha in forest land, 76.0 kha in grassland, 78.6 kha in cropland, 39.7 kha in wetlands (peat extraction fields), and 9.3 kha in settlements (628.6 kha in total) [10].
As drained peatlands in general contribute significantly to the global anthropogenic GHG emissions [11], peatland management has received much attention, especially during the past several years (e.g., [12]) in the context of ambitious aims to achieve carbon (C) neutrality by 2050–2070 under the Paris Agreement [13]. GHG emissions not only from the drained soils but also from drainage ditches themselves, especially eutrophic ditches with organic-rich sediment, can appreciably contribute to the total GHG budgets of drained areas [14,15,16,17]. Emissions from ditches, which are anthropogenic in origin, cannot therefore be ignored when landscape- or national-scale GHG budgets are estimated [5,6,7,18]. The latest Intergovernmental Panel on Climate Change (IPCC) guidelines for national GHG inventories also provide methodologies and emission factors for CH4 emissions from drainage ditches, while methodologies and emission factors for CO2 and N2O emissions from drainage ditches have until now not been provided [6,19].
Carbon dioxide (CO2) is produced by the respiration of both plants and soil microorganisms and by other biological processes in sediments [16,20]. During the daytime, CO2 emissions may decrease due to CO2 uptake by photosynthetically active aquatic plants [20]. Although CO2 is highly soluble in water, oversaturation of CO2 near the sediment/water interface can release CO2 to the atmosphere [16]. The magnitude of methane (CH4) emissions depends on the dominance of two counteracting microbial processes: methanogenesis, which is the production of CH4 either by acetate fermentation or by CO2 reduction in anoxic conditions (the terminal microbial process of organic matter degradation), and the following oxidation of the generated CH4 into CO2 by methanotrophic bacteria [16,21]. Nitrous oxide (N2O) emissions result from biogeochemical interactions between reactive nitrogen (N), microorganisms (nitrification and denitrification processes), aquatic plants, and the environment, and such emissions help to identify drainage ditches, especially those suffering from eutrophication, as sources of N2O [22,23,24,25]. In general, GHG is transported to the atmosphere through water by three main pathways: (1) diffusion between soil and atmosphere (2) bubble ebullition, and (3) plant-mediated transport [20,26,27].
GHG production is driven by biochemical processes (microbial processes being the key processes) and emissions as the terminal process is regulated by variables such as the trophic state of the water body; sediment texture and chemistry, including organic matter availability; water chemistry, including pH and electrical conductivity (EC), oxygen (O2) saturation and the presence of electron acceptors such as O2, NO3, Fe3+, and SO42− (redox conditions); and sediment and water temperature (e.g., [2,16,25,28,29,30,31,32]). In addition, GHG emissions from drainage ditches vary depending on factors such as water level and flow rate in a ditch, frequency and duration of drought, water body morphology, plant community composition, and dominant land use in the catchment (e.g., [5,7,17,33]).
Our objective in this study was to investigate the magnitude of GHG emissions (CO2, CH4 and N2O exchange at the water/air interface) from drainage ditches in hemiboreal peatlands in Latvia and to identify the main affecting factors. As research sites were located both in peat extraction sites (active peat extraction sites, abandoned peat extraction sites with bare peat and with shrub and herbaceous plant vegetation) and in peatland forests (dominated by Scots pine and silver birch), the results allowed for indirect assessment of the potential impact of afforestation of peat extraction sites on GHG emissions from drainage ditches.

2. Materials and Methods
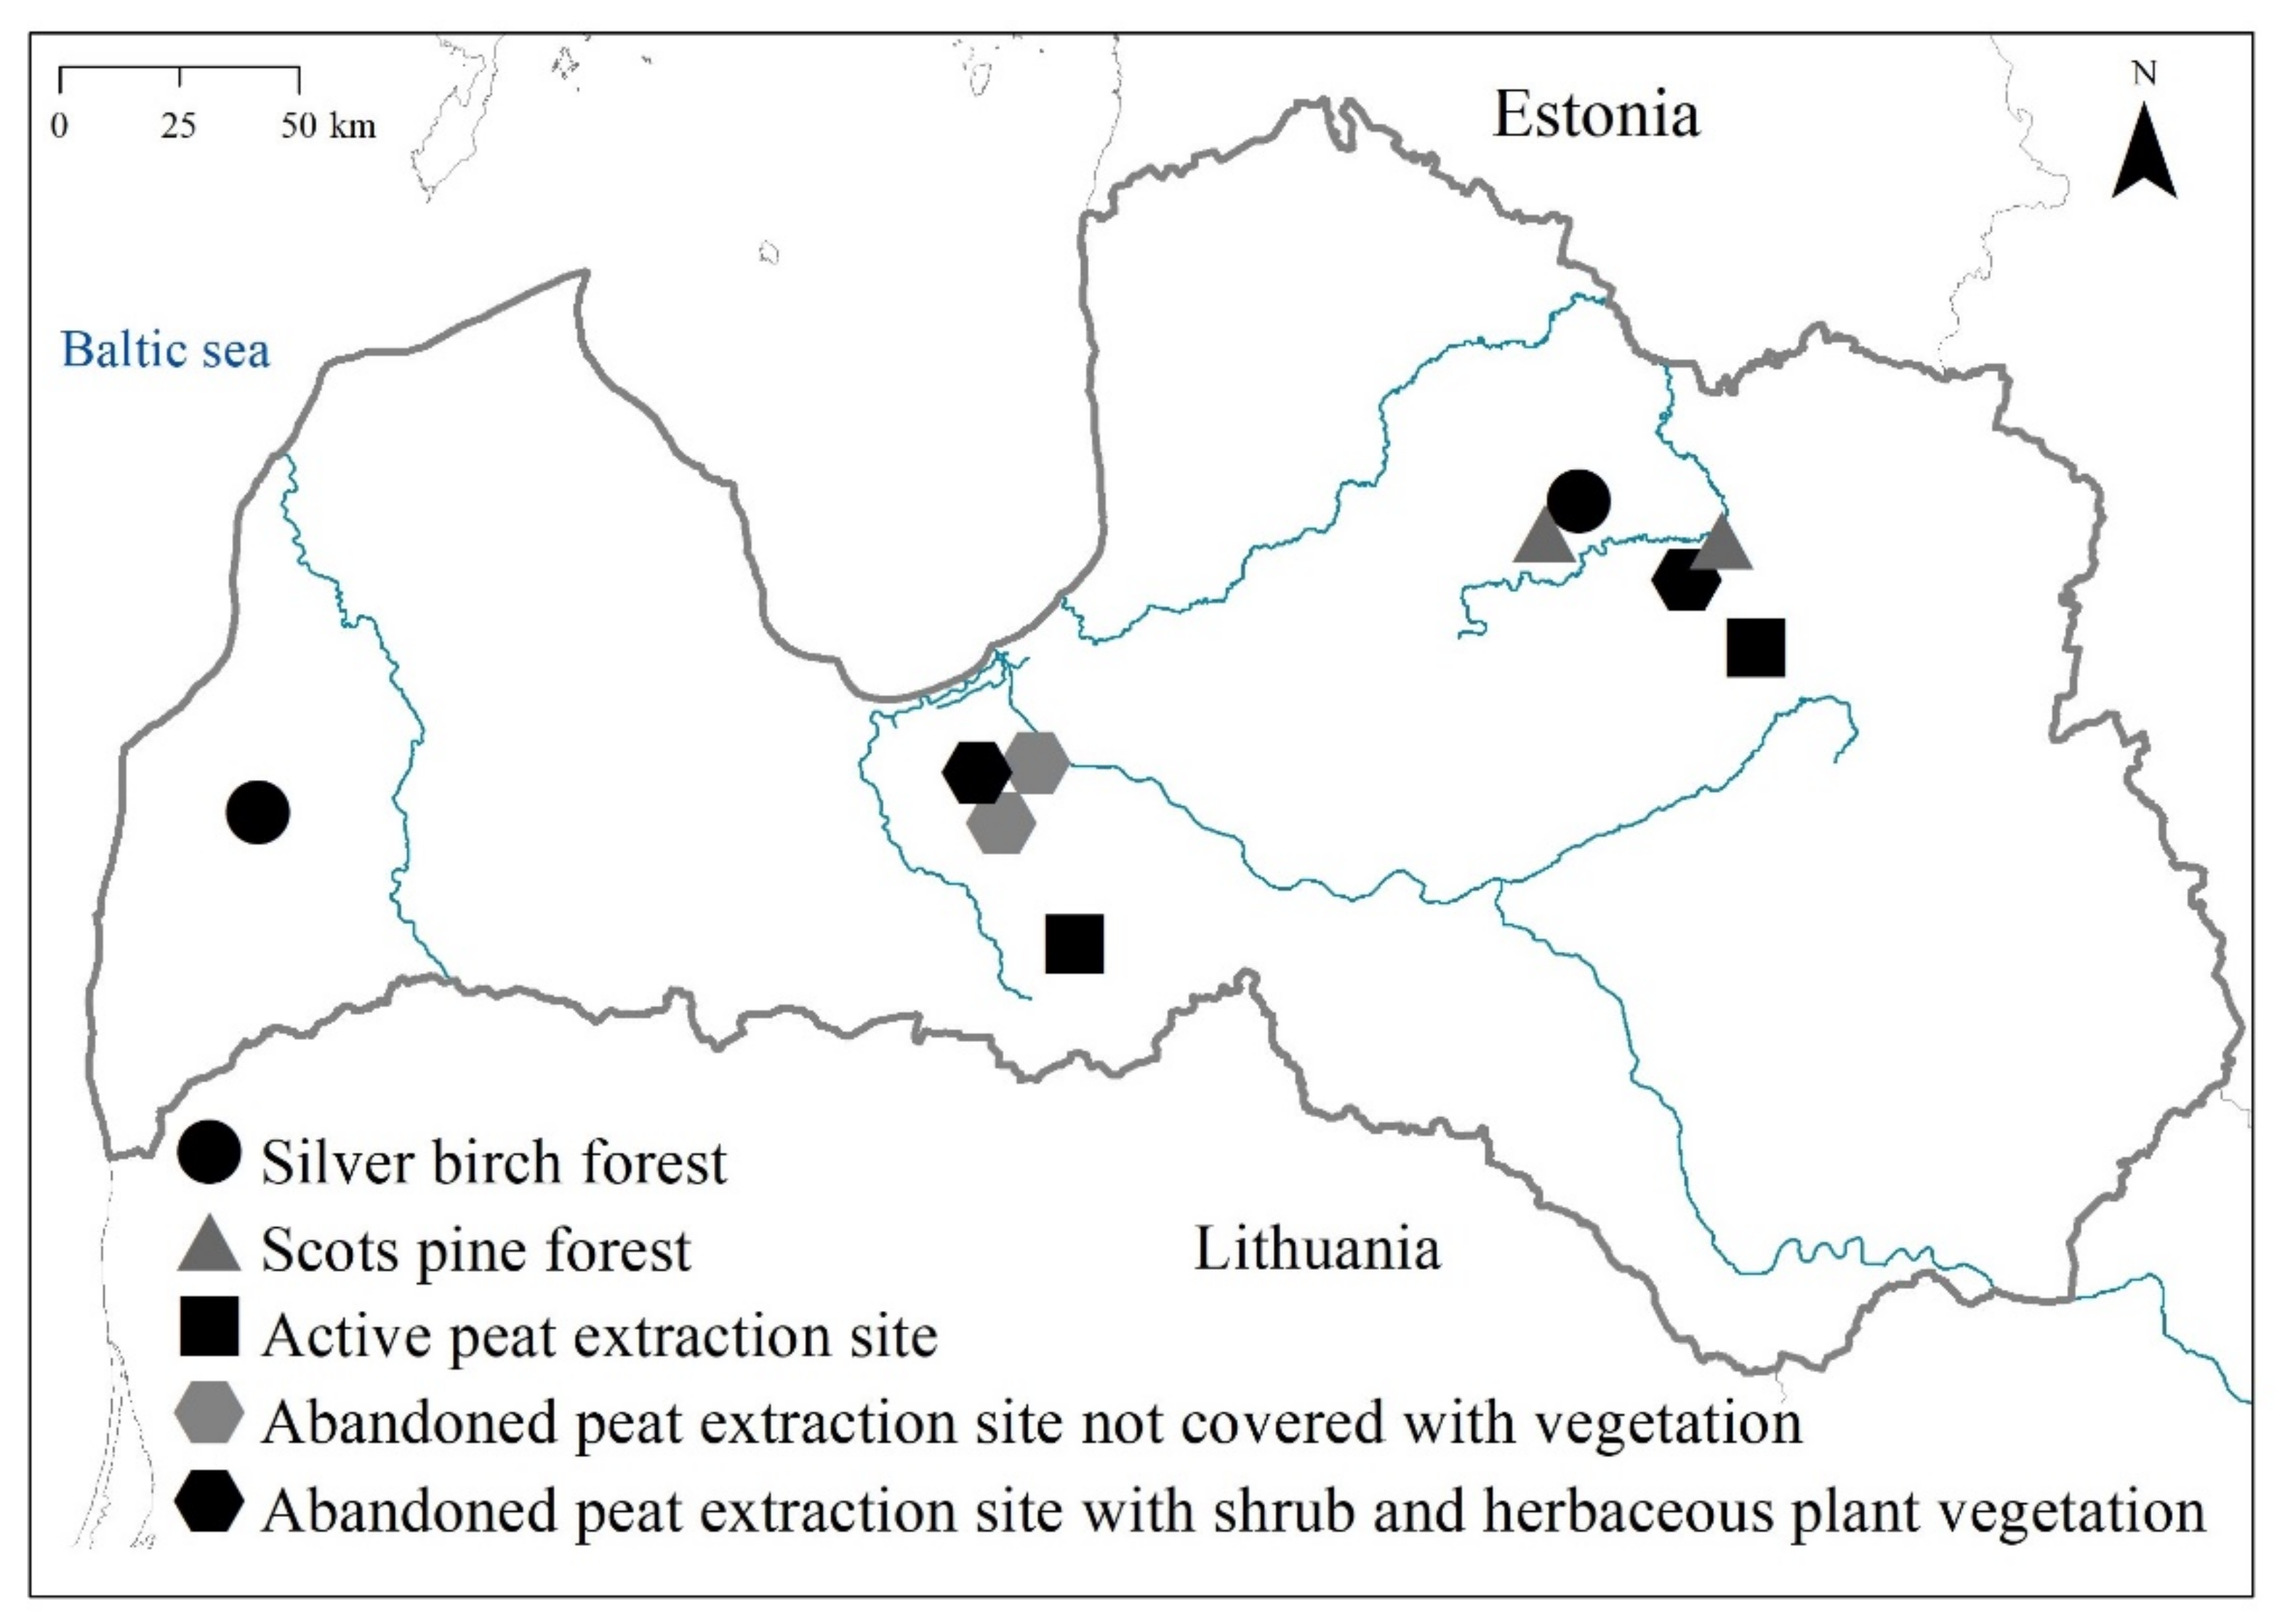
2.1. Research Sites

This study was conducted in ten research sites in drained hemiboreal peatlands (former and active peat extraction fields) in Latvia covering different regions (Figure 1) during the frost-free period of 2021. In 2021, the weather conditions in Latvia were typical (representative) for the region and no significant deviations from the norm were detected. In 2021, the mean annual precipitation in Latvia was 676.3 mm, and it was 1% below the annual norm (685.6 mm). Thus, 2021 was already the 4th consecutive year with less than usual precipitation. The mean annual air temperature was 7.0 °C, the minimum mean monthly temperature was −5.2 °C (February 2021), and the maximum mean monthly temperature was 21.5 °C (July 2021). In 2021, the average air temperature was 0.2 °C warmer than the climatic standard norm (1991–2020), and thus, 2021 was already the 9th consecutive year warmer than the climatic standard norm [34].
One representative ditch was selected at each research site (Table 1). Research sites represent and were divided into five different groups according to the type of current land use (two research sites in each group): (i) active peat extraction sites; (ii) abandoned peat extraction sites not covered with vegetation (bare peat); (iii) abandoned peat extraction sites with shrub and herbaceous plant vegetation; (iv) Scots pine forest with organic soil; and (v) silver birch forests with organic soil (Table 1). All research sites are former peat extraction fields, with the difference that four sites have been afforested following peat extraction (Table A1), four sites are abandoned, and two sites are still under active peat extraction. In all research sites, current management practice has continued for at least 20 years.

2.2. GHG Measurements

GHG flux measurements were done once per month during 2021 except the frost period of winter (from March to December randomly between 9:30 and 16:00) in 3 replicates in each ditch (distance between replicates was 10–25 m). To measure GHG fluxes, we used a closed-type GHG flux measurement chamber, which—perpendicular to the longitudinal axis of the drainage ditch—covers its entire surface, providing GHG flux measurements from a full cross-sectional area including ditch bed or water surface and slopes (ditch sides). Cross-sectional area of ditches (plane at soil surface) ranged from 0.65 m2 to 1.32 m2. The cover frame was made from metal constructions to which a durable, opaque plastic film was attached; the outer side was white and the inner side was black to reflect sunlight and minimize internal temperature fluctuations in the chamber. The metal construction covered the surface of the drainage ditch, while the plastic film was pressed to the ditch profile using a stainless steel chain placed along the perimeter of the gas exchange chamber. The chamber can be used for GHG flux measurements from drainage ditches with different depths, widths, profiles, and water levels, as its length and height can be changed, ensuring the possibility of performing measurements in different environmental conditions. During the measurements, selected width (50 cm constantly), height, and length of the chamber were fixed. Inside the GHG flux measurement chamber, there was a small ventilator installed to ensure that air inside the chamber was continuously mixed. A portable Fourier Transform Infrared (FTIR) spectroscopy (Gasmet DX4040 gas analyzer [35]) was used to measure GHG fluxes. GHG flux measurements—changes in the average content of CO2, CH4, and N2O in atmosphere enclosed in the chamber within 2 min time intervals for 30 min period (respectively, every measurement period was characterized by 15 individual measurements per chamber)—were recorded using software “Calcmet Lite v2.0” [35].

2.3. Measurements of Environmental Variables

At each GHG measurement event, environmental variables were measured. These variables included GW level and the soil and air temperatures, which were measured using Comet Data Logger sensors (Comet System s.r.o., Roznov pod Radhostem, Czech Republic) [36], and the atmospheric pressure, which was measured using Gasmet DX4040 (Gasmet Technologies Oy, Vantaa, Finland) [35]. The water level in drainage ditches was also measured (zero means that the ditch was dry). Three GW wells were sunk in each research site next to the ditch: Positive values mean that the water level was below the soil surface, negative that the water level is was above the soil surface (that is, the area was flooded). Cloudiness, windiness and atypical environmental conditions were fixed.
In addition, GW was sampled at each GHG measurement event and the samples were transported to the LVS EN ISO 17025:2018 accredited laboratory at the Latvian State Forest Research Institute “Silava” and prepared for analysis. The following general chemistry parameters were determined: pH according to LVS ISO 10523:2012; electrical conductivity (EC) according to LVS EN 27888:1993; total nitrogen (TN) and dissolved organic carbon (DOC) concentrations were determined using a FORMACSHT TOC/TN Analyser (ND25 nitrogen detector) according to LVS EN 12260:2004 and to LVS EN 1484:2000; and potassium (K), calcium (Ca), and magnesium (Mg) concentrations in water were determined using the flame atomic absorption spectroscopy (Thermo Fisher Scientific iCE3500, Thermo Fisher Scientific (Asheville) LLC, USA, Serial No: AA05191115) according to LVS EN ISO 7980:2000 and LVS ISO 9964-3:2000. Water samples from ditches were not collected due to the ditches being empty for most of the year.

2.4. Statistical Analysis

All statistical analyses were carried out using the R [37]. A Kruskal–Wallis rank sum test and pairwise comparisons using the Wilcoxon rank sum exact test were used to evaluate possible differences in the mean values of GHG emissions and environmental variables, including GW chemistry between different groups (for instance, groups of current peatland uses), with a significance level of 0.05. Correlations between GHG emissions and different environmental variables were tested with Spearman’s ρ (R package “corrplot” [38]), using a significance level of 0.05 (the function rcorr() from R package “Hmisc” was used to compute the significance levels for Spearman correlations [39]).
Environmental variables such as temperature, water level in ditches, GW level and general chemistry (X) were used to explain the variance of instantaneous GHG emissions from drainage ditches (Y) in partial least squares (PLS) regression—a useful multivariate method for dealing with variables that are linearly related to each other, as this method is robust against intercorrelations among X-variables. R package “mdatools” [40] was used to compute the PLS regression. In PLS, X variables are ranked according to their relevance in explaining Y, commonly expressed as variables important for projection (VIP values). Only X variables with VIP values exceeding 0.5 were used in PLS regression, and VIP values exceeding 1.0 are considered as important X variables [41,42,43].

3. Results

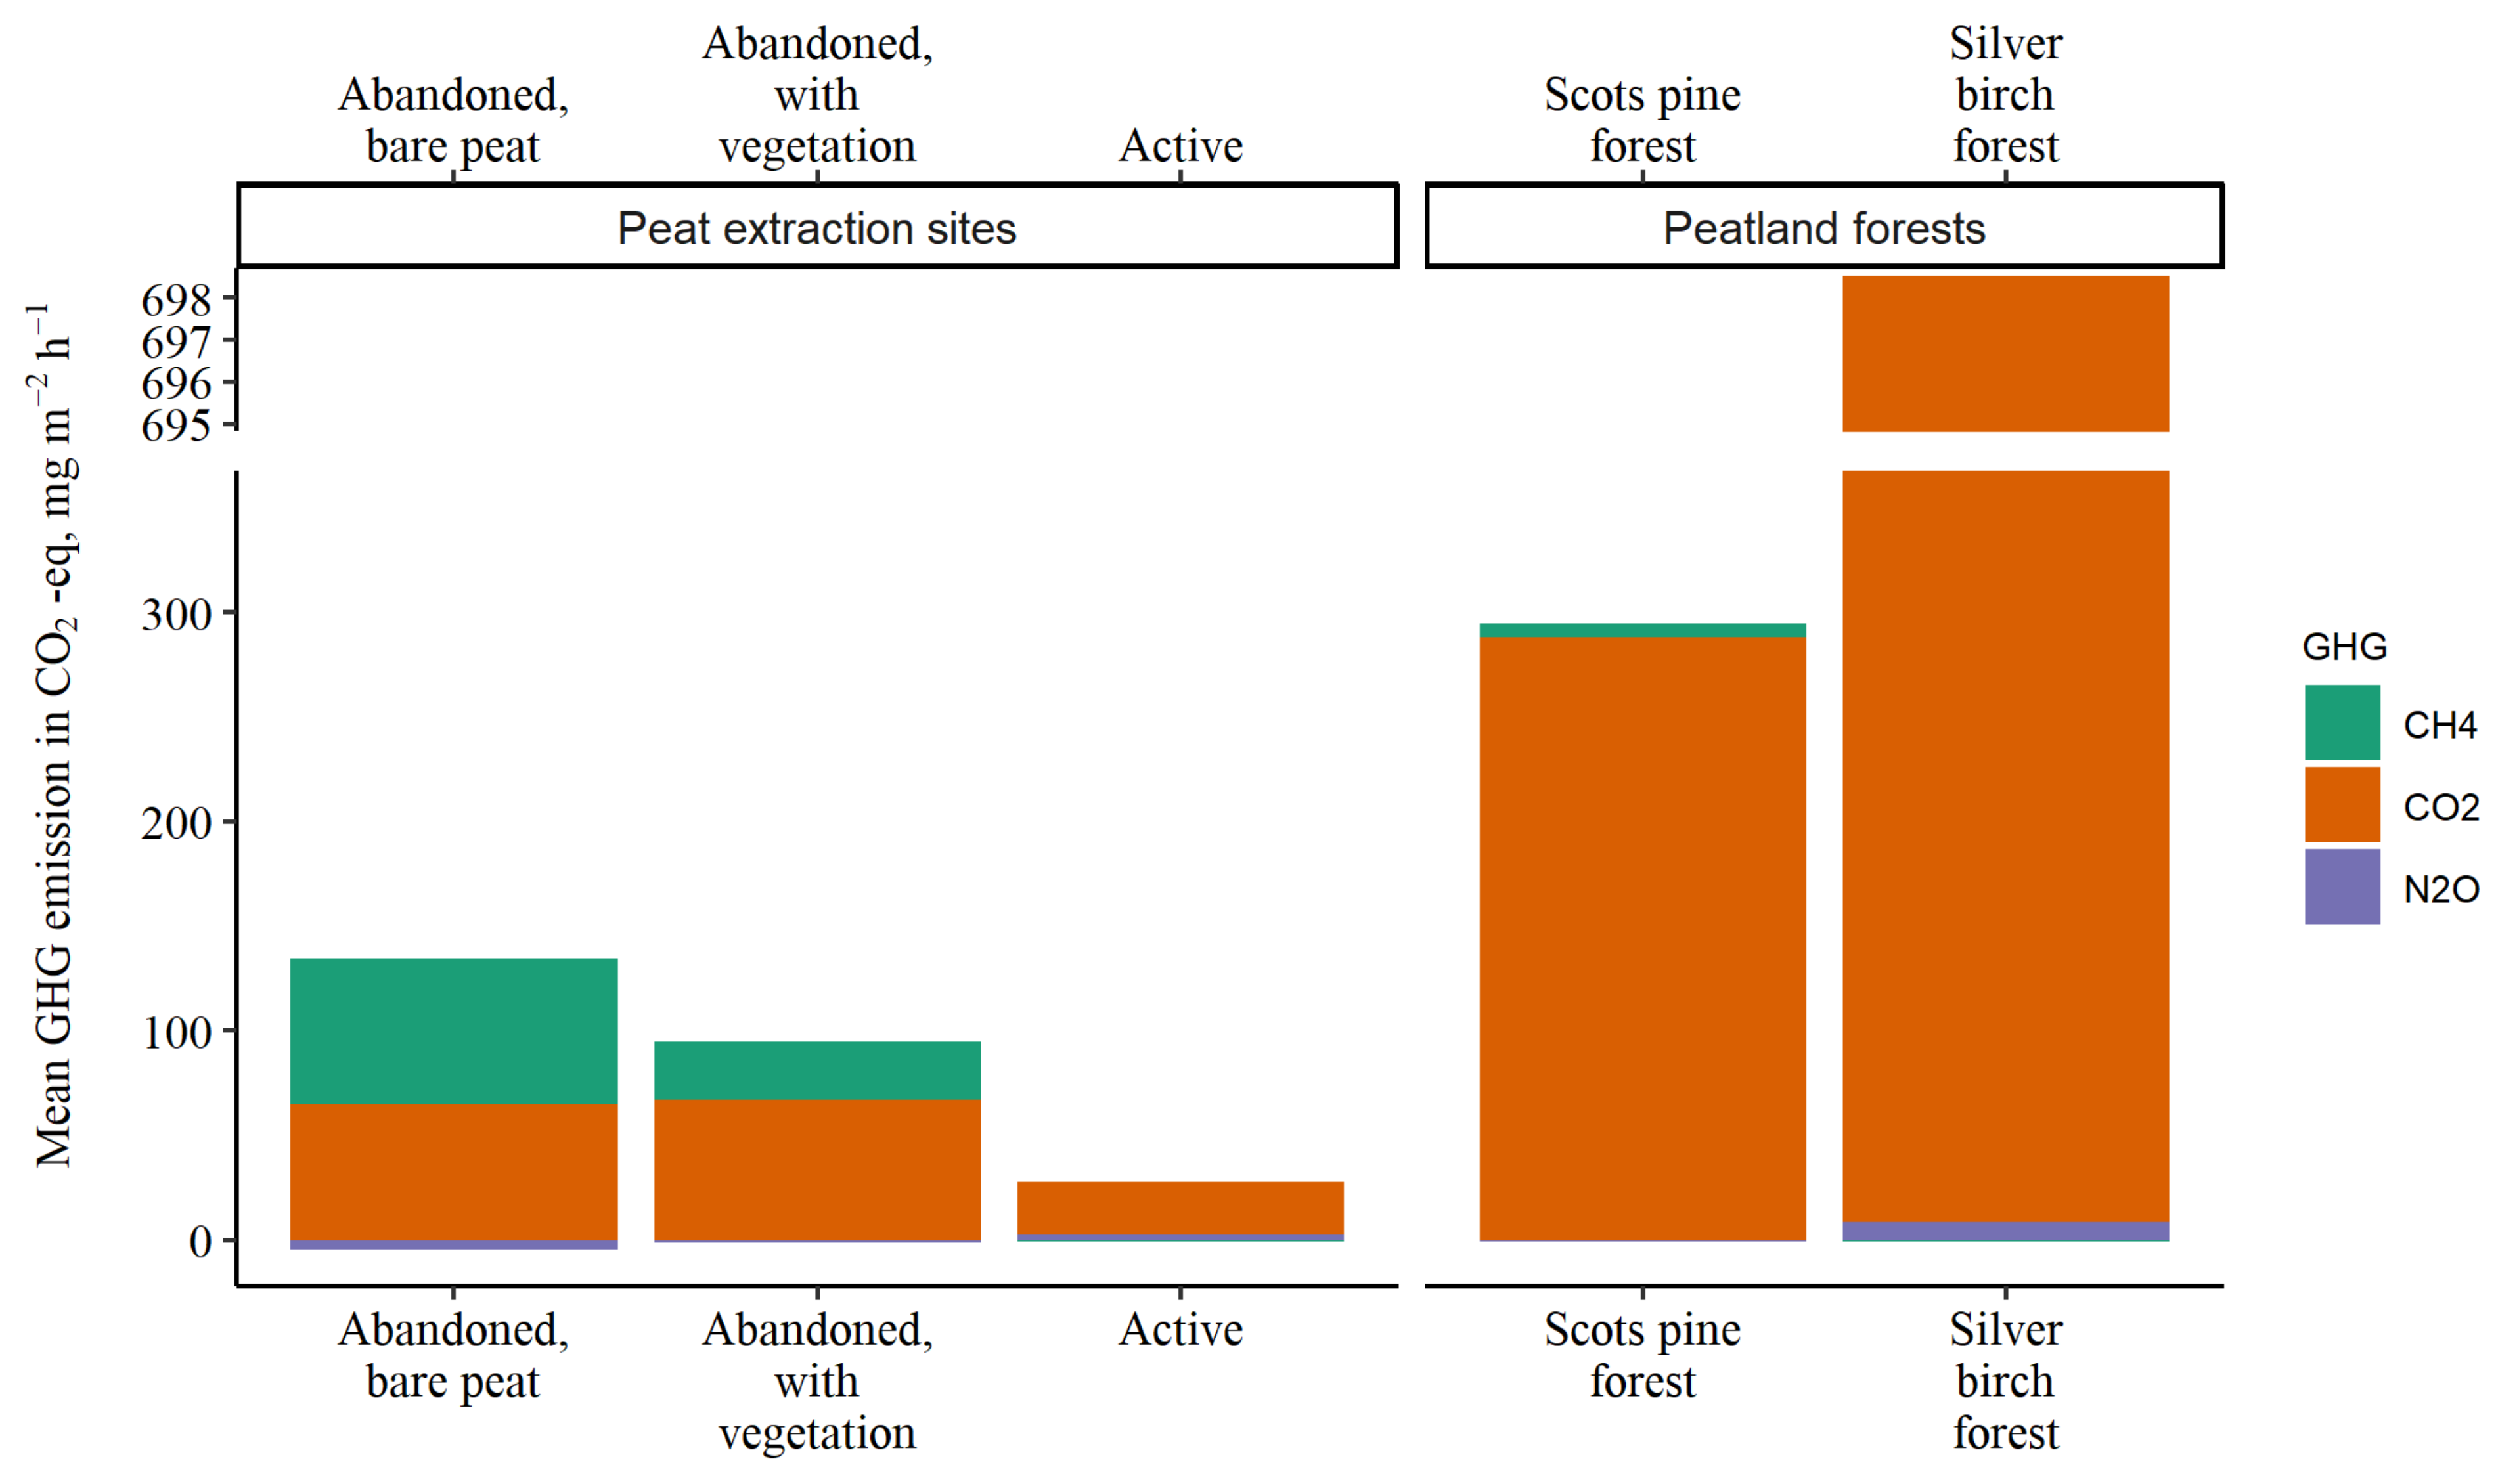
3.1. Variation of Instantaneous GHG Emissions among Different Type of Peatlands and Across Seasons

CO2 emissions from drainage ditches (Figure 2) tended to be higher in peatland forests where episodic, exceptionally high values of instantaneous CO2 emissions were observed during the summer and spring seasons (ranging from 3.1 mg CO2-C m−2 h−1 in the frost-free period of the winter season to 727.1 mg CO2-C m−2 h−1 in summer) compared to peat extraction sites (ranging from −4.6 mg CO2-C m−2 h−1 in autumn to 83.8 mg CO2-C m−2 h−1, also in autumn). In peatland forests, the mean value of instantaneous CO2 emissions was 136.6 ± 28.7 mg CO2-C m−2 h−1 (median value 61.0 mg CO2-C m−2 h−1), while in peat extraction sites the mean value was 14.7 ± 2.4 mg CO2-C m−2 h−1 (median value 10.1 mg CO2-C m−2 h−1). Mean values of CO2 emissions from each individual ditch revealed that all studied drainage ditches acted as sources of CO2 emissions to the atmosphere. Furthermore, the CO2 emissions in summer were significantly higher than the CO2 emissions recorded in autumn, winter, and spring (p = 0.008, p = 0.002, p = 0.008, respectively).
Instantaneous CH4 emissions from drainage ditches (Figure 2) ranged from −2.2 mg CH4-C m−2 h−1 in abandoned peat extraction sites with shrub and herbaceous plant vegetation in summer to 12.6 mg CH4-C m−2 h−1 in abandoned peat extraction sites with bare peat, also in summer. The mean value of CH4 emissions was 0.085 ± 0.034 mg CH4-C m−2 h−1 (median value 0.024 mg CH4-C m−2 h−1) in peatland forests, while in peat extraction sites the mean value was 1.07 ± 0.45 mg CH4-C m−2 h−1 (median value 0.035 mg CH4-C m−2 h−1). Mean values of CH4 emissions from each individual ditch revealed that most of the studied drainage ditches acted as sources of CH4 emissions to the atmosphere, except for three ditches where a removal of CH4 was observed (minimum mean CH4 emission value was −0.35 mg CH4-C m−2 h−1 in abandoned peat extraction site with shrub and herbaceous plant vegetation). Significant seasonality impact on CH4 emissions was not observed.
The highest instantaneous N2O emissions (Figure 2) were found in silver birch forests (ranging from −0.004 mg N2O-N m−2 h−1 in summer to 0.076 mg N2O-N m−2 h−1 in spring) compared to peat extraction sites (ranging from −0.107 mg N2O-N m−2 h−1 in summer to 0.065 mg N2O-N m−2 h−1 in summer) and Scots pine forests (ranging from −0.009 mg N2O-N m−2 h−1 in summer to 0.010 mg N2O-N m−2 h−1 in spring). Mean value of N2O emissions was 0.009 ± 0.003 mg N2O-N m−2 h−1 (median value 0.001 mg N2O-N m−2 h−1) in peatland forests, while in peat extraction sites the mean value was −0.003 ± 0.004 mg N2O-N m−2 h−1 (median value −0.001 mg N2O-N m−2 h−1). Mean values of N2O emissions from each individual ditch revealed that half (50%) of the studied drainage ditches acted as sources of N2O emissions to the atmosphere (the maximum mean N2O emission value was 0.033 mg N2O-N m−2 h−1 in the silver birch forest), but the other half of the studied drainage ditches acted as sinks of N2O emissions (the minimum mean N2O emission value was −0.013 mg N2O-N m−2 h−1 in abandoned peat extraction site with bare peat). As with CH4 emissions, significant differences in the N2O emissions between seasons were not found (p > 0.75).
The comparison of the contributions of different GHG emission in terms of warming potential is given in Figure 3, where CH4 and N2O emissions have been recalculated to CO2 equivalents (CH4 and N2O is 25 and 298 times as potent as CO2, respectively). In all ditches, except ditches in abandoned peat extraction sites with bare peat, the dominant GHG in terms of warming potential was CO2. The contribution of CH4 emissions from drainage ditches in silver birch forests and active peat extraction sites (−0.43 and −0.63 mg CO2-eq. m−2 h−1, respectively), as well as the contribution of N2O emissions from drainage ditches in Scots pine forests and abandoned peat extraction sites with shrub and herbaceous plant vegetation (−0.58 and −1.39 mg CO2-eq. m−2 h−1, respectively) was negligible.

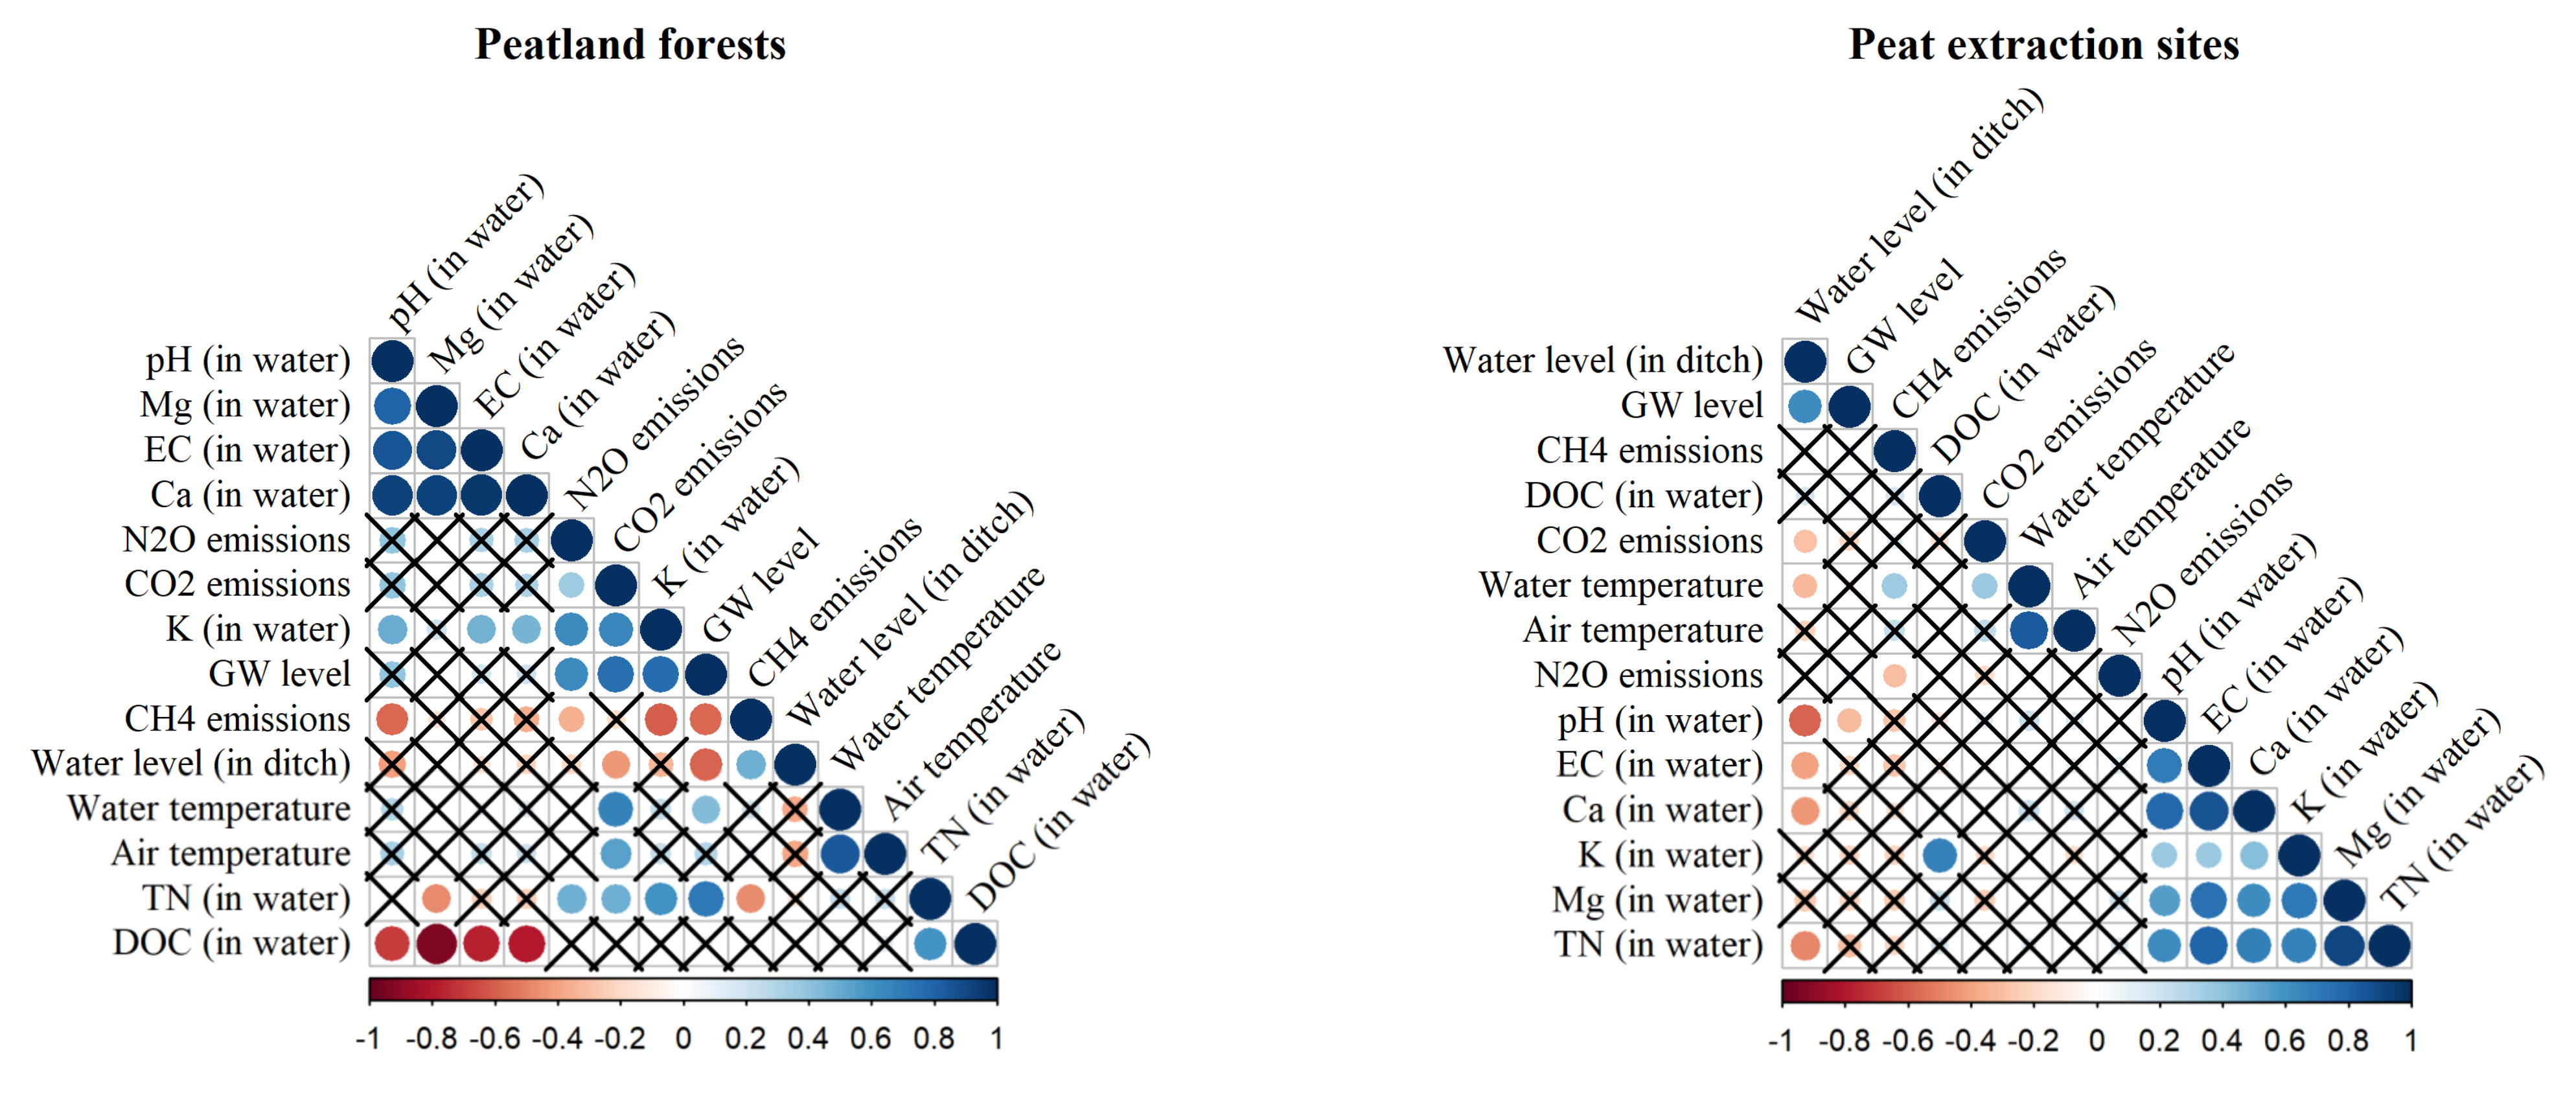
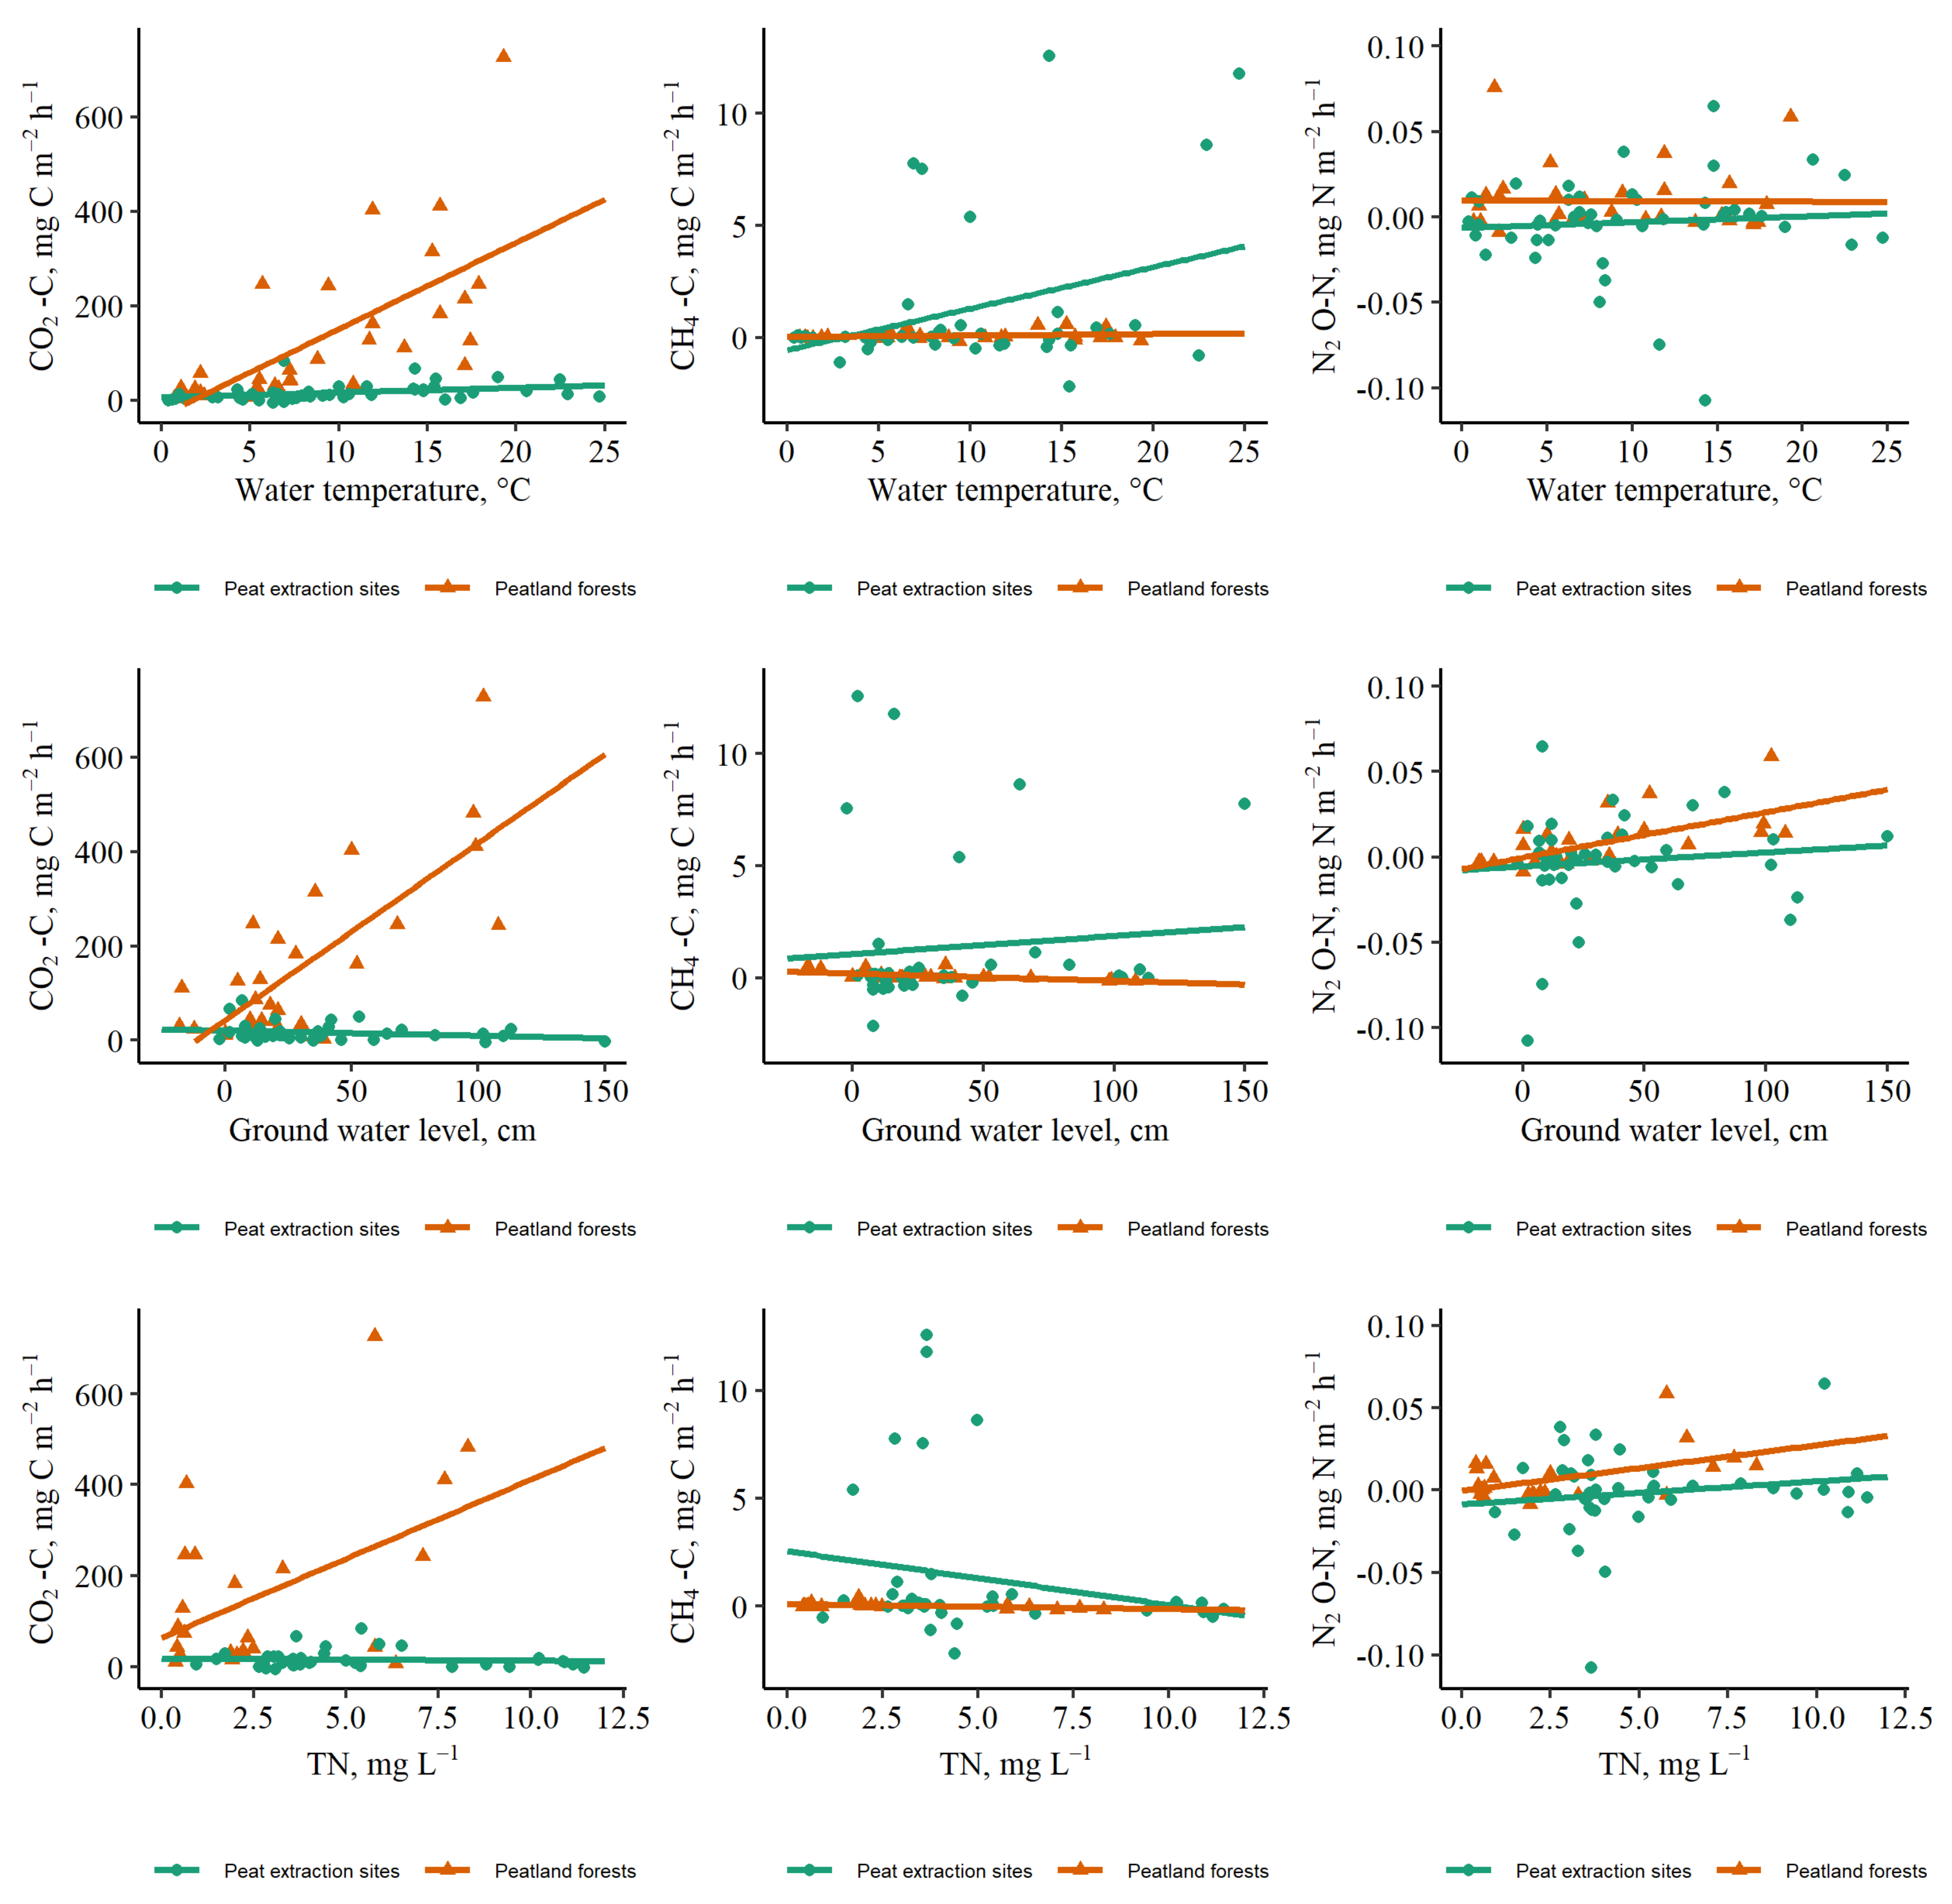
3.2. Evaluation of Affecting Factors

The instantaneous CO2 emissions from drainage ditches both in peatland forests and peat extraction sites were positively correlated with water temperature (ρ = 0.68 and ρ = 0.37, respectively) and negatively with water level in ditches (ρ = −0.43 and ρ = −0.30, respectively) (Figure 4 and Figure 5). Furthermore, in peatland forests, the average CO2 emissions from dry ditches were significantly higher than from water-filled ditches (p < 0.001) (Figure 6). In peat extraction sites, there was no detectable difference in the average CO2 emissions between water-filled and dry ditches. In addition, in peatland forests, CO2 emissions were positively correlated with the GW level (ρ = 0.76), K and TN concentrations in water (ρ = 0.66 and ρ = 0.48, respectively), and air temperature (ρ = 0.54) (Figure 4 and Figure 5). A PLS model (R2 = 0.64, Q2 = 0.41) revealed that the variation in instantaneous CO2 emissions from drainage ditches in peatland forests was generally explained by the GW level (VIP = 1.5), water temperature (VIP = 1.3), K concentrations in water (VIP = 1.2), and air temperature (VIP = 1.0), while in peat extraction sites a PLS model was weak (R2 = 0.26, Q2 < 0.10).
Instantaneous CH4 emissions from drainage ditches in peatland forests were negatively correlated with the GW level (ρ = −0.57), pH (ρ = −0.57), and K and TN concentration in water (ρ = −0.60 and ρ = −0.46, respectively), and positively with the water level in ditches (ρ = 0.48). In peat extraction sites, CH4 emissions from drainage ditches were positively correlated with water temperature (ρ = 0.36) (Figure 4 and Figure 5). Although higher average CH4 emissions were recorded from water-filled ditches compared to dry ditches, there was no significant difference in CH4 emissions between water-filled and dry ditches (Figure 6). A PLS model (R2 = 0.60, Q2 = 0.32) revealed that the variation in instantaneous CH4 emissions from drainage ditches in peatland forests was generally explained by the GW level (VIP = 1.5), water level in ditches (VIP = 1.1), and K concentrations in water (VIP = 1.1), while in peat extraction sites a PLS model was very weak (R2 = 0.21, Q2 < 0.10).
Instantaneous N2O emissions from drainage ditches in peatland forests were positively correlated with the GW level, and K and TN concentration in water (ρ = 0.63, ρ = 0.63 and ρ = 0.48, respectively) (Figure 4 and Figure 5). In peat extraction sites, there was no detectable difference in the average N2O emissions between water-filled and dry ditches, while in peatland forests the average N2O emissions from dry ditches were significantly higher than from water-filled ditches (p = 0.021), similar to the case of CO2 emissions (Figure 6). PLS models explaining variation in instantaneous N2O emissions from drainage ditches were weak both in peatland forests (R2 = 0.48, Q2 = 0.14) and peat extraction sites (R2 < 0.10, Q2 < 0.10).
In addition, cross-correlations were found between GHG emissions. While CO2 emissions from drainage ditches tended to correlate positively with N2O emissions, both CO2 and N2O emissions simultaneously tended to correlate negatively with CH4 emissions (Figure 4). Variations and mean values of water level in ditches, GW level, and parameters of GW chemistry in research sites are summarized in Table 2.

4. Discussion

4.1. CO2 Emissions

In most of the studied drainage ditches, CO2 was the dominant GHG in terms of greenhouse warming potential. The highest instantaneous CO2 emissions from drainage ditches were found in peatland forests, especially during the summer season (ranging up to 727.1 mg CO2-C m−2 h−1) when drainage ditches were dry and GW level was at least 50 cm below soil surface. In peat extraction sites, instantaneous CO2 emissions ranged from −4.6 to 83.8 mg CO2-C m−2 h−1. Although in some cases negative CO2 emissions (CO2 removals) were found (for instance, in peat extraction sites during the spring and autumn seasons), the mean values of CO2 emissions revealed that all studied drainage ditches acted as sources of CO2 emissions to the atmosphere, indicating that CO2 production exceeded CO2 uptake during photosynthesis by plants [16].
Episodic, exceptionally high instantaneous CO2 emissions from drainage ditches recorded in peatland forests in summer and spring significantly increase the mean value of CO2 emissions, which results in significant differences between the mean and median values of CO2 emissions. Thus, extrapolation and inclusion of these episodic, exceptionally high instantaneous CO2 emissions from drainage ditches in calculations of annual CO2 emissions should be done with caution to avoid overestimating annual CO2 emissions. As CO2 emissions from drainage ditches correlate significantly with several environmental variables, e.g., temperature, GW level, and the presence of surface water, the best approach for calculation of the annual CO2 emissions is very likely to use multivariate equations. Such an approach, however, requires a wide monitoring (activity) data set. Episodic increases in CO2 emissions from drainage ditches when the ditches were dry can be explained by both increased mineralization of fresh organic matter (for instance, tree litter in peatland forests) in oxic conditions and by the intensification of some of the pathways by which CO2 was transported into the atmosphere. However, a longer monitoring period of GHG emissions from drainage ditches (at least two years period) and more frequent campaigns would increase knowledge of the contribution of episodic, exceptionally high instantaneous fluxes to the annual emissions, and would improve identification and characterization of the main affecting factors determining GHG emissions.
In general, reported CO2 emissions from drained ditches vary widely. For instance, Peacock et al. (2021) revealed no significant difference in the mean CO2 emissions between drainage ditches in catchments with mineral and peat soils in boreal and hemiboreal regions and reported the mean CO2 emissions of 6016 (range −720 to 32,470) mg CO2 m−2 d−1 from drainage ditches in forests in southern Sweden [5]. Hyvönen et al. (2013) reported that the daily CO2 emission from drainage ditches in a boreal cutaway peatland cultivated with reed canary grass in eastern Finland ranged from −0.4 mg m−1 h−1 to 468.5 mg m−1 h−1 [17]. Sundh et al. (2000) reported average CO2 emissions from drainage ditches in peat-mining areas in Sweden of −112–161 mg CO2 m−2 h−1 [18], while Schrier-Uijl et al. (2011) reported that CO2 emission from the drainage ditches in peat areas in the Netherlands ranged from 69.6 mg m−2 h−1 to 199.0 mg m−2 h−1 [16].
Nevertheless, several studies have concluded that the ditches do not contribute significantly to the total site CO2 emissions (e.g., [17,18]). Our estimates of instantaneous CO2 emissions from drainage ditches in peat extraction sites did not exceed the ranges reported previously for drained peat soils in peat extraction sites in Latvia (e.g., [46]) and Estonia (e.g., [47]). By contrast, CO2 emissions from drainage ditches in peatland forests in some months even exceed maximum monthly average total CO2 emissions from soils in nutrient-rich organic forest soils in Latvia (15.81 t C ha−1 yr−1), as recently found by Butlers et al. (2022) [48]. This is explained by the impact of several episodic, exceptionally high records of instantaneous CO2 emissions in peatland forests in summer and spring, as discussed above.
Research results regarding relationships between CO2 emissions from ditches and environmental parameters, ditch parameters, presence of vegetation, water chemistry, and other parameters are not unambiguous, but mostly no correlations are reported (e.g., [16,17,18]). Nevertheless, Schrier-Uijl et al. (2011) found that a higher trophic status correlates positively with CO2 emissions, while the depth of the water and the pH correlate inversely with CO2 emissions [16]. Similarly, we found positive correlations between CO2 emissions from drainage ditches and K and TN concentrations in water, and negative correlations with water levels in the ditches. In addition, we revealed positive correlations between CO2 emissions from drainage ditches and the GW level (cm below soil surface) and temperatures (water and air). Although CO2 is highly soluble in water and can be leached [17], the dependence of CO2 emissions on temperature confirms the existence of biological (microbial) processes that regulate CO2 emissions [16].

4.2. CH4 Emissions

CH4 emissions from the studied drainage ditches ranged from −2.2 mg to 12.6 mg CH4-C m−2 h−1. The highest recorded instantaneous CH4 emissions can be characterized as episodic, exceptionally high emissions most likely caused by bubble ebullition [20,26,27]. Most of the studied drainage ditches acted as sources of CH4 emissions to the atmosphere, except for a few ditches where small CH4 removals were observed. However, our estimates are in the range of the CH4 emissions from drainage ditches reported by other studies. For instance, Peacock et al. (2021) reported a CH4 emission range from 0.1 to 386 g CH4 m−2 y−1 with a mean of 64.6 ± 11.1 g CH4 m−2 y−1 based on a literature synthesis covering both boreal, temperate, and tropical climate zones [7]. In Sweden, the mean CH4 emissions of 33.9 (range −1.3 to 1390) mg CH4 m−2 d−1 were reported from drainage ditches in forests [5], while in peat-mining areas CH4 emissions from drainage ditches reached 93 mg CH4 m−2 h−1 with a mean rate of 15.1 ± 23.9 mg CH4 m−2 h−1 [18]. In Finland, daily CH4 emissions from drainage ditches in a boreal cutaway peatland cultivated with reed canary grass ranged from –1.87 mg m−2 d−1 to 99.32 mg m−2 d−1 [17], while CH4 emissions from drainage ditch bottoms and ditch sides in Lakkasuo mire (central Finland) ranged from 0 to 595 and from 0 to 78 mg m−2 d−1, respectively; furthermore, the highest emissions were measured from the ditch bottoms covered by water [2]. Hyvönen et al. (2013) also highlighted that waterlogged ditches showed the highest CH4 emissions, which the authors explained by their having anaerobic conditions that favor CH4 production but limit CH4 oxidation [17]. Moore and Roulet (1993), Liblik et al. (1997) in Canada [49,50], and van den Pol-van Dasselaar (1998) in the Netherlands [51] found strong relationships between the average seasonal CH4 emissions and GW level. Our results support this relationship: CH4 emissions from water-filled ditches were higher than from dry ditches (although the difference was not significant). As well, we also found a positive correlation between CH4 emissions from drainage ditches and water levels in ditches, and a negative correlation between CH4 emissions and the GW level.
Several studies have highlighted that CH4 emissions from ditches tend to increase with temperature and that higher CH4 emissions were found from more eutrophic ditches (e.g., [7,16,51]. The impact of temperature is related to the decreased activity of methanogens and other bacteria implied by methanogenic fermentation at low temperatures [28]. Our results also showed a positive correlation between CH4 emissions from drainage ditches and water temperature; in contrast, we found a negative correlation between CH4 emissions and TN and K concentrations in water, which indirectly indicates the trophic status of the water. Although the activity of methanogens producing CH4 is optimum around neutrality or under slightly alkaline conditions, methanogens can partly adapt to acidic environments [28,52]. A negative correlation between CH4 emissions from drainage ditches and water pH was also found. The mean GW pH over the study period did not drop below 5.2 at our research sites, indicating that the environment in the research sites was not extremely acidic, which could have limited CH4 production.
We found no significant differences in CH4 emissions from ditches of peat extraction sites and those of peatland forests. A similar observation was made by Peacock et al. (2021) [7]. An earlier study from Latvia [46] and Estonia [47] demonstrated that CH4 emissions from drained peat soils (ranging from −32.12 to 170.44 µg CH4-C m−2 h−1 in Latvia and from −82 to 12,037 µg CH4-C m−2 h−1 in Estonia) were significantly lower in Latvia and similar in Estonia to those from the drainage ditches recorded within this study. The finding confirms that CH4 emissions from the ditches can contribute significantly to the total site CH4 emissions, including emissions from the peat soils and drainage ditches as reported by, for instance, Peacock et al. (2021) [5], Sundh et al. (2000) [18], and Roulet and Moore (2011) [21].
IPCC (2014) provided CH4 emission factors for drainage ditches in forest land with drained organic soils and peat extraction sites of 217 and 542 kg CH4 ha−1 yr−1, respectively, in boreal and temperate climate zones [6]. Our mean CH4 emission factor was 10.3 kg CH4 ha−1 yr−1 for drained peatland forests and 122.5 kg CH4 ha−1 yr−1 for peat extraction sites with the highest annual CH4 emissions in abandoned peat extraction sites with bare peat (244.3 kg CH4 ha−1 yr−1). Although our estimates demonstrated that annual CH4 emissions (emission factors) for drainage ditches in hemiboreal peatlands are notably smaller than those provided by the IPCC guidelines [6], the calculated CH4 emission factor for peat extraction sites lay in the uncertainty range of the IPCC default emissions factor (102–981 kg CH4 ha−1 yr−1). Moreover, estimates within this study demonstrated a significantly narrower range of variation of annual CH4 emissions from drainage ditches than that provided by the IPCC guidelines. However, our annual CH4 emissions were calculated as the mean of instantaneous CH4 emissions expressed in annual units (yr−1) including episodic, exceptionally high instantaneous CH4 emissions identified in abandoned peat extraction sites. As with CO2 emissions, the best approach to calculate annual CH4 emissions would very likely be to use multivariate equations that would avoid potential overestimations.

4.3. N2O Emissions

N2O emissions from the drainage ditches in the studied research sites were negligible in terms of greenhouse warming potential and ranged from −0.107 to 0.076 mg N2O-N m−2 h−1. The highest mean N2O emissions from ditches were found in silver birch forests (the mean value of 0.033 mg N2O-N m−2 h−1). Negative N2O emission values can be explained by complete denitrification, resulting in N2O conversion into inert N2 under anaerobic conditions [53]. It is supported by the findings in peatland forests, where the average N2O emissions from dry ditches were significantly higher than from water-filled ditches. As Hyvönen et al. (2013) [17] also found, a significant temporal variation of N2O emissions from ditches (difference between seasons) was not found, nor was temperature found to be a significant factor affecting N2O emissions.
An earlier study from Latvia [46] demonstrated that N2O emissions from drained peat soils were even lower and varied in a narrower range from −0.001 to 0.013 mg N2O-N m−2 h−1 compared to emissions from drainage ditches. Findings in Estonia [47], however, revealed that N2O emissions from peat soils (the average reported emissions of N2O-N varied between −22.7 and 328.8 µg N2O-N m−2 h−1) were higher than from the drainage ditches recorded in this study.

4.4. Impact of Afforestation of Peat Extraction Areas

There is some evidence of increasing tree cover both in pristine and managed boreal and temperate peatlands due to changes in climate and land use [54,55]. Increased tree cover in peatlands has a strong impact on the peat’s physical, chemical, and microbial properties [54,55] and consequently on biogeochemical cycling of elements including GHG fluxes. The results of this study indirectly demonstrated that afforestation of drained peat extraction areas would most likely lead to increased GHG emissions from drainage ditches, although only CO2 and N2O emissions were observed to be higher in peatland forests (especially in more fertile silver birch stands) than in peat extraction sites. Most probably, increased CO2 and N2O emissions from drainage ditches in peatland forests compared to peat extraction sites can be a result of mineralization of fresh tree litter especially in oxic conditions when ditches were dry. Furthermore, decomposition of litter has been faster in the deciduous stands than in the coniferous stands (e.g., [56,57,58,59,60]) and this may generally be explained by higher lignin content in coniferous litter (e.g., [56,57]). The higher CO2 and N2O emissions from drainage ditches in silver birch forests compared to the Scots pine forests observed in this study support this interpretation.
Nevertheless, the potential increase in GHG emissions from drainage ditches after afforestation of former peat extraction areas could be compensated with CO2 sequestration in tree biomass and other C pools. Recent findings also demonstrated that soils in drained and afforested peatlands can be a net sink for C (considering C input through tree litter and forest floor vegetation as well), since the amount of C entering the soil can substantially exceed the C released due to the heterotrophic decomposition of soil organic matter [59,60].

5. Conclusions

In terms of warming potential, the contribution of CO2 emissions to the total budget of GHG emission from ditches in drained peatlands can be higher than the CH4 contribution. For this reason, both GHGs must be considered (included) in calculations of a total landscape-level GHG budget. Average instantaneous CO2 and N2O emissions from drainage ditches in peatland forests were significantly higher than those from ditches in peat extraction sites, while there was no difference in the average CH4 emissions from ditches between peatland forests and peat extraction sites.
Emissions from ditches of all GHGs increased with increasing temperature. In addition, CO2 and N2O emissions from drainage ditches increased with a fall in the GW level. They were also negatively correlated with water levels in ditches, but positively correlated with K and TN concentrations in water. By contrast, CH4 emissions from drainage ditches increased with increased GW level and water levels in ditches, but were negatively correlated with K and TN concentrations in water and water pH.

Author Contributions

Conceptualization, A.L.; methodology, M.V.-D.; software, A.B. (Aldis Butlers); validation, A.B. (Arta Bārdule), I.L. and A.L.; formal analysis, M.V.-D. and A.B. (Arta Bārdule); investigation, E.M.U., M.V.-D. and D.P.; resources, A.L.; data curation, A.L.; writing—original draft preparation, A.B. (Arta Bārdule), A.B. (Aldis Butlers) and M.V.-D.; writing—review and editing, A.B. (Arta Bārdule), M.V.-D., D.P. and I.L.; visualization, A.B. (Arta Bārdule) and M.V.-D.; supervision, A.B. (Aldis Butlers); project administration, A.L.; funding acquisition, A.L. All authors have read and agreed to the published version of the manuscript.

Funding

This research was funded by European Regional Development Fund project “Development of greenhouse gas emission factors and decision support tools for management of peatlands after peat extraction”, grant number 1.1.1.1/19/A/064.

Data Availability Statement

Data available on request made to the corresponding author Arta Bārdule.

Acknowledgments

The M.V.-D. contribution was supported by the Latvian Council of Science, project “Evaluation of impact of land use, soil and climate factors on greenhouse gas (GHG) emission for drainage ditches” (No.: LZP-2020/2-0193). The A.L. contribution was supported by the European Regional Development Fund support for post-doctoral studies in Latvia “Economic and environmental assessment of biomass production in buffer zones around drainage systems and territories surrounding the protective belts of natural water streams” (No.: 1.1.1.2/VIAA/3/19/437). The D.P. contribution was supported by the European Regional Development Fund project “Evaluation of factors affecting greenhouse gas (GHG) emissions reduction potential in cropland and grassland with organic soils” (No.: 1.1.1.1/21/A/031). The I.L. contribution was supported by the EU LIFE Programme project “Demonstration of climate change mitigation potential of nutrient rich organic soils in Baltic States and Finland” (LIFE OrgBalt, LIFE18 CCM/LV/001158)”. We thank Raitis Normunds Meļņiks (LSFRI Silava) for helping to prepare the map of Latvia with locations of research sites (Figure 1).

Conflicts of Interest

The authors declare no conflict of interest. The funders had no role in the design of the study; in the collection, analyses, or interpretation of data; in the writing of the manuscript; or in the decision to publish the results.

Appendix A

Table A1. Characterization of the forest stands (afforested peatland after peat extraction).
Current Land Use/Type of VegetationResearch SiteTree Diameter at Breast Height (Mean ± S.E.), cmTree Height
(Mean ± S.E.), m
Scots pine forestSite 7 (Cepļa Mire)7.9 ± 0.48.6 ± 0.5
Site 8 (MPS Mežole)21.3 ± 0.918.8 ± 1.3
Silver birch forestSite 9 (Pleces Mire)14.2 ± 0.813.7 ± 1.4
Site 10 (MPS Mežole)15.3 ± 0.316.8 ± 0.7

References

  1. Paavilainen, E.; Päivänen, J. Peatland Forestry: Ecology and Principles; Springer: Berlin/Heidelberg, Germany; New York, NY, USA, 1996. [Google Scholar]
  2. Minkkinen, K.; Laine, J.; Nykänen, H.; Martikainen, P.J. Importance of drainage ditches in emissions of methane from mires drained for forestry. Can. J. For. Res. 1997, 27, 949–952. [Google Scholar] [CrossRef]
  3. Sirin, A.; Chistotin, M.; Suvorov, G.; Glagolev, M.; Kravchenko, I.; Minaeva, T. Drained peatlands used for extraction and agriculture: Biogeochemical status with special attention to greenhouse gas fluxes and rewetting. Geophys. Res. Abstr. 2010, 12, 11623. [Google Scholar]
  4. Teh, Y.A.; Silver, W.L.; Sonnentag, O.; Detto, M.; Kelly, M.; Baldocchi, D.D. Large greenhouse gas emissions from a temperate peatland pasture. Ecosystems 2011, 14, 311–325. [Google Scholar] [CrossRef] [Green Version]
  5. Peacock, M.; Granath, G.; Wallin, M.B.; Högbom, L.; Futter, M.N. Significant emissions from forest drainage ditches—An unaccounted term in anthropogenic greenhouse gas inventories? JGR Biogeosci. 2021, 126, e2021JG006478. [Google Scholar] [CrossRef]
  6. IPCC. 2013 Supplement to the 2006 IPCC Guidelines for National Greenhouse Gas Inventories: Wetlands; Hiraishi, T., Krug, T., Tanabe, K., Srivastava, N., Baasansuren, J., Fukuda, M., Troxler, T.G., Eds.; IPCC: Geneva, Switzerland, 2014. [Google Scholar]
  7. Peacock, M.; Audet, J.; Bastviken, D.; Futter, M.N.; Gauci, V.; Grinham, A.; Harrison, J.A.; Kent, M.S.; Kosten, S.; Lovelock, C.E.; et al. Global importance of methane emissions from drainage ditches and canals. Environ. Res. Lett. 2021, 16, 044010. [Google Scholar] [CrossRef]
  8. Zālītis, P. Mežkopības Priekšnosacījumi; SIA ‘et cetera’: Riga, Latvia, 2006; pp. 68–88. [Google Scholar]
  9. Kalniņa, L. Geological inventory of areas affected by peat extraction. In Suitable and Responsible After-Use of Peat Extraction Areas; Priede, A., Gancone, A., Eds.; Baltijas Krasti: Riga, Latvia, 2019; pp. 81–90. [Google Scholar]
  10. Latvia National Inventory Report. 1990–2020. Available online: https://unfccc.int/documents/461908 (accessed on 24 October 2022).
  11. Leifeld, J.; Wüst-Galley, C.; Page, S. Intact and managed peatland soils as a source and sink of GHGs from 1850 to 2100. Nat. Clim. Chang. 2019, 9, 945–947. [Google Scholar] [CrossRef]
  12. Kreyling, J.; Tanneberger, F.; Jansen, F.; van der Linden, S.; Aggenbach, C.; Blüml, V.; Couwenberg, J.; Emsens, W.-J.; Joosten, H.; Klimkowska, A.; et al. Rewetting does not return drained fen peatlands to their old selves. Nat. Commun. 2021, 12, 5693. [Google Scholar] [CrossRef]
  13. Paris Agreement. Available online: https://unfccc.int/sites/default/files/english_paris_agreement.pdf (accessed on 24 October 2022).
  14. Liikanen, A.; Martikainen, P.J. Effect of ammonium and oxygen on methane and nitrous oxide fluxes across sediment-water interface in a eutrophic lake. Chemosphere 2003, 52, 1287–1293. [Google Scholar] [CrossRef]
  15. Saarnio, S.; Winiwater, W.; Leitão, J. Methane release from wetlands and watercourses in Europe. Atmos. Environ. 2009, 43, 1421–1429. [Google Scholar] [CrossRef]
  16. Schrier-Uijl, A.P.; Veraart, A.J.; Leffelaar, P.A.; Berendse, F.; Veenendaal, E.M. Release of CO2 and CH4 from lakes and drainage ditches in temperate wetlands. Biogeochemistry 2011, 102, 265–279. [Google Scholar] [CrossRef] [Green Version]
  17. Hyvönen, N.P.; Huttunen, J.T.; Shurpali, N.J.; Lind, S.E.; Marushchak, M.E.; Heitto, L.; Martikainen, P.J. The role of drainage ditches in greenhouse gas emissions and surface leaching losses from a cutaway peatland cultivated with a perennial bioenergy crop. Boreal Environ. Res. 2013, 18, 109–126. [Google Scholar]
  18. Sundh, I.; Nilsson, M.; Mikkelä, C.; Granberg, G.; Svensson, B.H. Fluxes of methane and carbon dioxide on peat-mining areas in Sweden. AMBIO J. Hum. Environ. 2000, 29, 499–503. [Google Scholar] [CrossRef]
  19. IPCC. 2019 Refinement to the 2006 IPCC Guidelines for National Greenhouse Gas Inventories; Calvo Buendia, E., Tanabe, K., Kranjc, A., Baasansuren, J., Fukuda, M., Ngarize, S., Osako, A., Pyrozhenko, Y., Shermanau, P., Federici, S., Eds.; IPCC: Geneva, Switzerland, 2019. [Google Scholar]
  20. Komiya, S.; Noborio, K.; Katano, K.; Pakoktom, T.; Siangliw, M.; Toojinda, T. Contribution of ebullition to methane and carbon dioxide emission from water between plant rows in a tropical rice paddy field. Int. Sch. Res. Not. 2015, 2015, 623901. [Google Scholar] [CrossRef] [PubMed] [Green Version]
  21. Roulet, N.; Moore, T. The effect of forestry drainage practices on the emission of methane from northern peatlands. Can. J. For. Res. 1995, 25, 491–499. [Google Scholar] [CrossRef]
  22. Beaulieu, J.J.; Arango, C.P.; Tank, J.L. The effects of season and agriculture on nitrous oxide production in headwater streams. J. Environ. Qual. 2009, 38, 637–646. [Google Scholar] [CrossRef]
  23. Maljanen, M.; Sigurdsson, B.D.; Guðmundsson, J.; Óskarsson, H.; Huttunen, J.T.; Martikainen, P.J. Greenhouse gas balances of managed peatlands in the Nordic countries—Present knowledge gaps. Biogeosciences 2010, 7, 2711–2738. [Google Scholar] [CrossRef] [Green Version]
  24. Butterbach-Bahl, K.; Baggs, E.M.; Dannenmann, M.; Kiese, R.; Zechmeister-Boltenstern, S. Nitrous oxide emissions from soils: How well do we understand the processes and their controls? Phil. Trans. R. Soc. B 2013, 368, 20130122. [Google Scholar] [CrossRef]
  25. Tian, L.; Akiyama, H.; Zhu, B.; Shen, X. Indirect N2O emissions with seasonal variations from an agricultural drainage ditch mainly receiving interflow water. Environ. Pollut. 2018, 242, 480–491. [Google Scholar] [CrossRef]
  26. Glaser, P.H.; Chanton, J.P.; Morin, P.; Rosenberry, D.O.; Siegel, D.I.; Ruud, O.; Chasar, L.I.; Reeve, A.S. Surface deformations as indicators of deep ebullition fluxes in a large northern peatland. Glob. Biogeochem. Cycles 2004, 18, GB1003. [Google Scholar] [CrossRef] [Green Version]
  27. Couwenberg, J.; Fritz, C. Towards developing IPCC methane ‘emission factors’ for peatlands (organic soils). Mires Peat 2012, 10, 1–17. [Google Scholar]
  28. Le Mer, J.; Roger, P. Production, oxidation, emission and consumption of methane by soils: A review. Eur. J. Soil Biol. 2011, 37, 25–50. [Google Scholar] [CrossRef]
  29. van Bodegom, P.M.; Scholten, J.C.M. Microbial processes of CH4 production in a rice paddy soil: Model and experimental validation. Geochem. Cosmochim. Acta 2001, 65, 2055–2066. [Google Scholar] [CrossRef] [Green Version]
  30. Huttunen, J.T.; Väisänen, T.S.; Heikkinen, M.; Hellsten, S.; Nykänen, H.; Nenonen, O.; Martikainen, P.J. Exchange of CO2, CH4 and N2O between the atmosphere and two northern boreal ponds with catchments dominated by peatlands or forests. Plant Soil 2002, 242, 137–146. [Google Scholar] [CrossRef]
  31. Rantakari, M.; Kortelainen, P. Interannual variation and climatic regulation of the CO2 emission from large boreal lakes. Glob. Chang. Biol. 2005, 11, 1368–1380. [Google Scholar] [CrossRef]
  32. Stadmark, J.; Leonardson, L. Emissions of greenhouse gases from ponds constructed for nitrogen removal. Ecol. Eng. 2005, 25, 542–551. [Google Scholar] [CrossRef]
  33. Whalen, S.C. Biogeochemistry of methane exchange between natural wetlands and the atmosphere. Environ. Eng. Sci. 2005, 22, 73–94. [Google Scholar] [CrossRef]
  34. LVĢMC Klimata Portals. Available online: https://klimats.meteo.lv/laika_apstaklu_raksturojums/2021/gads/ (accessed on 24 October 2022).
  35. Gasmet. Available online: https://www.gasmet.com/cases/gas-analyzer-builds-complete-picture-of-contamination/ (accessed on 24 October 2022).
  36. Comet System. Available online: https://www.cometsystem.com/products/temperature-data-logger-for-four-external-pt1000-probes/reg-u0141 (accessed on 24 October 2022).
  37. R Core Team. The R Project for Statistical Computing. Available online: https://www.R-project.org (accessed on 24 October 2022).
  38. An Introduction to Corrplot Package. Available online: https://cran.r-project.org/web/packages/corrplot/vignettes/corrplot-intro.html#introduction (accessed on 24 October 2022).
  39. Hmisc: Harrell Miscellaneous. Available online: https://cran.r-project.org/web/packages/Hmisc/index.html (accessed on 24 October 2022).
  40. mdatools: Multivariate Data Analysis for Chemometrics. Available online: https://cran.r-project.org/web/packages/mdatools/index.html (accessed on 24 October 2022).
  41. Eriksson, L.; Johansson, E.; Kettapeh-Wold, N.; Wold, S. Introduction to Multiand Megavariate Data Analysis Using Projection Methods (PCA & PLS); Umetrics: Umea, Sweden, 1999. [Google Scholar]
  42. Wold, S.; Sjöström, M.; Eriksson, L. PLS-regression: A basic tool of chemometrics. Chemom. Intell. Lab. Syst. 2001, 58, 109–130. [Google Scholar] [CrossRef]
  43. Kucheryavskiy, S. mdatools–R package for chemometrics. Chemom. Intell. Lab. Syst. 2020, 198, 103937. [Google Scholar] [CrossRef]
  44. ggplot2: Create Elegant Data Visualisations Using the Grammar of Graphics. Available online: https://cran.r-project.org/web/packages/ggplot2/index.html (accessed on 24 October 2022).
  45. Xu, S.; Chen, M.; Feng, T.; Zhan, L.; Zhou, L.; Yu, G. Use ggbreak to effectively utilize plotting space to deal with large datasets and outliers. Front. Genet. 2021, 12, 774846. [Google Scholar] [CrossRef]
  46. Bārdule, A.; Gerra-Inohosa, L.; Kļaviņš, I.; Kļaviņa, Z.; Bitenieks, K.; Butlers, A.; Lazdiņš, A.; Lībiete, Z. Variation in the mercury concentrations and greenhouse gas emissions of pristine and managed hemiboreal peatlands. Land 2022, 11, 1414. [Google Scholar] [CrossRef]
  47. Salm, J.-O.; Maddison, M.; Tammik, S.; Soosar, K.; Truu, J.; Mander, Ü. Emissions of CO2, CH4 and N2O from undisturbed, drained and mined peatlands in Estonia. Hydrobiologia 2012, 692, 41–50. [Google Scholar] [CrossRef]
  48. Butlers, A.; Spalva, G.; Licite, I.; Purvina, D. Carbon dioxide (CO2) emissions from naturally wet and drained nutrient-rich organic forest soils. In Proceedings of the 21st International Scientific Conference ‘Engineering for Rural Development’, Jelgava, Latvia, 25–27 May 2022. [Google Scholar]
  49. Moore, T.R.; Roulet, N.T. Methane flux: Water table relations in northern wetlands. Geophys. Res. Lett. 1993, 20, 587–590. [Google Scholar] [CrossRef] [Green Version]
  50. Liblik, L.K.; Moore, T.R.; Bubier, J.L.; Robinson, S.D. Methane emissions from wetlands in the zone of discontinuous permafrost: Fort Simpson, Northwest Territories, Canada. Glob. Biogeochem. Cycles 1997, 11, 485–494. [Google Scholar] [CrossRef]
  51. Van den Pol-van Dasselaar, A. Methane Emissions from Grasslands. Ph.D. Thesis, Wageningen Agricultural University, Wageningen, The Netherlands, 16 September 1998. [Google Scholar]
  52. Dunfield, P.; Knowles, R.; Dumont, R.; Moore, T. Methane production and consumption in temperate and subarctic peat soils—Response to temperature and pH. Soil Biol. Biochem. 1993, 25, 321–326. [Google Scholar] [CrossRef]
  53. Wang, C.; Amon, B.; Schulz, K.; Mehdi, B. Factors that influence nitrous oxide emissions from agricultural soils as well as their representation in simulation models: A review. Agronomy 2021, 11, 770. [Google Scholar] [CrossRef]
  54. Edvardsson, J.; Šimanauskienė, R.; Taminskas, J.; Baužienė, I.; Stoffel, M. Increased tree establishment in Lithuanian peat bogs—Insights from field and remotely sensed approaches. Sci. Total Environ. 2015, 505, 113–120. [Google Scholar] [CrossRef]
  55. Ratcliffe, J.L.; Creevy, A.; Andersen, R.; Zarov, E.; Gaffney, P.P.J.; Taggart, M.A.; Mazei, Y.; Tsyganov, A.N.; Rowson, J.G.; Lapshina, E.D.; et al. Ecological and environmental transition across the forested-to-open bog ecotone in a west Siberian peatland. Sci. Total Environ. 2017, 607–608, 816–828. [Google Scholar] [CrossRef] [Green Version]
  56. Hobbie, S.E.; Reich, P.B.; Oleksyn, J.; Ogdahl, M.; Zytkowiak, R.; Hale, C.; Karolewski, P. Tree species effects on decomposition and forest floor dynamics in a common garden. Ecology 2006, 87, 2288–2297. [Google Scholar] [CrossRef]
  57. Prescott, C.E.; Zabek, L.M.; Staley, C.L.; Kabzemsand, R. Decomposition of broadleaf and needle litter inforests of British Columbia: Influences of littertype, forest type, and litter mixtures. Can. J. For. Res. 2000, 30, 1742–1750. [Google Scholar] [CrossRef]
  58. Bārdule, A.; Butlers, A.; Lazdiņš, A.; Līcīte, I.; Zvirbulis, U.; Putniņš, R.; Jansons, A.; Adamovičs, A.; Razma, G. Evaluation of soil organic layers thickness and soil organic carbon stock in hemiboreal forests in Latvia. Forests 2021, 12, 840. [Google Scholar] [CrossRef]
  59. Hermans, R.; McKenzie, R.; Andersen, R.; Teh, Y.A.; Cowie, N.; Subke, J.-A. Net soil carbon balance in afforested peatlands and separating autotrophic and heterotrophic soil CO2 effluxes. Biogeosciences 2022, 19, 313–327. [Google Scholar] [CrossRef]
  60. Butlers, A.; Lazdiņš, A.; Kalēja, S.; Bārdule, A. Carbon budget of undrained and drained nutrient-rich organic forest soil. Forests 2022, 13, 1790. [Google Scholar] [CrossRef]
Figure 1. Location of research sites in Latvia.
Land 11 02233 g001
Figure 2. Variation of instantaneous GHG emissions from drainage ditches in peatlands by types of current land use. In the boxplots, the median is shown by the bold line, the mean by the black dot. The box corresponds to the lower and upper quartiles, and the whiskers show the minimal and maximal values (within 150% of the interquartile range from the median), while dots outside the box represent outliers of the datasets. Colored dots represent different seasons, and different lowercase letters show statistically significant differences (p < 0.05) in mean values between groups of current peatland uses. Figure was prepared with the R package “ggplot2” [44].
Land 11 02233 g002
Figure 3. Contribution to greenhouse warming of different GHG emissions from drainage ditches, given in CO2 equivalents. Figure was prepared with the R package “ggplot2” [44] and “ggbreak” [45].
Land 11 02233 g003
Figure 4. Spearman’s correlations between instantaneous GHG emissions from drainage ditches and environmental variables (temperatures, water level in ditches, GW level, and general chemistry). Positive correlations are displayed in blue and negative correlations in red. Color intensity and the size of the circle are proportional to the correlation coefficients. Below the correlogram, the legend color shows the correlation coefficients and the corresponding colors. Correlations with p > 0.05 are considered insignificant (crosses are added). Figure was prepared with the R packages “corrplot” [38] and “Hmisc” [39].
Land 11 02233 g004
Figure 5. Relationships between instantaneous CO2, CH4, and N2O emissions from drainage ditches and water temperature, groundwater level below soil surface, and total nitrogen concentration in groundwater. Figure was prepared with the R package “ggplot2” [44].
Land 11 02233 g005
Figure 6. Variation of instantaneous GHG emissions from drainage ditches depending on water level in ditches. In the boxplots, the median is shown by the bold line. The box corresponds to the lower and upper quartiles, whiskers show the minimal and maximal values (within 150% of the interquartile range from the median), and dots outside the box represent outliers of the datasets. In the boxplots, different lowercase letters show statistically significant differences (p < 0.05) in the mean values between the dry and water-filled ditches within the groups of current land use of peatland (peat extraction sites and peatland forests). Figure was prepared with the R package “ggplot2” [44].
Land 11 02233 g006
Table 1. Characterization of the research sites in Latvia.
Current Land Use/Type of VegetationResearch SiteCoordinates (LKS92 TM Coordinate System)Ditch width at the Soil Surface Level, cmDitch Depth,
cm
Active peat extraction siteSite 1 (Lambārtes Mire)X: 518826; Y: 262233143 90
Site 2 (Ušuru Mire)X: 661175; Y: 324116145123
Abandoned peat extraction site not covered with vegetation (bare peat)Site 3 (Cenas Mire)X: 498792; Y: 29786619665
Site 4 (Medema Mire)X: 506624; Y: 30017518845
Abandoned peat extraction site with shrub and herbaceous plant vegetationSite 5 (Cenas Mire)X: 498615; Y: 29801613069
Site 6 (Cepļa Mire)X: 649492; Y: 34459820459
Scots pine forestSite 7 (Cepļa Mire)X: 649724; Y: 34421321455
Site 8 (MPS Mežole)X: 620173; Y: 34911721733
Silver birch forestSite 9 (Pleces Mire)X: 348265; Y: 28979526058
Site 10 (MPS Mežole)X: 624262; Y: 35483626452
Table 2. Variations and mean values of water level in ditches, GW level, and parameters of GW general chemistry during the study period in research sites. Different lowercase letters show statistically significant differences (p < 0.05) in mean values between groups of current land use of peatland.
Parameter, UnitValuePeat Extraction SitesPeatland Forests
Abandoned, Bare PeatAbandoned, with VegetationActiveScots Pine
Forest
Silver Birch Forest
Water level in ditch, cmmean ± S.E.37.6 ± 8.8 a44.6 ± 12.9 ab26.6 ± 8.1 ab8.7 ± 3.4 ab4.8 ± 2.0 b
range0–1100–1500–700–320–24
GW level, cmmean ± S.E.18.0 ± 4.1 ab62.1 ± 12.0 a24.1 ± 4.4 ab10.6 ± 4.7 b45.4 ± 9.6 ab
range−2–537–1508–59−18–360–108
pHmean ± S.E.5.2 ± 0.2 a5.2 ± 0.3 a6.3 ± 0.2 b5.2 ± 0.3 a7.3 ± 0.1 c
range3.8–7.03.9–6.75.2–7.03.8–6.46.4–7.9
EC, µS cm−1mean ± S.E.48.4 ± 5.5 ad64.1 ± 9.5 bcd110.9 ± 16.5 cd64.1 ± 12.8 d292.9 ± 24.6 e
range32.7–117.238.9–160.634.4–22536.5–163.25142.7–450.5
TN, mg L−1mean ± S.E.3.57 ± 0.33 abde3.84 ± 0.27 be8.27 ± 0.86 c2.57 ± 0.38 de2.88 ± 0.87 e
range0.94–6.522.78–5.422.65–11.431.86–5.770.39–8.29
DOC, mg L−1mean ± S.E.99.1 ± 6.7 a101.9 ± 5.8 a125.8 ± 22.5 a109.3 ± 6.7 a41.2 ± 10.3 b
range49.1–140.881.4–142.064.0–291.789.7–149.79.2–101.0
K, mg L−1mean ± S.E.0.94 ± 0.08 ae0.65 ± 0.07 be2.19 ± 0.28 c0.42 ± 0.04 d0.91 ± 0.11 e
range0.47–1.500.23–0.950.76–3.960.23–0.750.38–1.76
Ca, mg L−1mean ± S.E.10.6 ± 1.7 abd13.4 ± 2.3 bcd19.5 ± 2.8 cd17.0 ± 3.4 d62.5 ± 4.1 e
range1.78–28.195.42–31.574.76–39.934.14–41.8734.64–79.93
Mg, mg L−1mean ± S.E.0.63 ± 0.03 a1.19 ± 0.12 b4.67 ± 0.52 c0.74 ± 0.13 a12.82 ± 1.51 e
range0.49–0.850.83–1.930.73–6.660.34–1.624.82–18.32
Publisher’s Note: MDPI stays neutral with regard to jurisdictional claims in published maps and institutional affiliations.

