Article

Multi-Scenario Simulation and Driving Force Analysis of Ecosystem Service Value in Arid Areas Based on PLUS Model: A Case Study of Jiuquan City, China

1
College of Geography and Environment Science, Northwest Normal University, Lanzhou 730070, China
2
Gansu Engineering Research Center of Land Utilization and Comprehension Consolidation, Lanzhou 730070, China
*
Author to whom correspondence should be addressed.
Land 2023, 12(5), 937; https://doi.org/10.3390/land12050937
Submission received: 7 March 2023 / Revised: 18 April 2023 / Accepted: 20 April 2023 / Published: 22 April 2023
(This article belongs to the Section Landscape Ecology)

Abstract

:
The arid region of northwest China is an extremely fragile area of natural ecology. With population growth and continuous expansion of urban scale, the ecosystem in the arid region is facing greater pressure. Scientific assessment and prediction of the value of ecosystem services in arid areas are necessary and of great significance for the sustainable development of regional ecological environments. In this paper, a parametric optimal geographic model is used to analyze the driving factors of ESV spatial dispersion in Jiuquan City as an example. The PLUS model is also used to simulate the spatial and temporal evolution of ESV in 2035 under the scenarios of natural development, urban development, water constraints and ecological conservation, based on the historical change pattern of land use and ecosystem service value (ESV). The results showed that from 1980 to 2020, the plowland, water and construction land area in Jiuquan City showed a significant increasing trend, while other land use types showed a decreasing trend. ESV has increased from CNY 139.394 billion to CNY 142.642 billion. The expansion of plowland and water area was the main reason for the increase in ESV. Elevation, temperature, and precipitation are the main driving factors of spatial differentiation of ESV in Jiuquan City. The interaction of natural and human factors enhances the explanatory power of each factor to the spatial differentiation of ESV. In 2035, the ESV in four development scenarios in Jiuquan City showed an upward trend, and the ESV of the ecological protection scenario was the highest, which was the best mode to realize a sustainable development in Jiuquan City in the future. This study can provide scientific basis and decision-making basis for Jiuquan City to formulate sustainable development strategy.

1. Introduction

Ecosystem service refers to life support products and services directly or indirectly obtained through the structure, process and function of ecosystems, mainly including supply services, regulation services, support services and cultural services. It plays a pivotal role in the survival and development of human society [1]. Maintaining the dynamic balance of ecosystem structure and function is an important guarantee for maintaining human well-being and promoting the coordination of human -land relations [2]. In recent years, with population growth and rapid expansion of urban scale, natural and semi-living natural ecosystems have been continuously transformed into artificial ecosystems [3], resulting in damage to ecosystem service value (ESV) in some areas [4,5]. So far, 60% of the ecosystem service functions in the world have been significantly degraded [6,7], and a series of negative feedback effects have been triggered [8]. The ecological background of the arid regions in northwest China is fragile, the contradiction between the demand for economic development and the supply capacity of ecosystem services is more prominent [9], and the ecosystem is facing severe challenges. Therefore, it is of great significance to clarify the temporal and spatial evolution law and spatial differentiation driving force of ESV in the arid region of northwest China, and predict the change trend of ESV in multiple scenarios in the future, which is helpful to optimize regional land use structure and identify ecosystem service problems [10,11,12].
At present, the research results of ESV have been quite rich. At first, American ecologist Costanza and others developed the global ecosystem service equivalence factor table [1], which aroused widespread concern in this field. Subsequently, on the basis of Costanza’s theory, scholars such as Xie Gaodi of China constructed the China Terrestrial Ecosystem Ecological Service Value Equivalent Scale per Unit Area applicable to China, which was widely used in ESV assessment by domestic scholars [13,14]. Currently, the main valuation methods for ESVs are the real market method, the alternative market method and the virtual market method, with the equivalent factor method (which is part of the real market method) being the most widely used. Although somewhat subjective, the equivalence factor method is intuitive and easy to use and requires less difficulty in obtaining data, making it more suitable for large-scale assessments. Other methods usually require data on the economic indicators of the study area, which are difficult to obtain and not uniform across districts, and are not conducive to large scale assessment, so other methods are needed to complete the calculations in the assessment. ESV assessment has also evolved from a single ecosystem value accounting in the past to a multi-type integrated ecosystem accounting stage, and the research has become more dynamic, mechanistic and practical. With the development and involvement of remote-sensing information technology, many studies have given more prominence to the relationship between different ESV and land use, the status of ESV in regional development decisions and the role of ESV as a decision aid for optimizing the layout of future spatial elements in the region [15,16,17,18]. In addition, ESV accounting is also widely used in the evaluation of regional ecological vulnerability, ecological risk assessment and the construction of ecological security patterns. Land use modeling is the basis for the ESV multi-scenario assessment and for achieving an optimized layout of the region’s future spatial elements, and the choice of model is crucial. Currently, widely used land use simulation models mainly include cellular automata markov (CA Markov) [19,20], system dynamics (SD) [17,21], agent-based model (ABM) [22], conversion of land use and its effects at small regional extent (CLUE-S) [23,24], and geographical simulation and optimization system (GeoSOS) [24]. However, with the further improvement of regional requirements for land use planning, these models can no longer meet the simulation needs. They generally only consider the constraints of spatial planning policies (such as protected areas and prohibited areas), ignoring the drive and guidance of future land changes (e.g., development zone planning and traffic planning), so there are many limitations [25,26]. The patch-generating land use simulation (PLUS) model integrates a random forest-based stochastic seed mechanism for planned development areas and transport planning, which allows for better exploitation of land-use change mechanisms during the simulation process. It fills the need for simulation of land use changes guided by spatial planning policies in urban development [26,27], and the results can better support spatial planning policy implementation and future ESV multi-scenario assessment. From the literature search, the academic community generally carries out land use simulation and ESV multi-scenario assessment of urban [3], watershed [28], wetland [29], forest [30], arid land [17,18] and other research objects at different scales such as global [31,32], national [33] and regional [11]. However, many studies only set scenarios based on the requirements of national macro strategies and the focus of existing development trends. They lack regional specificity and cannot reveal spatial differences in ecological environment, resource status and development level. For example, the traditional urban development scenario and cultivated land protection scenario impose minimum restrictions on the area of cultivated land and construction land based on meeting the needs of population growth and economic development [10,17]. However, for arid areas, water resources are the main factor restricting their development. “Water determines demand, water determines action” is an inevitable requirement for arid areas to embark on the road of sustainable development; blindly increasing the area of plowland and urban land is bound to over-consume water resources, leading to further degradation of the ecological environment [34]. Therefore, the main factors that limit regional development should also be considered in the scenario setting, and targeted scenarios should be set up according to the current situation and needs of regional development, which are in line with the future development trend of the region.
Jiuquan City is located in the arid region of northwest China and is one of the regions with the most serious desertification and the highest water resource shortage in Gansu Province and even in China [35,36]. The area of desert and sandy land next to the city accounts for 66.8%, and the area of an oasis suitable for human habitation only accounts for 8.7% [37]. The shortage of water resources is the main factor restricting the rapid economic development of Jiuquan City [35,36]. In recent years, in order to improve water use efficiency and ease ecological pressure, the government of Jiuquan has issued a series of water resource management policies, such as the Implementation Opinions on Accelerating the Construction of a Water-saving Society and the Measures for the Management of Groundwater Resources in Jiuquan City, which have achieved certain results in water conservation. However, as population growth and urbanization continue to advance, the area of cultivated land and construction land in the region has gradually increased, the total amount of water used in agriculture and urban areas remains high, and the ecosystem is still facing threats. Based on this, this paper takes Jiuquan City as the study area, and first analyzes the spatiotemporal evolution of Jiuquan City’s ESV using the method of ecosystem service equivalent factor. Then, the driving mechanism of ESV spatial differentiation is analyzed by using the parameter-optimal geographic detector model. Finally, four future development scenarios of natural development, urban development, water resource constraints, and ecological protection are set according to the natural geographical characteristics and development needs of Jiuquan City. With the help of the PLUS model, the ESV of different development models in 2035 is simulated and predicted to explore the best path for the future development of Jiuquan City. It is expected to provide a basis for promoting the construction of a water-saving society in Jiuquan City, coordinating the sustainable development of the economy and ecology, and providing a reference for the ecological protection of similar regions.

2. Study Area and Data Resources
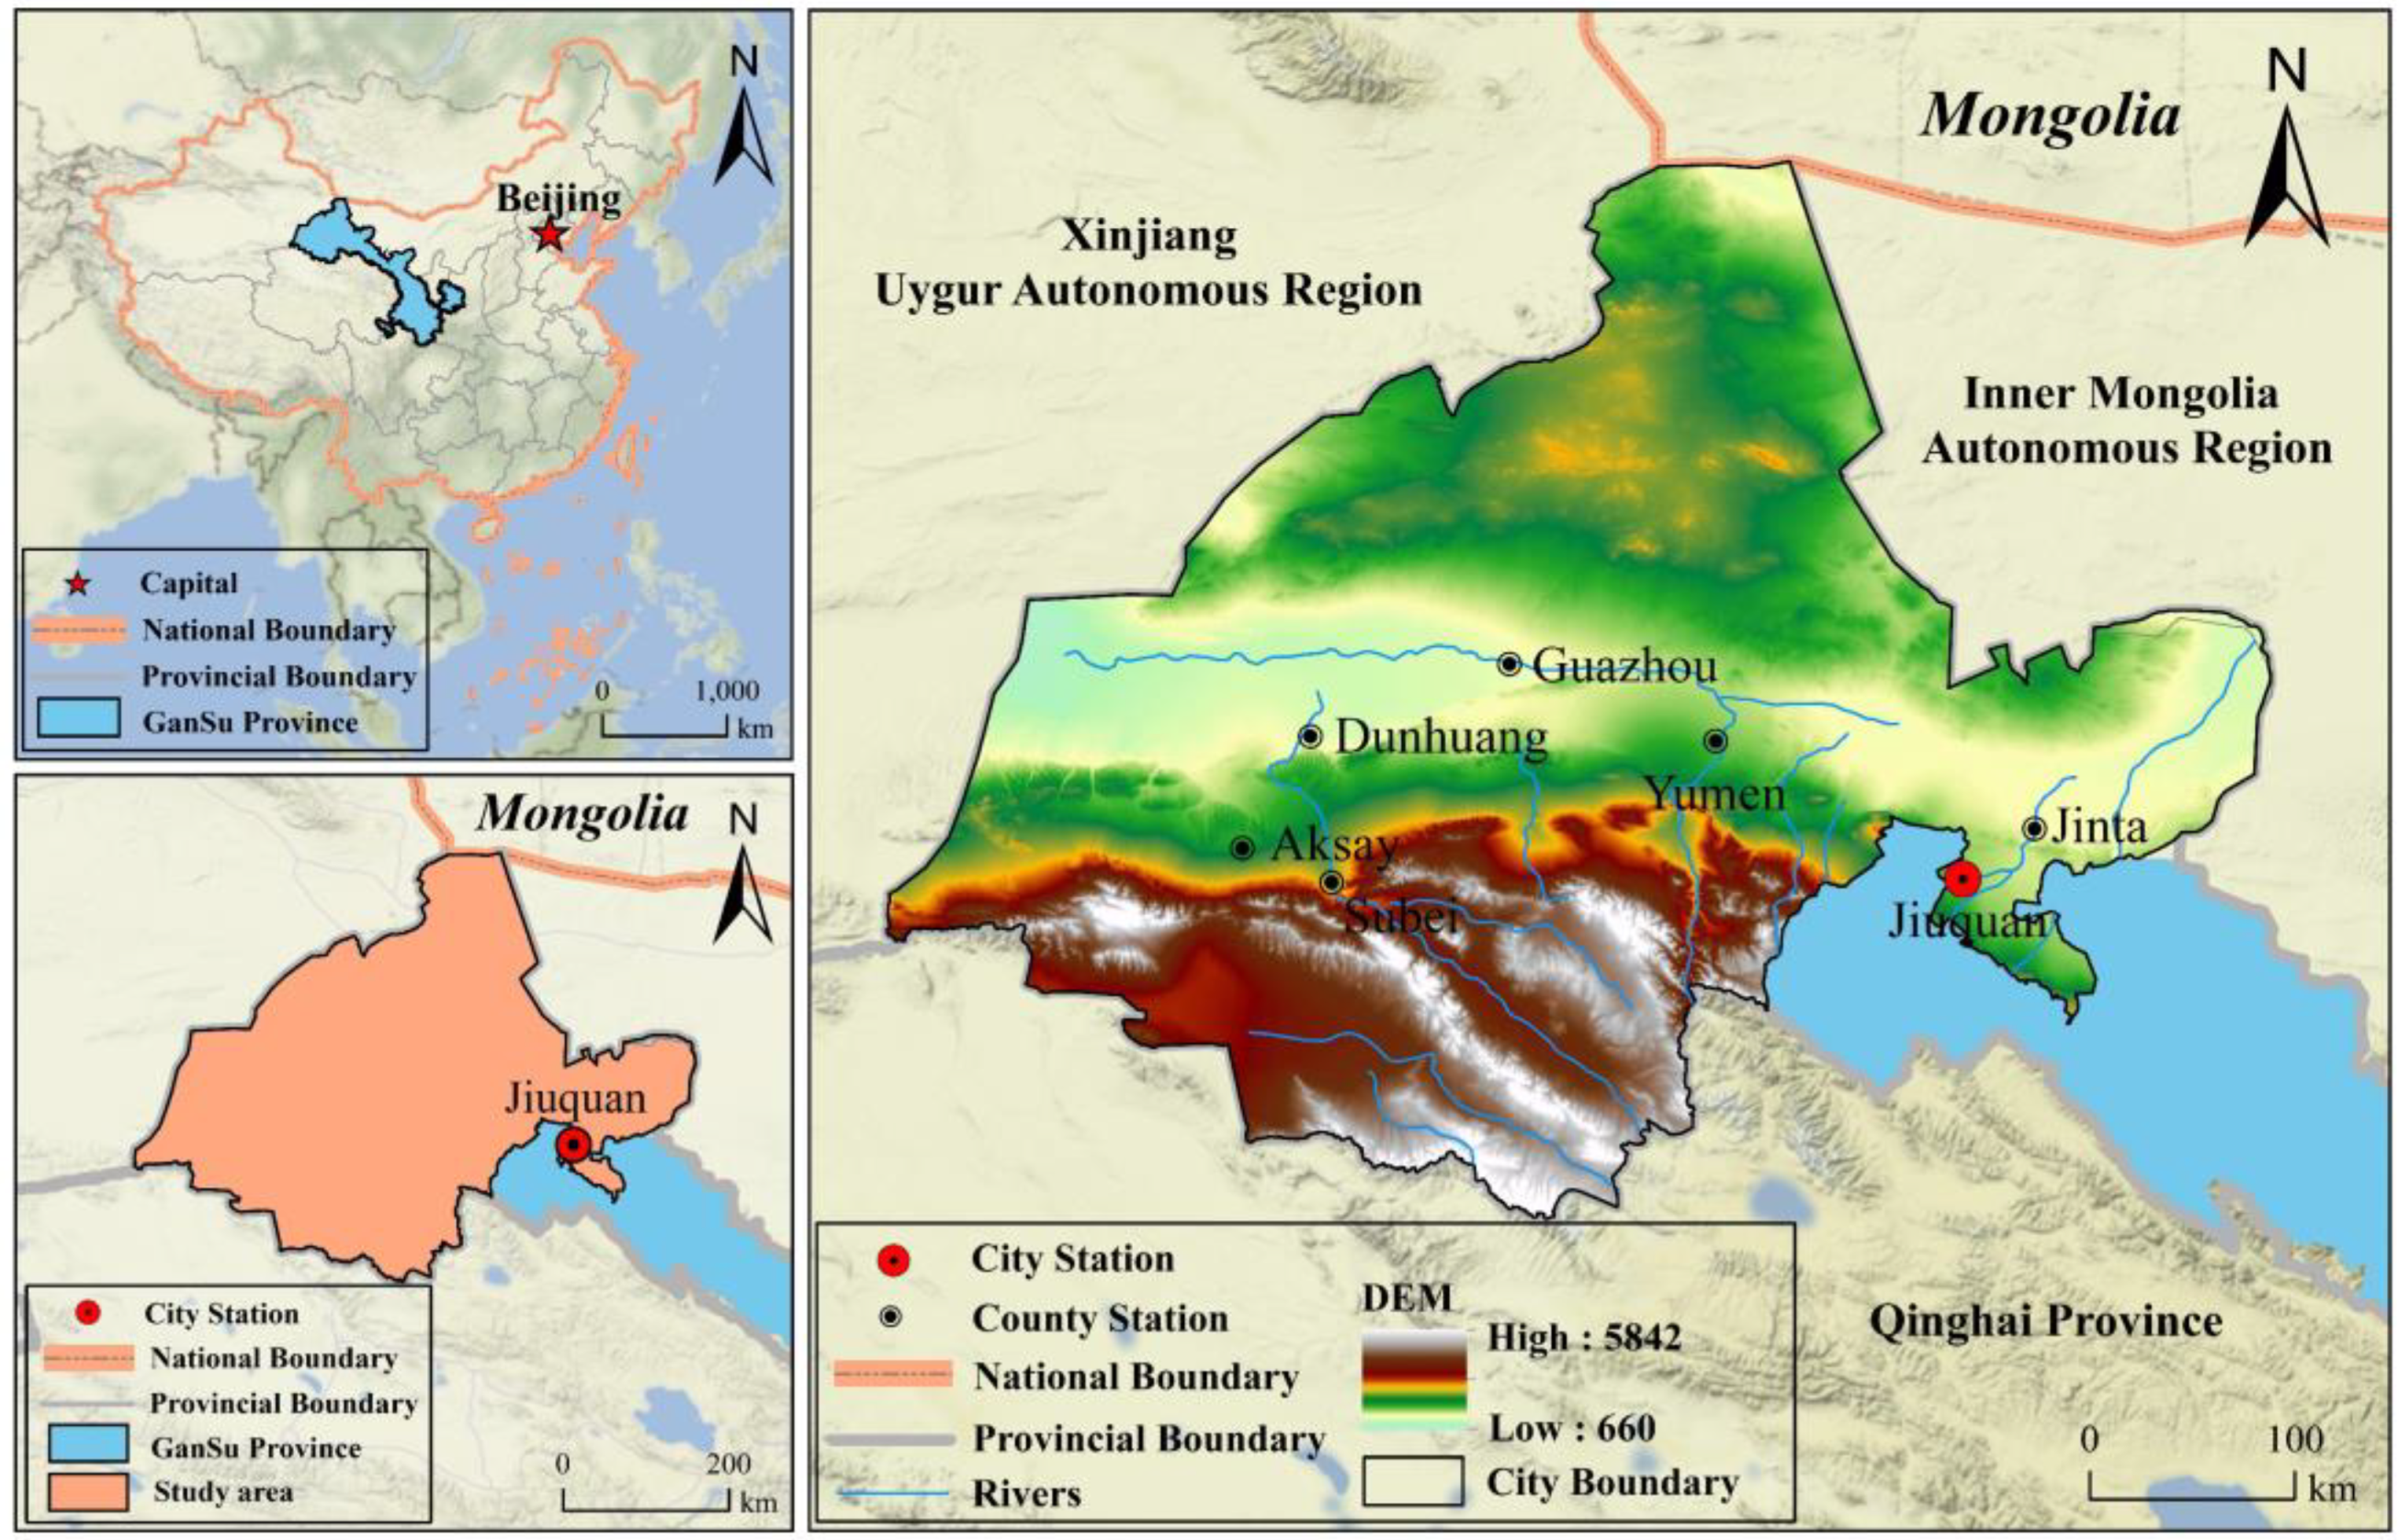
2.1. Study Area

Jiuquan City (Figure 1) is located in the inland region of northwest China (38°09′~42°48′N, 92°20′~100°20′E). The city is a prefecture-level city in China, comprising one district, two county-level cities and four counties, with a total area of about 16.8 × 10⁴ km2, accounting for 42% of the total area of Gansu Province [37]. In 2020, there were 1.0557 million permanent residents, with a GDP of CNY 65.77 billion. Jiuquan City is high in the south and low in the north, leaning from southwest to northeast, with an altitude of 660 m~5842 m [38]. To the south of Jiuquan are the Alpen gold, Dang Henan Mountain, Mustang South Mountain and Daxue Mountain, with high vegetation cover and a composite ecosystem of glacial meadows and forests. In the central region are the oases of Dunhuang, Guazhou, Yumen and Jiuquan, which are horizontally zoned along the Shule River and are dominated by desert oasis mountain complex ecosystems. The northern area is the Anxi Extreme Arid Desert Ecosystem and the Horsehair Mountain Northern Goat Desert Oasis Ecosystem. All other regions are desert areas. The average annual precipitation is only 40–176 mm, and the evaporation is as high as 2100–3100 mm, which is a typical continental arid climate. There are three major water systems in Jiuquan City, namely the Shule River, the Black River and the Haerteng River, all originating from the Nanshan glacial snow area, with available water resources of about 3.1 × 10⁹ m3, and water resources per square kilometer of land area of only 2.1 × 10⁵ m3, which is 1/17 of the national average [39]. Jiuquan City is a key node city of the Silk Road Economic Belt and an essential growth pole supporting the development of the northwest arid region. The ecological and economic status is significant, but the overall development level needs to be improved because economic development is seriously affected by natural conditions, development space and development mode.

2.2. Data Sources

The data covered in this paper mainly include land use, DEM, population density and GDP density, meteorology, roads, municipal government sites, food prices, water resources and green-space cover data in built-up areas. Among them, land use data comes from the Resource and Environmental Science and Data Center of the Chinese Academy of Sciences (http://www.resdc.cn (accessed on 15 January 2023)) (Figure 2). The land use data were interpreted using human–computer interactive visual interpretation with a spatial resolution of 30 m, all with an overall accuracy of over 88.95%. In this paper, they are divided into six categories: plowland (arable land), forestland (coniferous forests, broadleaf forests and shrubs), grassland (scrub and meadows), water area (water systems, glacial snow and wetlands), unused land (desert and bare land) and construction land (urban land, rural settlements and other built-up land) [14]. DEM data are provided by the geospatial data cloud plat form (http://www.gscloud.cn (accessed on 15 January 2023)), and slope data is calculated using DEM data. Population density and GDP density data, meteorological data, road data and resident data of municipal governments are all from the Resource and Environmental Science and Data Center of the Chinese Academy of Sciences (http://www.resdc.cn (accessed on 15 January 2023)). The grain output and grain sown area are derived from the Statistical Bulletin of National Economic and Social Development of Jiuquan City. The grain price data are from China Food Yearbook. The water resources data are from Gansu Water Resources Bulletin. Data on green space coverage in built-up areas are from the Bulletin on the Urban Construction Status of Jiuquan City.

3. Materials and Methods

3.1. ESV Calculation

In this paper, the ESV of Jiuquan City was calculated using the Service Equivalence Table per Unit Area of Terrestrial Ecosystems in China developed by Xie Gaodi et al. [14]. The ESV per unit area is shown in Table 1, and the ESV of Jiuquan City was calculated using equations [3,4]:
E S V = i = 1 n A i × V C i
V C i = j = 1 k E C j × E a
where ESV is the total ecosystem service value; Ai is the area of type i land use type; VCi is the ecosystem service value per unit area of type i land use type, unit: CNY·hm−2·a−1; k is the number of ecosystem services; ECj is the ecosystem service value equivalent of item j of type i land use type; and Ea is the equivalent factor of ecosystem services, unit: hm−2.
Due to the variability of economic development in different regions, the economic value per unit of ecosystem services in Jiuquan City needs to be determined more precisely in relation to the field situation in the study area. The economic value of Jiuquan’s ecosystem service equivalent factor was revised according to the most widely used rule that the economic value of production services provided by an existing unit of farmland is seven times greater than the economic value of a natural ecosystem without human input. The revised results provide a more objective picture of the characteristics and status of the service value of natural ecosystems in Jiuquan City. The multi-year average grain production in Jiuquan City from 2000 to 2018 was calculated in this study to be 8059.3 kg·hm−2, and the multi-year average market grain price was 2.242 CNY·kg−1. The results indicate an ecosystem service equivalent factor of 2581 CNY·hm−2 in Jiuquan City, corrected as follows:
E a = 1 7 × P × Q
where Ea is the economic value of 1 unit of ecosystem service in CNY·hm−2·a−1, P is the multi-year average grain price in Jiuquan City and Q is the unit area yield of grain crops in kg·hm−2.
The above ESV estimation methods mostly focus on the value of natural ecosystems and thus ignore the ESV of construction land. Scholars generally set the ESV of construction land to 0 in their research, which may lead to some errors in the calculation of regional ESV. In reality China is increasing the area of artificial green space in cities in order to improve the urban habitat, which has led to an increase in ESV in urban areas. According to the Jiuquan City Urban Construction Status Bulletin, the multi-year average green-space coverage of the built-up area in Jiuquan is 31.2%. Greenfield areas generally consist of higher quality and more fragmented grassland and forestland. Therefore, ESV on construction sites cannot be ignored and needs to be improved on from the traditional approach. The improved formula for calculating ESV for building sites is as follows:
E S V c l = E S V w l + E S V g l A t 2
where: ESVcl, ESVwl and ESVgl represent the ESV of construction land, forest land and grassland respectively; At refers to the average annual green-space coverage in the urban area.

3.2. Optimal Parameter-Based Geographic Detector
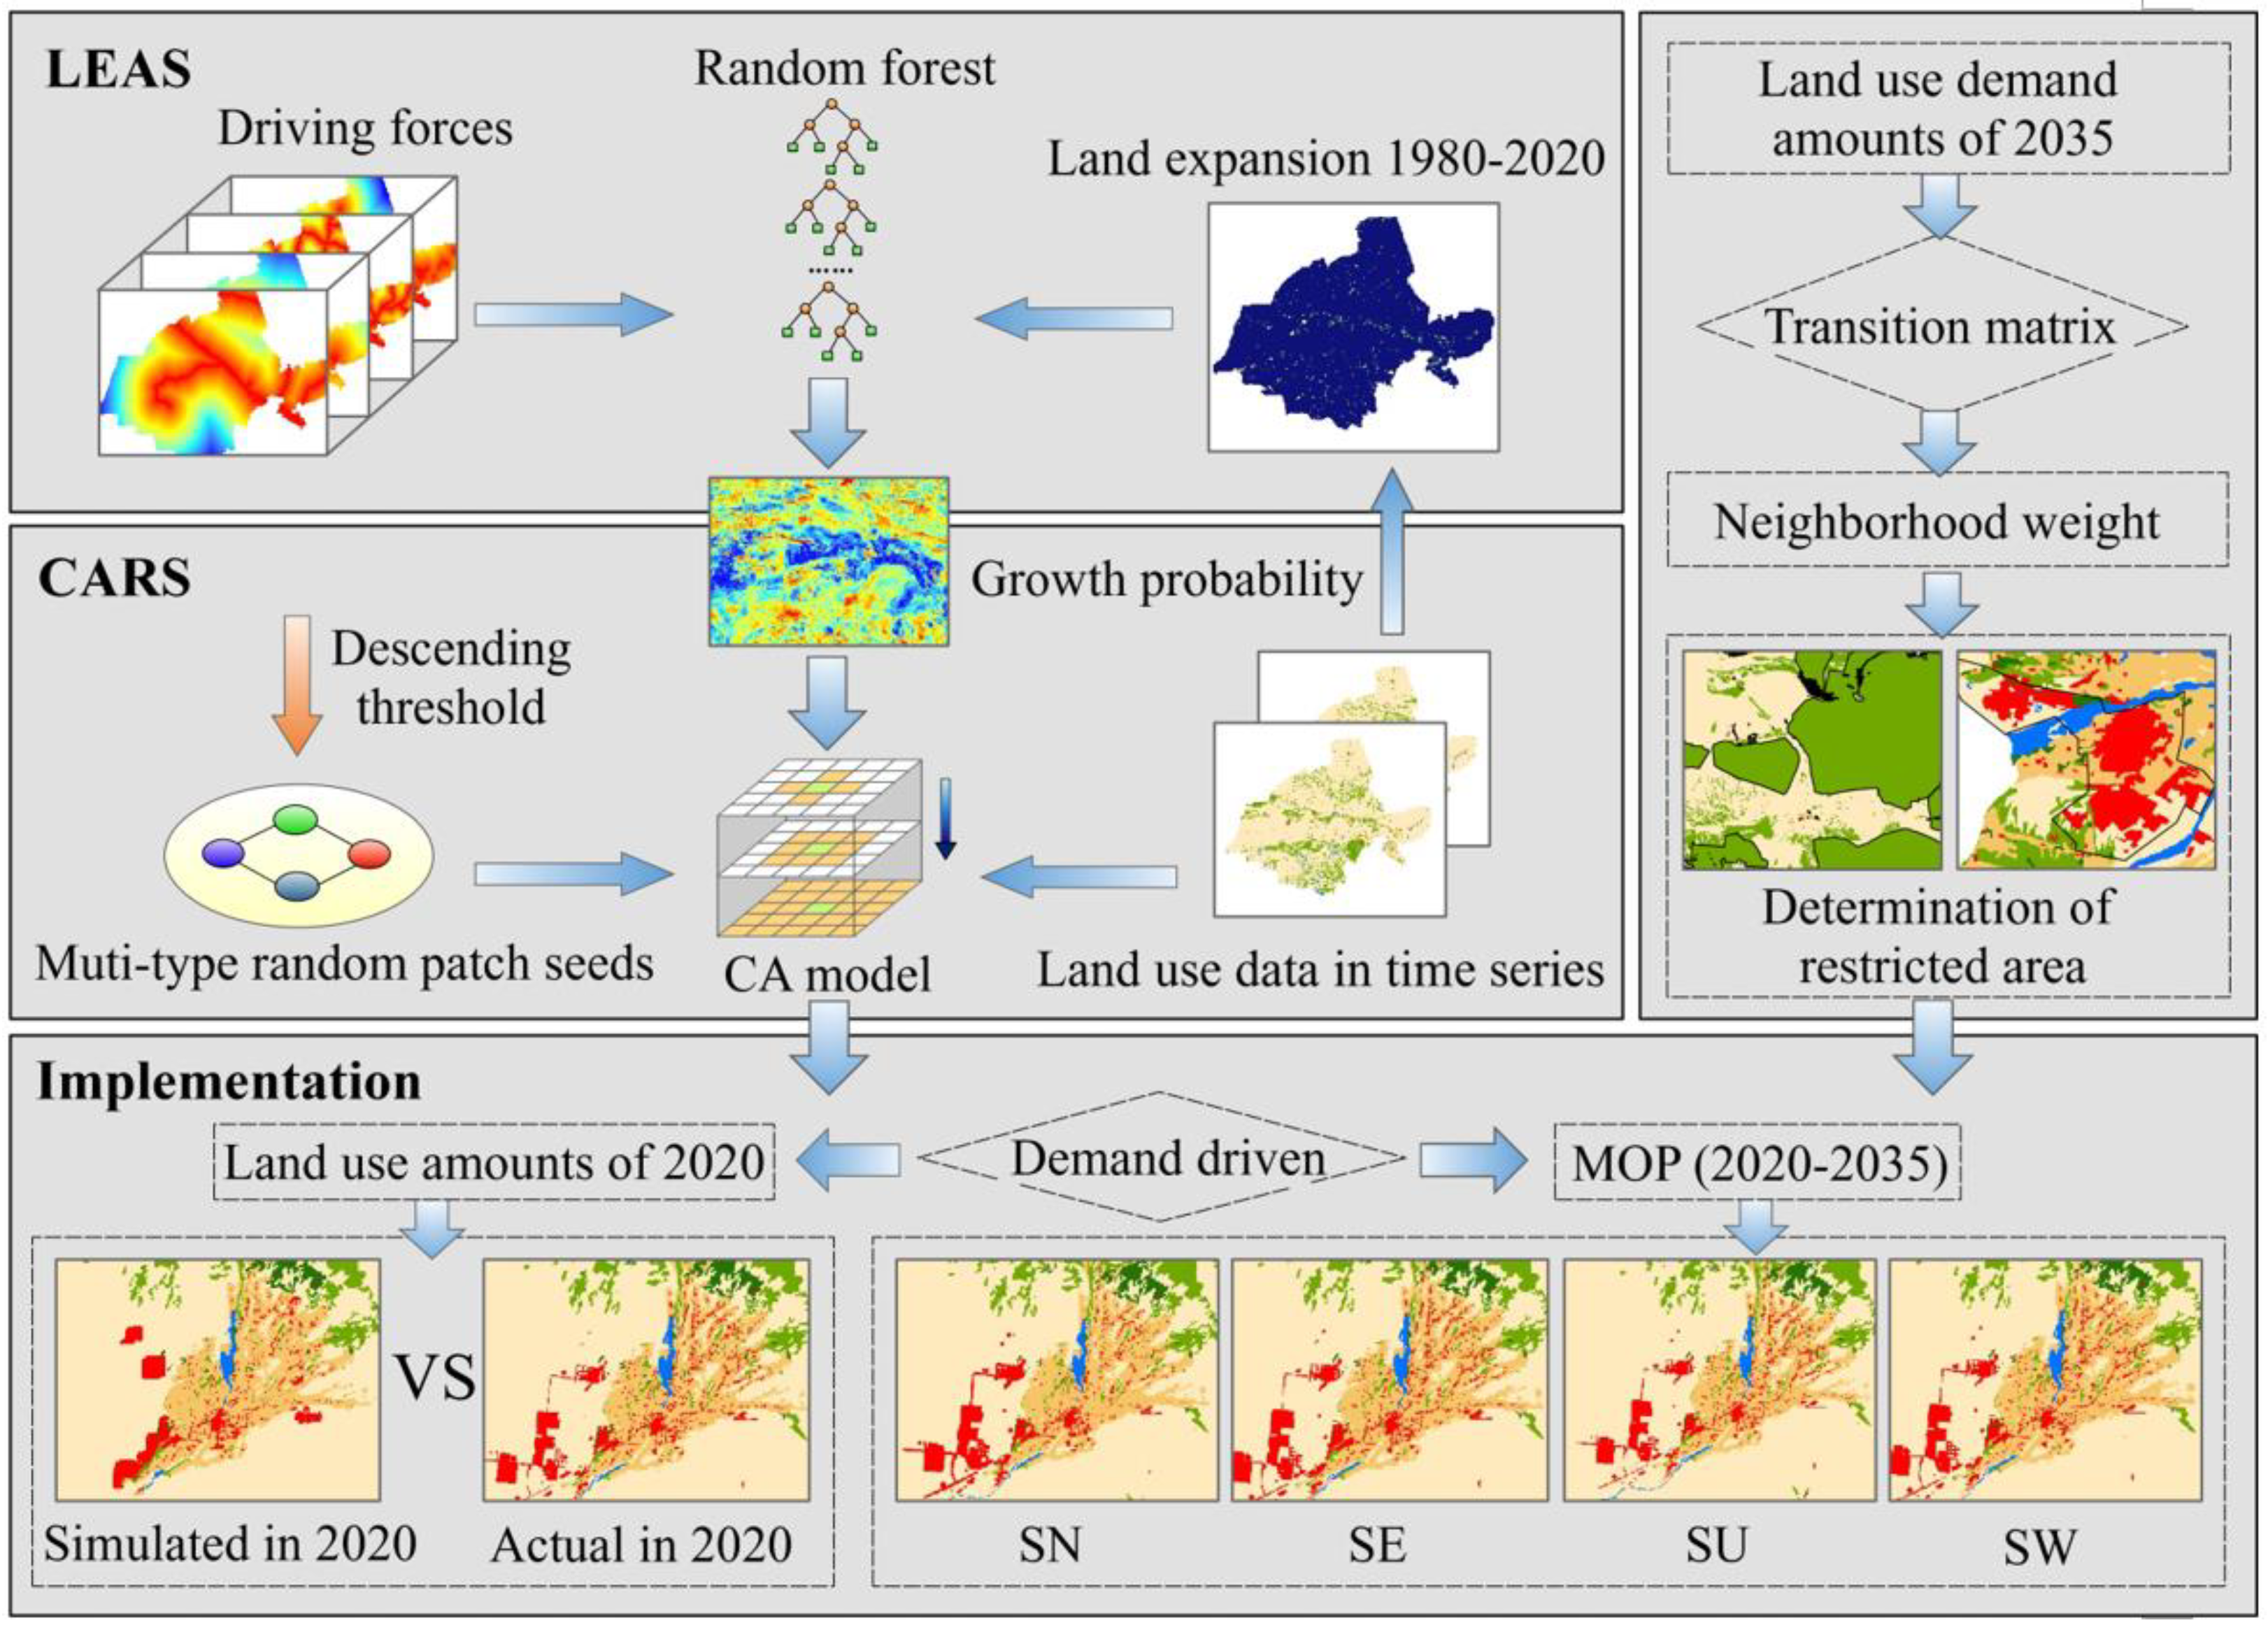
Geographic detectors can detect and analyze ESV and the selected factors, find the spatial differentiation of ESV and reveal its main driving force [40]. The discretization of continuous variables by traditional geographical detectors has strong subjectivity, which affects the determination of the optimal scale of spatial stratification heterogeneity to a certain extent. Therefore, with the help of the GD package in the R language, this paper uses classification methods such as equal breaks, natural breaks, quantile breaks, geometric breaks and standard deviation breaks to set the number of classification levels to 5–10 classes. We selected the combination of parameters with the highest q value (hierarchical method and number of discontinuities) for spatial discretization [41]. In this way, the spatial stratification heterogeneity of ESV and the explanatory power of influencing factors on ESV spatial differentiation were detected, and the interaction factors were used to analyze the influence of two-factor synergy on ESV spatial differentiation. By calculating the q (q (X1), q (X2)) value of a single factor and the q value q (X1∩X2) of the interaction between two factors, we can determine whether there is interaction between two factors and the extent of an interaction. See the relevant literature for discrimination methods [40,41,42]. See the formula for q value calculation:
q = 1 h = 1 L N h σ h 2 N σ 2 = 1 S S W S S T
S S W = h = 1 L N h σ h 2 ,   S S T = N σ 2
In the formula, q is the explanatory power of the factor, and its value range is [0, 1]. The greater the value, the stronger the explanatory power; h is the stratification of explanatory variables or explained variables (strata); Nh and N are the number of units in layer h and the whole area; σh and σ2 represent the variance of layer h and region Y, respectively; and SSW and SST are the sum of variance within the layer and the total variance of the whole region.

3.3. PLUS Model

3.3.1. Model Introduction

The PLUS model is a rule-mining framework based on land expansion analysis strategy (LEAS) and a CA model based on multi-type random seeds (CARS) [27] (Figure 3). In the LEAS module, two phases of land use data are required to extract the expansion areas of various types of land, and the relationship between land expansion and drivers is analyzed by combining random-forest algorithms. In the CARS module, you need to set parameters such as land use conversion rules and field weights. The conversion rules are set based on previous research results and the actual situation of Jiuquan City [31,40]. The domain weight of land use types is determined based on the ratio of the expansion area of each type of land to the total area of the region. Based on the experience of existing studies and the actual situation in Jiuquan City, 11 driving factors of elevation, slope, temperature, precipitation, distance from water, distance from highways, distance from railways, distance from the city center, distance from the government, population density and GDP density were selected for the land use simulation [43,44]. (Figure 4). Natural factors such as elevation, slope, temperature and precipitation influence the degree of land use development mainly by limiting human activity. In addition, changes in temperature and precipitation can alter regional climatic conditions and have an impact on changes in surface vegetation. The closer the distance to water, the higher the quality of the ecological environment, and human activities such as crop cultivation and construction land development can be carried out in areas close to the water, thus changing the landscape type of the area. Distance from roads, distance from the city center, population density and GDP density can reflect the spatial distribution of human disturbance activities in the study area from different perspectives and are the main influencing factors on the intensity of land use development. Distance from the government can indirectly influence land use change, for example, the presence of the government can have a pulling effect on the siting of residential development, population and industrial layout, thus indirectly changing land use types. If the government presence is relocated, this will have a significant impact on the spatial distribution pattern of the relocated landscape. It is therefore reasonable to choose the above impact shadow analysis for the impact on land use change.

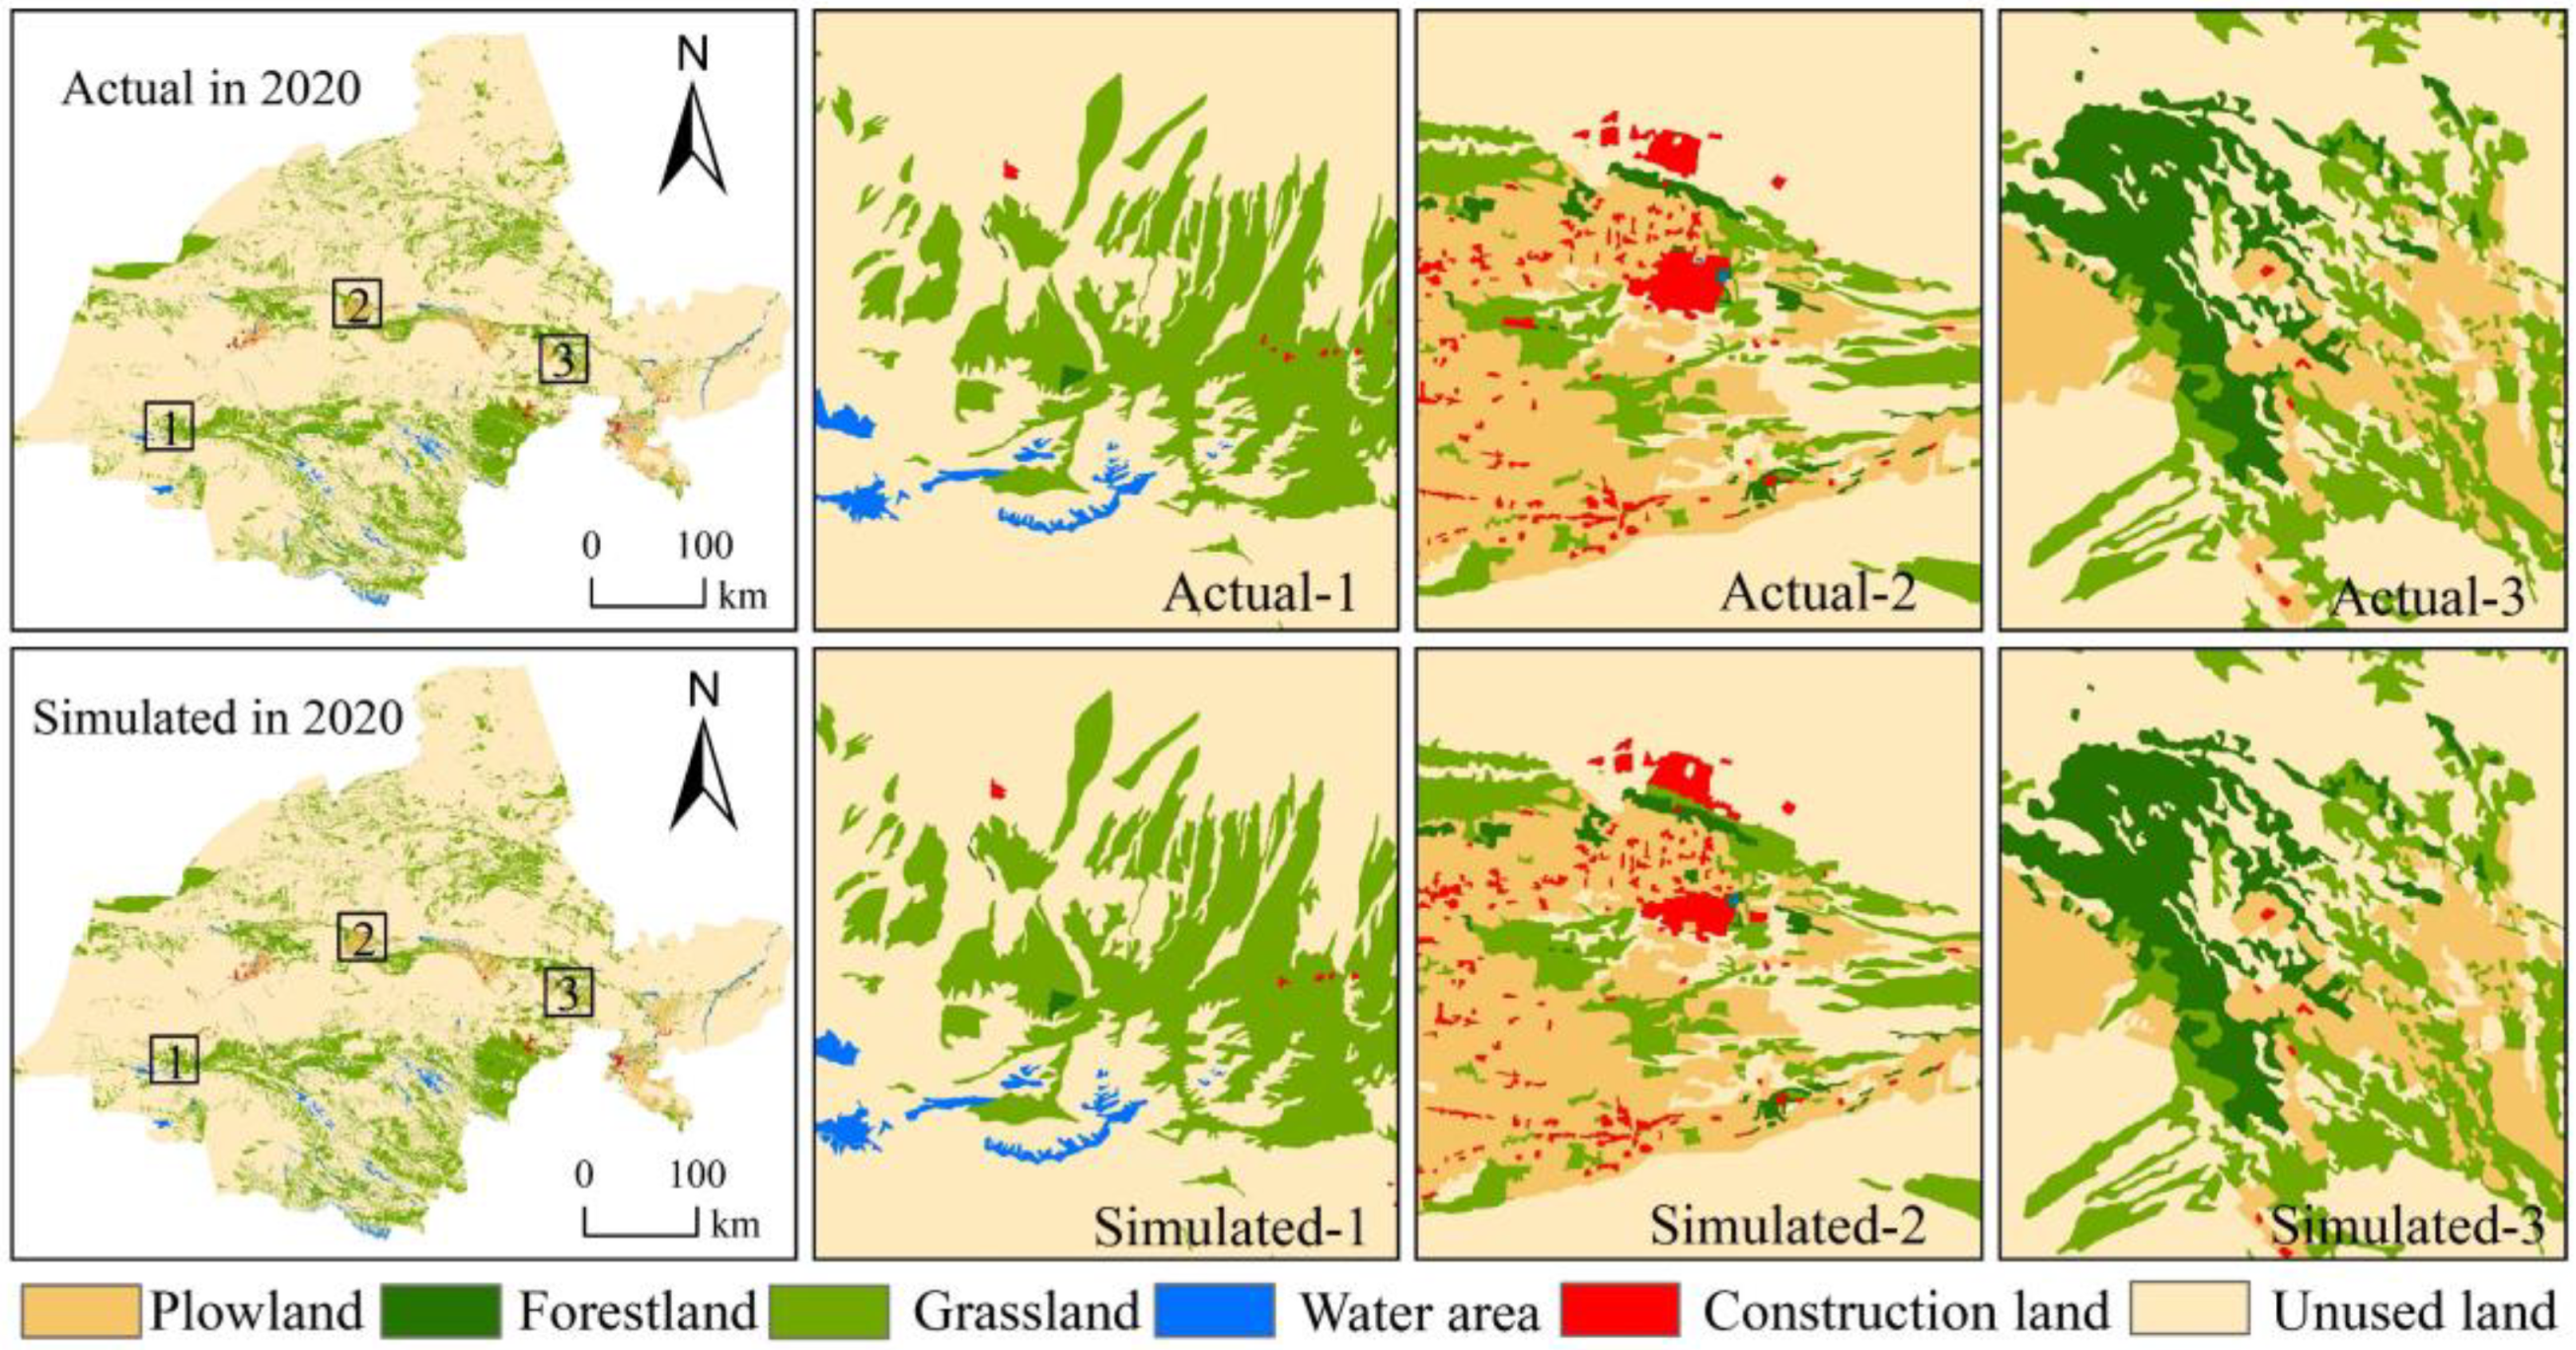
3.3.2. Model Inspection

This paper simulates the land use data in 2020 with 1980 as the initial year and conducts a consistency test on the land use simulation results in 2020 (Figure 5). The results show that the kappa value is 0.878, and the overall accuracy is 95.89%. In general, when kappa ≥ 0.75, the actual data and simulation results have a high consistency [45,46]. Therefore, the precision of the land use data in 2020 simulated by this model is high, and it can be used to simulate the land use change in Jiuquan City in 2035.

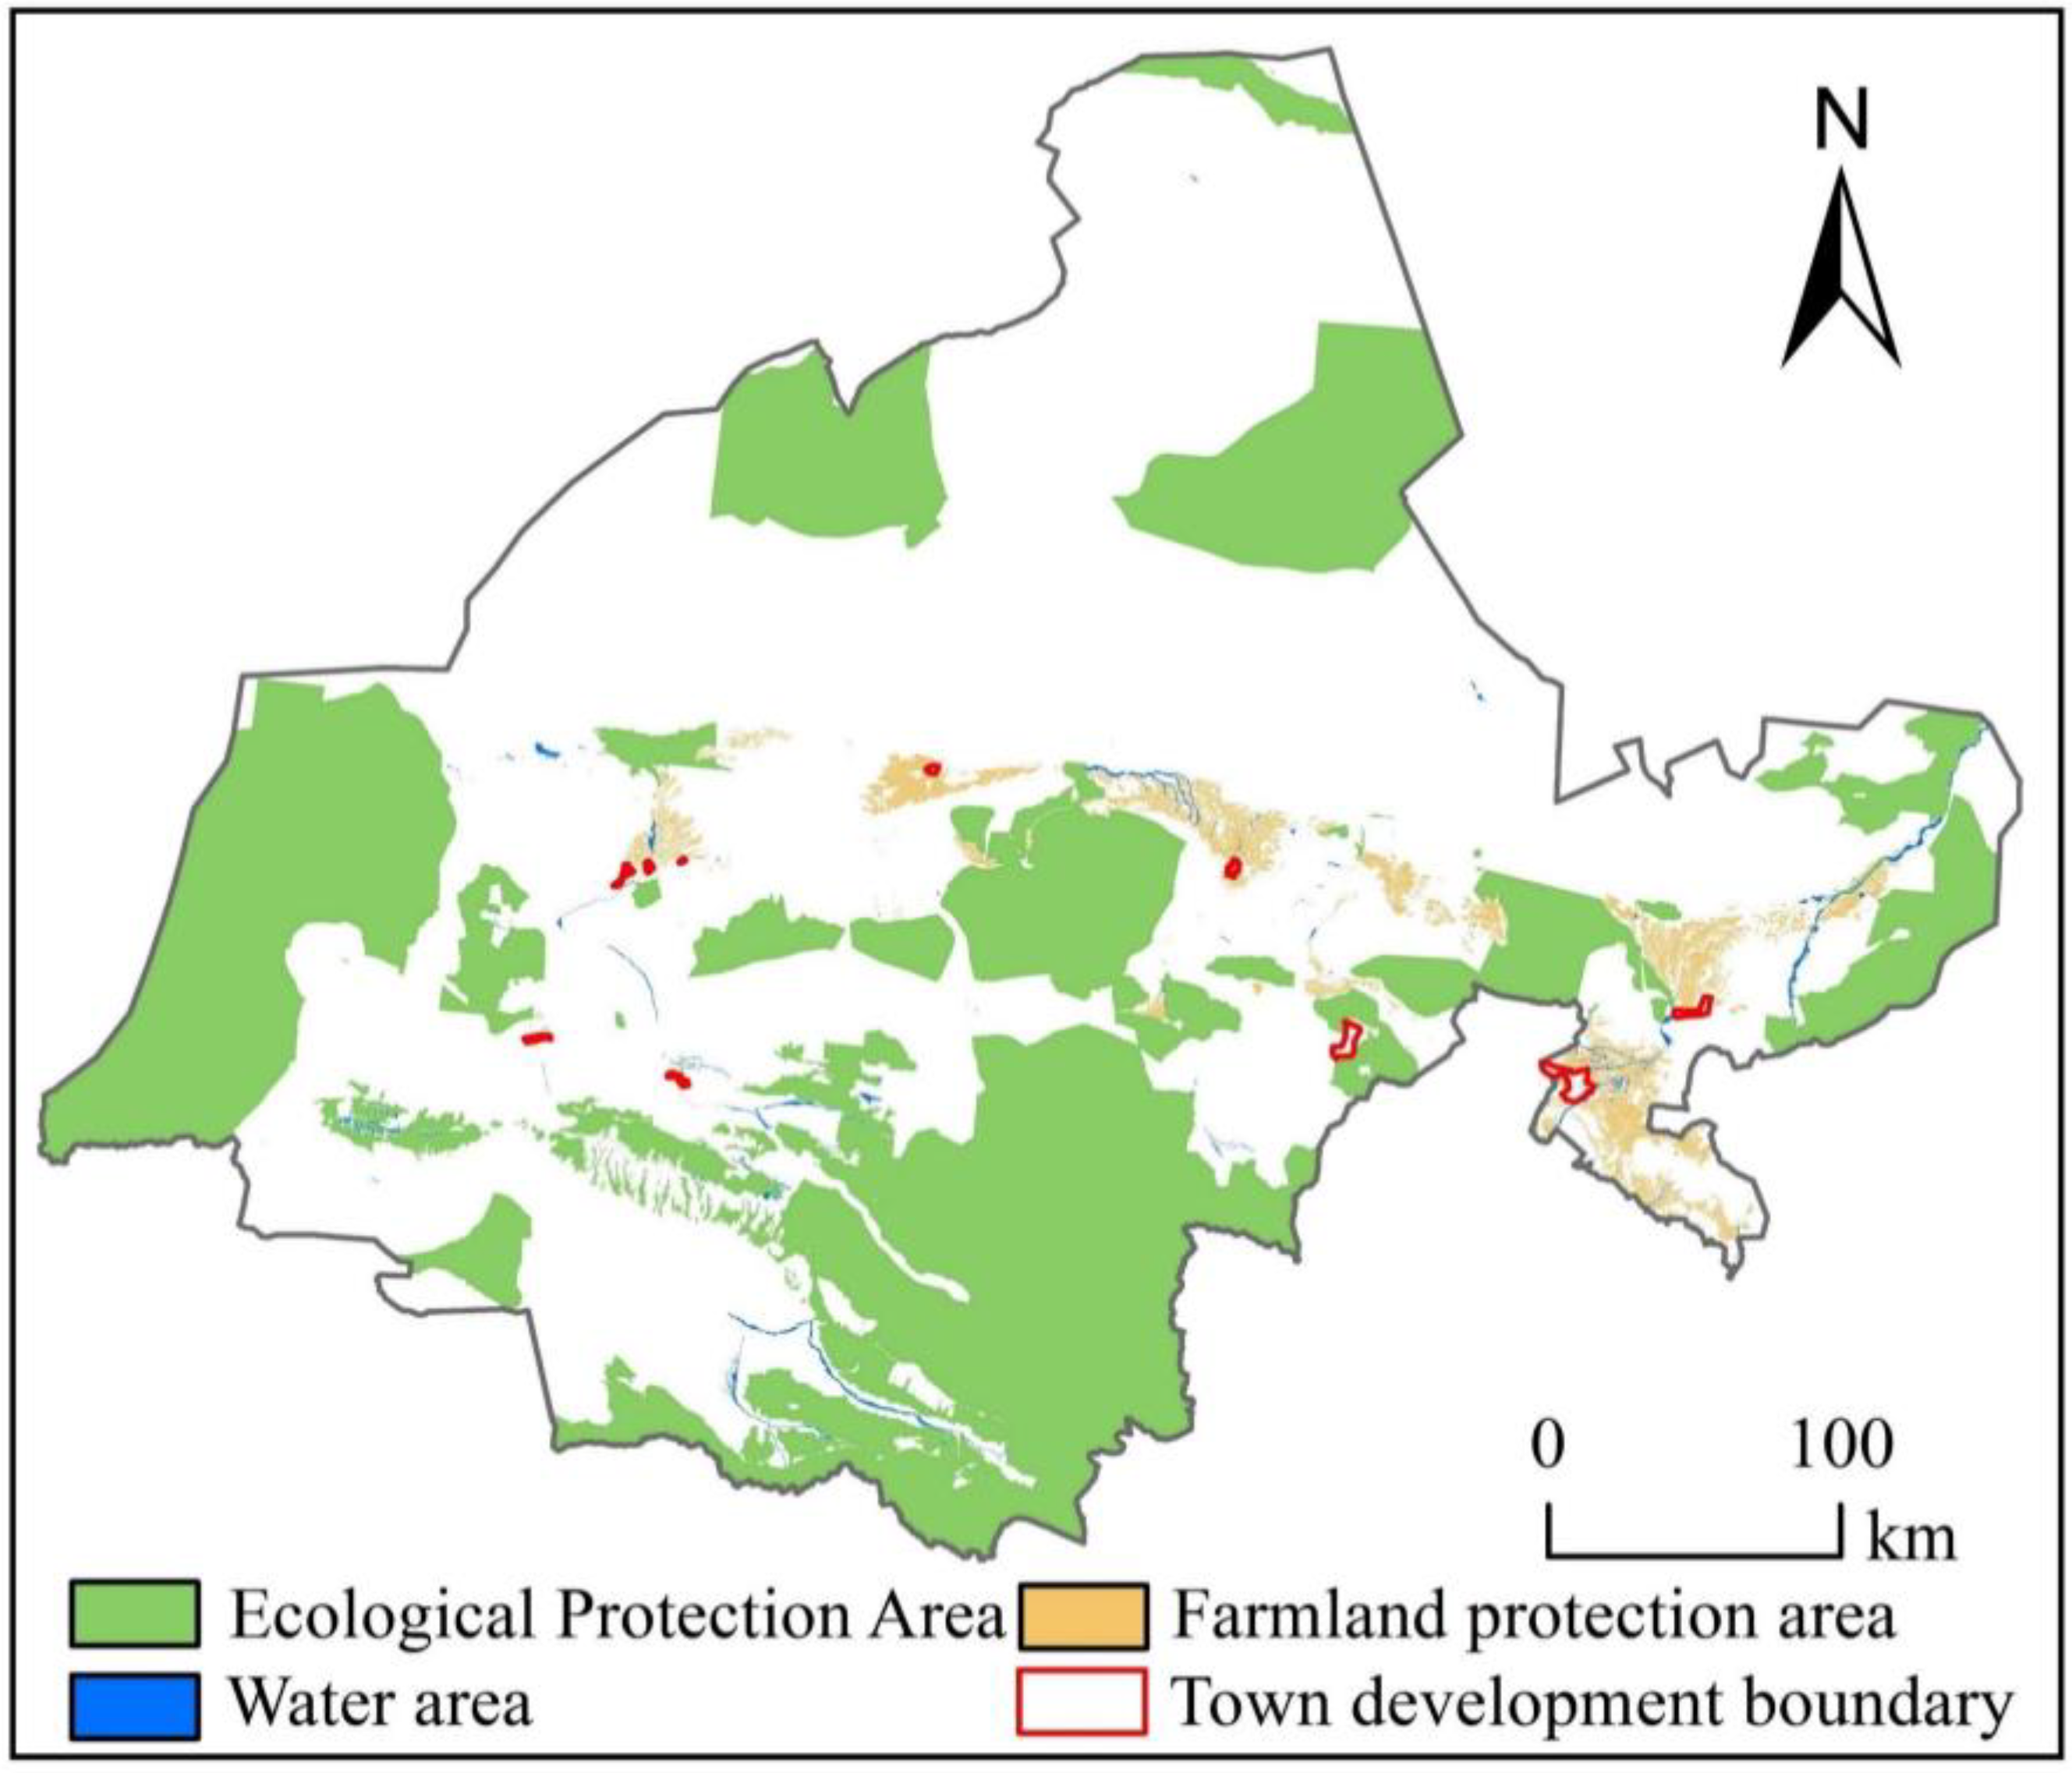
3.3.3. Profile Settings

Scenario simulation aims to analyze and predict land use changes under different development paths in the future, providing reference for regional development decision-making. Referring to previous research results [18,20] and integrating the future development planning requirements of Jiuquan in the Gansu Province Territorial Spatial Planning (2019–2035) and the natural geographical characteristics of Jiuquan, the following four scenarios were set:
(1) Natural development scenario (SN): Fully follow the law of land use change from 1980 to 2020, do not consider the requirements of development policies and development planning and do not impose any restrictions on the change rules of land use types.
(2) Urban development scenario (SU): In this scenario, we do not blindly pursue economic growth and urban-scale expansion but achieve intensive development while meeting population and economic growth. Restrictions on the future urban development boundary of Jiuquan City (Figure 4) according to the Gansu Province Territorial Spatial Planning (2019–2035) are set out. According to the planning requirements, the construction land area in 2035 is not less than 531.4 km2. Set a prohibition on the conversion of construction land to other types of land and increase the probability of conversion of other land use types to construction land within the urban development boundary.
(3) Water resource constraint scenario (SW): According to the practice of production and life, this paper divides the types of regional water use into four categories: farmland irrigation, forestry, animal husbandry, fishery and livestock, production and life (including industrial, urban public and residential water) and ecological environment water. Assuming that the water consumption per unit area of various types of land remains unchanged, the total amount of irrigation water used in farmland is directly related to the cultivated land area, the total amount of production and domestic water use and the construction land area. The maximum area of cultivated land and construction land in 2035 is constrained by the annual average water demand per square meter of cultivated land and the annual comprehensive water demand per square meter of construction land. The Land and Gansu Province Territorial Spatial Planning (2019–2035) stipulates that the total water consumption of Jiuquan City should be controlled within 2245 million m3 in 2035. Considering the water use efficiency, this paper only calculates the annual average water demand per square meter of cultivated land and the annual average comprehensive water demand per square meter of construction land during 2016–2020, which are 0.538 m3/m2, and 0.259 m3/m2 respectively. The maximum area of cultivated land and construction land in 2035 is calculated as follows.
See the formula for the calculation of total regional water consumption:
W = W a + W f + W p l + W e
See the formula for calculation of annual average total water consumption:
W ¯ = W ¯ a + W ¯ f + W ¯ p l + W ¯ e
where W is the total water consumption; Wa is farmland irrigation water; Wf is water for forestry, animal husbandry, fishing and livestock; Wpl is production and domestic water; We is water for ecological environment; and W ¯ is the total annual water consumption. See the formula for the calculation of the maximum cultivated land and construction land area in 2035:
S f 35 W 35 W ¯ a 0.538 W ¯
S b 35 W 35 W ¯ p l 0.259 W ¯
where W35 is the total water consumption in 2035; Sf35 is the area of cultivated land in 2035; and Sb35 is the construction land area in 2035. The final calculation shows that the area of cultivated land and construction land in 2035 should be within 3481.2 km2 and 538.2 km2 under the water resource constraint scenario. In this scenario, in order to improve the protection of water resources, the conversion of prohibited water areas to other land types is set.
(4) Ecological protection scenario (SE): Comprehensively considering the food security and resource and environmental carrying capacity of Jiuquan City, in order to improve the intensity of ecological protection, it is necessary to add the concepts of cultivated land protection and ecological environmental protection, and set the permanent basic farmland protection area, ecological reserve and water area required by the Gansu Provincial Land and Spatial Plan (2019–2035) as prohibited conversion areas (Figure 6).

4. Results

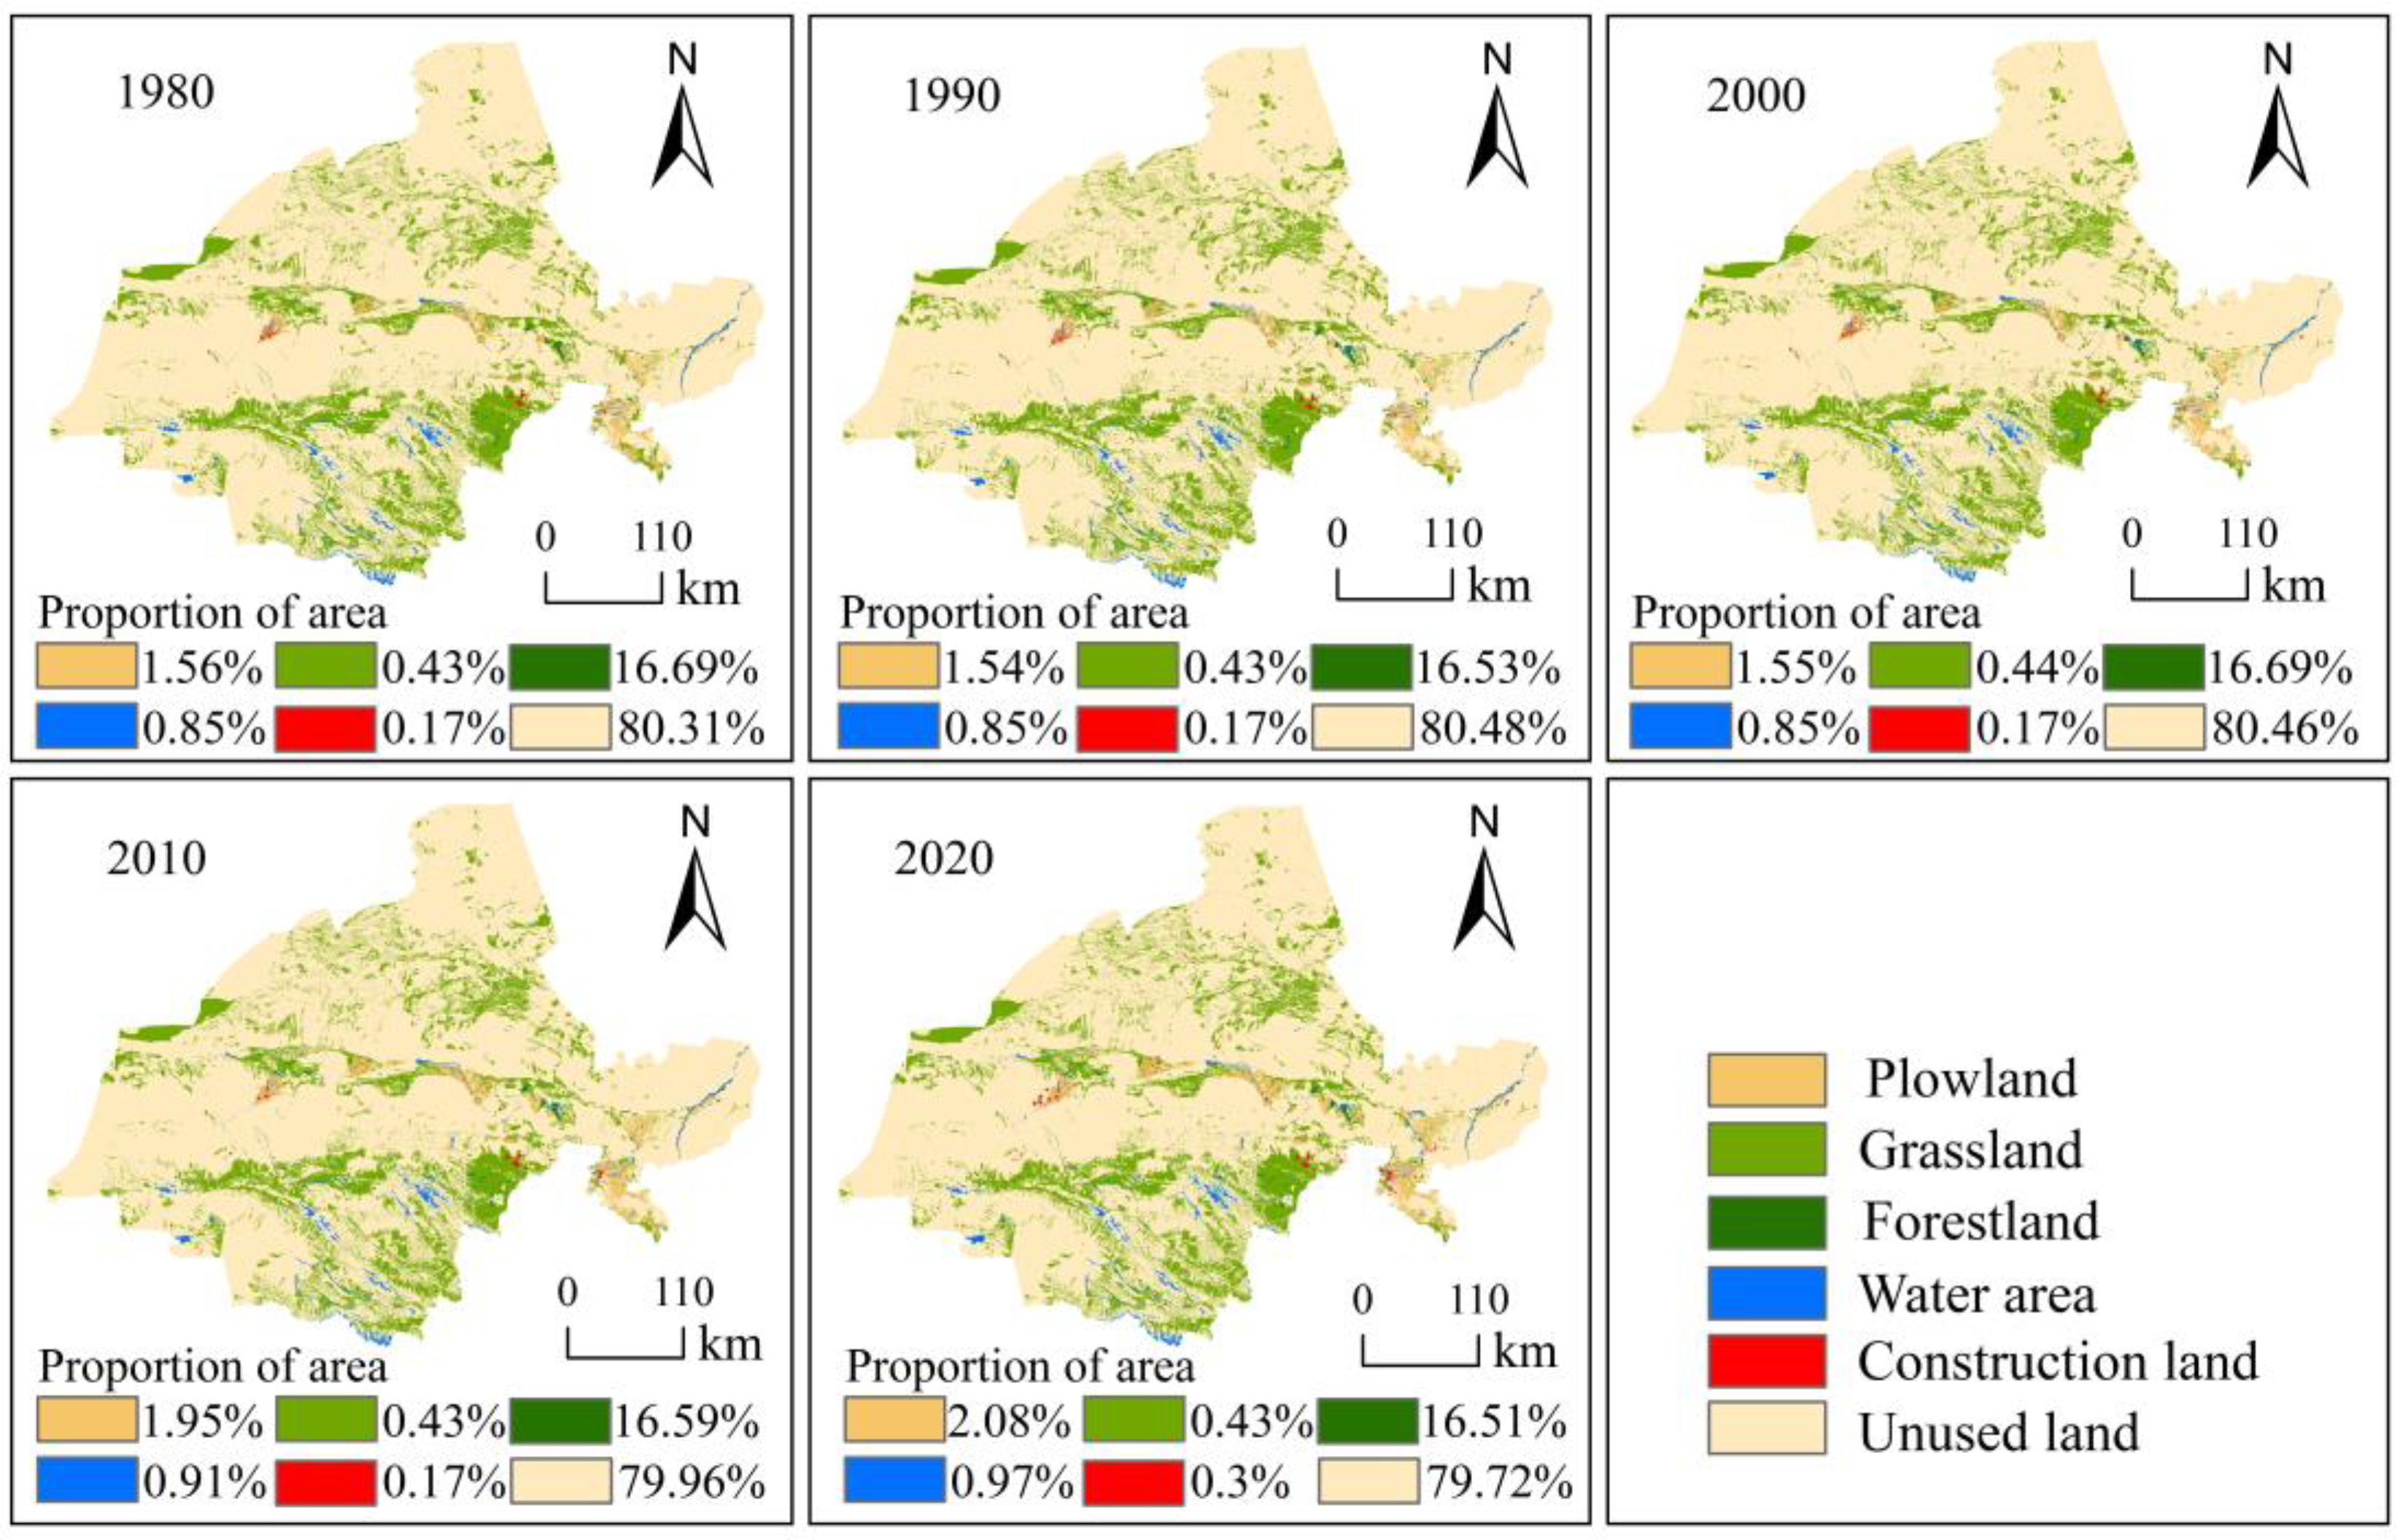
4.1. Analysis of Land Use Type Change Characteristics

In the study area, unused land and grassland cover 95% of Jiuquan, with unused land accounting for 79% of the area (Table 2). There were no significant changes in the spatial distribution characteristics of land use types in Jiuquan between 1980 and 2020 (Figure 2). Grasslands and forestlands are more concentrated in the north in the Horsehair Mountains and in the south in the Alpen gold, DangHenan Mountain, Mustang South Mountain and Daxue Mountain regions, with a horizontal band in the center. Plowland and construction land are distributed along the Shule River and Black River; the rest is unused land. During 1980–2020, the area of plowland, water area and construction land showed a significant increasing trend; especially after 2000, the increase of plowland and construction land was significantly accelerated, with an increase of 864.76 km2 and 229.22 km2 respectively. The total area of grassland and unused land decreased, while the area of forest-land remained basically unchanged. The reason for this is that the expansion of plowland and construction land is mainly due to the increase in population in Jiuquan. Since 1983, Jiuquan has successively implemented a number of migration programs, including the Two West program migration, the Shule River construction project migration and the Jiudian Gorge migration, accumulating about 150,000 migrants by 2008 and developing a plowland area of over 7500 km2. It is mainly concentrated in the oasis areas of Guazhou, Yumen and Jiuquan. In addition, with the rapid increase in population, the area of construction land is expanding rapidly. Although the expansion of construction land is dominated by unused land, it still has a significant effect on the encroachment of grassland and plowland in the central oasis area of Jiuquan. The main reason for the increase in water area may be related to the implementation of water conservation policies and the construction of water conservancy projects in Jiuquan in recent years. In recent decades, Jiuquan has achieved remarkable results in agricultural water conservation, groundwater extraction and comprehensive management of corporate wastewater and has built a number of water conservation projects, such as the Danghe Reservoir and the Changma Reservoir, which have led to a rise in the water level of rivers and an expansion of the water surface area of rivers and lakes. The reduction in grassland and forestland areas may be related to human activities and vegetation degradation in the oasis area. The implementation of ecological protection projects and policies has led to the conversion of large areas of wasteland into forestland and grassland, but the ecological background of Jiuquan is fragile, and there is still significant vegetation degradation in local areas. Therefore, land use type changes in the oasis area of Jiuquan are closely related to human activities, and excessive development and construction can lead to ecological degradation in the oasis area. Land use changes in other areas are mainly due to natural causes.
Analysis of the specific data shows that the increase in plowland area is mainly due to the conversion of grassland and unused land (Table 3), contributing 27.64% and 62.9% of the total area converted to plowland, respectively. The increase in water area is mainly converted from unused land, which accounts for 84.05% of the total area converted into water area. The increase in construction land area was mainly converted from plowland, grassland and unused land, accounting for 9.73%, 9.17% and 79.88% of the total area converted into construction land, respectively. It can be seen that the conversion of unused land to other land types, grassland to plowland and construction land, and plowland to construction land are the main ways of land use conversion in the study area.

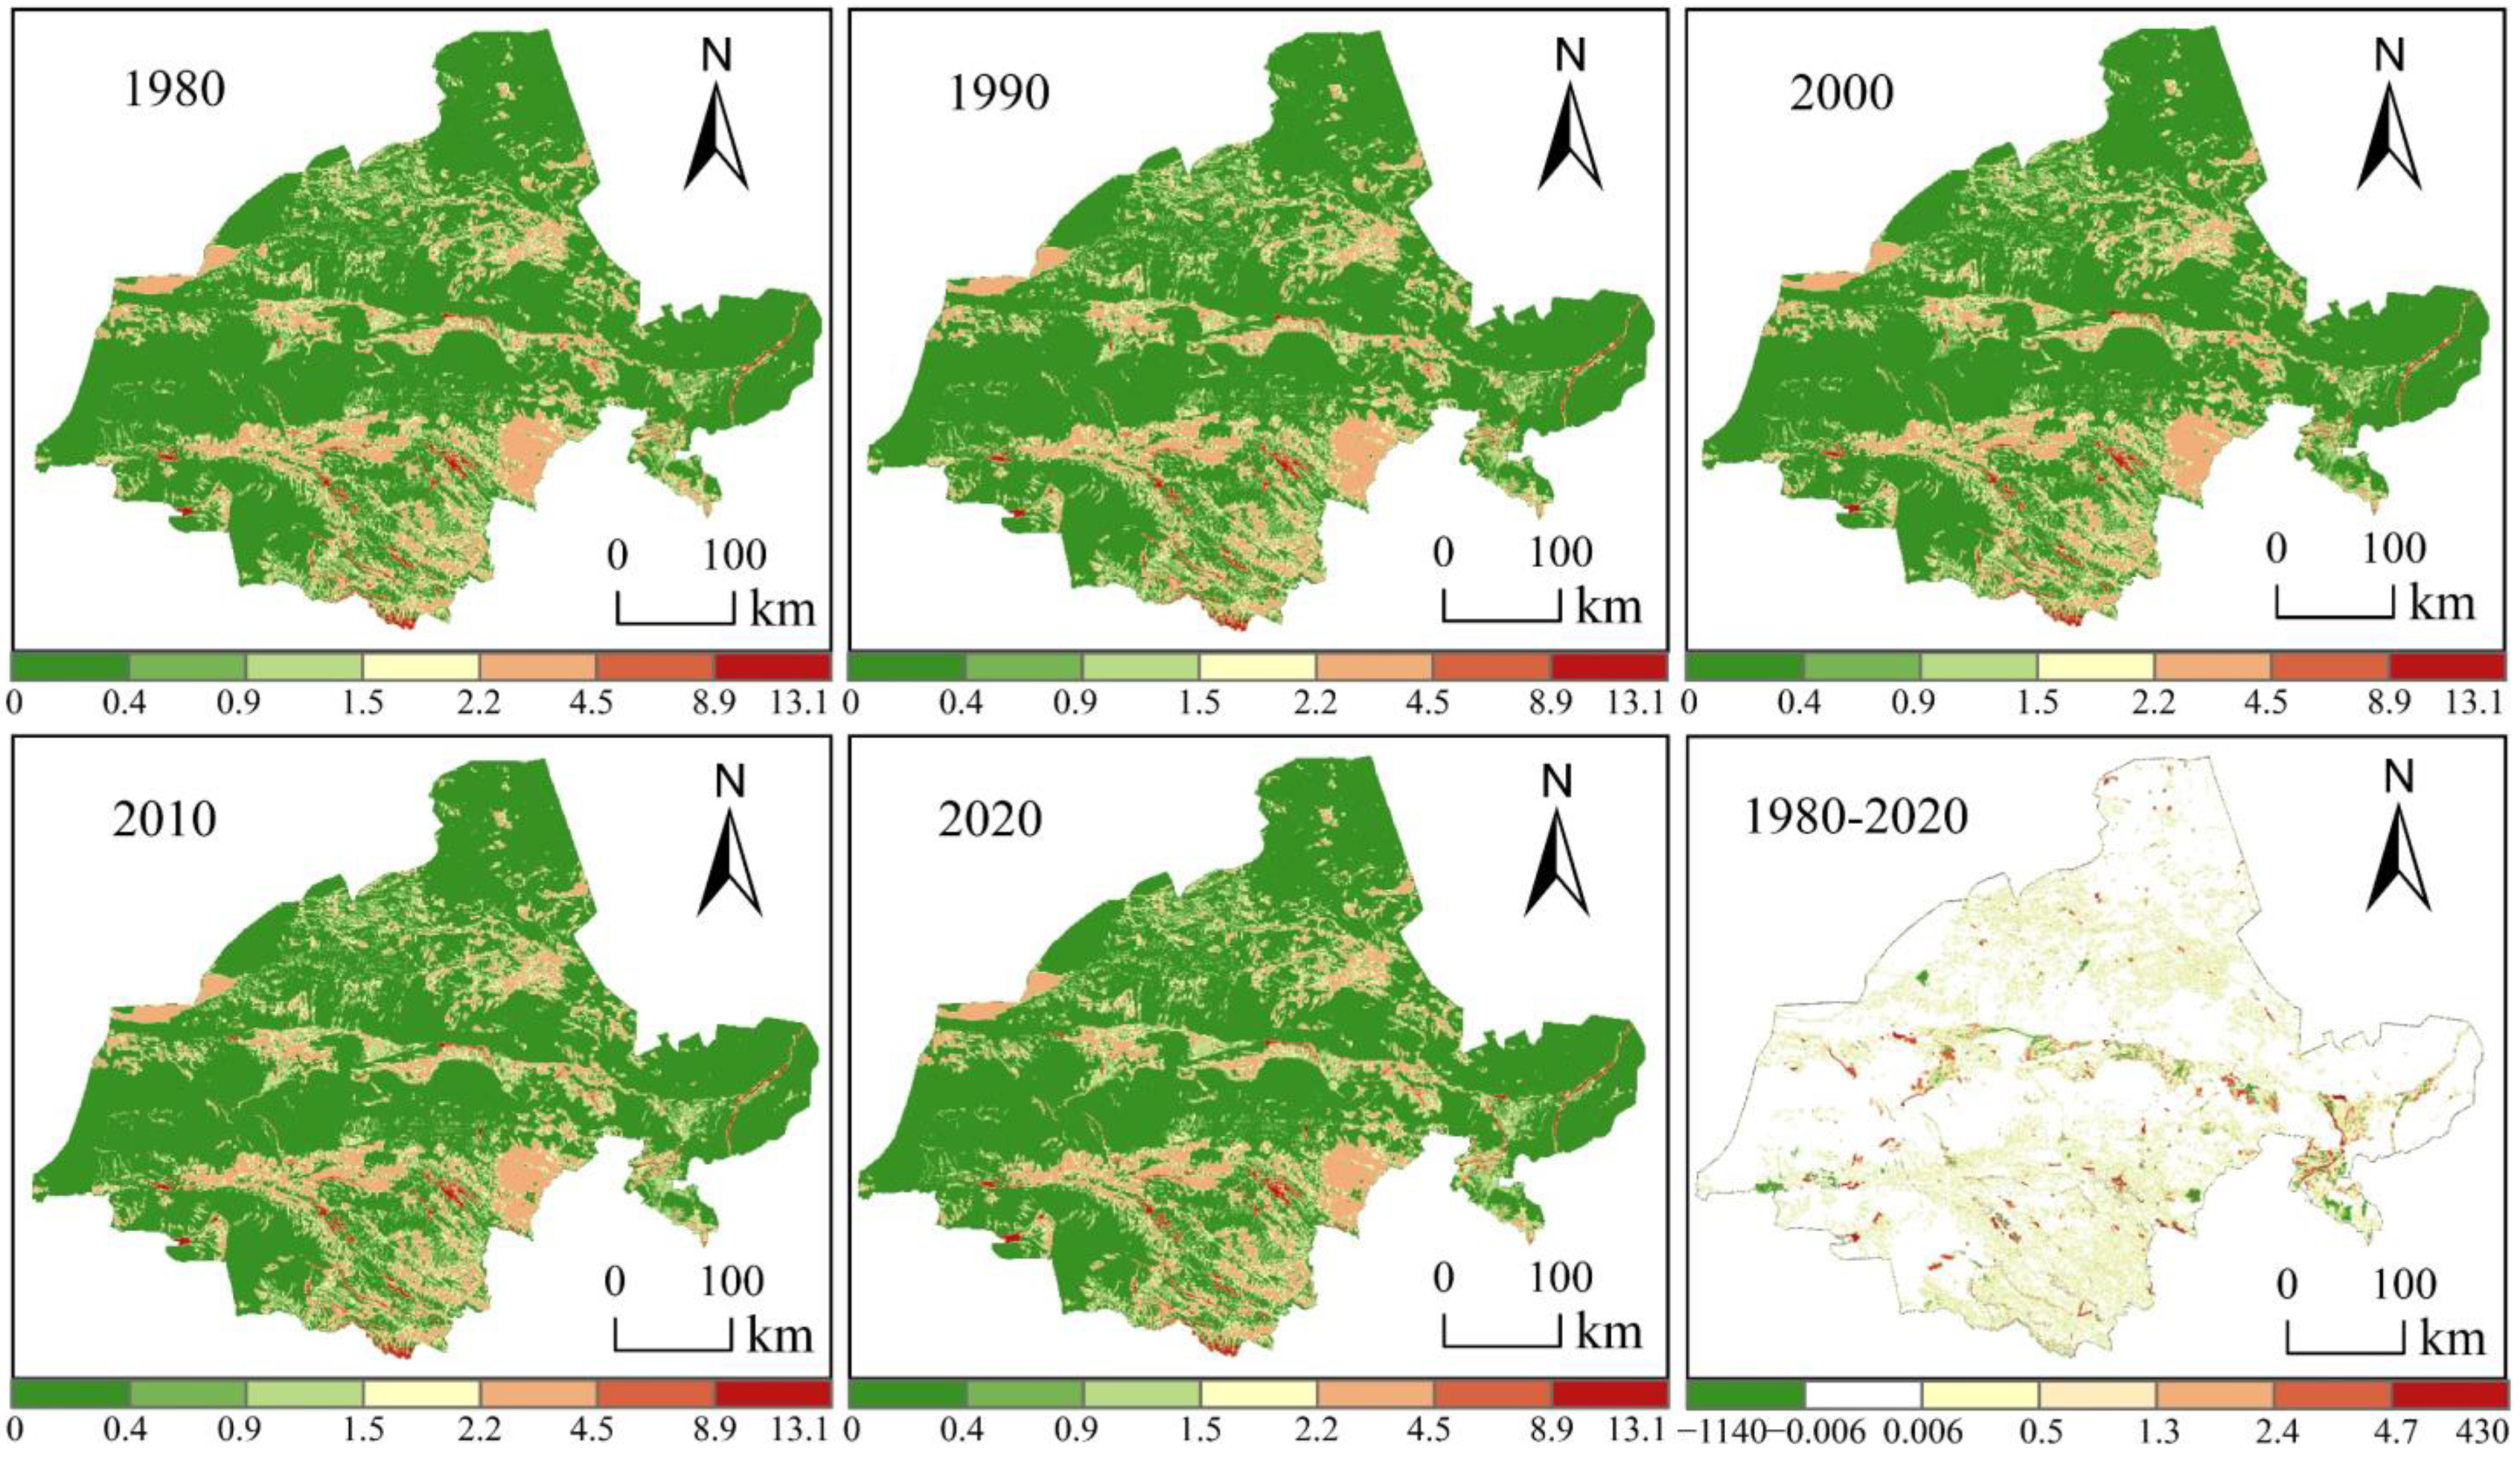
4.2. Analysis of ESV Change Characteristics

As shown in Figure 7, forestland and grassland are widely distributed in the south, middle and north of Jiuquan City, with high ESV. Other areas are mostly unused land with low ESV. From 1980 to 2020, due to urbanization, the land use types in the central and eastern oases changed frequently, resulting in significant spatial changes in ESV. The ESV in the south and north increased slightly and remained unchanged in other areas.
Between 1980 and 2020, the ESV of Jiuquan City increased from 139.394 billion to CNY142.642 billion (Table 4). In terms of the different land use types, grassland has the largest ESV contribution with 62.49%. This is followed by waters and unused land, with a contribution of 16.48% and 16.20%, respectively. Forestland, plowland and construction land contributed less, at 2.62%, 1.94% and 0.26%, respectively. Of these, plowland, construction land and watershed ESV are on a rapid upward trend, while forestland, grassland and unused land ESV are on a slow downward trend. In terms of the different ecosystem service functions (Table 5), regulating services provided the highest ESV at 67.26%. This was followed by support services at 21.31%. Supply services and cultural services ESV accounted for 6.88% and 4.55%, respectively. In the past 40 years, the adjustment service increased the most, with an increment of CNY 2.566 billion. In terms of ecosystem service subtypes, hydrological regulation made the largest contribution to ESV at 27.79%. This was followed by climate regulation with 19.17%. Maintenance of nutrient cycling contributed the least with only 0.82%. All subtypes showed an increasing trend.

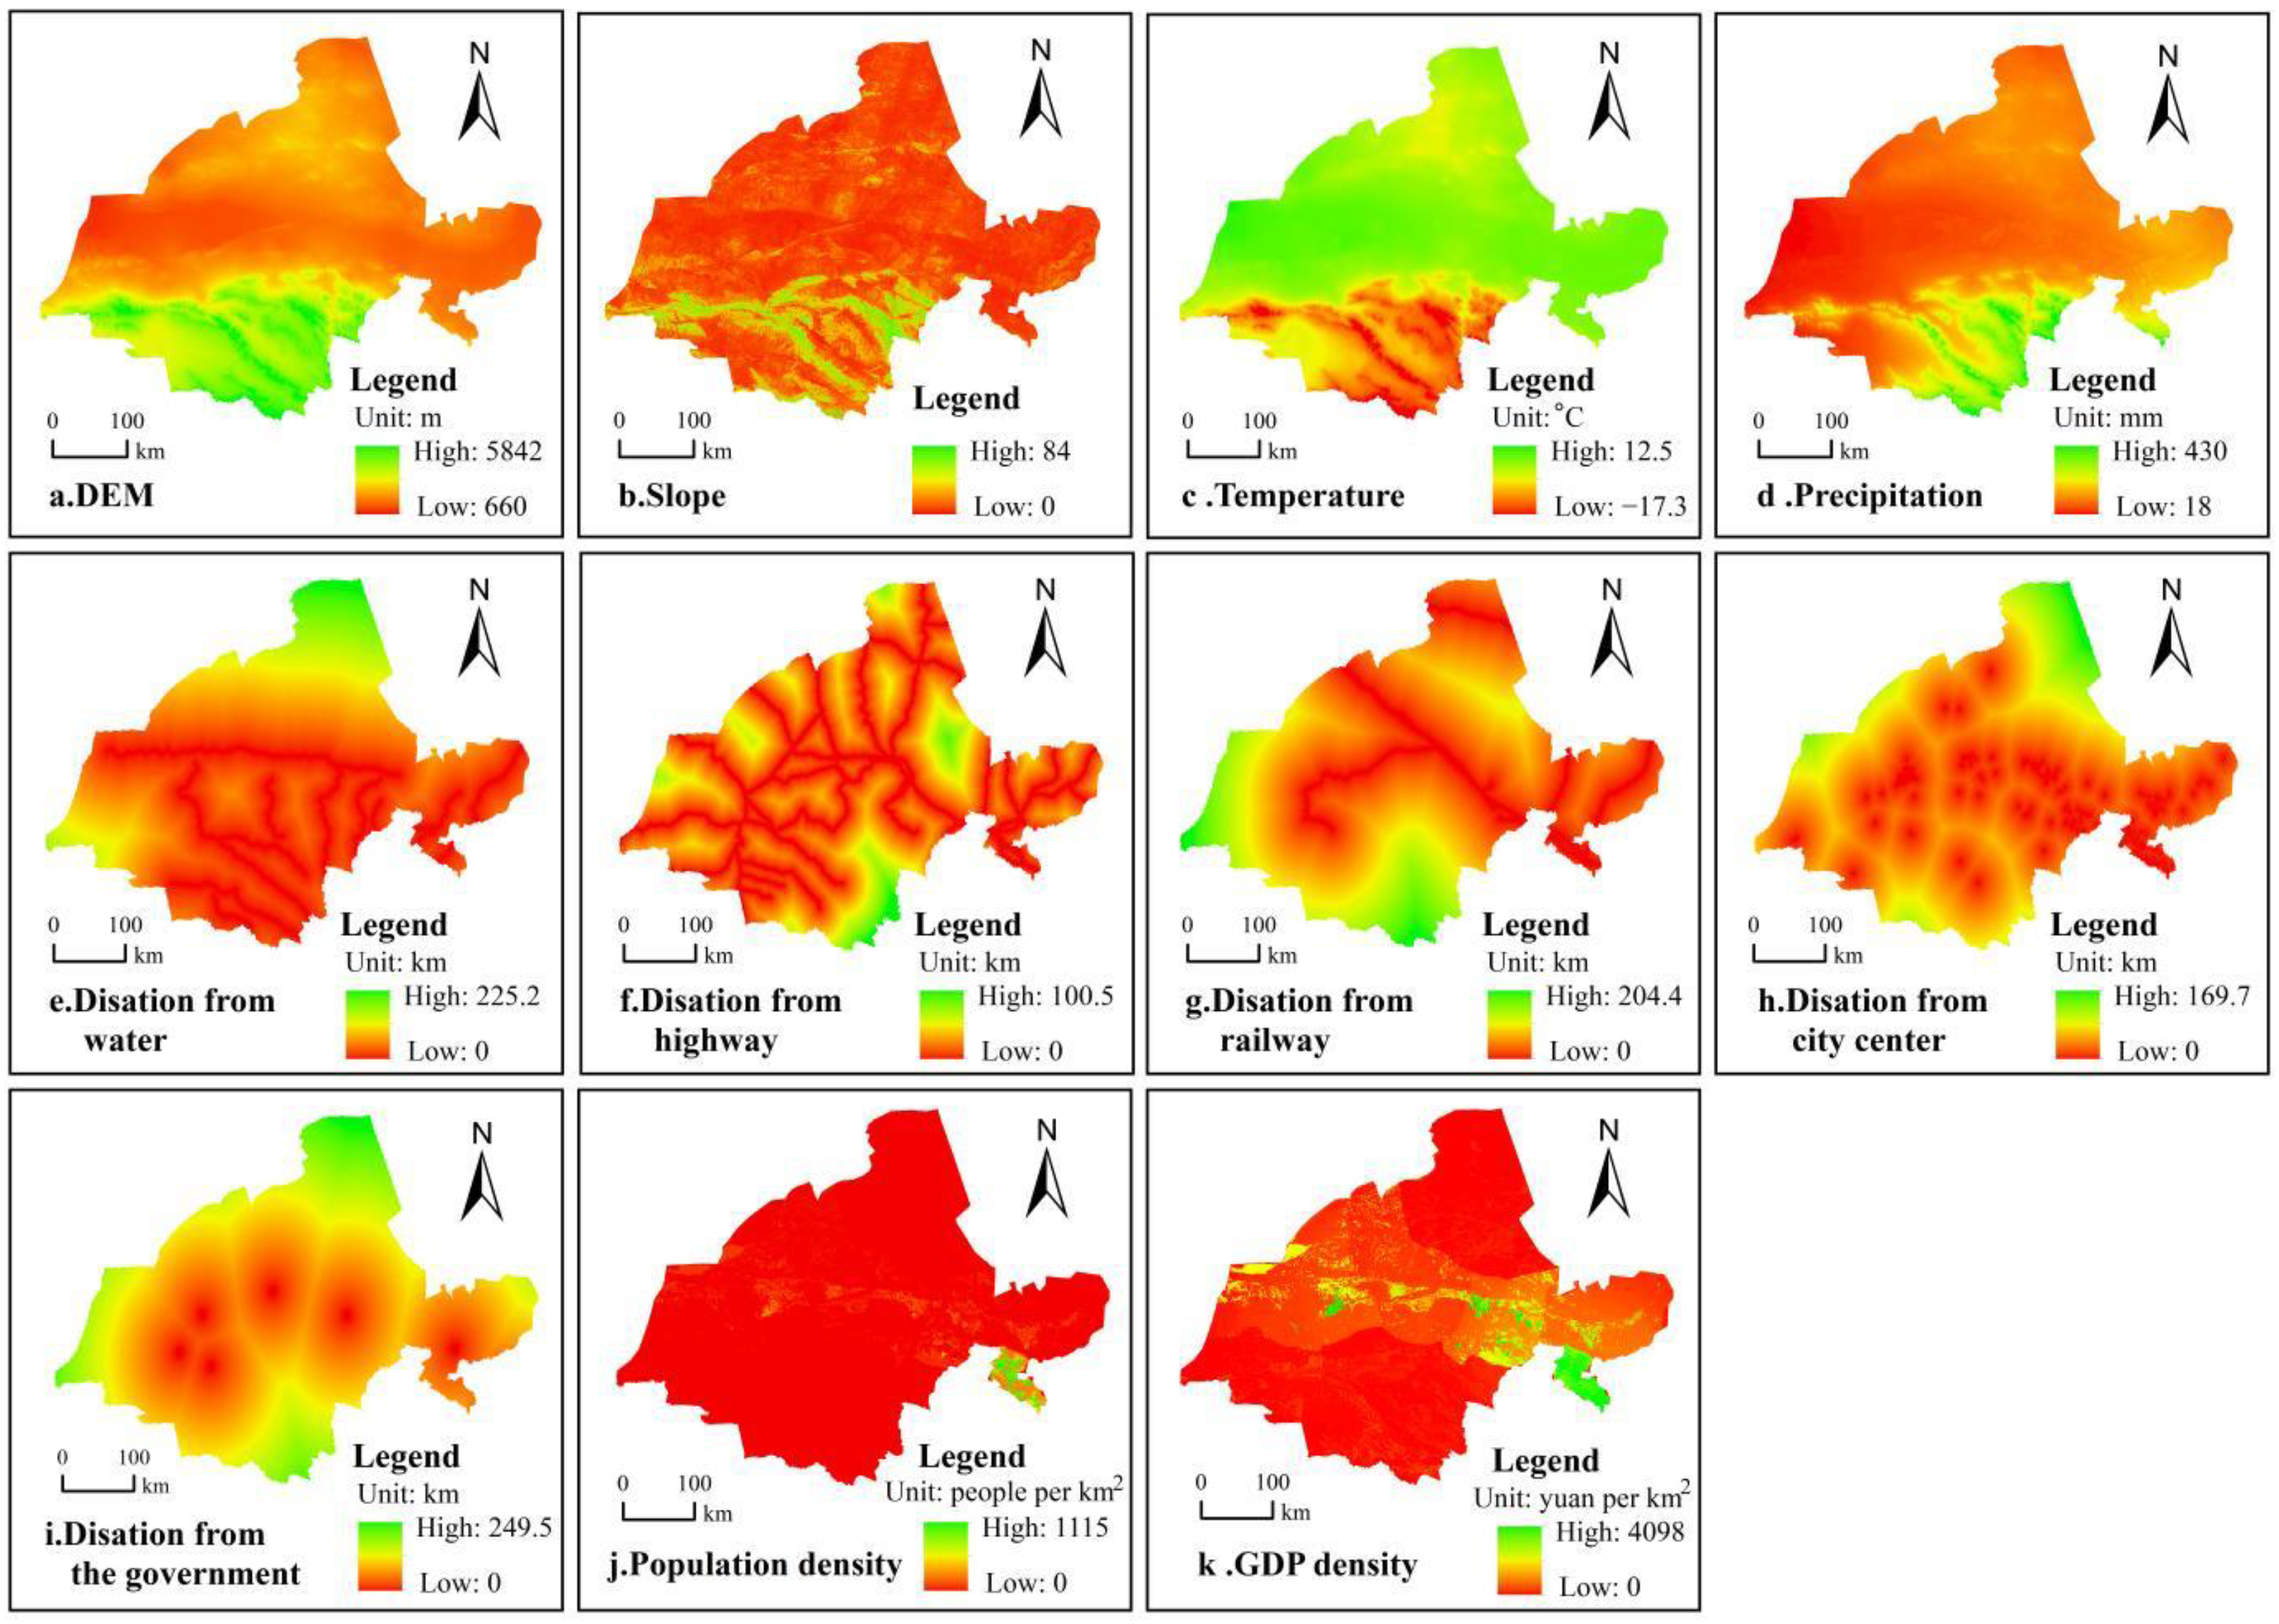
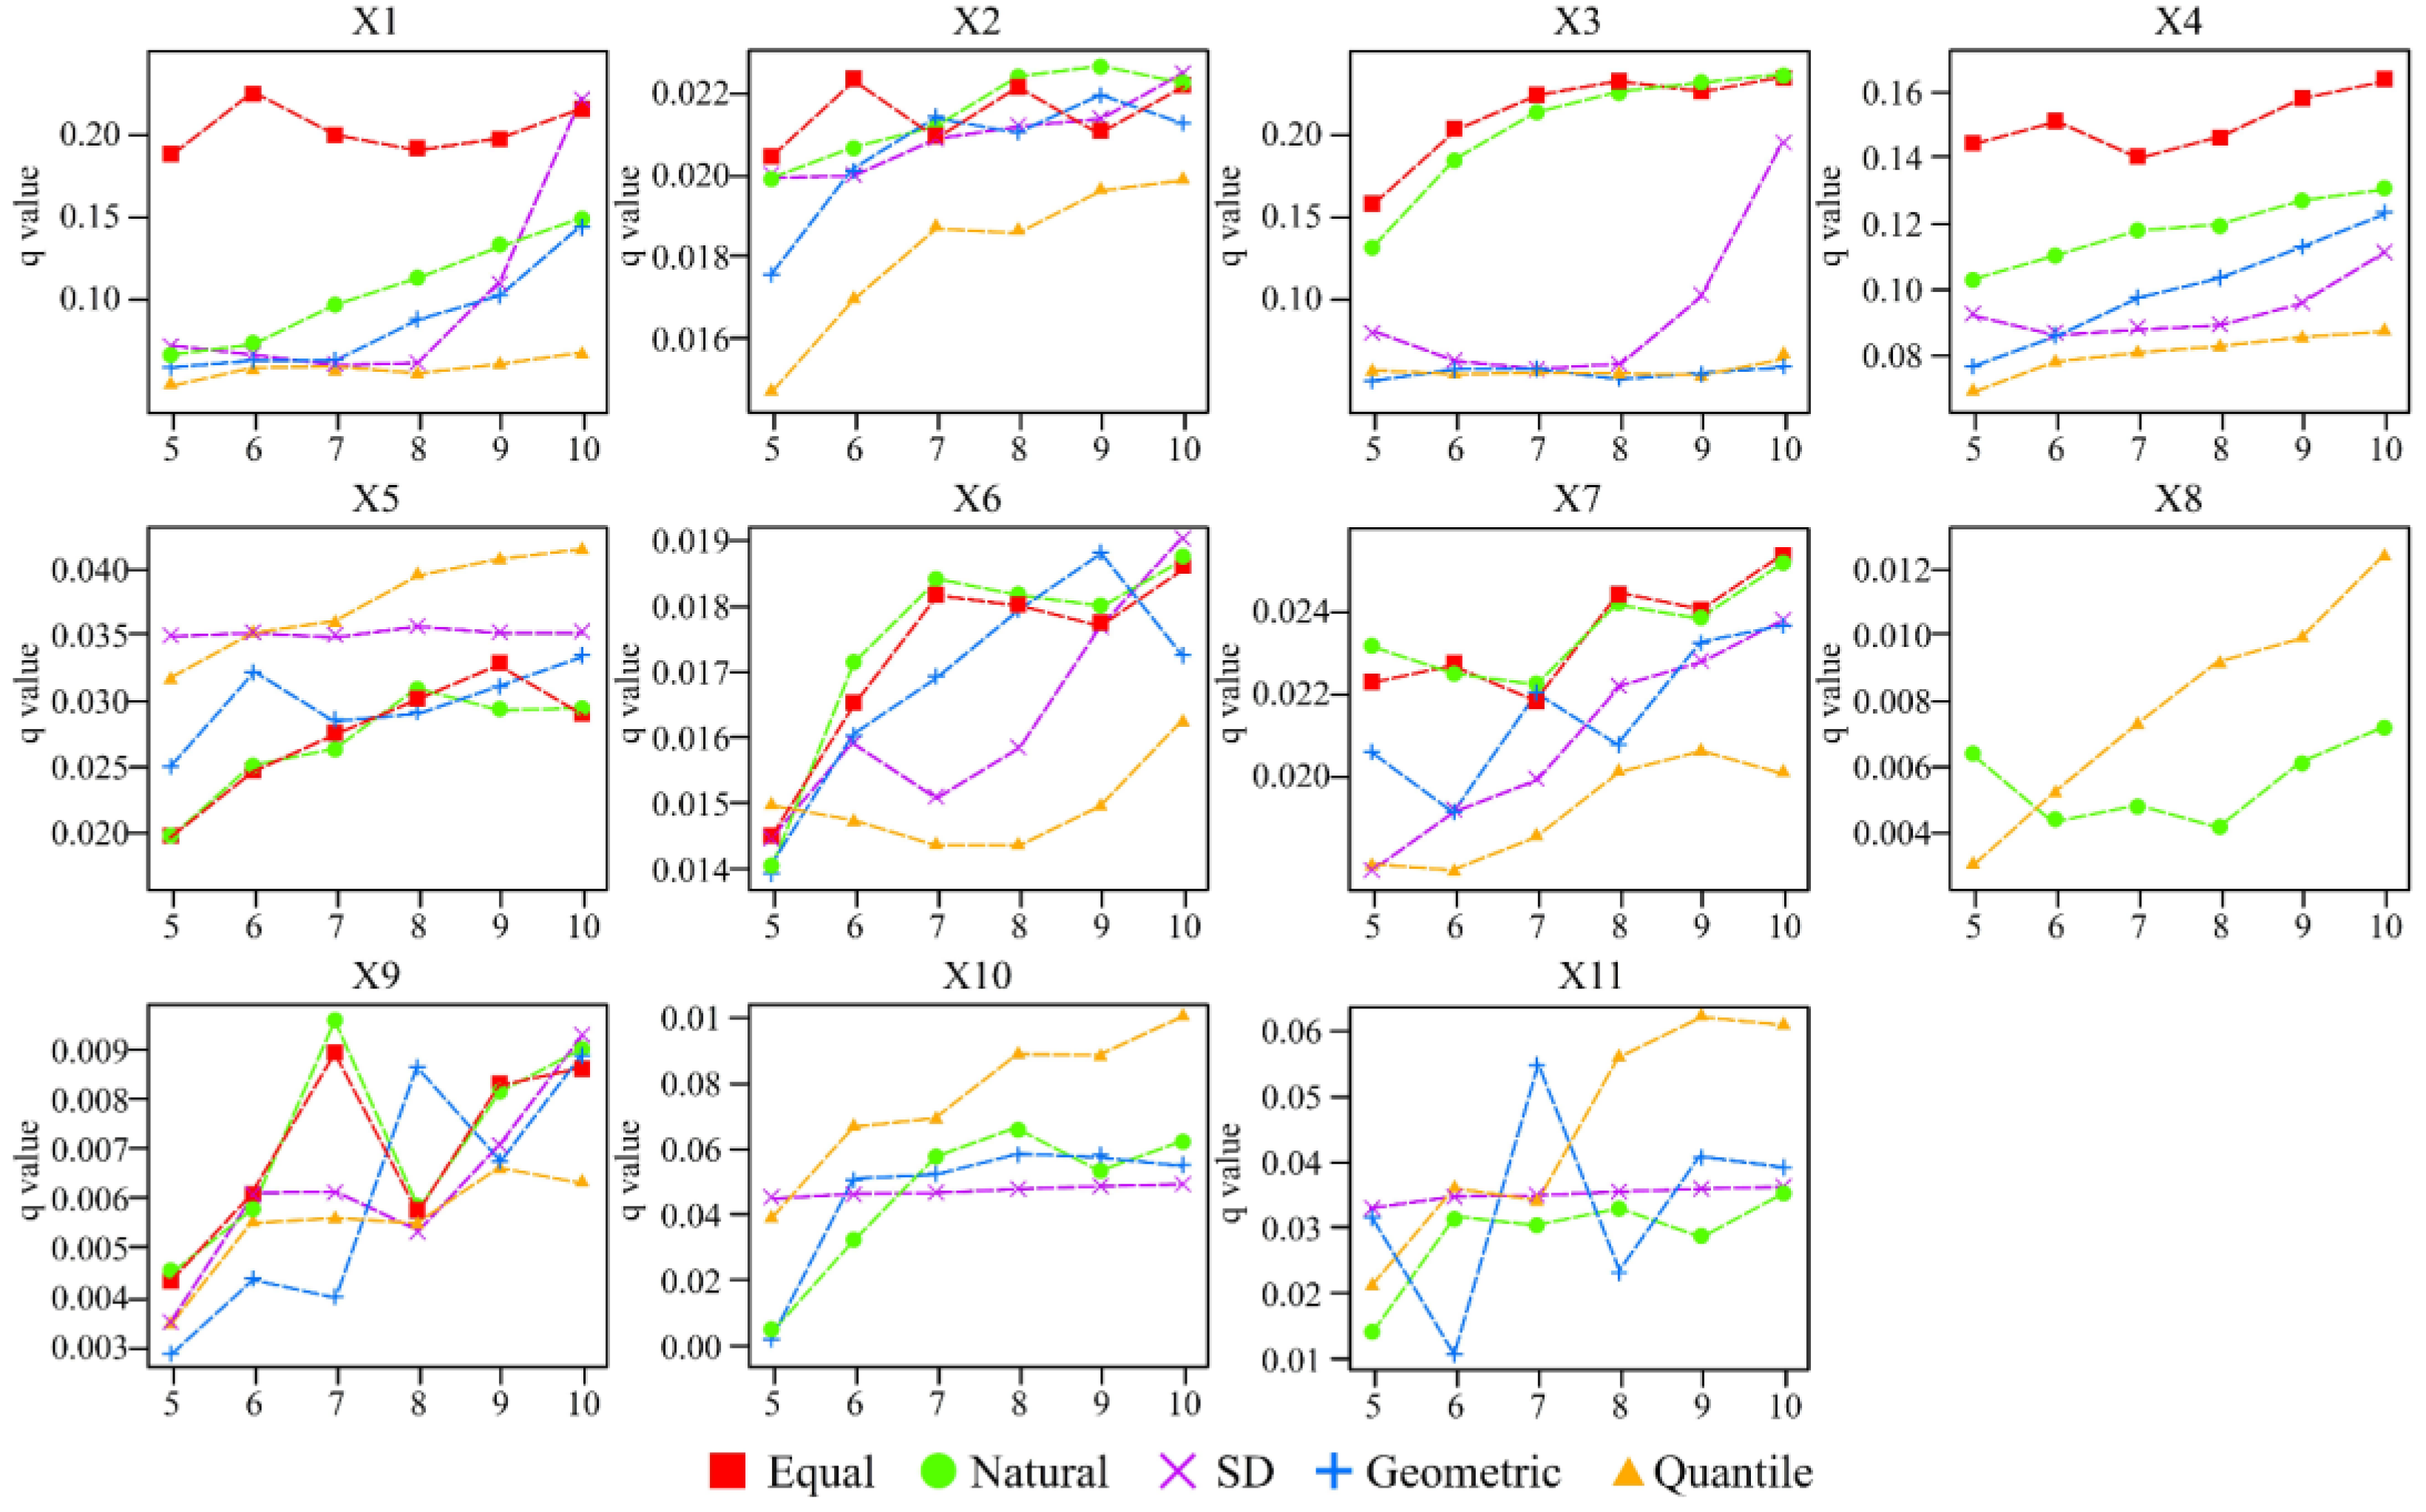
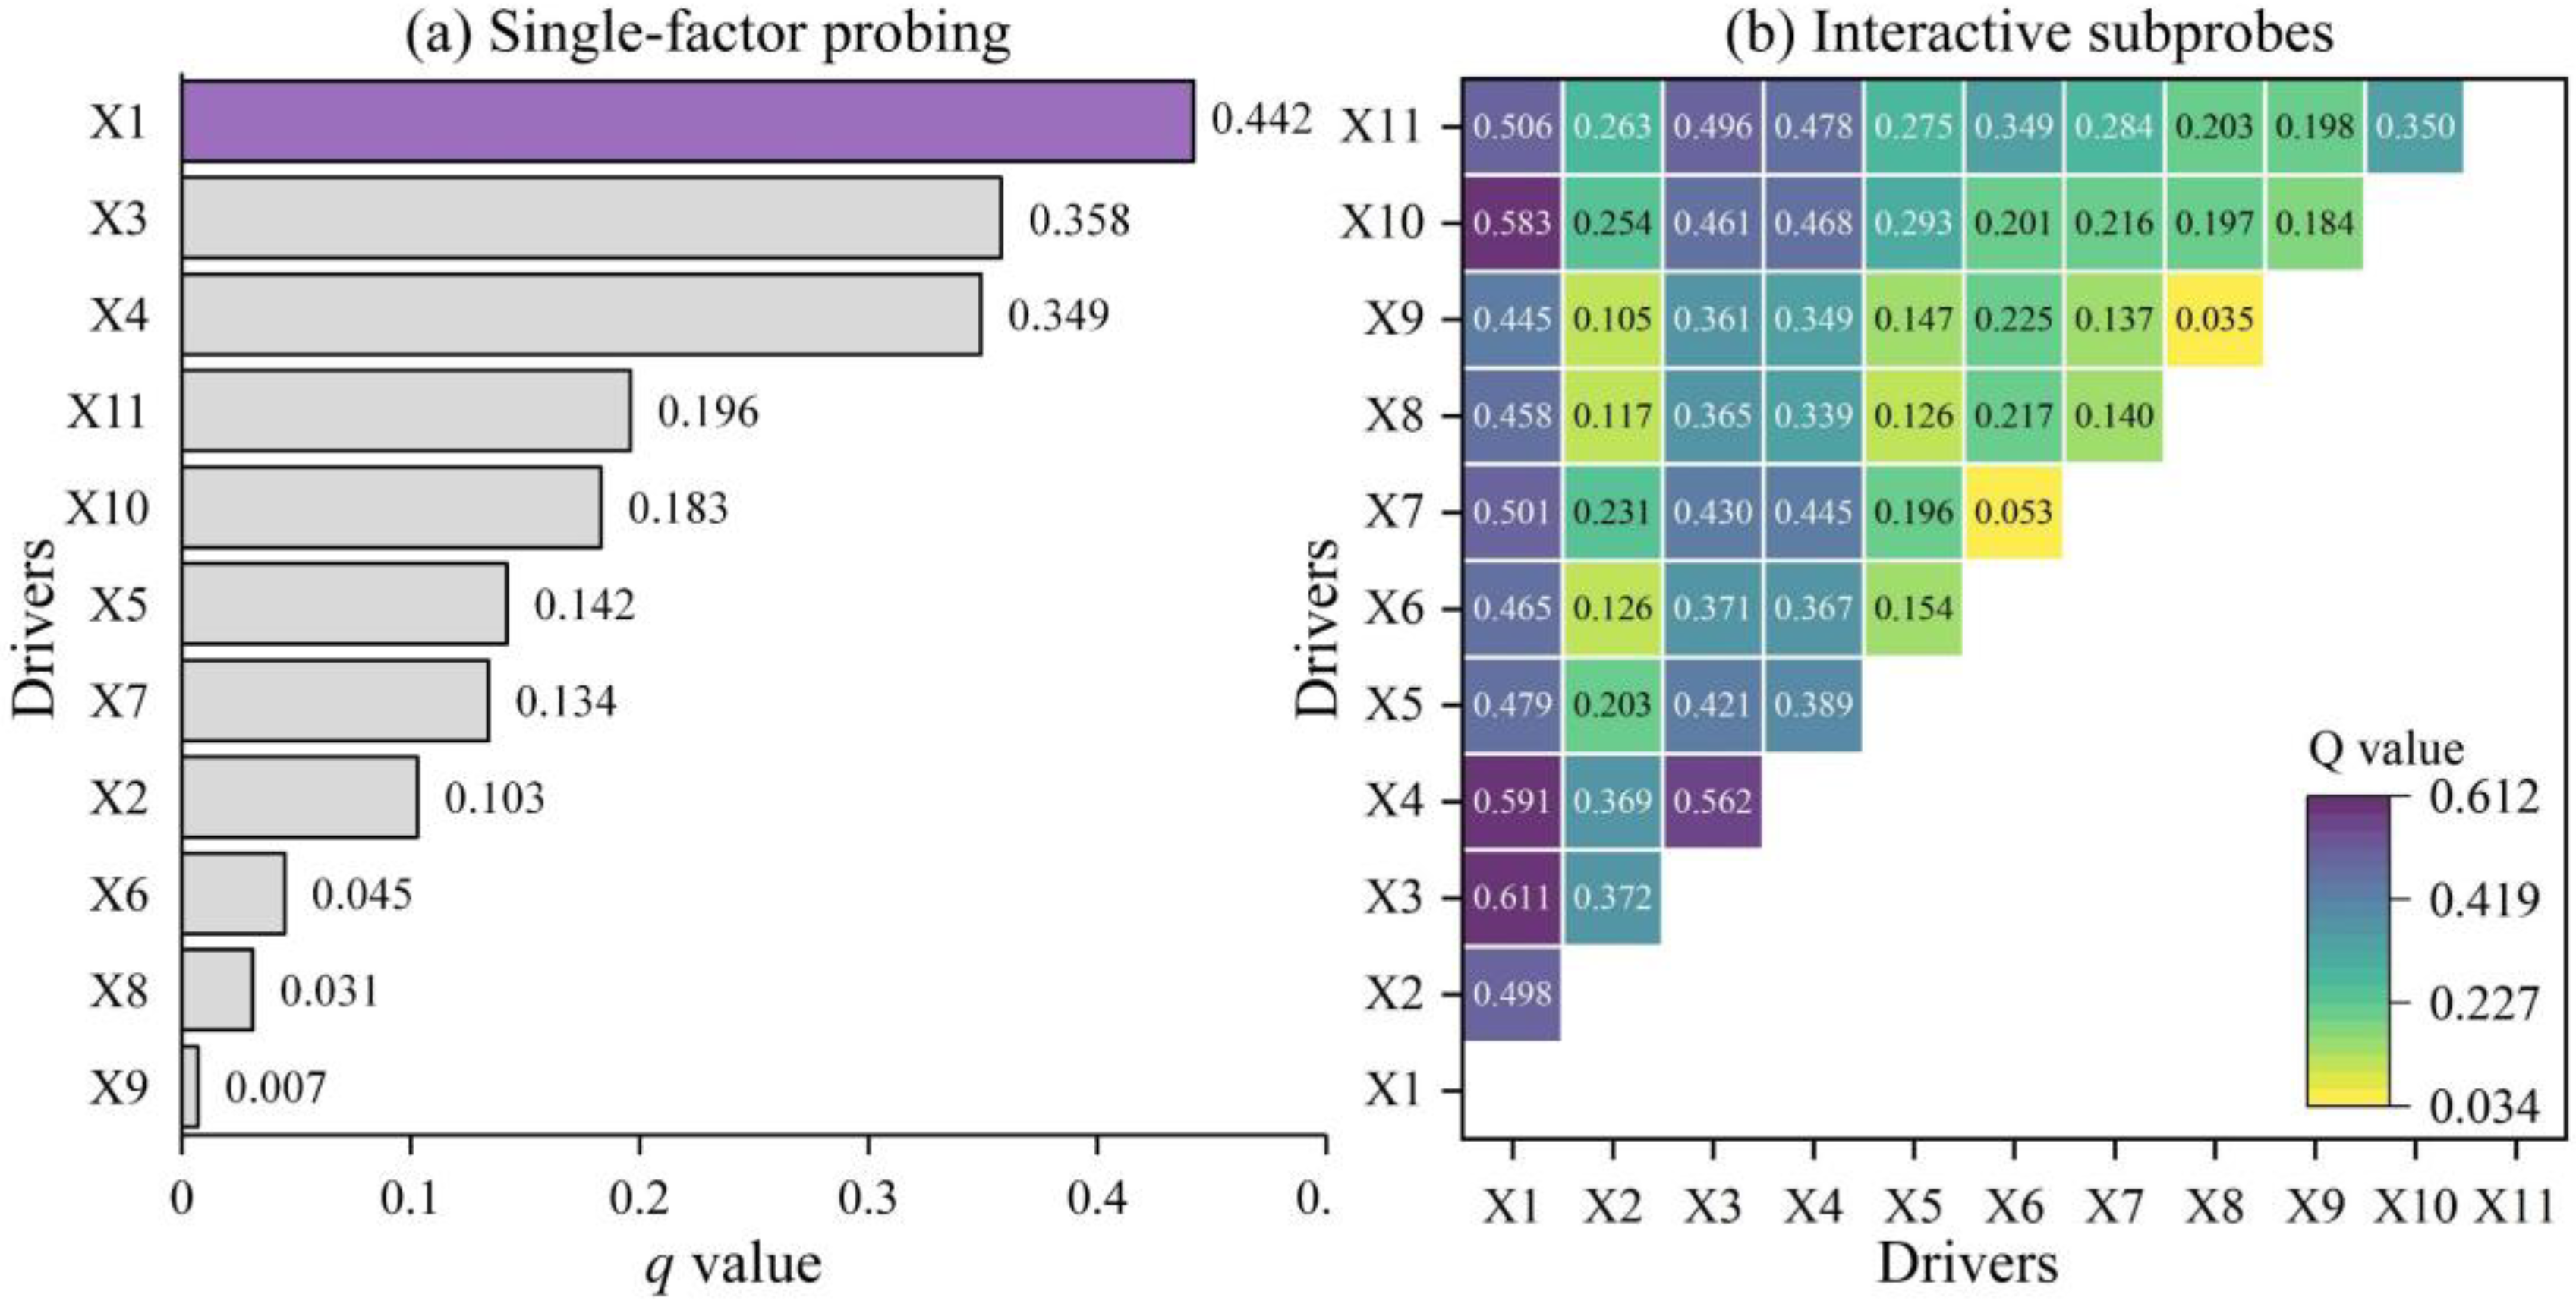
4.3. Driving Force Analysis of ESV Spatial Differentiation

In this paper, 11 continuous factors of elevation (X1), slope (X2), air temperature (X3), precipitation (X4), distance from water (X5), distance from roads (X6), distance from railways (X7), distance from the city center (X8), distance from the government (X9), population density (X10), and GDP density (X11) were optimally discretized (Figure 8). Taking precipitation as an example, the q value is the largest when the number of intervals in the equal interval classification method is 10, so the precipitation should be divided into 10 categories by equal interval classification in the geographic detector as the optimal parameter selection, and the other driving factors are the same.
From the single-factor analysis (Figure 9a), all factors have significant driving effects on the spatial distribution characteristics of ESV (P values are less than 0.01). Among them, elevation, temperature and precipitation have strong explanatory power on the spatial distribution of ESV, and q values are 0.442, 0.385 and 0.349, respectively. It shows that for arid areas, topographic characteristics and climate factors are the main driving factors for the spatial distribution of ESV. The q values of population density and GDP density are 0.196 and 0.183, respectively, which are second only to precipitation and have a strong impact on the spatial distribution of ESV. From the interaction factor analysis (Figure 9b), any two-factor interaction q values are greater than the single-factor q values, indicating that the interaction between factors enhances the driving force on the spatial distribution of ESV. The most significant enhancements in the interaction values of X1 and X3 with X4, X10 and X11 were all greater than 0.46 in q value. Studies have shown that the interaction of altitude, temperature and precipitation, GDP density and population density can greatly enhance the effect on the spatial distribution of ESVs under specific combinations of conditions.

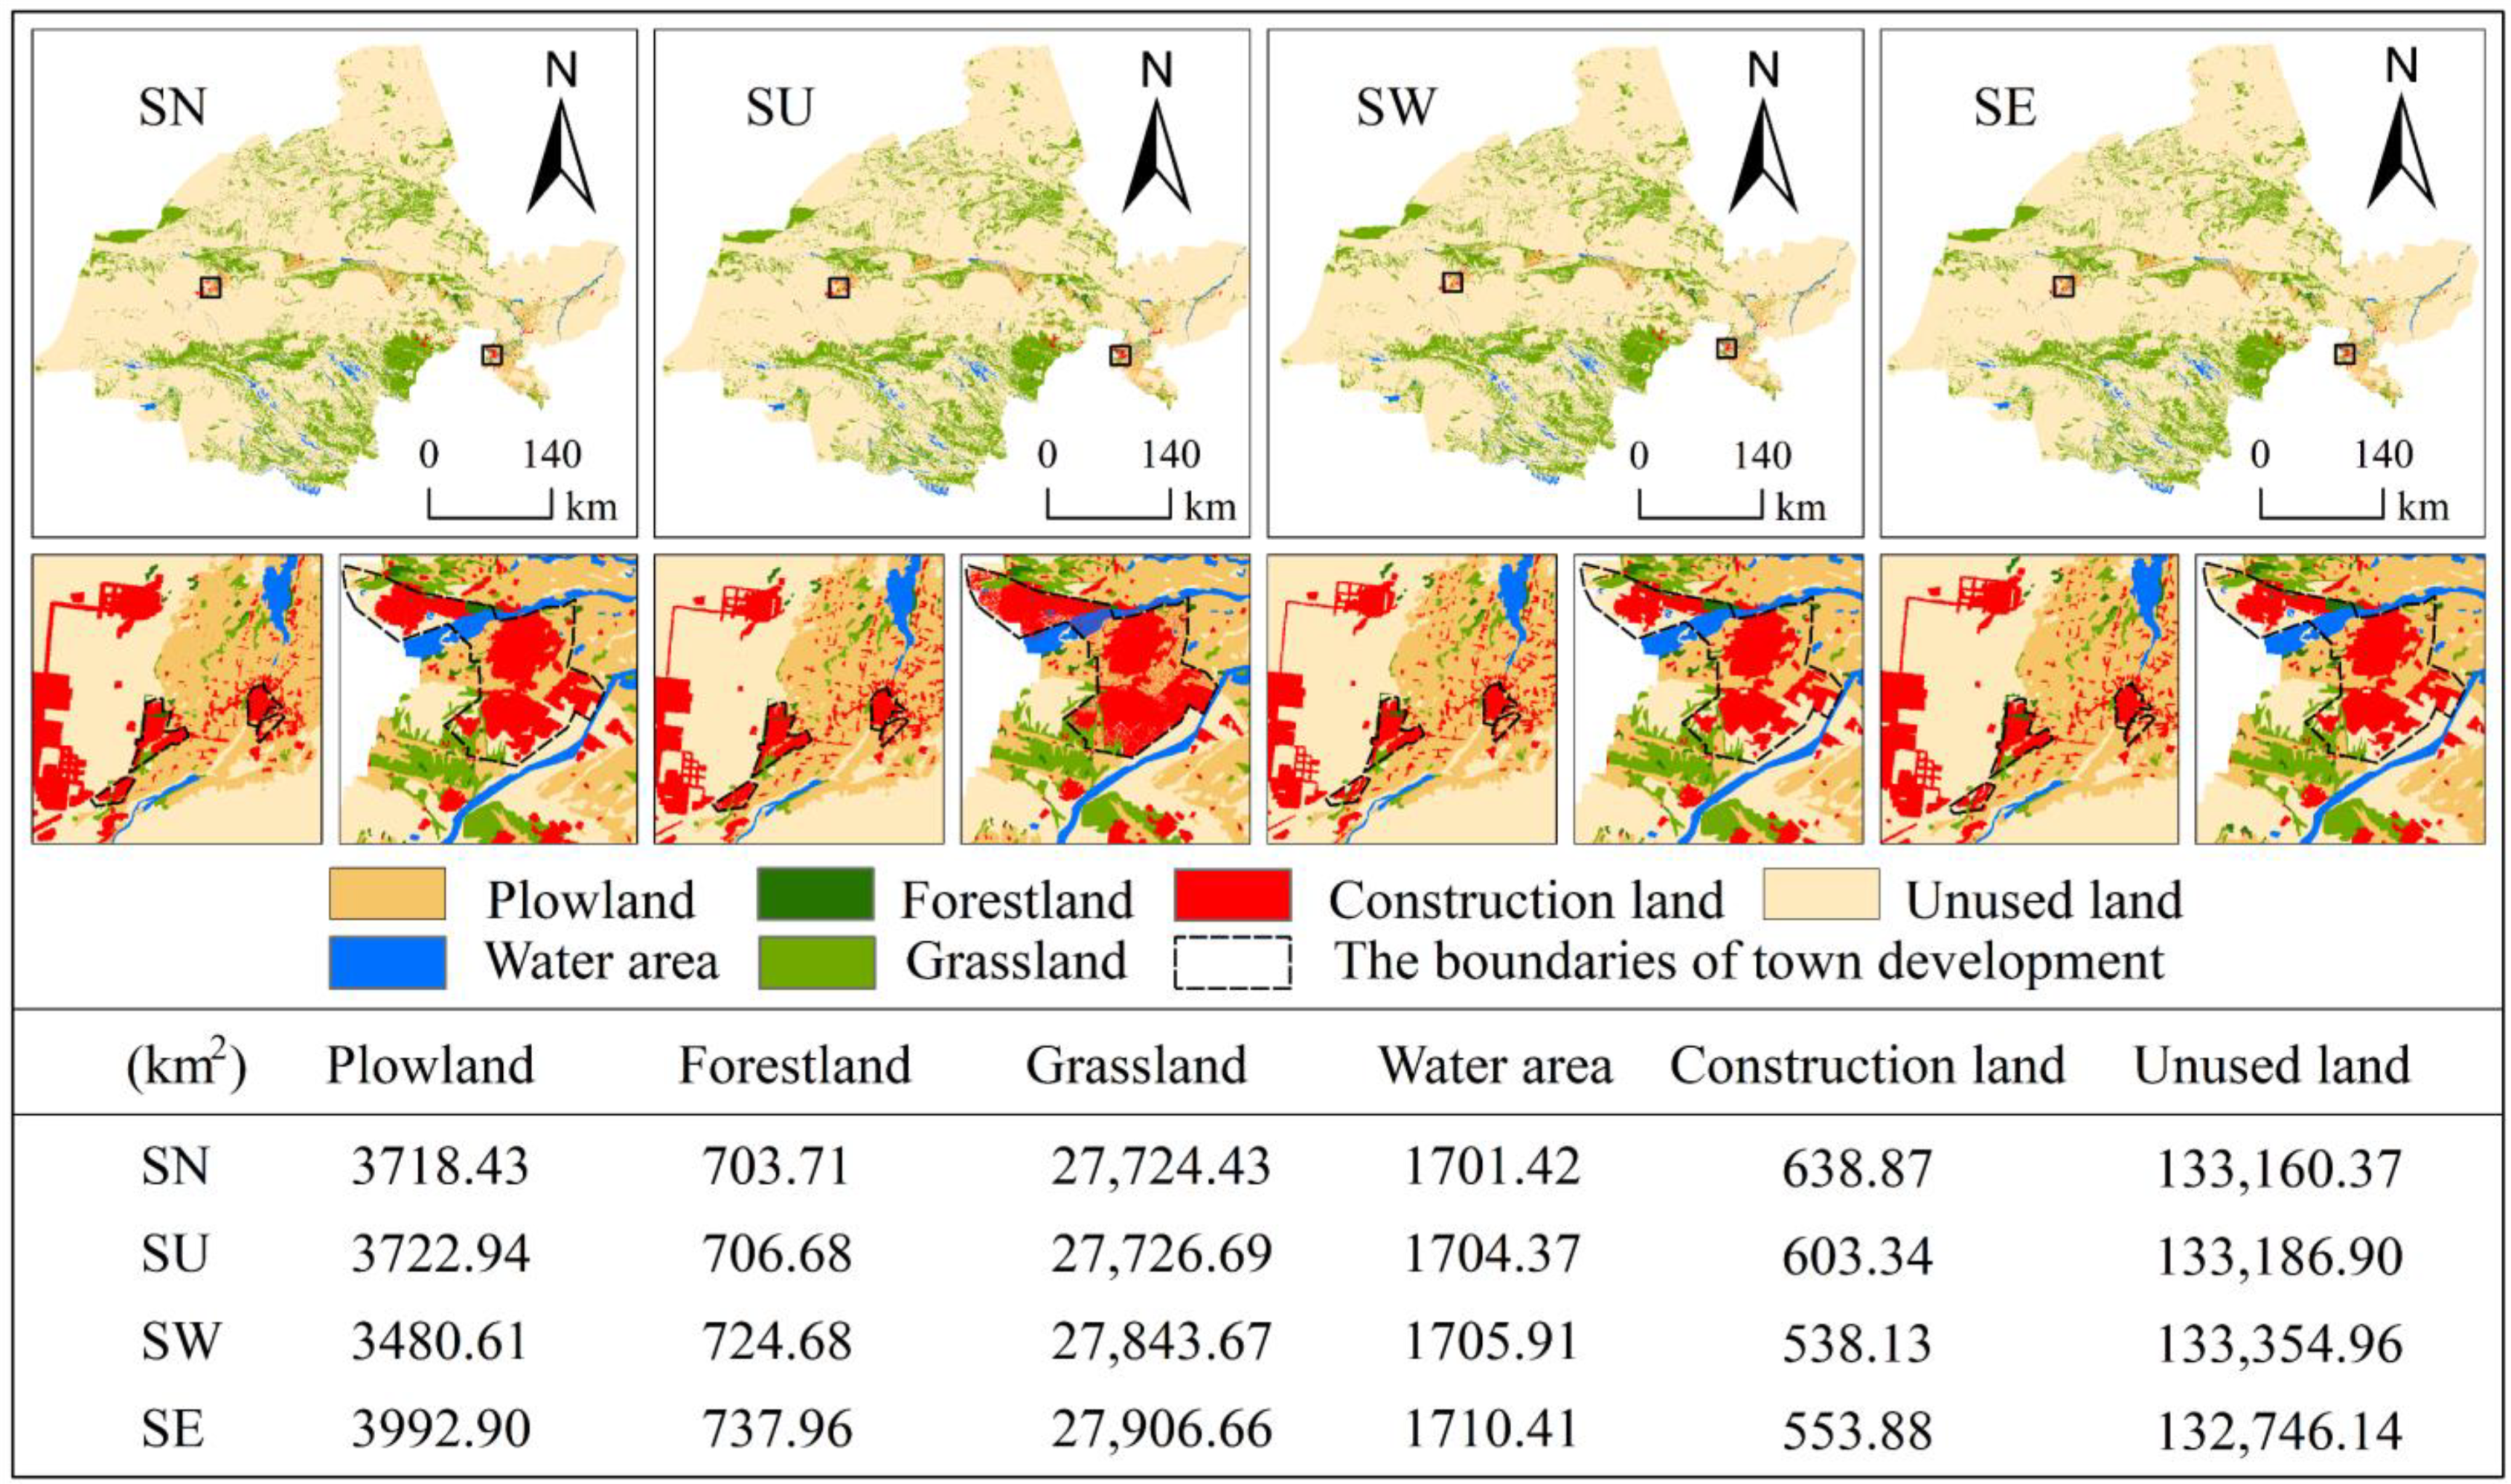
4.4. Simulation of Land Use Change in Jiuquan City in 2035

The simulation results show that the spatial distribution pattern of land use in Jiuquan City is basically the same under the four scenarios (Figure 10), but there are differences in the changes of each land use type in the different scenarios. The SN scenario is a continuation of the historical development pattern, with a large amount of construction and development leading to a significant increase in the area of built-up land and mainly outward expansion, with a strong encroachment on ecological land such as plowland, forestland and grassland. The SU scenario, with its restrictions on urban development boundaries, has led to a more concentrated and predominantly infill expansion of construction land in the oasis area, with less encroachment on ecological land outside the urban development boundaries. The restriction on total water use in the SW scenario results in the smallest increase in the area of plowland and construction land in the study area. The grasslands in the oasis areas of Dunhuang, Guazhou and Yumen have not been significantly developed or destroyed, and there has been a large increase in the area of forestland and grassland. In the SE scenario, the largest increase in the area of plowland, forestland, grassland and water was due to the increased protection of the ecological environment, and it was mainly converted from unused land. In general, the SE scenario is more suitable for the future development of Jiuquan City from the perspective of improving the quality of the regional ecological environment.

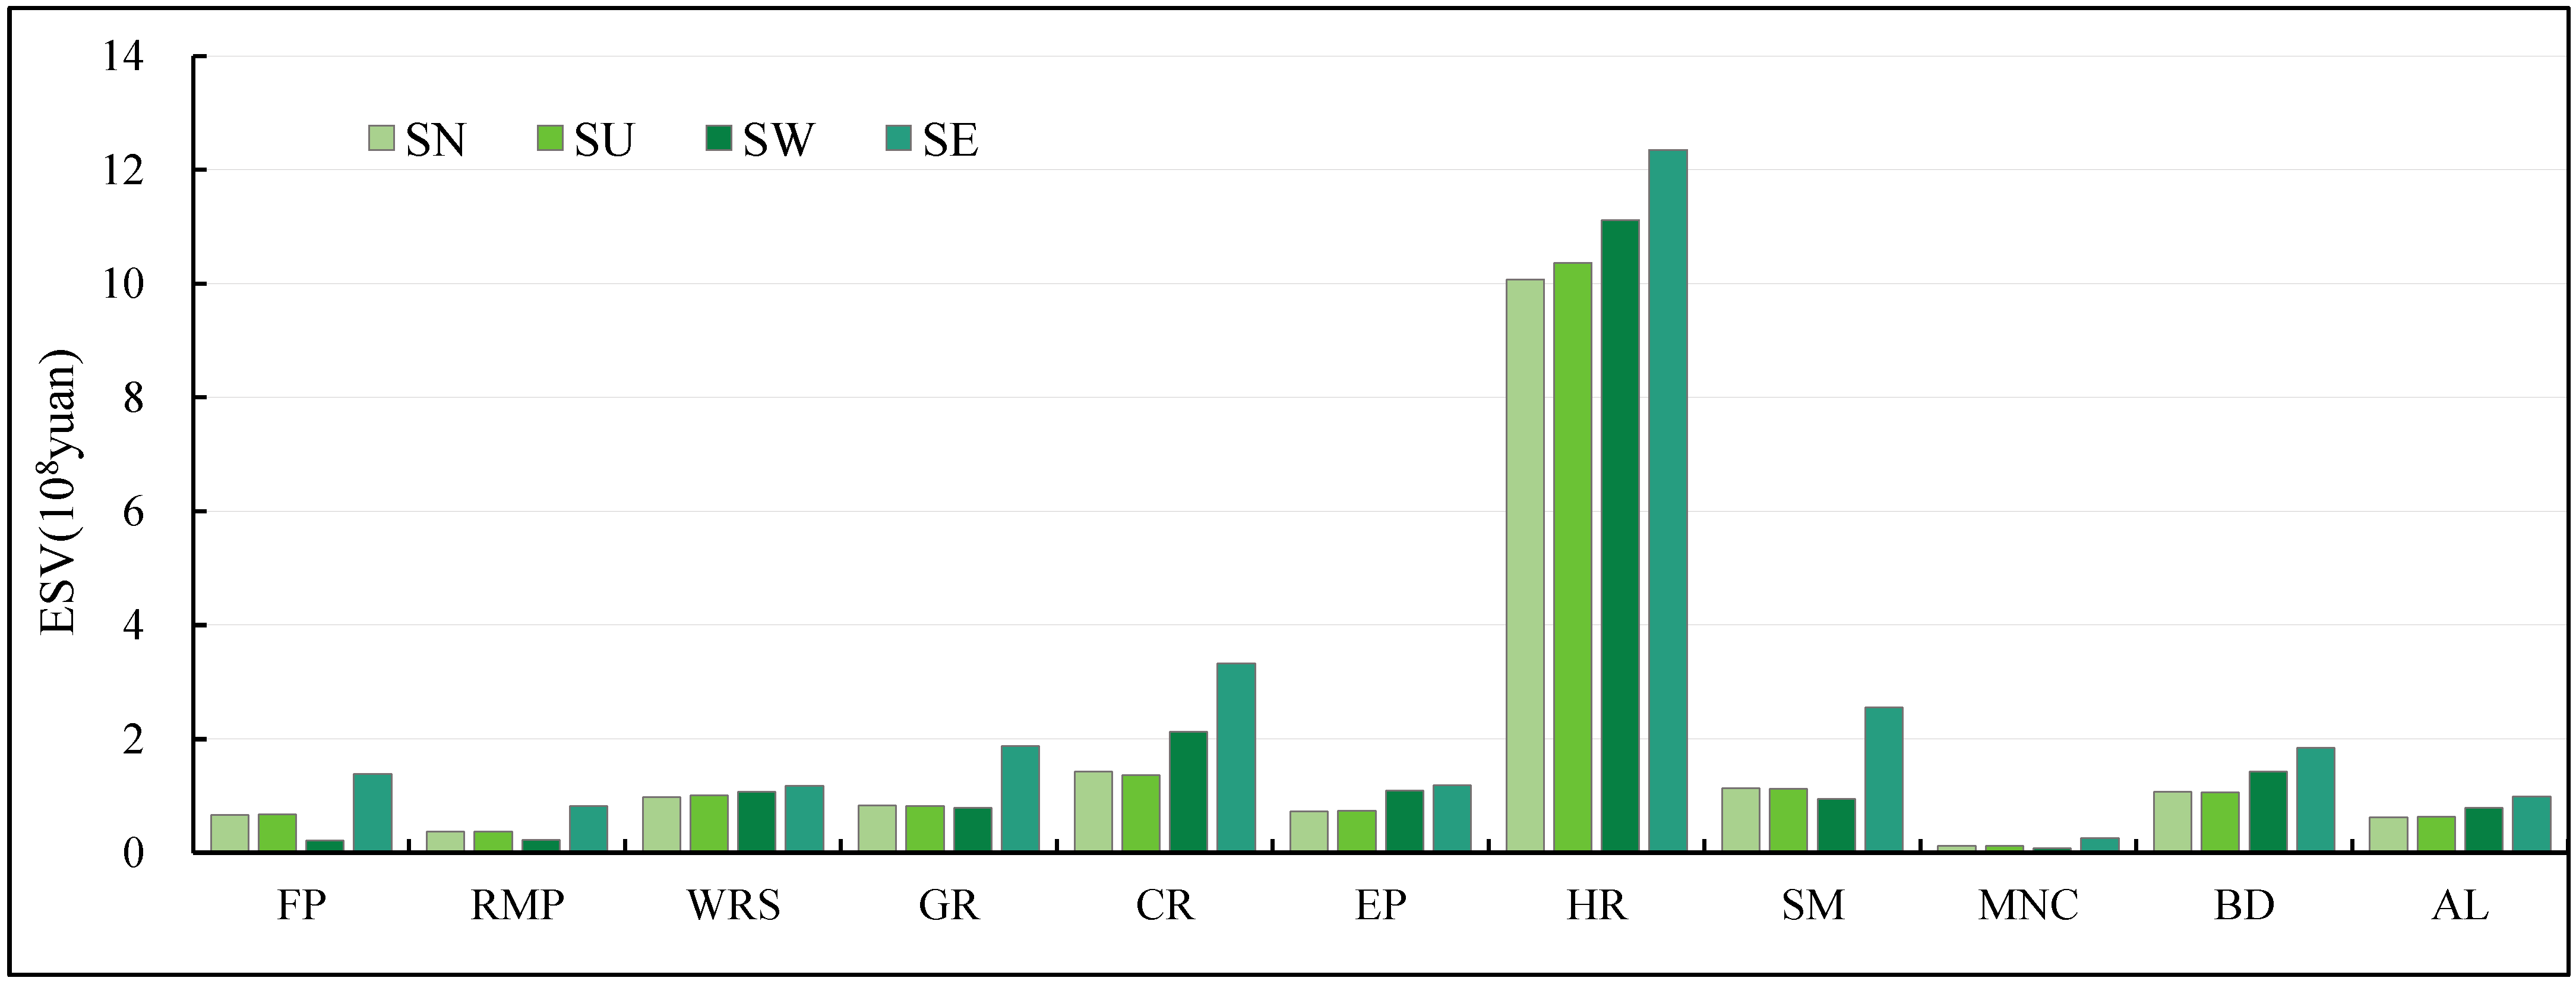
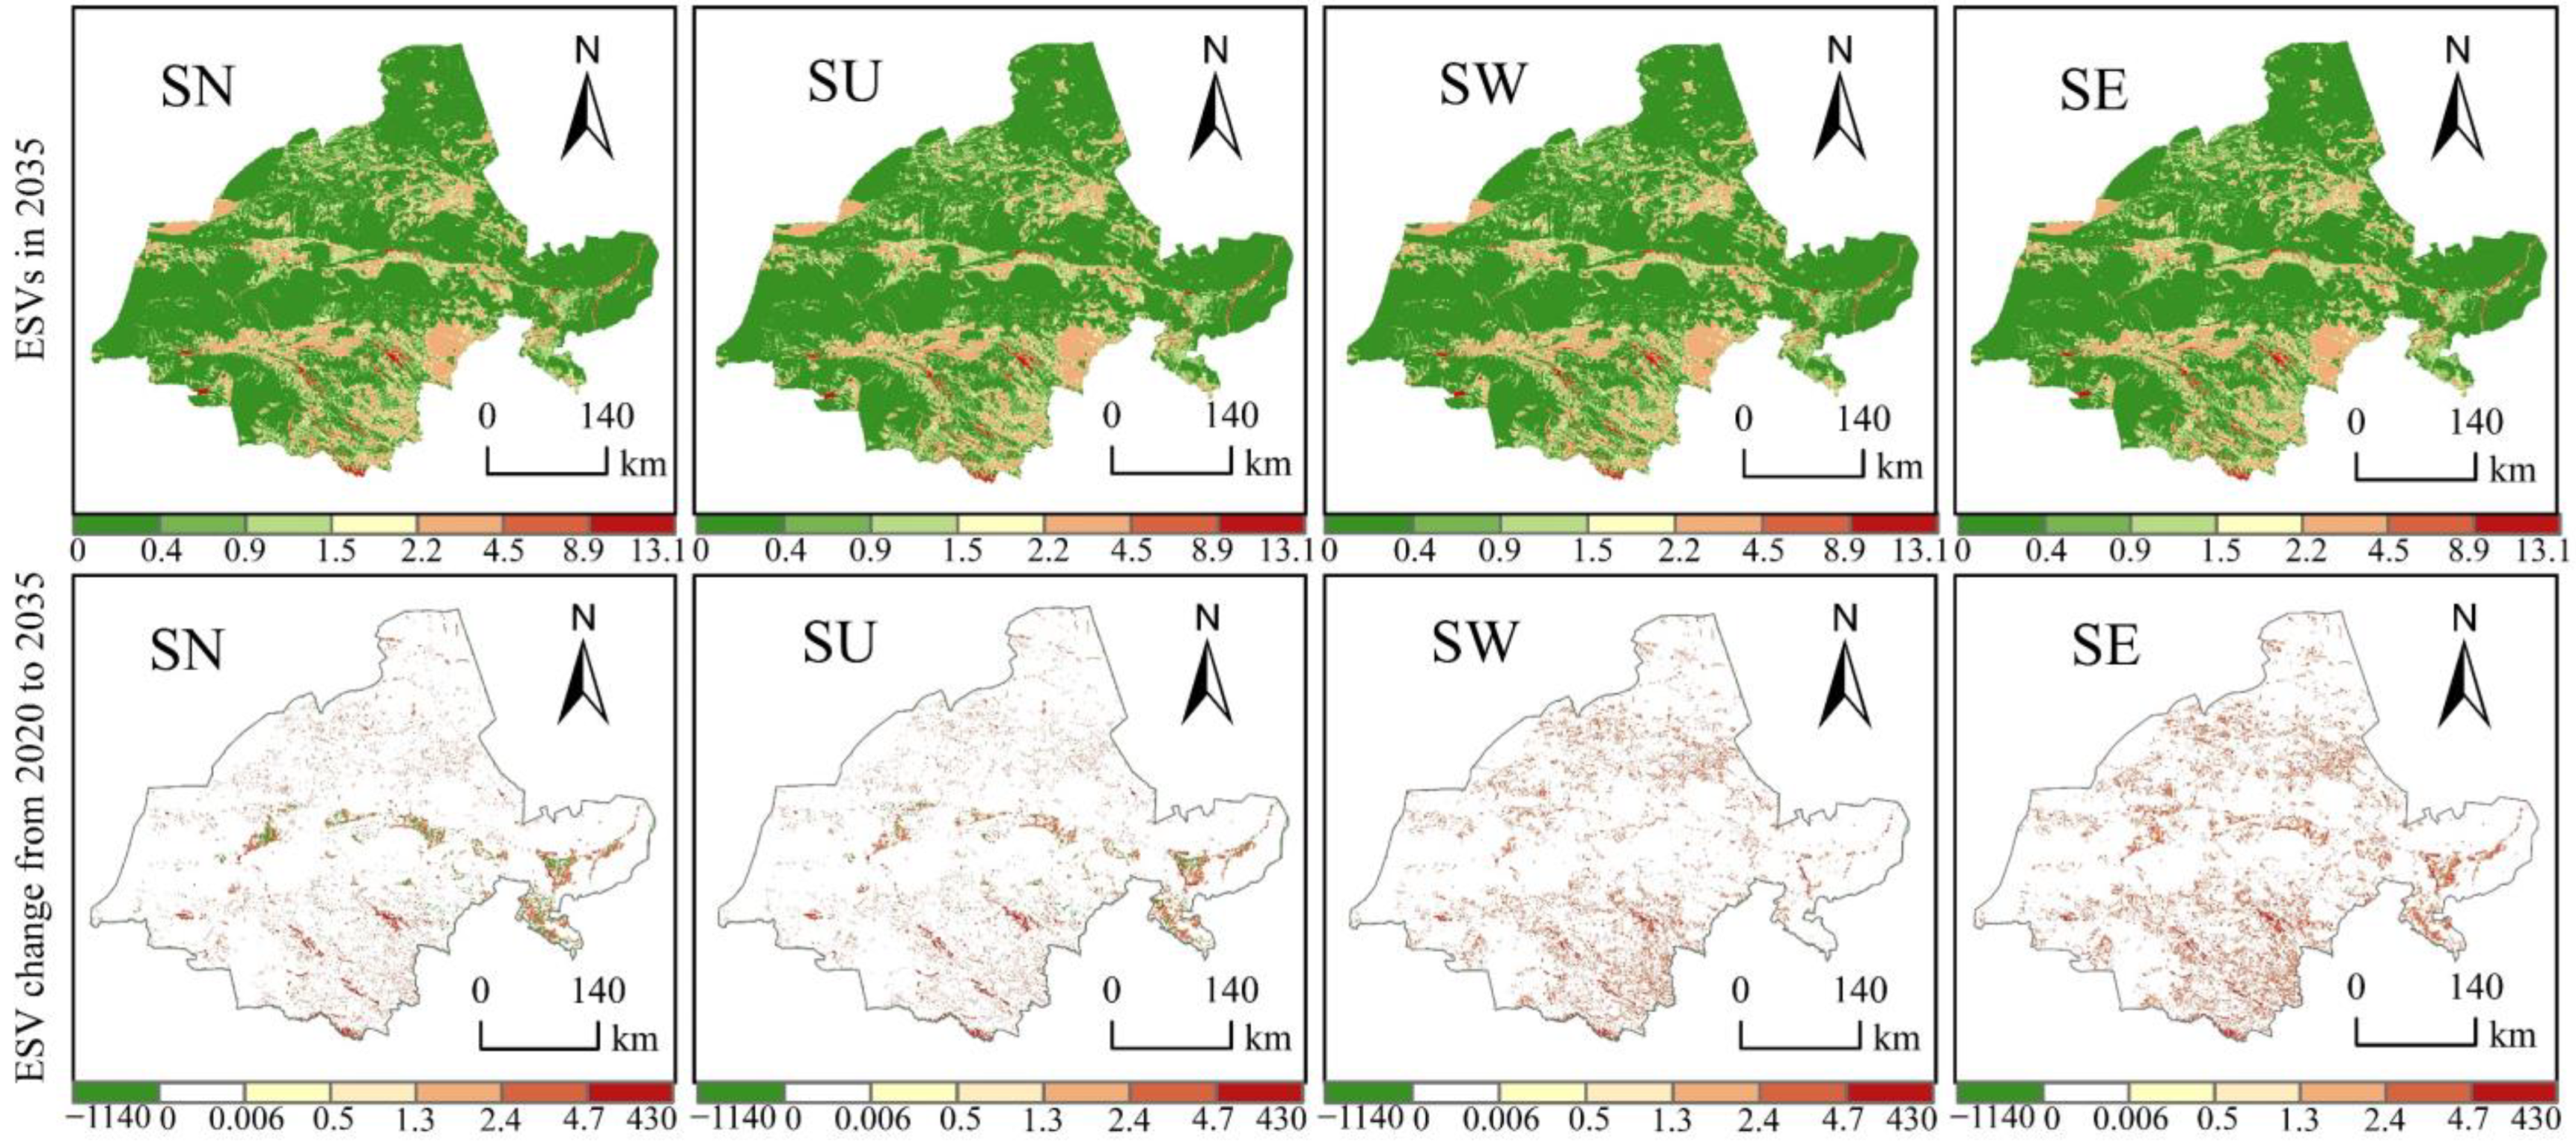
4.5. ESV Change Characteristics under Different Scenarios in Jiuquan City in 2035

In 2035, the ESV of SN, SU, SW and SE will increase (Figure 11), which are CNY 144.408 billion, CNY 144.424 billion, CNY 144.617 billion, and CNY 145.401 billion, respectively. SN’s ESV increase was the smallest, indicating that the traditional development model is no longer suitable for the future development trend of Jiuquan City, and the development strategy needs to be adjusted in time. From each individual point of view, ESV showed an increasing trend, with the largest increase in hydrological regulation ESV and the smallest increase in maintaining nutrient cycle. The individual ESVs in SN and SU were small, mainly because the area of forestland and grassland was significantly smaller than that of SW and SE. The gas regulation and climate regulation of SN is slightly higher than that of SU, because the area of construction land in SN is large, and the ESV of construction land is higher than that of unused land. The ESV of food production, feedstock production, soil conservation and maintenance nutrient cycling in SW was lower than in other scenarios, mainly because the cultivated land area in this scenario was the smallest. In SE, because the protection of cultivated land, grassland, forest land and water area is the largest, the ESV of each individual is significantly higher than that of other scenarios.
In terms of the spatial distribution pattern (Figure 12), the spatial distribution characteristics of ESVs are generally consistent across the four scenarios. However, there are some differences in the spatial variation of ESV across scenarios compared to 2020. In both the SN and SU scenarios, the central and eastern oasis areas of Jiuquan City have a significant expansion of built-up land and plowland within the production and living function areas, with a significant reduction in ESV. However, the shift from unused to other land types with higher ESV is also accompanied in this area, so there are also clear areas of increased ESV. In contrast, the area of built-up land expansion in the SW and SE scenarios is relatively small. There are no significant areas of decline in ESV in the central and eastern regions. Moreover, because of the greatest protection of grasslands, forestlands and waters in the SE scenario, the increase in ESV is more pronounced in the southern, central and northern regions than in the other scenarios.

5. Discussion

5.1. Insights into the Future Development of Jiuquan City Based on ESV Scenario Simulation

Changes in land use types affect ESV by changing the structure and function of ecosystems, and ESV can also reflect the land use status in the region to some extent [47]. The modeling results show an increasing trend in ESV in all four scenarios from 2020 to 2035, but the increase and spatial variation in ESV varies between scenarios. The SN scenario has the strongest land use changes in the production, living and ecological functional areas within the Dunhuang, Guazhou, Yumen, Jinta and Jiuquan oases, resulting in significant ESV changes in these areas [48]. The SN scenario has the most significant expansion of built-up land area due to the continuation of historical trends, with a strong encroachment on the productive and ecological functional areas of the oasis zone, resulting in a reduction in the ESV of the productive and ecological functional areas. In the SU scenario, as the state has paid more attention to the protection of ecological and agricultural space in recent years, it has been increasing the control of the three lines [49], and this scenario imposes restrictions on urban development boundaries. This has led to a more concentrated expression of the expansion of construction land within the living function area, which to a certain extent reduces the encroaching effect of construction land expansion on the productive and ecological function areas of the oasis zone. The southern region of Jiuquan City is an extremely important core ecological function area. It plays an absolute guarantee for climate regulation, water connotation and water supply in the region, and the ESV of this area is increased in both the SN and SU scenarios. The SW scenario limits the total amount of water used in Jiuquan in 2035 to ensure regional water security, resulting in a minimum increase in plowland and construction land. This greatly avoids the encroaching effect of production and living space on ecological space, resulting in a scenario in which none of the functional areas of the oasis zone show a significant decline in ESV. However, the increase in ESV from the development of unused land is also lost in this scenario, so there are no areas of significant increase in ESV in the oasis zone. In the SE scenario, the protection of ecological land is strong, resulting in a significant increase in the area of ecological land and a significant increase in ESV in the ecological function areas. The increase in ESV is most significant in the central oasis area, the southern important ecological function area and other areas in the SE scenario.
In summary, the ecological protection scenario from the perspective of increasing ESV is most suitable for the future development of Jiuquan. However, differentiated ecological regulation measures should also be adopted for different functional areas in order to improve the ESV of Jiuquan City on the basis of safeguarding the ecological security of the local area. The southern part of Jiuquan City is an important ecological function area, and efforts should be increased to protect the glaciers, forests, meadows and other ecological land in this area. Ecological construction projects such as water-containing forests and wetland protection to enhance the water-containing and soil conservation functions of the district should be carried out. In addition, land remediation should be carried out in historical mining and collapse areas, and ecological spatial enclosure control should be adopted. Ecological migration should be implemented to control development and construction in the area and reduce the disturbance of the ecological environment by human factors. In this way, the ESV of the important ecological function areas in the south of Jiuquan City is enhanced. The oasis areas in the central and eastern parts of Jiuquan City are the main gathering areas for human production and living space. However, due to the shortage of water resources in Jiuquan City, the contradiction between the production and living level of the district and the supply of water resources is outstanding, which seriously restricts the economic development of the district. Therefore, the Jiuquan Oasis Region should implement a water conservation priority development strategy in its future development based on improving ESV. Agricultural planting should vigorously develop the substrate pillow cultivation mode, actively promote drip irrigation, pipe irrigation, sprinkler irrigation and micro-irrigation and other water-saving projects, and constantly improve the construction of water-saving agricultural systems. At the same time, to strengthen the comprehensive management of groundwater mining, the implementation of no-mining areas, restricted areas and annual delineation, the establishment of groundwater levels and the total amount of water extraction dual control indicator system should also be carried out. We also actively carry out clean production audits in key industries, strictly control the discharge of wastewater to the standard of enterprises and improve the level of industrial wastewater treatment and reuse in industrial water use. To ensure regional water security and to avoid the potential risk of ecological degradation due to excessive water consumption, restrictions need to be placed on the area of plowland and construction land and expansion boundaries. It also strengthens the protection of ecological functional areas such as forestlands and grasslands as a means to further improve regional ESV and promote sustainable development in the region.

5.2. Driving Factor Analysis of ESV Spatial Differentiation

Single-factor detection results show that altitude (q = 0.442), temperature (q = 0.358), and precipitation (q = 0.349) among natural factors play a leading role in the spatial differentiation of ESV, which is consistent with previous research results [50,51]. The highest ESV value is concentrated in the southern part of Jiuquan City. The main reason is that the southern part of Jiuquan City is the Qilian Mountain glacier and water conservation ecological function area under national key protection. This area is fed by precipitation and glacier snow melt water for a long time, and the vegetation coverage is significantly higher than in other regions. The high ESV values in the central and northern regions are mostly concentrated in the oasis areas of the Shule River and Black River basins. The altitude of this area is low, the air temperature is high, the vegetation growth conditions are good, the land type is mainly grassland and farmland and the ESV is significantly higher than that of the surrounding areas. Population density (q = 0.26) and GDP density (q = 0.285) are second only to precipitation in their influence on the spatial distribution of ESV. Over 90% of Jiuquan’s population and over 95% of its social wealth is concentrated in the oasis areas of Dunhuang, Yumen, Guazhou and Jiuquan. In particular, the Suzhou district within the Jiuquan oasis carries 39.8% of the city’s population on 1.2% of its land area [38]. The high level of anthropogenic disturbance in these areas has led to the conversion of parts of the grassland to arable and built-up land with a much lower ESV, in marked contrast to the surrounding oasis areas. From the perspective of interaction factors, the interaction of natural factors such as altitude, temperature and precipitation with socio-economic factors such as population density and GDP density has significantly enhanced the explanatory power of each factor to the spatial differentiation of ESV (q > 0.46), indicating that the spatial differentiation of ESV in Jiuquan City is the result of the common role of natural geographical factors and socio-economic factors. Regional natural endowments create spatial differentiation of ESV, and the combination of socio-economic and physical geographical elements will accelerate the change in the local regional environment and ecosystem structure and function, thereby changing the spatial differentiation of ESV. Therefore, in the future, Jiuquan City should adopt a differentiated multi-regulation strategy according to the characteristics of the role of different driving factors in ecological protection and risk management practices. Land use development patterns that are compatible with the natural conditions and level of socio-economic development of the region, and avoid unreasonable human activities that act in concert with natural and socio-economic factors to exert greater pressure on regional ecosystems should be selected [44].

5.3. Innovation, Uncertainty and Prospect of This Study

According to the natural geographical characteristics of arid areas and relevant planning requirements, this paper constructs a new land use change scenario from the perspective of water resource constraints, that is, the water resource constraint scenario. Moreover, it also improves the SU scenario presented in the previous study and increases the guidance mechanism of spatial planning policy on land use change. In addition, this paper calculates the ESV of construction land according to the green-space coverage rate of the built-up area, which reduces the calculation error of the total amount of regional ESV to a certain extent.
However, there are some uncertainties in this paper. First, this paper ignores the impact of water efficiency improvement on future land use area in the SW. According to the water resource data of Jiuquan City, from 2006 to 2020, the area of construction land and cultivated land continued to increase, but the total amount of agricultural water use and the total comprehensive water use of construction land were decreasing, indicating that the water use efficiency will increase with the improvement of production technology. Therefore, when the total amount of water resources in 2035 is fixed, the area of plowland and construction land calculated by using the average water consumption of the past five years may be small. Secondly, this paper ignores the impact of water conservation on regional ESV. Water conservation will inevitably reduce the amount of surface and groundwater extraction in Jiuquan City, thereby improving the structure and function of the ecosystem, and the increase in ESV caused by this indirectness is difficult to measure [52]. Finally, this paper calculates the ESV of the construction land by using the green space coverage rate. Although the calculation error of the total amount of regional ESV is reduced to a certain extent, the ESV of the construction land itself and its impact on the natural and semi-natural ecosystems are also ignored, which may have a certain impact on the results. Therefore, the following improvements should be made in future research: (1) The issue of improving water efficiency and the relationship between water conservation and ESV in the SW need to be further explored to constantly improve the SW. (2) In the future, we will specifically analyze the ESV of construction land itself and its impact on different types of ecosystem services and further improve the methodology of ESV simulation and assessment.

6. Conclusions

In this paper, the PLUS model and ESV algorithm are used to quantitatively reveal the differences in ESV changes under different development scenarios in Jiuquan City in the future, and the driving factors of spatial differentiation of ESV in Jiuquan City are analyzed using the parameter-optimal geographic detector model. The main conclusions are as follows:
(1) Unused land and grassland are the main types of land, accounting for 95% of the area of Jiuquan City. From 1980 to 2020, the area of cultivated land, water area, and construction land showed a significant increase trend, while the area of other land use types decreased.
(2) From 1990 to 2020, ESV increased from CNY 139.394 billion to CNY 142.642 billion. From the perspective of land use type, grassland has the highest percentage of ESV, accounting for 62.49%. The ESV of cultivated land and water area increased, while the ESV of other land types decreased. From the perspective of ecosystem service types, the ESV of regulating services is the highest, accounting for 67.26%, and the ESV of the four services is increasing.
(3) From the factor analysis, the influence of physical geographical factors on the spatial differentiation of Jiuquan City ESV is greater than that of social and economic factors. Elevation, temperature, and precipitation are the main driving factors. The interaction of natural and human factors enhances the explanatory power of each factor to the spatial differentiation of ESV.
(4) Compared with 2020, ESV will increase in all four scenarios in 2035. The ESV increase in the SE scenario was the largest, and the ESV of each individual was significantly higher than that of other scenarios.

Author Contributions

J.S.: conceptualization, methodology, data curation, writing—original draft, validation, software. P.S. and Z.W.: writing—review and editing, funding acquisition, supervision. L.W.: writing—review and editing, supervision. Y.L.: validation, supervision. All authors have read and agreed to the published version of the manuscript.

Funding

This research was supported by the National Natural Science Foundation of China (Grant Number: 41771130).

Data Availability Statement

Not available.

Conflicts of Interest

The authors declare no conflict of interest.

References

  1. Costanza, R.; D’Arge, R.; de Groot, R.D.; Farber, S.; Grasso, M.; Hannon, B.; Limburg, K.; Naeem, S.; Neill, R.; Paruelo, J.; et al. The value of the world’s ecosystem services and natural capital. Nature 1997, 387, 253–260. [Google Scholar] [CrossRef]
  2. Hunsaker, C.T.; Graham, R.L.; Suter, G.W.; O’Neill, R.V.; Barnthouse, L.W.; Gardner, R.H. Assessing ecological risk on a regional scale. Environ. Manag. 1990, 14, 325–332. [Google Scholar] [CrossRef]
  3. Wang, Y.; Li, X.; Zhang, Q.; Li, J.; Zhou, X. Projections of future land use changes: Multiple scenarios -based impacts analysis on ecosystem services for Wuhan city, China. Ecol. Indic. 2018, 94, 430–445. [Google Scholar] [CrossRef]
  4. Peng, K.; Jiang, W.G.; Ling, Z.Y.; Hou, P.; Deng, Y.W. Evaluating the potential impacts of land use changes on ecosystem service value under multiple scenarios in support of SDG reporting: A case study of the Wuhan urban agglomeration. J. Clean. Prod. 2021, 307, 127321. [Google Scholar] [CrossRef]
  5. Lawler, J.J.; Lewis, D.J.; Nelson, E.; Plantinga, A.J.; Polasky, S.; Withey, J.C.; Helmers, D.P.; Martinuzzi, S.; Pennington, D.; Radeloff, V.C. Projected land-use change impacts on ecosystem services in the United States. Proc. Natl. Acad. Sci. USA 2014, 111, 7492–7497. [Google Scholar] [CrossRef] [PubMed]
  6. Fu, B.J.; Zhang, L.W. Land-use change and ecosystem services: Concepts, methods and progress. Prog. Geogr. 2014, 33, 441–446. [Google Scholar]
  7. Himes, C.A.; Pendleton, L.; Atiyah, P. Valuing ecosystem services from blue forests: A systematic review of the valuation of salt marshes, sea grass beds and mangrove forests. Ecosyst. Serv. 2018, 30 Pt A, 36–48. [Google Scholar] [CrossRef]
  8. Huang, L.; Cao, W.; Xu, X.L.; Fan, J.W.; Wang, J.B. Linking the benefits of ecosystem services to sustainable spatial planning of ecological conservation strategies. J. Environ. Manag. 2018, 222, 385–395. [Google Scholar] [CrossRef]
  9. Mugiraneza, T.; Ban, Y.F.; Haas, J. Urban land cover dynamics and their impact on ecosystem services in Kigali, Rwanda using multi-temporal Landsat data. Remote Sens. 2018, 13, 234–246. [Google Scholar] [CrossRef]
  10. Gao, X.; Wang, J.; Li, C.X.; Song, Z.Y.; Nie, C.J.; Zhang, X.R. Land use change simulation and spatial analysis of ecosystem service value in Shijiazhuang under multi-scenarios. Environ. Sci. Pollut. Res. 2021, 28, 31043–31058. [Google Scholar] [CrossRef]
  11. Zhang, J.; Li, X.C.; Zhang, C.C.; Yu, L.; Wang, J.Z.; Wu, X.Y. Assessing spatiotemporal variations and predicting changes in ecosystem service values in the Guangdong–Hong Kong–Macao Greater Bay Area. GISci. Remote Sens. 2021, 59, 184–199. [Google Scholar] [CrossRef]
  12. De, G.R.; Brander, L.; Van der Ploeg, S.; Costanza, R.; Bernard, F.; Braat, L.; Christie, M.; Crossman, N.; Ghermandi, A.; Hein, L.; et al. Global estimates of the value of ecosystems and their services in monetary units. Ecosyst. Serv. 2012, 1, 50–61. [Google Scholar] [CrossRef]
  13. Xie, G.D.; Zhen, L.; Lu, C.X.; Xiao, Y.; Chen, C. Expert Know ledge Based Valuation Method of Ecosystem Services in China. J. Nat. Resour. 2008, 13, 1315–1318. [Google Scholar]
  14. Xie, G.D.; Zhang, C.X.; Zhang, L.M.; Chen, W.H.; Li, S.M. Improvement of the Evaluation Method for Ecosystem Service Value Based on Per Unit Area. J. Nat. Resour. 2015, 30, 1243–1254. [Google Scholar]
  15. Ling, H.; Yan, J.; Xu, H.; Guo, B.; Zhang, Q. Estimates of shifts in ecosystem service values due to changes in key factors in the Manas River basin, northwest China. Sci. Total Environ. 2019, 659, 177–187. [Google Scholar] [CrossRef]
  16. Chen, T.; Feng, Z.; Zhao, H.; Wu, K. Identification of ecosystem service bundles and driving factors in Beijing and its surrounding areas. Sci. Total Environ. 2020, 711, 134687. [Google Scholar] [CrossRef]
  17. Goldstein, J.H.; Caldarone, G.; Duarte, T.K.; Ennaanay, D.; Hannahs, N.; Mendoza, G.; Polasky, S.; Wolny, S.; Daily, G.C. Integrating ecosystem-service tradeoffs into land-use decisions. Proc. Natl. Acad. Sci. USA 2012, 109, 7565–7570. [Google Scholar] [CrossRef]
  18. Liu, J.M.; Xiao, B.; Jiao, J.Z.; Li, Y.S.; Wang, X.Y. Modeling the response of ecological service value to land use change through deep learning simulation in Lanzhou, China. Sci. Total Environ. 2021, 796, 148981. [Google Scholar] [CrossRef] [PubMed]
  19. Gao, X.; Yang, L.W.Q.; Li, C.X.; Song, Z.Y.; Wang, J. Land use change and ecosystem service value measurement in Baiyangdian Basin under the simulated multiple scenarios. Acta Ecol. Sin. 2021, 41, 7974–7988. [Google Scholar] [CrossRef]
  20. Hu, S.; Chen, L.Q.; Li, L.; Yuan, L.N.; Cheng, L.; Wang, J.; Wen, M.X. Simulation of Land Use Change and Ecosystem Service Value Dynamics under Ecological Constraints in Anhui Province, China. Int. J. Environ. Res. Public Health 2020, 17, 4228. [Google Scholar] [CrossRef] [PubMed]
  21. Zhao, Q.Q.; Li, J.; Cuan, Y.D.; Zhang, Z.X. The Evolution Response of Ecosystem Cultural Services under Different Scenarios Based on System Dynamics. Remote Sens. 2020, 12, 418. [Google Scholar] [CrossRef]
  22. Vilet, J.V.; Hurkens, J.; White, R.; Delden, H.V. An activitybased cellular automaton model to simulate land-use dynamics. Environ. Plan. B Urban Anal. City Sci. 2012, 39, 198–212. [Google Scholar] [CrossRef]
  23. Mansour, S.; Al-Belushi, M.; Al-Awadhi, T. Monitoring land use and land cover changes in the mountainous cities of Oman using GIS and CA-Markov modelling techniques. Land Use Policy 2020, 91, 104414. [Google Scholar] [CrossRef]
  24. Ji, Z.; Wei, H.; Xue, D.; Liu, M.; Cai, E.; Chen, W.; Feng, X.; Li, J.; Lu, J.; Guo, Y. Trade-Off and Projecting Effects of Land Use Change on Ecosystem Services under Different Policies Scenarios: A Case Study in Central China. Int. J. Environ. Res. Public Health 2021, 18, 3552. [Google Scholar] [CrossRef] [PubMed]
  25. Gounaridis, D.; Chorianopoulos, I.; Symeonakis, E.; Koukoulas, S. A Random Forest-Cellular Automata modelling approach to explore future land use/cover change in Attica (Greece), under different socio-economic realities and scales. Sci. Total Environ. 2019, 646, 320–335. [Google Scholar] [CrossRef]
  26. Liang, X.; Liu, X.; Li, D.; Zhao, H.; Chen, G.Z. Urban growth simulation by incorporating planning policies into a CA-based future land-use simulation model. Int. J. Geogr. Inf. Sci. 2018, 32, 2294–2316. [Google Scholar] [CrossRef]
  27. Liang, X.; Guan, Q.F.; Clarke, K.C.; Liu, S.S.; Wang, B.Y.; Yao, Y. Understanding the drivers of sustainable land expansion using a patch-generating land use simulation (PLUS) model: A case study in Wuhan, China. Comput. Environ. Urban Syst. 2020, 85, 101569. [Google Scholar] [CrossRef]
  28. Xie, L.; Wang, H.W.; Liu, S.L. The ecosystem service values simulation and driving force analysis based on land use/land cover: A case study in inland rivers in arid areas of the Aksu River Basin, China. Ecol. Indic. 2022, 138, 108828. [Google Scholar] [CrossRef]
  29. Gibbs, J.P. Wetland loss and biodiversity conservation. Conserv. Biol. 2000, 14, 314–317. [Google Scholar] [CrossRef]
  30. Estoque, R.C.; Murayama, Y.J. Examining the potential impact of land use/cover changes on the ecosystem services of Baguio city, the Philippines: A scenario-based analysis. Appl. Geogr. 2012, 35, 316–326. [Google Scholar] [CrossRef]
  31. Kubiszewski, I.; Costanza, R.; Anderson, S.; Sutton, P. The future value of ecosystem services: Global scenarios and national implications. Ecosyst. Serv. 2017, 26, 289–301. [Google Scholar] [CrossRef]
  32. Nelson, E.; Sander, H.; Hawthorne, P.; Marc, C.; Driss, E.; Stacie, W.; Manson, S.; Polasky, S. Projecting global land-use change and its effect on ecosystem service provision and biodiversity with simple models. PLoS ONE 2010, 5, 14327. [Google Scholar] [CrossRef] [PubMed]
  33. Egoh, B.N.; Reyers, B.; Rouget, M.; Richardson, D.M. Identifying priority areas for ecosystem service management in South African grasslands. J. Environ. Manag. 2011, 92, 1642–1650. [Google Scholar] [CrossRef] [PubMed]
  34. Tan, Z.; Guan, Q.; Lin, J.; Yang, L.; Luo, H.; Ma, Y.; Tian, J.; Wang, Q.; Wang, N. The response and simulation of ecosystem services value to land use/land cover in an oasis, Northwest China. Ecol. Indic. 2020, 118, 106711. [Google Scholar] [CrossRef]
  35. Liu, L.B.; Li, S.P. Evaluation on Land Ecological Security in Desertification Areas of Northwest China—A Case Study of Jiuquan City. Res. Soil Water Conserv. 2014, 21, 190–194. [Google Scholar] [CrossRef]
  36. Feng, X.M.; Fu, B.J.; Piao, S.L.; Wang, S.; Ciais, P.; Zeng, Z.Z.; Lü, Y.H.; Zeng, Y.; Li, Y.; Jiang, X.H.; et al. Revegetation in China’s Loess Plateau is approaching sustainable water resource limits. Nat. Clim. Chang. 2016, 6, 1019. [Google Scholar] [CrossRef]
  37. Ma, Z.W.; Wang, X.Y.; Wang, X.J.; Ding, Q.P.; Qu, H. Present situation and dynamic analysis of land desertification in Jiuquan City, Gansu Province. Chin. J. Agric. Resour. Reg. Plan. 2018, 39, 141–147. [Google Scholar]
  38. Wang, Z.Y.; Shi, P.J.; Zhang, X.B.; Tong, H.L.; Zhang, W.P.; Liu, Y. Research on Landscape Pattern Construction and Ecological Restoration of Jiuquan City Based on Ecological Security Evaluation. Sustainability 2021, 13, 5732. [Google Scholar] [CrossRef]
  39. Cao, C.; Chen, Y.N. Development of green finance in ecologically fragile areas. China Financ. 2017, 20, 92–93. [Google Scholar]
  40. Wang, J.F.; Xu, C.D. Geodetector: Principle and prospective. Acta Geogr. Sin. 2017, 72, 116–134. [Google Scholar]
  41. Song, Y.Z.; Wang, J.F.; Ge, Y.; Xu, C.D. An optimal parameters-based geographical detector model enhances geographic characteristics of explanatory variables for spatial heterogeneity analysis: Cases with different types of spatial data. GISci. Remote Sens. 2020, 57, 593–610. [Google Scholar] [CrossRef]
  42. Chen, Y.; Li, X.; Liu, X.; Ai, B. Modeling urban land-use dynamics in a fastdeveloping city using the modified logistic cellular automaton with a patch-based simulation strategy. Int. J. Geogr. Inf. Sci. 2014, 28, 234–255. [Google Scholar] [CrossRef]
  43. Ming, Q.L.; Shi, L.L.; Fang, F.W. Cost-benefit analysis of ecological restoration based on land use scenario simulation and ecosystem service on the Qinghai-Tibet Plateau. Glob. Ecol. Conserv. 2022, 34, e02006. [Google Scholar] [CrossRef]
  44. Zhang, H.; Liao, X.L.; Zhai, T.L. Evaluation of ecosystem service based on scenario simulation of land use in Yunnan Province. Phys. Chem. Earth 2018, 104, 58–65. [Google Scholar] [CrossRef]
  45. Mitsova, D.; Shuster, W.; Wang, X. A cellular automata model of land cover change to integrate urban growth with open space conservation. Landsc. Urban Plan. 2011, 99, 141–153. [Google Scholar] [CrossRef]
  46. Zhao, Q.J.; Wen, Z.M.; Chen, S.L.; Ding, S.L. Quantifying Land Use/Land Cover and Landscape Pattern Changes and Impacts on Ecosystem Services. Int. J. Environ. Res. Public Health 2020, 17, 126. [Google Scholar] [CrossRef] [PubMed]
  47. Turner, K.G.; Odgaard, M.V.; BoCher, P.K.; Dalgaard, T.; Svenning, J. Bundling ecosystem services in Denmark: Trade-offs and synergies in a cultural landscape. Landsc. Urban Plan. 2014, 125, 89–104. [Google Scholar] [CrossRef]
  48. Peng, H.; Cheng, G.; Xu, Z.; Yin, Y.; Xu, W. Social, economic, and ecological impacts of the “Grain for Green” project in China: A preliminary case in Zhangye, Northwest China. J. Environ. Manag. 2007, 85, 2774–2784. [Google Scholar] [CrossRef] [PubMed]
  49. Fu, J.Y.; Hao, Q.; Jiang, D.; Lin, G. Optimal regulation of spatial planning in the context of black soil preservation and food security in Qiqihar. Acta Geogr. Sin. 2022, 77, 1662–1680. [Google Scholar]
  50. Cui, F.; Wang, B.; Zhang, Q.; Tang, H.; De Maeyer, P.; Hamdi, R.; Dai, L. Climate change versus land-use change—What affects the ecosystem services more in the forest-steppe ecotone? Total Environ. 2020, 759, 143525. [Google Scholar] [CrossRef]
  51. Weiskopf, S.R.; Rubenstein, M.A.; Crozier, L.G.; Gaichas, S.; Griffis, R.; Halofsky, J.E. Climate change effects on biodiversity, ecosystems, ecosystem services, and natural resource management in the United States. Sci. Total Environ. 2020, 733, 137782. [Google Scholar] [CrossRef] [PubMed]
  52. Wang, Y.C.; Zhao, J.; Fu, J.W.; Wei, W. Effects of the Grain for Green Program on the water ecosystem services in an arid area of China—Using the Shiyang River Basin as an example. Ecol. Indic. 2019, 104, 659–668. [Google Scholar] [CrossRef]
Figure 1. Overview of the study area.
Land 12 00937 g001
Figure 2. Distribution of land use types in Jiuquan City from 1980 to 2020.
Land 12 00937 g002
Figure 3. PLUS model framework.
Land 12 00937 g003
Figure 4. Factors affecting land use change.
Land 12 00937 g004
Figure 5. Comparison between land use simulation results and actual data in 2020.
Land 12 00937 g005
Figure 6. Restricted conversion area of Jiuquan City.
Land 12 00937 g006
Figure 7. Spatial distribution (106 CNY/km2) and change (104 CNY/km2) in ESV in Jiuquan City from 1980 to 2020.
Land 12 00937 g007
Figure 8. Optimal discretization of continuous factors.
Land 12 00937 g008
Figure 9. Factor detection results and interactive detection results of spatial distribution characteristics of ESV.
Land 12 00937 g009
Figure 10. Distribution of land use types under different scenarios in 2035.
Land 12 00937 g010
Figure 11. Difference between different scenarios in 2035 and individual ESVs in 2020.
Land 12 00937 g011
Figure 12. Spatial distribution (106 CNY/km2) and spatial change (104 CNY/km2) of ESV under different scenarios in 2035.
Land 12 00937 g012
Table 1. ESV coefficient of unit area in Jiuquan City (CNY·hm−2·a−1).
TypePlowlandForestlandGrasslandWater AreaConstruction LandUnused Land
Provisioning servicesFood production (FP)2193.85651.70602.231127.04195.6112.91
Raw materials production (RMP)1032.401496.98886.14628.04371.7738.72
Water resources supply (WRS)51.62774.30490.3911,218.75197.2925.81
Regulating servicesGas regulation (GR)1729.274923.263114.412451.951253.88167.77
Climate regulation (CR)929.1614,731.068233.395531.943582.45129.05
Environment purification (EP)258.104316.722718.658009.701097.52529.11
Hydrology regulation (HR)696.879640.046030.94114,940.532444.67309.72
Supporting servicesSoil maintenance (SM)2658.435994.373794.072787.481527.00193.58
Maintaining nutrient circulation (MNC)309.72458.13292.51215.08117.1012.91
Biological diversity (BD)335.535458.823449.948973.281389.77180.67
Cultural servicesAesthetic landscape (AL)154.862393.881522.795772.84611.0077.43
Total10,349.8150,839.2431,135.46161,656.6312,788.051677.65
Table 2. Land use area and proportion of Jiuquan City from 1980 to 2020 (km2).
Land Use Type1980%1990%2000%2010%2020%
Plowland2615.591.562580.491.542594.171.553265.091.953480.352.08
Forestland719.620.43729.080.43729.790.44717.140.43716.510.43
Grassland27,977.9116.6927,721.3316.5327,719.1716.5327,806.7116.5927,670.2716.51
Water area1421.070.851424.610.851431.900.851522.670.911618.980.97
Construction land279.220.17279.220.17285.090.17283.710.17508.440.30
Unused land134,641.1280.31134,919.8180.48134,886.2380.46134,049.6079.96133,653.4179.72
Table 3. Land use transfer matrix of Jiuquan City from 1980 to 2020 (km2).
Year1980Total%
PlowlandForestlandGrasslandWater AreaConstruction LandUnused Land
2020Plowland2462.654.4131.7311.7528.1076.852615.481.56
Forestland28.92602.5119.845.841.4261.04719.570.43
Grassland281.2672.0926,433.6328.3026.491134.1427,975.9116.69
Water area16.660.8418.271311.702.1169.801419.380.85
Construction land50.710.872.563.04219.562.49279.220.17
Unused land640.0035.791162.27257.94230.76132,301.17134,627.9280.31
Total3480.19716.5027,668.301618.57508.44133,645.49167,637.48
Percentage change+0.520−0.18+0.12+0.13−0.59
(Behavior transfer out. Listed as transfer in.).
Table 4. Changes in ESV in Jiuquan City from 1980 to 2020.
Land Use TypeEcosystem Service Value (×108 CNY)Rate of Change (%)Average Contribution (%)
19801990200020102020Variation Value
Plowland27.0726.7126.8533.7936.028.9533.061.94
Forestland36.5937.0737.1036.4636.43−0.16−0.432.62
Grassland871.11863.12863.05865.77861.53−9.58−1.1062.49
Water area229.73230.30231.48246.15261.7231.9913.9316.48
Construction land3.573.573.653.636.502.9382.090.26
Unused land225.88226.35226.29224.89224.22−1.66−0.7316.20
Total1393.941387.111388.411410.691426.4232.482.33100.00
Table 5. ESV changes of different ecosystem service types in Jiuquan City from 1980 to2020.
Ecosystem ServicesEcosystem Service Value (×108 CNY)Rate of Change (%)Average Contribution (%)
19801990200020102020Variation Value
Provisioning servicesFood production (FP)26.4526.2326.2727.8828.421.977.431.93
Raw material production (RMP)34.7834.5434.5635.3435.570.792.262.49
Water resource supply (WRS)33.8933.8133.8934.9636.022.136.292.46
Regulating servicesGas regulation (GR)121.62120.87120.91122.36122.751.130.938.68
Climate regulation (CR)269.62267.67267.73269.28269.630.010.0019.17
Environment purification (EP)162.77162.28162.33162.97163.460.690.4211.62
Hydrology regulation (HR)383.22382.23383.07394.12404.9321.725.6727.79
Supporting servicesSoil maintenance (SM)147.87146.92146.98149.11149.691.821.2310.57
Maintaining nutrient circulation (MNC)11.4011.3211.3311.5611.630.232.040.83
Biological diversity (BD)138.79138.03138.10139.22139.921.130.819.91
Cultural servicesAesthetic landscape (AL)63.5363.2063.2463.9164.400.861.364.55
Total1393.941387.111388.411410.691426.4232.482.33100
Disclaimer/Publisher’s Note: The statements, opinions and data contained in all publications are solely those of the individual author(s) and contributor(s) and not of MDPI and/or the editor(s). MDPI and/or the editor(s) disclaim responsibility for any injury to people or property resulting from any ideas, methods, instructions or products referred to in the content.

