1. Introduction
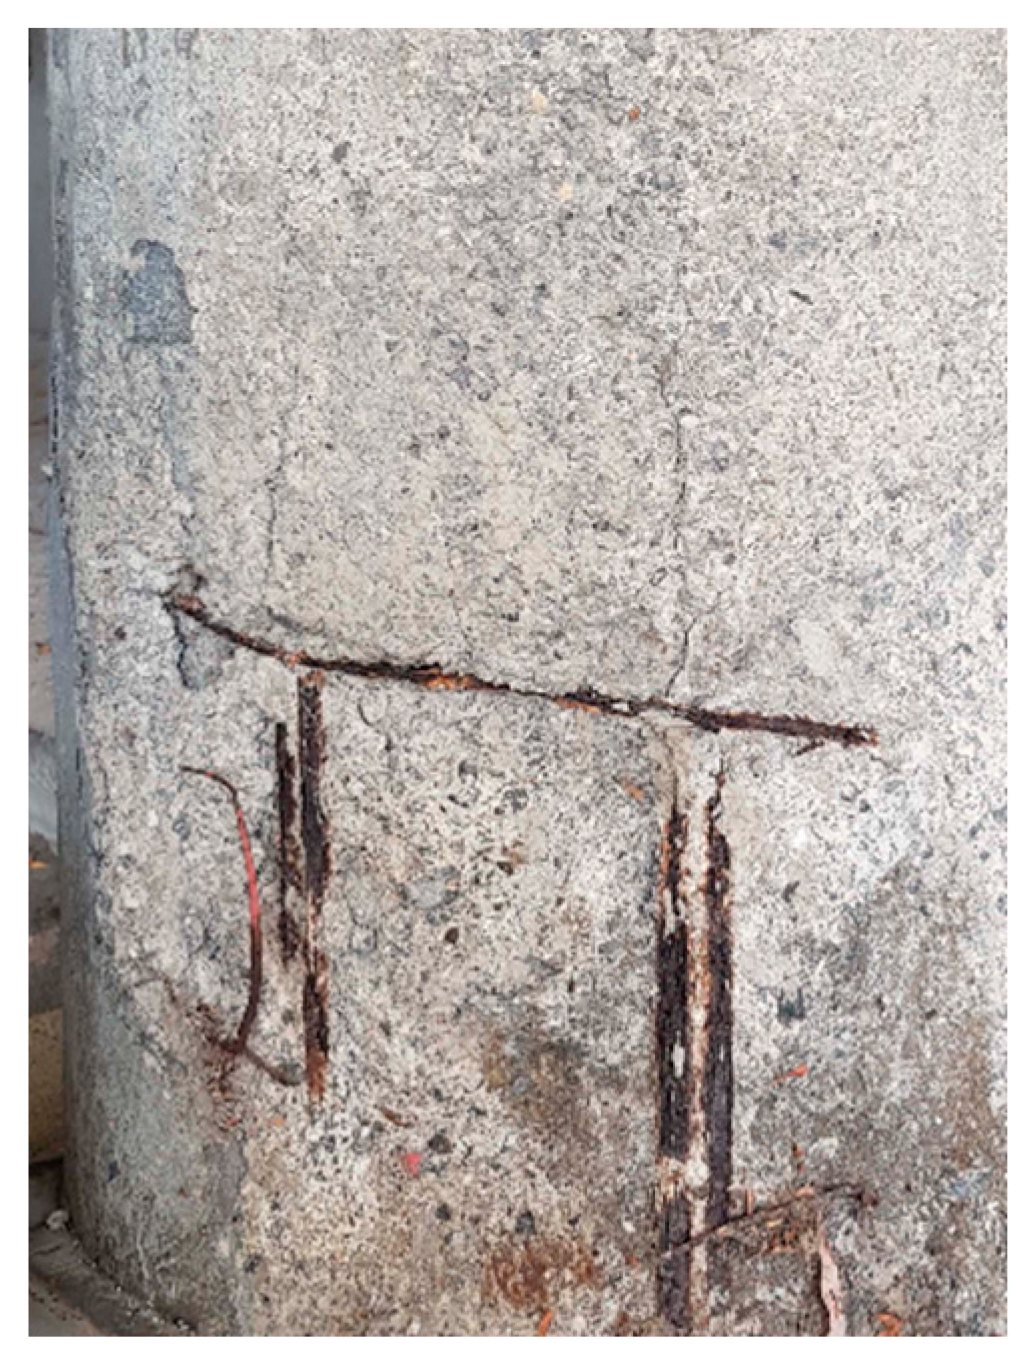
Wear, fracture, and corrosion are considered to be huge problems in engineering structures, which cause not only enormous economy loss, but also great injuries provoked by the failure of structures and materials. The most striking examples concern the sudden and unexpected falling of concrete-made civil structures like houses or bridges, in which the reinforcing metallic inner structure turn out to be covered with concrete. Thus, this covering of the reinforcing metal makes it impossible to see the true working conditions (see
Figure 1).
In order to prevent that kind of disaster, nowadays structural health monitoring (SHM) studies are performed, which refers to the process of implementing a damage identification strategy for engineering structures [
1]. This means to observe a structure or mechanical system over time by taking periodic measurements in order to determine the actual state of the system’s health and compare it with the initial undamaged state. Damage caused in the structures could be of different kinds, such as changes related to the materials (for example, in corrosion processes) and/or geometric properties of the system, and defects or flaws. The term damage does not necessarily imply the loss of the structure’s functionality; however, the system would not be operating in its optimal way and it could provoke system failures. Nevertheless, if any damage accumulates over long periods of time it can cause fatigue and end with the total damage of the structure.
In order to monitor possible damages inside the structure, amorphous ferromagnetic ribbons (or metallic glasses) are a suitable alternative to develop effective sensors for SHM applications. Metallic glasses fabricated in the form of ribbons can be introduced easily inside the engineering structure during the fabrication process. Due to their magnetic and magnetomechanical properties, these alloys will reflect any change in the structure of the hosting material through a change in the affected magnetic and/or magnetomechanical properties, therefore allowing monitoring and study of the structural system [
2,
3]. These materials are actually a promising alternative for the current SHM as they present several advantages besides their excellent magnetomechanical properties, for example high corrosion resistance, fabrication low cost, and quick remote detection possibility [
4,
5]. Such metallic glasses have already been used as sensors and actuators for different applications, showing the wide range of possible sensing parameters [
6,
7,
8].
The detection operational principle is based on the magnetic and magnetoelastic properties of those materials in which the elastic and magnetic behaviors are coupled, and it can be developed by following two different routes [
9]: (a) By using the magnetic susceptibility
of the material as sensing parameter to any applied external stress
. That dependence can be expressed by Equation (1):
where
and
are the spontaneous magnetization and saturation magnetostriction of the alloy. Due to their fabrication process, metallic glasses possess null or very low magneto-crystalline anisotropy
, and good values of
and
, which directly leads to their high stress sensitivity. The second detection route (b) consists of detecting the changes of the properties of an acoustic wave travelling through the magnetoelastic material. In particular, and for metallic glasses of appropriate form and size, the parameter that is extremely sensitive to different external perturbations is the frequency of the first magnetoelastic resonance mode of the ribbon:
where now
,
and
are the ribbon length, Young modulus and density, respectively.
In other words, if the hosting structure (concrete, wood, plastic, etc.) suffers any fracture, wear, or corrosion process, it will cause stress, strain, or a change in the external conditions of the magnetoelastic ribbon embedded in the structure. Due to the magnetoelastic coupling, the metallic glass will react by changing its magnetization state, triggering a magnetic signal that will be detected remotely by a set of coils and through Faraday’s electromagnetic induction law, transduced in an electrical signal.
Different compositions of amorphous ferromagnetic magnetoelastic materials have been fabricated and employed to sense and detect different kind of parameters. The composition of the alloys can be modulated in order to look for some specific applications or characteristics of the resonant sensing platform. To fabricate such ribbons in the amorphous phase, which is a metastable state, the composition must be
of metallic elements
and include a
of metalloids (
which favors the formation of the amorphous phase) [
10,
11]. It has been observed that
-rich amorphous alloys show high strength and hardness, presenting also good magnetic and magnetoelastic properties, low material costs and a superior corrosion resistance, being thus of critical importance for the desired application of the ribbons.
Our previous experience working with metallic glasses exhibiting good corrosion properties, like the Metglas 2826MB3 alloy from VACUUMSCHMELZE GmbH & Co. (Hanau, Germany), told us that even when working within soft saline solutions, clear trends of sample oxidation appeared. Bearing this in mind, in this work we present an extensive magnetic, magnetoelastic, and corrosion resistance study of the family of amorphous ribbons with the nominal composition
, where the
ratio was varied from the only Fe-containing sample to the just Ni-containing one.
and
will be the main elements responsible for the magnetic and magnetoelastic behavior of the ribbons. Nevertheless, not only
, but also the presence of other elements in their composition will determine the corrosion resistance of the samples [
12,
13,
14]. It has been already reported by several authors that the addition of certain elements, such as
[
15,
16] or
[
17] substantially increases the corrosion resistance of the metallic alloys. In fact, in one of our previous works we observed how the addition of
improves the corrosion resistance of these type of magnetoelastic alloys [
18]. Bearing this in mind,
of
was included in our sample’s composition. The ultimate goal of the present study is to improve the corrosion resistance of our magnetoelastic ribbons, while maintaining reasonably good magnetic and magnetoelastic properties. This will allow them to be implemented as sensing materials in SHM devices to monitor structural problems of engineering structures. Nevertheless, we have to remark also that other aspects, like the pH of the hosting material (for example concrete has an alkaline pH value) or environment that can alter the corrosion behavior of the metallic glass sensing material, have to be taken into account prior to any implementation in those control devices.
2. Materials and Methods
The metallic glasses studied in this work were fabricated at VACUUMSCHMELZE GmbH & Co. KG, Hanau, Germany, in the form of long ribbons using the melt spinning technique, in order to achieve the amorphous state. From the same family,, seven different compositions were prepared, maintaining a small amount of chromium constant and varying the ratio (in all cases, ). All the ribbons present a thickness of and were cut with a width of using a picosecond pulsed laser ablation technology (3D Micromac, microStruct, (Chemnitz, Germany)).
All compositions were fully magnetic and magnetoelastically characterized. Room temperature hysteresis loops were measured by a classical induction method, obtaining therefore the coercive field and saturation magnetization of each strip. The magnetic microstructure of the samples was investigated by using an Evico–Zeiss magneto-optic Kerr effect [
19] microscope instrument. The observed changes on the rotation and/or the ellipticity of a linearly polarized beam of light upon reflection from a magnetic surface will depend on the magnetization state of the sample issue of study, therefore allowing for a direct inspection of its magnetic microstructure or magnetic domains [
20].
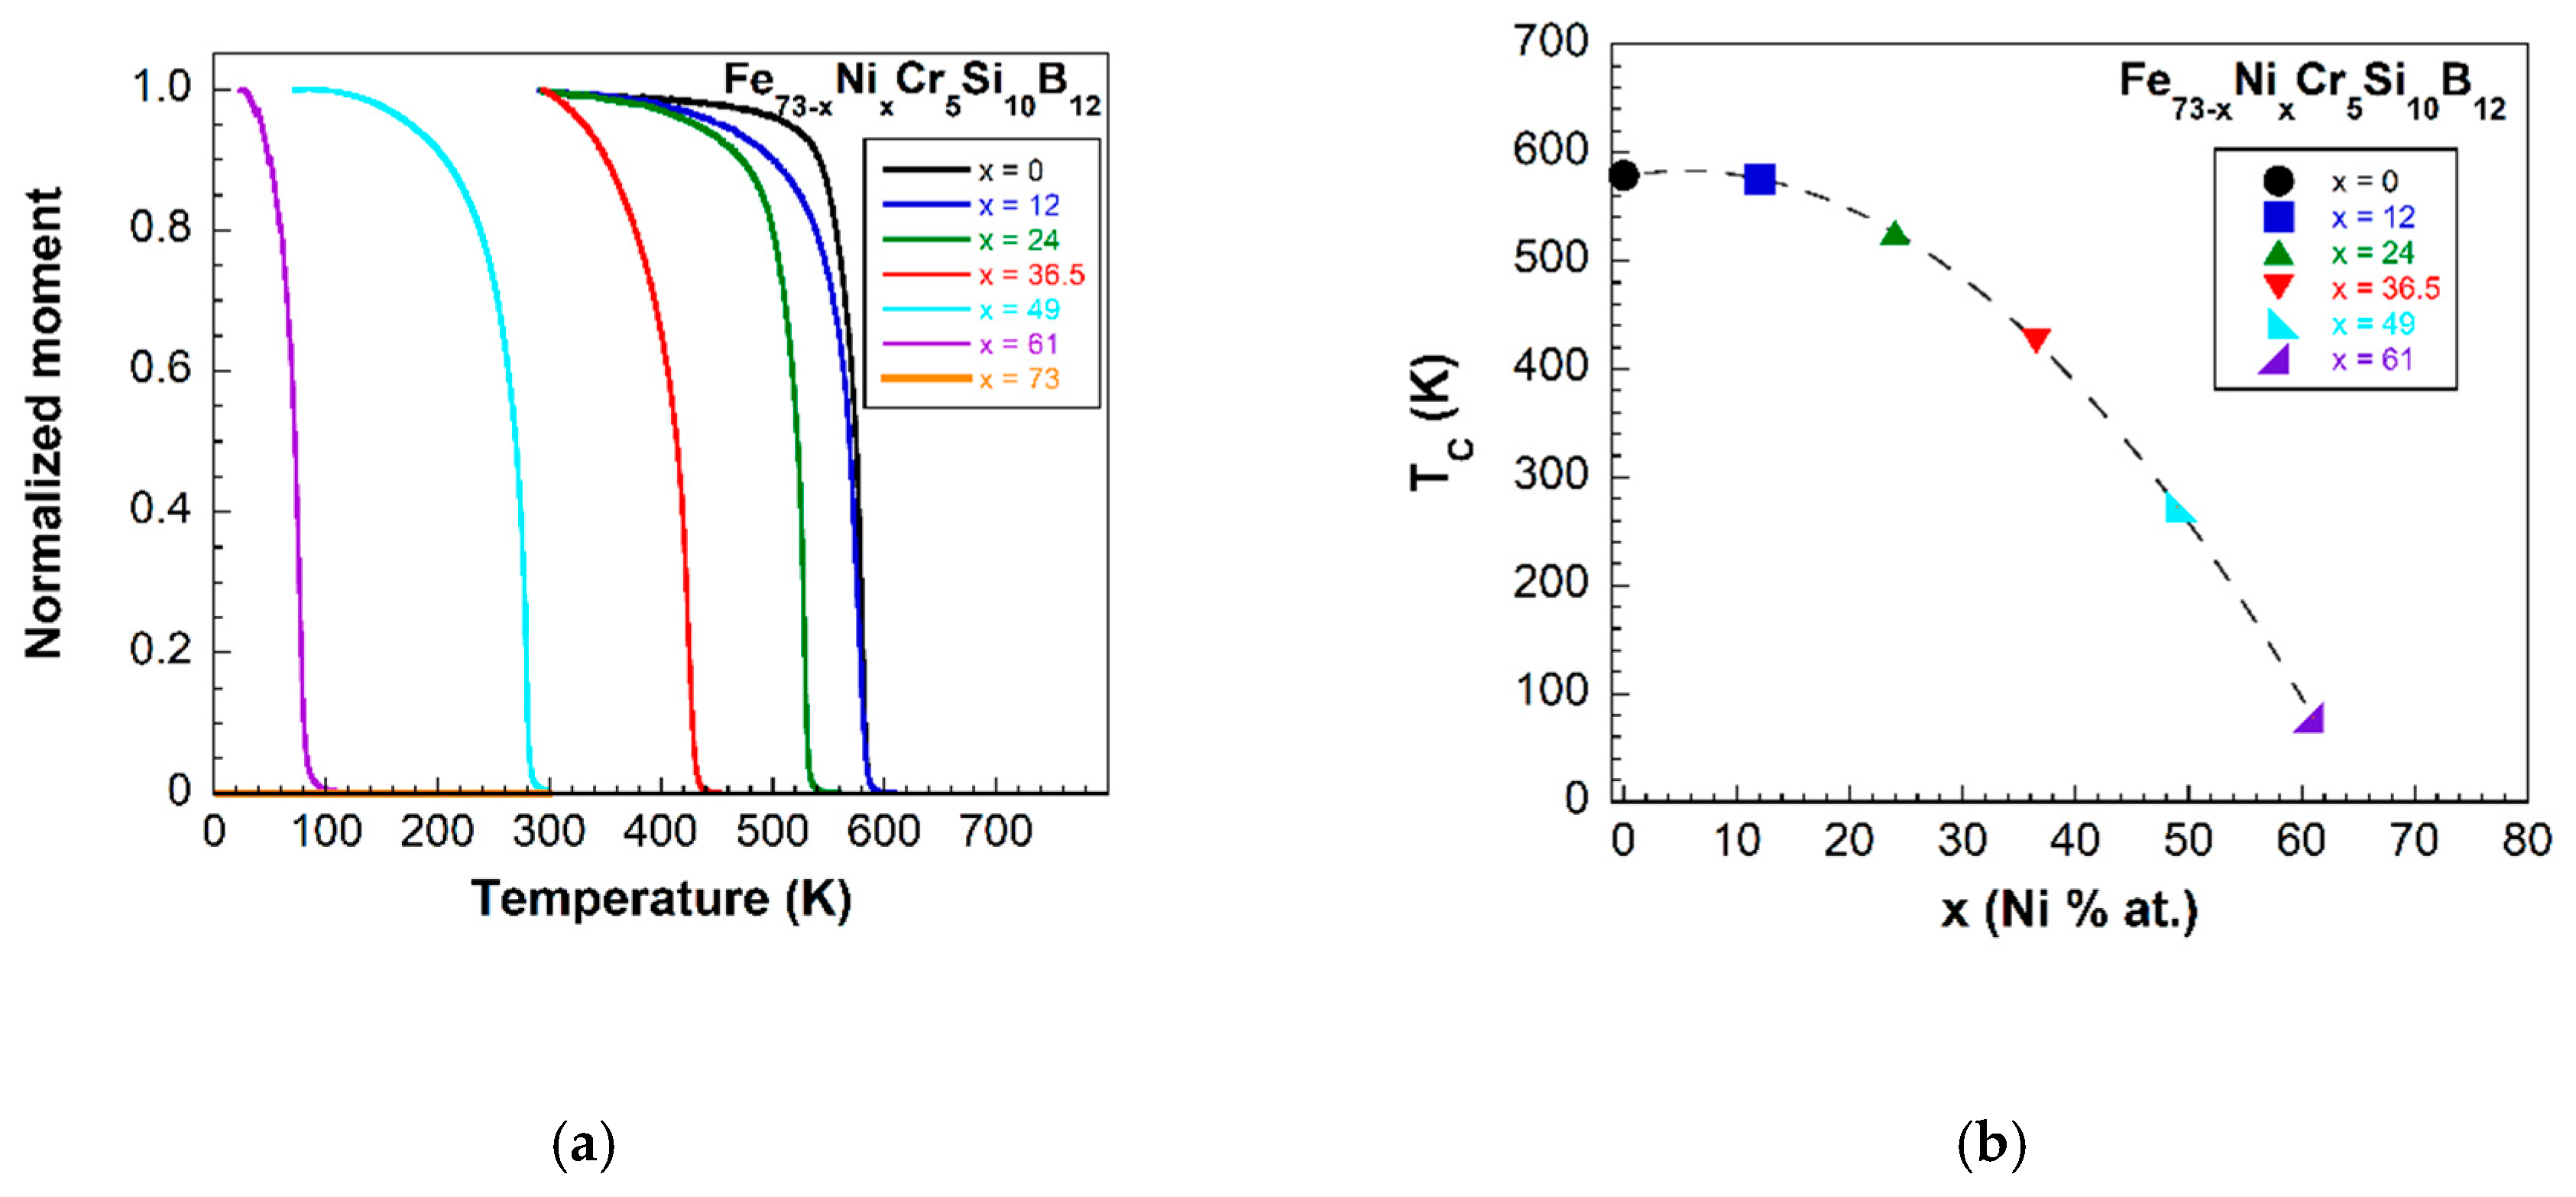
The Curie temperature was determined in a Vibrating Sample Magnetometer (VSM) using liquid nitrogen to cool down the samples, and in a Superconducting QUantum Interference Device (SQUID), using liquid helium to reach very low temperatures.
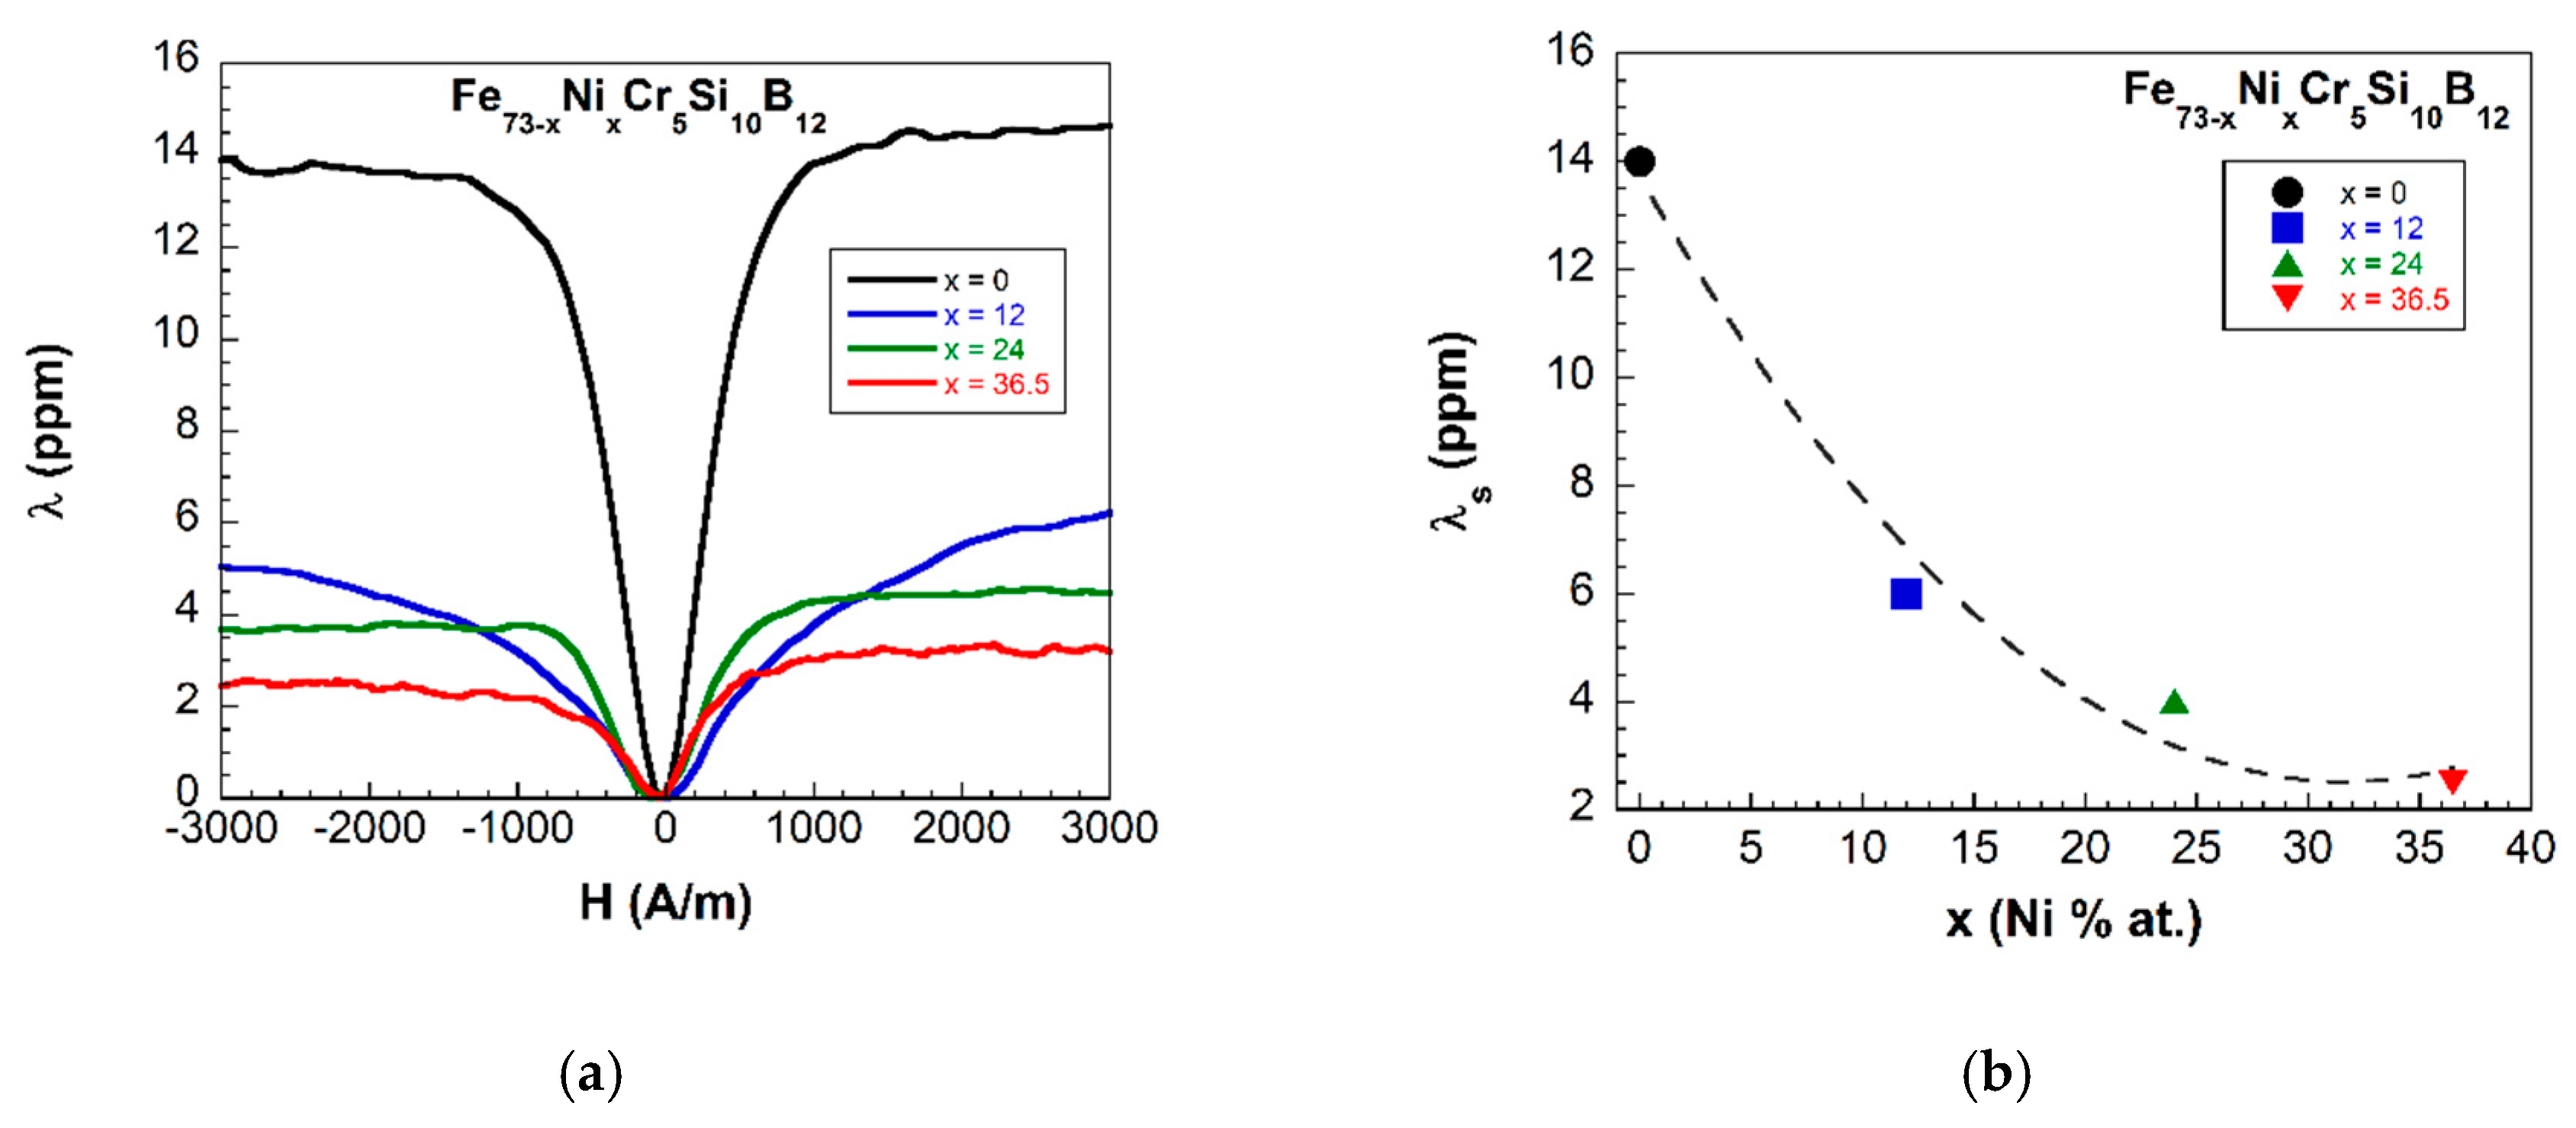
The saturation magnetostriction was determined by using strain gauges KOYWA KFL-02-120-C1-11 (Japan) and an electronic Wheatstone bridge working in half-bridge configuration, including a passive gauge. Magnetoelastic measurements of the
effect (the change in the Young’s modulus with the external applied magnetic field) were carried out using the resonance–antiresonance technique with a home-mounted experimental set-up consisting in three coaxial solenoids in order to apply the bias constant field
, the alternating field to magnetostrictively excite the sample, and a secondary pick-up coil to monitor the induced magnetization oscillations and detect the frequency of the corresponding magnetoelastic resonance [
21].
The corrosion behavior was studied by using the linear potential resistance (LPR) technique with a BioLogic VMP3 Potentiostat/Galvanostat. Measurements were performed in a conventional three-electrode cell, using as working electrode (WE) the fabricated amorphous ribbon, as reference electrode (RE) an Ag/AgCl ingold electrode, and as a counter-electrode (CE) a platinum foil electrode, these last two electrodes purchased from Methrom. We used as electrolyte a saline Phosphate Buffer Saline solution (PBS)
purchased from Sigma (Spain)
and
. All the corrosion measurements were made at room temperature 25 °C and at
[
22]. Before measuring the corrosion resistance behavior, the strips were cut in
-long pieces and carefully cleaned with acetone under sonication for 5 min and dried at room temperature. Samples were left to stabilize for 30 min in the saline solution while measuring the open circuit voltage (OCV), and afterwards we force the working electrode to decrease
from the OCV and scan the potential in the anodic direction at
until
above that OCV. Tafel and
fits were performed by analysis of the obtained curves, using the EC-Lab software in order to obtain values for the corrosion potential
, the corrosion density
, the polarization resistance
and the Corrosion Rate
[
23].
To confirm our observations from electrochemical measurements, X-ray photoelectron spectroscopy (XPS) analyses were performed in a SPECS instrument (Berlin, Germany) that uses monochromatic radiation from and that is provided with a Phoibos 150 1D-DLD analyzer. The system was initially calibrated with . For each sample, two scans were performed: the first one to determine the elements present in each ribbon (or wide scan, step energy , dwell time , pass energy ) and the second one to carefully analyze each detected element (or detail scan: step energy , dwell time , pass energy ). The analyzer is located perpendicular to the sample surface.
4. Discussion
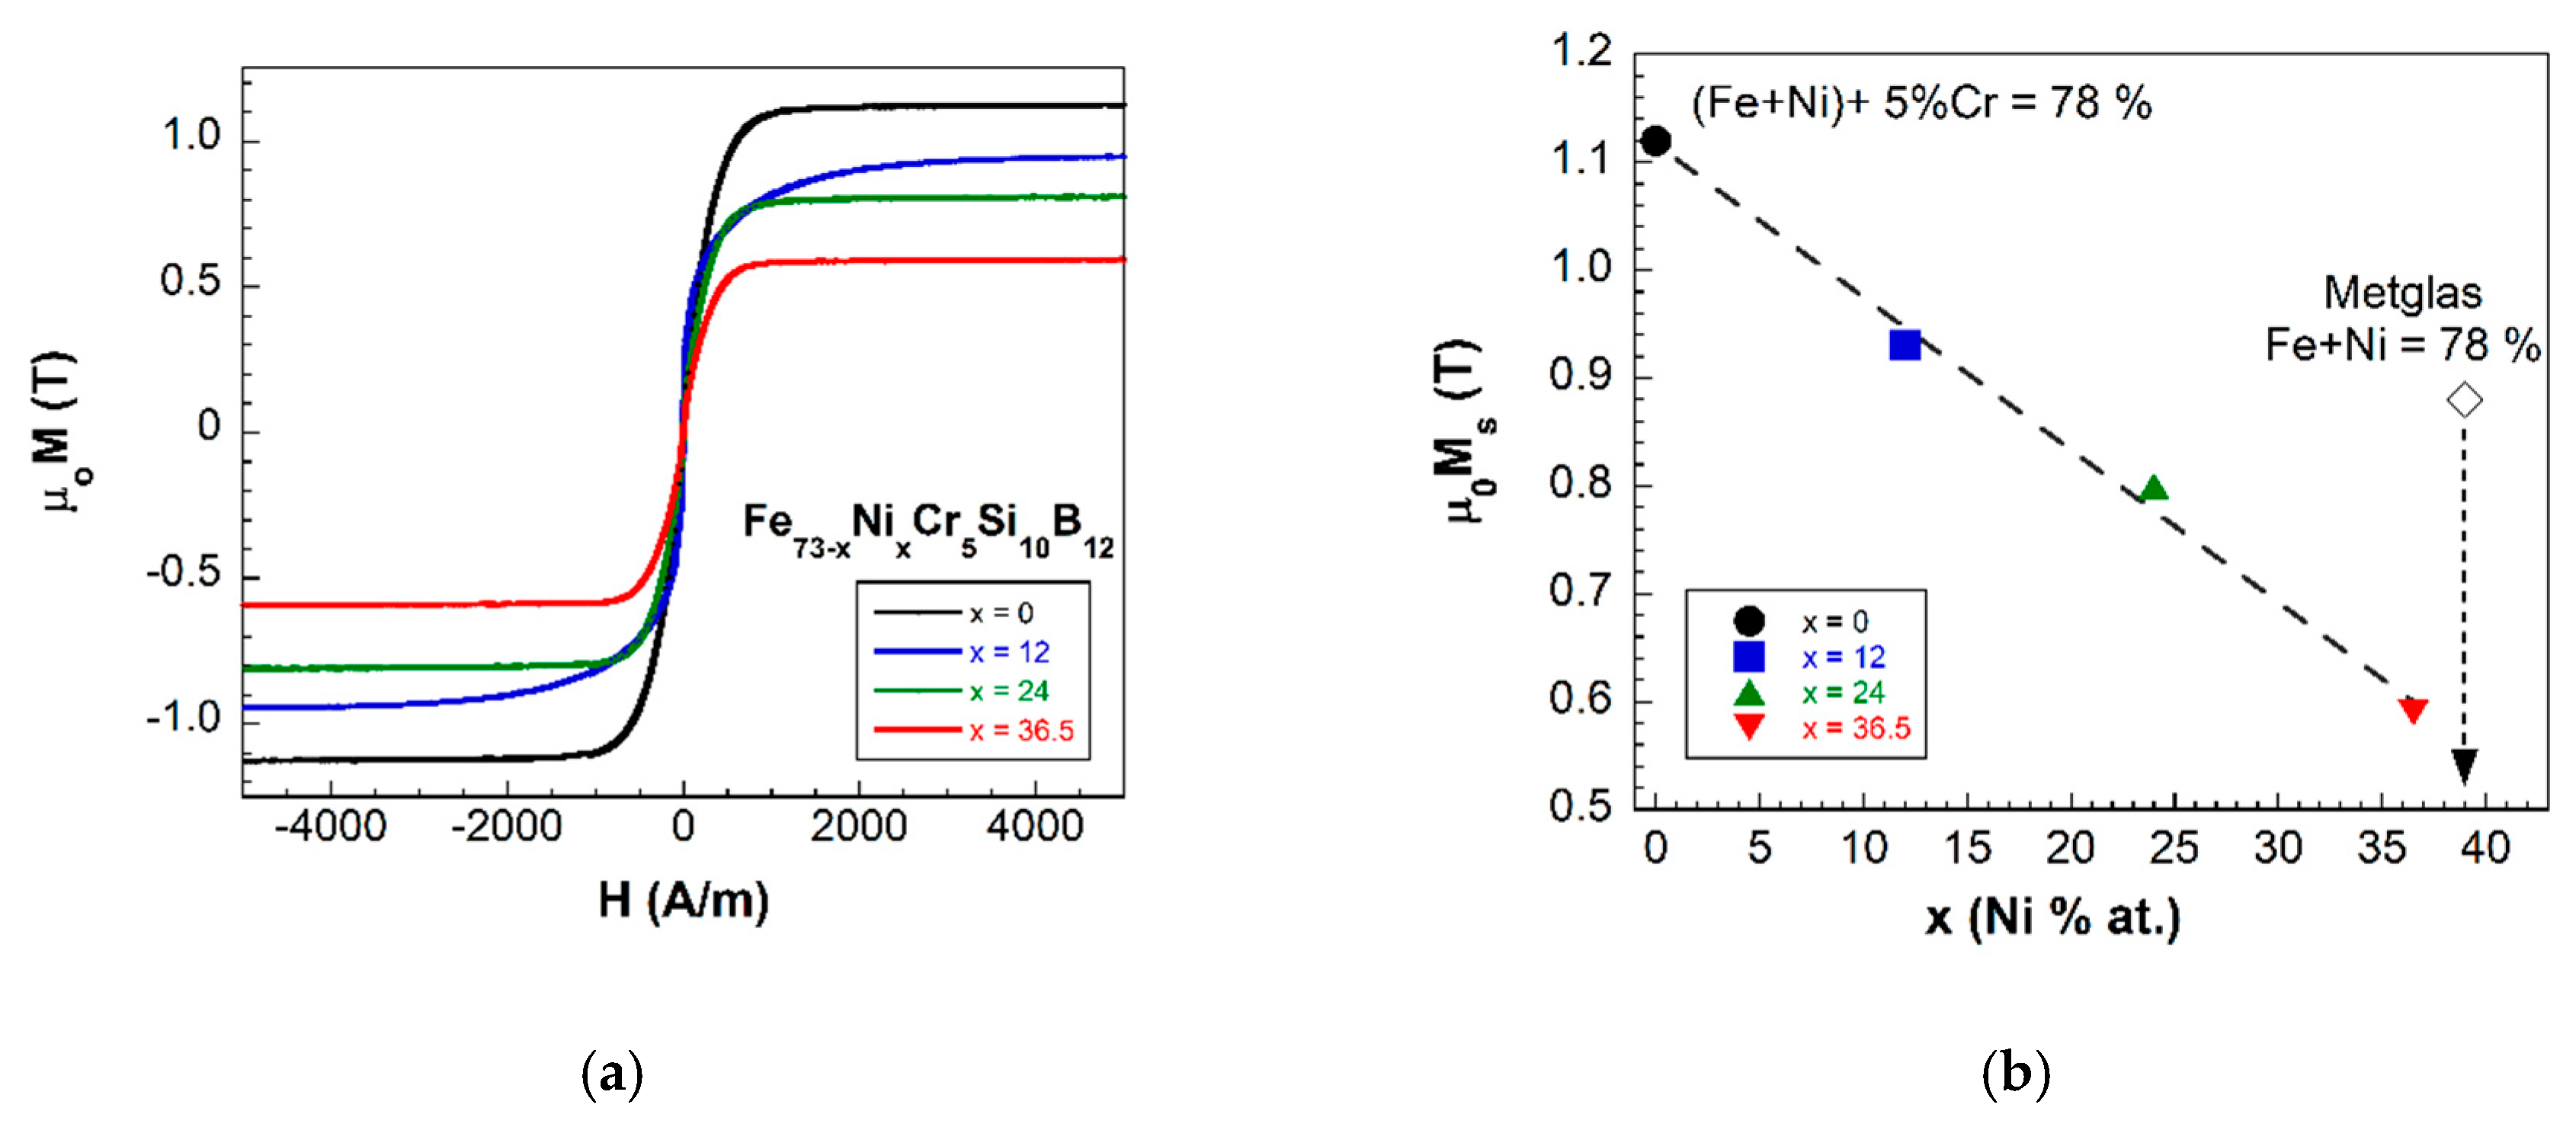
The magnetic properties of the studied metallic glasses of nominal compositions
with different
ratios and
show two characteristic features: firstly, from the seven synthesized samples, only the four with a Ni content up to a
show ferromagnetic behavior at room temperature (see
Figure 3). Secondly, a continuous decrease in their measured saturation magnetization values (see
Figure 2). The reason for these simultaneous observations arises from the magnetic nature of
,
and
elements.
and
are ferromagnetic elements, while
is paramagnetic. As expected, the first effect of a
addition in the composition of our samples is to reduce the magnetization value [
28]. This is fully confirmed by comparing the saturation magnetization values of Metglas 2826MB3 and our
sample, the one with the closest composition to the reference sample (see
Figure 2b).
The outer electronic structures of
and
are
and
, respectively. The observed decrease in the saturation magnetization values when changing the composition from
to
can be explained by considering both the energy-band model and the Slater–Pauling curve. To start, the energy-band model [
29] tells us that in a ferromagnetic alloy an increase of the number of electrons in the
d band can enhance or diminish the electron distribution of energy-band, and therefore change the magnetic moment of the alloy. Its experimental observation can be explained by the Slater–Pauling curve [
30], which demonstrates that the average magnetic moment of an alloy is a function of the amount of outer electrons. Concerning the elements included in the present study, both
and
have the 3
d spin-up band fully occupied, while they have one and three 3
d spin-down electrons, respectively. Thus, the progressive addition of
in the
-rich composition alloys enhances the total electron distribution and, as a consequence, gives rise to the observed monotonous decrease in the saturation magnetization values our samples.
Special attention must be payed to the sample
, with composition
. While room temperature hysteresis loops of the
fabricated samples are almost identical, the hysteresis loop of the sample with
shows that this composition needs more applied magnetic field in order to reach magnetic saturation (in other words, the approach to saturation in the hysteresis loop is more “rounded”; see
Figure 8a). Also, the measured
effect magnitude for this composition shows an abrupt decrease if compared with the other compositions (see
Figure 5b). In order to elucidate the origin of such anomalous behavior we have inspected the domain sizes of samples
and
by means of Kerr microscopy.
A direct inspection of
Figure 8b,c shows that at remanence, the sample with
shows only big magnetic domains while sample
presents a coexistence of small and large sized magnetic domains. The relation between the domain sizes, and the coercive and saturating fields in patterned [
31] and thin film [
32] soft magnetic materials, is already well established. The
sample undergoes a reversal process involving sequential flipping of domains, starting from the small domains being flipped upon application of an external field, and then dragging the bigger domains upon reversal of the smaller ones. The fingerprint of this process is precisely the distinct hysteresis loop shape shown in panel (a) of
Figure 8, in opposition to a sharp reversal process of the big domains present in the rest of the samples, which results in sharper hysteresis loop shapes. This difference in the bulk magnetization process together with the different inner microstructure of those magnetic domains within the sample, give rise to the observed anomalous behavior in both hysteresis loop and Young’s modulus variation one.
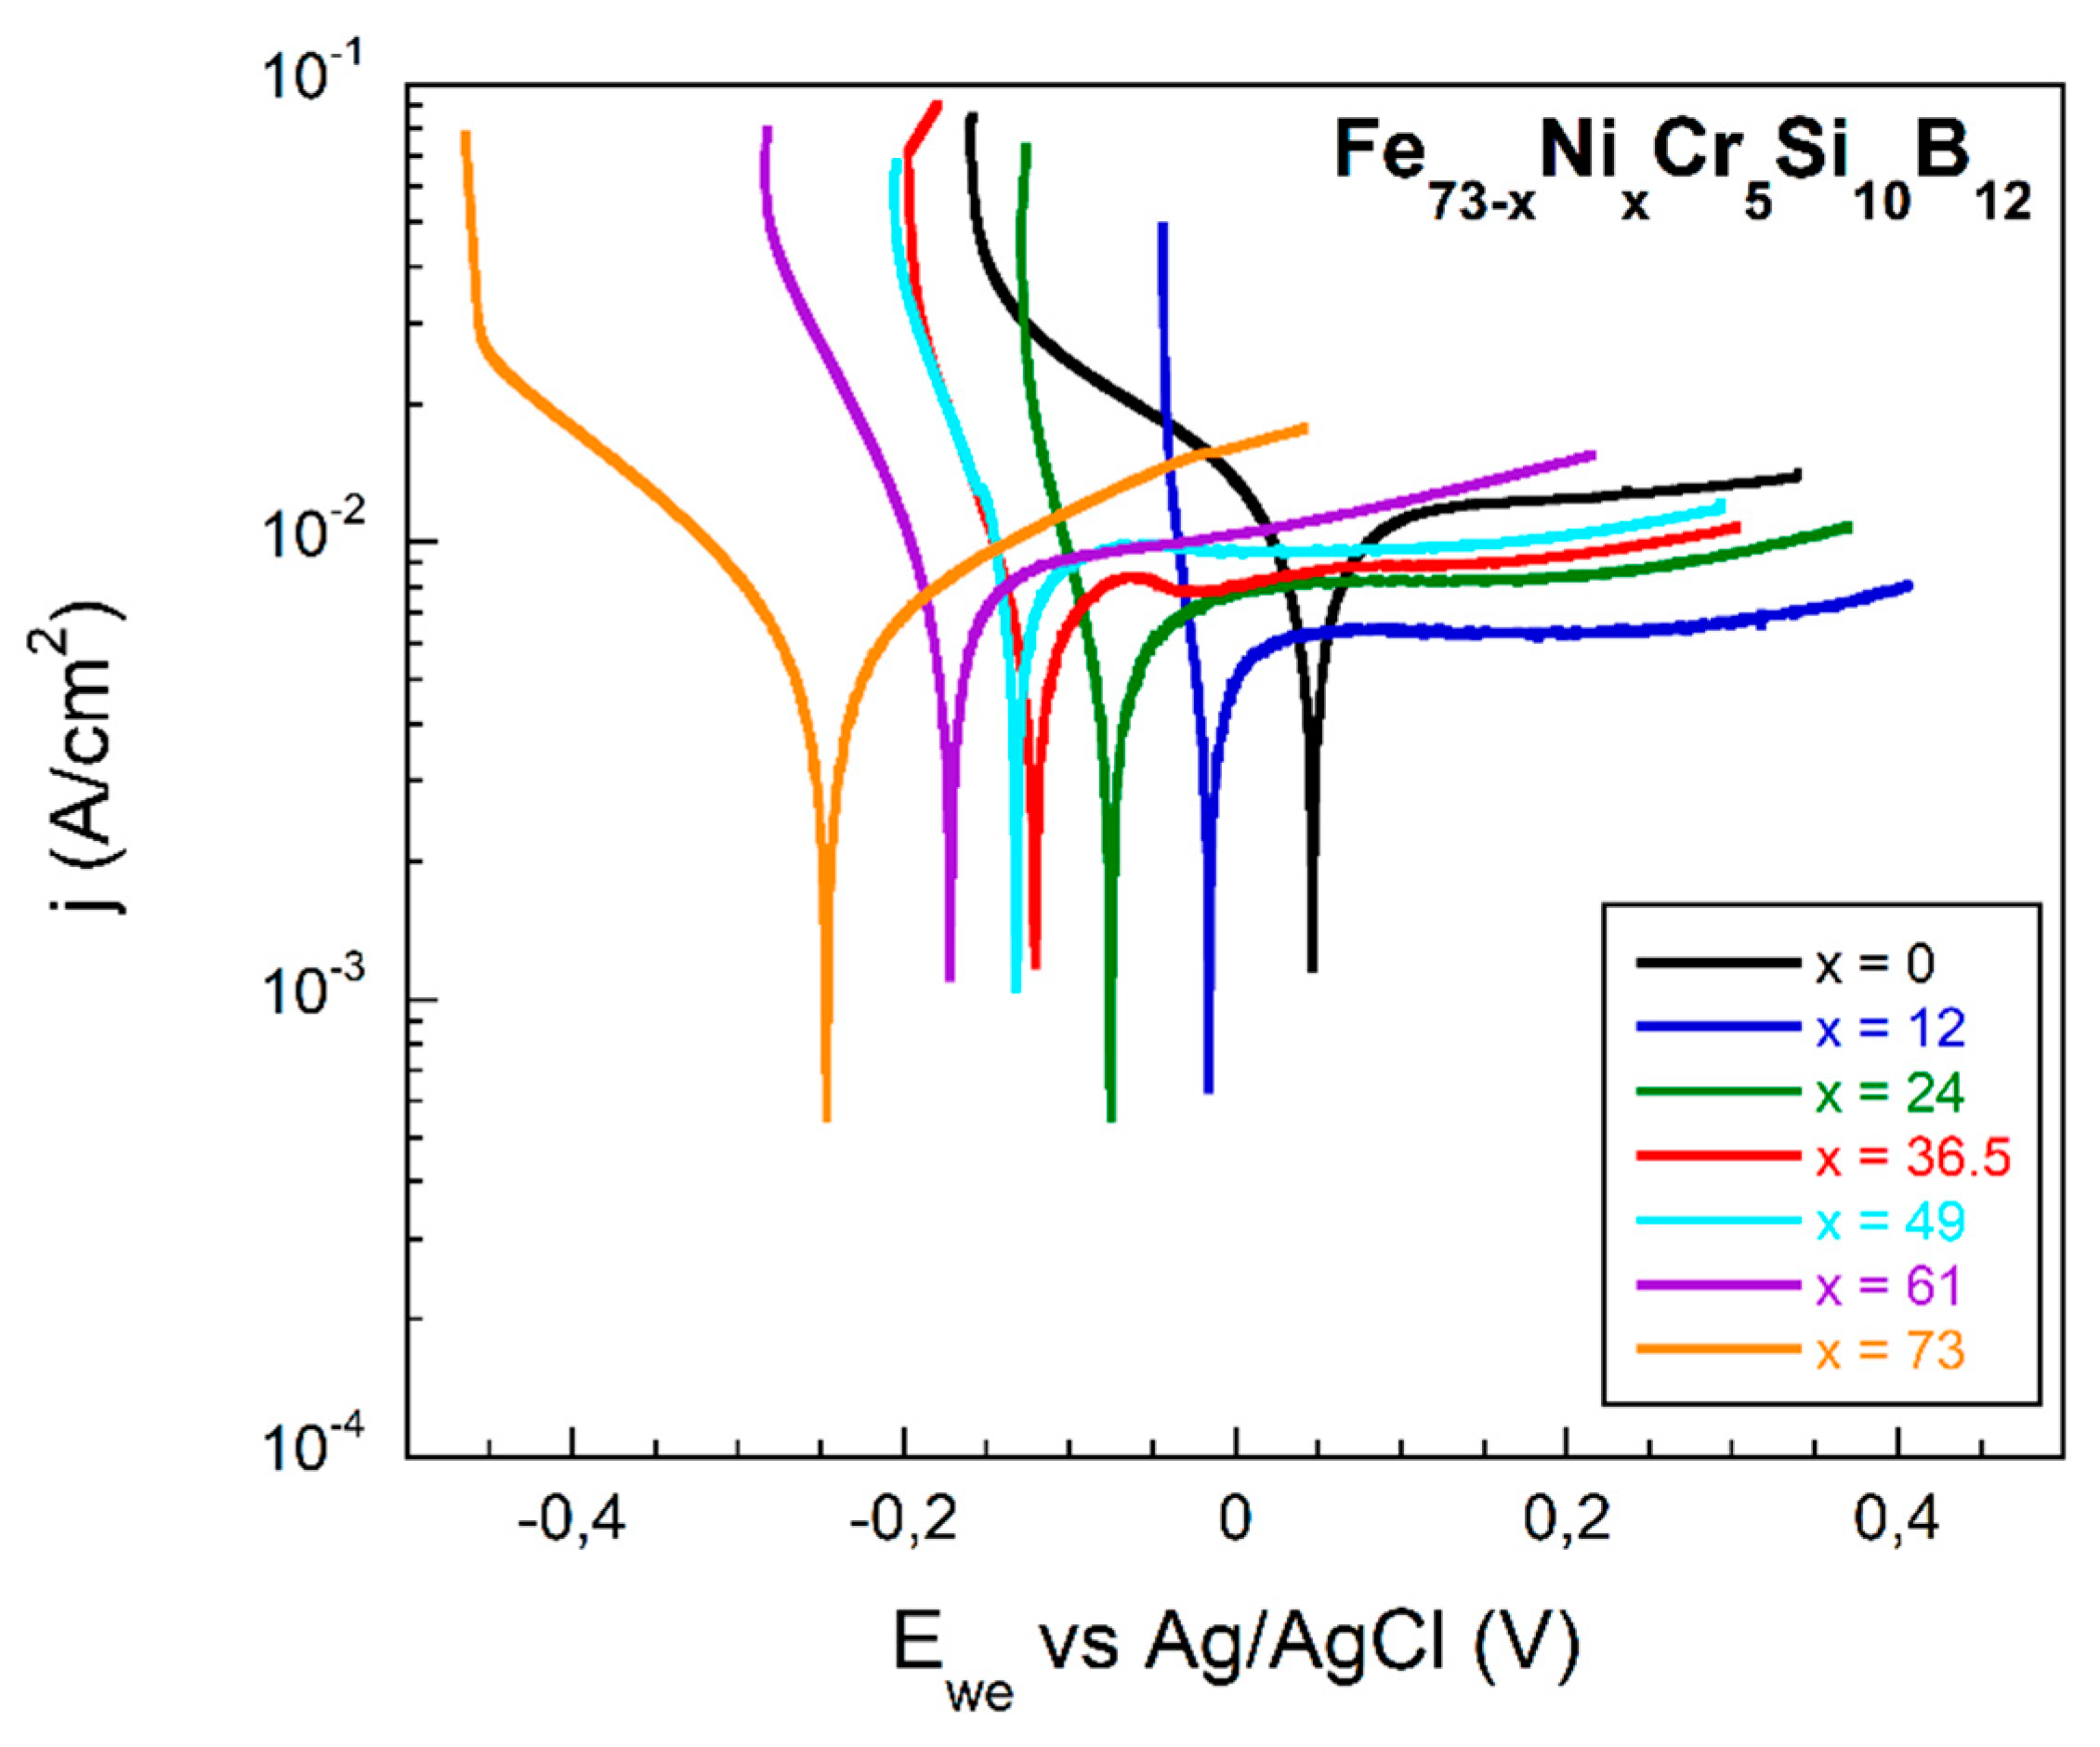
Concerning the electrochemical behavior of the samples, our results, shown in
Figure 6 and
Figure 7 and summarized in
Table 2, clearly indicate that
-based metallic glasses with a small percentage of chromium in their composition exhibit excellent corrosion resistance properties. As expected, the most corrosion resistant alloy is also the one with the lowest corrosion rate
. This is fully justified by the measured high corrosion potential and low current density determined from our measurements [
18,
33].
Also, we have observed that the gradual addition of
to the initial (
) sample composition, gives rise to a smooth, but continuous, degrading of those properties. The first reason for such behavior has to be found in the structural characteristics of the amorphous state. This is a homogeneous single phase arisen from the extremely rapid cooling rates necessary to form the glassy state. So, there are no grain boundaries nor dislocations that provide an initial site for corrosion [
12,
34]. This amorphous structure is usually accompanied by a chemical homogeneity that, if including the proper elements, gives excellent corrosion properties to the amorphous material. This is the case of our
containing metallic glasses [
12,
15,
34].
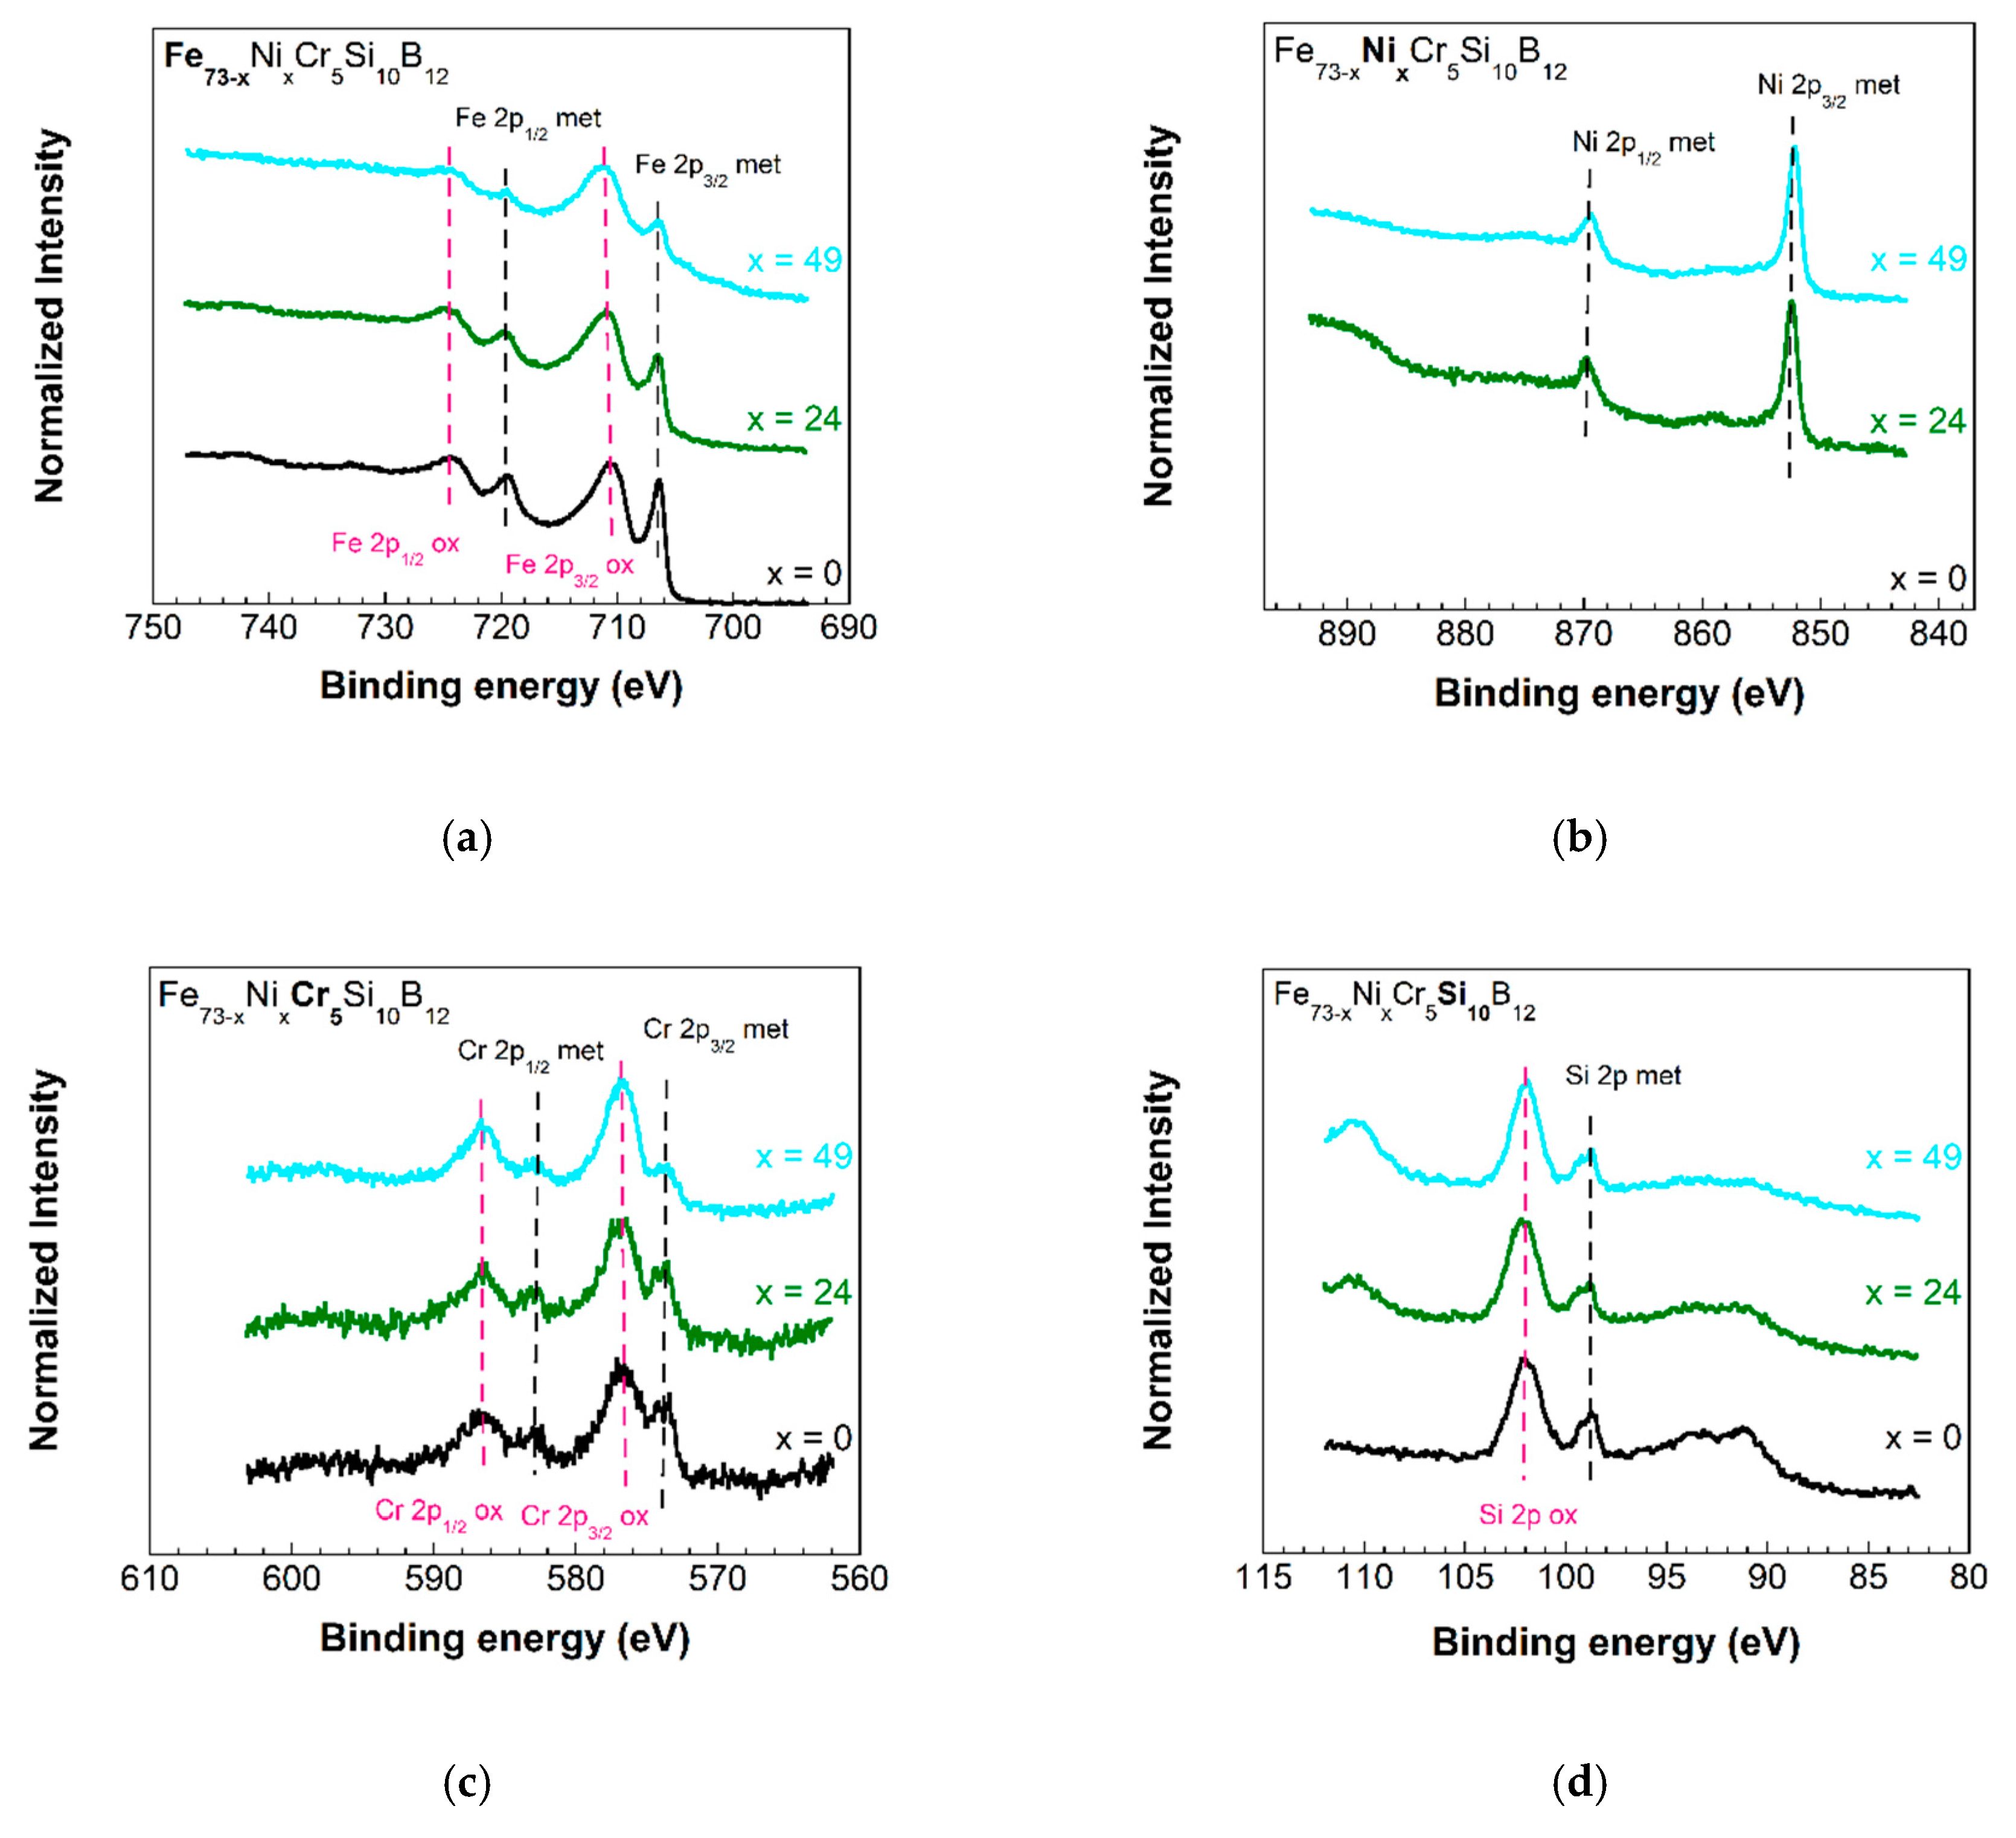
The homogeneity in chemical composition favors the appearance of an amorphous oxide film on their surface: the so-called “passivation layer”, that retards the charge transport responsible for corrosion phenomenon. The formation of this passive layer occurs very quickly. To gain a deeper insight into the existence of such protective layers onto our amorphous strips, we have performed X-ray photoelectron spectroscopy (XPS) analysis with the
content compositions.
Figure 9a–e show the spectra measured for
and
, respectively, for the three studied compositions.
Regarding the iron spectra, elemental (metallic)
and
emissions located at
and
binding energies are observed. Also,
and
emissions located at
and
are observed, which correspond to oxidized iron (being
,
or
possible oxides) [
35].
In the case of nickel, and elemental (metallic) emissions located around and binding energies are observed. The presence of oxidized nickel is not clear, since and emissions located around and are observed, but these emission features could correspond to plasmon loss leaks for metallic .
Related to chromium,
and
elemental (metallic) emissions located at
and
binding energies are observed. Also,
and
emissions located at
and
are observed, which correspond to oxidized chromium (probably
) [
36].
In the silicon spectra, elemental (metallic) emission located at and (oxidized) emission located at are observed, most probably due to the presence of .
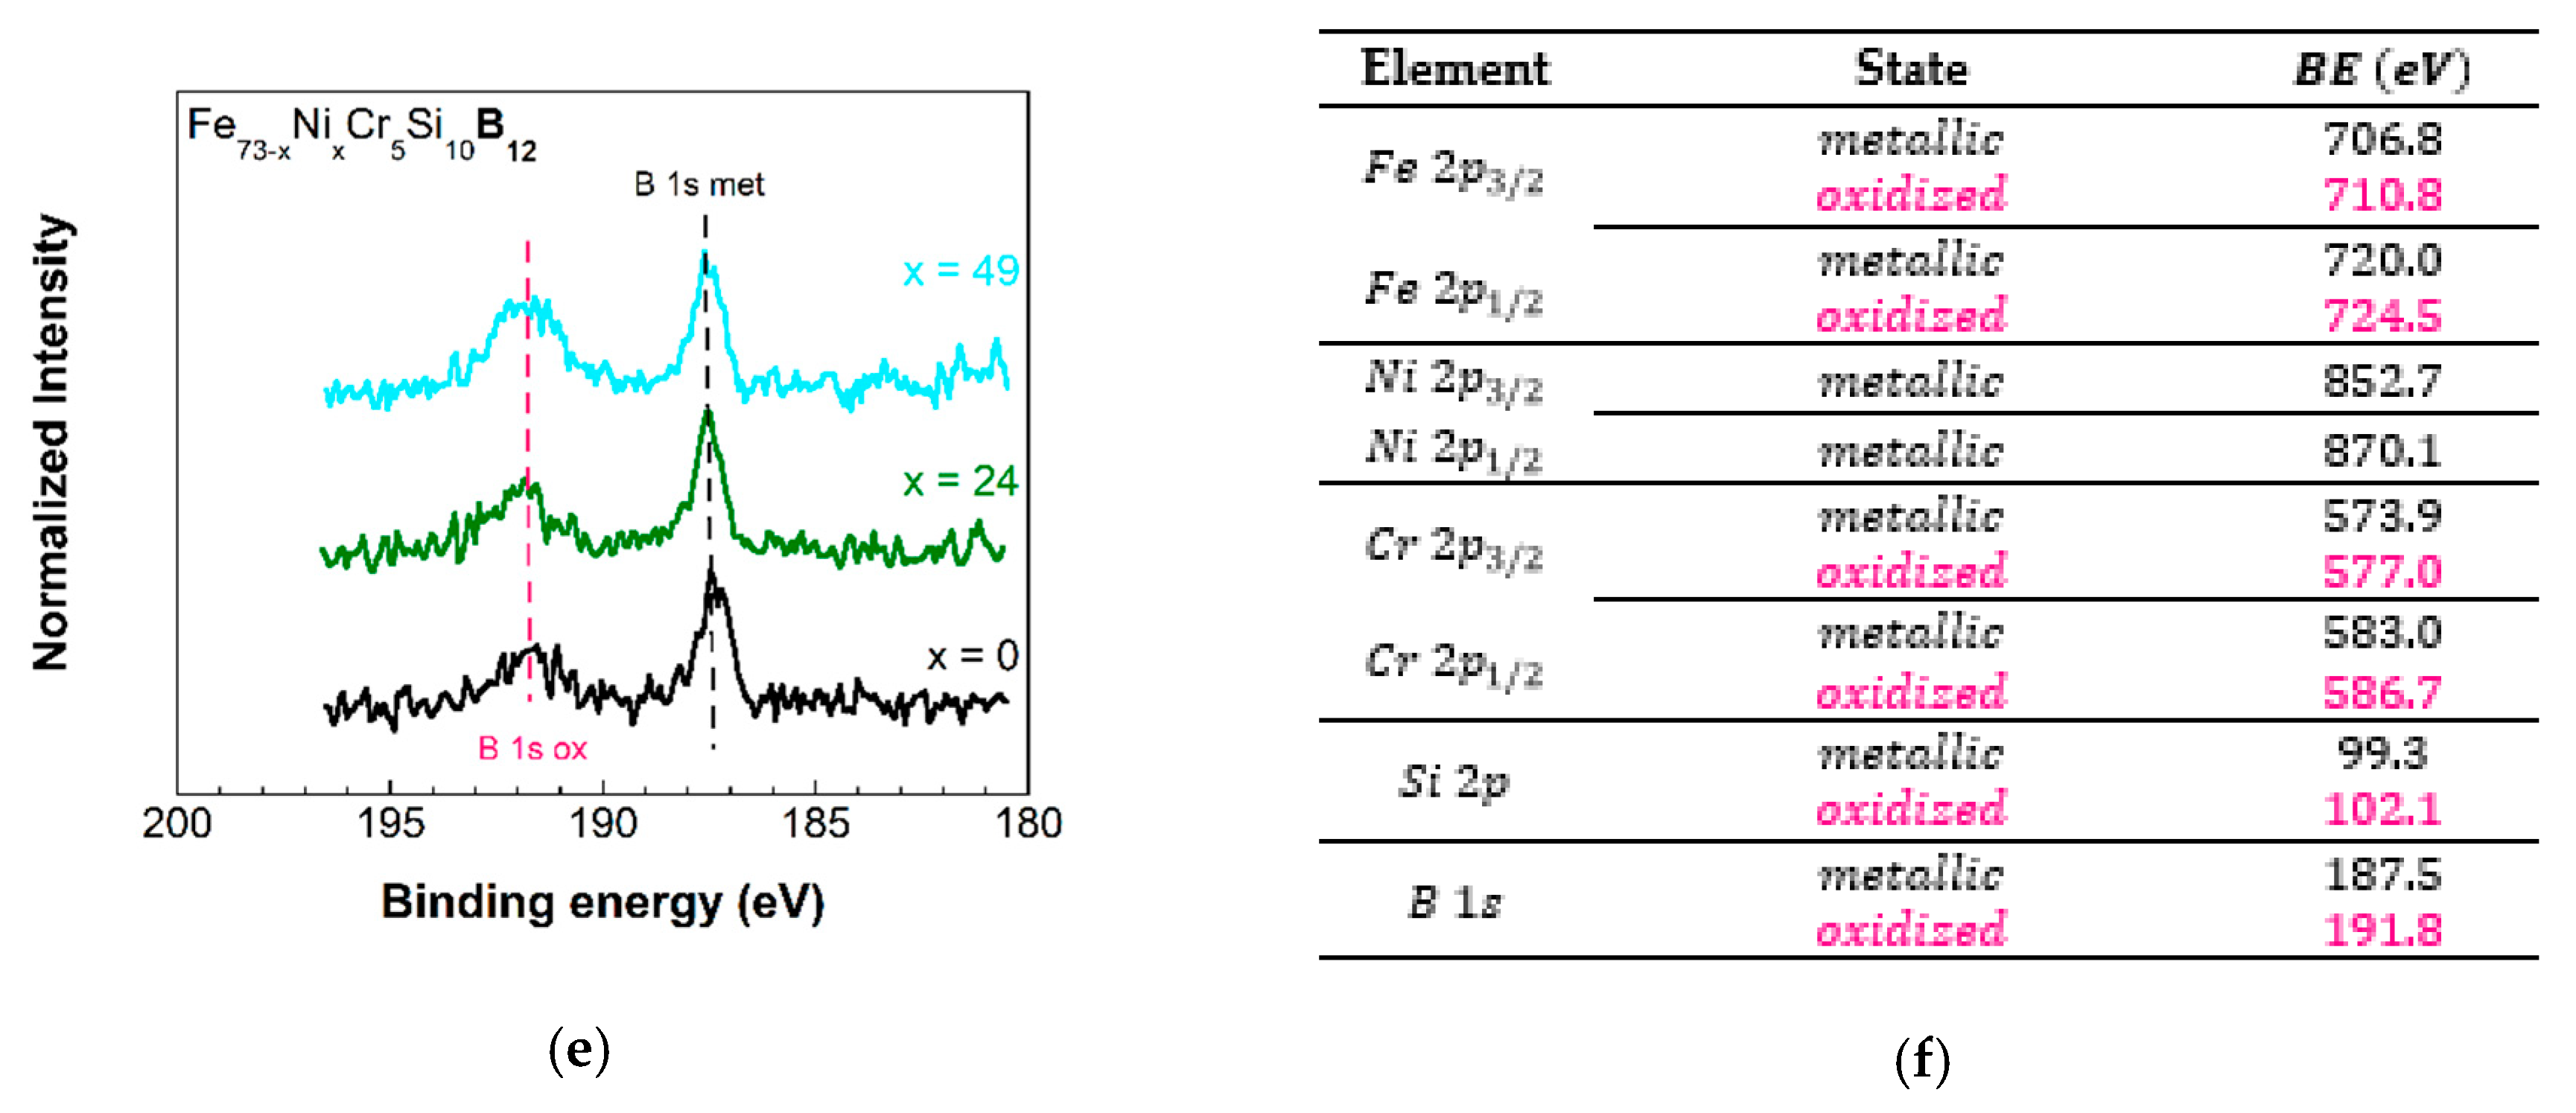
Finally, the boron spectra show
metallic emission located around
and oxides emission around
, this last corresponding to oxidized species, as
or
[
37,
38,
39].
In all these detected peaks, we assume those elemental or metallic emissions to arise from the bulk alloy. However, all the emissions arising from oxidized species belong to the presence of formed passivation layers that give the corrosion properties to the different alloy compositions. From the quantification of the measured XPS spectra, it is clearly shown that the oxide layer atomic percentage decreases ( for the sample, for the sample and for the sample) as the content in the sample increases ( for the sample and for the sample). The oxide passivation layer slightly changes, for the sample, for the sample and for the sample. More surprisingly, the presence of a relevant oxide layer has been confirmed by our measurements, with values of for the sample, for the sample and for the sample. In summary, in the existing passivation layers the oxide amount decreases as the content in the composition of the sample increases, oxide content practically does not change and there is a significant amount of oxide (about ) that strongly contributes to the corrosion resistance behavior of our studied samples. These atomic percentage values obtained from the XPS analysis reflect the expected concentration trend in the different samples, but they do not correspond with the theoretical values due to the presence of carbon (usually detected in samples analyzed by XPS) and an excess of oxygen because of the air exposure.

 ,
, 


