CuWO4 with CuO and Cu(OH)2 Native Surface Layers for H2S Detection under in-Field Conditions


Abstract
:1. Introduction
2. Materials and Methods
2.1. Materials Preparation
- 1 g (NH4)W12O41 and 0.73 g copper(II) acetylacetonate were used as inorganic precursors, 100 mL ethanol absolute as a solvent, 9 mL tripropylamine (TPA) as a template, and 0.8 g polyvinylpyrrolidone (PVP) (average mol wt 360,000) as a dispersant/stabilizer agent. Solution I obtained by dissolving the PVP in 40 mL of ethanol was added to solution II, which was prepared by dissolving the inorganic precursors in 60 mL of ethanol. Then, TPA was added and the obtained mixture was kept under vigorous stirring for 24 h. The blue gel obtained after several days at room temperature, was dried at 80 °C and next thermally treated at 600 °C in air, for 8 h. The sample was labeled CuW1.
- The second method followed a similar protocol to the previous one. During the synthesis process, 3 g of urea was added to the inorganic precursors solution and 12 mL of tetrabuthylammonium hydroxide (40 wt% in water) was added as a precipitating agent after TPA addition. After 24 h, a white precipitate was observed. The mixture was maintained at 50 °C for several days, followed by a thermal treatment under a vacuum at 150 °C for 1 h. The green obtained resin was calcined in air at 600 °C for 8 h. The sample was labeled CuW2.
- The third synthesis route involves a hydrothermal carbonization of different biomass derivates (2 g glucose, 2 g fructose, and 6 g starch) in the presence of the inorganic precursors for Cu and W, 0.76 g copper(II) acetylacetonate and 0.59 g (NH4)W12O41. The water was used as a solvent, 125 mL for biomass derivate and 50 mL for inorganic precursors. The suspension was transferred to an autoclave with a Teflon liner. The hydrothermal carbonization process takes place at 180 °C for 12 h. The precipitate was isolated by centrifugation (3000 rot/min for 15 min), dried under vacuum at 80 °C and thermally treated at 600 °C in air for 8 h. The sample was labeled CuW3.
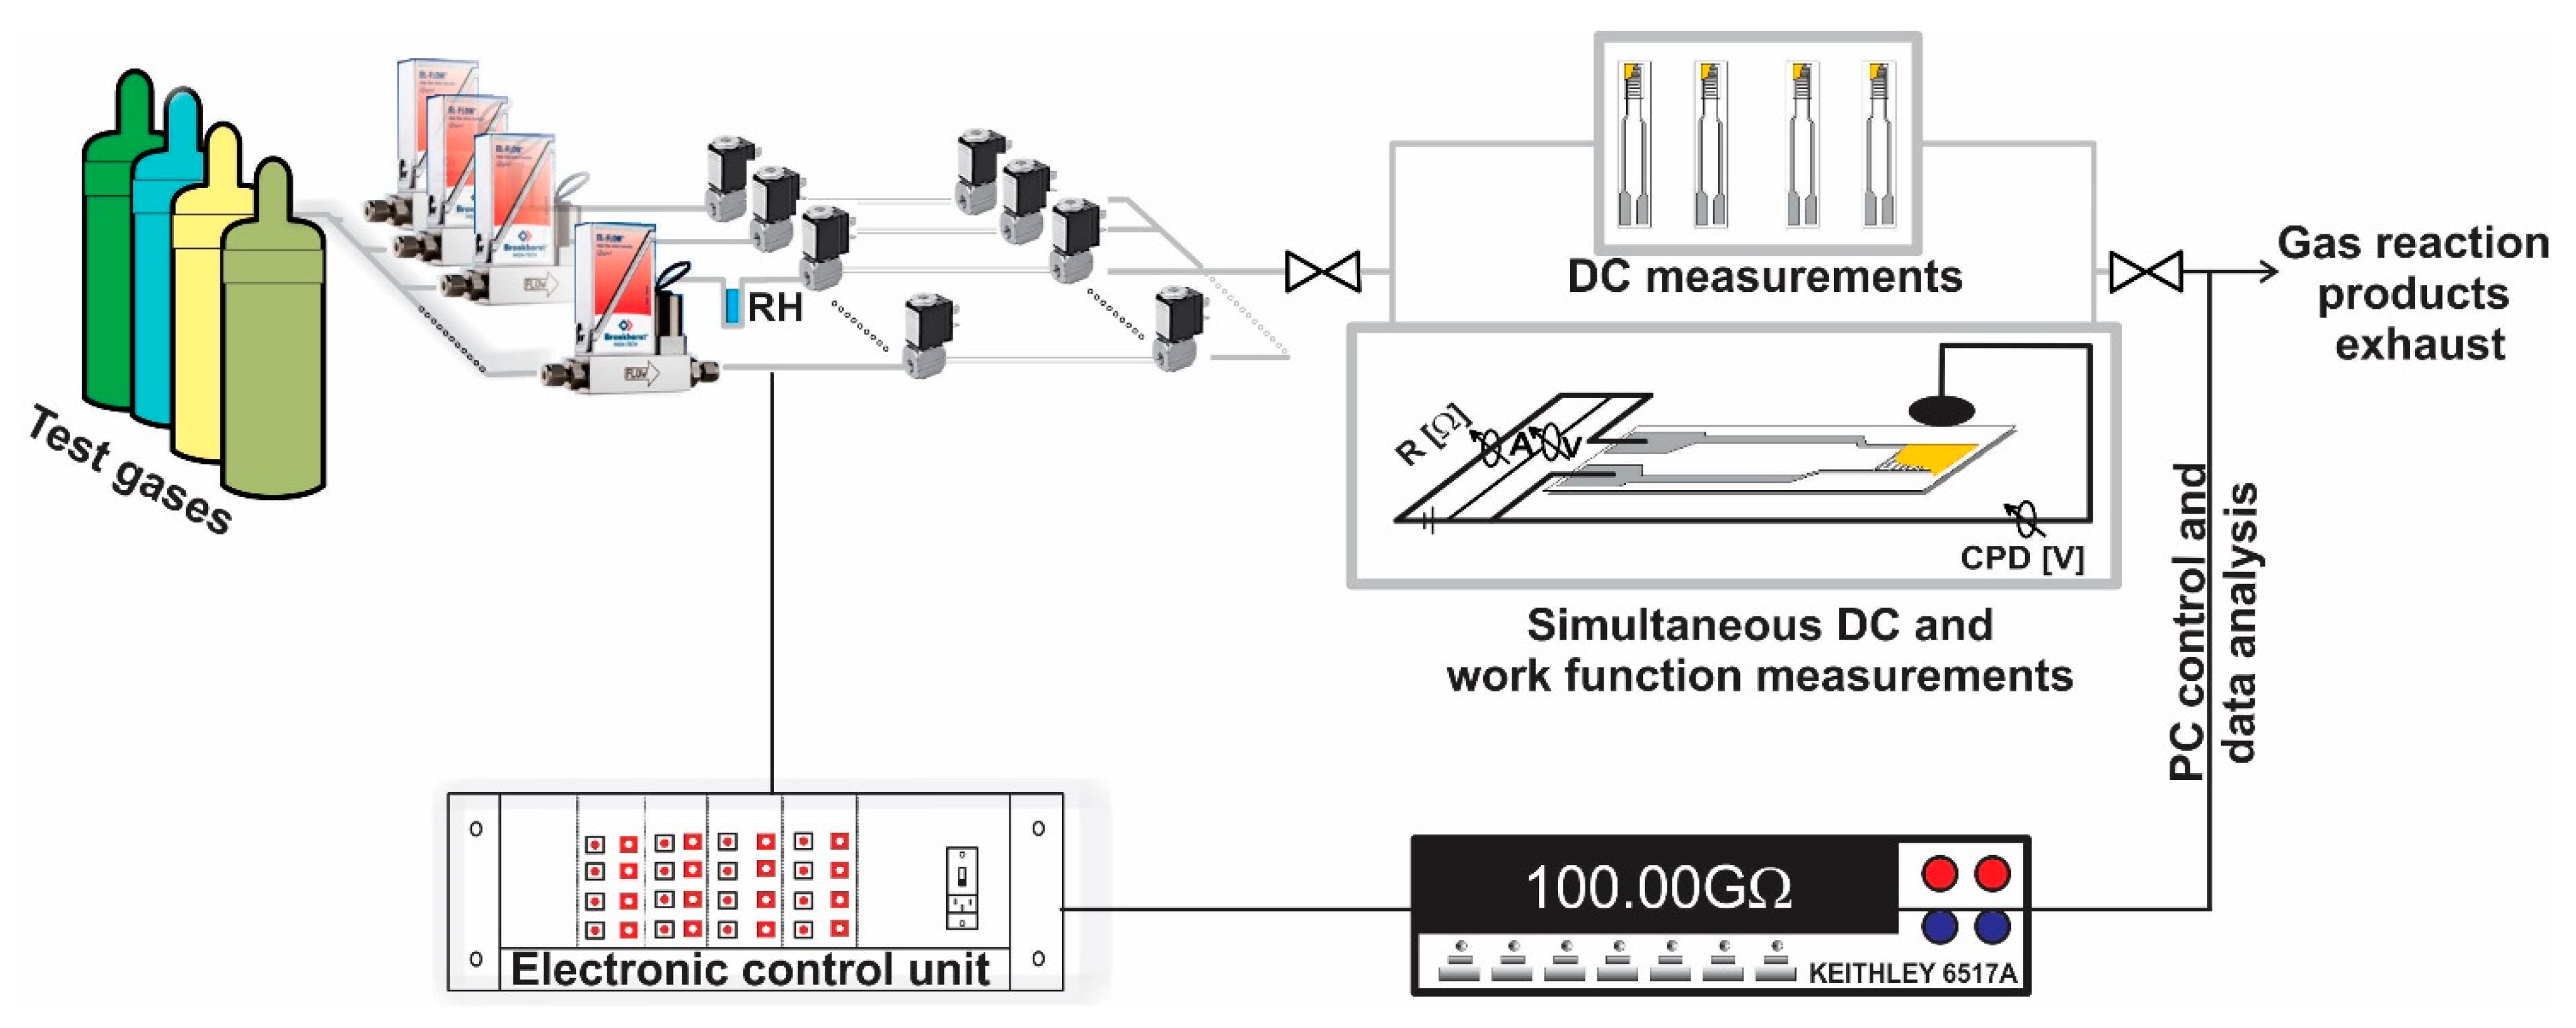
2.2. Sensors Fabrication
2.3. Materials Characterization
3. Results
3.1. Materials Characterization
3.1.1. Structural and Morphological Assessment
XRD Analysis
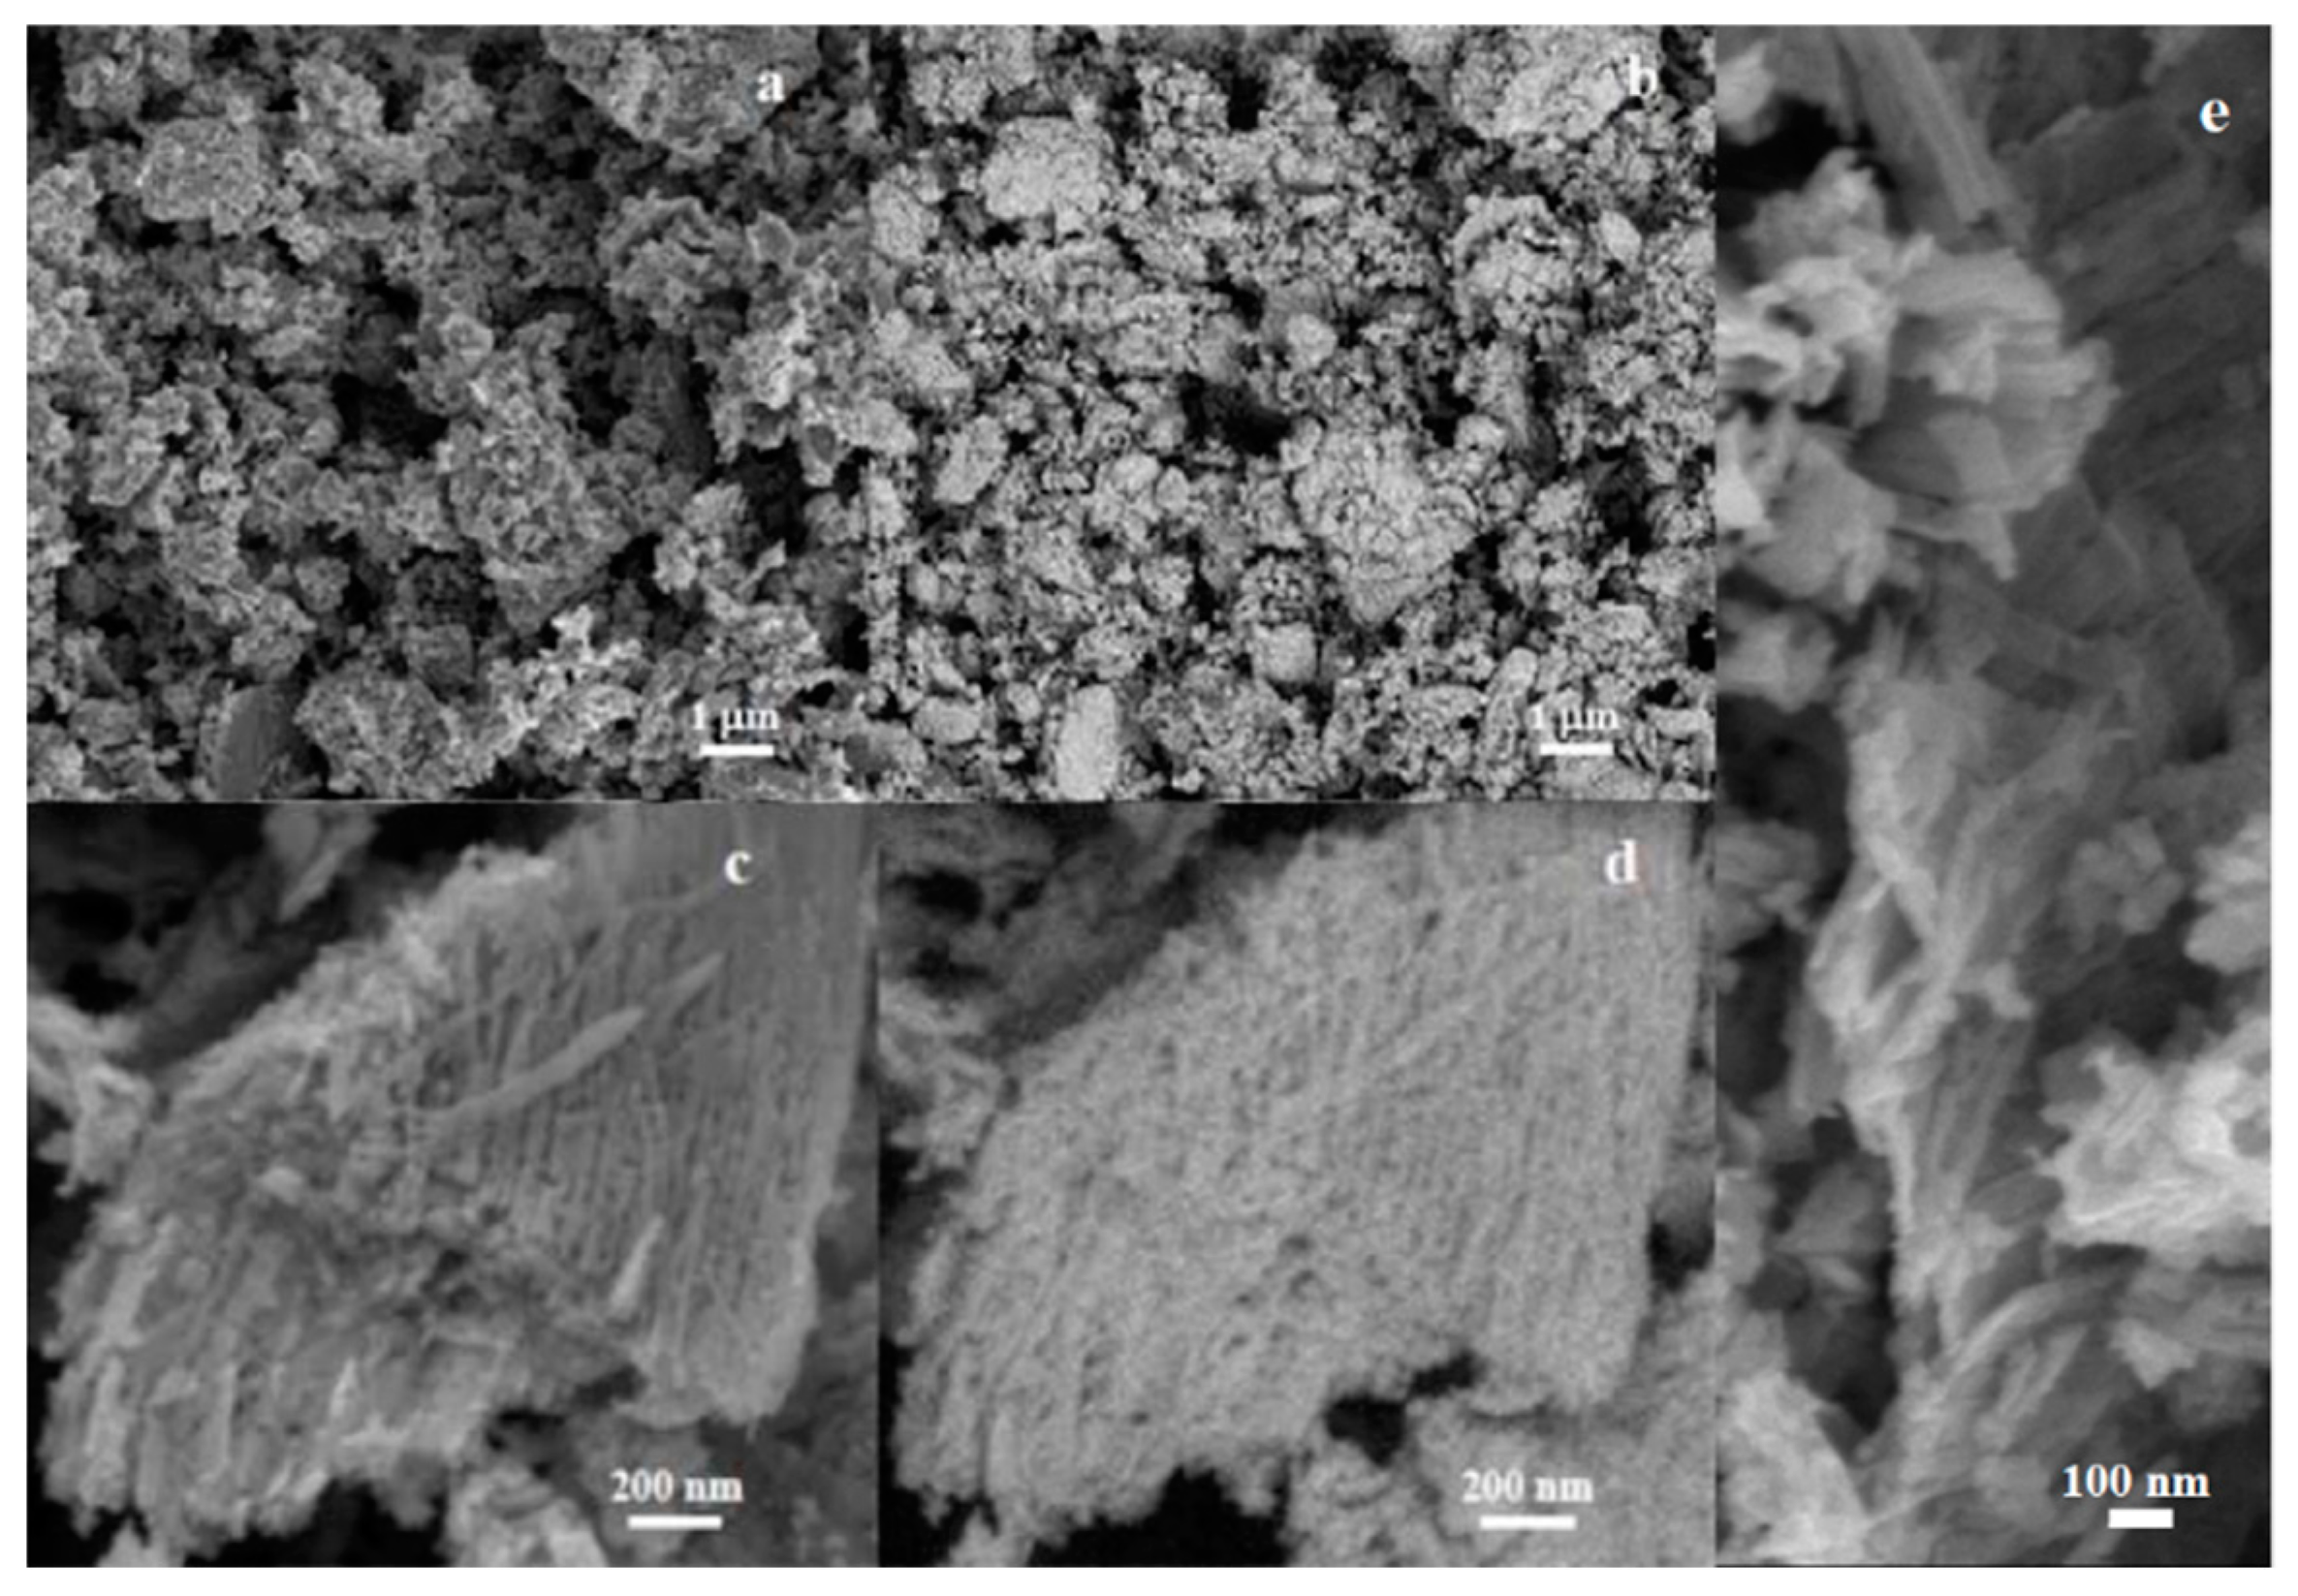
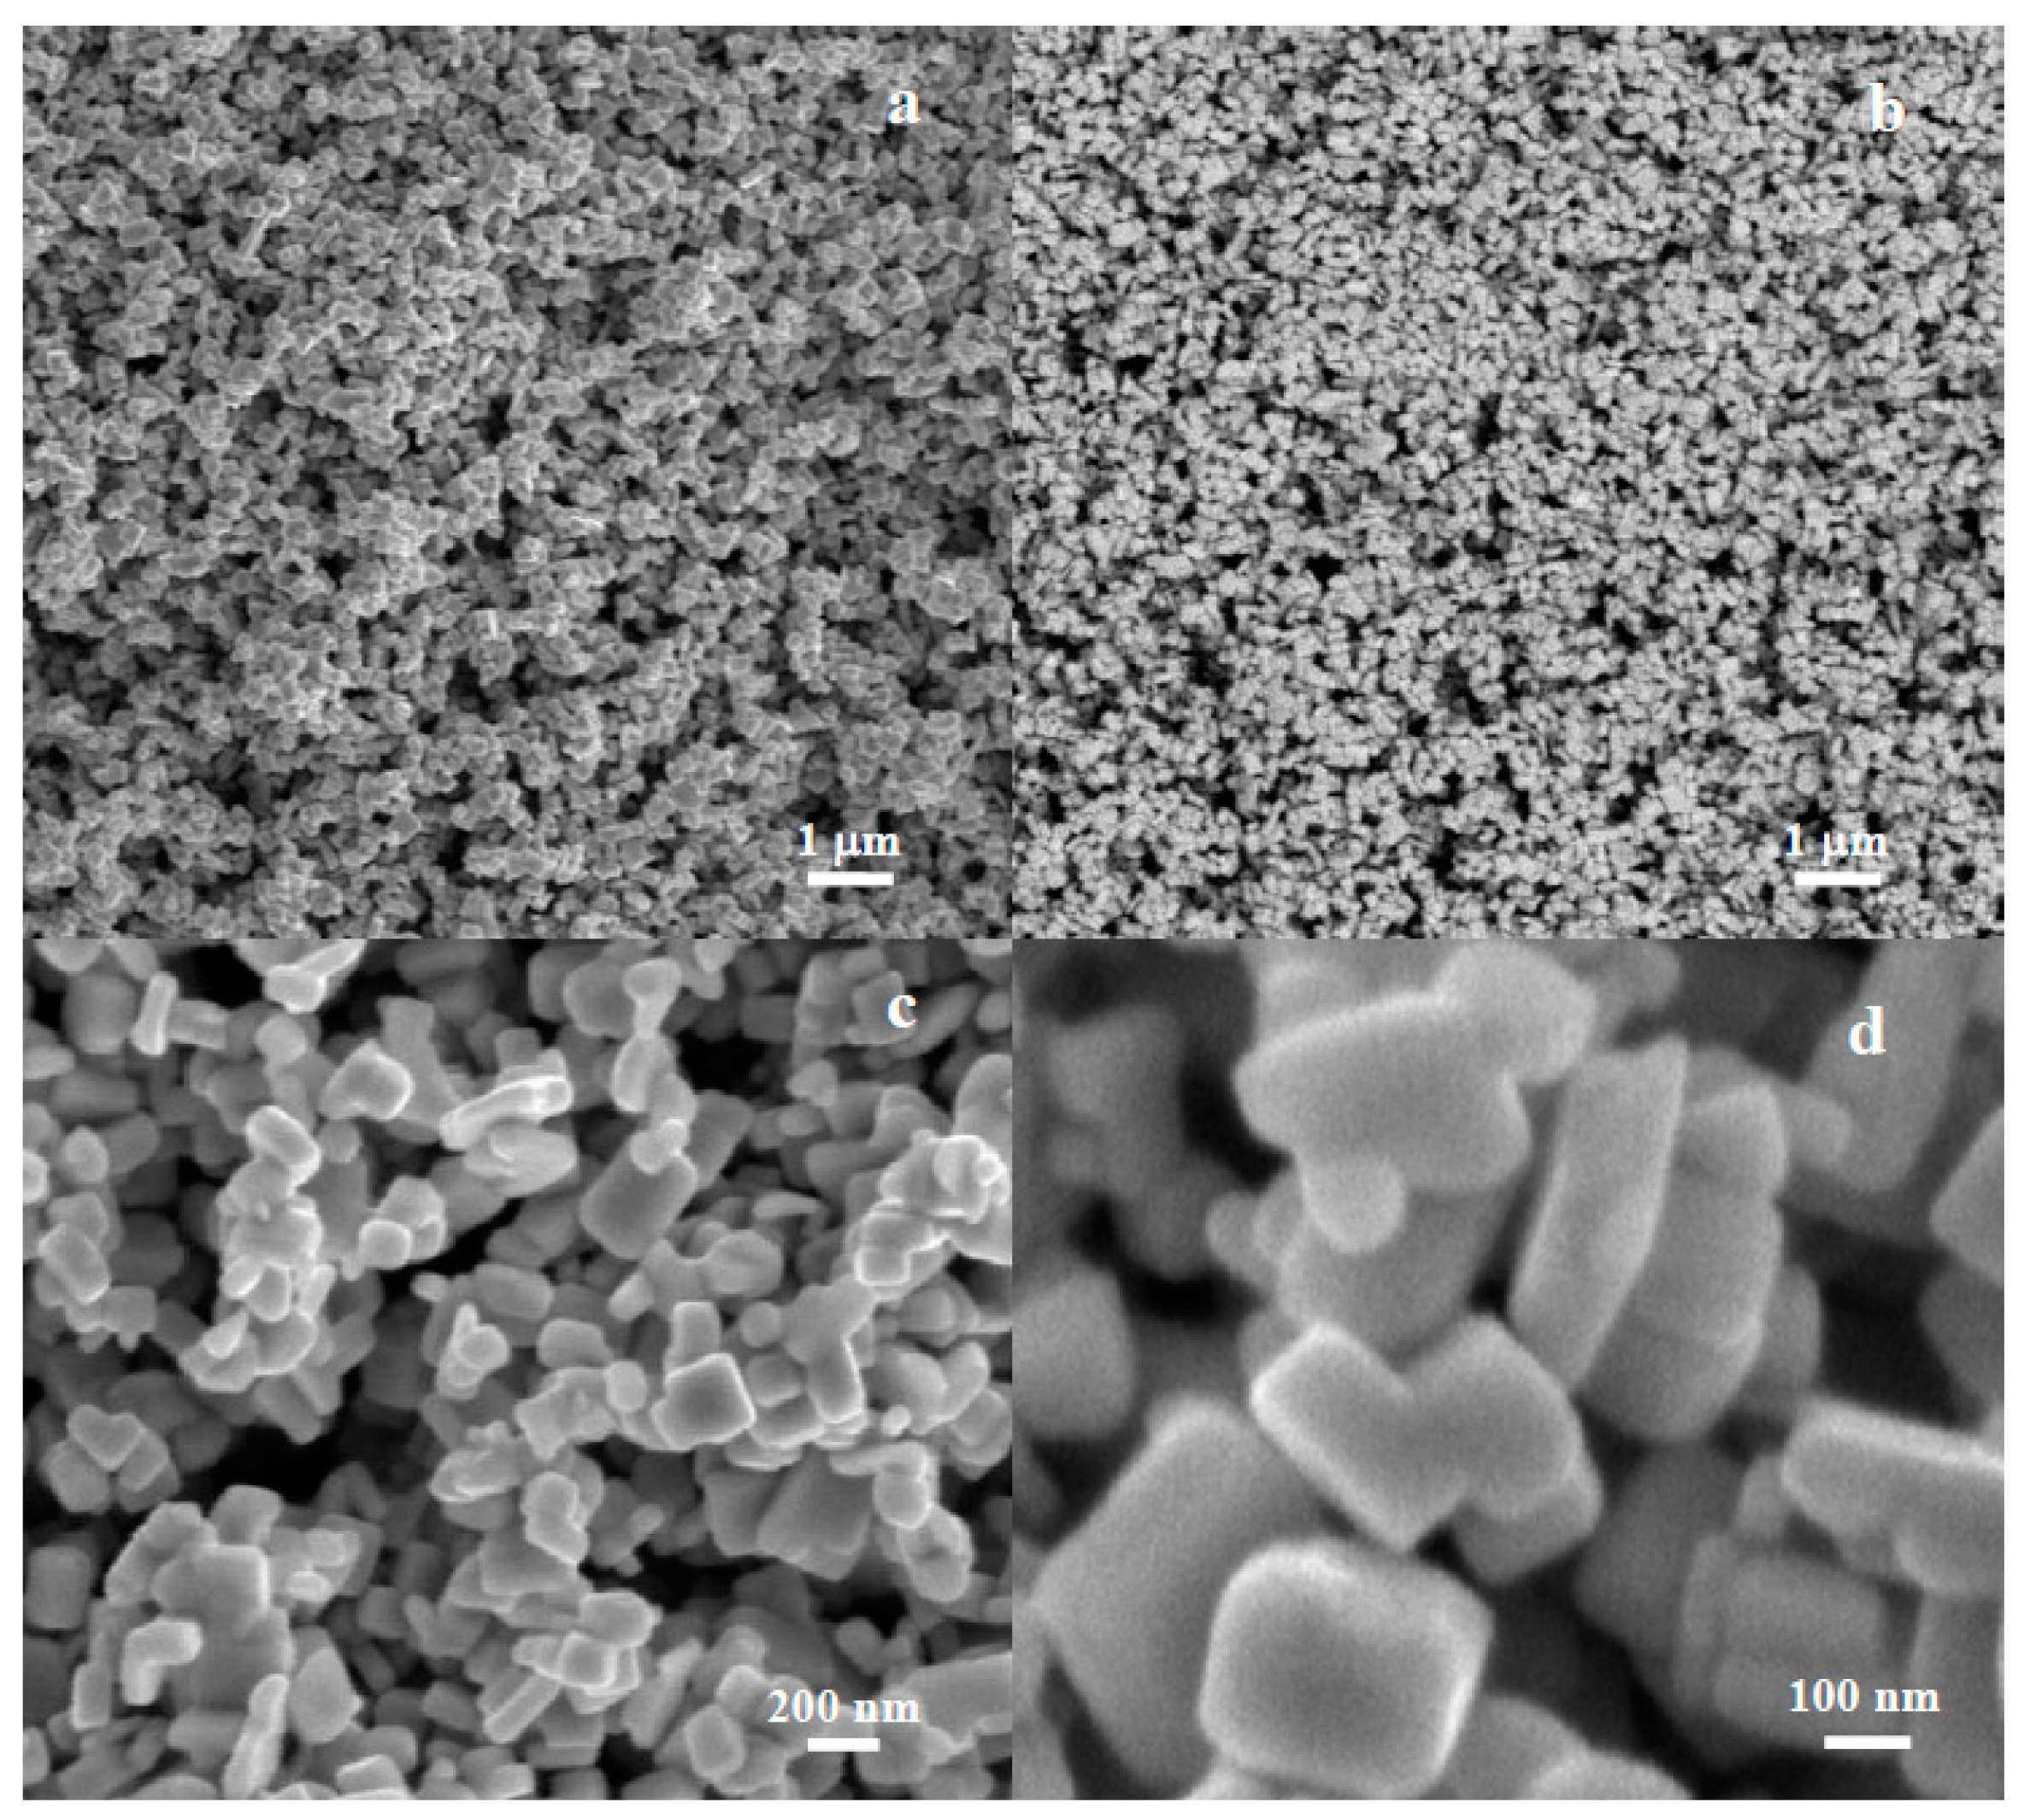
SEM Micrographs
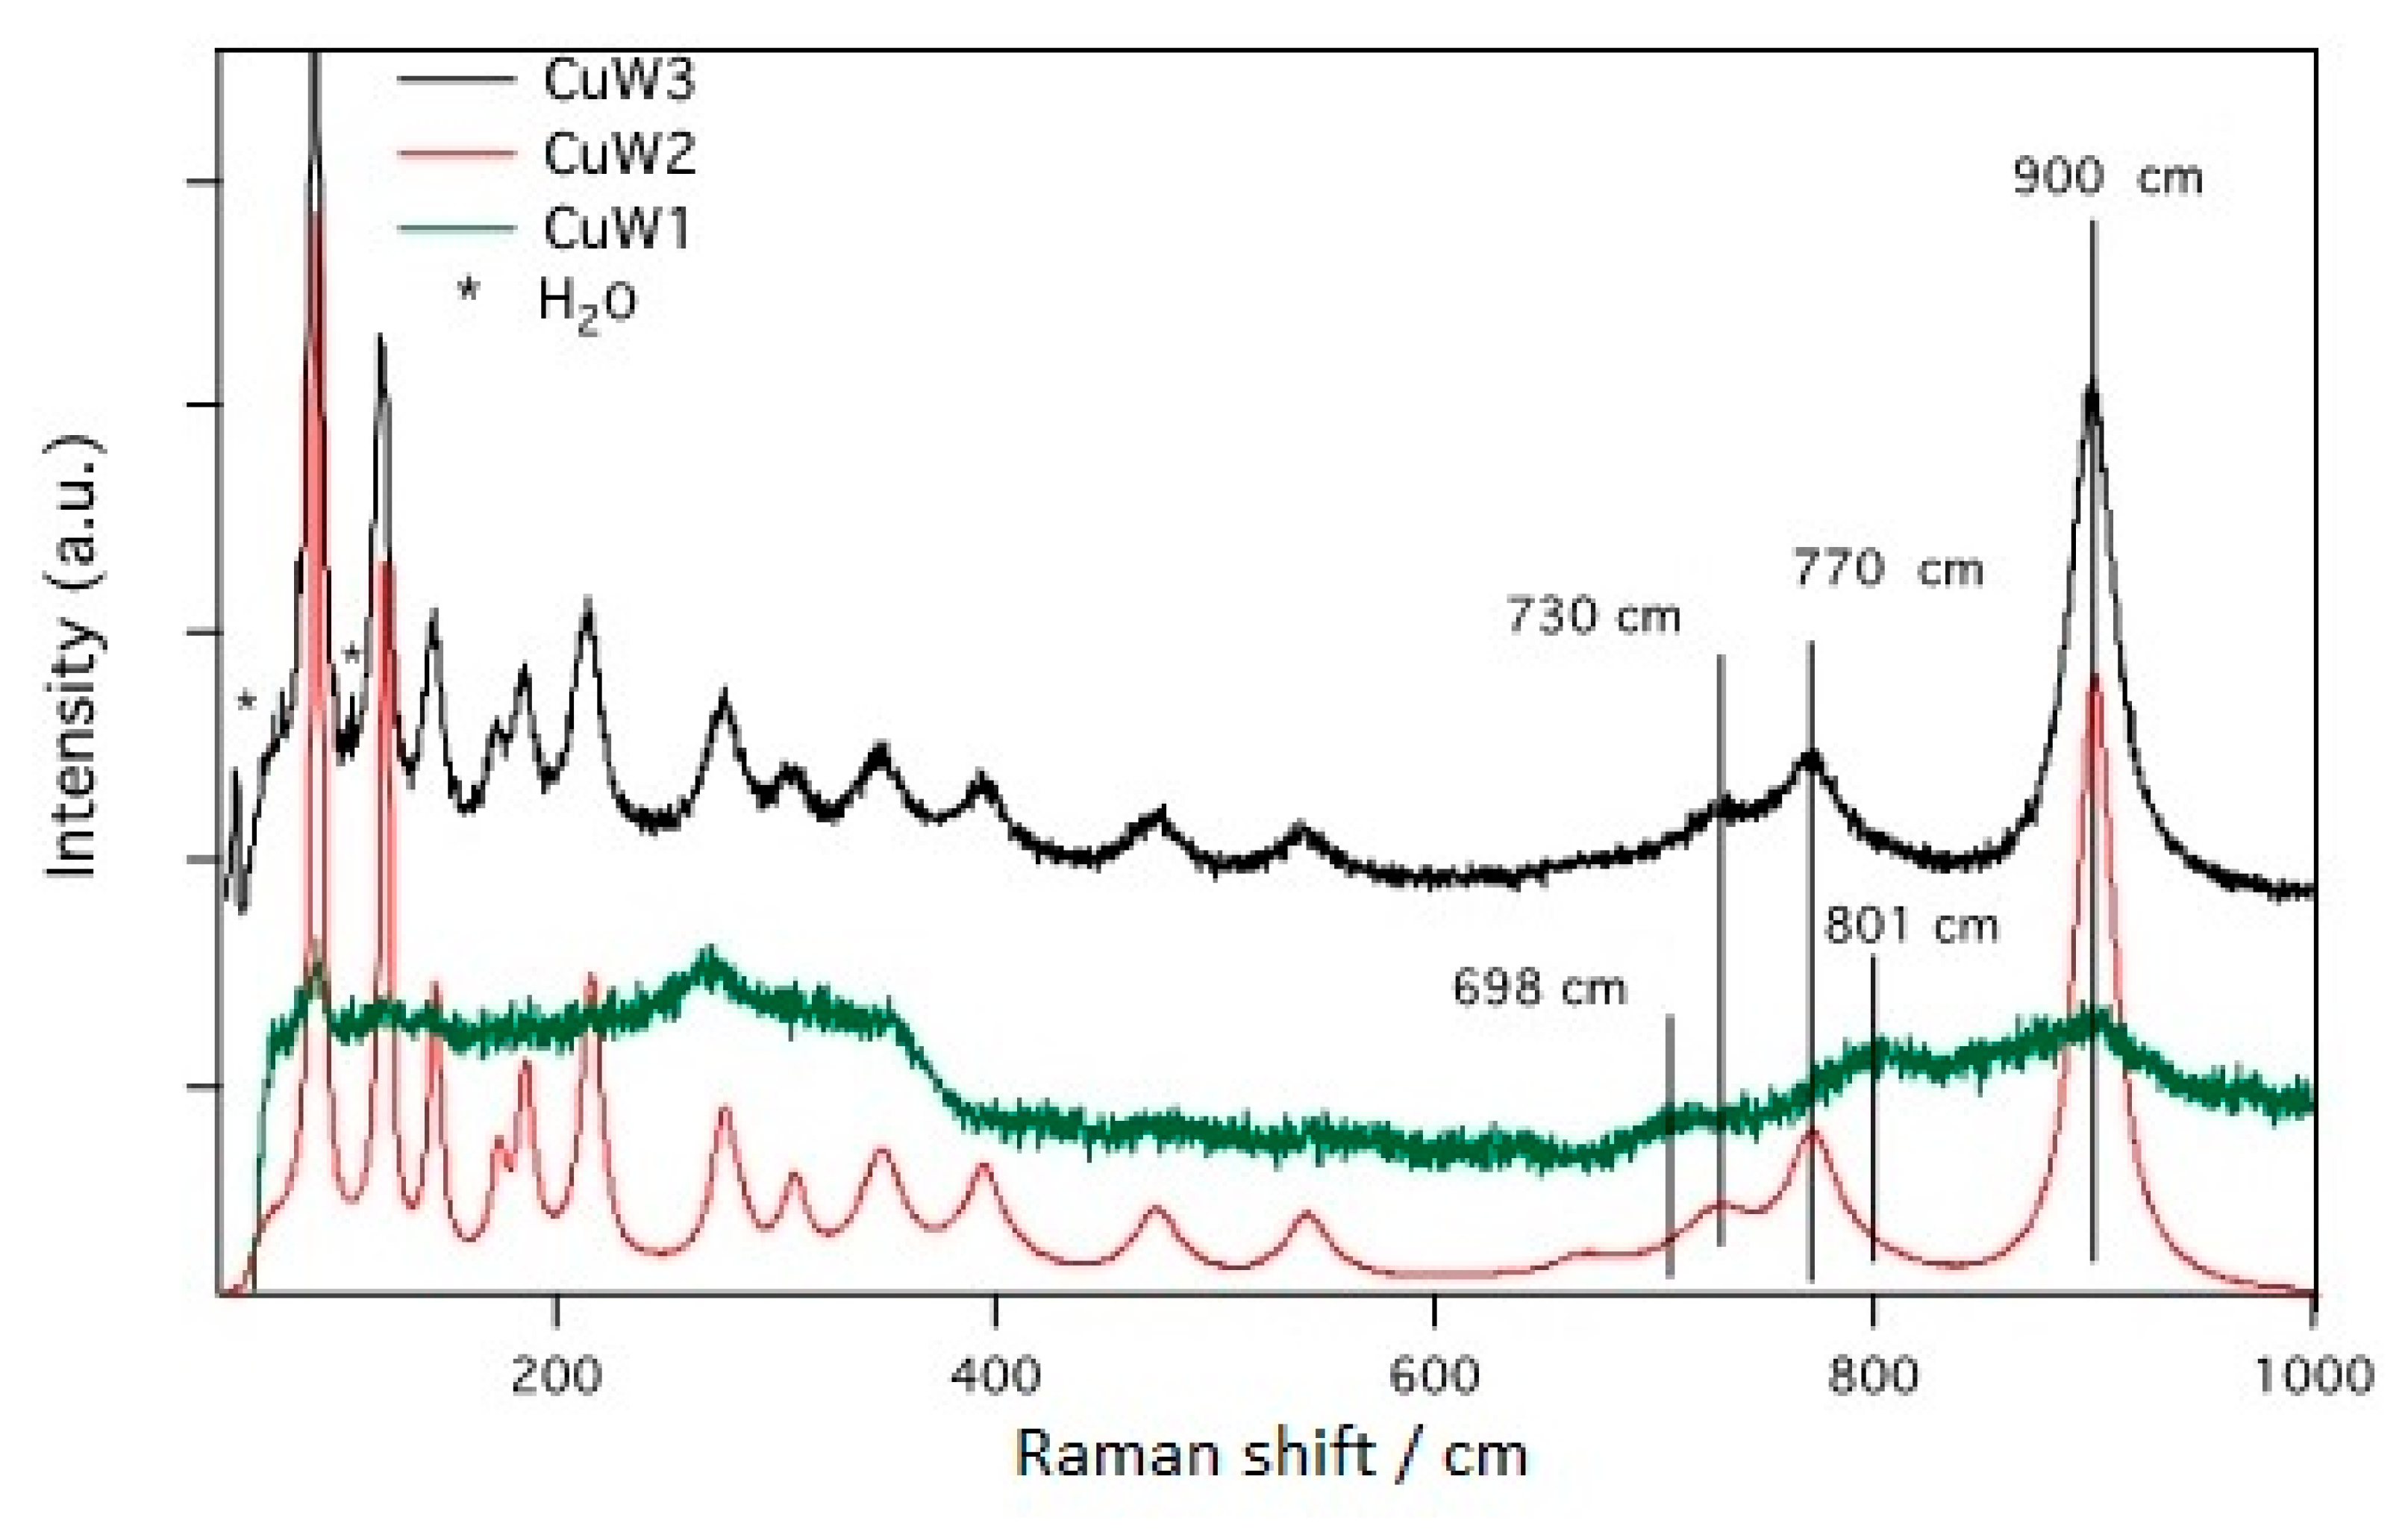
Raman Micro-Spectroscopy
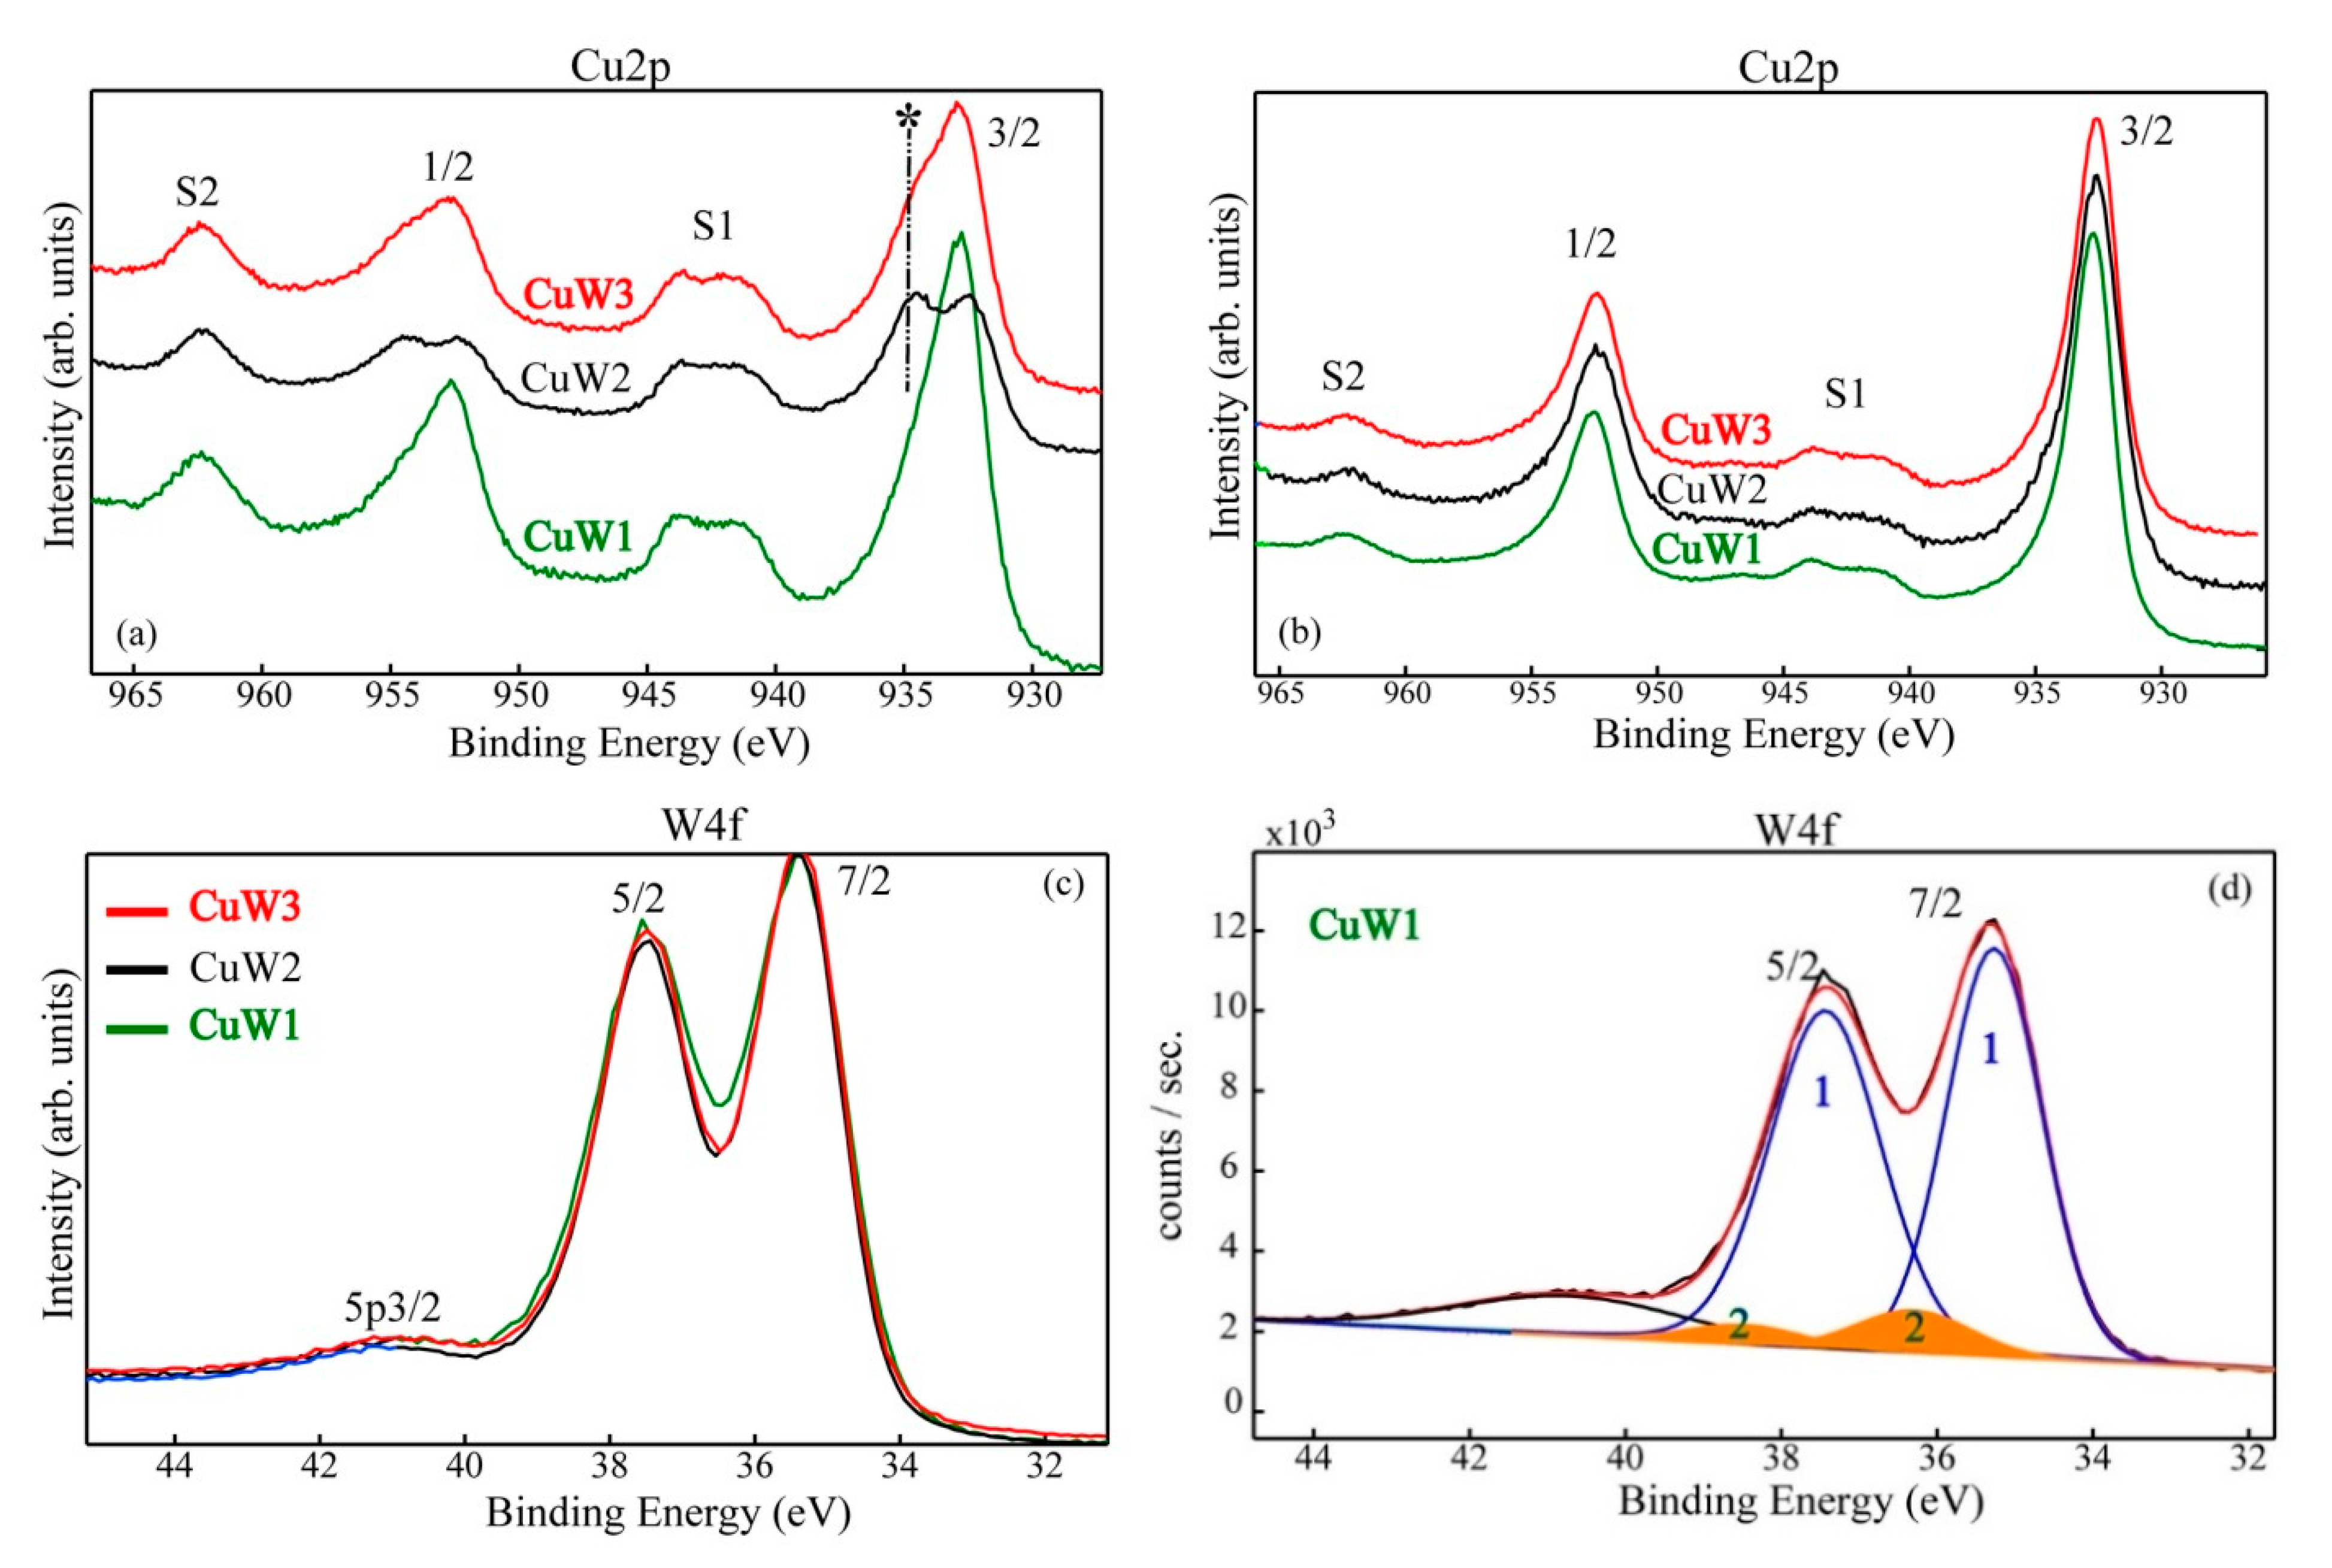
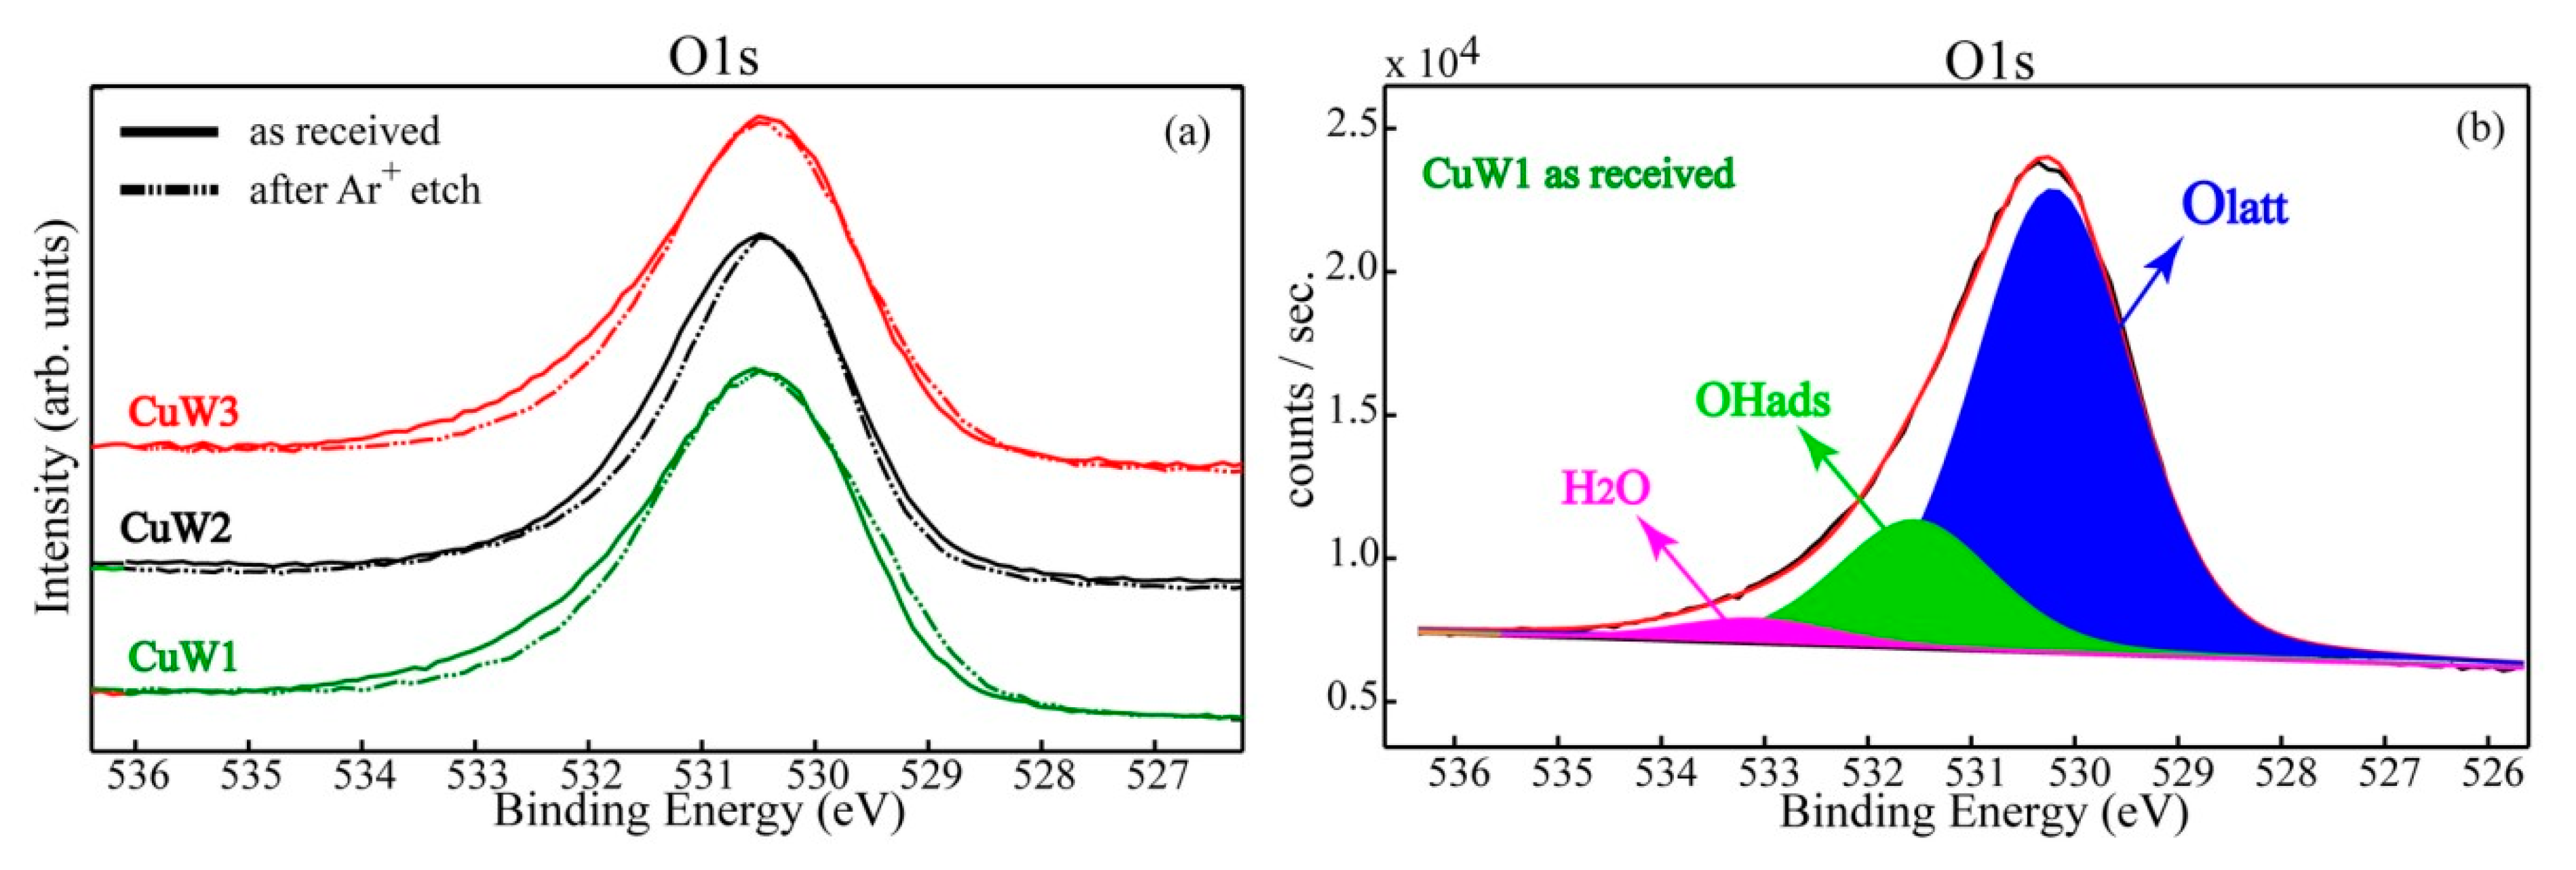
Surface Chemistry Assessment
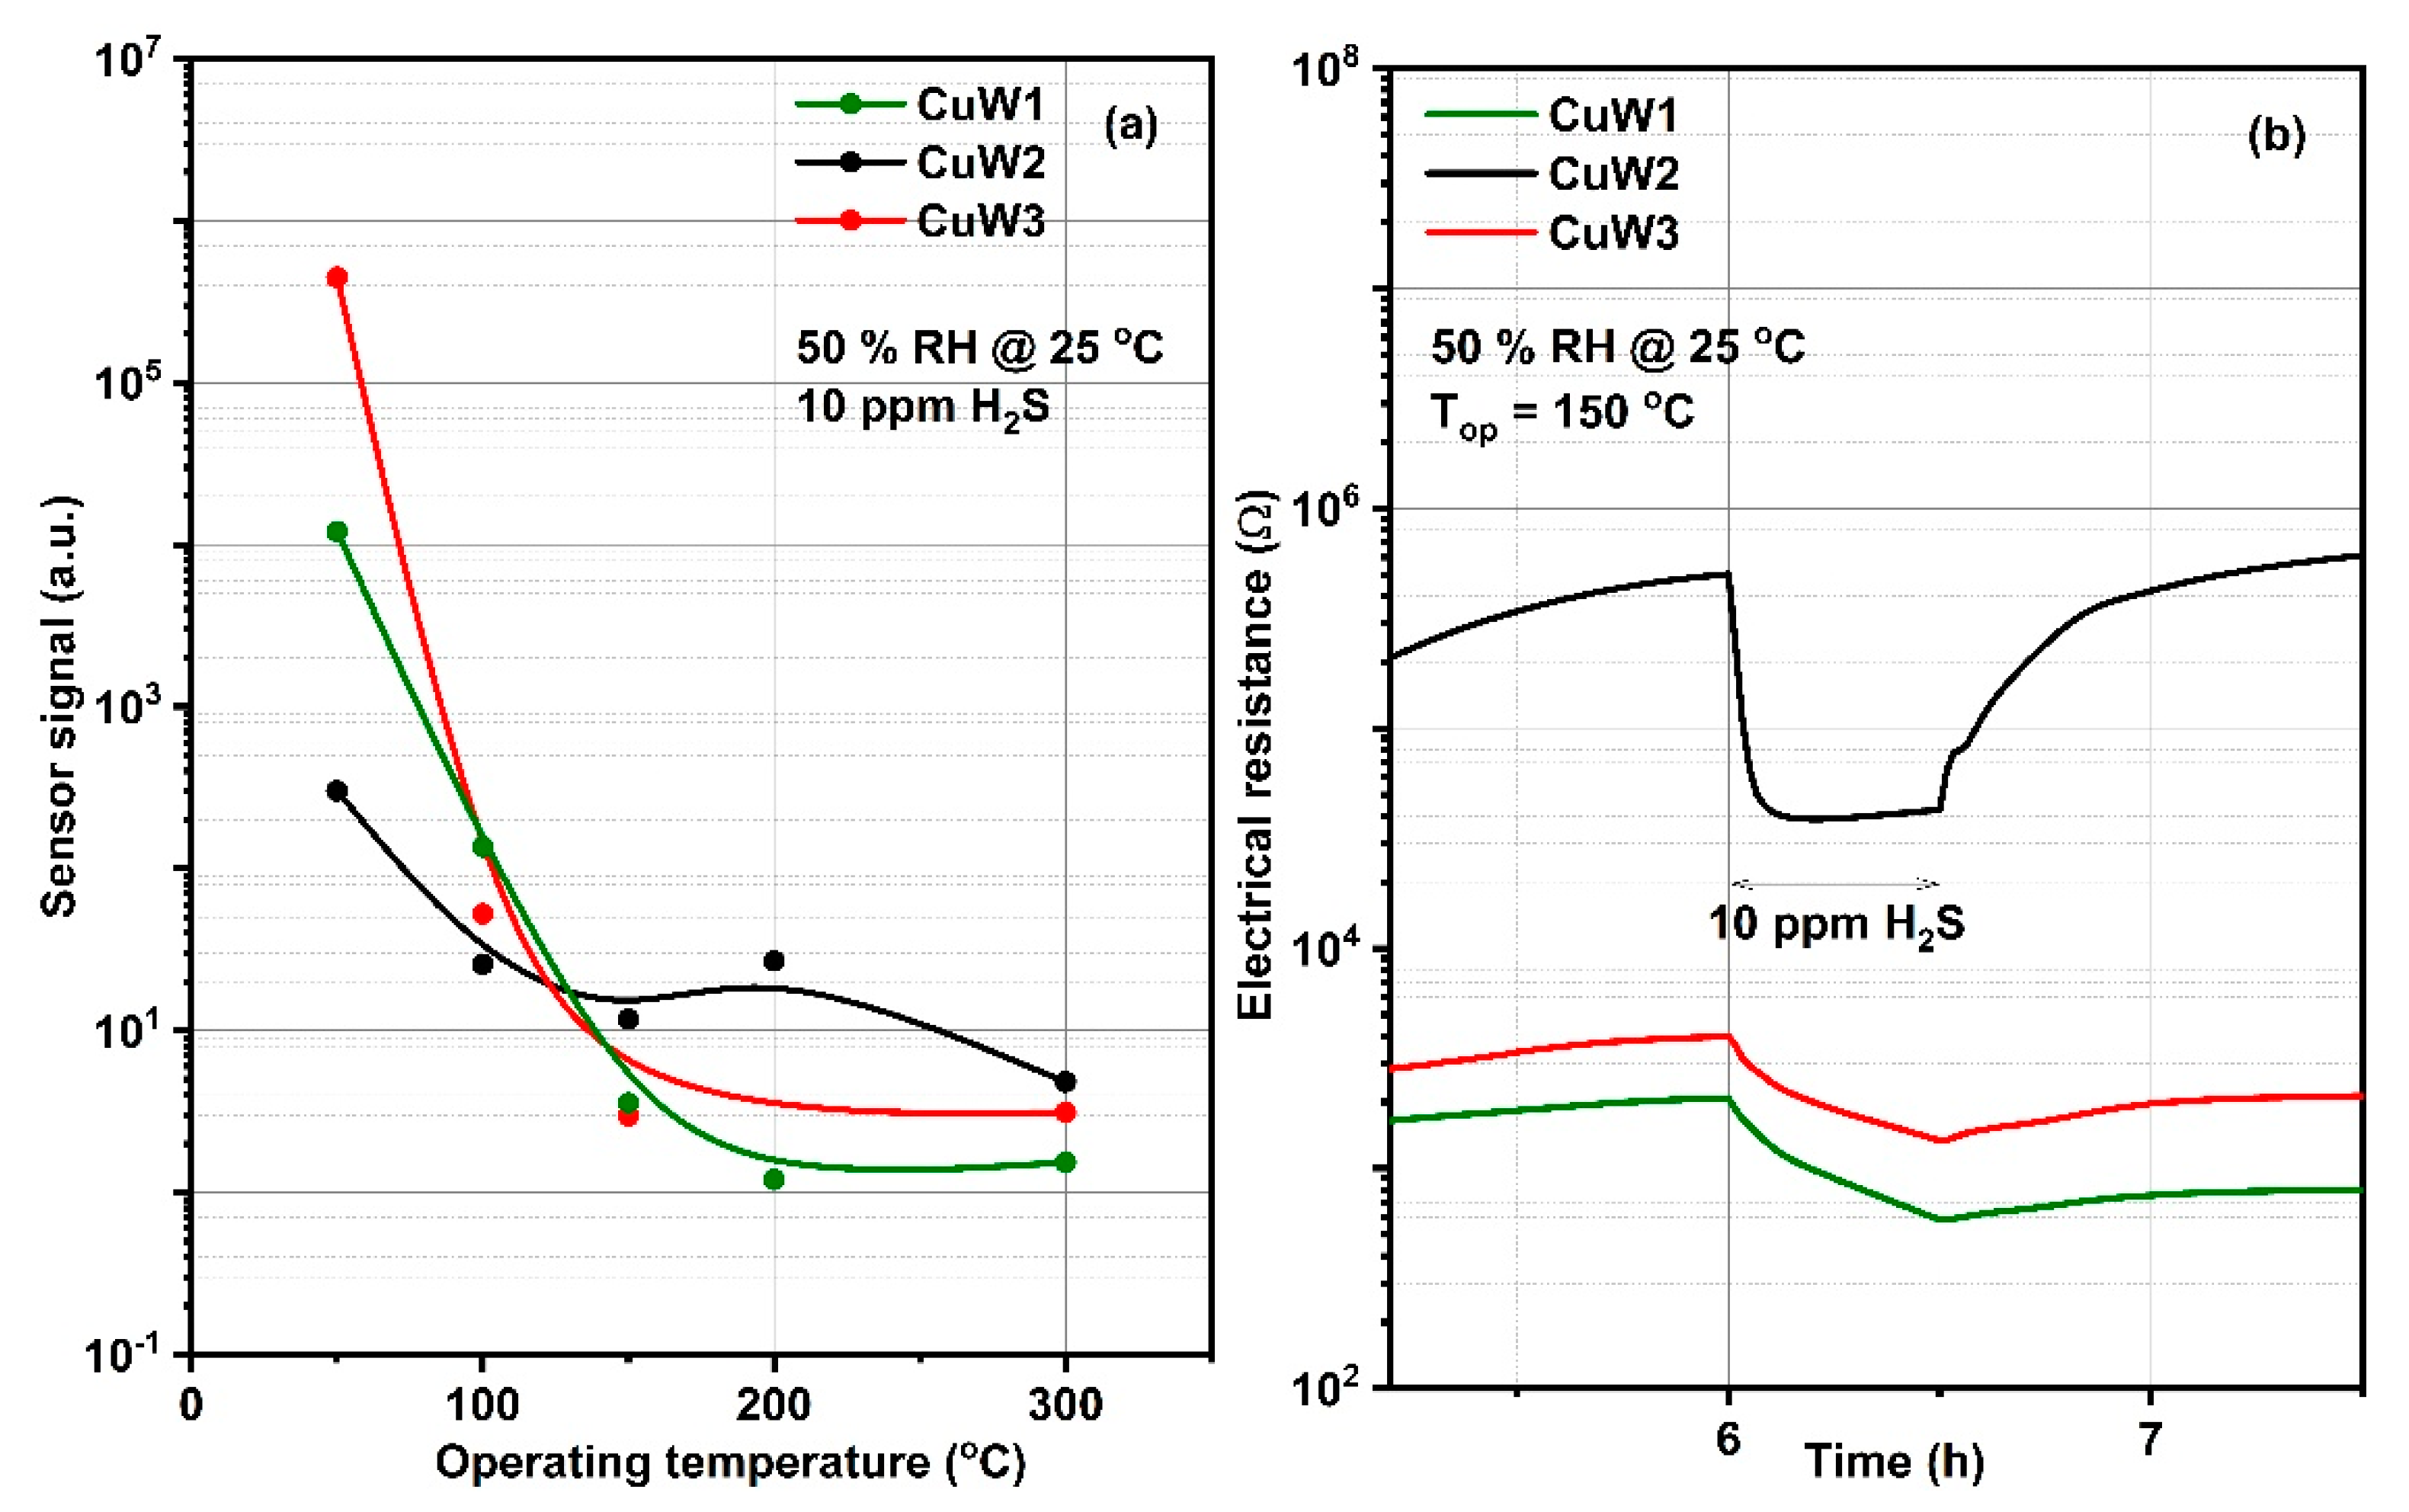
3.2. Gas Sensing Properties
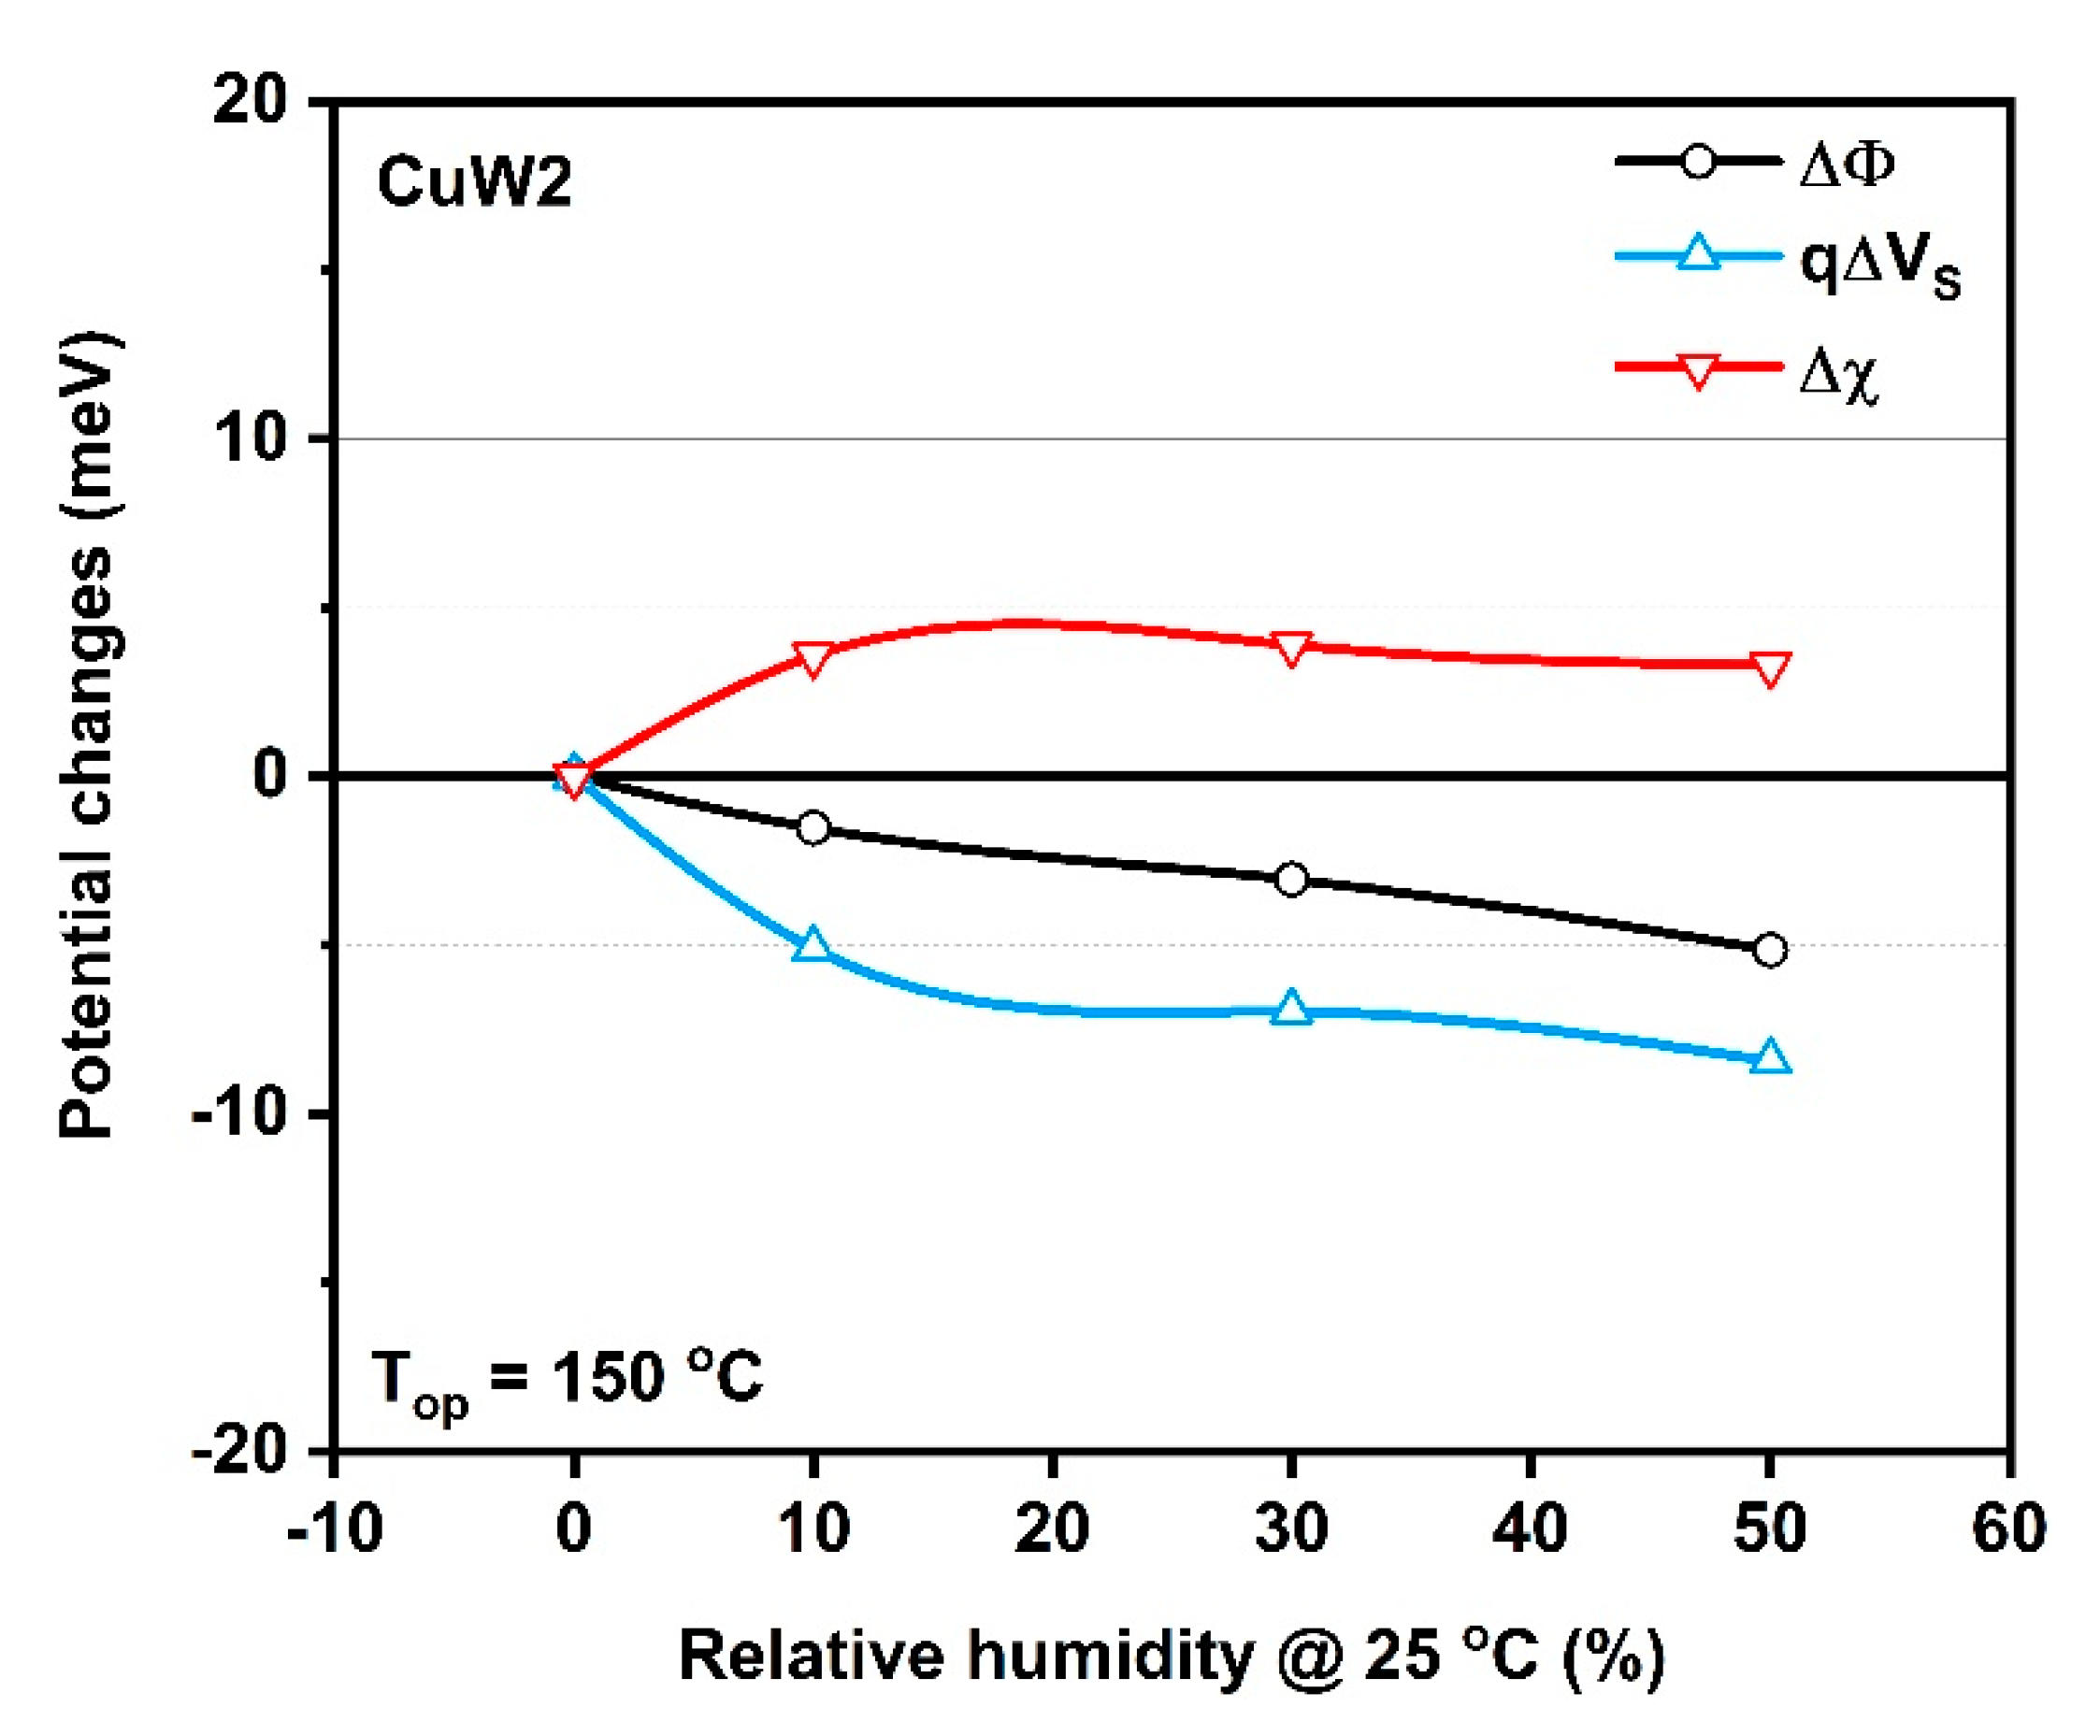
3.3. Theoretical Approach
4. Conclusions
Author Contributions
Funding
Institutional Review Board Statement
Informed Consent Statement
Data Availability Statement
Conflicts of Interest
References
- Olson, K.R. A Practical Look at the Chemistry and Biology of Hydrogen Sulfide. Antioxid. Redox Signal. 2012, 17, 32–44. [Google Scholar] [CrossRef] [PubMed] [Green Version]
- Qiao, X.; Xu, Y.; Yang, K.; Ma, J.; Li, C.; Wang, H.; Jia, L. Mo doped BiVO4 gas sensor with high sensitivity and selectivity towards H2S. Chem. Eng. J. 2020, 395, 125144. [Google Scholar] [CrossRef]
- Ji, H.; Zeng, W.; Li, Y. Gas sensing mechanisms of metal oxide semiconductors: A focus review. Nanoscale 2019, 11, 22664–22684. [Google Scholar] [CrossRef] [PubMed]
- Feng, S.; Farha, F.; Li, Q.; Wan, Y.; Xu, Y.; Zhang, T.; Ning, H. Review on Smart Gas Sensing Technology. Sensors 2019, 19, 3760. [Google Scholar] [CrossRef] [Green Version]
- Stanoiu, A.; Simion, C.E.; Calderon-Moreno, J.M.; Osiceanu, P.; Florea, M.; Teodorescu, V.S.; Somacescu, S. Sensors based on mesoporous SnO2 -CuWO4 with high selective sensitivity to H2S at low operating temperature. J. Hazard. Mater. 2017, 331, 150–160. [Google Scholar] [CrossRef]
- Catto, A.C.; Fiorido, T.; Souza, É.L.; Avansi, W.; Andres, J.; Aguir, K.; Longo, E.; Cavalcante, L.S.; Da Silva, L.F. Improving the ozone gas-sensing properties of CuWO4 nanoparticles. J. Alloy Compd. 2018, 748, 411–417. [Google Scholar] [CrossRef] [Green Version]
- Urasinska-Wojcik, B.; Vincent, T.; Gardner, J. H2S Sensing Properties of WO3 based Gas Sensor. Procedia Eng. 2016, 168, 255–258. [Google Scholar] [CrossRef]
- Wang, Y.; Liu, B.; Xiao, S.; Wang, X.; Sun, L.; Li, H.; Xie, W.; Li, Q.; Zhang, Q.; Wang, T. Low-Temperature H2S Detection with Hierarchical Cr-Doped WO3 Microspheres. ACS Appl. Mater. Interfaces 2016, 8, 9674–9683. [Google Scholar] [CrossRef]
- Llobet, E.; Brunet, J.; Pauly, A.; Ndiaye, A.; Varenne, C. Nanomaterials for the Selective Detection of Hydrogen Sulfide in Air. Sensors 2017, 17, 391. [Google Scholar] [CrossRef]
- Wang, Y.; Maity, A.; Sui, X.; Pu, H.; Mao, S.; Singh, N.K.; Chen, J. In Operando Impedance Spectroscopic Analysis on NiO-WO3 Nanorod Heterojunction Random Networks for Room-Temperature H2S Detection. ACS Omega 2018, 3, 18685–18693. [Google Scholar] [CrossRef] [Green Version]
- Ponzoni, A.; Baratto, C.; Cattabiani, N.; Falasconi, M.; Galstyan, V.; Núñez-Carmona, E.; Rigoni, F.; Sberveglieri, V.; ZambottI, G.; Zappa, D. Metal Oxide Gas Sensors, a Survey of Selectivity Issues Addressed at the SENSOR Lab, Brescia (Italy). Sensors 2017, 17, 714. [Google Scholar] [CrossRef] [PubMed] [Green Version]
- Verma, M.K.; Gupta, V. A highly sensitive SnO2–CuO multilayered sensor structure for detection of H2S gas. Sens. Actuators B Chem. 2012, 166, 378–385. [Google Scholar] [CrossRef]
- Li, Z.; Wang, N.; Wang, J.; Liu, W.; Sun, K.; Fu, Y.Q.; Wang, Z. Room-Temperature High-Performance H2S Sensor Based on Porous CuO Nanosheets Prepared by Hydrothermal Method. ACS Appl. Mater. Interfaces 2016, 8, 20962–20968. [Google Scholar] [CrossRef] [PubMed]
- Mirzaei, A.; Kim, S.S.; WooKimab, H. Resistance-based H2S gas sensors using metal oxide nanostructures: A review of recent advances. J. Hazard. Mater. 2018, 357, 314–331. [Google Scholar] [CrossRef] [PubMed]
- Li, D.; Qin, L.; Zhao, P.; Zhang, Y.; Liu, D.; Liu, F.; Kang, B.; Wang, Y.; Song, H.; Zhang, T.; et al. Preparation and gas-sensing performances of ZnO/CuO rough nanotubular arrays for low-working temperature H2S detection. Sens. Actuators B Chem. 2018, 254, 834–841. [Google Scholar] [CrossRef]
- Diao, K.; Zhou, M.; Zhang, J.; Tang, Y.; Wang, S.; Cui, X. High response to H2S gas with facile synthesized hierarchical ZnO microstructures. Sens. Actuators B Chem. 2015, 219, 30–37. [Google Scholar] [CrossRef]
- Li, Z.; Huang, Y.; Zhang, S.; Chen, W.; Kuang, Z.; Ao, D.; Liu, W.; Fu, Y.Q. A fast response & recovery H2S gas sensor based on α-Fe2O3 nanoparticles with ppb level detection limit. J. Hazard. Mater. 2015, 300, 167–174. [Google Scholar] [CrossRef]
- Yang, S.; Song, Z.; Gao, N.; Hu, Z.; Zhou, L.; Liu, J.; Zhang, B.; Zhang, G.; Jiang, S.; Li, H.-Y.; et al. Near room temperature operable H2S sensors based on In2O3 colloidal quantum dots. Sens. Actuators B Chem. 2019, 286, 22–31. [Google Scholar] [CrossRef]
- Hosseini, Z.; Zad, A.I.; MortezaAli, A. Room temperature H2S gas sensor based on rather aligned ZnO nanorods with flower-like structures. Sens. Actuators B Chem. 2015, 207, 865–871. [Google Scholar] [CrossRef]
- Vuong, N.M.; Kima, D.; Kim, H. Porous Au-embedded WO3 Nanowire Structure for Efficient Detection of CH4 and H2S. Sci. Rep. 2015, 5, srep11040. [Google Scholar] [CrossRef] [Green Version]
- Simion, C.E.; Somacescu, S.; Teodorescu, V.S.; Osiceanu, P.; Stanoiu, A. H2S sensing mechanism of SnO2-CuWO4 operated under pulsed temperature modulation. Sens. Actuators B Chem. 2018, 259, 258–268. [Google Scholar] [CrossRef]
- Pokhrel, S.; Nagaraja, K. Electrical and humidity sensing properties of Chromium(III) oxide–tungsten(VI) oxide composites. Sens. Actuators B Chem. 2003, 92, 144–150. [Google Scholar] [CrossRef]
- Nartowski, A.; Atkinson, A. Sol-Gel Synthesis of Sub-Micron Titanium-Doped Chromia Powders for Gas Sensing. J. Sol-Gel Sci. Technol. 2003, 26, 793–797. [Google Scholar] [CrossRef]
- Jayaraman, V.; Gnanasekar, K.; Prabhu, E.; Gnanasekaran, T.; Periaswami, G. Preparation and characterisation of Cr2−xTixO3+δ and its sensor properties. Sens. Actuators B Chem. 1999, 55, 175–179. [Google Scholar] [CrossRef]
- Somacescu, S.; Ghica, C.; Simion, C.E.; Kuncser, A.C.; Vlaicu, A.M.; Stefan, M.; Ghica, D.; Florea, O.G.; Mercioniu, I.; Stanoiu, A. Nanoclustered Pd decorated nanocrystalline Zn doped SnO2 for ppb NO2 detection at low temperature. Sens. Actuators B Chem. 2019, 294, 148–156. [Google Scholar] [CrossRef]
- Naumkin, A.V.; Kraut-Vass, A.; Gaarenstroom, S.W.; Powell, C.J. NIST X-ray Photoelectron Spectroscopy Database; NIST Standard Reference Database 20 Version 4.1; NIST: Gaithersburg, MD, USA, 2012. [Google Scholar] [CrossRef]
- Chen, H.; Xu, Y. Photocatalytic organic degradation over W-rich and Cu-rich CuWO4 under UV and visible light. RSC Adv. 2014, 5, 8108–8113. [Google Scholar] [CrossRef]
- Schmitt, P.; Brem, N.; Schunk, S.; Feldmann, C. Polyol-Mediated Synthesis and Properties of Nanoscale Molybdates/Tungstates: Color, Luminescence, Catalysis. Adv. Funct. Mater. 2011, 21, 3037–3046. [Google Scholar] [CrossRef]
- Kumar, R.D.; Karuppuchamy, S. Microwave-assisted synthesis of copper tungstate nanopowder for supercapacitor applications. Ceram. Int. 2014, 40, 12397–12402. [Google Scholar] [CrossRef]
- Souza, E.; Sczancoski, J.; Nogueira, I.; Almeida, M.; Orlandi, M.; Li, M.; Luz, R.; Filho, M.; Longo, E.; Cavalcante, L.S. Structural evolution, growth mechanism and photoluminescence properties of CuWO4 nanocrystals. Ultrason. Sonochemistry 2017, 38, 256–270. [Google Scholar] [CrossRef] [Green Version]
- Ihokura, K.; Watson, J. The Stannic Oxide Gas Sensor—Principles and Applications; CRC-Press: Boca Raton, FL, USA, 1994; ISBN 0-8493-2604-4. [Google Scholar] [CrossRef]
- Gentry, S.; Jones, T. A comparison of metal oxide semiconductor and catalytic gas sensors. Sens. Actuators 1983, 4, 581–586. [Google Scholar] [CrossRef]
- Sahm, T.; Gurlo, A.; Barsan, N.; Weimar, U.; Mädler, L. Fundamental studies on SnO2 by means of simultaneous work function change and conduction measurements. Thin Solid Films 2005, 490, 43–47. [Google Scholar] [CrossRef]
- Gurlo, A. Interplay between O2 and SnO2: Oxygen Ionosorption and Spectroscopic Evidence for Adsorbed Oxygen. ChemPhysChem 2006, 7, 2041–2052. [Google Scholar] [CrossRef] [PubMed]
- Lin, H.-M.; Hsu, C.-M.; Yang, H.-Y.; Lee, P.-Y.; Yang, C.-C. Nanocrystalline WO3-based H2S sensors. Sens. Actuators B Chem. 1994, 22, 63–68. [Google Scholar] [CrossRef]
- Singh, S.; Dogra, N.; Sharma, S. A sensitive H2S sensor using MoS2/WO3 composite. Mater. Today Proc. 2020, 28, 8–10. [Google Scholar] [CrossRef]
- Ramgir, N.S.; Goyal, C.; Sharma, P.; Goutam, U.; Bhattacharya, S.; Datta, N.; Kaur, M.; Debnath, A.; Aswal, D.; Gupta, S. Selective H2S sensing characteristics of CuO modified WO3 thin films. Sens. Actuators B Chem. 2013, 188, 525–532. [Google Scholar] [CrossRef]
- Georgiadis, A.G.; Charisiou, N.D.; Goula, M.A. Removal of Hydrogen Sulfide From Various Industrial Gases: A Review of The Most Promising Adsorbing Materials. Catalysts 2020, 10, 521. [Google Scholar] [CrossRef]
- Coppola, G.; Papurello, D. Biogas Cleaning: Activated Carbon Regeneration for H2S Removal. Clean Technol. 2018, 1, 40–57. [Google Scholar] [CrossRef] [Green Version]
- Ionescu, R.; Moise, C.; Vancu, A. Are modulations of the Schottky surface barrier the only explanation for the gas-sensing effects in sintered SnO2? Appl. Surf. Sci. 1995, 84, 291–297. [Google Scholar] [CrossRef]
- Monroy, J.; Lilienthal, A.J.; Blanco, J.L.; Gonzalez-Jimenez, J.; Trincavelli, M.; Blanco, J.-L. Calibration of MOX gas sensors in open sampling systems based on Gaussian Processes. IEEE Sens. 2012, 10, 1–4. [Google Scholar] [CrossRef] [Green Version]
- Barsan, N.; Weimar, U. Conduction Model of Metal Oxide Gas Sensors. J. Electroceramics 2001, 7, 143–167. [Google Scholar] [CrossRef]
- Tamaki, J.; Zhang, Z.; Fujimori, K.; Akiyama, M.; Harada, T.; Miura, N.; Yamazoe, N. Grain-Size Effects in Tungsten Oxide-Based Sensor for Nitrogen Oxides. J. Electrochem. Soc. 1994, 141, 2207–2210. [Google Scholar] [CrossRef]
- Barsan, N.; Koziej, D.; Weimar, U. Metal oxide-based gas sensor research: How to? Sens. Actuators B Chem. 2007, 121, 18–35. [Google Scholar] [CrossRef]
- Madou, M.J.; Morrison, S.R. Chemical Sensing with Solid State Devices; Academic Press, Inc.: Cambridge, MA, USA, 1989; p. 27. [Google Scholar] [CrossRef]
- Bharati, R.; Shanker, R.; A Singh, R. Electrical transport properties of CuWO4. Pramana 1980, 14, 449–454. [Google Scholar] [CrossRef]
- Morrison, S.R. The Chemical Physics of Surfaces; Plenum Press: New York, NY, USA, 1977. [Google Scholar] [CrossRef]
- Yamazoe, N.; Shimanoe, K. Roles of Shape and Size of Component Crystals in Semiconductor Gas Sensors. J. Electrochem. Soc. 2008, 155, J85–J92. [Google Scholar] [CrossRef]
- Rebholz, J.; Bonanati, P.; Weimar, U.; Barsan, N. Grain shape influence on semiconducting metal oxide based gas sensor performance: Modeling versus experiment. Anal. Bioanal. Chem. 2013, 406, 3977–3983. [Google Scholar] [CrossRef]


| Crystal Size (nm) | Synthesis Method | Ref. |
|---|---|---|
| 38 | sonochemical | [27] |
| 43 | polyol | [28] |
| 44 | microwave irradiation | [29] |
| 80 | co-precipitation | CuW1 |
| 56 | co-precipitation | CuW2 |
| 84 | hydrothermal | CuW3 |
| Material | Synthesis Method | H2S Concentration | Additional Loading | Sensitivity @Temperature | Ref. |
|---|---|---|---|---|---|
| WO3 nanocrystalline | Hydrothermal | 100 ppm | Pt loaded | ~9.9@220 °C | [35] |
| MoS2/WO3 composite | Hydrothermal | 25 ppm | Unloaded | ~40%@350 °C | [36] |
| WO3 | Commercial | 5 ppm | Unloaded | ~4@350 °C | [7] |
| Cu doped WO3 | Hydrothermal | 10 ppm | 2.25 at% Cu loaded | ~534@300 °C | [37] |
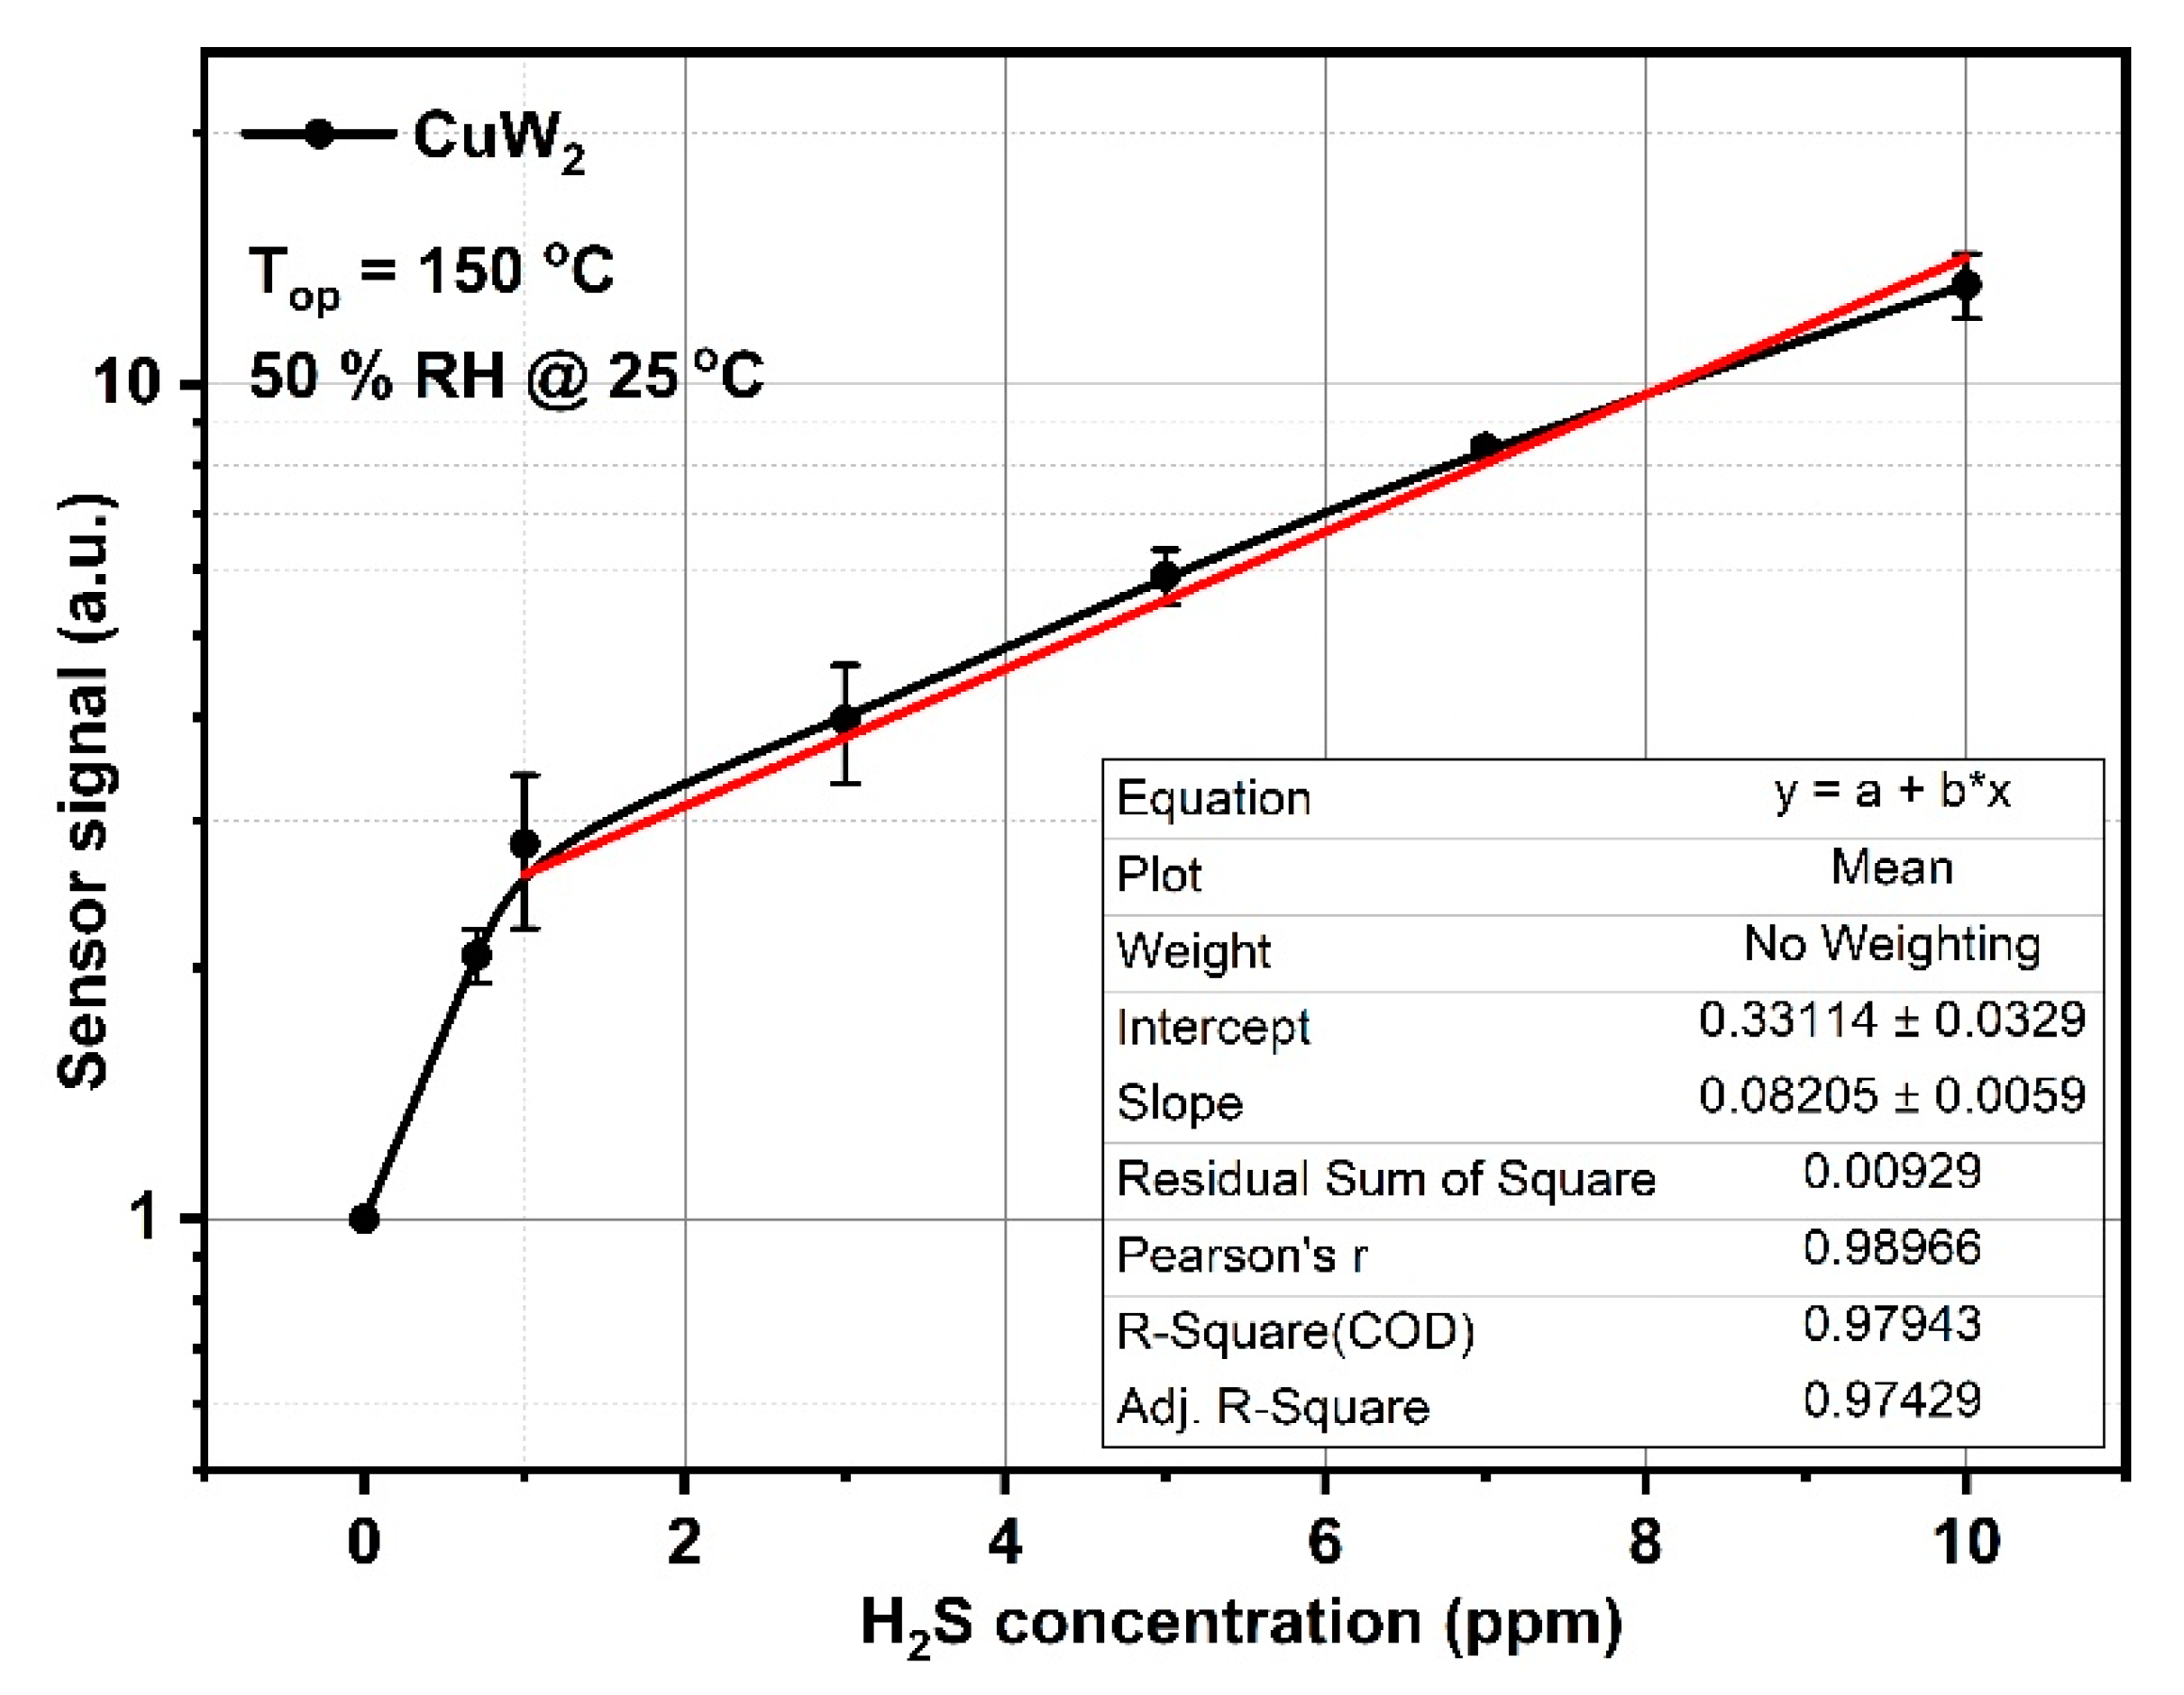
| CuW2 | Co-precipitation | 10 ppm | Unloaded | ~15@150 °C | This work |
| Temperature (°C) | CuW1 | CuW2 | CuW3 | |||
|---|---|---|---|---|---|---|
| τresponse (min.) | τrecovery (min.) | τresponse (min.) | τrecovery (min.) | τresponse (min.) | τrecovery (min.) | |
| 50 | 18 | >60 | <1 | >60 | 11 | >60 |
| 100 | 5 | >60 | <2 | >60 | 8 | >60 |
| 150 | 22 | >60 | <3 | 35 | 22 | >60 |
| Intrinsic Properties | CuW2 (Crystallite Sizes of 50 nm) |
|---|---|
| ; | |
Publisher’s Note: MDPI stays neutral with regard to jurisdictional claims in published maps and institutional affiliations. |
© 2021 by the authors. Licensee MDPI, Basel, Switzerland. This article is an open access article distributed under the terms and conditions of the Creative Commons Attribution (CC BY) license (http://creativecommons.org/licenses/by/4.0/).
Share and Cite
Somacescu, S.; Stanoiu, A.; Dinu, I.V.; Calderon-Moreno, J.M.; Florea, O.G.; Florea, M.; Osiceanu, P.; Simion, C.E. CuWO4 with CuO and Cu(OH)2 Native Surface Layers for H2S Detection under in-Field Conditions. Materials 2021, 14, 465. https://doi.org/10.3390/ma14020465
Somacescu S, Stanoiu A, Dinu IV, Calderon-Moreno JM, Florea OG, Florea M, Osiceanu P, Simion CE. CuWO4 with CuO and Cu(OH)2 Native Surface Layers for H2S Detection under in-Field Conditions. Materials. 2021; 14(2):465. https://doi.org/10.3390/ma14020465
Chicago/Turabian StyleSomacescu, Simona, Adelina Stanoiu, Ion Viorel Dinu, Jose Maria Calderon-Moreno, Ovidiu G. Florea, Mihaela Florea, Petre Osiceanu, and Cristian E. Simion. 2021. "CuWO4 with CuO and Cu(OH)2 Native Surface Layers for H2S Detection under in-Field Conditions" Materials 14, no. 2: 465. https://doi.org/10.3390/ma14020465