
Optical Properties of Transparent Rare-Earth Doped Sol-Gel Derived Nano-Glass Ceramics


National Institute of Materials Physics, 077125 Magurele, Romania
*
Author to whom correspondence should be addressed.
Materials 2021, 14(22), 6871; https://doi.org/10.3390/ma14226871
Submission received: 1 October 2021
/
Revised: 4 November 2021
/
Accepted: 9 November 2021
/
Published: 14 November 2021
(This article belongs to the Special Issue Optical Properties of Rare-Earth Doped Nanostructured Materials)
Abstract
:Rare-earth doped oxyfluoride glass ceramics represent a new generation of tailorable optical materials with high potential for optical-related applications such as optical amplifiers, optical waveguides, and white LEDs. Their key features are related to the high transparency and remarkable luminescence properties, while keeping the thermal and chemical advantages of oxide glasses. Sol-gel chemistry offers a flexible synthesis approach with several advantages, such as lower processing temperature, the ability to control the purity and homogeneity of the final materials on a molecular level, and the large compositional flexibility. The review will be focused on optical properties of sol-gel derived nano-glass ceramics related to the RE-doped luminescent nanocrystals (fluorides, chlorides, oxychlorides, etc.) such as photoluminescence, up-conversion luminescence, thermoluminescence and how these properties are influenced by their specific processing, mostly focusing on the findings from our group and similar ones in the literature, along with a discussion of perspectives, potential challenges, and future development directions.
1. Introduction
Glass ceramics are inorganic, non-metallic materials prepared by controlled crystallization of precursor glasses with at least one type of functional crystalline phase, that may vary from ppm to almost 100% is embedded in residual glass [1]. The basic requirements for optical transparency include: nanocrystals size smaller than the light wavelength, very close refractive index of amorphous and crystalline phases and low birefringency [1]. Transparent oxyfluoride nano-glass ceramics are produced by fluoride nanocrystals precipitation in a silica glass matrix during a controlled thermal processing. They have shown a high potential for applications in various devices (optical amplifiers, optical waveguides, white LEDs, etc.) since they combine the optical phenomena with optical transparency due to lack of scattering.
The conventional way to obtain glass ceramics is by melt-quenching (at around 1400 °C for oxy-fluoride glasses or a lower temperature in a controlled atmosphere for fluoride glasses) followed by crystallization of the precursor glass during a controlled annealing step throughout a heat-treatment at lower temperatures. Nucleation and growth of fluoride nanocrystals occurs in the glass matrix during heat treatment and rare earth ions can preferentially segregate into the fluoride nanocrystals. Hence, the partition of the optically active rare-earth (RE) ions into the precipitated fluoride nanocrystals can be obtained, with low phonon frequencies, but keeping good chemical and mechanical stability of the oxide glass (see the review of de Pablos-Martin et al. [2]). An alternative route is based on sol-gel chemistry, well known as a flexible approach to preparing various materials such as glass, ceramics, and organic-inorganic hybrids by using colloidal solutions (sol) as starting materials [3,4]. The glass ceramics’ synthesis by using the sol-gel method has several advantages such as lower processing temperature, the ability to control the purity and homogeneity of the final materials on a molecular level, and the large compositional flexibility which could be difficult to obtain via the melt-quenching technique. Most of the sol-gel derived oxyfluoride glass ceramic materials studied have a simple composition according to the formula: (100 − x) SiO2-xM1F2/M2F3/M1M2F4, where M1 and M2 are alkaline, alkaline-earth metals, or lanthanide elements, respectively [4].
This review is focused on luminescence properties of sol-gel derived nano-glass ceramics related to the RE-doped luminescent nanocrystals (fluorides, chlorides, oxychlorides, etc.) such as photoluminescence, up-conversion luminescence, thermoluminescence and how these properties are influenced by thermal processing, focusing on the findings from our group and similar ones in the literature of the past decade, along with a discussion of the future perspectives, potential challenges, and future development directions.
2. Sol-Gel Method for Glass Ceramic Synthesis
The pioneering contribution on sol-gel derived oxyfluoride glass ceramic preparation came from the first works of Fujihara et al. [5,6,7] performed in two steps: (i) preparation of a silica sol by using classic route with metal alkoxides (ii) followed by mixing with a second trifluoroacetates solution formed by trifluoroacetic (TFA) acid reaction with rare earth precursors (acetates). The liquid mixture is dried and aged at room temperature under sealed containers for several days or weeks. The nanocrystalline phase precipitation is obtained during subsequent calcination of dried xerogel matrix above the temperature required for thermal decomposition of corresponding trifluoracetates at around 300 °C:
RE(CF3COO)3 → REF3 + (CF3CO)2O + CO + CO2
Since then, the number of the publications on that topic has increased steadily and many compositions and crystalline phases have been studied using different Ln3+ ions as dopants to obtain enhanced linear and nonlinear optical processes for a wide application range.
2.1. Crystallization Mechanism
The first investigations of the crystallization processes of sol-gel derived glasses were done by Fujihara et al., with MgF2 thin films synthesis from trifluoracetic acid (TFA) and Mg-ethoxide (Mg(OC2H5)2 as precursors. It was assumed that the Mg2+ ions released during the thermal decomposition of the Mg(OC2H5)2 complexes form the xerogel and react with thermally activated fluorine in CF3COO− ions to form MgF2 crystals [7].
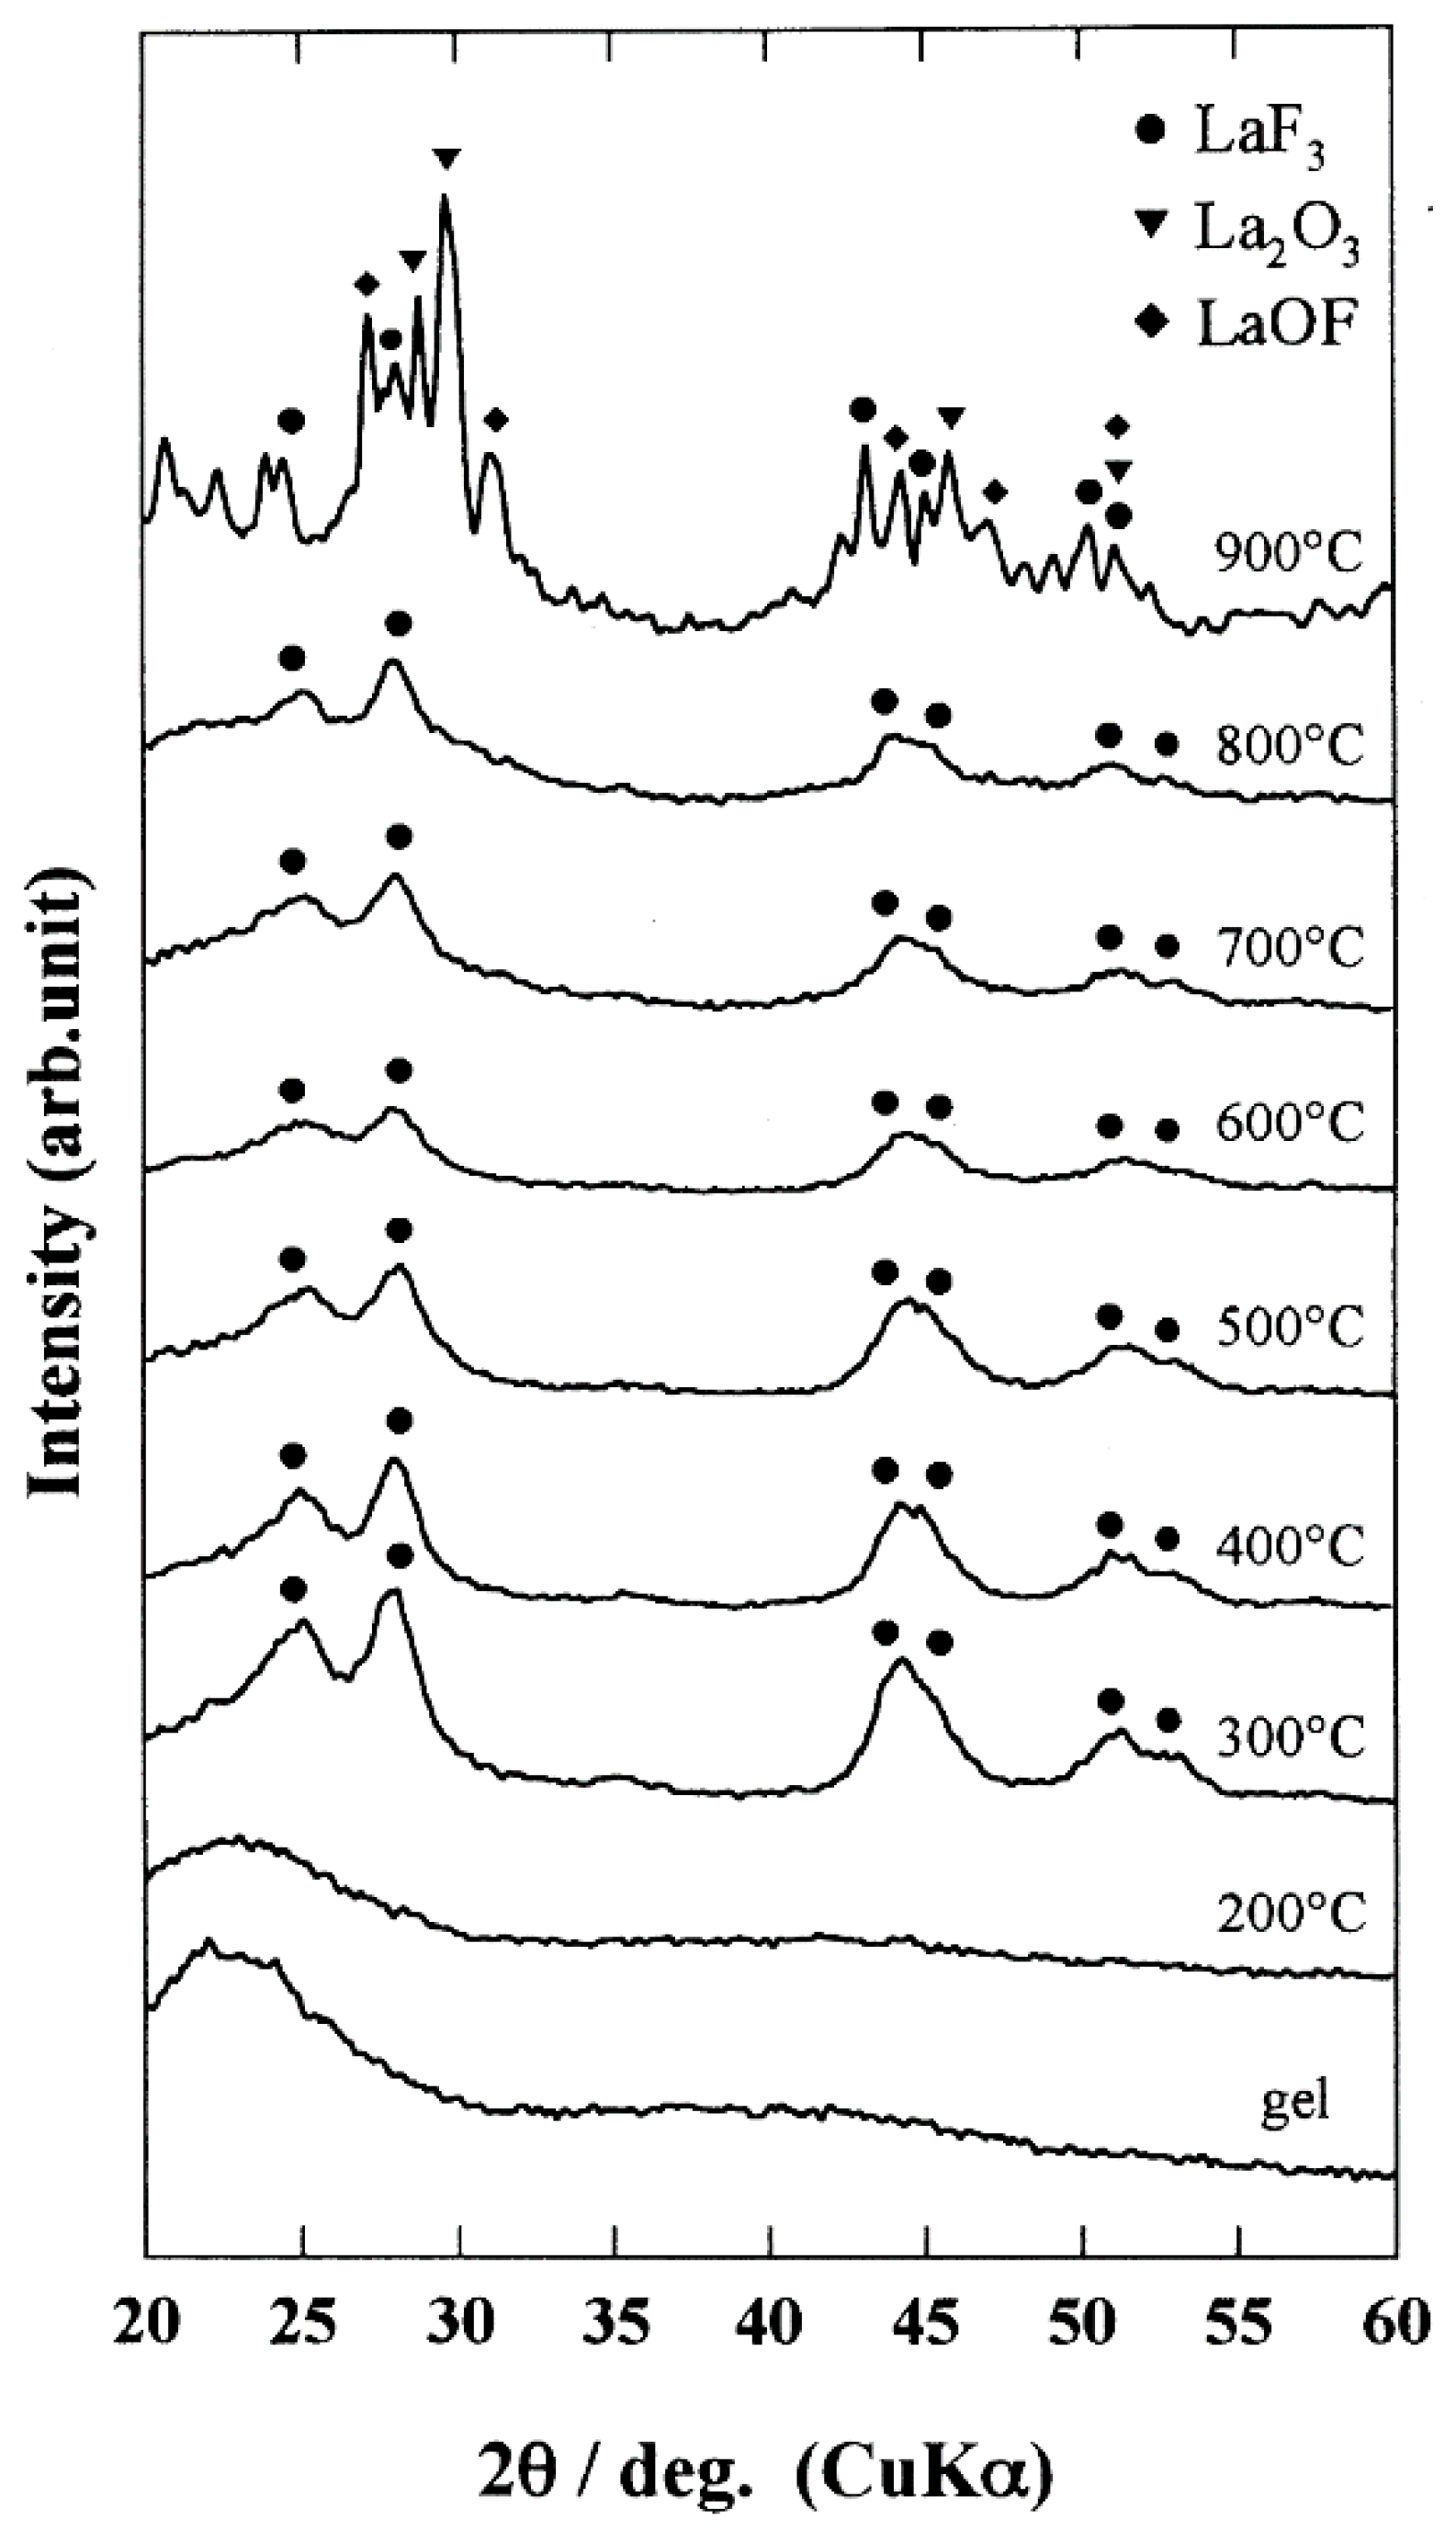
The investigations of the SiO2–LaF3 sol gel system evolution during the heat treatment by using Fourier transform infrared spectroscopy (FTIR) analysis indicated decomposition of trifluoroacetic acid (TFA), used as a fluorine precursor, together with the formation of fluoride lattice bonding [5,6] (Figure 1). The formation of LaF3 nanocrystals (of about 10 ± 30 nm in size after calcination above 300 °C of the precursor silica xerogel) was assigned to the screening effect of the CF3COO− ions coordinating the La3+ ions that prevented the La3+ ions incorporation into the SiO2 matrix [5]. The smallness of the LaF3 nanocrystals (tens of nm size) even for higher temperatures calcination was assigned to the low nanocrystals growth rate because of the uniform distribution of the nanocrystals [5]. For higher annealing temperatures above 800 °C, the formation of LaF3, La2O3, and LaOF nanocrystals was observed [5].
Later on, the studies of the crystallization kinetics of sol gel-derived glasses were extended by using multiple techniques (structural, magnetic, optical), which indicated a decomposition chemical reaction accompanied by the precipitation of nanocrystals, and not a diffusion-controlled nucleation and growing process, as in the melt-quenched glasses [6,7,8,9,10]. For longer treatment times, the loss of crystal structure and a partial/total dissolution of crystals in the glass matrix was observed. Higher annealing temperature does not result in better crystallinity or bigger nanocrystals but for even higher temperatures (1000 °C) the Si–O–Si network is heavily destroyed due to precipitation of the SiO2 crystalline phase, so the nano-crystals size grow quickly [11]. It was shown that the nanocrystal growth process in the glass matrix is strongly influenced by the ionic environment and ionic impurities incorporated during the growth process, and energy dispersive X-ray (EDX) analysis indicated the presence of oxygen ions in the nanocrystals [12].
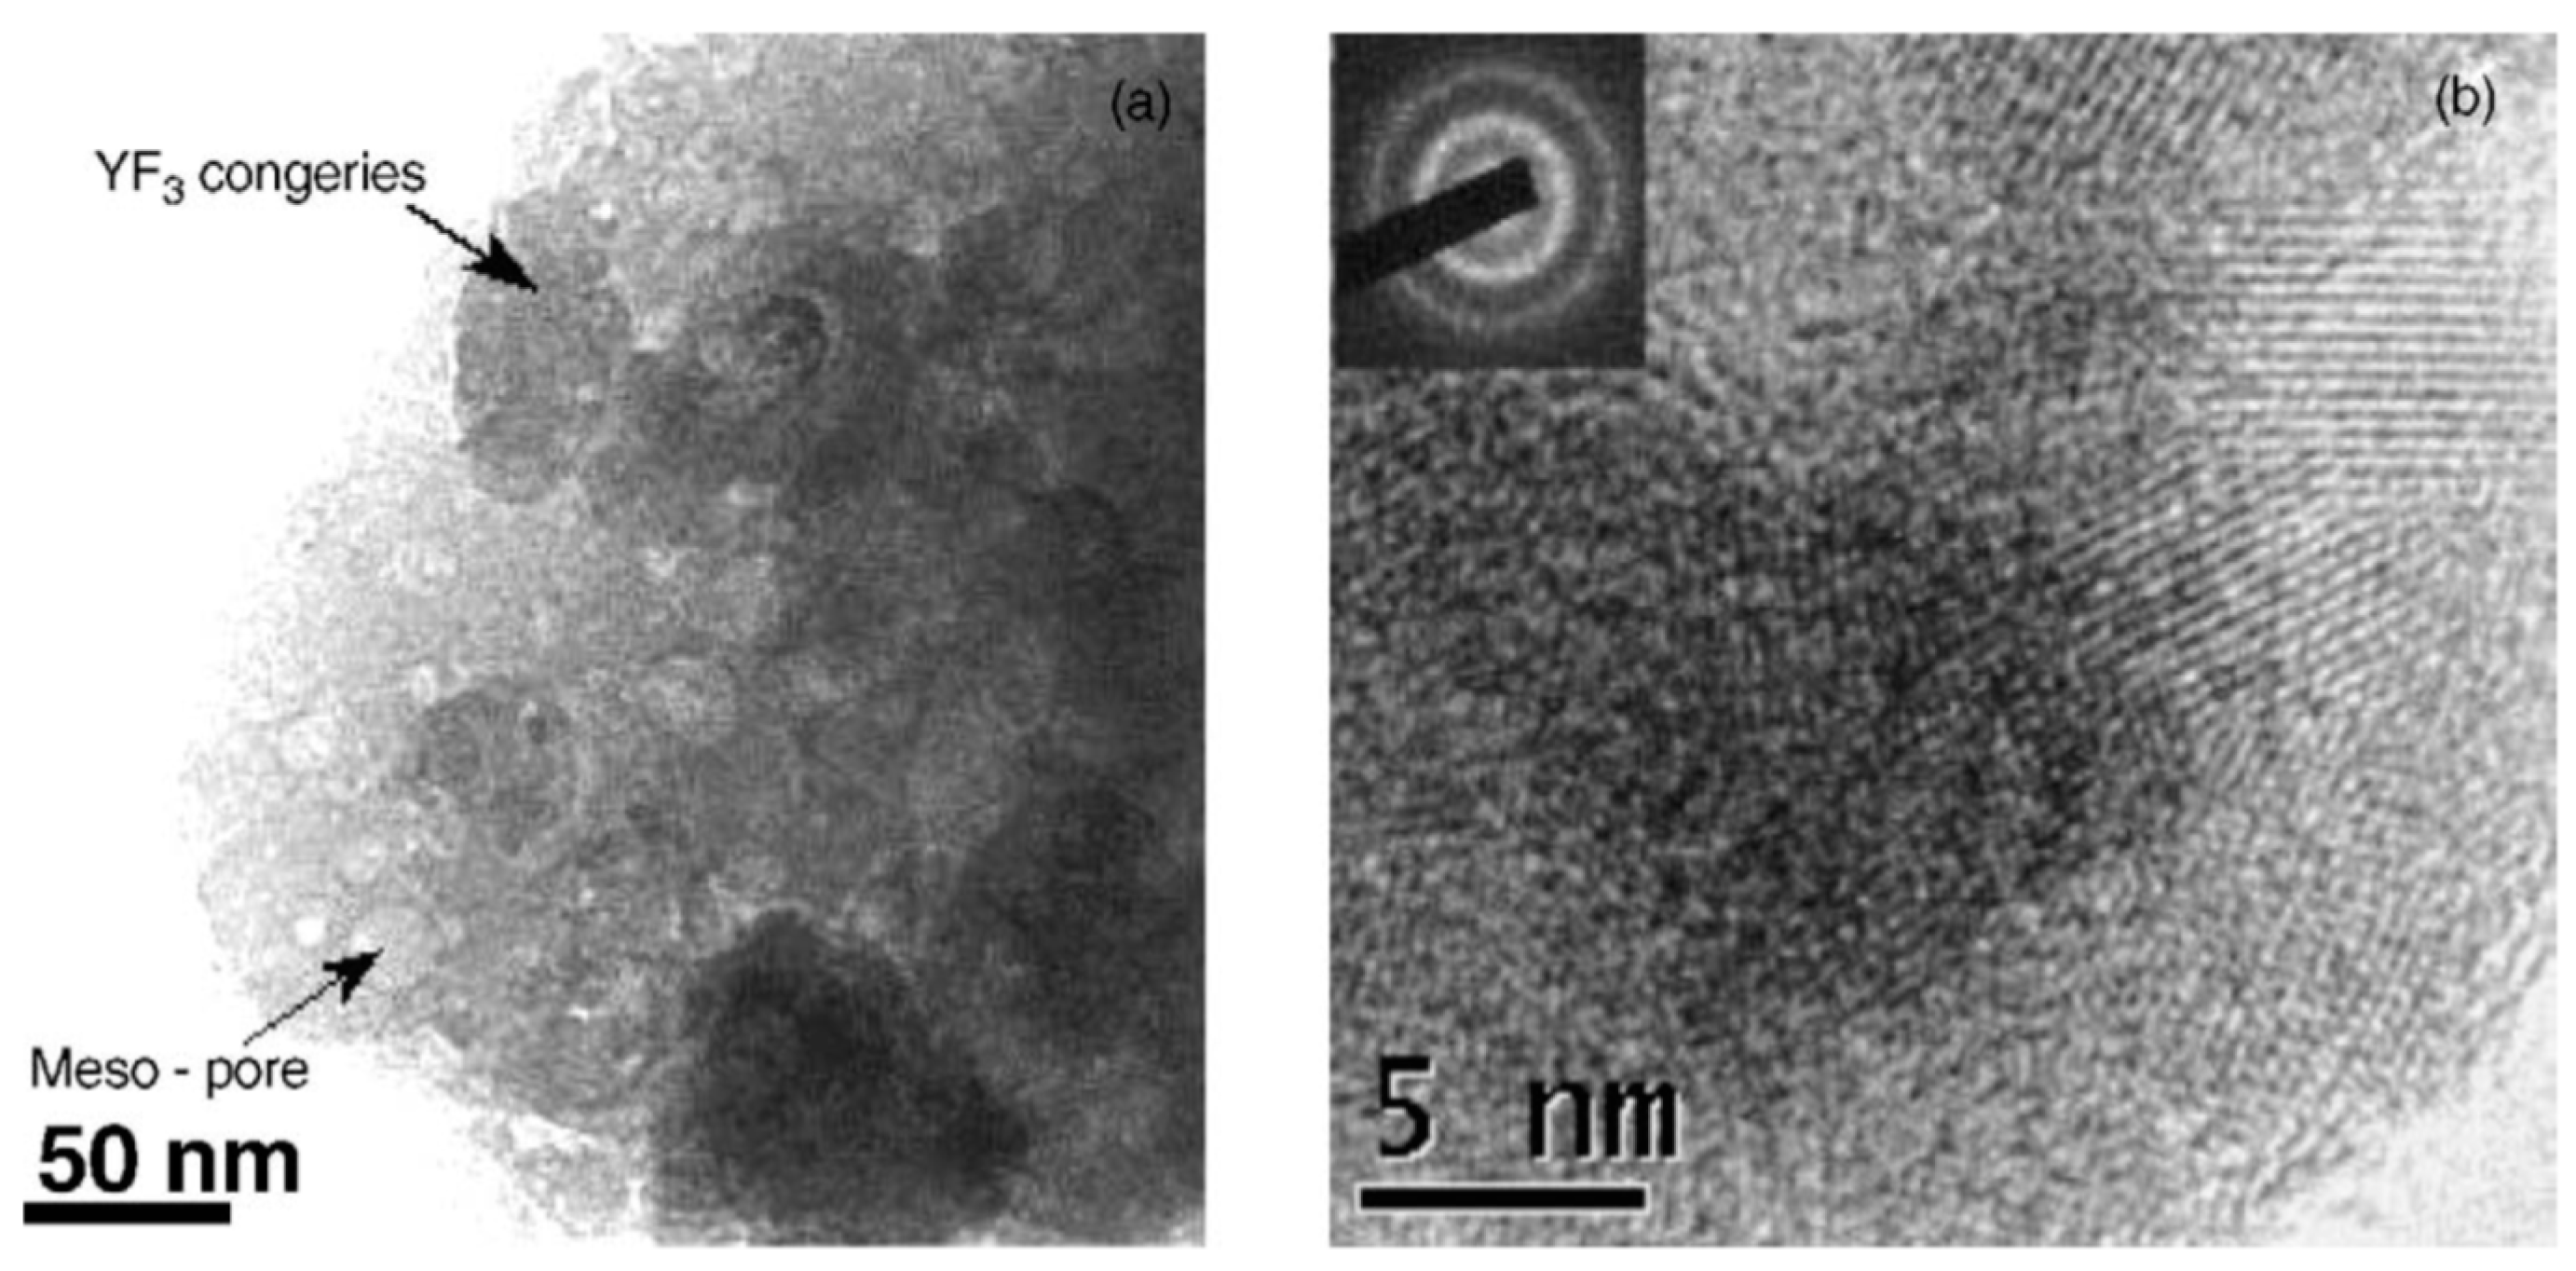
Structural and morphological studies of the crystallization mechanism [13] of the SiO2–YF3 glass ceramic showed that the crystallization of YF3 nanocrystalline phase is due to decomposition of Y(CF3COO)3, according to the previous image of the crystallization mechanism. Moreover, transmission electron microscopy (TEM) investigations showed that YF3 nanophase crystallization started with formation of big congeries particles in the glassy matrix consisting of many randomly oriented mono-crystallites sized around 5 nm (Figure 2). Higher calcination temperature (up to 600 °C) promotes the separation of the initial nanocrystals by reducing stress and lowering system energy. A similar conclusion was reached by Yunlong Yu et al. (2006) [11], who showed that the formation of SrF2 nano-crystals 8–10 nm distributed homogenously among the glassy matrix. The nanocrystals size remains almost unchanged up to 800 °C annealing due to the interfacial interaction of SrF2 nano-crystals with the glass matrix, which hinders their further growth.
Structural and optical investigations of the crystallization process in SiO2–BaF2 sol-gel indicated a homogenous crystallization mechanism, with BaF2 small nanocrystals (a few nm size) acting as nucleation centers that resulted from thermal decomposition of Ba–trifluoroacetate at about 300 °C [8]. The investigations of thermal behavior of the silicate xerogels by using differential scanning calorimetry (DSC) and thermogravimetry (TG) showed a three-stage thermal degradation profile related to the glass ceramization process [8] (Figure 3). The first step corresponding to the temperature range from 120 °C to 200 °C is due to the removal of volatile components. A second step from 280 to 360 °C is closely related to the Ba trifluoroacetate decomposition [14] with the formation of tiny BaF2 nanocrystalline seeds (few nm size) and is accompanied by a strong DSC peak at about 307 °C. The next weight loss in the TG curve occurs in the temperature range from 400 to 500 °C and is due to the pyrolysis of organic groups bonded to silicon (residual organics and carbon). The formation of the BaF2 nanocrystalline phase in Eu3+-doped SiO2–BaF2 and crystallinity improvement was associated to a broad and weak DSC peak at 685 °C (Figure 3) and shows a slight dependence (within few degrees) on the RE-dopant ions incorporation. A similar peak was reported at 663 °C in 95SiO2–5CaF2 [15] and at 700 °C in 95SiO2–5SrF2 [11] xerogel, but not in the undoped one, indicating its strong relation to the nature of the nanocrystalline phase.
Therefore, the general characteristic of the sol-gel glasses crystallization process is the thermal decomposition reaction of the metal trifluoroacetates, revealed as a strong DSC peak between 280 and 350 °C [10,16]. Higher calcination temperature results in a weak increase of the nanocrystals size by promoting the separation and growth of the initial nanocrystals [13]. These processes are revealed by a second and weaker DSC peak, which is strongly dependent of the fluoride nanocrystals nature. However, the mechanism is expected to be more complicated for glass ceramics containing complex compounds such as NaYF4, NaLaF4, NaGdF4, KLaF4, KYF4, LiYF4, BaYF5, and BaGdF5 (refer to the next section).
2.2. Optical Properties: Photoluminescence, Up-Conversion Luminescence, and Thermoluminescence
The calcination of dried xerogel affects not only structural and morphological properties (i.e., nanocrystals formation), but also the optical ones. During xerogel calcination, a silica network is formed due to the progressive enhancement of dehydration–condensation reactions [8,15,17], accompanied by the precipitation of the fluoride nanocrystalline phase, where a fraction of the RE3+ ions was incorporated. It was shown that in Er3+-doped SiO2–LaF3 sol-gel glass ceramic the effective concentration of rare-earth ions estimated by X-ray absorption spectroscopy was 91% and 9% in a fluoride and glass environment, respectively [18].
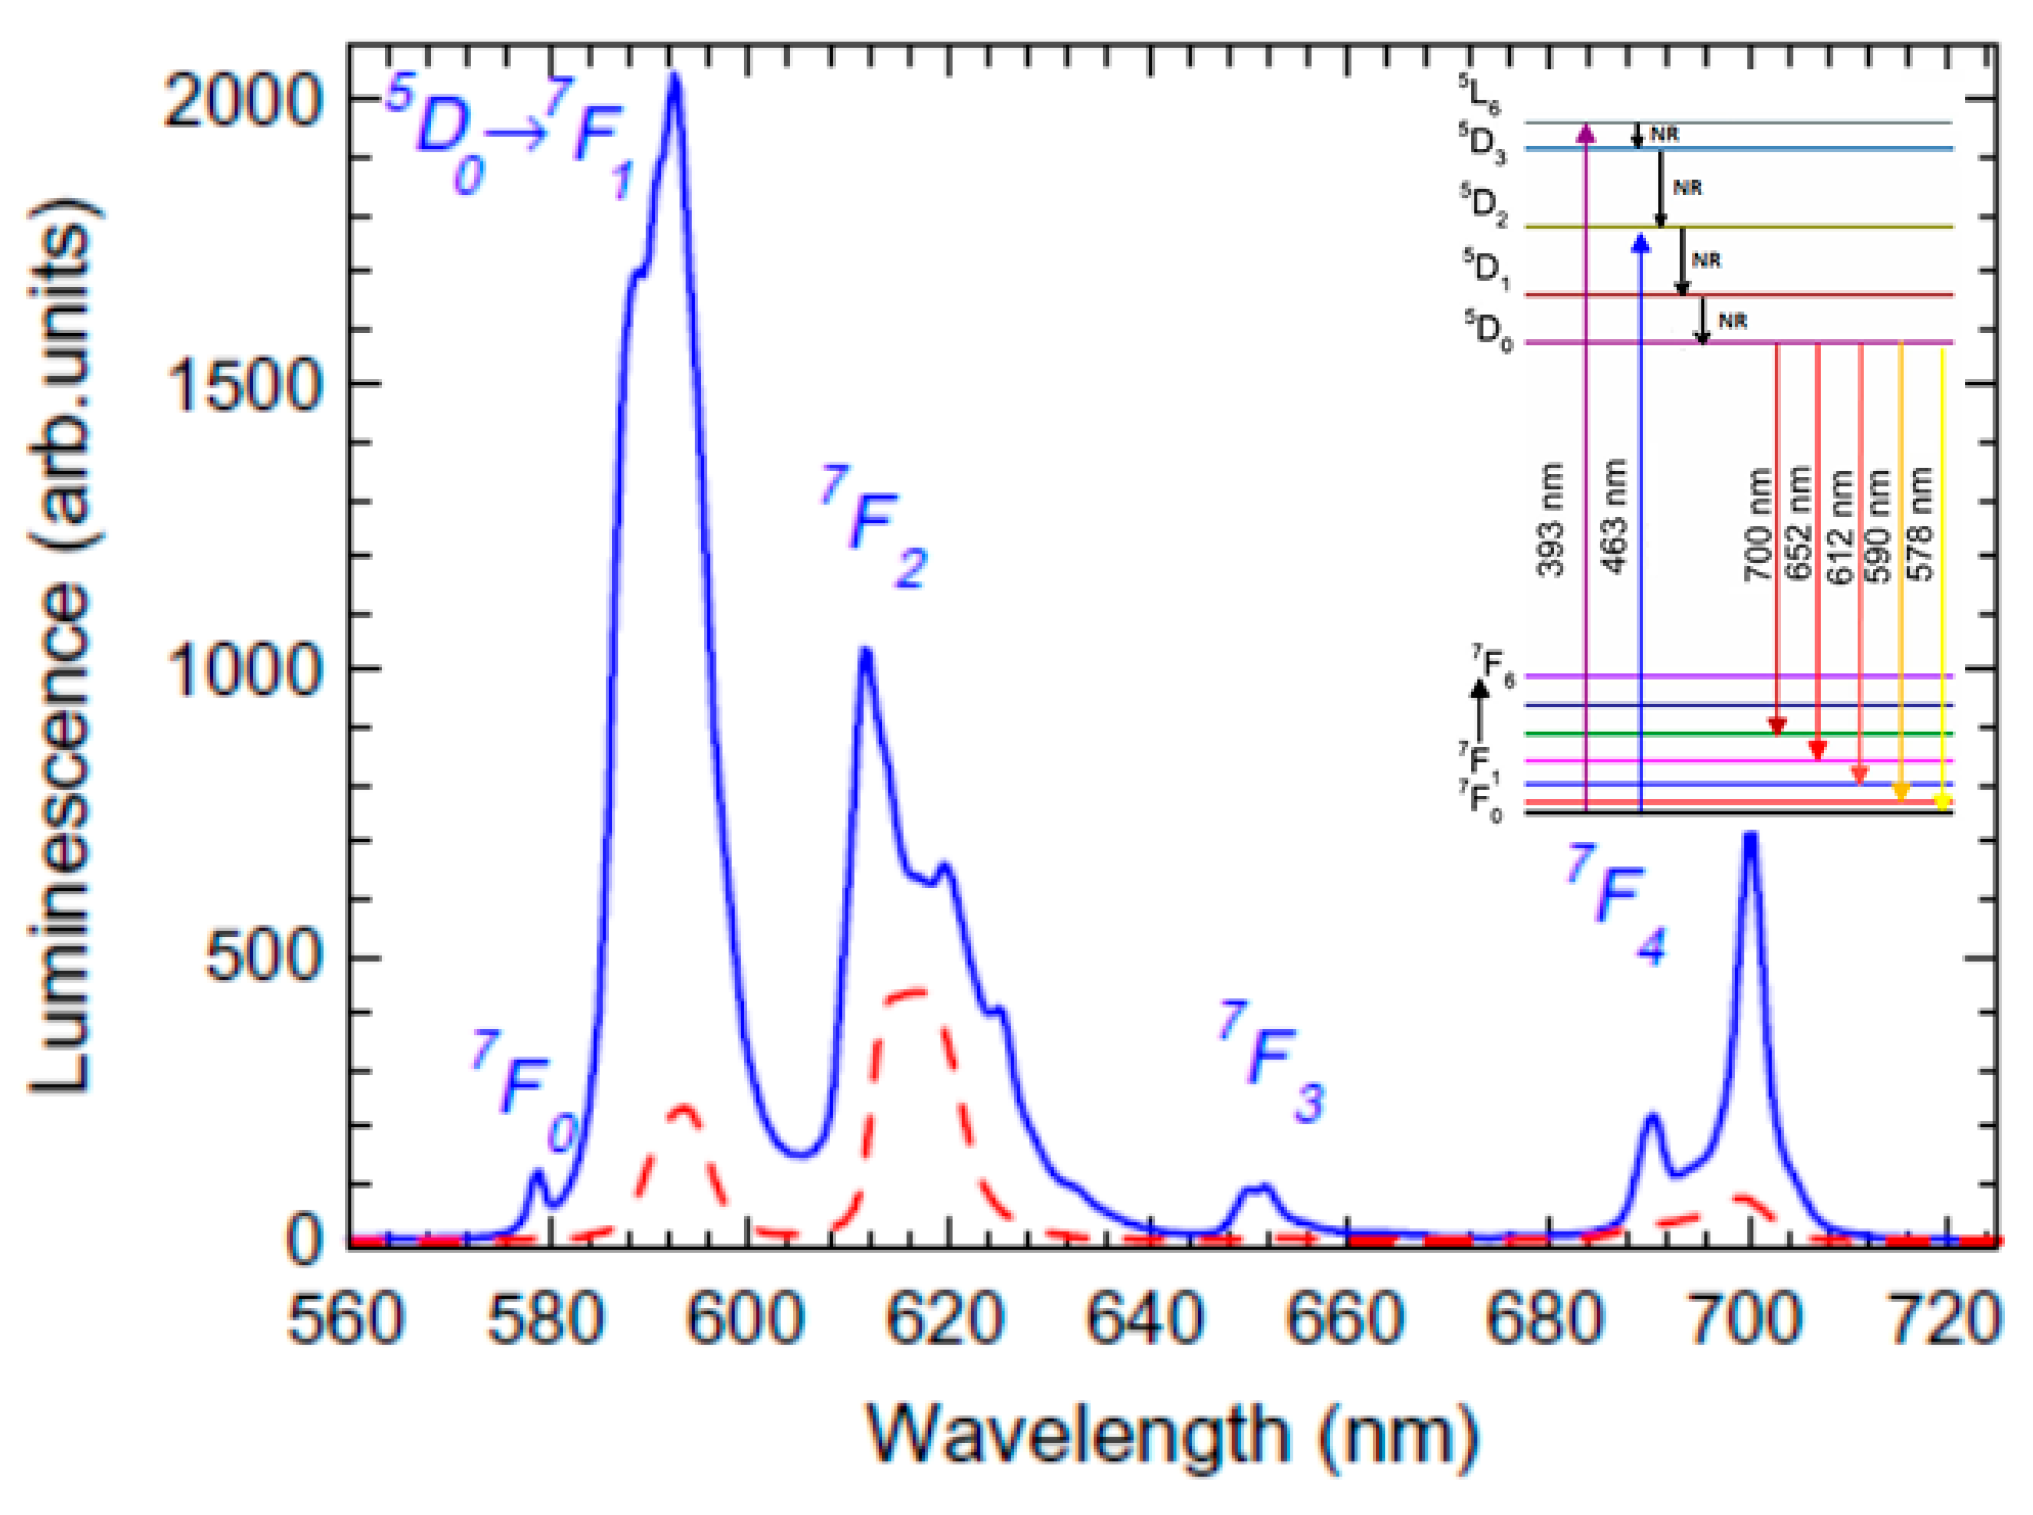
In the amorphous matrix, the RE3+-ions dopants are distributed within the amorphous structure of the glass, characterized by unregular arrangement of the constituent ions. Hence, in the glass matrix, the photoluminescence spectra of the RE3+-ions shows broadening due to the random positions and random surroundings of the dopant ions. The new luminescence features observed in the glass ceramic were assigned to the RE3+-ions incorporated into the precipitated nanocrystals. The luminescence spectra in the glass ceramic shows Stark splitting due to the degeneracy lifting by the local crystal field where the RE3+-ion are incorporated, an effect clearly observed for Eu3+ ions [19,20]; Figure 4. Because of the nanocrystals smallness in the glass ceramic, the nanosize-related effects can have a strong influence on the PL spectra (i.e., broadening effects), as was observed in the nanocrystals [21,22]. Moreover, on the nanocrystals surface, we expect a high concentration of surface atoms and defects [21,22] acting as trapping centers and non-radiatively dissipating energy. Therefore, the PL spectra are assigned to a superposition between the RE3+ ions emission located in the glass matrix and in the crystalline phase, inside the nanocrystals and on their surface [19]. Photoluminescence decay measurements are also highly sensitive to the RE3+-ions environment. Lower phonon energy of fluorides and the dehydration processes reduce the probability of non-radiative de-excitations and as a result a luminescence signal enhancement and longer luminescence lifetimes compared to the xerogels were observed [8,18,23]. Defects with relatively large vibration energies like hydroxyl groups from the water, solvent, and silanol groups are efficient non-radiative relaxation channels for the excited states and therefore multiphonon relaxation rate is rather large, thereby decreasing the luminescence lifetime and efficiency.
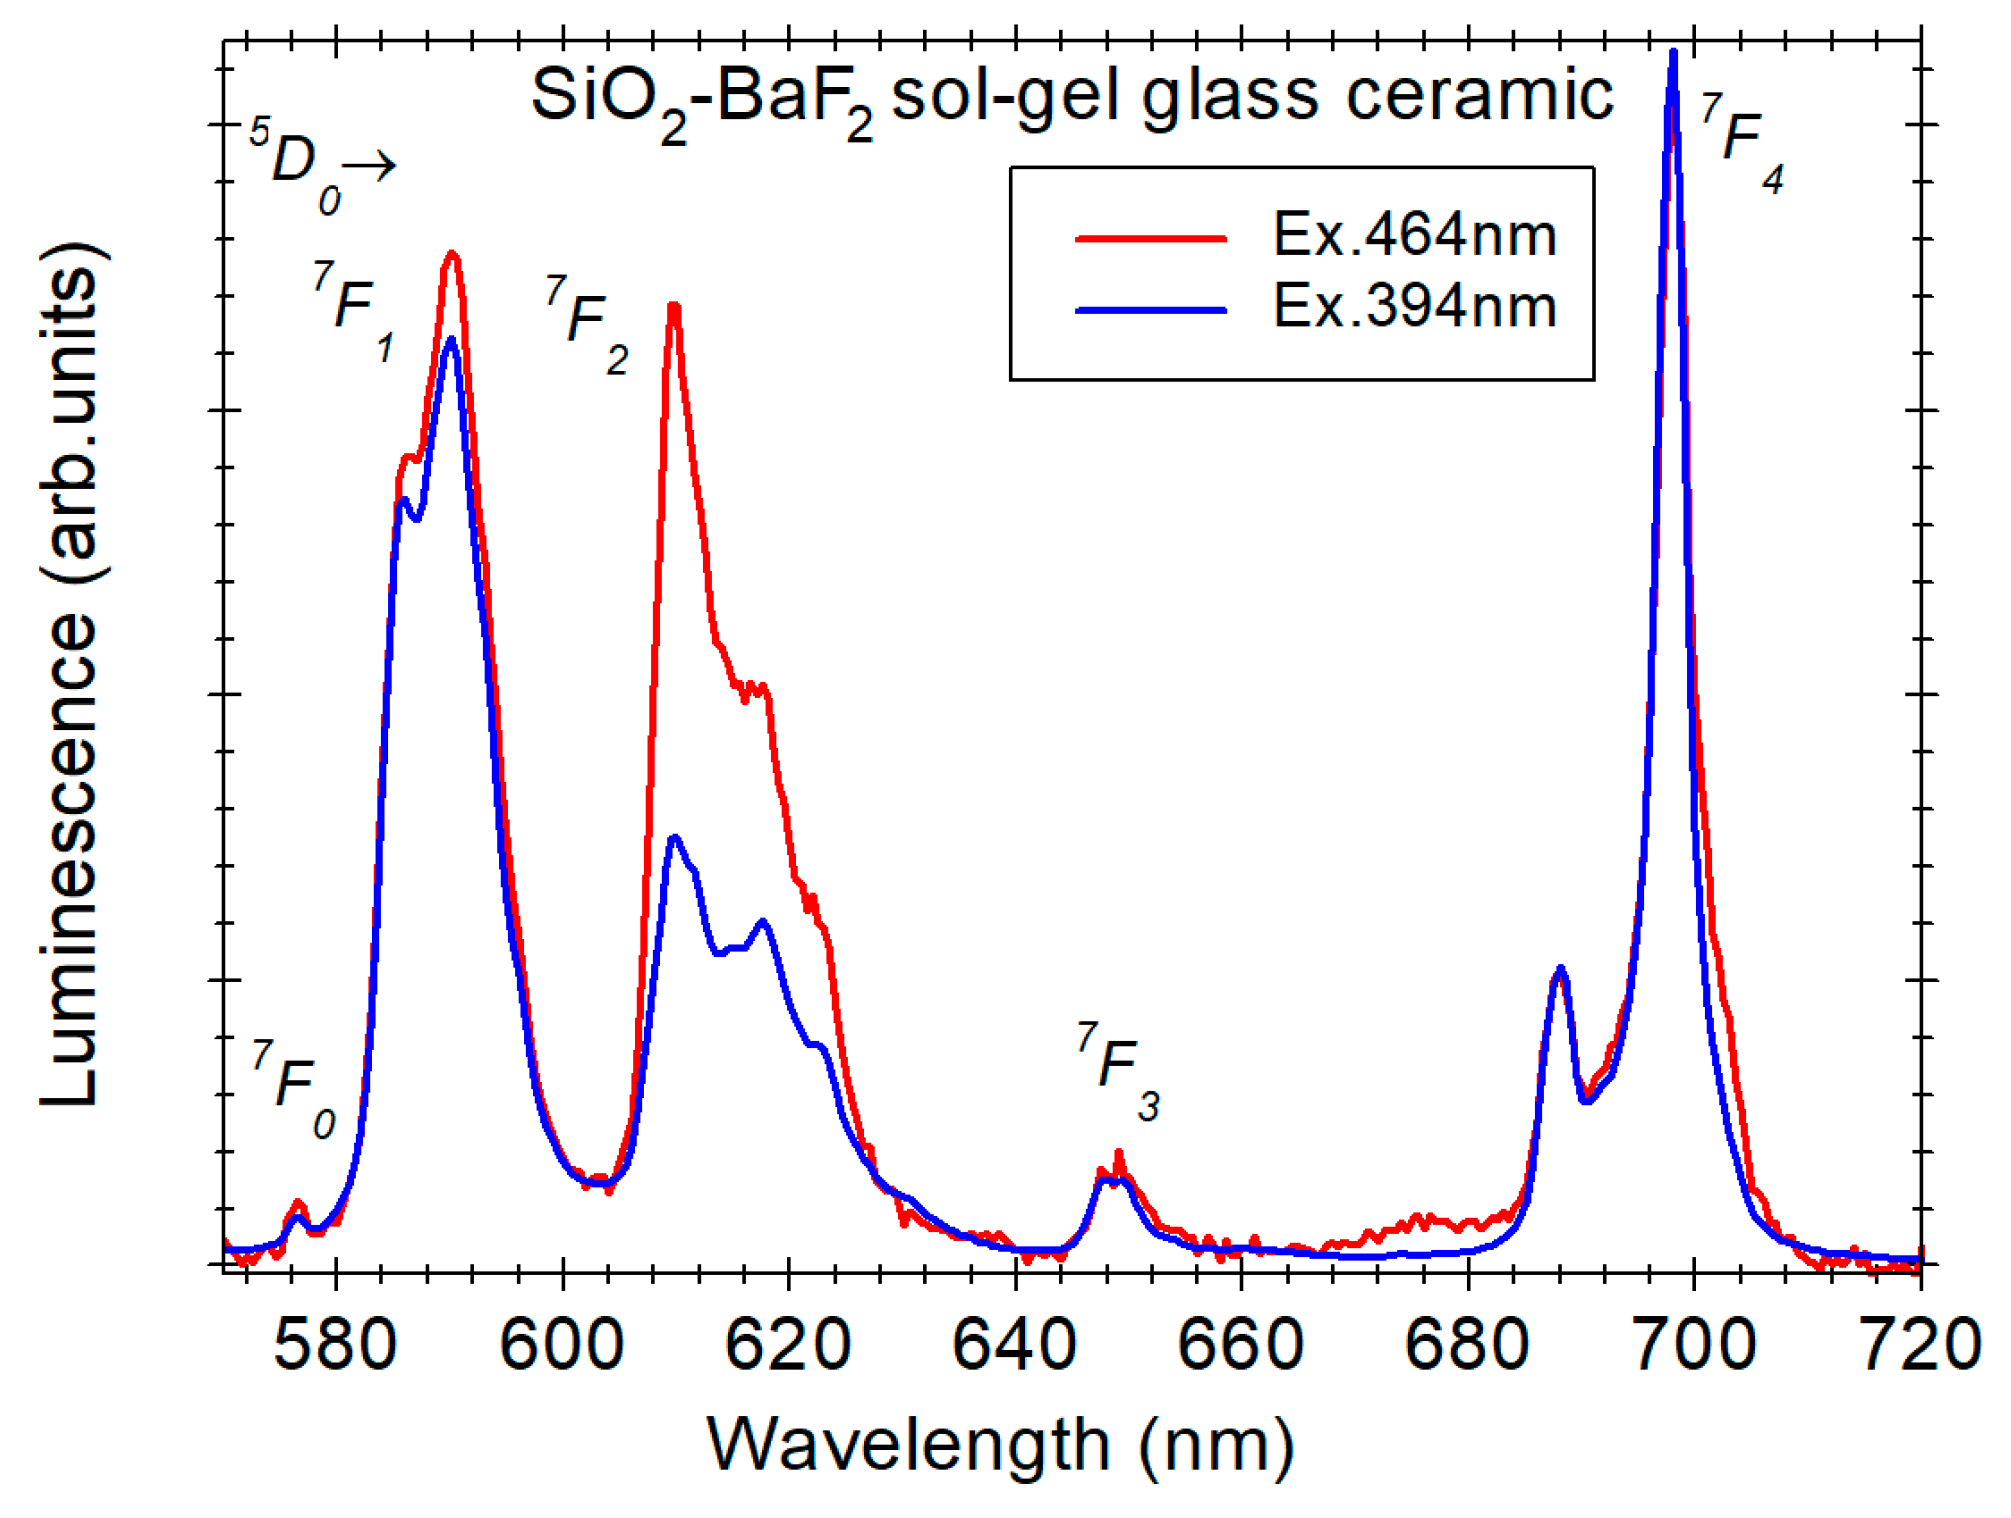
Among the RE3+ ions, Eu3+ ions are widely used as green–red light emitting activators, where the characteristic luminescence properties are to the intra-configurational 4f6–4f6 transitions (5D0 → 7FJ, J = 0–4); see Figure 4. Moreover, they are widely studied as probe-ions for local site symmetry in various materials [24,25] and have been used to investigate the sol-gel process [8,26,27,28]. The electric-dipole 7D0 → 5F2 transition is sensitive to the environment and therefore the intensity ratio between the two visible emissions 5D0–7F2/5D0–7F1 is highly dependent on the Eu3+-ion environment. The lower this ratio, the closer is the local symmetry to the one having an inversion center [29]. In particular, the intensity ratio has been used to monitor and discuss the sol-gel process and xerogel transformation in various Eu3+-doped glass ceramics [8,20,23,30]. Moreover, luminescence spectra recorded under proper excitation wavelengths and luminescence decay measurements recorded in SiO2–LaF3 glass ceramic have allowed discerning between ions residing in precipitated nanocrystals and those remaining in a glassy environment [23]. The 464 nm excitation wavelength is inhibited for Eu3+ ions in high symmetry sites, whereas the broad luminescence spectrum and shorter luminescence decay lifetime reflect the glassy environment [23]. By comparison, the luminescence spectra recorded under 394 nm excitation (the 7D0 → 5F2 transition) shows Stark splitting and longer decay time characteristic to the crystalline environment [23]. A similar approach was applied to the Eu3+-doped SiO2–BaF2 glass ceramic (prepared in ref. [8]) and the spectra showed structured luminescence spectra for both excitation wavelengths but different red to green visible emissions ratios (Figure 5). The spectra are consistent with dominant incorporation of the Eu3+ ions within the BaF2 nanocrystals [8], exhibiting two different crystalline sites with higher and lower local symmetry.
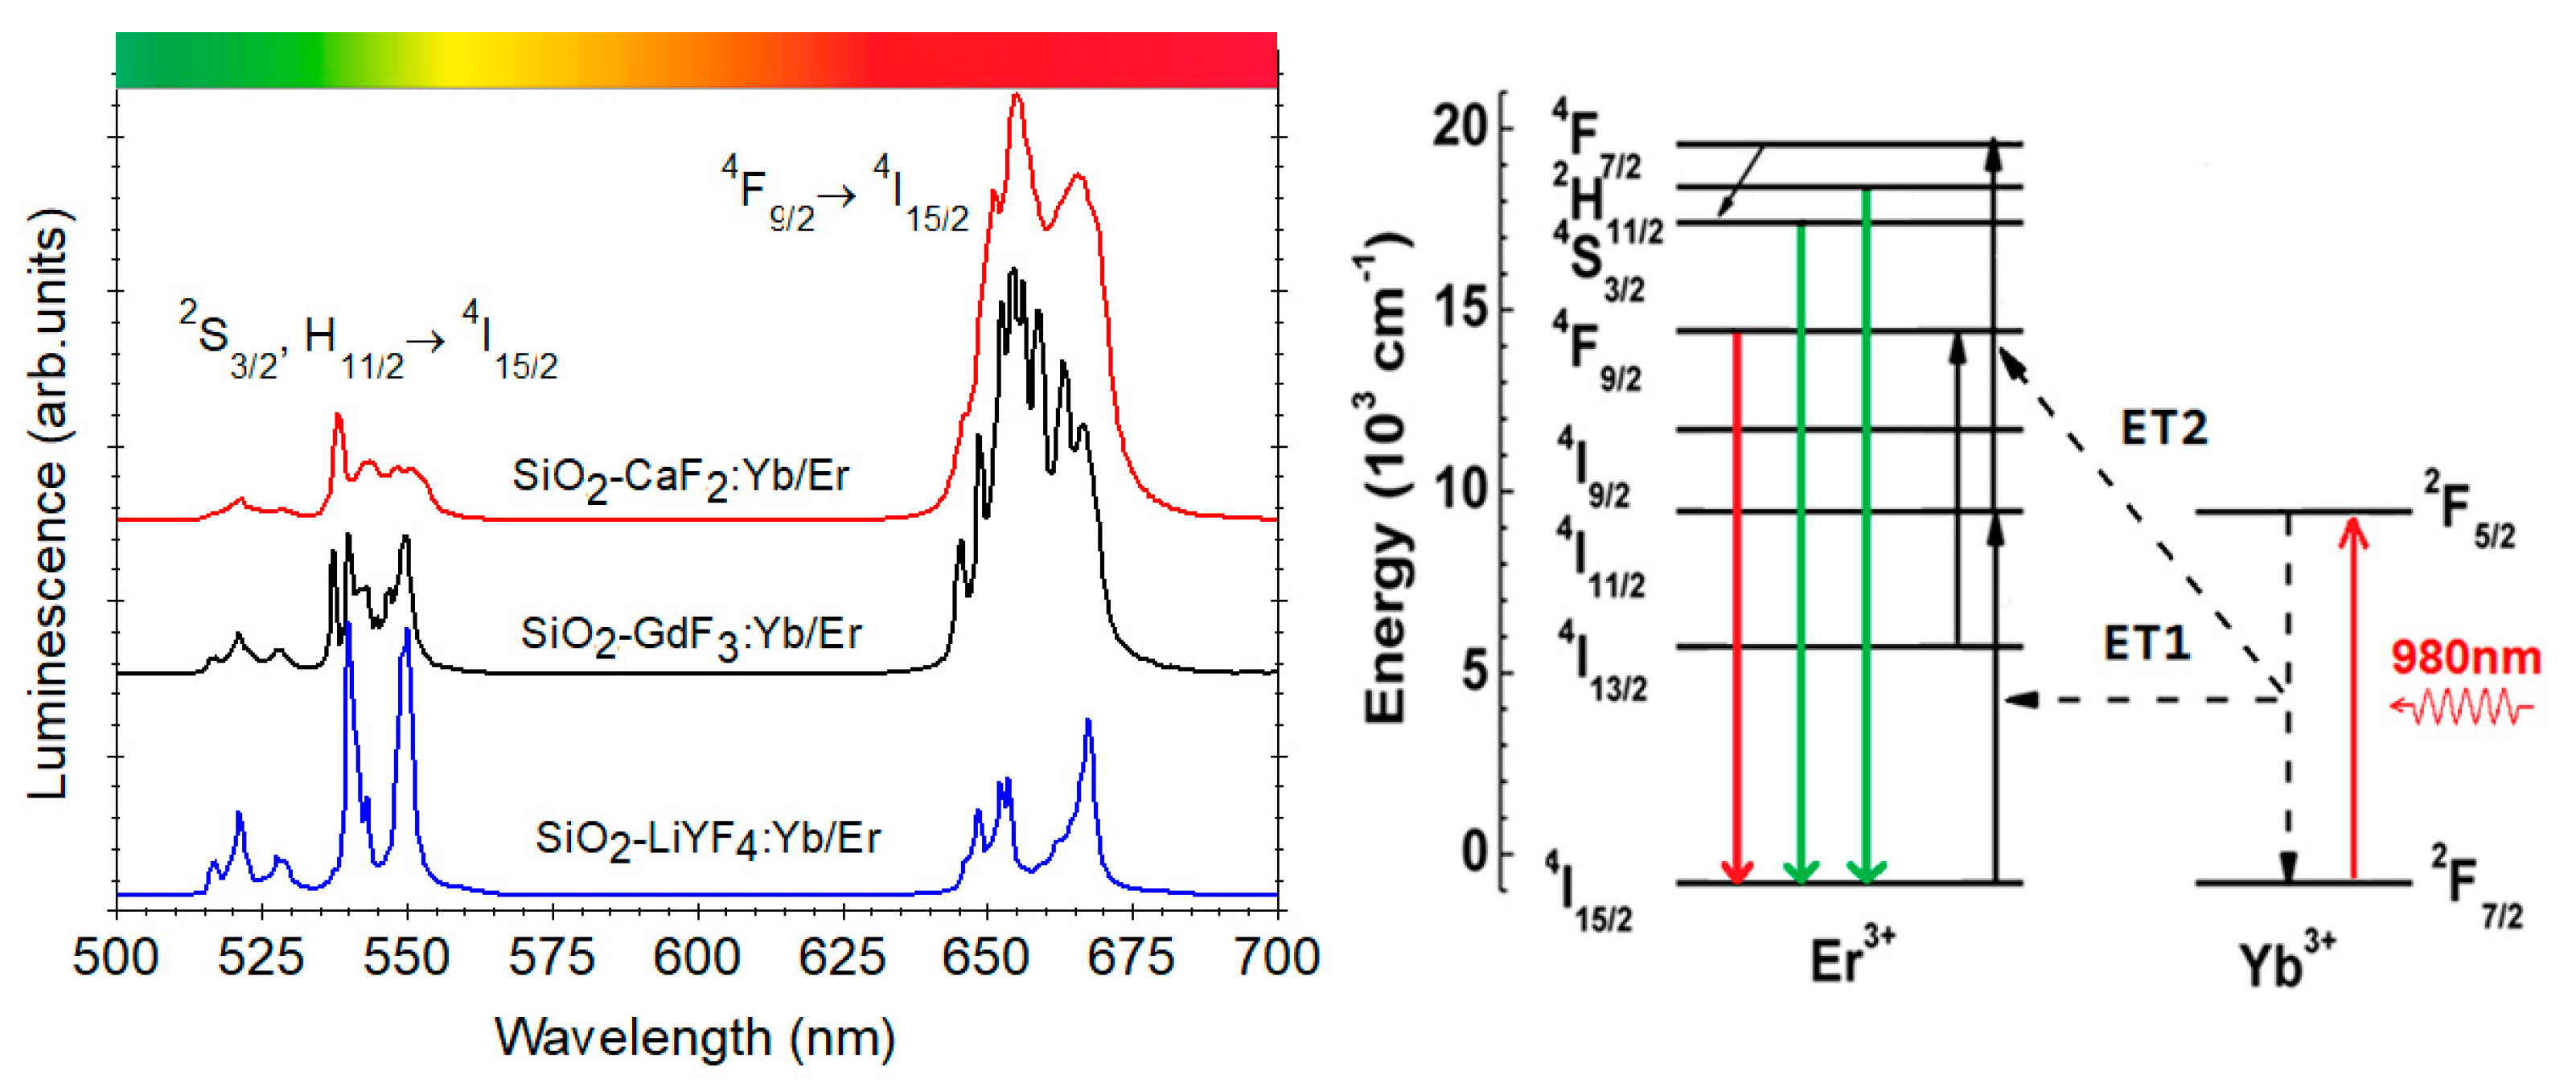
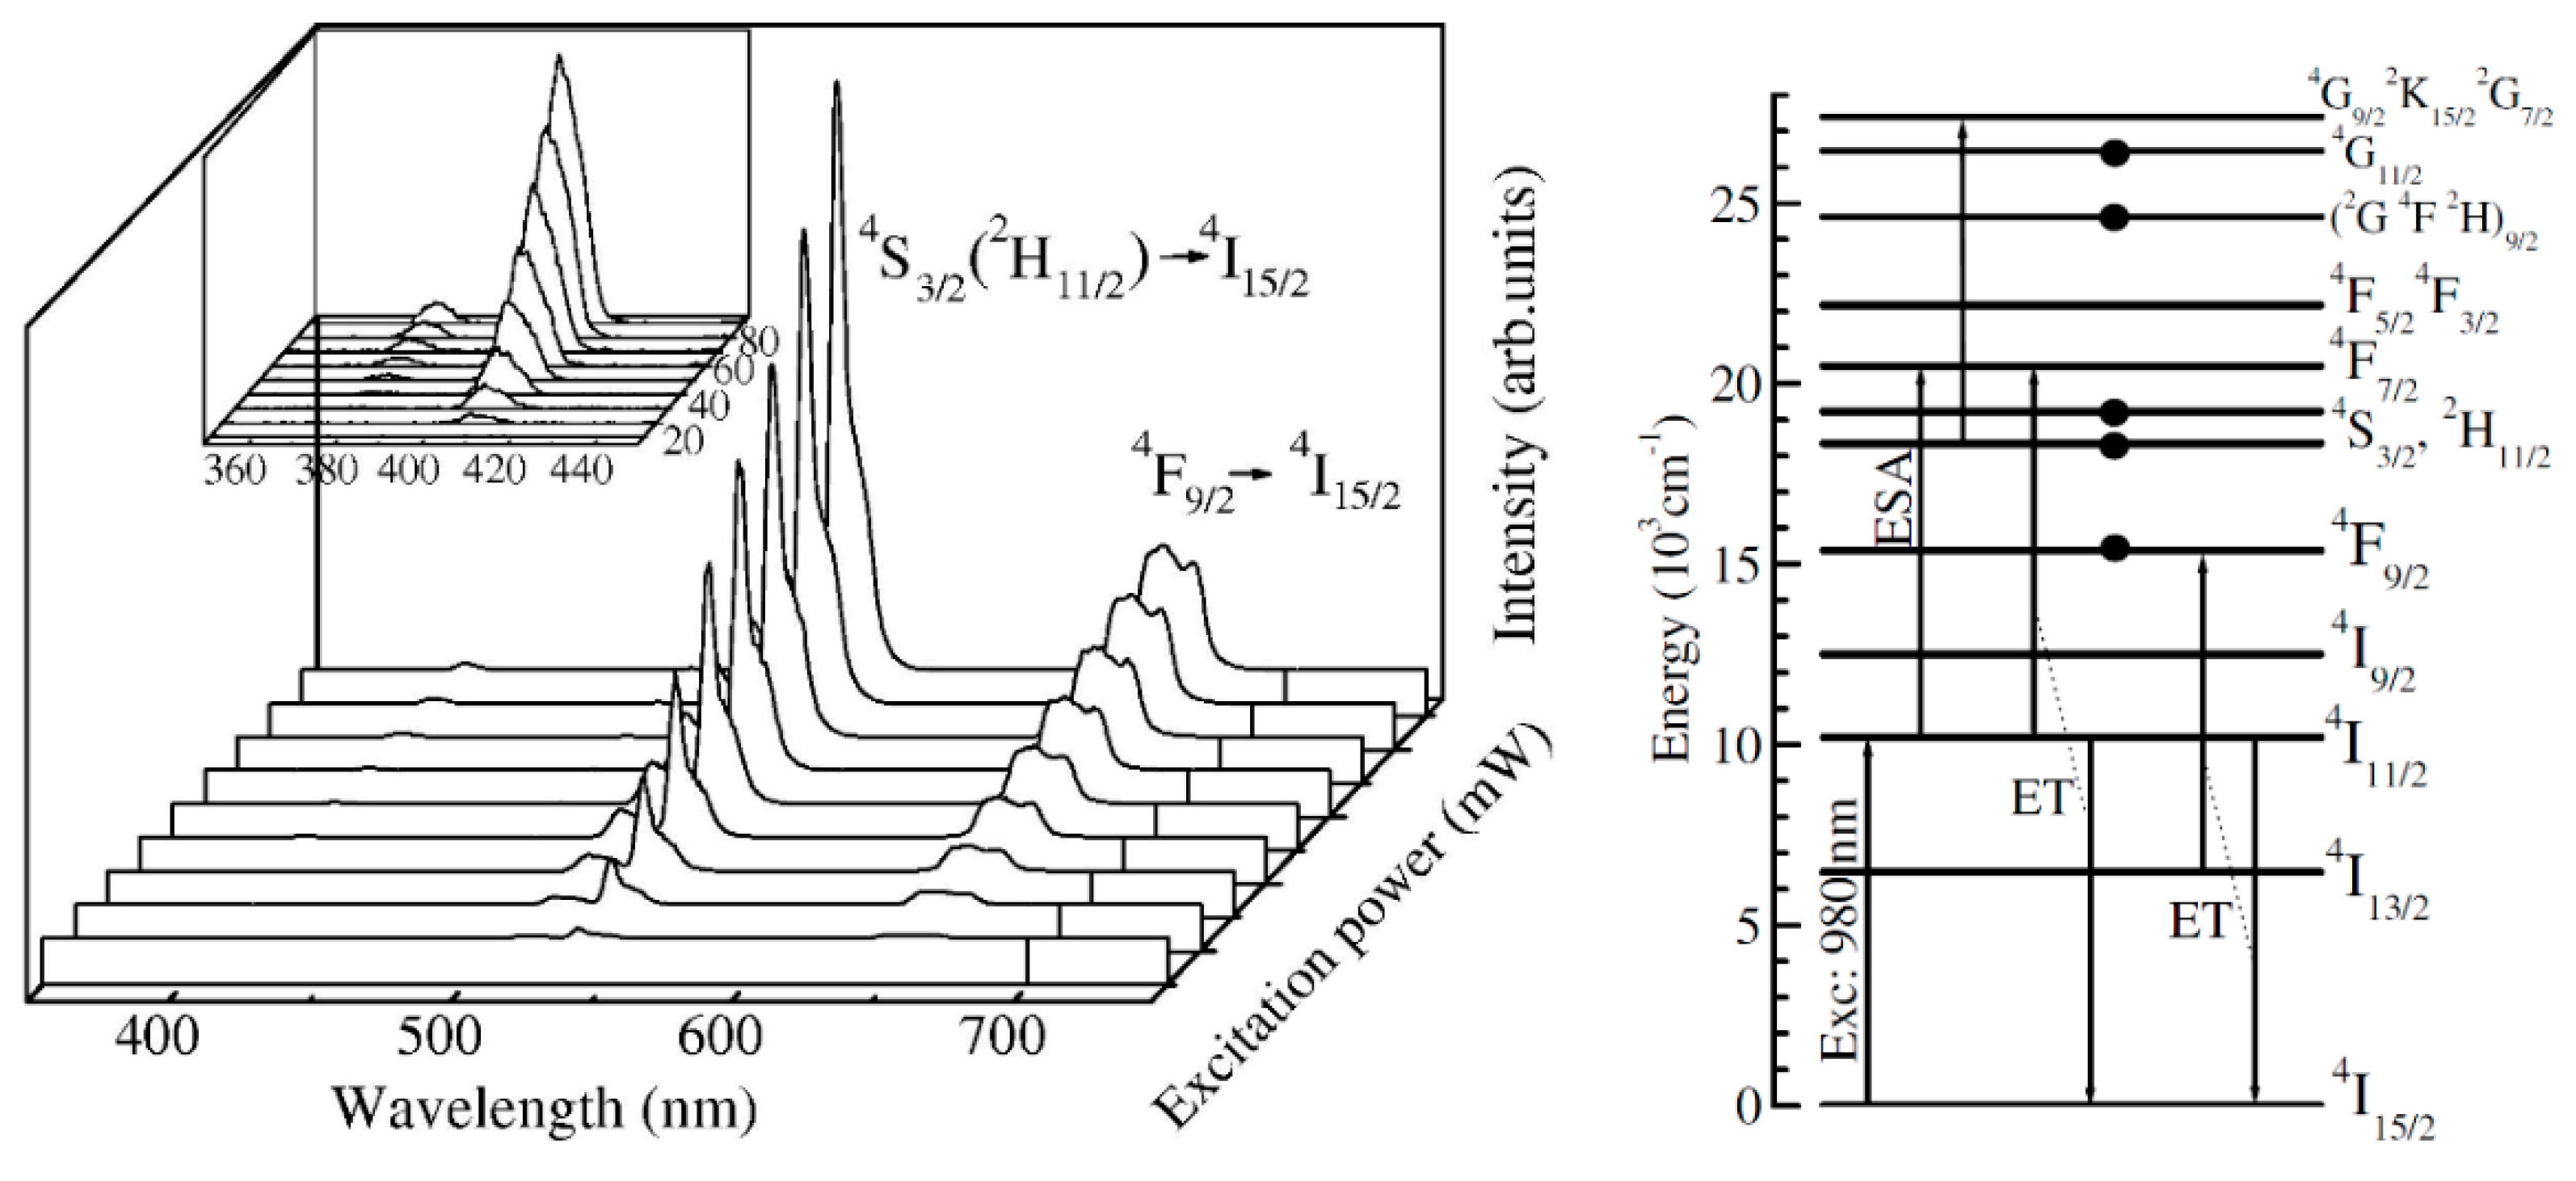
A special case is represented by the up-conversion luminescence (UC) shown by the rare-earth ions (or ion pairs) that is an anti-Stokes luminescence process where synergistic effects of light excitation and mutual interactions between ions produce higher energy emission photons [31]. For rare-earth doped materials, the UC mechanism is based on the large absorption cross-section in the NIR region around 1000 nm of Yb3+ and a very efficient energy transfer (ET) to one of the Er3+/Ho3+ or Tm3+ ions. The absorption of infrared light photons by the Yb3+ ions (2F7/2 → 2F5/2 transition) is followed by a two-step energy transfer process to neighboring Er3+ ions with their characteristic green ((2H11/2, 4S3/2) → 4I15/2) and red (4F9/2 → 4I15/2) luminescent emissions (see Figure 6).
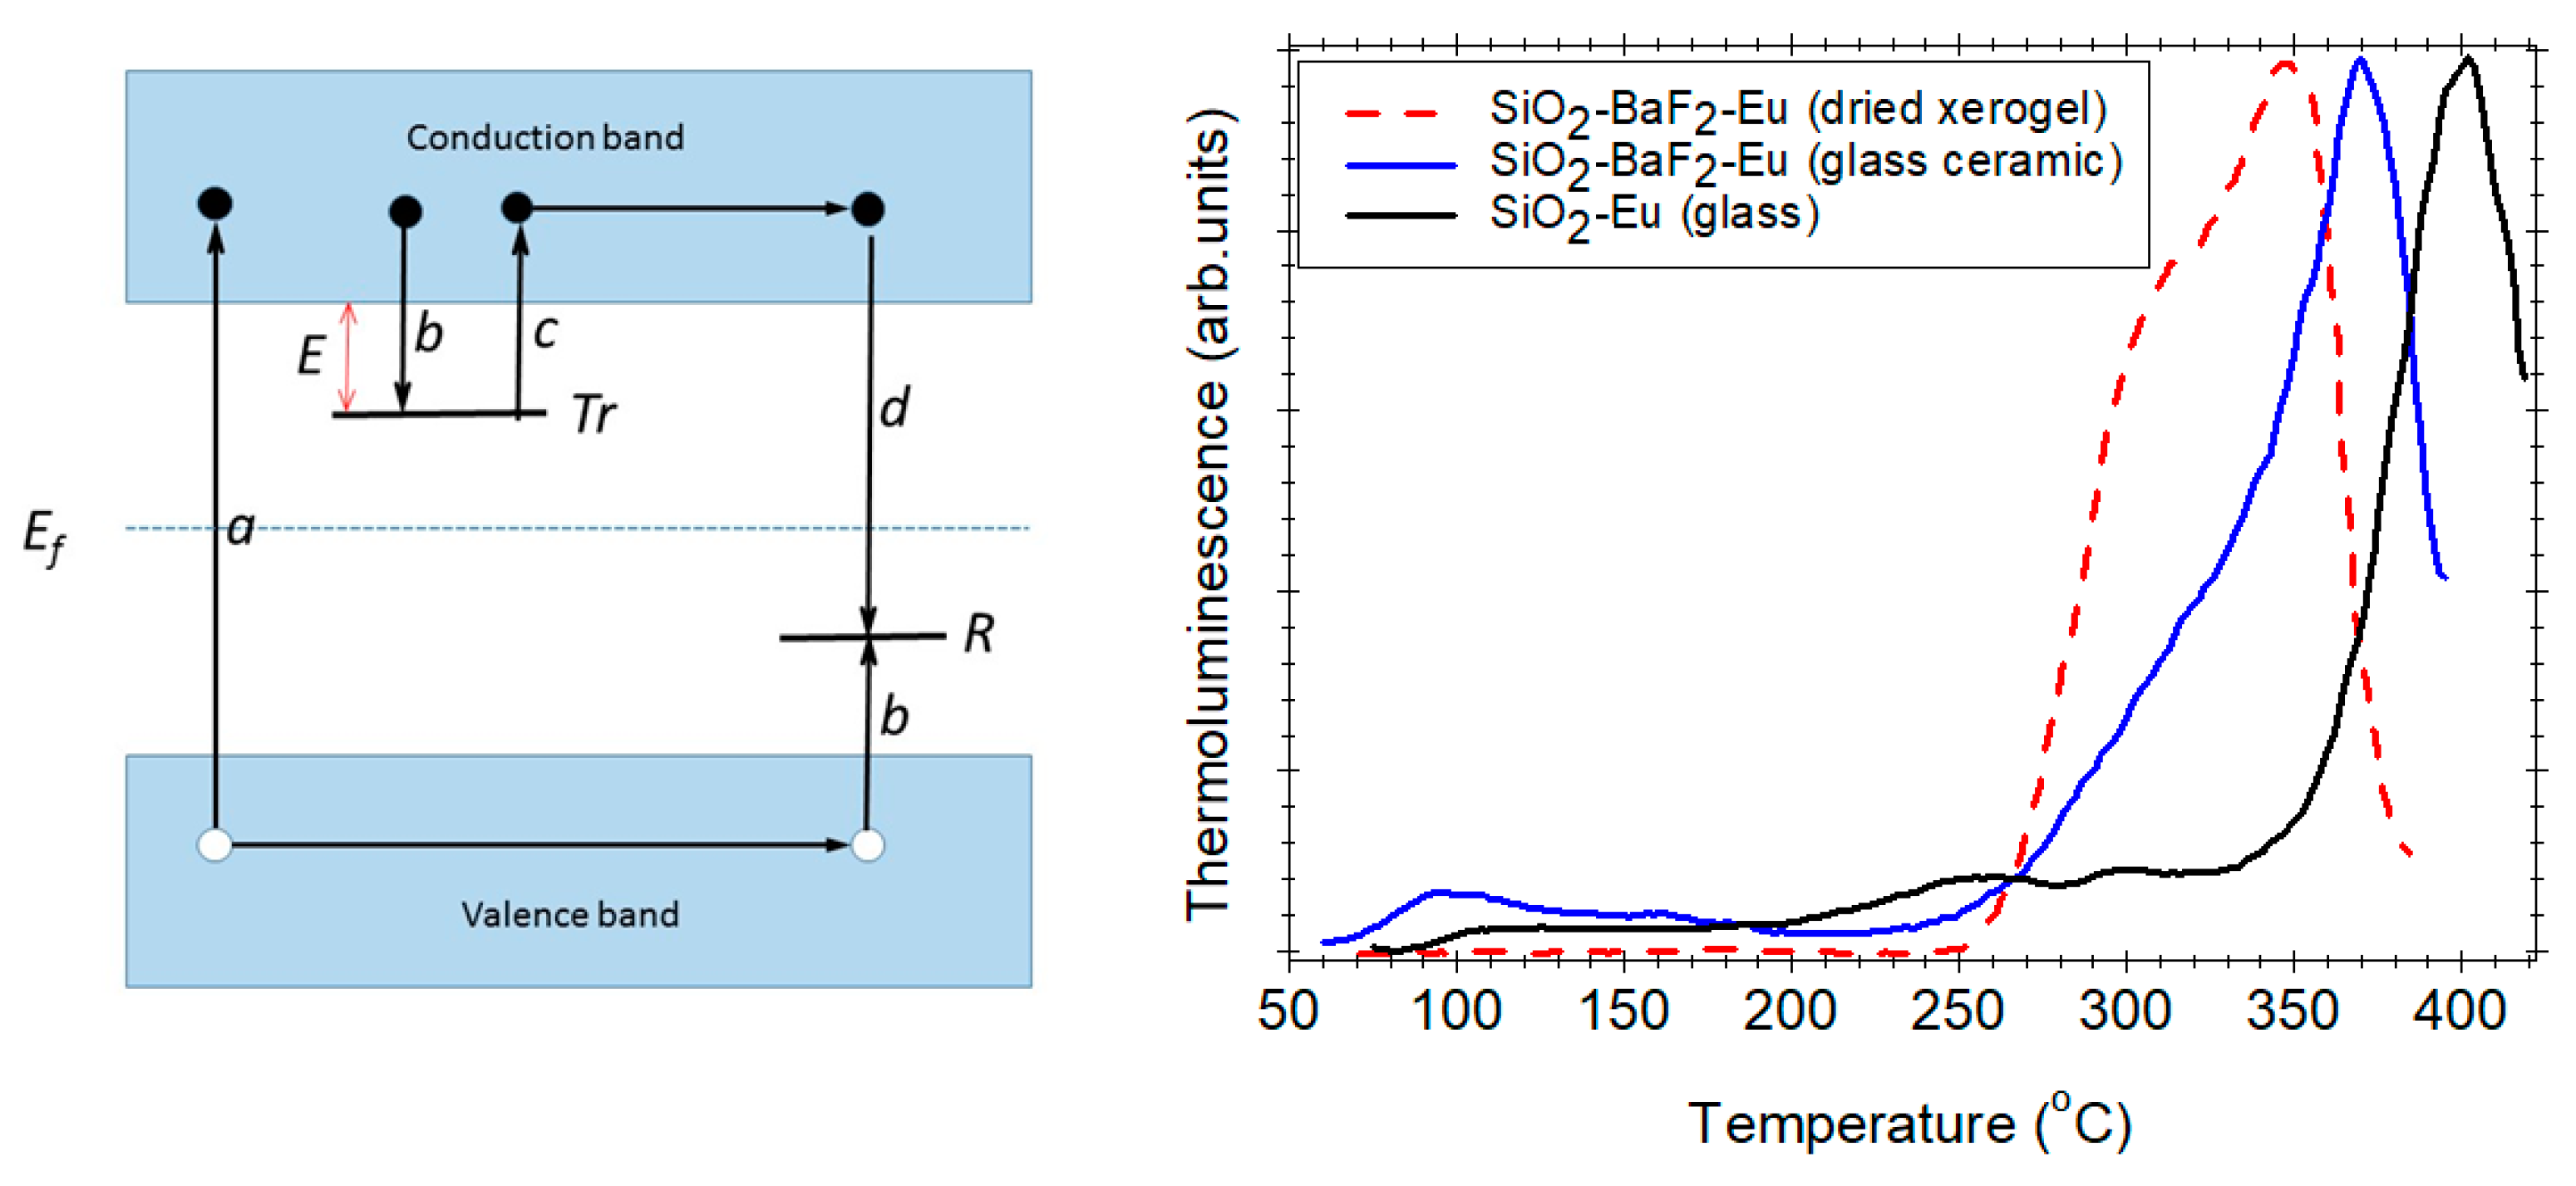
Nanocrystalline phase formation has a great effect on the optical response to ionizing radiation, and this can be characterized by using thermoluminescence measurement technique. Thermoluminescence (TL) represents the light emission by a solid sample during controlled heating after irradiation by ionizing radiation such as UV light, X-rays, gamma-rays, etc. [33] and it has proved to be a useful and sensitive tool for the study of radiation effects in various materials. According to the basic model, charge carriers (electrons and holes) produced by irradiation (stage a) are trapped in local energy levels Tr, (stage b), such as vacancies, interstitials, or impurities within the band gap; during the heating (stage c), they are thermally released and recombine at the recombination centers R giving rise to TL [33]; the thermal activation energy is E. In particular, TL has proved an effective tool for the study of rare-earth induced levels in material and their behavior as electron or hole trap [35,36,37].
The TL properties of Eu3+-doped materials are due to the thermal release of the electrons from deep Eu3+-related traps followed by the recombination with the hole traps, resulting in the emission of light. TL properties were used to monitor the densification of Eu3+ doped SiO2–BaF2 dried xerogel prepared in ref. [8] to the glass ceramic (Figure 7-right). The investigations evidenced two glow peaks at 309 and 350 °C in the xerogel and a single dominant one at 370 °C in the glass ceramic, different from the glow peak observed in the Eu3+-silica glass at 400 °C [38]. This change was associated with structural changes during the ageing process of the gel and glass crystallization (Figure 7-right).
3. Oxyfluoride Glass Ceramic
In the following sections, we present the most relevant results about the optical properties (mainly photo- and up-conversion luminescence properties) for RE3+ doped oxy-fluoride glass ceramics, depending on the nature of the nanocrystalline phase.
3.1. SiO2–MeF2 Oxyfluoride Glass ceramic (with Me = Mg, Ca, Sr, Ba, Pb)
Alkali-earth fluorides are well-known optical materials with various applications for radiation detection (as scintillators and for thermoluminescence dosimetry) or as laser media due to excellent optical properties such as high transmittance from ultraviolet to mid infrared spectral range and easy incorporation of RE3+-ions.
3.1.1. SiO2–CaF2 Oxyfluoride Glass Ceramic
The first report on 1 mol % ErF3-doped SiO2–CaF2 glass ceramic was by Zhou et al. [39]—the precipitation of CaF2 crystals of about 20 nm size, homogeneously distributed in the amorphous SiO2 matrix, is accompanied by the Er3+ related red (4F9/2 → 4I15/2) up-conversion luminescence. Further and deeper investigations on the UC luminescence properties of the Yb/Er doped SiO2–CaF2 glass ceramic and the mechanism involved were conducted by Georgescu et al. (2013) [40]. The green ((2H11/2, 4S3/2) → 4I15/2) and red (4F9/2 → 4I15/2) up conversion luminescences (Figure 6) are accompanied by weaker blue-UV luminescences at 380 nm (4G11/2 → 4I15/2) and 405 nm (2H9/2 → 4I15/2) assigned to the Er3+ ions deexcitation from higher energy levels. The analysis of the upconversion emissions indicated a two-photon processes for the red–green luminescence while the blue-UV luminescences is ascribed to three-photon processes. Their internal quantum efficiencies—0.88% (blue), 0.44% (green), and 10.6% (red)—were estimated from the fluorescence lifetimes of the blue, green, and red luminescences.
The Eu3+ ions environment in the silica glass and SiO2–CaF2 glass ceramic was investigated by using phonon side bands (PSB) measurements [15,17] (Figure 8). The local structures around Eu3+ ions give rise to local vibration modes that can be observed as vibronic lines associated to excitation peaks, i.e., PSB. The PSB peaks were assigned to the vibrations of the SiO4 tetrahedra units of the glass network (above ≅500 cm−1) and Ca–F bonds vibrations in the precipitated CaF2 nanocrystalline phase (below ≅500 cm−1). The presence of Si–O, Eu–O, and Eu–F bonds is consistent with the Eu3+ ions partition in both silica glass matrix and CaF2 nanocrystaline phase, i.e., in the non-centrosymmetric sites of the CaF2 nanocrystals structure [15].
New evidence on the Eu3+ ions partition was provided by the thermoluminescence measurements. Thermoluminescence investigations of SiO2–CaF2 glass ceramic revealed a glow peak at 370 °C, assigned to the recombination of the electrons released from the Eu3+-electron traps in the CaF2 nanocrystals, which is shifted from the peak observed in the Eu3+-doped silica glass at 400 °C [38]; the broadening of the glow peaks is consistent with multiple Eu3+-ion sites.
3.1.2. SiO2–SrF2 Oxyfluoride Glass Ceramic
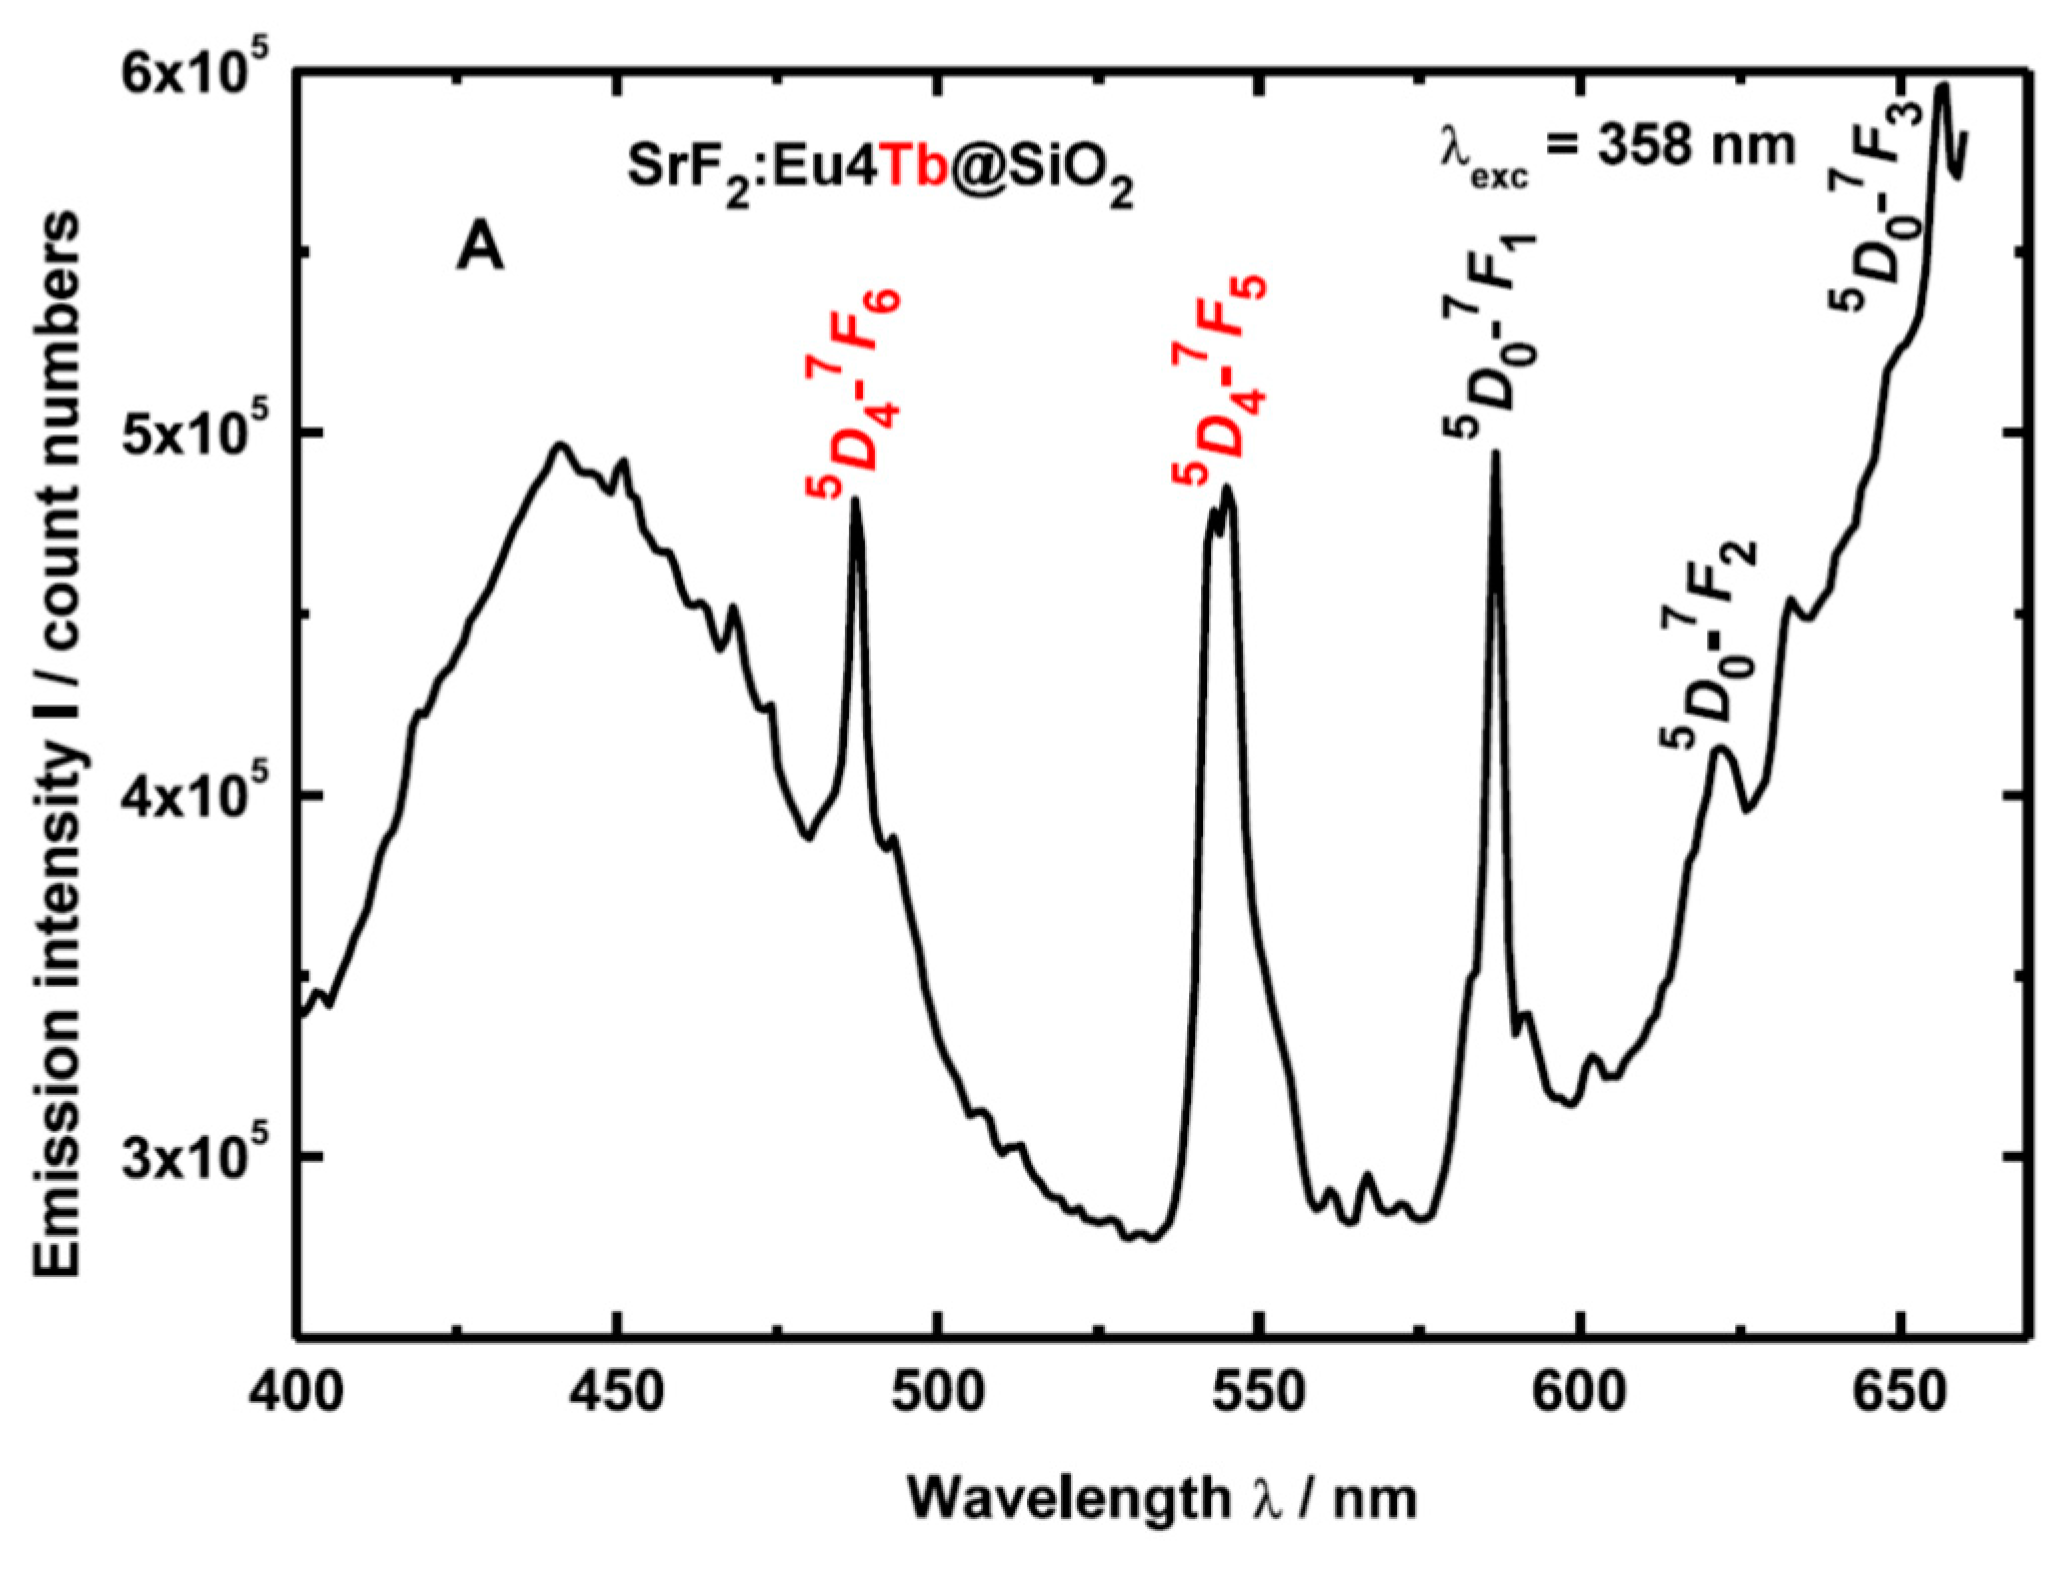
Luminescence properties of Eu3+/Tb3+ co-doped SiO2–SrF2 glass ceramics have been studied and showed cross-relaxation in materials with Tb3+ dopant as well as energy transfer from Tb3+ to Eu3+. White luminescence can be achieved by combining blue emission of SiO2, green light emitted by Tb3+ and red one by Eu3+, resulting in a white phosphor-like behavior [41] (Figure 9).
Up-conversion luminescence spectra of Er3+-doped SiO2–SrF2 oxyfluoride glass ceramic showed resolved Stark components of 4I13/2 band in the glass ceramics compared to the xerogel, assigned to the change of the environment around Er3+ from the glass to nanocrystals [42]. Moreover, the introduction of Al3+ to the SiO2 network caused an improvement of the optical properties: better transparency in the UV region due to lower pore content and intense visible UC luminescence as compared to the one with only SiO2 [42].
3.1.3. SiO2–BaF2 Oxyfluoride Glass Ceramic
Transparent glass ceramics containing Er3+-doped BaF2 nano-crystals doped were prepared by sol–gel route and upconversion luminescence was assigned to the Er3+-ions incorporated within the BaF2 nanocrystals of about 2–15 nm size [43]. Further investigations of RE3+-doped SiO2–BaF2 glass ceramic (RE = Ho, Dy, Eu, Sm) showed that in the glass ceramic material, a large fraction of RE3+ optically active ions is partitioned into BaF2 nanocrystals of about 10 nm size [8,19]. The Eu3+-luminescence signal enhancement is accompanied by an increase of luminescence lifetime, from 0.27 ms in dried xerogel to 4.7 ms in the glass ceramic [8].
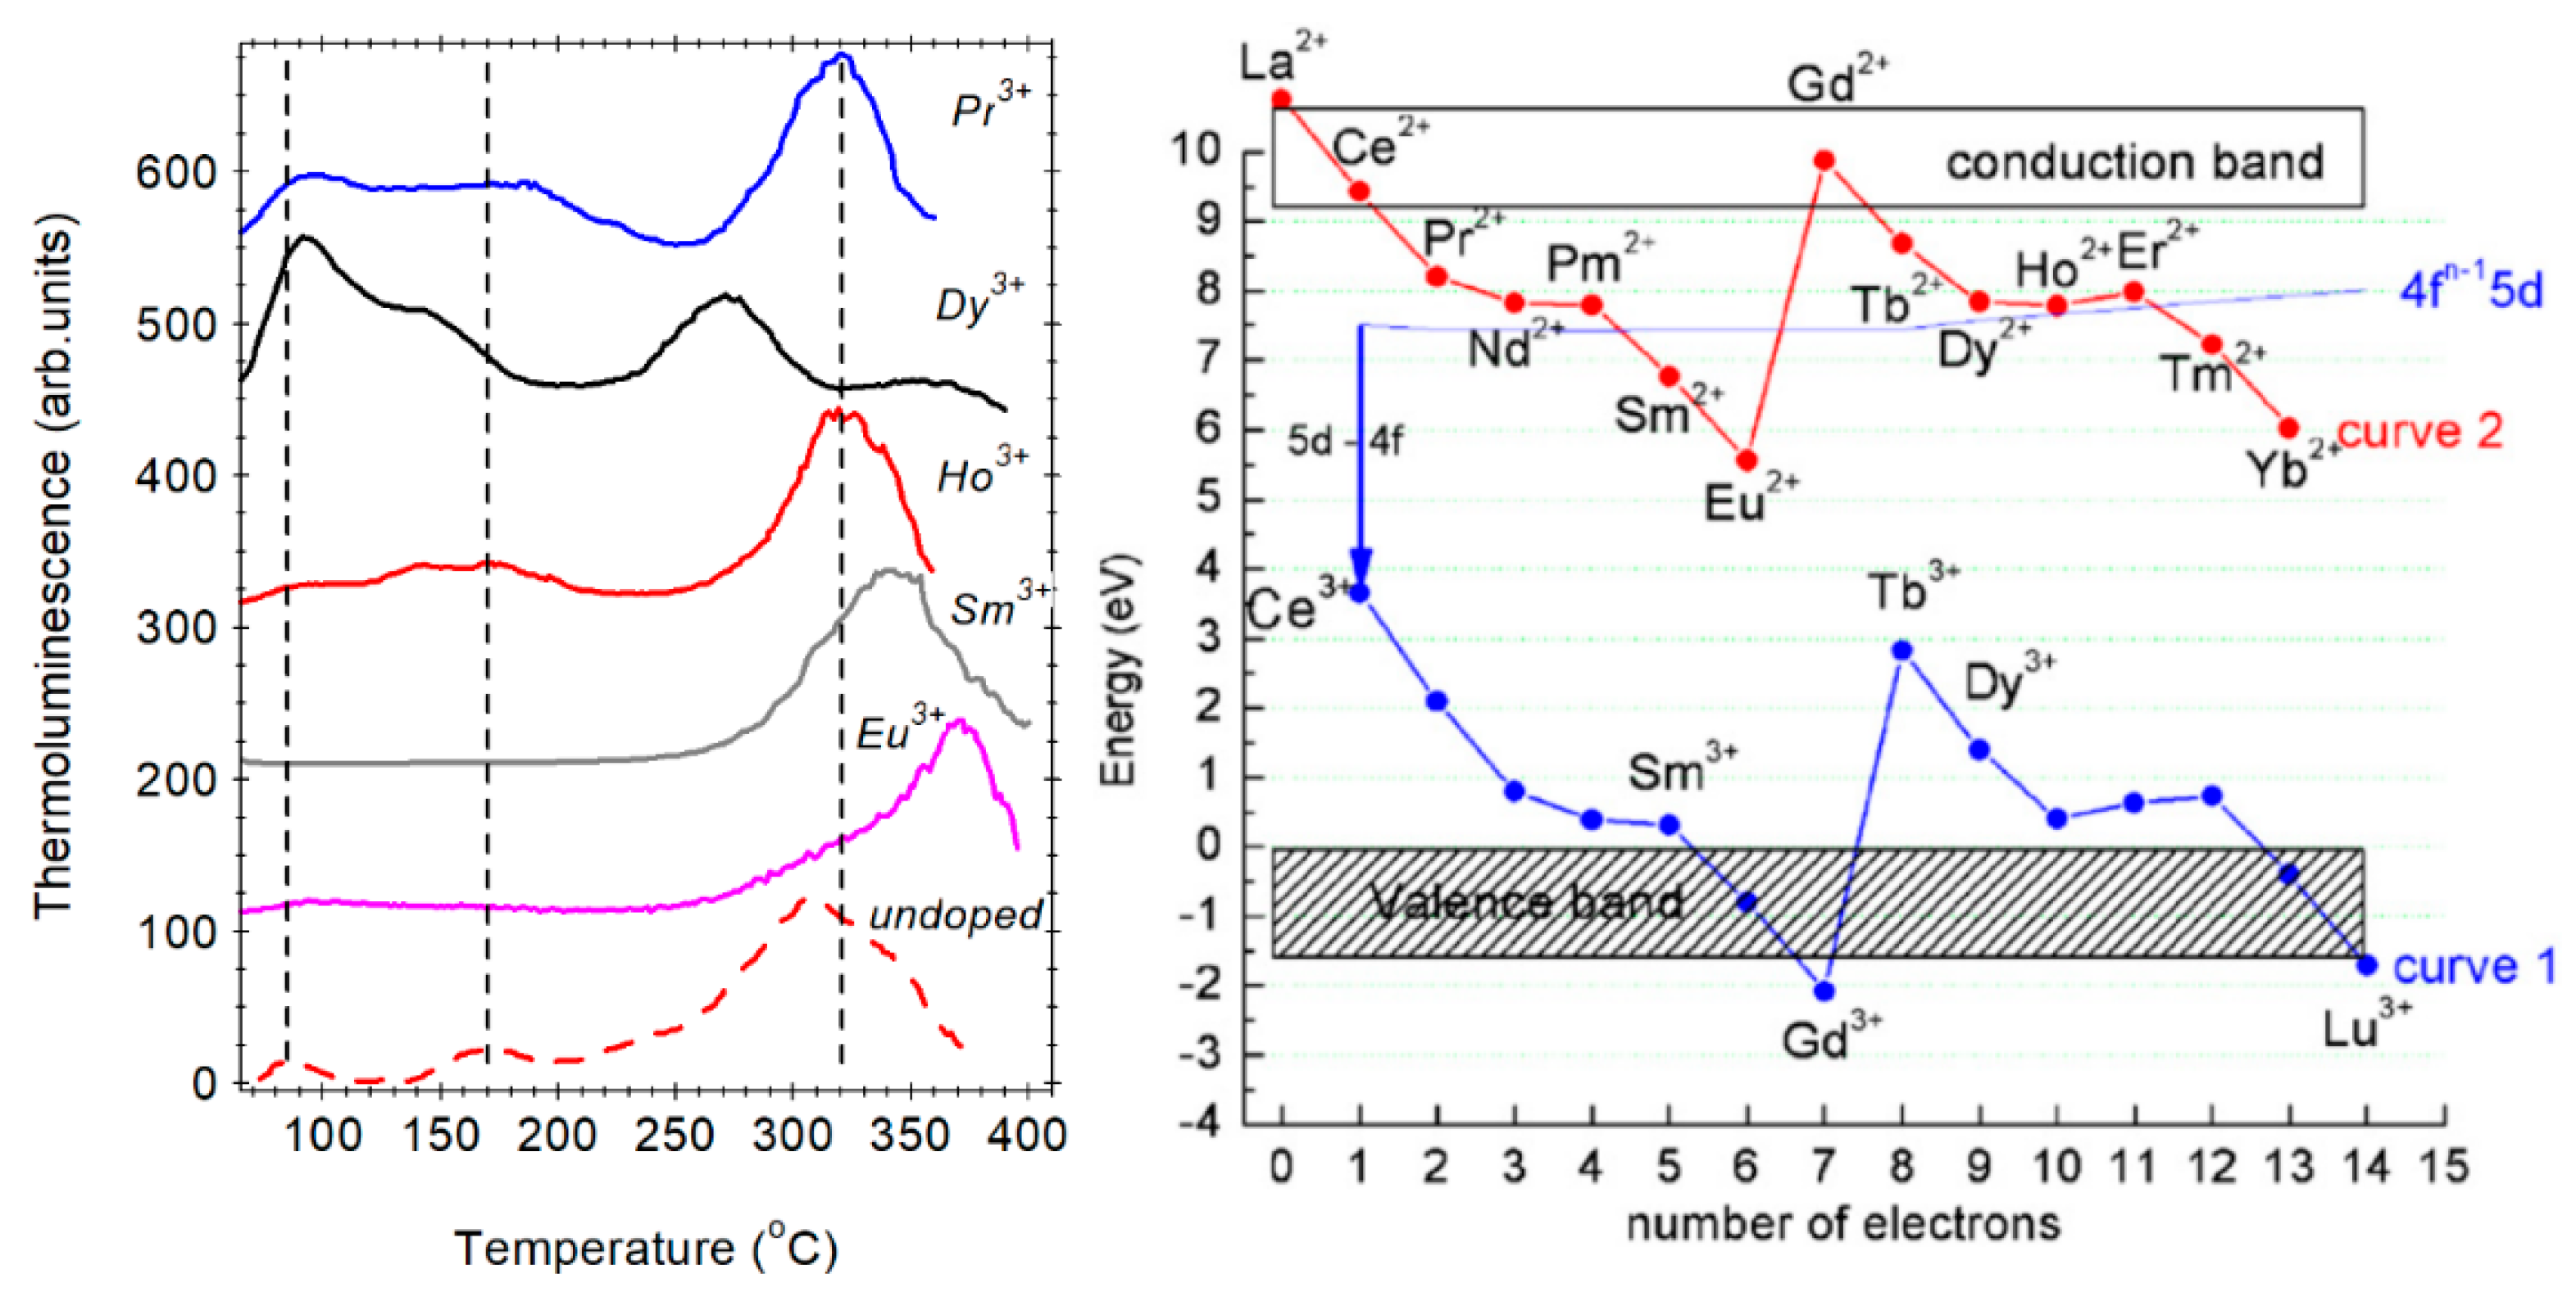
Thermoluminescence measurements recorded after X-ray irradiation of RE3+-doped SiO2–BaF2 glass ceramic indicated that new deep trap levels are introduced by the RE3+-doping: ≅140 °C (for Ho3+, Dy3+), 340 °C (for Sm3+), and 370 °C (for Eu3+); in undoped glass ceramic, the TL peak was observed at 383 °C. The glow peaks were assigned to the recombination of RE3+-related electron traps located mainly inside the BaF2 nanocrystals (Figure 10). Within the series, the trivalent lanthanide ions act as increasingly deeper electron trapping centers [34,35,36,37,38] and this can be observed as glow peaks shift in the temperature scale [36]. The glow peaks energy within the energy levels model proposed for the crystals might be influenced by the nanosize-related effects on the band gap energy.
3.1.4. SiO2–PbF2 Oxyfluoride Glass Ceramic
The first study on Er3+-doped SiO2–PbF2 oxyfluoride glass ceramic made by Luo et al. [44] assigned the crystallization of β-PbF2 phase to a diffusion-controlled process of three-dimensional growth with decreasing nucleation. It was assumed that Er3+-ions segregated at the surface of the crystallites and hindered the growth of β-PbF2, thus postponing the crystallization. Later on, the studies were extended to crystallization behavior, structural investigation, and optical properties of other rare earth doped SiO2–PbF2 oxyfluoride glass ceramics.
Glass ceramic containing Eu3+/Tb3+ singly-doped β-PbF2 nanocrystals containing nanocrystals of around 10–15 nm size embedded in silica amorphous hosts were synthesized and their optical properties studied [12,45,46]. Luminescence decay kinetics showed non-exponential decays with shorter and longer luminescence lifetimes: (Eu3+: τ1(5D0) = 0.90 ms, τ2(5D0) = 5.15 ms; Tb3+: τ1(5D4) = 0.48 ms, τ2(5D4) = 4.01 ms) corresponding to two different surroundings around Eu3+ and Tb3+ dopants, silica glassy hosts, and β-PbF2 nanocrystals. The analysis of the luminescence intensity ratios as well as double-exponential character of luminescence decay curves clearly indicated the incorporation of RE3+ dopant ions into formed low phonon β-PbF2 nanocrystalline phase.
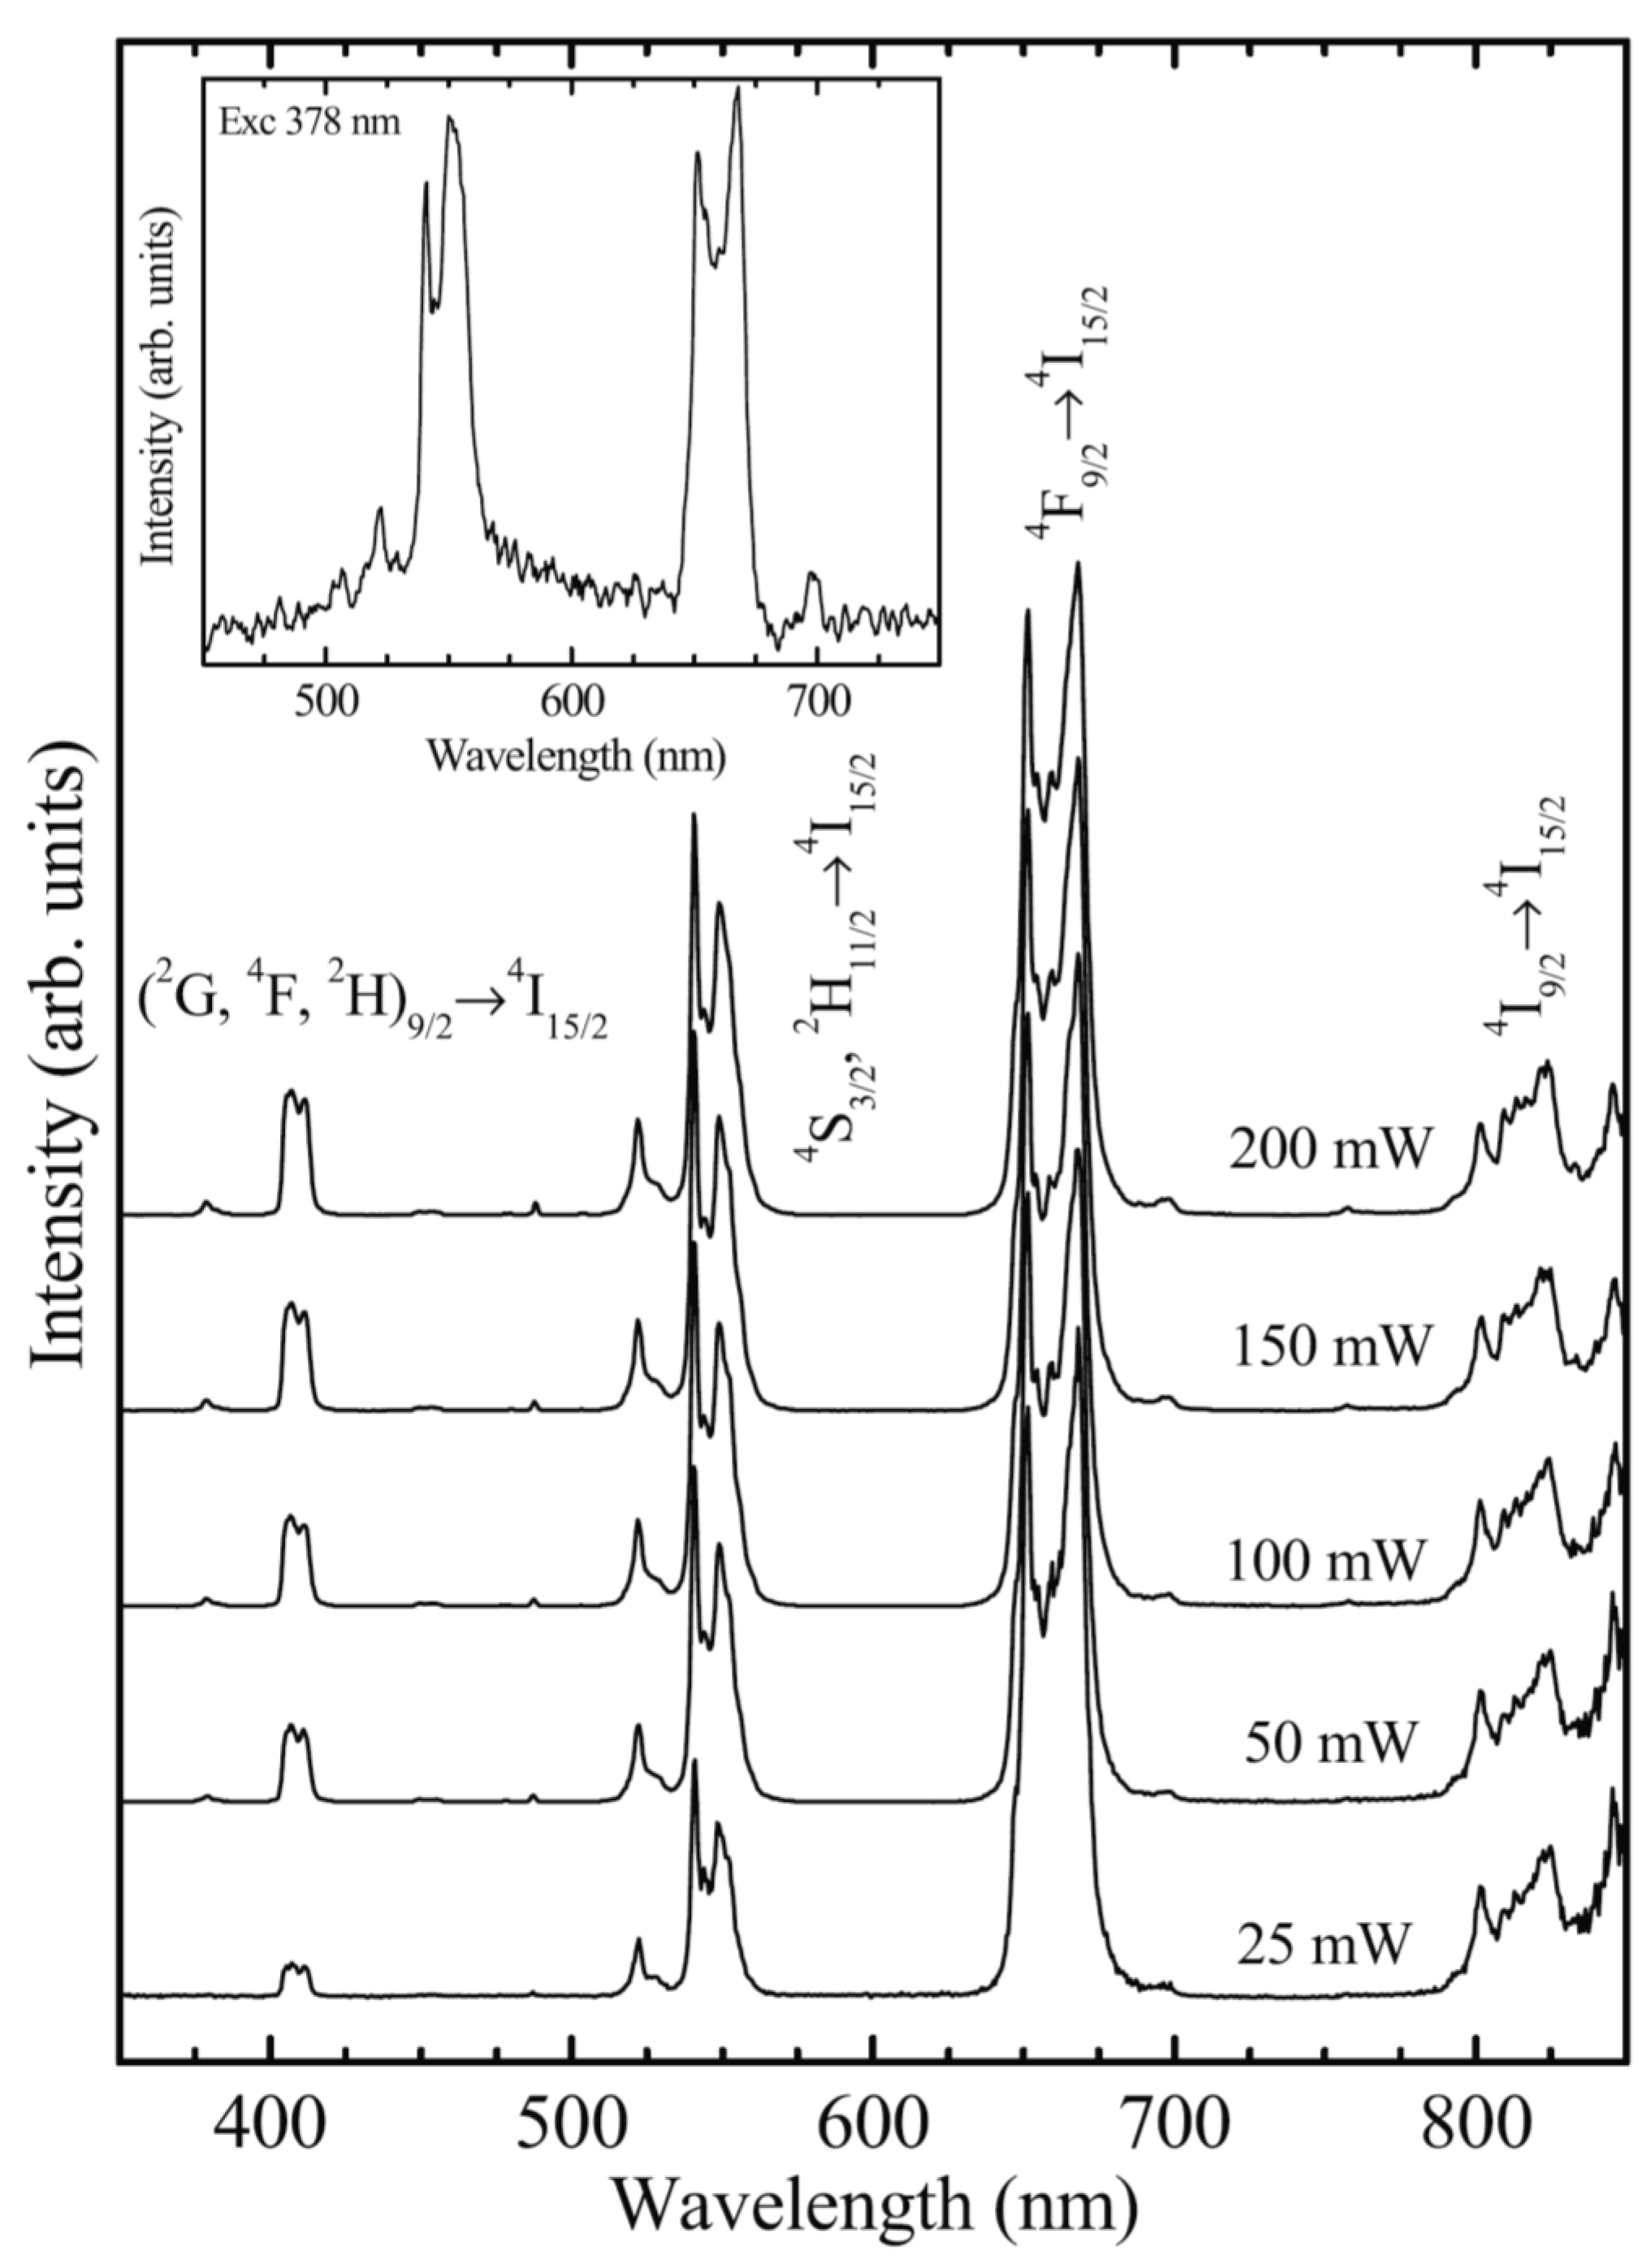
The up-conversions properties of transparent 0.3Yb3+/0.1Er3+ (mol%) co-doped 90SiO2–10PbF2 oxyfluoride glass–ceramics were extensively studied by J. del-Castillo et al. [47,48]. X-ray diffraction and electron microscopy analysis showed the precipitation of cubic β-PbF2 nanocrystals varying from 5 to 25 nm depending on heat treatment conditions at low temperatures, i.e., 300–400 °C. The up-conversion luminescence spectra showed green ((2H11/2, 4S3/2) → 4I15/2) and red (4F9/2 → 4I15/2) luminescence at 520–540 and 660 nm, respectively, accompanied by weaker blue luminescence at 410 nm (2H9/2 → 4I15/2) all assigned to the Er3+ transitions; the Stark splitting is consistent with the ions incorporation within the nanocrystals that assure an efficient energy transfer between ions (Figure 11).
The analysis of the dynamics of the up-conversion emissions indicated that distinct energy transfer excitation pathways are responsible for populating the luminescent levels: two and three photon processes for red-visible emission at 520–540 nm and 660 nm, and blue emission at 410 nm, respectively. Moreover, white up-conversion luminescence was obtained by combining the blue and red upconversion emissions band of Tm3+ with the upconversion green emission bands of Er3+ or Ho3+ and by using different pump powers and ratios between co-dopants [48].
3.2. SiO2–MeF3 Oxyfluoride Glass Ceramic (with Me = La, Y, Gd, Ce)
Rare-earth doped trifluorides and the corresponding oxyfluoride glass ceramics are attractive optical materials because of their wide band-gap, high solubility of rare-earth ions without additional charge compensation, and possible energy transfer (ET) processes to other co-dopant ions (for Gd3+ and Ce3+).
3.2.1. SiO2–LaF3 Oxyfluoride Glass Ceramic
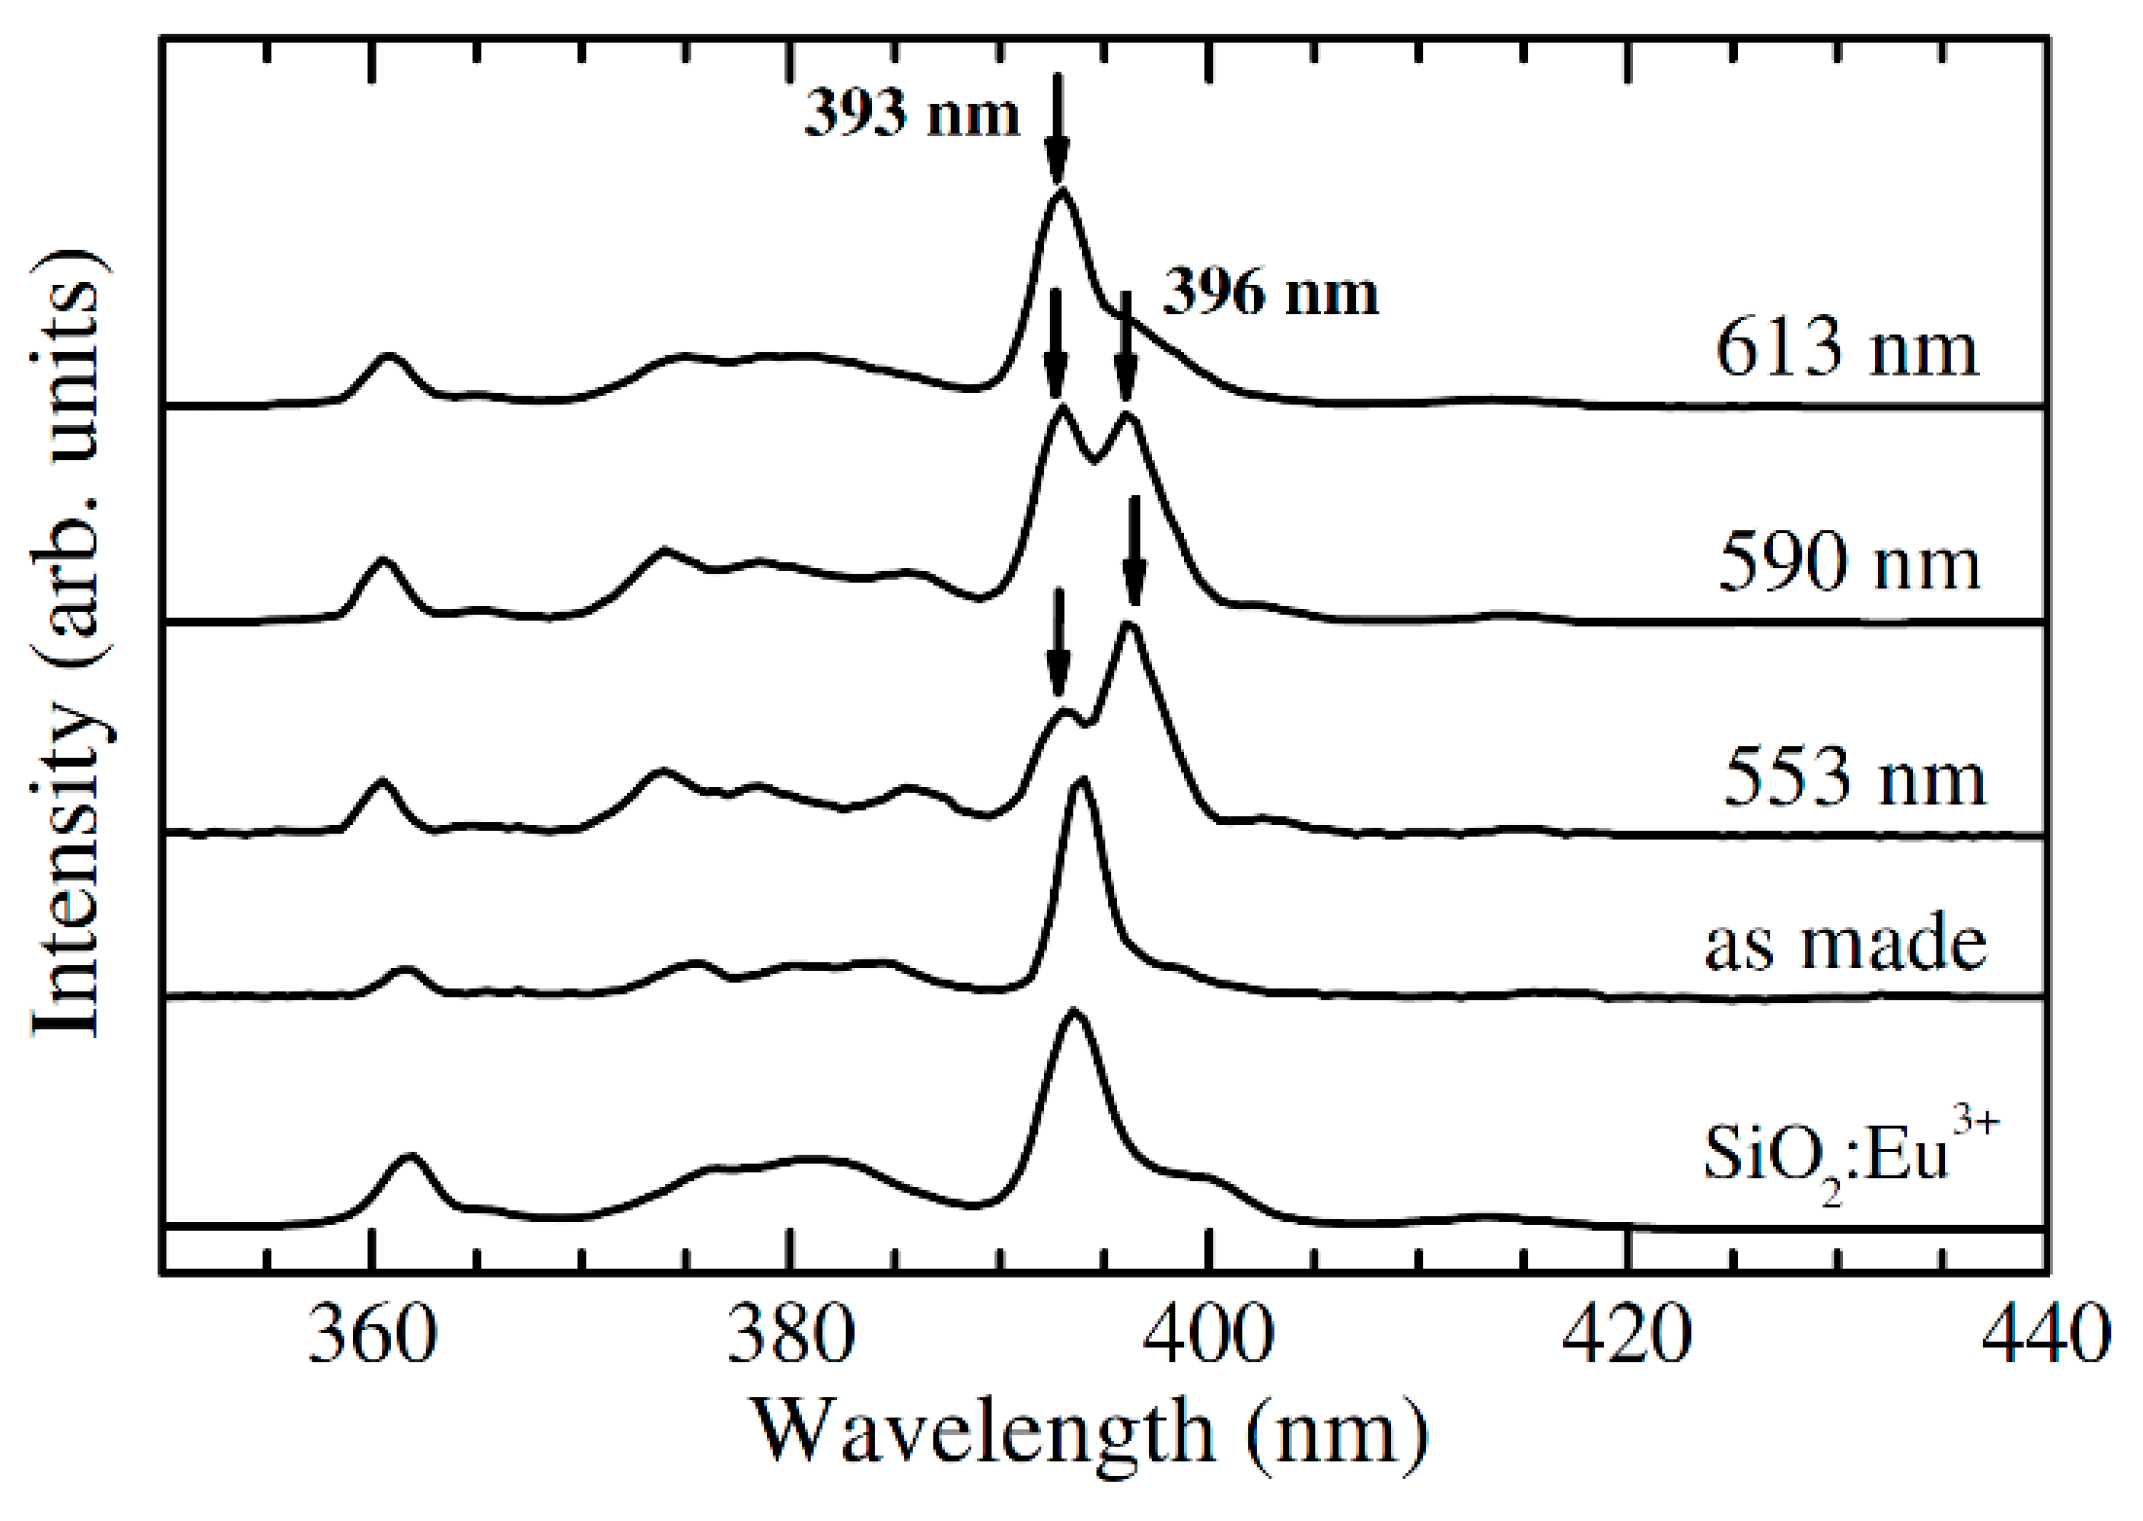
The first studies on the glass ceramization investigations in the SiO2–LaF3 system revealed the importance of controlling the synthesis and heat treatment parameters [5,6,7]. Recent investigations on the crystallization process of SiO2–LaF3 glass–ceramics indicated a chemical reaction, followed by the fast precipitation of LaF3 crystals and not diffusion-controlled nucleation and growing process, as in the melt-quenched glasses [10]. Structural and optical investigations of nano-structured Eu3+-doped SiO2–LaF3 transparent glass–ceramics calcinated at 800 °C [49] were used to investigate the Eu3+ ions partition in both glassy and crystalline phases. Site selective luminescence spectroscopy revealed the 393 nm excitation peak assigned to the Eu3+ ions in the silica glassy phase, whereas the 396 nm peak would correspond to Eu3+ ions partitioned into LaF3 nanocrystals (Figure 12). It is concluded that about half the Eu3+ ions are partitioned into fluoride nanocrystals, while the rest remains in the glassy phase.
The liquid sol transformation to xerogel and then Eu-doped SiO2–LaF3 glass ceramic was investigated by using photoluminescence spectroscopy [20,50,51]. The Eu3+ luminescence spectra and luminescence decay analysis showing a double-exponential character (with τ1(5D0) = 2.07 ms, τ2(5D0) = 8.07 ms and τ1(5D0) = 0.79 ms, τ2(5D0) = 9.76 ms for powders and glass ceramics, respectively) indicated the incorporation of optically active Eu3+ ions from amorphous silica framework into the low phonon energy LaF3 nanocrystalline phase. Moreover, the intensity ratio between the two visible emissions (5D0–7F2/5D0–7F1) was used to analyze the local symmetry around Eu3+ ions: the observation of the ratio value decrease is consistent with the ions’ incorporation within the LaF3 nanocrystals.
Up-conversion luminescence properties and the mechanism were investigated in 95SiO2–5LaF3:0.1Er3+ glass ceramic [52] (Figure 13) and Yb–Er or Yb–Ho, Yb–Tm doped SiO2–LaF3 glass ceramics [53,54,55,56]. Segregation of LaF3 nanocrystals in the matrix was confirmed by X-ray diffraction and upconversion emissions associated with the Er, Ho, and Tm ions in the nanocrystals were observed under 980 nm IR light excitation. Color tuneability and white light generation were observed in triple Yb3+/Ho3+/Tm3+ co-doped SiO2–LaF3 nano glass ceramics [57].
3.2.2. SiO2–YF3 Oxyfluoride Glass Ceramic
Structural and morphological investigations of Eu3+-doped SiO2–YF3 sol–gel nano-glass ceramics have indicated the precipitation of YF3 nanocrystals with an average diameter of about 15 nm [57]. The reducing of the (5D0–7F2/5D0–7F1) intensity ratio value from 2.82 to 0.66 as well as bi-exponential character of decay curves (with shorter and longer lifetimes, 0.86 and 1.14 ms) was assigned to the incorporation of Eu3+ ions in both glassy and YF3 nanocrystalline phases, respectively.
An exhaustive analysis of the luminescence properties of (Eu3+, Sm3+) doped SiO2–YF3 structured glass–ceramic containing nanocrystals of around 11 nm was performed by A. Carlos Yanes et al. [23]. Selective excitation wavelengths and luminescence decay measurements allowed discerning between ions residing in precipitated YF3 nanocrystals and those remaining in a glassy environment; a large fraction of optically active ions is efficiently partitioned into nanocrystals. Moreover, for Yb3+–Tm3+ co-doped samples, bright and efficient up-conversion was observed, as well as very intense high-energy emissions in the UV range strongly dependent on the Yb3+ doping level opening the way to developing short-wavelength solid-state lasers for various photonic related applications [23]. The investigations of Tb3+/Eu3+ co-doped sol-gel glass ceramic materials containing MF3 (M = Y, La) nanocrystals showed Tb3+ → Eu3+ energy transfer process (ET) accompanied by multicolor emission due to the visible 4fn–4fn transitions of Tb3+ and Eu3+ ions [58].
3.2.3. SiO2–MeF3 Oxyfluoride Glass Ceramic (with Me = Gd, Ce)
Oxyfluoride glass ceramics containing GdF3 or CeF3 nanocrystals dispersed in the SiO2 matrix have been obtained and the optical properties of RE3+-ions studied. The energy levels overlap between the 6PJ states of Gd3+ and the UV-excited states of RE-ions promote an efficient energy transfer from Gd3+ to the RE3+ ions resulting in their characteristic photoluminescence. Crystalline phases analysis of RE3+-doped SiO2–GdF3 oxyfluoride glass ceramics has shown the precipitation of both hexagonal and orthorhombic GdF3 nanocrystals [59,60] or only orthorhombic one [61,62,63] in the silica matrix, depending on the synthesis path and the chemical composition of the system [50].
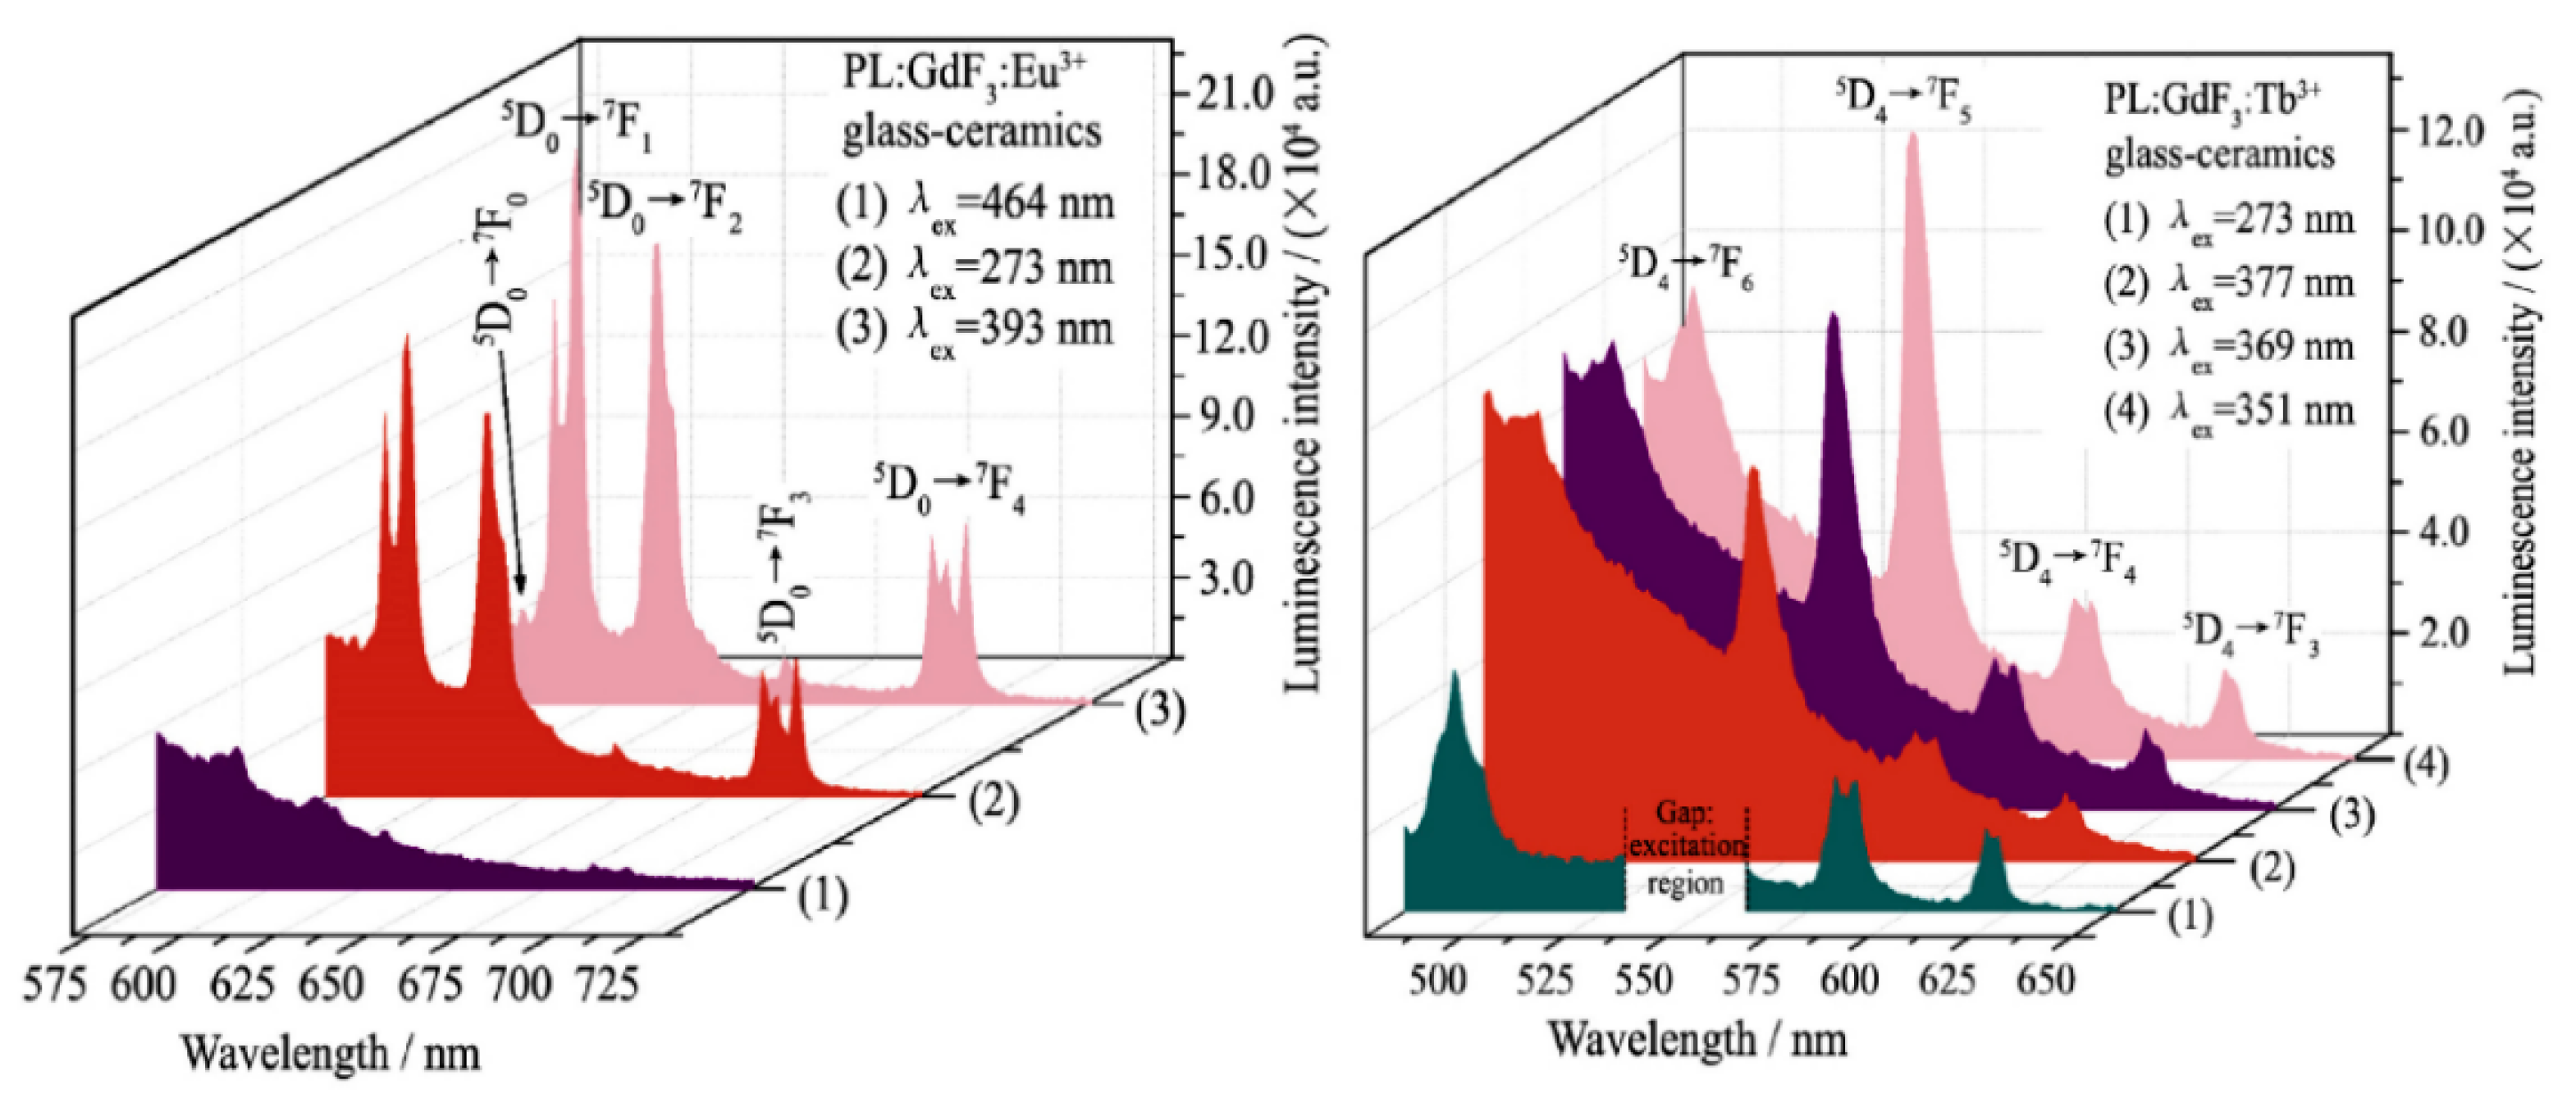
The luminescence spectra and luminescence decay measurements recorded on Eu3+/Tb3+ doped SiO2–GdF3 oxyfluoride glass ceramics indicate the incorporation of the RE3+ ions within the nanocrystalline phase and silica glass matrix (Figure 14). The energy transfer process from Gd3+ to Eu3+ or Tb3+ ions was evidenced by the excitation spectra and luminescence spectra recorded under Gd3+ ions excitation wavelength at 273 nm [63].
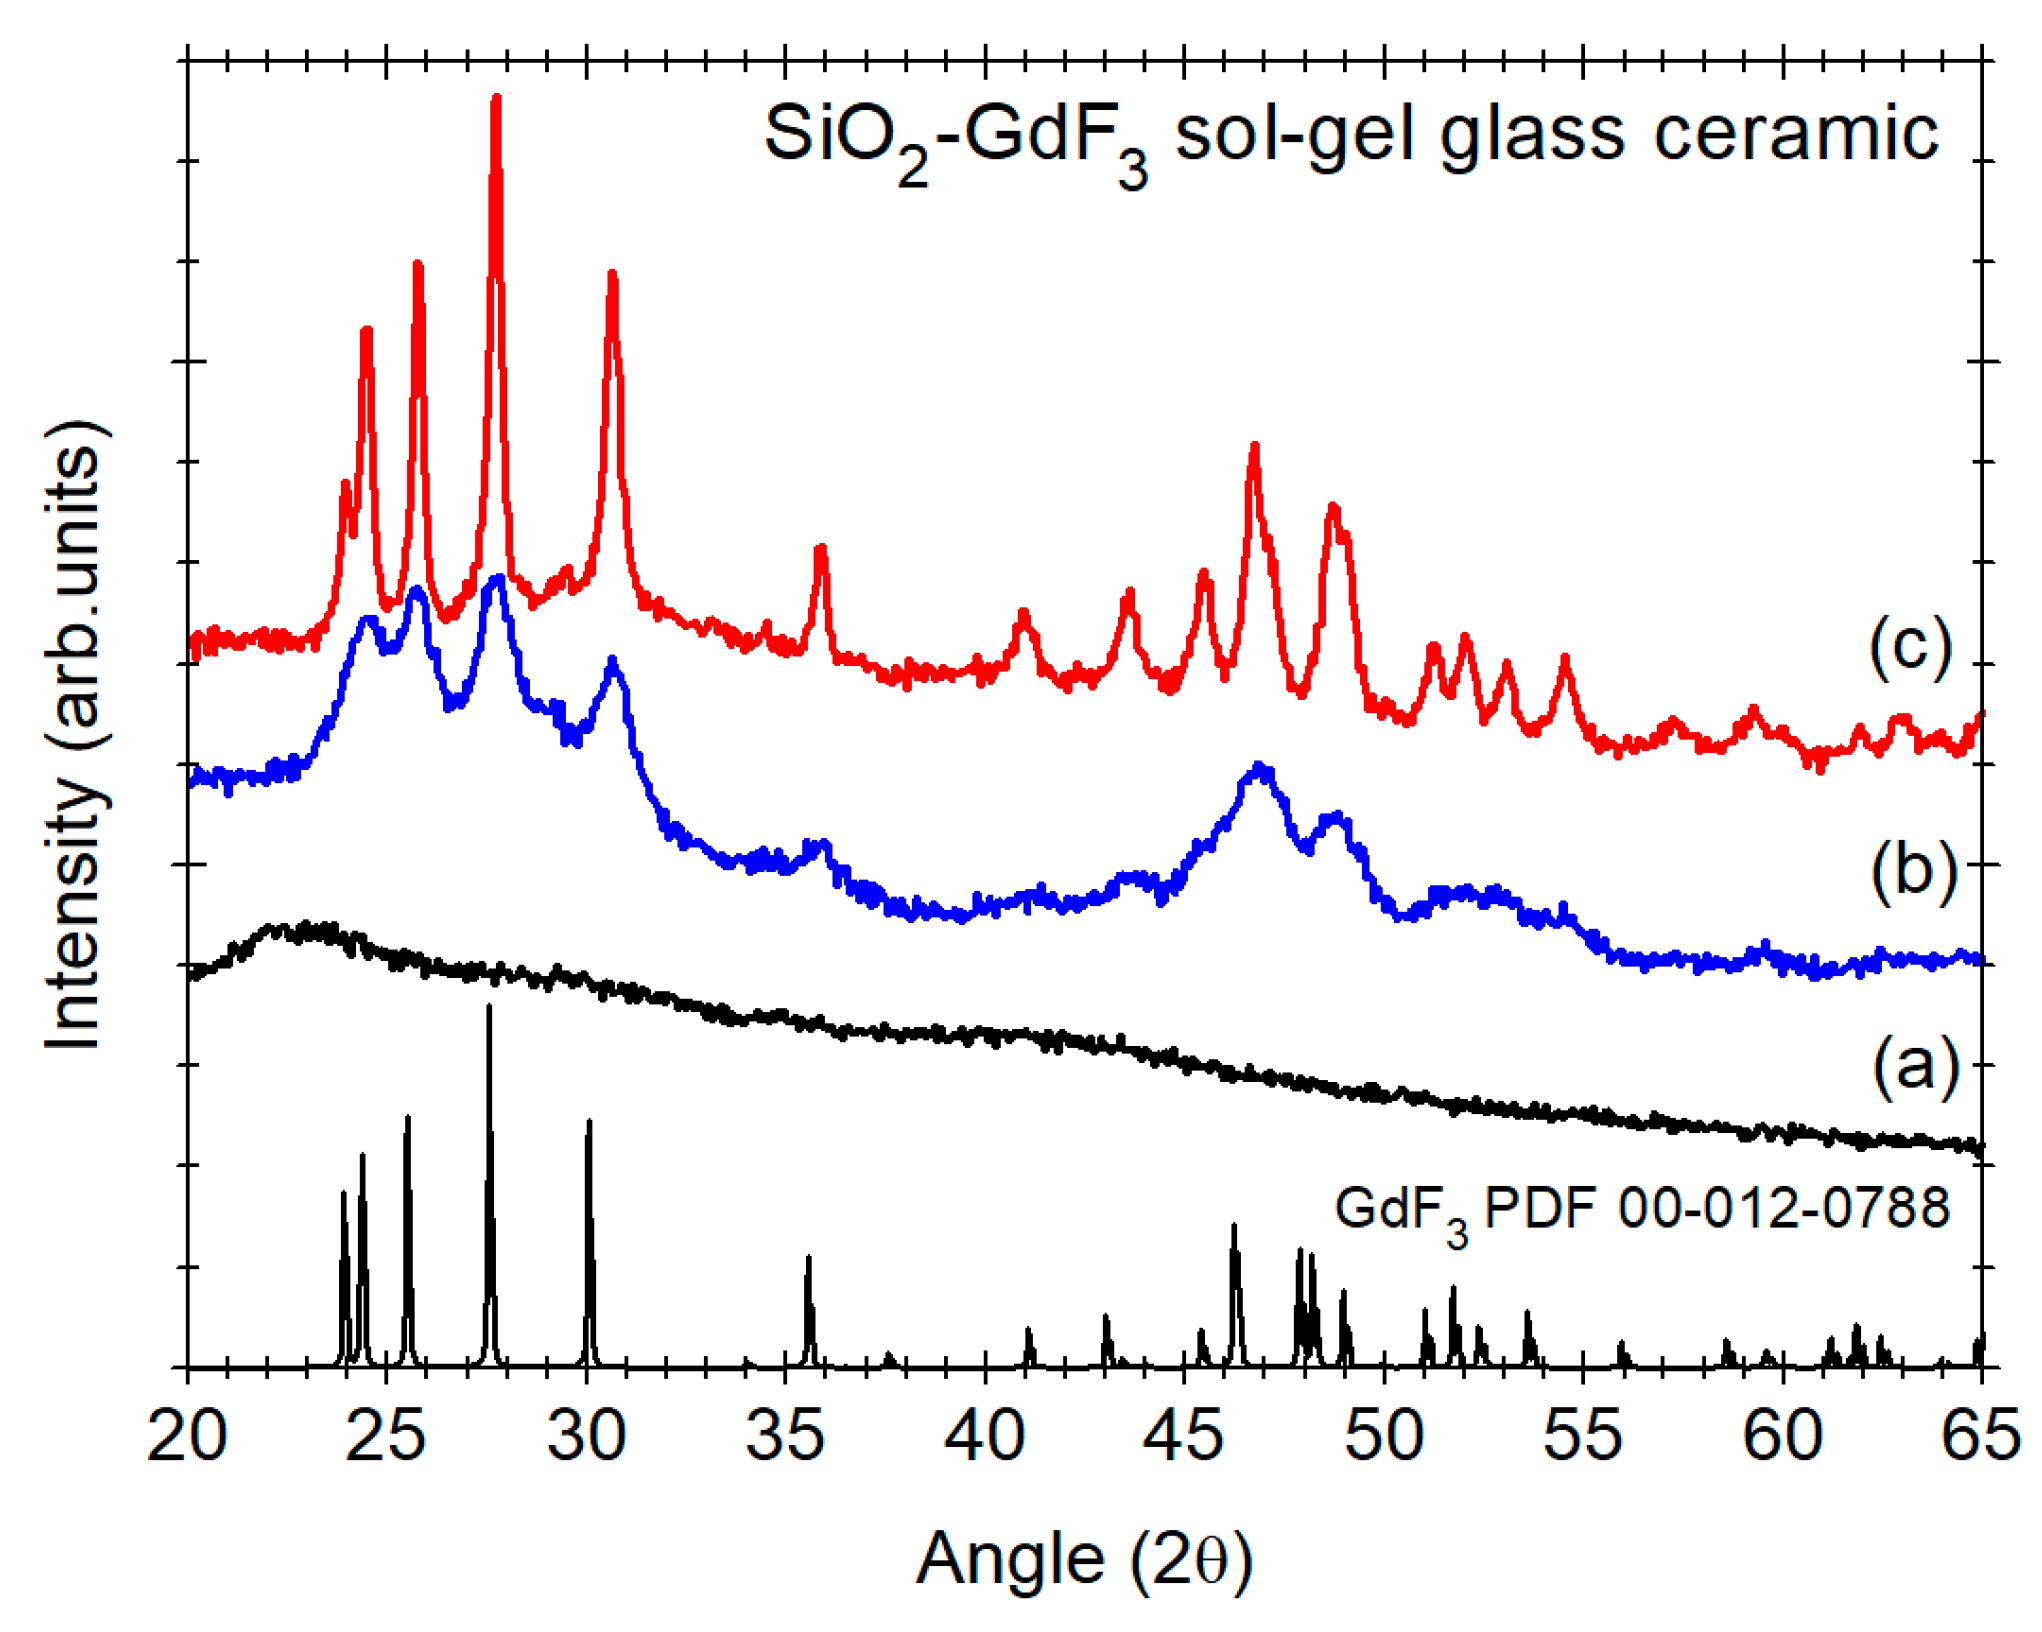
Recently we used Fujuhara’s approach [5] for the synthesis of Eu-doped and Yb/Er co-doped SiO2–GdF3 and SiO2–LiGdF4 [64,65] glass ceramics and the key role played by the nature of the RE-dopant ions and Li co-dopants ions in the stabilization of orthorhombic GdF3 phase: the nanocrystals size increase from 9 nm to 25 nm is accompanied by strong lattice distortion evidenced by XRD peaks shift towards higher angles [65] (Figure 15). Under 980 nm IR light pumping, we observed up-conversion luminescence signal assigned to the Er3+ ions (Figure 6), with more than one order of magnitude higher in Li co-doped glass ceramic.
For RE3+-doped SiO2–CeF3 sol–gel glass–ceramics with RE = Eu, Sm, Yb/Er, structural and morphologic characterization has showed precipitation of the CeF3 nanocrystals [66]. The analysis of the intense red–orange emissions due to Eu3+ and Sm3+ transitions and the excitation spectra confirmed the partition of a large fraction of these ions into the precipitated CeF3 nanocrystals. A cross-relaxation process occurs between Eu3+ and Ce3+ ions and therefore the emissions from higher 5D1 and 5D0 energy levels are inhibited by the phonon-assisted energy transfer between the ions. In addition, in the Yb/Er co-doped samples, the presence of Ce3+ ions as a phonon-assisted cross-relaxation channel is responsible for a strong emission at 1.5 μm, which also leads to a drastic inhibition of the up-conversion emission.
4. Thernary and More Complex Oxyfluoride Glass Ceramic
The sol-gel route has been used to obtain other transparent glass ceramic compositions comprising thernary fluoride nanocrystalline Me1Me2F4 phases such as: SiO2–NaYF4 [67], SiO2–NaLaF4 [68], SiO2–NaGdF4 [69], SiO2–KLaF4 [70], SiO2–KYF4 [71], SiO2–LiYF4 [30,72,73] and their properties have been investigated. In these cases, the crystallization mechanism seems to be more complicated and the decomposition of metal trifluoroacetates is likely to be accompanied by some chemical reaction between metal and fluorine partners, followed by nanocrystalline phase precipitation within the glassy matrix. It was observed that the nature of the final precipitate crystalline phase is strongly dependent on the molar ratio between trivalent ion (Y, Gd, La) and alkali metals ions (Li, Na or K), and in general mixtures of fluorides were obtained (for LaF–NaLaF4 [68] and YF3–LiYF4 [30,72,73]) or different phase mixtures of the same compound (cubic and/or hexagonal NaGdF4 or KLaF4 nanocrystals [69,70]). Hence, an optimization of the initial composition and processing parameters (time and temperature) was required to obtain precipitation of the desired crystalline phase.
Optical properties of the Eu3+ ions were used to investigate local structure and xerogel to glass ceramic transformations in SiO2–NaYF4 [67] and SiO2–LiYF4 [30] glass ceramics. For Eu3+-doped SiO2–NaYF4 glass ceramics, cubic-NaYF4 nanocrystals of about 4–10 nm size precipitated during the thermal processing [67]. Site selective spectroscopy measurements allowed discerning ions in the amorphous silica glassy phase from those preferentially partitioned into a like-crystalline environment. Hence, a noticeable enhancement of the 613 nm luminescence from 3.1 to 5.7 ms by changing from amorphous surroundings (exciting at 464 nm) to those ions partitioned into nanocrystals (exciting at 392 nm) was observed. Moreover, the red to green emissions ratio (5D0–7F2/5D0–7F1) diminishes with the heat treatment indicating the partition of Eu3+ ions in the nanocrystals. In the SiO2–LiYF4 [72,73] glass ceramic, the precipitation of the LiYF4 nanocrystals was observed only for high Li excess (up to four molar Li/Y ratio). For a lower molar ratio, a glass–ceramic containing a mixture of YF3 and LiYF4 crystals or only YF3 phase (i.e., for stoichiometric ratio) was obtained [73]. The enhancement of Eu3+-lifetime values from 0.22 ms in the xerogel to 8.68 ms and the diminishing of the red to green emissions ratio were associated to the xerogel to glass ceramic transformation and Eu3+ ions partition in the nanocrystals [30]. Moreover, the group-theoretical analysis of the photoluminescence spectra has indicated that the Eu3+ ions incorporation occurs dominantly inside the LiYF4 nanocrystals with lower symmetry (C2v) sites than in polycrystalline pellet (D2d).
Transparent oxyfluoride glass–ceramics comprising Yb3+/Er3+ co-doped LiYF4 and NaYF4 nanocrystals showed green ((2H11/2, 4S3/2) → 4I15/2) and red (4F9/2 → 4I15/2) visible up-conversion luminescence due to the Er3+ ions incorporated in precipitated nanocrystals [73,74]. For Er/Yb co-doped SiO2–LiYF4 glass ceramic, the values of the quantum efficiencies for the red and green UC luminescences are much lower in the glass ceramic (η = 2% and η = 3.5%) compared to the pellet (η = 46% and η = 21%) [73], but similar to the Er/Yb co-doped glass ceramic containing CaF2 nanocrystals [40]. Moreover, the ratio between red and green up-conversion emission bands can be varied as a function of processing temperature and pump power resulting in color tunable up-conversion phosphors [74].
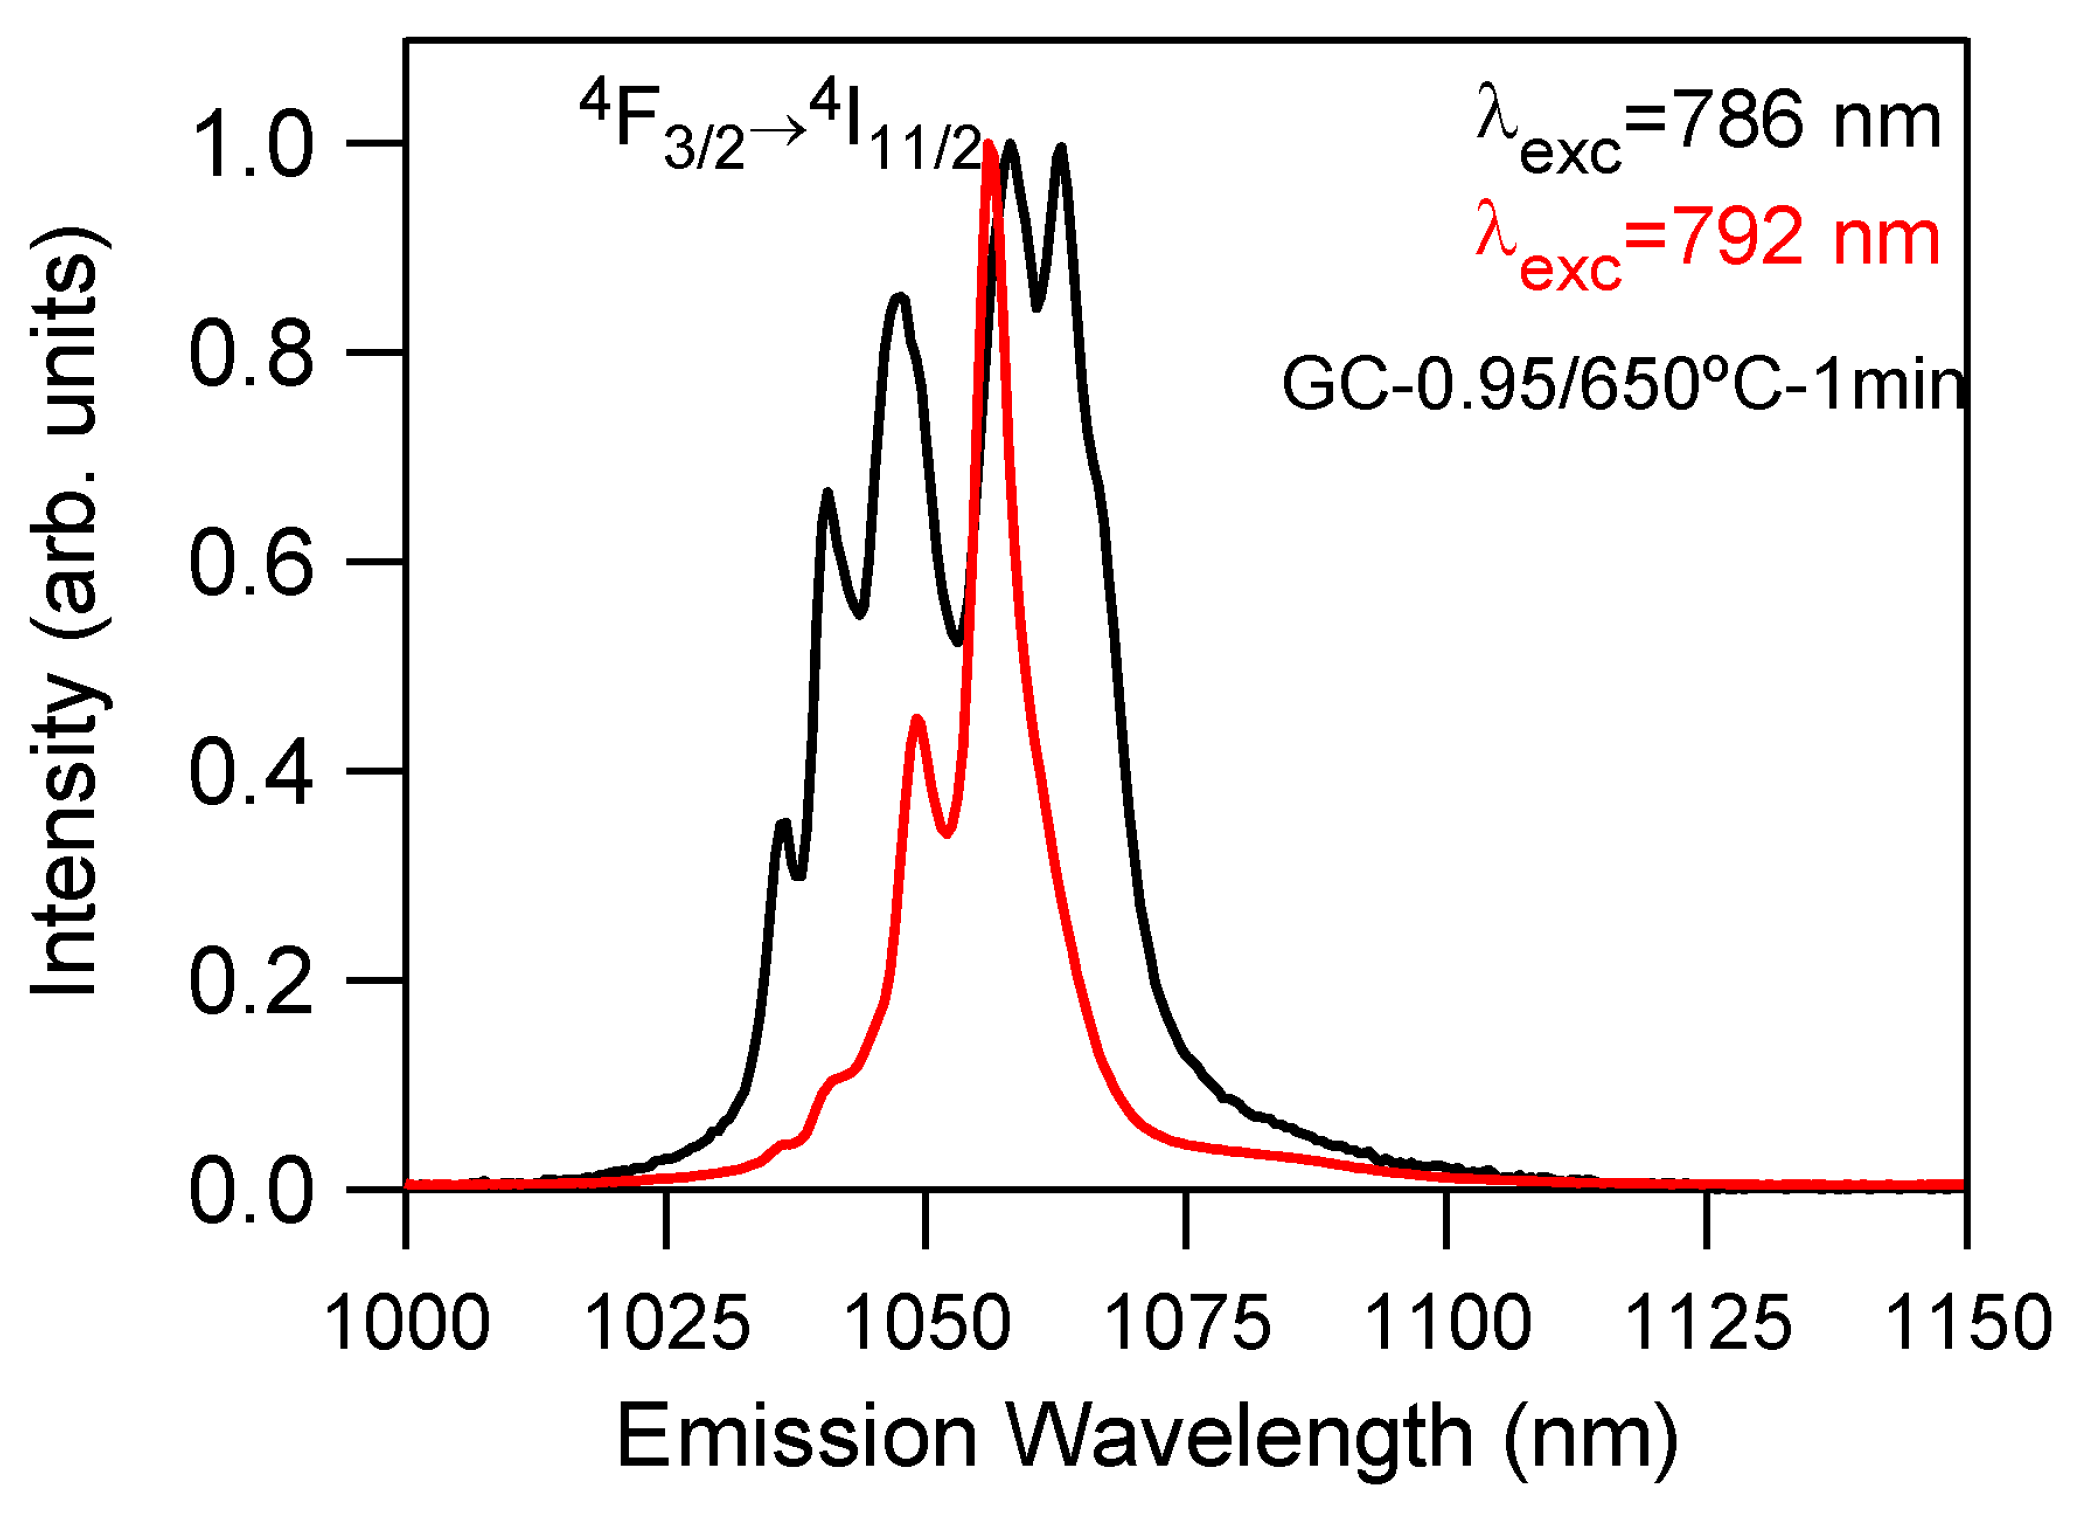
The investigations of the Nd3+-doped SiO2–NaLaF4 glass ceramic showed both LaF3/NaLaF4 crystalline phases for different initial compositions and annealing temperatures; the crystallization of NaLaF4 was only promoted for Na deficiency in the precursors and higher temperatures calcination, above 650 °C [68]. The incorporation of Nd3+ ion into NaLaF4 and LaF3 nanocrystals was confirmed by site-selective emission and excitation spectra (Figure 16).
For the SiO2–NaGdF4 glass ceramic, the precipitation of cubic and/or hexagonal NaGdF4 nanocrystals with a size ranging between 4 and 24 nm was observed, depending on the Na:Gd ratio and processing conditions (temperature and time) [69]. The Na:Gd ratio was optimized to obtain the crystallization of β-NaGdF4 phase, more adequate for luminescent applications and for a molar ratio 0.95:1, the precipitation of β-NaGdF4 (JCPDS 027-0699) phase was observed after treatment at 550 °C. Luminescence results showed Eu3+ ions’ incorporation mainly in NaGdF4 NCs, and an efficient energy transfer Gd3+ to Eu3+ was observed. Electron microscopy investigations of SiO2–KLaF4 glass ceramics confirmed the coexistence of cubic (α-phase) and hexagonal (β-phase) KLaF4 phases, the last one being favored for high temperature calcination [70]. The spectral features of the Nd3+ ions dopants confirmed the incorporation of Nd3+ ions in both crystalline phases, with emission of Nd3+ predominantly in the β-KLaF4 hexagonal phase.
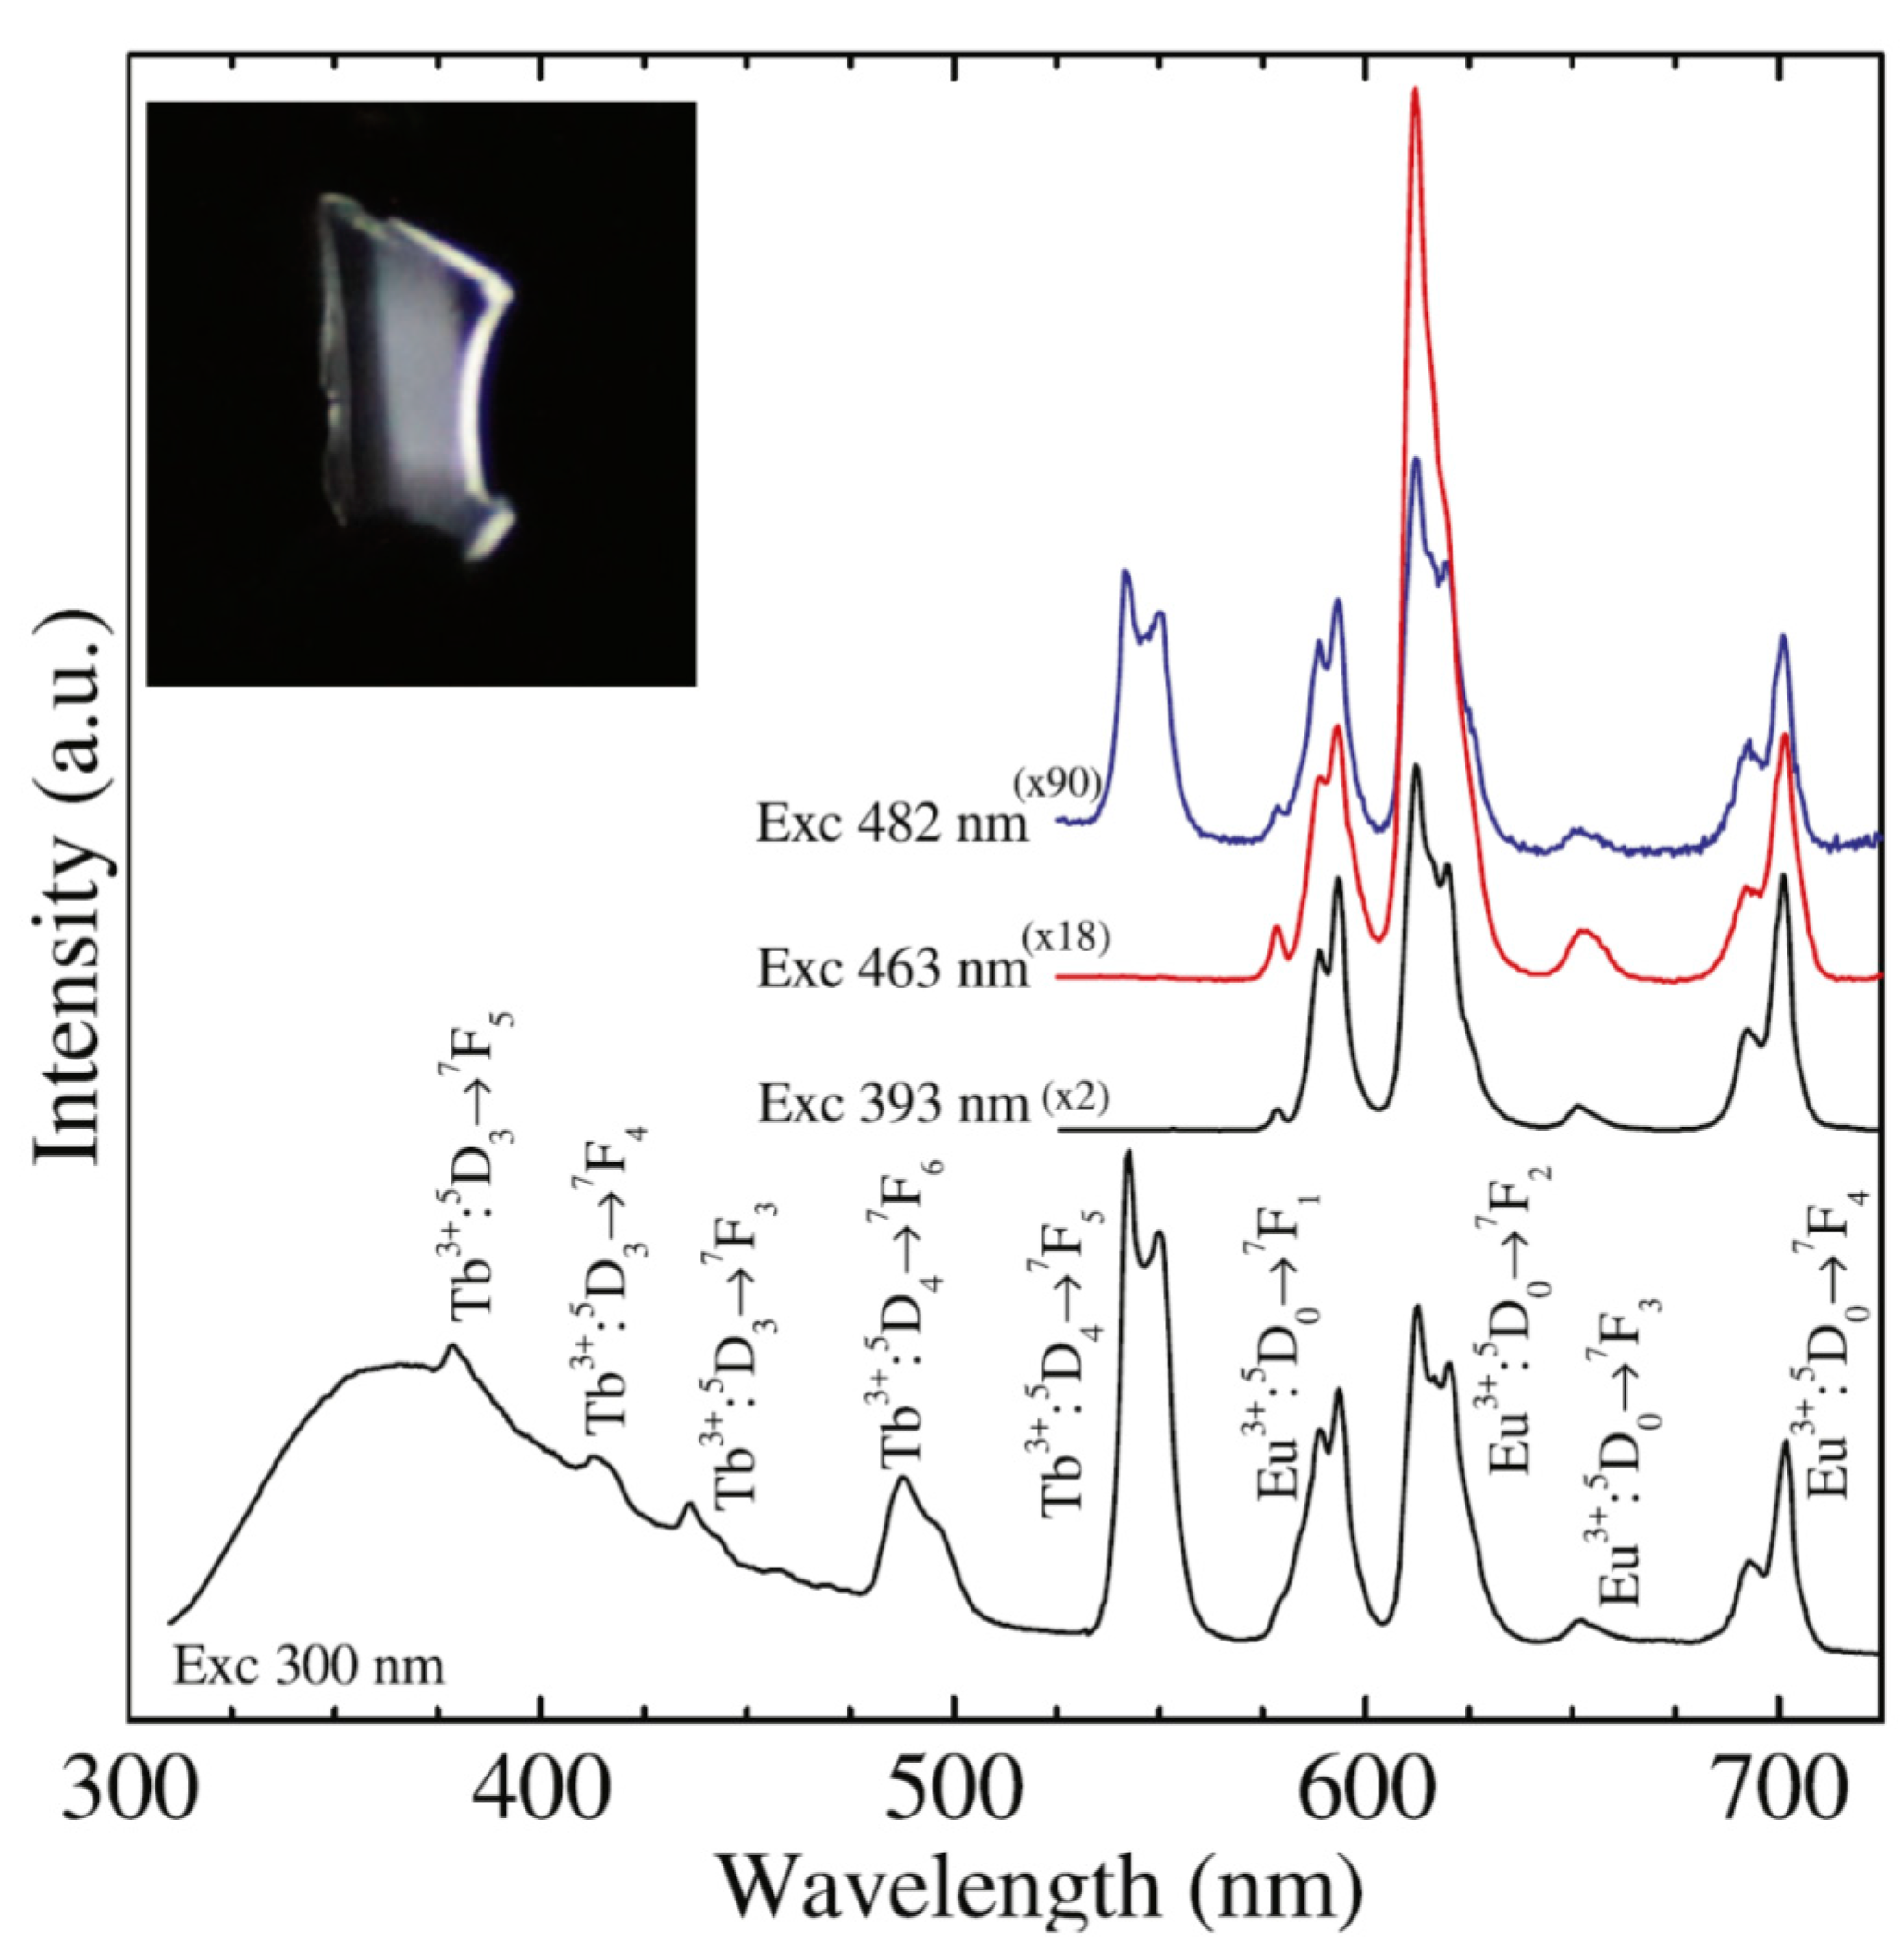
The UV light excitation of Ce3+/Tb3+/Eu3+ triply-doped SiO2–KYF4 glass ceramics is accompanied by an efficient ET processes between Ce3+ and Tb3+/Eu3+ ions, followed by their characteristic green and reddish-orange emission, respectively [71]. The emitted color can be tuned by varying the content of Eu3+ ions and/or the excitation wavelength, and white light generation was reached (Figure 17). In SiO2–KYF4 transparent glass–ceramics comprising Yb3+, Er3+, Tm3+ co-doped KYF4 nanocrystals, white light generation was obtained by simultaneous red, green, and blue additive up-conversion emissions of the RE3+-ions dopants [75].
More complex sol–gel glass ceramics, containing RE3+-doped BaYF5 and BaGdF5 nanocrystals embedded in silica matrix, have been produced by appropriate annealing of the corresponding precursor xerogel [76,77]. Optical measurements confirmed the distribution of a significant fraction of RE3+ ions into the precipitated BaYF5 fluoride nanocrystals environment [76]. For RE3+-doped (Eu3+, Sm3+, Dy3+ or Tb3+) glass ceramics containing BaGdF5 nanocrystals, intense visible emissions through efficient energy transfer from Gd3+ to RE3+ ions were observed, which leads to consider these materials as potential emitting phosphors for color converted UV LED [77]. Sol-gel glass ceramics comprising Tm3+ co-doped SiO2–BaY0.78−xGdxYb0.2Tm0.02F5 (x = 0–0.78) nanocrystals showed UC luminescence in the NIR, visible, and UV range assigned to the Tm3+-dopant ions distributed into nanocrystalline environments [78]. The substitution of Y3+ by Gd3+ leads to a continuous decrease of the UV emission intensities due to an effective energy transfer between Tm3+ and Gd3+ ions.
As RE3+-doped Lu-based fluorides are investigated for their applications as scintillators due to high absorption cross-section for any kind of radiation, the sol-gel route has been used to prepare RE-doped SiO2–Sr2LuF7 glass ceramics and their structural and optical properties investigated [79]. The luminescent features of Eu3+ ions, used as structural probes, revealed the distribution of RE3+ ions in both glass matrix and fluoride nanocrystals. Under 980 nm laser excitation of Yb3+–Tm3+, Yb3+–Er3+ and Yb3+–Ho3+ co-doped glass ceramics, intense UV, vis and NIR up-conversion emissions were observed.
5. Oxychloride Glass Ceramic
Sol-gel glass ceramics containing Er3+-doped BaCl2 nanocrystals of about tens of nm size embedded in a silica matrix were prepared but by replacing TFA with trichloroacetic acid (CCl3COOH) [80]. The crystallization process relies on thermal decomposition of Ba-trichloroacetate at about 300 °C followed by subsequent growth into BaCl2-nanocrystals at 745 °C; Er3+-ions are incorporated during the nanocrystals’ growth. Under 810 nm laser light pumping, it shows green ((2H11/2, 4S3/2) → 4I15/2) and red (4F9/2 → 4I15/2) Er3+ up-conversion luminescences, much weaker (only about 10%) compared to NaYF4:Er3+ (18%). Glassy nanocomposites containing Eu3+-doped LaOCl nanocrystals of about tens of nm size embedded in a silica matrix were prepared with the sol–gel route using trichloroacetic acid (CCl3COOH) as a chlorination agent [81]. It was shown that the LaOCl nanocrystalline phase precipitation is the result of the lanthanum chloride hydrolytic and oxidative reactions. As the annealing temperature increases, nanocrystals grow up to tens of nm size and Eu3+-ions are gradually incorporated inside the LaOCl nanocrystals, with a (C4v) local coordination symmetry.
6. Perspectives and Applications
In summary, the synthesis and investigations of sol-gel derived oxyfluoride glass ceramics are based and limited to the synthesis initially developed by Fujihara et al. [5,6,7], using TMOS and/or TEOS as the SiO2 precursor and TFA as the fluorine source and active fluoride crystalline phase fraction of about 5%, much lower than in melt-quenched glass ceramics. Most of the research efforts were dedicated to oxyfluoride glass ceramics, being focused primarily on optical (luminescence) properties of the RE-doped nanocrystals. Therefore, future research efforts are expected to be dedicated to the discovery of new glass ceramic materials with multifunctional properties (optical, electric, and magnetic) for new and improved applications.
Transparent glass ceramic waveguides offer specific characteristics of capital importance in photonics and the sol-gel approach has proved to be a very convenient and flexible way to deposit glass ceramic thin films on a variety of substrates for different applications, such as planar waveguides or integrated optics. New glass ceramic thin films comprising RE-doped oxide semiconducting nanocrystals such as SnO2, ZrO2, CeO2, HfO2 have been already obtained and optical properties studied [82,83,84,85,86]. The investigations of both optical and electric properties would be interesting for both basic and applied research.
New developments of the glass ceramic films can include patterned glass ceramic thin films that can be produced by using laser-induced crystallization [87] allowing the development of active integrated optical circuits. Moreover, a higher crystallized fraction of the nominal active fluoride crystalline phase is expected to improve the optical properties. Recent studies have shown that crack-free SiO2–LaF3 glass ceramic films with a crystalline LaF3 crystalline fraction of 18 wt% can be obtained [18].
The investigations of glass ceramics with Gd3+-based fluorides nanocrystals embedded in the glass matrix were limited to the analysis of luminescence properties of the co-dopant RE-ions [61,62,63]. The magnetic properties related to Gd3+ ions and the influence of the magnetic field on optical properties, in particular on the energy transfer processes, have been overlooked/missed. Such novel, multifunctional magneto-optical materials allow the intertwining between the magnetism and photonics and might offer new opportunities for magneto-optical devices.
Sol–gel synthesis has been used to obtain not only thin films but also monolithic silica and glass ceramics [88,89] opening the opportunity to produce monolithic scintillating glass ceramics based on BaF2, CaF2, CeF3 and BaCl2. Proper co-doping with broad blue absorbing sensitizer ions (Bi3+, Sn3+, etc.) capable to transfer their excitation energy to neighboring activator ions might develop potential spectral down-conversion applications.
The optical properties investigations of glass ceramics were focused only on trivalent ions related ones and divalent Eu2+ and Sm2+ ions were omitted. Previous investigations [90,91] have shown the incorporation of the reduced Eu2+ and Sm2+ ions in sol-gel glasses (not ceramic ones) under moderate conditions of temperature and atmosphere in two steps, glass-formation, and their reduction to the bivalent state by calcination in reducing atmosphere. Eu2+ and Sm2+ ions have attracted significant attention because they have a great potential for various photonics-related applications or radiation detection. The Sm2+ ion shows persistent spectral hole burning (PSHB) and potential application for high density optical memories. On the other hand, Eu2+ doping is crucial for scintillators detectors or X-ray storage phosphor for digital imaging applications. However, the incorporation of such bivalent ions into the precipitated nanocrystals from the glass ceramics still remain an open problem.
A new approach for sol-gel glass ceramics was recently proposed by Cruz M.E. et al. (2020) [92], where dispersed nanocrystals were incorporated in the silica glass matrix. This approach allows the incorporation in the silica glass matrix of a much broader range of nanocrystalline phosphors such as Eu2+-doped persistent phosphors [93] or Sm3+-doped BaFCl for multilevel optical data storage applications [94].
As the optical properties are strongly influenced by the hydroxyl ions (present even after high temperatures calcination), new non-aqueous sol-gel approaches are highly desirable [95,96]. A first step was made by using hydrofluoric acid catalyzed sol–gel process [95] and the non-aqueous fluorolytic sol–gel synthesis of metal nano-fluorides [96].
7. Conclusions
In conclusion, sol-gel derived glass ceramic materials based on stabilized rare-earth doped nanoparticles embedded in a glass matrix were demonstrated as novel, attractive materials for photonics applications. However, the advantages of sol-gel chemistry and thin films’ deposition ability have not been fully exploited for advances in both basic and applied research. Therefore, the development of new glass ceramic materials with multifunctional properties for new and improved applications is highly desirable.
Author Contributions
The manuscript was written by M.S. in collaboration with C.S. and C.B. All the authors contributed to discussions and reviewed the manuscript. All authors have read and agreed to the published version of the manuscript.
Funding
This research was funded by the Romanian Ministry of Research and Innovation (MCI) through the PN19-03 Core Program of NIMP (2020).
Conflicts of Interest
The authors declare no conflict of interest.
Abbreviations
| DSC | differential scanning calorimetry |
| ET | energy transfer |
| FTIR | Fourier transform infrared spectroscopy |
| IR | Infrared |
| NIR | near infrared |
| PL | photoluminescence |
| PSB | phonon side bands |
| PSHB | persistent spectral hole burning |
| RE | rare earth |
| TEOS | Tetraethyl orthosilicate, formally named tetraethoxysilane |
| TFA | trifluoroacetic acid |
| TG | thermogravimetry |
| TEM | Transmission electronmicroscopy |
| TL | Thermoluminescence |
| TMOS | Tetramethyl orthosilicate |
| UC | up-conversion |
| UV | ultraviolet |
| XRD | X-ray diffraction |
References
- Deubener, J.; Allix, M.; Davis, M.J.; Duran, A.; Höche, T.; Honma, T.; Komatsu, T.; Krüger, S.; Mitra, I.; Müller, R.; et al. Updated definition of glass-ceramics. J. Non-Cryst. Solids 2018, 501, 3–10. [Google Scholar] [CrossRef]
- Pablos-Martin, A.; Duran, A.; Pascual, M.J. Nanocrystallisation in oxyfluoride systems: Mechanisms of crystallization and photonic properties. Int. Mater. Rev. 2012, 57, 165–186. [Google Scholar] [CrossRef]
- Brinker, C.J.; Scherer, G. Sol-Gel Science: The Physics and Chemistry of Sol-Gel Processing, 1st ed.; Academic Press Inc.: New York, NY, USA, 1990; Levy, D.; Zayat, M. The Sol-Gel Handbook: Synthesis, Characterization and Applications; Wiley-VCH: Weinheim, Germany, 2015. [Google Scholar]
- Gorni, G.; Velázquez, J.J.; Mosa, J.; Balda, R.; Fernández, J.; Durán, A.; Castro, Y. Transparent Glass-Ceramics Produced by Sol-Gel: A Suitable Alternative for Photonic Materials. Materials 2018, 11, 212. [Google Scholar] [CrossRef] [Green Version]
- Fujihara, S.; Mochizuki, C.; Kimura, T. Formation of LaF3 microcrystals in sol-gel silica. J. Non-Cryst. Solids 1999, 244, 267–274. [Google Scholar] [CrossRef]
- Fujihara, S.; Kato, T.; Kimura, T. Influence of solution composition on the formation of SiO2/LaF3 composites in the sol-gel process. J. Mater. Sci. 2000, 35, 2763–2767. [Google Scholar] [CrossRef]
- Fujihara, S.; Tada, M.; Kimura, T. Preparation and characterization of MgF2 thin film by a trifluoroacetic acid method. Thin Solid Films 1997, 304, 252–255. [Google Scholar] [CrossRef]
- Secu, C.E.; Bartha, C.; Polosan, S.; Secu, M. Thermally activated conversion of a silicate gel to an oxyfluoride glass ceramic: Optical study using Eu3+ probe ion. J. Lumin. 2014, 146, 539–543. [Google Scholar] [CrossRef]
- Almeida, R.M.; Goncalves, M.C. Crystallization of Sol-gel Derived Glasses. Int. J. Appl. Glass Sci. 2014, 5, 114–125. [Google Scholar] [CrossRef]
- Gorni, G.; Pascual, M.J.; Caballero, A.; Velázquez, J.J.; Mosa, J.; Castro, Y.; Durán, A. Crystallization mechanism in sol-gel oxyfluoride glass-ceramics. J. Non-Cryst. Solids 2018, 501, 145–152. [Google Scholar] [CrossRef]
- Yu, Y.; Chen, D.; Wang, Y.; Luo, W.; Zheng, Y.; Cheng, Y.; Zhou, L. Structural evolution and its influence on luminescence of SiO2–SrF2–ErF3 glass ceramics prepared by sol–gel method. Mater. Chem. Phys. 2006, 100, 241–245. [Google Scholar] [CrossRef]
- Szpikowska-Sroka, B.; Zur, L.; Czoik, R.; Goryczka, T.; Swinarew, A.S.; Zadło, M.; Pisarski, W.A. Long-lived emission from Eu3+-doped PbF2 nanocrystals distributed into sol–gel silica glass. J. Sol-Gel Sci. Technol. 2013, 68, 278–283. [Google Scholar] [CrossRef] [Green Version]
- Luo, W.; Wang, Y.; Cheng, Y.; Bao, F.; Zhou, L. Crystallization and structural evolution of SiO2-YF3 xerogel. Mater. Sci. Eng. B 2006, 127, 218–223. [Google Scholar] [CrossRef]
- Farjasa, J.; Campsa, J.; Rouraa, P.; Ricartb, S.; Puigb, T.; Obradors, X. The thermal decomposition of barium trifluoroacetate. Thermochim. Acta 2012, 544, 77–83. [Google Scholar] [CrossRef]
- Secu, M.; Secu, C.E.; Ghica, C. Eu3+-doped CaF2 nanocrystals in sol–gel derived glass–ceramics. Opt. Mater. 2011, 33, 613–617. [Google Scholar] [CrossRef]
- Rüssel, C. Thermal decomposition of metal trifluoracetates. J. Non-Cryst. Solids 1993, 152, 161–166. [Google Scholar] [CrossRef]
- Nogami, M.; Abe, Y. Properties of sol-gel-derived Al2O3-SiO2 glasses using Eu3+ ion fluorescence spectra. J. Non-Cryst. Solids 1996, 197, 73–78. [Google Scholar] [CrossRef]
- Gorni, G.; Velázquez, J.J.; Mosa, J.; Mather, G.C.; Serrano, A.; Vila, M.; Castro, G.R.; Bravo, D.; Balda, R.; Fernández, J.; et al. Transparent Sol-Gel Oxyfluoride Glass-Ceramics with High Crystalline Fraction and Study of RE Incorporation. Nanomaterials 2019, 9, 530. [Google Scholar] [CrossRef] [PubMed] [Green Version]
- Secu, C.E.; Secu, M.; Ghica, C.; Mihut, L. Rare-earth doped sol–gel derived oxyfluoride glass–ceramics: Structural and optical characterization. Opt. Mater. 2011, 33, 1770–1774. [Google Scholar] [CrossRef]
- Pawlik, N.; Szpikowska-Sroka, B.; Pietrasik, E.; Goryczka, T.; Pisarski, W.A. Structural and luminescence properties of silica powders and transparent glass-ceramics containing LaF3:Eu3+ nanocrystals. J. Am. Ceram. Soc. 2018, 101, 4654–4668. [Google Scholar] [CrossRef]
- Bartha, C.; Secu, C.E.; Matei, E.; Negrila, C.; Leca, A.; Secu, M. Towards a Correlation between Structural, Magnetic, and Luminescence Properties of CeF3:Tb3+ Nanocrystals. Materials 2020, 13, 2980. [Google Scholar] [CrossRef]
- Secu, C.E.; Matei, E.; Negrila, C.; Secu, M. The influence of the nanocrystals size and surface on the Yb/Er doped LaF3 luminescence properties. J. Alloys Compd. 2019, 791, 1098–1104. [Google Scholar] [CrossRef]
- Yanes, A.C.; Santana-Alonso, A.; Méndez-Ramos, J.; del Castillo, J.; Rodriguez, V.D. Novel Sol–Gel Nano-Glass–Ceramics Comprising Ln3+-Doped YF3 Nanocrystals: Structure and High Efficient UV Up-Conversion. Adv. Funct. Mater. 2011, 21, 3136–3142. [Google Scholar] [CrossRef]
- Binnemans, K.; Gorller-Walrand, C. Application of the Eu3+ ion for site symmetry determination. J. Rare Earths 1996, 14, 173–180. [Google Scholar]
- Driesen, K.; Tikhomirov, V.K.; Gorller-Walrand, C. Eu3+ as a probe for rare-earth dopant site structure in nano-glass-ceramics. J. Appl. Phys. 2007, 102, 024312. [Google Scholar] [CrossRef]
- Lochhead, M.J.; Bray, K.L. Spectroscopic characterization of doped sol-gel silica gels and glasses: Evidence of inner-sphere complexation of europium(III). J. Non-Cryst. Solids 1994, 170, 143–154. [Google Scholar] [CrossRef]
- Devlin, K.; O’ Kelly, B.; Tang, Z.R.; McDonagh, C.; McGilp, J.F. A structural study of the sol-gel process by optical fluorescence and decay time spectroscopy. J. Non-Cryst. Solids 1991, 135, 8–14. [Google Scholar] [CrossRef]
- Secu, C.E.; Polosan, S.; Secu, M. Magneto-optical investigations of rare earth doped sol–gel derived silicate xerogel. J. Lumin. 2011, 131, 1747–1752. [Google Scholar] [CrossRef]
- Reisfeld, R.; Zigansky, E.; Gaft, M. Europium probe for estimation of site symmetry in glass films, glasses and crystals. Mol. Phys. 2004, 102, 1319–1330. [Google Scholar] [CrossRef]
- Secu, C.E.; Negrea, R.F.; Secu, M. Eu3+ probe ion for rare-earth dopant site structure in sol–gel derived LiYF4 oxyfluoride glass–ceramic. Opt. Mater. 2013, 35, 2456–2460. [Google Scholar] [CrossRef]
- Auzel, F. Upconversion and Anti-Stokes Processes with f and d Ions in Solids. Chem. Rev. 2004, 104, 139–174. [Google Scholar] [CrossRef]
- Secu, M. Up-conversion properties of sol-gel derived Yb3+/Er3+-doped oxyfluoride glass-ceramics. unpublished work.
- McKeever, S.W.S. Thermoluminescence of Solids; Cambridge University Press: New York, NY, USA, 1985. [Google Scholar]
- Bos, A.J.J. Thermoluminescence as a Research Tool to Investigate Luminescence Mechanisms. Materials 2017, 10, 1357. [Google Scholar] [CrossRef] [PubMed] [Green Version]
- Bos, A.J.J.; Dorenbos, P.; Bessière, A.; Viana, B. Lanthanide energy levels in YPO4. Radiat. Meas. 2008, 43, 222–226. [Google Scholar] [CrossRef]
- Krumpel, A.H.; van der Kolk, E.; Zeelenberg, D.; Bos, A.J.J.; Krämer, K.W.; Dorenbos, P. Lanthanide 4f-level location in lanthanide doped and cerium-lanthanide codoped NaLaF4 by photo- and thermoluminescence. J. Appl. Phys. 2008, 104, 073505. [Google Scholar] [CrossRef] [Green Version]
- Rodnyi, P.A.; Khodyuk, I.V.; Stryganyuk, G.B. Location of the Energy Levels of the Rare-Earth Ion in BaF2 and CdF2. Phys. Solid State 2008, 50, 1639–1643. [Google Scholar] [CrossRef] [Green Version]
- Secu, M.; Secu, C.; Sima, M. Sol–gel template synthesis of luminescent glass–ceramic rods. J. Nanopart. Res. 2012, 14, 772. [Google Scholar] [CrossRef]
- Zhou, L.; Chen, D.; Luo, W.; Wang, Y.; Yu, Y.; Liu, F. Transparent glass ceramic containing Er3+:CaF2 nano-crystals prepared by sol–gel method. Mater. Lett. 2007, 61, 3988–3990. [Google Scholar] [CrossRef]
- Georgescu, S.; Voiculescu, A.M.; Matei, C.; Secu, C.E.; Negrea, R.F.; Secu, M. Ultraviolet and visible up-conversion luminescence of Er3+/Yb3+ co-doped CaF2 nanocrystals in sol–gel derived glass-ceramics Journal ofLuminescence. J. Lumin. 2013, 143, 150–156. [Google Scholar] [CrossRef]
- Kłonkowski, A.M.; Wiczk, W.; Ryl, J.; Szczodrowski, K.; Wileńska, D. A white phosphor based on oxyfluoride nano-glass-ceramics codoped with Eu3+ and Tb3+: Energy transfer study (SrF2). J. Alloys Compd. 2017, 724, 649–658. [Google Scholar] [CrossRef]
- Yu, Y.; Wang, Y.; Chen, D.; Liu, F. Efficient upconversion luminescence of Er3+:SrF2-SiO2-Al2O3 sol-gel glass ceramics. Ceram. Int. 2008, 34, 2143–2146. [Google Scholar] [CrossRef]
- Chen, D.; Wang, Y.; Yu, Y.; Ma, E.; Zhou, L. Microstructure and luminescence of transparent glass ceramic containing Er3+:BaF2 nano-crystals. J. Solid State Chem. 2006, 179, 532–537. [Google Scholar] [CrossRef]
- Luo, W.; Wang, Y.; Bao, F.; Zhou, L.; Wang, X. Crystallization behavior of PbF2-SiO2 based bulk xerogels. J. Non-Cryst. Solids 2004, 347, 31–38. [Google Scholar] [CrossRef]
- Szpikowska-Sroka, B.; Pawlik, N.; Goryczka, T.; Pietrasik, E.; Bańczyk, M.; Pisarski, W.A. Lead fluoride β-PbF2 nanocrystals containing Eu3+ and Tb3+ ions embedded in sol-gel materials: Thermal, structural and optical investigations. Ceram. Int. 2017, 43, 8424–8432. [Google Scholar] [CrossRef]
- Szpikowska-Sroka, B.; Pawlik, N.; Goryczka, T.; Pisarski, W.A. Eu3+/Tb3+ codoped PbF2 nanocrystals in sol–gel glass–ceramic materials: Fabrication, structure and properties. Mater. Sci. Eng. B 2021, 263, 114884. [Google Scholar] [CrossRef]
- Del-Castillo, J.; Yanes, A.C.; Méndez-Ramos, J.; Tikhomirov, V.K.; Rodríguez, V.D. Structure and up-conversion luminescence in sol–gel derived Er3+–Yb3+ co-doped SiO2:PbF2 nano-glass–ceramics. Opt. Mater. 2009, 32, 104–107. [Google Scholar] [CrossRef]
- Del-Castillo, J.; Yanes, A.C.; Mendez-Ramos, J.; Tikhomirov, V.K.; Moshchalkov, V.V.; Rodrıguez, V.D. Sol–gel preparation and white up-conversion luminescence in rare-earth doped PbF2 nanocrystals dissolved in silica glass. J. Sol-Gel. Sci. Technol. 2010, 53, 509–514. [Google Scholar] [CrossRef] [Green Version]
- Yanes, A.C.; del-Castillo, J.; Mendez-Ramos, J.; Rodrıguez, V.D.; Torres, M.E.; Arbiol, J. Luminescence and structural characterization of transparent nanostructured Eu3+-doped LaF3–SiO2 glass–ceramics prepared by sol–gel method. Opt. Mater. 2007, 29, 999–1003. [Google Scholar] [CrossRef]
- Pawlik, N.; Szpikowska-Sroka, B.; Goryczka, T.; Pisarski, W.A. Studies of Sol-Gel Evolution and Distribution of Eu3+ Ions in Glass–Ceramics Containing LaF3 Nanocrystals Depending on Initial Sols Composition. Int. J. Mol. Sci. 2021, 22, 996. [Google Scholar] [CrossRef] [PubMed]
- Pawlik, N.; Szpikowska-Sroka, B.; Pitrasik, E.; Goryczka, T.; Dulski, M.; Swinarew, A.S.; Zubko, M.; Lelątko, J.; Pisarski, W.A. Reddish-orange Eu3+-doped sol-gel emitters based on LaF3 nanocrystals—Synthesis, structural and photoluminescence investigations. Opt. Mater. 2019, 89, 276–282. [Google Scholar] [CrossRef]
- Rodriguez, V.D.; del Castillo, J.; Yanes, A.C.; Mendez-Ramos, J.; Torres, M.; Peraza, J. Luminescence of Er3+-doped nanostructured SiO2–LaF3 glass-ceramics prepared by the sol–gel method. Opt. Mater. 2007, 29, 1557–1561. [Google Scholar] [CrossRef]
- Biswas, A.; Maciel, G.S.; Friend, C.S.; Prasad, P.N. Upconversion properties of a transparent Er3+–Yb3+ co-doped LaF3–SiO2 glass-ceramics prepared by sol–gel method. J. Non-Cryst. Solids 2003, 16, 393–397. [Google Scholar] [CrossRef]
- Méndez-Ramos, J.; Velázquez, J.J.; Yanes, A.C.; del-Castillo, J.; Rodríguez, V.D. Up-conversion in nanostructured Yb3+–Tm3+ co-doped sol–gel derived SiO2–LaF3 transparent glass-ceramics. Phys. Status Solidi A 2008, 205, 330–334. [Google Scholar] [CrossRef]
- Velázquez, J.J.; Yanes, A.C.; del Castillo, J.; Méndez-Ramos, J.; Rodríguez, V.D. Optical properties of Ho3+–Yb3+ co-doped nanostructured SiO2–LaF3 glass-ceramics prepared by sol–gel method. Phys. Status Solidi A 2007, 204, 1762–1768. [Google Scholar] [CrossRef]
- Yanes, A.C.; Velaszquez, J.J.; del-Castillo, J.; Mendez-Ramos, J.; Rodrıguez, V.D. Colour tuneability and white light generation in Yb3+–Ho3+–Tm3+ co-doped SiO2–LaF3 nano-glass-ceramics prepared by sol–gel method. J. Sol-Gel Sci. Technol. 2009, 51, 4–9. [Google Scholar] [CrossRef]
- Pawlik, N.; Szpikowska-Sroka, B.; Goryczka, T.; Zubko, M.; Lelątko, J.; Pisarski, W.A. Structure and luminescent properties of oxyfluoride glass-ceramics with YF3:Eu3+ nanocrystals derived by sol-gel method. J. Eur. Ceram. Soc. 2019, 39, 5010–5017. [Google Scholar] [CrossRef]
- Pawlik, N.; Szpikowska-Sroka, B.; Pisarski, W.A. Energy Transfer Study on Tb3+/Eu3+ Co-Activated Sol-Gel Glass-Ceramic Materials Containing MF3 (M = Y, La) Nanocrystals for NUV Optoelectronic Devices. Materials 2020, 13, 2522. [Google Scholar] [CrossRef]
- Fujihara, S.; Koji, S.; Kimura, T. Structure and Optical Properties of (Gd,Eu)F3-Nanocrystallized Sol-Gel Silica Films. J. Mater. Chem. 2004, 14, 1331–1335. [Google Scholar] [CrossRef]
- Velázquez, J.J.; Mosa, J.; Gorni, G.; Balda, R.; Fernández, J.; Pascual, L.; Durán, A.; Castro, Y. Transparent SiO2-GdF3 sol–gel nano-glass ceramics for optical applications. J. Sol-Gel Sci. Technol. 2019, 89, 322–332. [Google Scholar] [CrossRef]
- Pawlik, N.; Szpikowska-Sroka, B.; Sołtys, M.; Pisarski, W.A. Optical properties of silica sol-gel materials singly- and doubly doped with Eu3+and Gd3+ ions. J. Rare Earths 2016, 34, 786–795. [Google Scholar] [CrossRef]
- Szpikowska-Sroka, B.; Pawlik, N.; Goryczka, T.; Pisarski, W.A. Influence of silicate sol-gel host matrices and catalyst agents on luminescence properties of Eu3+/Gd3+ under different excitation wavelengths. RSC Adv. 2015, 5, 98773–98782. [Google Scholar] [CrossRef]
- Pawlik, N.; Szpikowska-Sroka, B.; Pietrasik, E.; Goryczka, T.; Pisarski, W.A. Photoluminescence and energy transfer in transparent glass-ceramics based on GdF3:RE3+ (RE = Tb, Eu) nanocrystals. J. Rare Earths 2019, 37, 1137–1144. [Google Scholar] [CrossRef]
- Secu, M.; Secu, C.E. Photoluminescence and energy transfer processes in Eu3+-doped SiO2–GdF3 oxyfluoride glass-ceramics prepared by sol-gel. manuscript in preparation.
- Secu, C.E.; Bartha, C.; Secu, M. Dual up-conversion luminescence and magnetic properties of sol-gel derived Er3+/Yb3+ doped SiO2-GdF3 nano-glass ceramics. manuscript in preparation.
- del Castillo, J.; Yanes, A.C.; Méndez-Ramos, J.; Velázquez, J.J.; Rodríguez, V.D. Structural and luminescent study in lanthanide doped sol–gel glass–ceramics comprising CeF3 nanocrystals. J. Sol-Gel Sci. Technol. 2011, 60, 170–176. [Google Scholar] [CrossRef]
- Santana-Alonso, A.; Yanes, A.C.; Méndez-Ramos, J.; del Castillo, J.; Rodríguez, V.D. Sol–gel transparent nano-glass–ceramics containing Eu3+-doped NaYF4 nanocrystals. J. Non-Cryst. Solids 2010, 356, 933–936. [Google Scholar] [CrossRef]
- Cruz, M.E.; Li, J.; Gorni, G.; Durán, A.; Mather, G.C.; Balda, R.; Fernández, J.; Castro, Y. Crystallization Process and Site-Selective Excitation of Nd3+ in LaF3/NaLaF4 Sol–Gel-Synthesized Transparent Glass-Ceramics. Crystals 2021, 11, 464. [Google Scholar] [CrossRef]
- Velázquez, J.J.; Mosa, J.; Gorni, G.; Balda, R.; Fernández, J.; Durán, A.; Castro, Y. Novel sol-gel SiO2-NaGdF4 transparent nano-glass-ceramics. J. Non-Cryst. Solids 2019, 520, 119447. [Google Scholar] [CrossRef]
- Cruz, M.E.; Li, J.; Gorni, G.; Durán, A.; Mather, G.C.; Balda, R.; Fernández, J.; Castro, Y. Nd3+doped- SiO2–KLaF4 oxyfluoride glass-ceramics prepared by sol-gel. J. Lumin. 2021, 235, 118035. [Google Scholar] [CrossRef]
- Yanes, A.C.; del-Castillo, J. Enhanced emission via energy transfer in RE co-doped SiO2-KYF4 nano-glass-ceramics for white LEDs. J. Alloys Compd. 2016, 658, 170–176. [Google Scholar] [CrossRef]
- Kawamura, G.; Yoshimura, R.; Ota, K.; Oh, S.I.; Hakiri, N.; Muto, H.; Hayakawa, T.; Matsuda, A. A unique approach to characterization of sol–gel-derived rare-earth-doped oxyfluoride glass-ceramics. J. Am. Ceram. Soc. 2013, 96, 476–480. [Google Scholar] [CrossRef]
- Secu, M.; Secu, C.E. Up-conversion luminescence of Er3+/Yb3+ co-doped LiYF4 nanocrystals in sol–gel derived oxyfluoride glass-ceramics. J. Non-Cryst. Solids 2015, 426, 78–82. [Google Scholar] [CrossRef]
- Yanes, A.C.; Santana-Alonso, A.; Méndez-Ramos, J.; del-Castillo, J.; Rodríguez, V.D. Yb3+–Er3+ co-doped sol–gel transparent nano-glass-ceramics containing NaYF4 nanocrystals for tuneable up-conversion phosphors. J. Alloys Compd. 2009, 480, 706–710. [Google Scholar] [CrossRef]
- Méndez-Ramos, J.; Yanes, A.C.; Santana-Alonso, A.; del-Castillo, J. Highly efficient up-conversion and bright white light in RE co-doped KYF4 nanocrystals in sol–gel silica matrix. Chem. Phys. Lett. 2013, 555, 196–201. [Google Scholar] [CrossRef]
- Del-Castillo, J.; Yanes, A.C.; Abé, S.; Smet, P.F. Site selective spectroscopy in BaYF5:RE3+ (RE = Eu, Sm) nano-glass–ceramics. J. Alloys Compd. 2015, 635, 136–141. [Google Scholar] [CrossRef] [Green Version]
- Yanes, A.C.; del-Castillo, J. Bright luminescence of Gd3+ sensitized RE3+-doped SiO2-BaGdF5 glass-ceramics for UV-LEDs colour conversion. J. Alloys Compd. 2017, 695, 3736–3743. [Google Scholar] [CrossRef] [Green Version]
- Del-Castillo, J.; Yanes, A.C. Ultraviolet and visible up-conversion in sol-gel based SiO2-BaY0.78-xGdxYb0.2Tm0.02F5 nano-glass-ceramics. Opt. Mater. 2018, 84, 1–7. [Google Scholar] [CrossRef]
- Yanes, A.C.; del-Castillo, J.; Luis, D.; Puentes, J. Novel Sr2LuF7–SiO2 nano-glass-ceramics: Structure and up-conversion luminescence. J. Lumin. 2016, 170, 789–794. [Google Scholar] [CrossRef] [Green Version]
- Secu, M.; Secu, C.E. Up-conversion luminescence of BaCl2:Er3+ nanocrystals embedded in oxychloride nano-glass ceramic. J. Eur. Ceram. Soc. 2016, 36, 1699–1703. [Google Scholar] [CrossRef]
- Secu, M.; Secu, C.E.; Bartha, C. Crystallization and luminescence properties of a new Eu3+-doped LaOCl nano-glass-ceramic. J. Eur. Ceram. Soc. 2016, 36, 203–207. [Google Scholar] [CrossRef]
- Del Castillo, J.; Rodríguez, V.D.; Yanes, A.C.; Méndez-Ramos, J.; Torres, M.E. Luminescent properties of transparent nanostructured Eu3+ doped SnO2–SiO2 glass-ceramics prepared by the sol-gel method. Nanotechnology 2005, 16, S300–S303. [Google Scholar] [CrossRef] [Green Version]
- Van Tran, T.T.; Turrell, S.; Capoen, B.; Le Van, H.; Ferrari, M.; Ristic, D.; Boussekey, L.; Kinowski, C. Environment segregation of Er3+ emission in bulk sol-gel-derived SiO2-SnO2 glass ceramics. J. Mater. Sci. 2014, 49, 8226–8233. [Google Scholar] [CrossRef]
- Gonçalves, R.R.; Messaddeq, Y.; Chiasera, A.; Jestin, Y.; Ferrari, M.; Ribeiro, S.J.L. Erbium-activated silica-zirconia planar waveguides prepared by sol-gel route. Thin Solid Films 2008, 516, 3094–3097. [Google Scholar] [CrossRef]
- Oikawa, M.; Fujihara, S. Sol-Gel Preparation and Luminescent Properties of CeO2:Ln (Ln = Eu3+ and Sm3+) thin films. J. Eur. Ceram. Soc. 2005, 25, 2921–2924. [Google Scholar] [CrossRef]
- Jestin, Y.; Armellini, C.; Chiappini, A.; Chiaser, A.; Ferrari, M.; Goyes, C.; Montagna, M.; Moser, E.; Nunzi Conti, G.; Pelli, S.; et al. Erbium activated HfO2 based glass-ceramics waveguides for photonics. J. Non-Cryst. Solids 2007, 353, 494–497. [Google Scholar] [CrossRef]
- Beall, G.H.; Borrelli, N.F.; Pinckney, L. Laser-Induced Crystallization of Transparent Glass-Ceramics. U.S. Patent No. 6928224, 9 August 2005. [Google Scholar]
- Kajihara, K. Recent advances in sol–gel synthesis of monolithic silica and silica-based glasses. J. Asian Ceram. Soc. 2013, 1, 121–133. [Google Scholar] [CrossRef] [Green Version]
- Tran, L.T.N.; Massella, D.; Zur, L.; Chiasera, A.; Varas, S.; Armellini, C.; Righini, G.C.; Lukowiak, A.; Zonta, D.; Ferrari, M. SiO2-SnO2:Er3+ Glass-Ceramic Monoliths. Appl. Sci. 2018, 8, 1335. [Google Scholar] [CrossRef] [Green Version]
- Nogami, M.; Abe, Y. Enhanced emission from Eu2+ ions in sol-gel derived Al2O3–SiO2 glasses. Appl. Phys. Lett. 1996, 69, 3776–3778. [Google Scholar] [CrossRef]
- Nogami, M.; Abe, Y.; Hirao, K.; Cho, D.H. Room temperature persistent spectra hole burning of Sm2+-doped Silicate glasses prepared by the sol-gel process. Appl. Phys. Lett. 1995, 66, 2952–2954. [Google Scholar]
- Cruz, M.E.; Duran, A.; Balda, R.; Fernandez, J.; Mather, G.C.; Castro, Y. A new sol–gel route towards Nd3+-doped SiO2–LaF3 glass-ceramics for photonic applications. Mater. Adv. 2020, 1, 3589–3596. [Google Scholar] [CrossRef]
- Li, Y.; Gecevicius, M.; Qiu, J. Long persistent phosphors-from fundamentals to applications. Chem. Soc. Rev. 2016, 45, 2090–2136. [Google Scholar] [CrossRef] [PubMed]
- Riesen, N.; Pan, X.; Badek, K.; Ruan, Y.; Monro, T.; Zhao, J.; Ebendorff-Heidepriem, H.; Riesen, H. Towards rewritable multilevel optical data storage in single nanocrystals. Opt. Express 2018, 26, 12266–12276. [Google Scholar] [CrossRef] [Green Version]
- Nagayama, S.; Kajihara, K.; Kanamura, K. Synthesis of nanocrystalline LaF3 doped silica glasses by hydrofluoric acid catalyzed sol–gel process. Mater. Sci. Eng. B 2012, 177, 510–514. [Google Scholar] [CrossRef]
- Kemnitz, E.; Noack, J. The non-aqueous fluorolytic sol–gel synthesis of nanoscaled metal fluorides. Dalton Trans. 2015, 44, 19411–19431. [Google Scholar] [CrossRef] [PubMed] [Green Version]
Figure 1.
The XRD patterns of SiO2–LaF3 gel and glass ceramics obtained after calcination at different temperatures. (Reproduced from reference [5].)
Figure 1.
The XRD patterns of SiO2–LaF3 gel and glass ceramics obtained after calcination at different temperatures. (Reproduced from reference [5].)

Figure 2.
TEM images of the SiO2–YF3 xerogel sample calcinated at 400 °C (left) showing the congeries (right) (reproduced from reference [12]).
Figure 2.
TEM images of the SiO2–YF3 xerogel sample calcinated at 400 °C (left) showing the congeries (right) (reproduced from reference [12]).

Figure 3.
Thermal analysis of Eu-doped SiO2–BaF2 xerogel showing the TG (red) and DSC (black) curves (reproduced from reference [8]).
Figure 3.
Thermal analysis of Eu-doped SiO2–BaF2 xerogel showing the TG (red) and DSC (black) curves (reproduced from reference [8]).

Figure 4.
Photoluminescence spectra recorded on Eu3+-doped xerogel (dotted curve) and glass ceramic (solid curve) using 394 nm excitation wavelength (modified from reference [19]); the inset shows the Eu3+ energy levels diagram.
Figure 4.
Photoluminescence spectra recorded on Eu3+-doped xerogel (dotted curve) and glass ceramic (solid curve) using 394 nm excitation wavelength (modified from reference [19]); the inset shows the Eu3+ energy levels diagram.

Figure 5.
Photoluminescence spectra of Eu (1%)-doped 95SiO2–5BaF2 nano-glass ceramic (prepared in ref. [8]) recorded under 394 and 464 nm excitation.
Figure 5.
Photoluminescence spectra of Eu (1%)-doped 95SiO2–5BaF2 nano-glass ceramic (prepared in ref. [8]) recorded under 394 and 464 nm excitation.

Figure 6.
The green (2H11/2, 4S3/2 → 4I15/2) and red (4F9/2 → 4I15/2) Er3+ up-conversion luminescences excited at 980 nm in various Yb3+/Er3+-doped oxyfluoride glass ceramics [32] and the energy level schemes of Yb3+ and Er3+ with the main energy transfer processes.
Figure 6.
The green (2H11/2, 4S3/2 → 4I15/2) and red (4F9/2 → 4I15/2) Er3+ up-conversion luminescences excited at 980 nm in various Yb3+/Er3+-doped oxyfluoride glass ceramics [32] and the energy level schemes of Yb3+ and Er3+ with the main energy transfer processes.

Figure 7.
Thermoluminescence mechanism (left) (reproduced from reference [34]); and normalized glow curves recorded after X-ray irradiation at room temperature of Eu3+ doped SiO2–BaF2 dried xerogel and Eu3+ doped glass ceramic (prepared in ref. [8]) (right).

Figure 8.
The PSB spectrum associated to the 5F0 → 5D2 transition of Eu3+-ion (at 461 nm), recorded in glass–ceramic (solid curve) and the fit with Gaussian-type curves (dashed curves); the abscissa is taken as the energy shift from the pure electronic transition (PET) peak 5F0 → 5D2 at 461 nm. (Modified from reference [15].)

Figure 9.
Photoluminescence spectra recorded on SrF2:Eu/Tb@SiO2 glass ceramics after under 368 nm excitation wavelength; blue broad emission of SiO2 is accompanied by the green light peaks of Tb3+ and red light peaks of Eu3+ (reproduced from reference [41]).
Figure 9.
Photoluminescence spectra recorded on SrF2:Eu/Tb@SiO2 glass ceramics after under 368 nm excitation wavelength; blue broad emission of SiO2 is accompanied by the green light peaks of Tb3+ and red light peaks of Eu3+ (reproduced from reference [41]).

Figure 10.
TL curves recorded on undoped (dotted line) and RE3+-doped glass ceramics (solid lines) after X-ray irradiation at room temperature (reproduced from reference [44]); the energy levels scheme of lanthanides in YPO4 (reproduced from reference [34]).

Figure 11.
Up-conversion emission spectra of Er3+-doped SiO2–PbF2 glass ceramic under 980 nm IR light pumping at different powers; the inset shows emission spectrum excited at 378 nm (reproduced from reference [47]).
Figure 11.
Up-conversion emission spectra of Er3+-doped SiO2–PbF2 glass ceramic under 980 nm IR light pumping at different powers; the inset shows emission spectrum excited at 378 nm (reproduced from reference [47]).

Figure 12.
Excitation spectra of Eu3+-doped LaF3–SiO2 glass ceramics recorded at indicated wavelengths; the spectra of 89.9SiO2–10LaF3–0.1EuF3 glassy sample and SiO2:Eu3+ sol–gel glass detected at 590 nm are also included (reproduced from reference [49]).
Figure 12.
Excitation spectra of Eu3+-doped LaF3–SiO2 glass ceramics recorded at indicated wavelengths; the spectra of 89.9SiO2–10LaF3–0.1EuF3 glassy sample and SiO2:Eu3+ sol–gel glass detected at 590 nm are also included (reproduced from reference [49]).

Figure 13.
Up-conversion luminescence spectra of 95SiO2–5LaF3:0.1Er3+ glass ceramics recorded at room temperature under 980 nm IR light pumping with different pumping powers from 10 to 90mW (left) and the energy level schemes of Er3+ with the main energy transfer processes (right); reproduced from reference [52].

Figure 14.
Photoluminescence spectra recorded in Eu3+ doped SiO2–GdF3 glass ceramic (left) and Tb3+ doped SiO2–GdF3 glass ceramic excited at Gd3+ or Eu3+/Tb3+ excitation wavelength peaks (reproduced from reference [63]).
Figure 14.
Photoluminescence spectra recorded in Eu3+ doped SiO2–GdF3 glass ceramic (left) and Tb3+ doped SiO2–GdF3 glass ceramic excited at Gd3+ or Eu3+/Tb3+ excitation wavelength peaks (reproduced from reference [63]).

Figure 15.
X-ray diffraction patterns of the Yb/Er co-doped SiO2–GdF3 xerogel (curve a) and glass ceramics undoped (curve b) and Li (1%) co-doped (c) [65]; the PDF file of orthorhombic GdF3 is shown for comparison.
Figure 15.
X-ray diffraction patterns of the Yb/Er co-doped SiO2–GdF3 xerogel (curve a) and glass ceramics undoped (curve b) and Li (1%) co-doped (c) [65]; the PDF file of orthorhombic GdF3 is shown for comparison.

Figure 16.
Normalized emission spectra of the 4F3/2 → 4I11/2 transition obtained under excitation at 786 (black) and 792 nm (red) of the GC-0.95 sample doped with 0.1 mol% of Nd3+ corresponding to Nd3+ ions in LaF3 and NaLaF4 crystalline phases, respectively [68].
Figure 16.
Normalized emission spectra of the 4F3/2 → 4I11/2 transition obtained under excitation at 786 (black) and 792 nm (red) of the GC-0.95 sample doped with 0.1 mol% of Nd3+ corresponding to Nd3+ ions in LaF3 and NaLaF4 crystalline phases, respectively [68].

Figure 17.
Emission spectra of 0.3Ce3+/0.3Tb3+/0.6Eu3+ (mol %) triply-doped SiO2–KYF4 glass ceramics under UV excitation of Ce3+ by comparison to the direct excitation of Eu3+ and Tb3+ ions, showing the Eu3+ and Tb3+ luminescence peaks (reproduced from reference [71]).
Figure 17.
Emission spectra of 0.3Ce3+/0.3Tb3+/0.6Eu3+ (mol %) triply-doped SiO2–KYF4 glass ceramics under UV excitation of Ce3+ by comparison to the direct excitation of Eu3+ and Tb3+ ions, showing the Eu3+ and Tb3+ luminescence peaks (reproduced from reference [71]).

Publisher’s Note: MDPI stays neutral with regard to jurisdictional claims in published maps and institutional affiliations. |
© 2021 by the authors. Licensee MDPI, Basel, Switzerland. This article is an open access article distributed under the terms and conditions of the Creative Commons Attribution (CC BY) license (https://creativecommons.org/licenses/by/4.0/).
Share and Cite
MDPI and ACS Style
Secu, M.; Secu, C.; Bartha, C. Optical Properties of Transparent Rare-Earth Doped Sol-Gel Derived Nano-Glass Ceramics. Materials 2021, 14, 6871. https://doi.org/10.3390/ma14226871
AMA Style
Secu M, Secu C, Bartha C. Optical Properties of Transparent Rare-Earth Doped Sol-Gel Derived Nano-Glass Ceramics. Materials. 2021; 14(22):6871. https://doi.org/10.3390/ma14226871
Chicago/Turabian StyleSecu, Mihail, Corina Secu, and Cristina Bartha. 2021. "Optical Properties of Transparent Rare-Earth Doped Sol-Gel Derived Nano-Glass Ceramics" Materials 14, no. 22: 6871. https://doi.org/10.3390/ma14226871
Note that from the first issue of 2016, this journal uses article numbers instead of page numbers. See further details here.