
A Possibility for Quantitative Detection of Mechanically-Induced Invisible Damage by Thermal Property Measurement via Entropy Generation for a Polymer Material


Abstract
:1. Introduction
2. MD Simulation
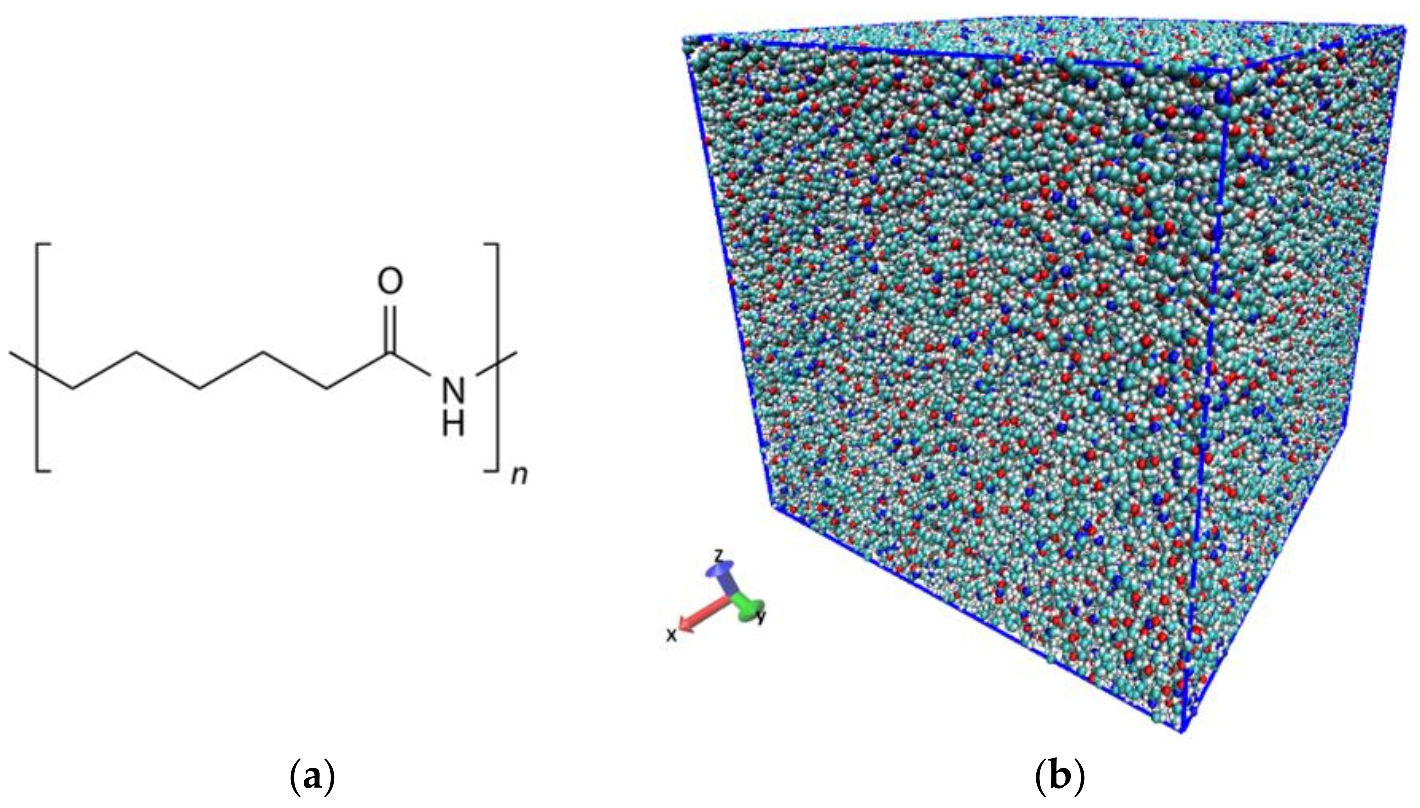
2.1. Polymer System
2.2. Simulation of Tensile Deformation
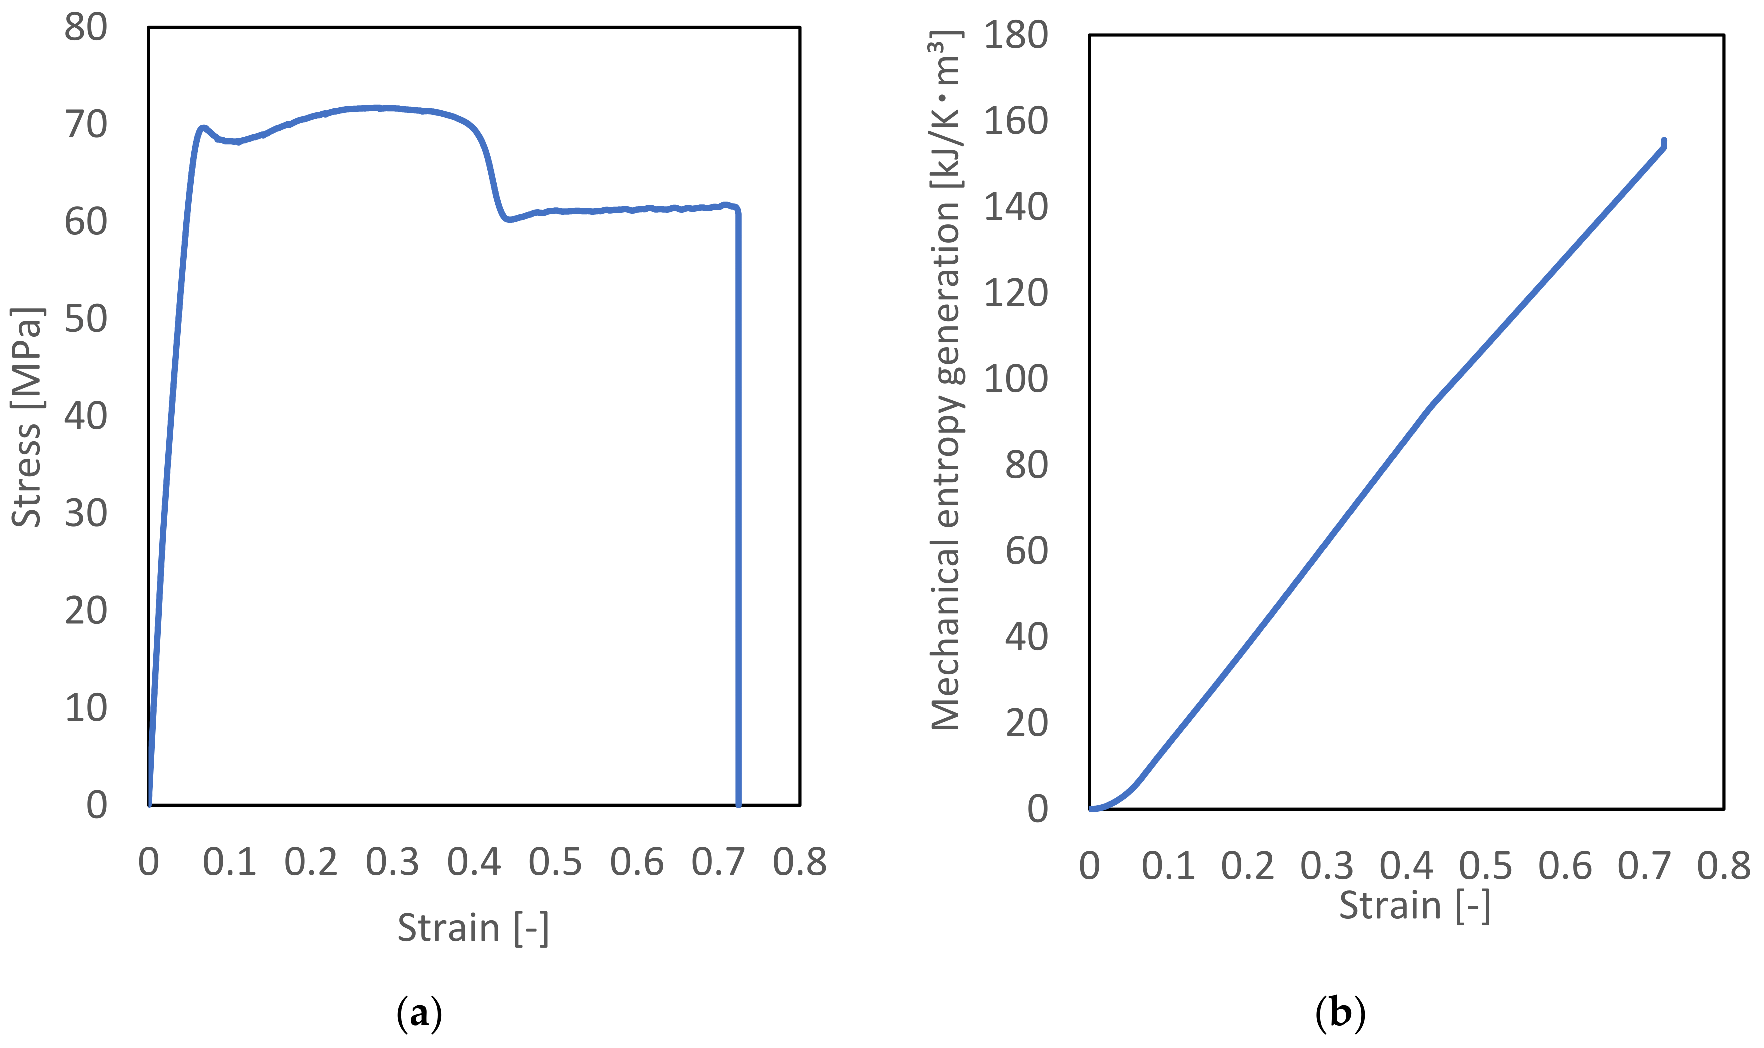
2.3. Results of MD Simulations
3. Tensile Test Experiment
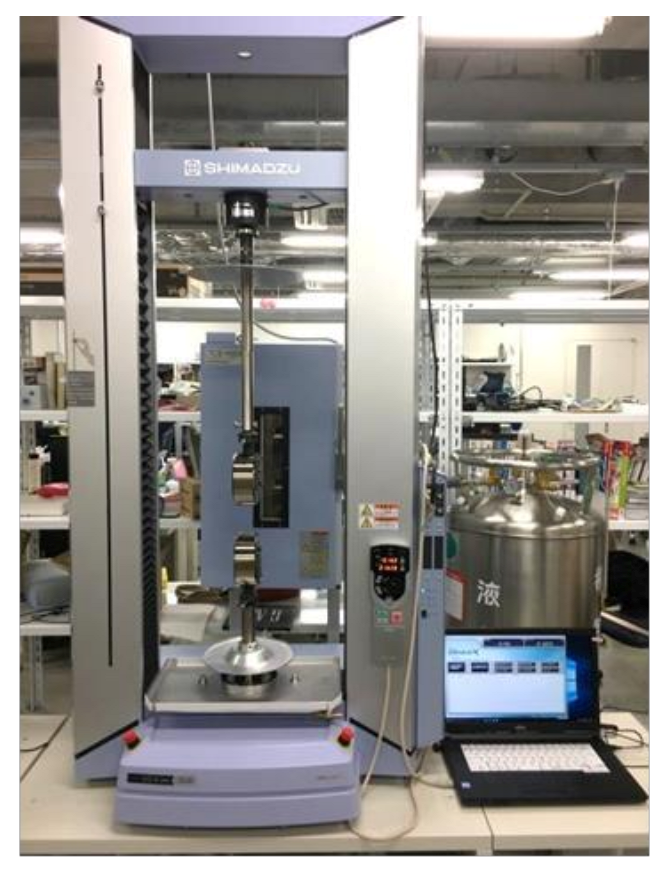
3.1. Materials and Methodology of the Tensile Test
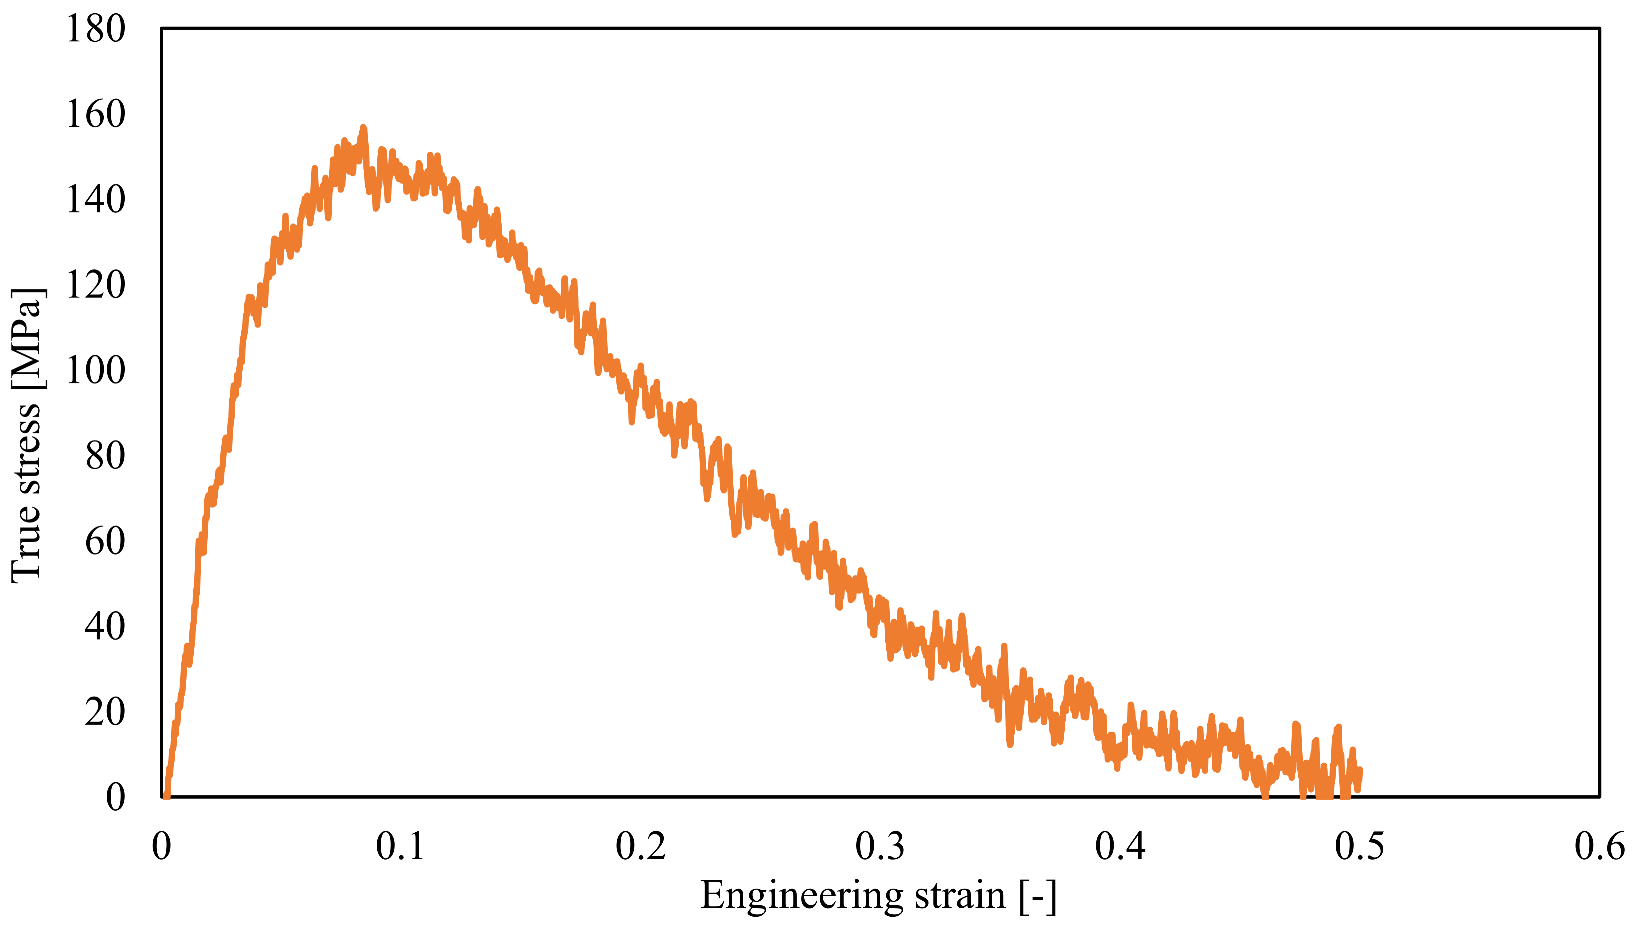
3.2. Results of the Tensile Tests
4. Thermal Entropy
4.1. Differential Scanning Calorimetry (DSC) Procedure
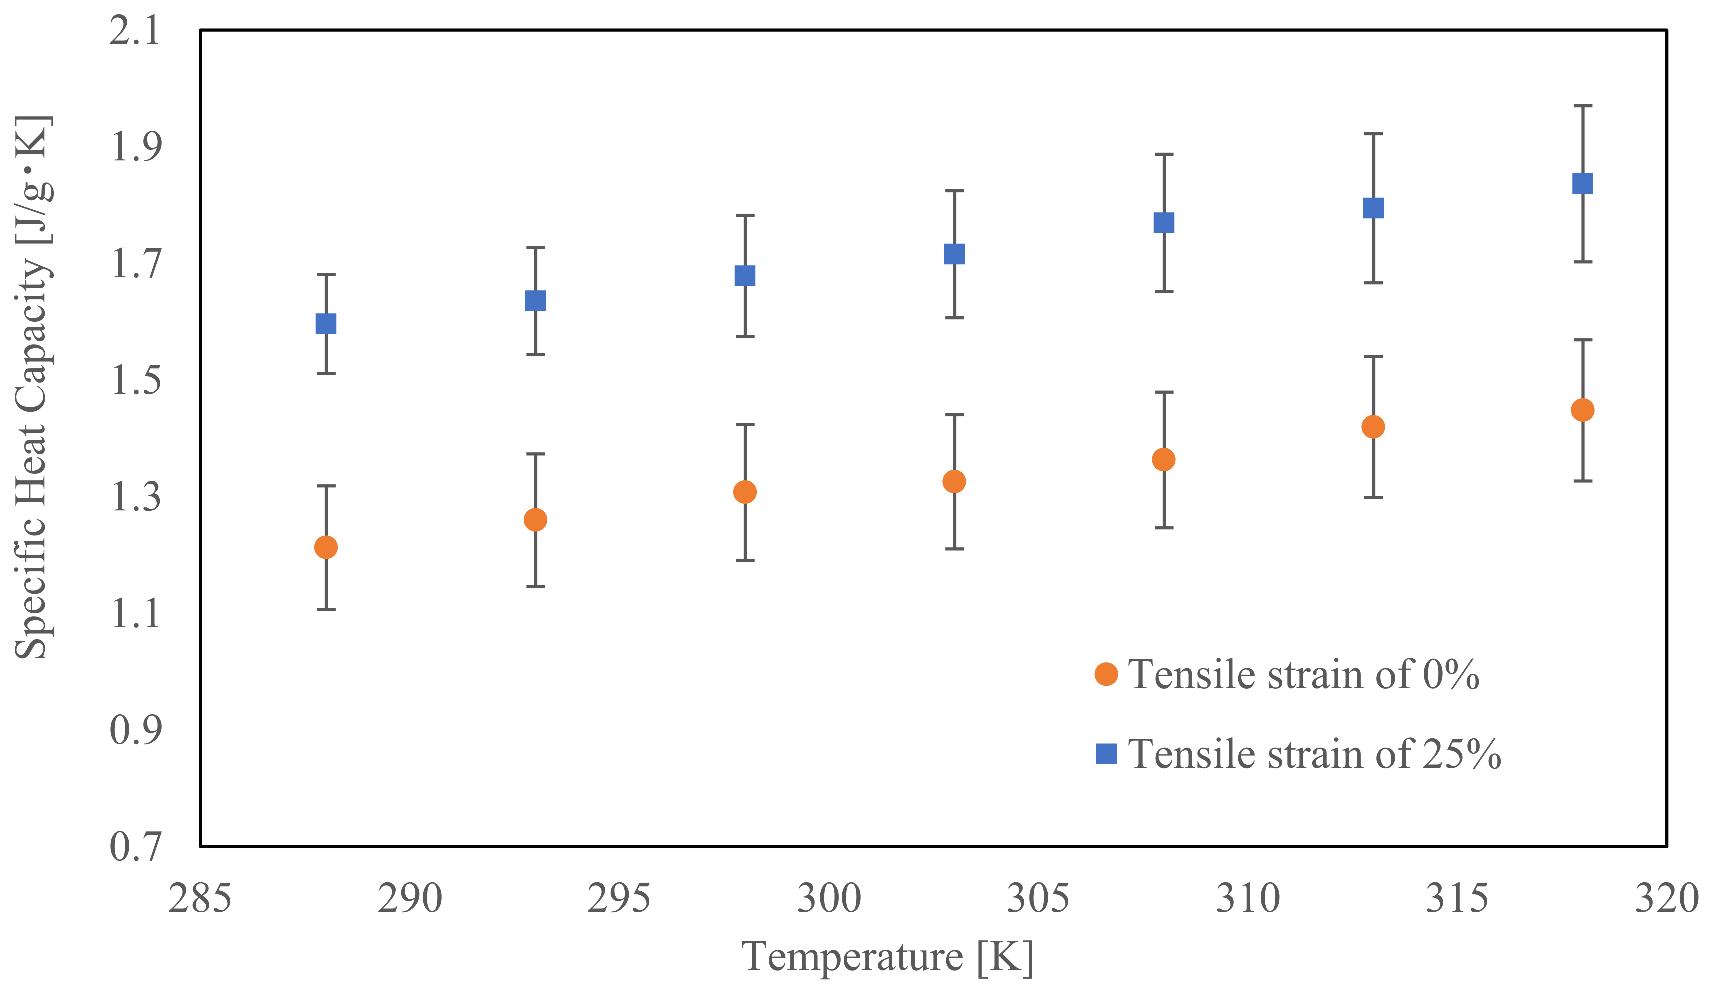
4.2. Specific Heat Capacity
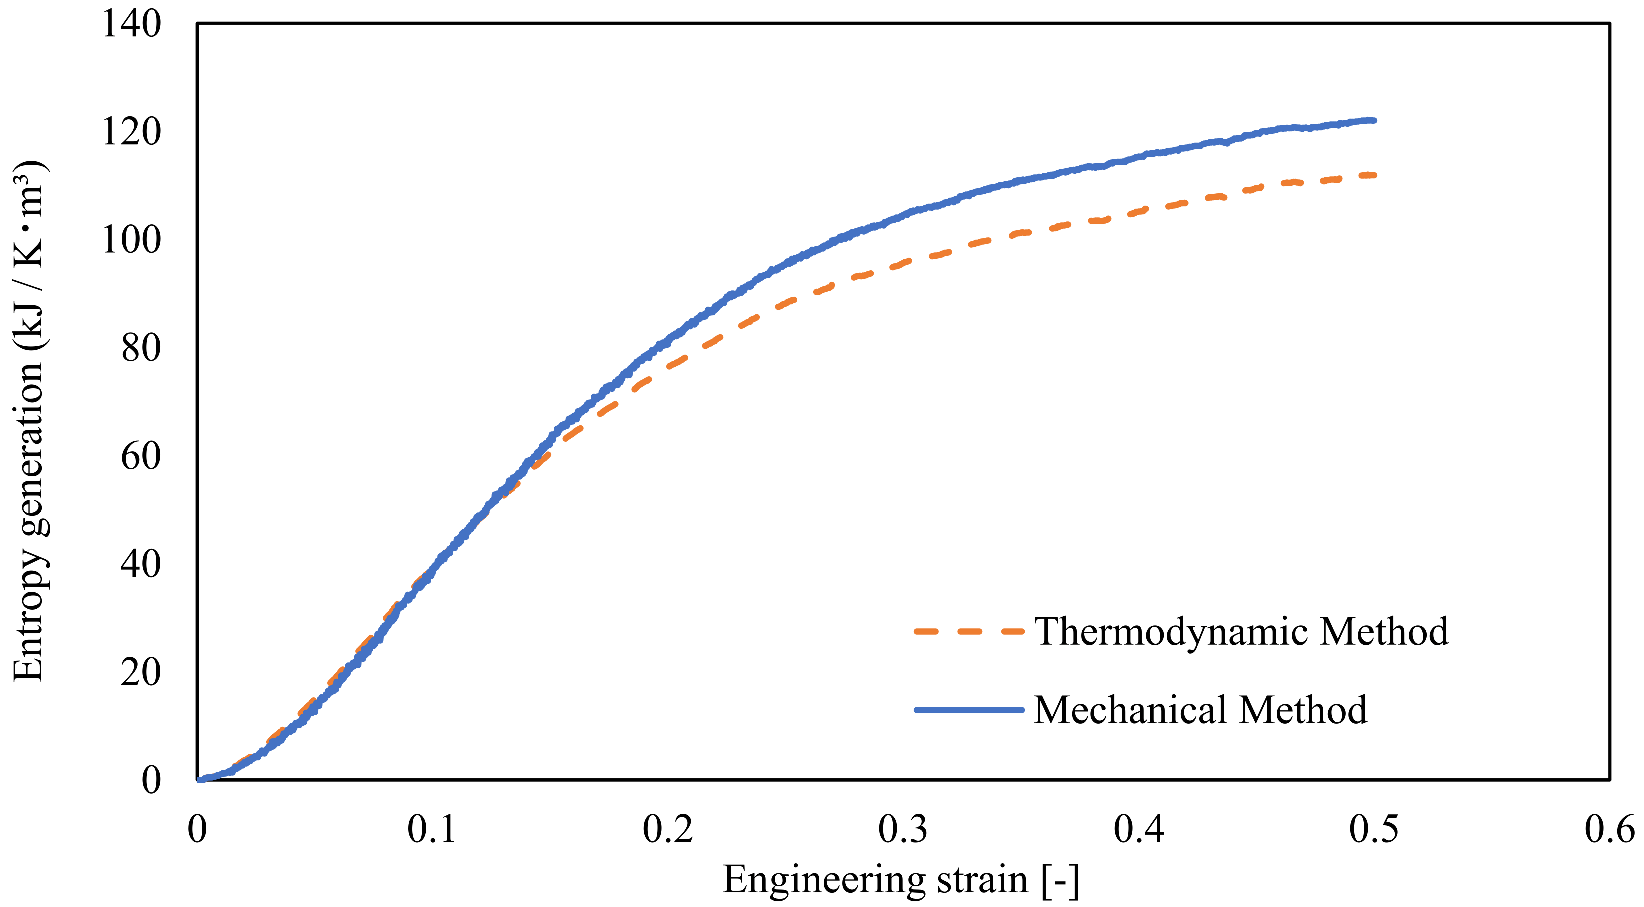
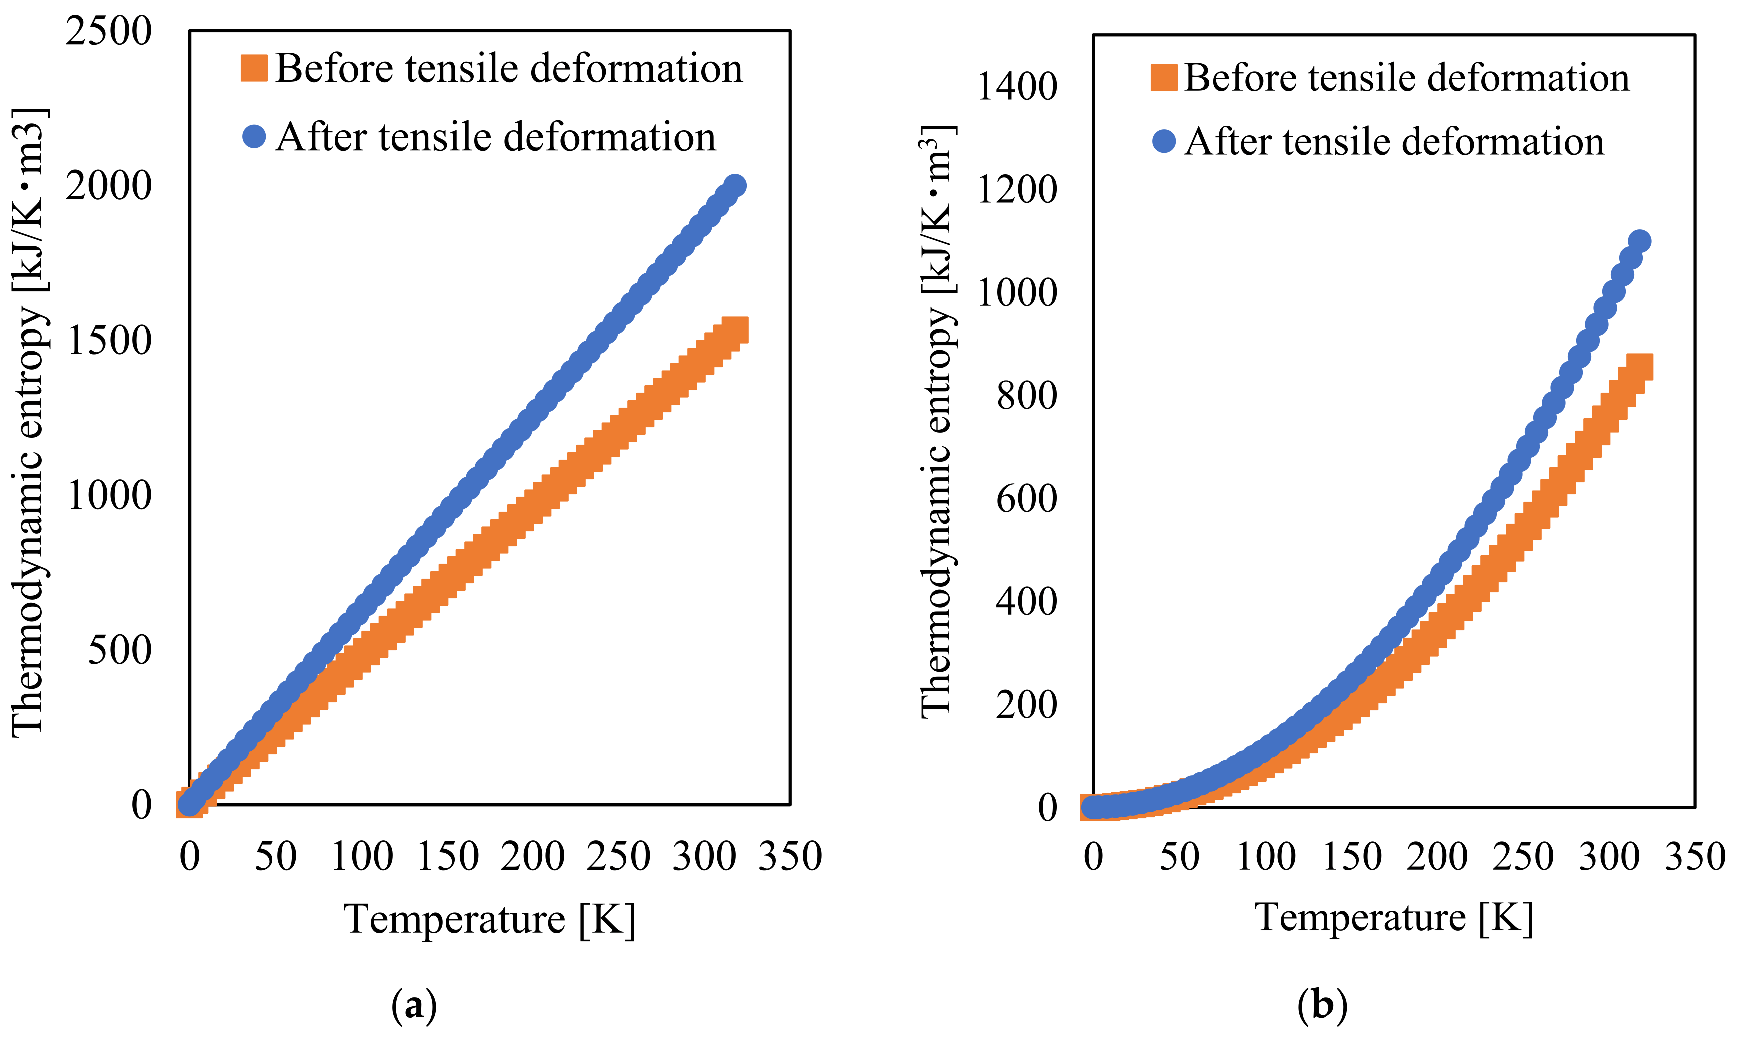
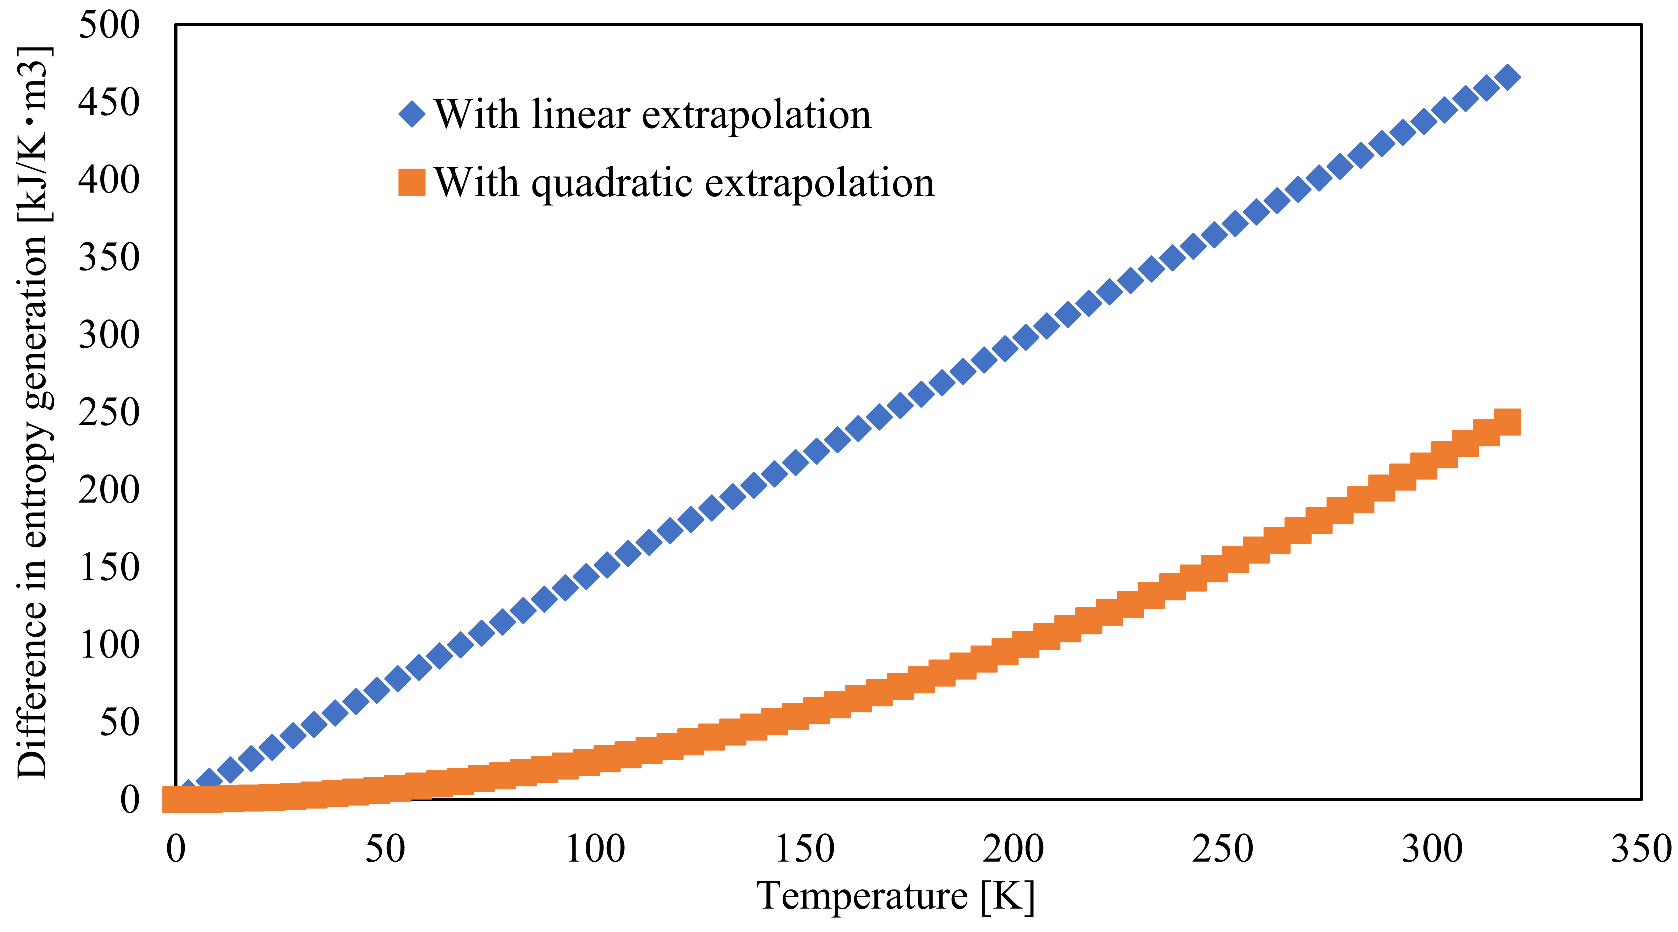
4.3. Thermal Entropy Generation
5. Conclusions
Author Contributions
Funding
Institutional Review Board Statement
Informed Consent Statement
Data Availability Statement
Acknowledgments
Conflicts of Interest
References
- Ferry, J.D. Mechanical Properties of Substances of High Molecular Weight. VI. Dispersion in Concentrated Polymer Solutions and its Dependence on Temperature and Concentration. J. Am. Chem. Soc. 1950, 72, 3746–3752. [Google Scholar] [CrossRef]
- Schapery, R.A. On the characterization of nonlinear viscoelastic materials. Polym. Eng. Sci. 1969, 9, 295–310. [Google Scholar] [CrossRef]
- Schapery, R.A. Nonlinear Viscoelastic and Viscoplastic Constitutive Equations Based on Thermodynamics. Mech. Time-Dependent Mater. 1997, 1, 209–240. [Google Scholar] [CrossRef]
- Sakai, T.; Somiya, S. Analysis of creep behavior in thermoplastics based on visco-elastic theory. Mech. Time-Depend. Mater. 2011, 15, 293–308. [Google Scholar] [CrossRef]
- Sakai, T.; Hirai, Y.; Somiya, S. Estimating the creep behavior of glass-fiber-reinforced polyamide considering the effects of crystallinity and fiber volume fraction. Mech. Adv. Mater. Mod. Process. 2018, 4, 5. [Google Scholar] [CrossRef] [Green Version]
- Koyanagi, J.; Nakada, M.; Miyano, Y. Tensile strength at elevated temperature and its applicability as an accelerated testing methodology for unidirectional composites. Mech. Time-Depend. Mater. 2012, 16, 19–30. [Google Scholar] [CrossRef]
- Bowman, A.L.; Mun, S.; Nouranian, S.; Huddleston, B.D.; Gwaltney, S.R.; Baskes, M.I.; Horstemeyer, M.F. Free volume and internal structural evolution during creep in model amorphous polyethylene by Molecular Dynamics simulations. Polymer 2019, 170, 85–100. [Google Scholar] [CrossRef]
- Knauss, W.G. A review of fracture in viscoelastic materials. Int. J. Fract. 2015, 196, 99–146. [Google Scholar] [CrossRef]
- Naderi, M.; Amiri, M.; Khonsari, M.M. On the thermodynamic entropy of fatigue fracture. Proc. R. Soc. A Math. Phys. Eng. Sci. 2010, 466, 423–438. [Google Scholar] [CrossRef] [Green Version]
- Basaran, C.; Nie, S. An irreversible thermodynamics theory for damage mechanics of solids. Int. J. Damage Mech. 2004, 13, 205–223. [Google Scholar] [CrossRef]
- Sato, M.; Hasegawa, K.; Koyanagi, J.; Higuchi, R.; Ishida, Y. Residual strength prediction for unidirectional CFRP using a nonlinear viscoelastic constitutive equation considering entropy damage. Compos. Part A Appl. Sci. Manuf. 2021, 141, 106178. [Google Scholar] [CrossRef]
- Idris, R.; Abdullah, S.; Thamburaja, P.; Omar, M.Z. Prediction of fatigue crack growth rate based on entropy generation. Entropy 2020, 22, 9. [Google Scholar] [CrossRef] [Green Version]
- Yun, H.; Modarres, M. Measures of Entropy to Characterize Fatigue Damage in Metallic Materials. Entropy 2019, 21, 804. [Google Scholar] [CrossRef] [Green Version]
- Jang, J.Y.; Khonsari, M.M. On the evaluation of fracture fatigue entropy. Theor. Appl. Fract. Mech. 2018, 96, 351–361. [Google Scholar] [CrossRef]
- Huang, J.; Li, C.; Liu, W. Investigation of internal friction and fracture fatigue entropy of CFRP laminates with various stacking sequences subjected to fatigue loading. Thin-Walled Struct. 2020, 155, 106978. [Google Scholar] [CrossRef]
- Mohammadi, B.; Shokrieh, M.M.; Jamali, M.; Mahmoudi, A.; Fazlali, B. Damage-entropy model for fatigue life evaluation of off-axis unidirectional composites. Compos. Struct. 2021, 270, 114100. [Google Scholar] [CrossRef]
- Ghane, E.; Mohammadi, B. Entropy-damage mechanics for the failure investigation of plain weave fabric composites. Compos. Struct. 2020, 250, 112493. [Google Scholar] [CrossRef]
- Mehdizadeh, M.; Khonsari, M.M. On the application of fracture fatigue entropy to multiaxial loading. Int. J. Fatigue 2021, 150. [Google Scholar] [CrossRef]
- Fan, J.; Anastassiou, A.; Macosko, C.W.; Tadmor, E.B. Molecular dynamics predictions of thermomechanical properties of an epoxy thermosetting polymer. Polymer 2020, 196, 122477. [Google Scholar] [CrossRef]
- Fujimoto, K.; Tang, Z.; Shinoda, W.; Okazaki, S. All-atom molecular dynamics study of impact fracture of glassy polymers. I: Molecular mechanism of brittleness of PMMA and ductility of PC. Polymer 2019, 178, 121570. [Google Scholar] [CrossRef]
- Koyanagi, J.; Takase, N.; Mori, K.; Sakai, T. Molecular dynamics simulation for the quantitative prediction of experimental tensile strength of a polymer material. Compos. Part C Open Access 2020, 2, 100041. [Google Scholar] [CrossRef]
- Chen, S.; Seveno, D.; Gorbatikh, L. Multiscale modeling and maximizing the thermal conductivity of Polyamide-6 reinforced by highly entangled graphene flakes. Compos. Part A Appl. Sci. Manuf. 2021, 151, 106632. [Google Scholar] [CrossRef]
- Cheng, H.; Zhao, K.; Gong, Y.; Wang, X.; Wang, R.; Wang, F.; Hu, R.; Wang, F.; Zhang, X.; He, J.; et al. Covalent coupling regulated thermal conductivity of poly(vinyl alcohol)/boron nitride composite film based on silane molecular structure. Compos. Part A Appl. Sci. Manuf. 2020, 137. [Google Scholar] [CrossRef]
- Bhowmik, R.; Sihn, S.; Varshney, V.; Roy, A.K.; Vernon, J.P. Calculation of specific heat of polymers using molecular dynamics simulations. Polymer 2019, 167, 176–181. [Google Scholar] [CrossRef]
- Takase, N.; Koyanagi, J.; Mori, K.; Sakai, T. Molecular Dynamics Simulation for Evaluating Fracture Entropy of a Polymer Material under Various Combined Stress States. Materials 2021, 14, 1884. [Google Scholar] [CrossRef]
- Vu-Bac, N.; Zhuang, X.; Rabczuk, T. Uncertainty Quantification for Mechanical Properties of Polyethylene Based on Fully Atomistic Model. Materials 2019, 12, 3613. [Google Scholar] [CrossRef] [Green Version]
- Vacher, R.; de Wijn, A.S. Molecular-Dynamics Simulations of the Emergence of Surface Roughness in a Polymer under Compression. Materials 2021, 14, 7327. [Google Scholar] [CrossRef]
- Terazawa, R.; Tamura, A.; Kageyama, K.; Sakai, T. Molecular dynamics simulation of weak bonds in carbon fiber reinforced plastic adhesive joints. Adv. Compos. Mater. 2021, 30, 15. [Google Scholar] [CrossRef]
- Kasahara, S.; Koyanagi, J.; Mori, K.; Yabe, M. Evaluation of interface properties of carbon fiber/resin using the full atomistic model considering the electric charge state. Adv. Compos. Mater. 2020, 30, 164–175. [Google Scholar] [CrossRef]
- Koyanagi, J.; Itano, N.; Yamamoto, M.; Mori, K.; Ishida, Y.; Bazhirov, T. Evaluation of the mechanical properties of carbon fiber/polymer resin interfaces by molecular simulation. Adv. Compos. Mater. 2019, 28, 639–652. [Google Scholar] [CrossRef]
- Niuchi, T.; Koyanagi, J.; Inoue, R.; Kogo, Y. Molecular dynamics study of the interfacial strength between carbon fiber and phenolic resin. Adv. Compos. Mater. 2017, 26, 569–581. [Google Scholar] [CrossRef]
- Oya, Y.; Inuyama, K.; Okabe, T.; Koyanagi, J.; Matsuzaki, R. Analysis of structure characteristics in laminated graphene oxide nanocomposites using molecular dynamics simulation. Adv. Compos. Mater. 2018, 27, 427–438. [Google Scholar] [CrossRef]
- Bekkedahl, N.; Matheson, H. Heat Capacity, Entropy, and Free Energy of Rubber Hydrocarbon. Rubber Chem. Technol. 1936, 9, 264–274. [Google Scholar] [CrossRef]
- Berendsen, H.J.C.; van der Spoel, D.; van Drunen, R. GROMACS: A message-passing parallel molecular dynamics implementation. Comput. Phys. Commun. 1995, 91, 43–56. [Google Scholar] [CrossRef]
- Jorgensen, W.L.; Maxwell, D.S.; Tirado-Rives, J. Development and testing of the OPLS all-atom force field on conformational energetics and properties of organic liquids. J. Am. Chem. Soc. 1996, 118, 11225–11236. [Google Scholar] [CrossRef]
- YABE, M.; MORI, K.; UEDA, K.; TAKEDA, M. Development of PolyParGen Software to Facilitate the Determination of Molecular Dynamics Simulation Parameters for Polymers. J. Comput. Chem. Jpn. -Int. Ed. 2019, 5, 1–5. [Google Scholar] [CrossRef] [Green Version]
- Essmann, U.; Perera, L.; Berkowitz, M.L.; Darden, T.; Lee, H.; Pedersen, L.G. A smooth particle mesh Ewald method. J. Chem. Phys. 1995, 103, 8577–8593. [Google Scholar] [CrossRef] [Green Version]
- Hess, B.; Bekker, H.; Berendsen, H.J.C.; Fraaije, J.G.E.M. LINCS: A Linear Constraint Solver for molecular simulations. J. Comput. Chem. 1997, 18, 1463–1472. [Google Scholar] [CrossRef]
- Li, J.; Humphrey, M.; Agarwal, D.; Jackson, K.; Van Ingen, C.; Ryu, Y. EScience in the cloud: A MODIS satellite data reprojection and reduction pipeline in the Windows Azure platform. In Proceedings of the 2010 IEEE International Symposium on Parallel & Distributed Processing (IPDPS), Atlanta, GA, USA, 19–23 April 2010; pp. 1–15. [Google Scholar] [CrossRef] [Green Version]
- Parrinello, M.; Rahman, A. Polymorphic transitions in single crystals: A new molecular dynamics method. J. Appl. Phys. 1981, 52, 7182–7190. [Google Scholar] [CrossRef]
- Koyanagi, J.; Hasegawa, K.; Ohtani, A.; Sakai, T.; Sakaue, K. Formulation of non-linear viscoelastic–viscoplastic constitutive equation for polyamide 6 resin. Heliyon 2021, 7, e06335. [Google Scholar] [CrossRef]
- Verdonck, E.; Schaap, K.; Thomas, L.C. A discussion of the principles and applications of Modulated Temperature DSC (MTDSC). Int. J. Pharm. 1999, 192, 3–20. [Google Scholar] [CrossRef]


Publisher’s Note: MDPI stays neutral with regard to jurisdictional claims in published maps and institutional affiliations. |
© 2022 by the authors. Licensee MDPI, Basel, Switzerland. This article is an open access article distributed under the terms and conditions of the Creative Commons Attribution (CC BY) license (https://creativecommons.org/licenses/by/4.0/).
Share and Cite
Sakai, T.; Takase, N.; Oya, Y.; Koyanagi, J. A Possibility for Quantitative Detection of Mechanically-Induced Invisible Damage by Thermal Property Measurement via Entropy Generation for a Polymer Material. Materials 2022, 15, 737. https://doi.org/10.3390/ma15030737
Sakai T, Takase N, Oya Y, Koyanagi J. A Possibility for Quantitative Detection of Mechanically-Induced Invisible Damage by Thermal Property Measurement via Entropy Generation for a Polymer Material. Materials. 2022; 15(3):737. https://doi.org/10.3390/ma15030737
Chicago/Turabian StyleSakai, Takenobu, Naohiro Takase, Yutaka Oya, and Jun Koyanagi. 2022. "A Possibility for Quantitative Detection of Mechanically-Induced Invisible Damage by Thermal Property Measurement via Entropy Generation for a Polymer Material" Materials 15, no. 3: 737. https://doi.org/10.3390/ma15030737