
Unveiling the Hidden Entropy in ZnFe2O4
by
 , , , , and
Miguel Angel Cobos
1 ,
,
Antonio Hernando
1,2,3,4 ,
,
José Francisco Marco
5,
Inés Puente-Orench
6,7,
José Antonio Jiménez
8,
Irene Llorente
8,
Asunción García-Escorial
8 and
Patricia de la Presa
1,9,*
1
Instituto de Magnetismo Aplicado (UCM-ADIF), CSIC, 28260 Las Rozas, Spain
2
Donostia International Physics Center, 20018 Gipuzkoa, Spain
3
IMDEA Nanociencia, 28049 Madrid, Spain
4
Industrial Engineering Department, Universidad de Nebrija, 28015 Madrid, Spain
5
Instituto de Química Física Rocasolano, 28006 Madrid, Spain
6
Institut Laue-Langevin, CEDEX 09, 38042 Grenoble, France
7
Instituto de Ciencia de Materiales de Aragón (ICMA), CSIC, 50009 Zaragoza, Spain
8
Centro Nacional de Investigaciones Metalúrgicas (CENIM), CSIC, 28040 Madrid, Spain
9
Department of Material Physics, Complutense University of Madrid, 28040 Madrid, Spain
*
Author to whom correspondence should be addressed.
Materials 2022, 15(3), 1198; https://doi.org/10.3390/ma15031198
Submission received: 20 December 2021
/
Revised: 27 January 2022
/
Accepted: 31 January 2022
/
Published: 4 February 2022
Abstract
:The antiferromagnetic (AFM) transition of the normal ZnFe2O4 has been intensively investigated with results showing a lack of long-range order, spin frustrations, and a “hidden” entropy in the calorimetric properties for inversion degrees δ ≈ 0 or δ = 0. As δ drastically impacts the magnetic properties, it is logical to question how a δ value slightly different from zero can affect the magnetic properties. In this work, (Zn1-δFeδ)[ZnδFe2-δ]O4 with δ = 0.05 and δ = 0.27 have been investigated with calorimetry at different applied fields. It is shown that a δ value as small as 0.05 may affect 40% of the unit cells, which become locally ferrimagnetic (FiM) and coexists with AFM and spin disordered regions. The spin disorder disappears under an applied field of 1 T. Mossbauer spectroscopy confirms the presence of a volume fraction with a low hyperfine field that can be ascribed to these spin disordered regions. The volume fractions of the three magnetic phases estimated from entropy and hyperfine measurements are roughly coincident and correspond to approximately 1/3 for each of them. The “hidden” entropy is the zero point entropy different from 0. Consequently, the so-called “hidden” entropy can be ascribed to the frustrations of the spins at the interphase between the AFM-FiM phases due to having δ ≈ 0 instead of ideal δ = 0.
1. Introduction
Zinc ferrites belong to the spinel structure (Zn1-δFeδ)A[ZnδFe2-δ]BO4, where A and B represent, respectively, the tetrahedral and the octahedral sites of the cubic structure and δ is the inversion degree parameter. There is a general agreement in the scientific community that δ plays the fundamental role in the magnetic properties of (Zn1-δFeδ)A[ZnδFe2-δ]BO4 with δ ≠ 0 [1,2,3,4]. For δ = 0, the ferrite is denominated normal, and it has been predicted to have an antiferromagnetic (AFM) transition around 10 K [5]. For δ ≠ 0, the zinc ferrite becomes ferrimagnetic (FiM) with magnetization that depends on δ as M = δ·(5.9 µB) at 5 K [4] and can reach high magnetization values even at room temperature.
Several articles have been published attempting to identify the AFM transition with a large variety of techniques like neutron powder diffraction (NPD), Mossbauer and µRS spectroscopy, magnetometry, calorimetry, among others [4,6,7,8,9,10,11,12,13,14,15,16,17,18]. Most of the results on NPD report on broad peaks that suggest lack of long-range order; Fe magnetic moment smaller than 5.9 µB at the octahedral sites; a positive Curie–Weiss temperature and a magnetic entropy which is half that of the theoretical one. This reduced entropy has been observed in other spinel structures [15,19,20], and has been described as a “hidden” entropy, an entropy different from 0 at the zero point entropy [19]. Since in most of the experimental works on normal spinel, it is assumed δ ≈ 0 [21,22,23,24], the main question is: how critical is it to have δ ≈ 0 instead δ = 0.
This work shows that a δ slightly different from zero (δ = 0.05) dramatically affects the magnetic properties. For this goal, two samples are investigated: one with δ = 0.05 (that can be considered as δ ≈ 0) and δ = 0.27 (δ ≠ 0). X-ray and neutron powder diffraction, calorimetry at various applied fields (0, 1, 5, and 9 T), and Mossbauer characterizations have been performed. The results show that for δ = 0.05, around 40% of the unit cells suffer a Zn/Fe cation exchange with a huge impact on the magnetic interactions inside the unit cell.
2. Materials and Methods
Different treatments were carried out in powder zinc ferrite supplied by Alfa–Aesar (Alfa Aesar GmbH & Co KG, Germany) (99% purity) in order to obtain samples with different inversion degrees. First, the sample was calcined for 2 h at 1100 °C with a slow cooling down at an average speed of 7 °C/min; the sample was named ZFO-0.05. Later, the commercial powder was milled up to 50 h in a Retsch PM4 planetary mill (Retsch GmbH, Haan, Germany), in a 250 cm3 capacity jar and 1 cm diameter balls stainless steel, at a rotating speed of 275 rpm. This milled sample was then subjected to an annealing temperature of 400 °C for 1 h in order to decrease the inversion degree. The sample name was ZFO-0.27.
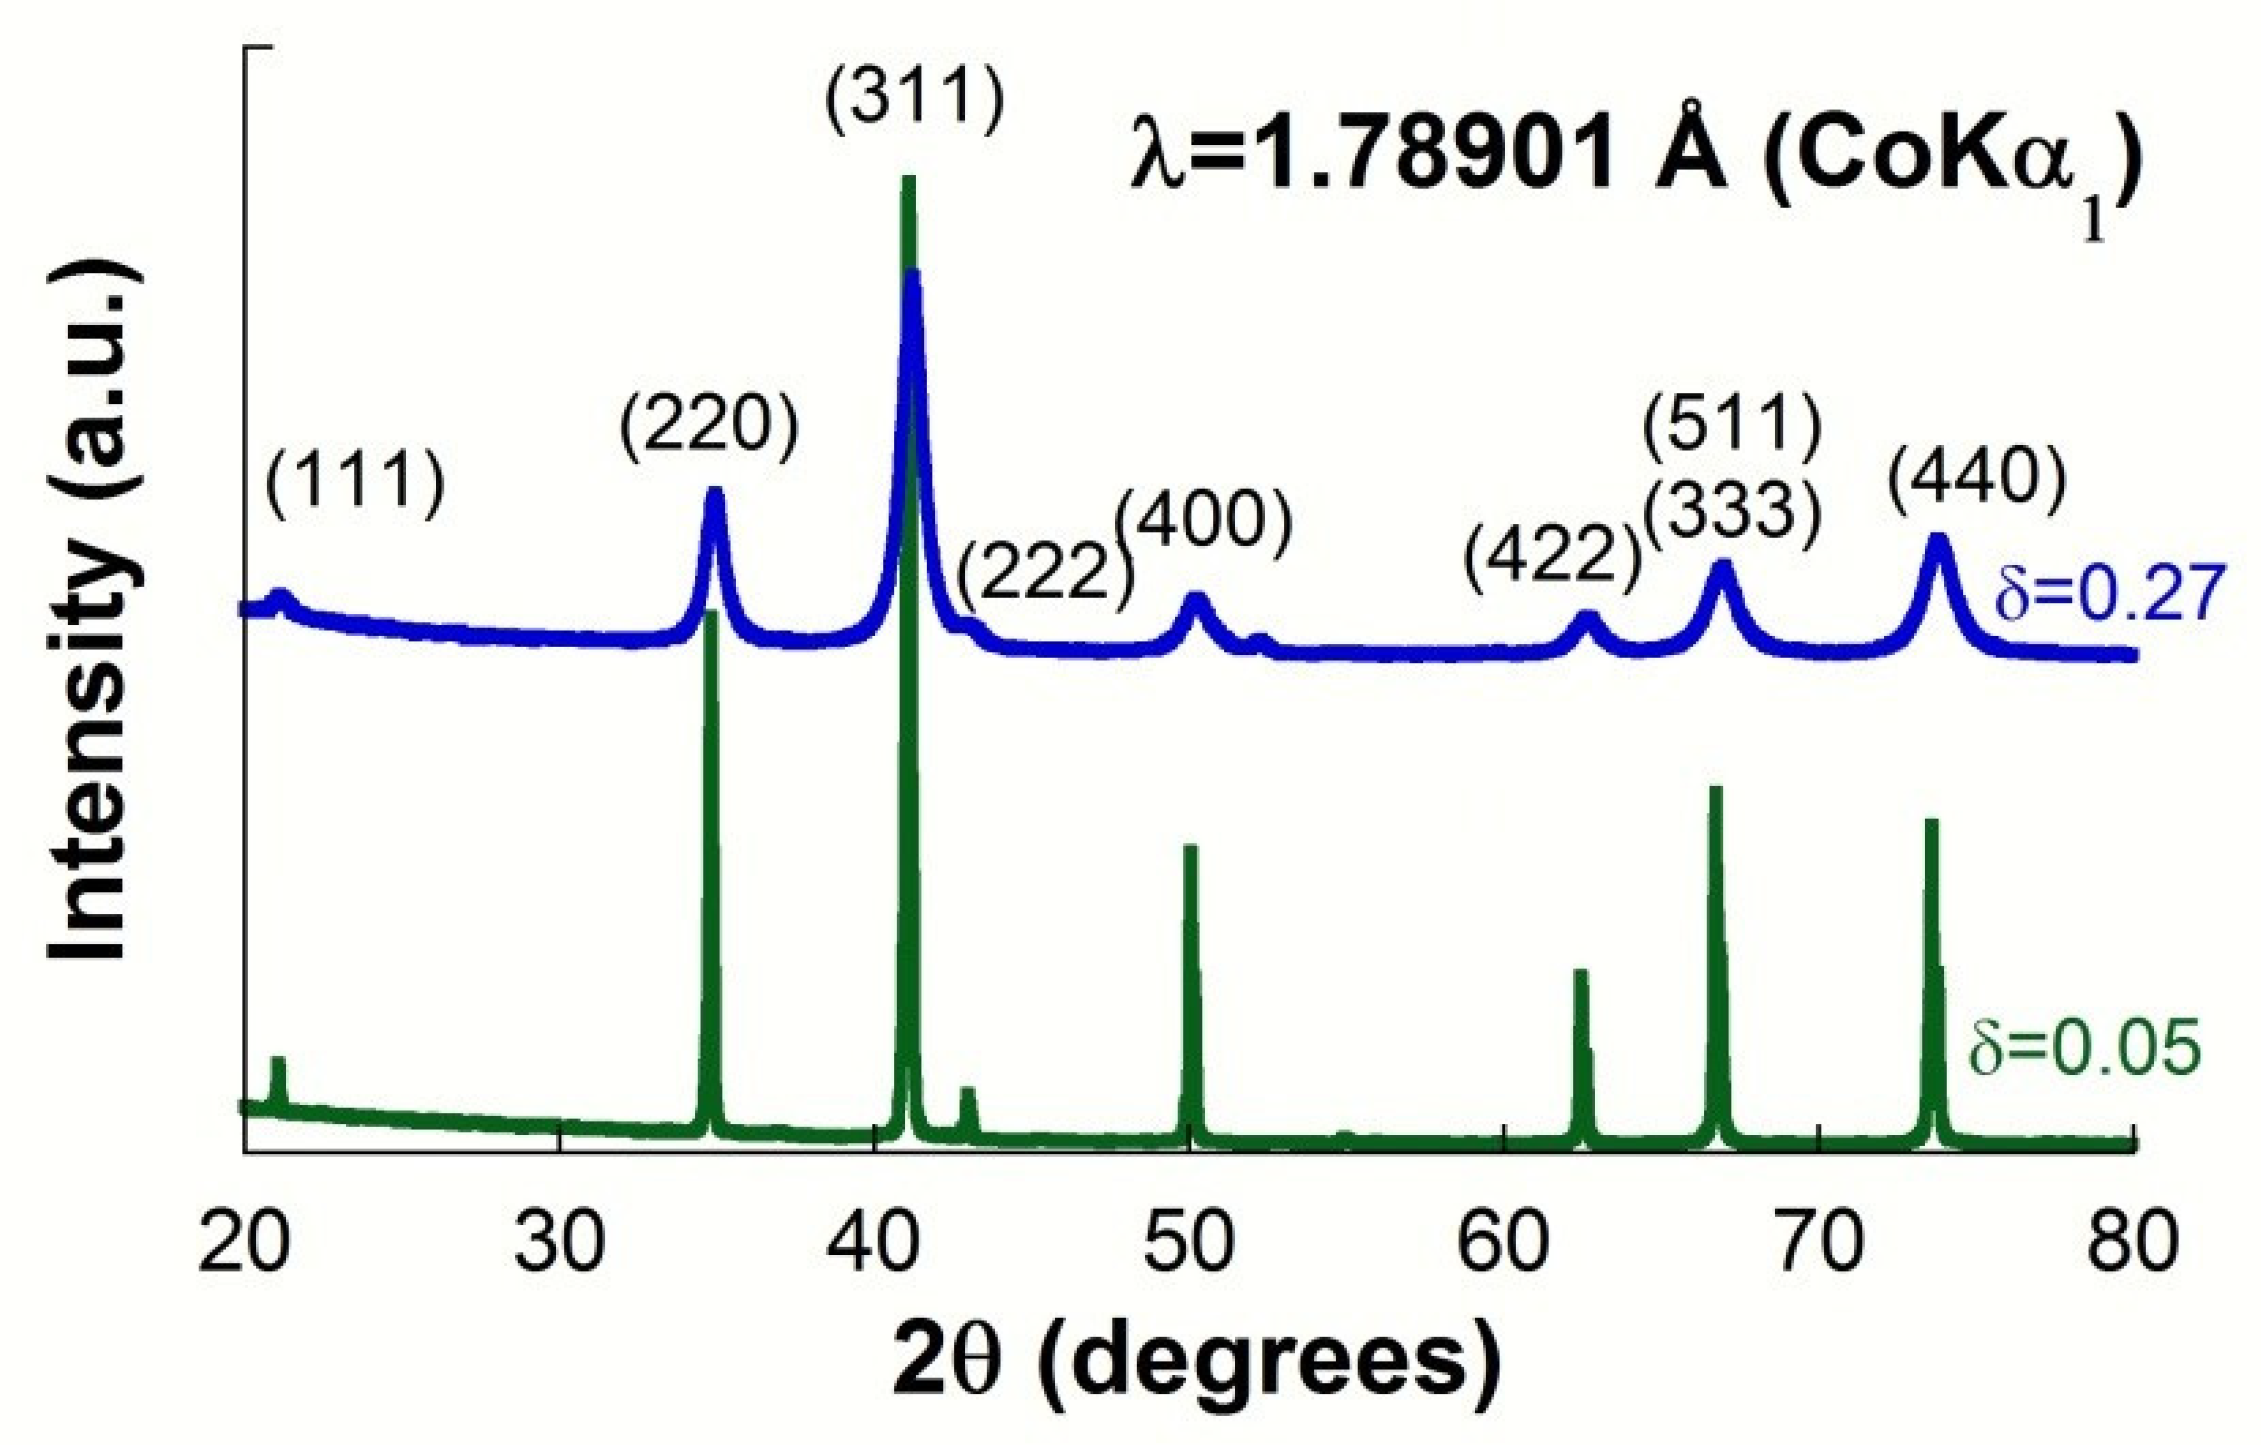
The samples were initially characterized by X-ray Diffraction (XRD) at room temperature (RT) using Co radiation in a Bruker AXS D8 diffractometer equipped with a Goebel mirror and a LynxEye detector (Bruker AXDS, GmbH, Karlsruhe, Germany). XRD spectra were collected in Bragg-Brentano geometry over a 2θ range from 10° to 120° with a step of 0.01°. Additionally, the magnetic structure has been studied using neutron powder diffraction (NPD) recorded at RT and 2 K at the Institute Laue-Langevin, Grenoble (France) with the high-resolution D2B (λ = 1.59 Å) diffractometer [25,26,27]. Powder samples were placed in vanadium cans and mounted onto a standard cryostat. Full diffraction patterns were obtained with a step of 0.05° with an acquisition time adjusted to obtain sufficient quality diffraction profiles (optimal counting statistics).
The obtained XRD and NPD patterns were analyzed using TOPAS v6.0 (Bruker AXDS, GmbH, Karlsruhe, Germany). Rietveld refinements were performed using as starting points the standardized structure for zinc ferrite taken from Pearson crystallographic database [28]. The quality of the refinements was evaluated by the statistically expected least-squares factor (Rexp), the weighted summation of residual of the least-squares fit (Rwp), and the goodness of fit (GoF or chi-square, whose limit tends to 1) [29].
Mossbauer experimental data were recorded from the sample ZFO-0.05 at 298.0, 77.0, and 8.8 K in the transmission mode using a conventional constant acceleration spectrometer, a 57Co(Rh) source, and a He closed-cycle cryorefrigerator.
Heat capacity was measured by PPMS (Physical Properties Measurement System) of Quantum Design in a range of temperatures between 2 and 300 K at zero applied field and at H = 1, 5, and 9 T from 2 to 40 K for both samples. For each applied field, the magnetic entropy change was calculated as .
3. Results and Discussion
XRD patterns of samples recorded at room temperature confirm the presence of a spinel structure that matches with the JCPDS file of Franklinite (JCPDS 22-1012), as observed in Figure 1. Rietveld refinements of the NPD and XRD data have provided microstructural parameters like cell lattice, inversion degree, O-position, crystallite size, and microdeformation shown in Table 1. As can be seen, these refinements have provided the same value of the inversion degree δ = 0.05 for the sample ZFO-0.05, whereas the inversion degree obtained for the ZFO-0.27 sample depends on the diffraction technique used. In spinel structures, the nuclear and magnetic diffraction peaks occur at the same scattering angles, giving rise to a strong correlation between the inversion parameter (occupancy) and magnetic moments. This correlation may lead to unsatisfactory fits and differences between the inversion parameter determined from the XRD and NPD patterns. To solve it, XRD and NDP data were simultaneously fitted by the Rietveld, constraining the microstructural parameters like inversion degree, the fractional coordinate of the oxygen atom, and particle size to the same value for the patterns recorded at both 2 and 300 K. The value of the lattice parameters at these temperatures were also constrained to be the same for both XRD and NPD patterns. Finally, independent magnetic moments were included in the refinement for the NPD profiles recorded at 300 and 2 K under the assumption that the cation distribution is the same at both temperatures. The best-fitted microstructural parameters obtained by the combined analysis lead to an inversion degree of 0.27, taken as the best value, for the good quality by low values of the R-factors and GoF (Rwp = 3.27, Rexp = 2.65, and GoF = 1.26).
It is worth noting that the crystallite size of sample ZFO-0.27 is 15 nm, below the magnetic critical size, whereas ZFO-0.05 has a crystallite size of micrometers, i.e., bulk size.
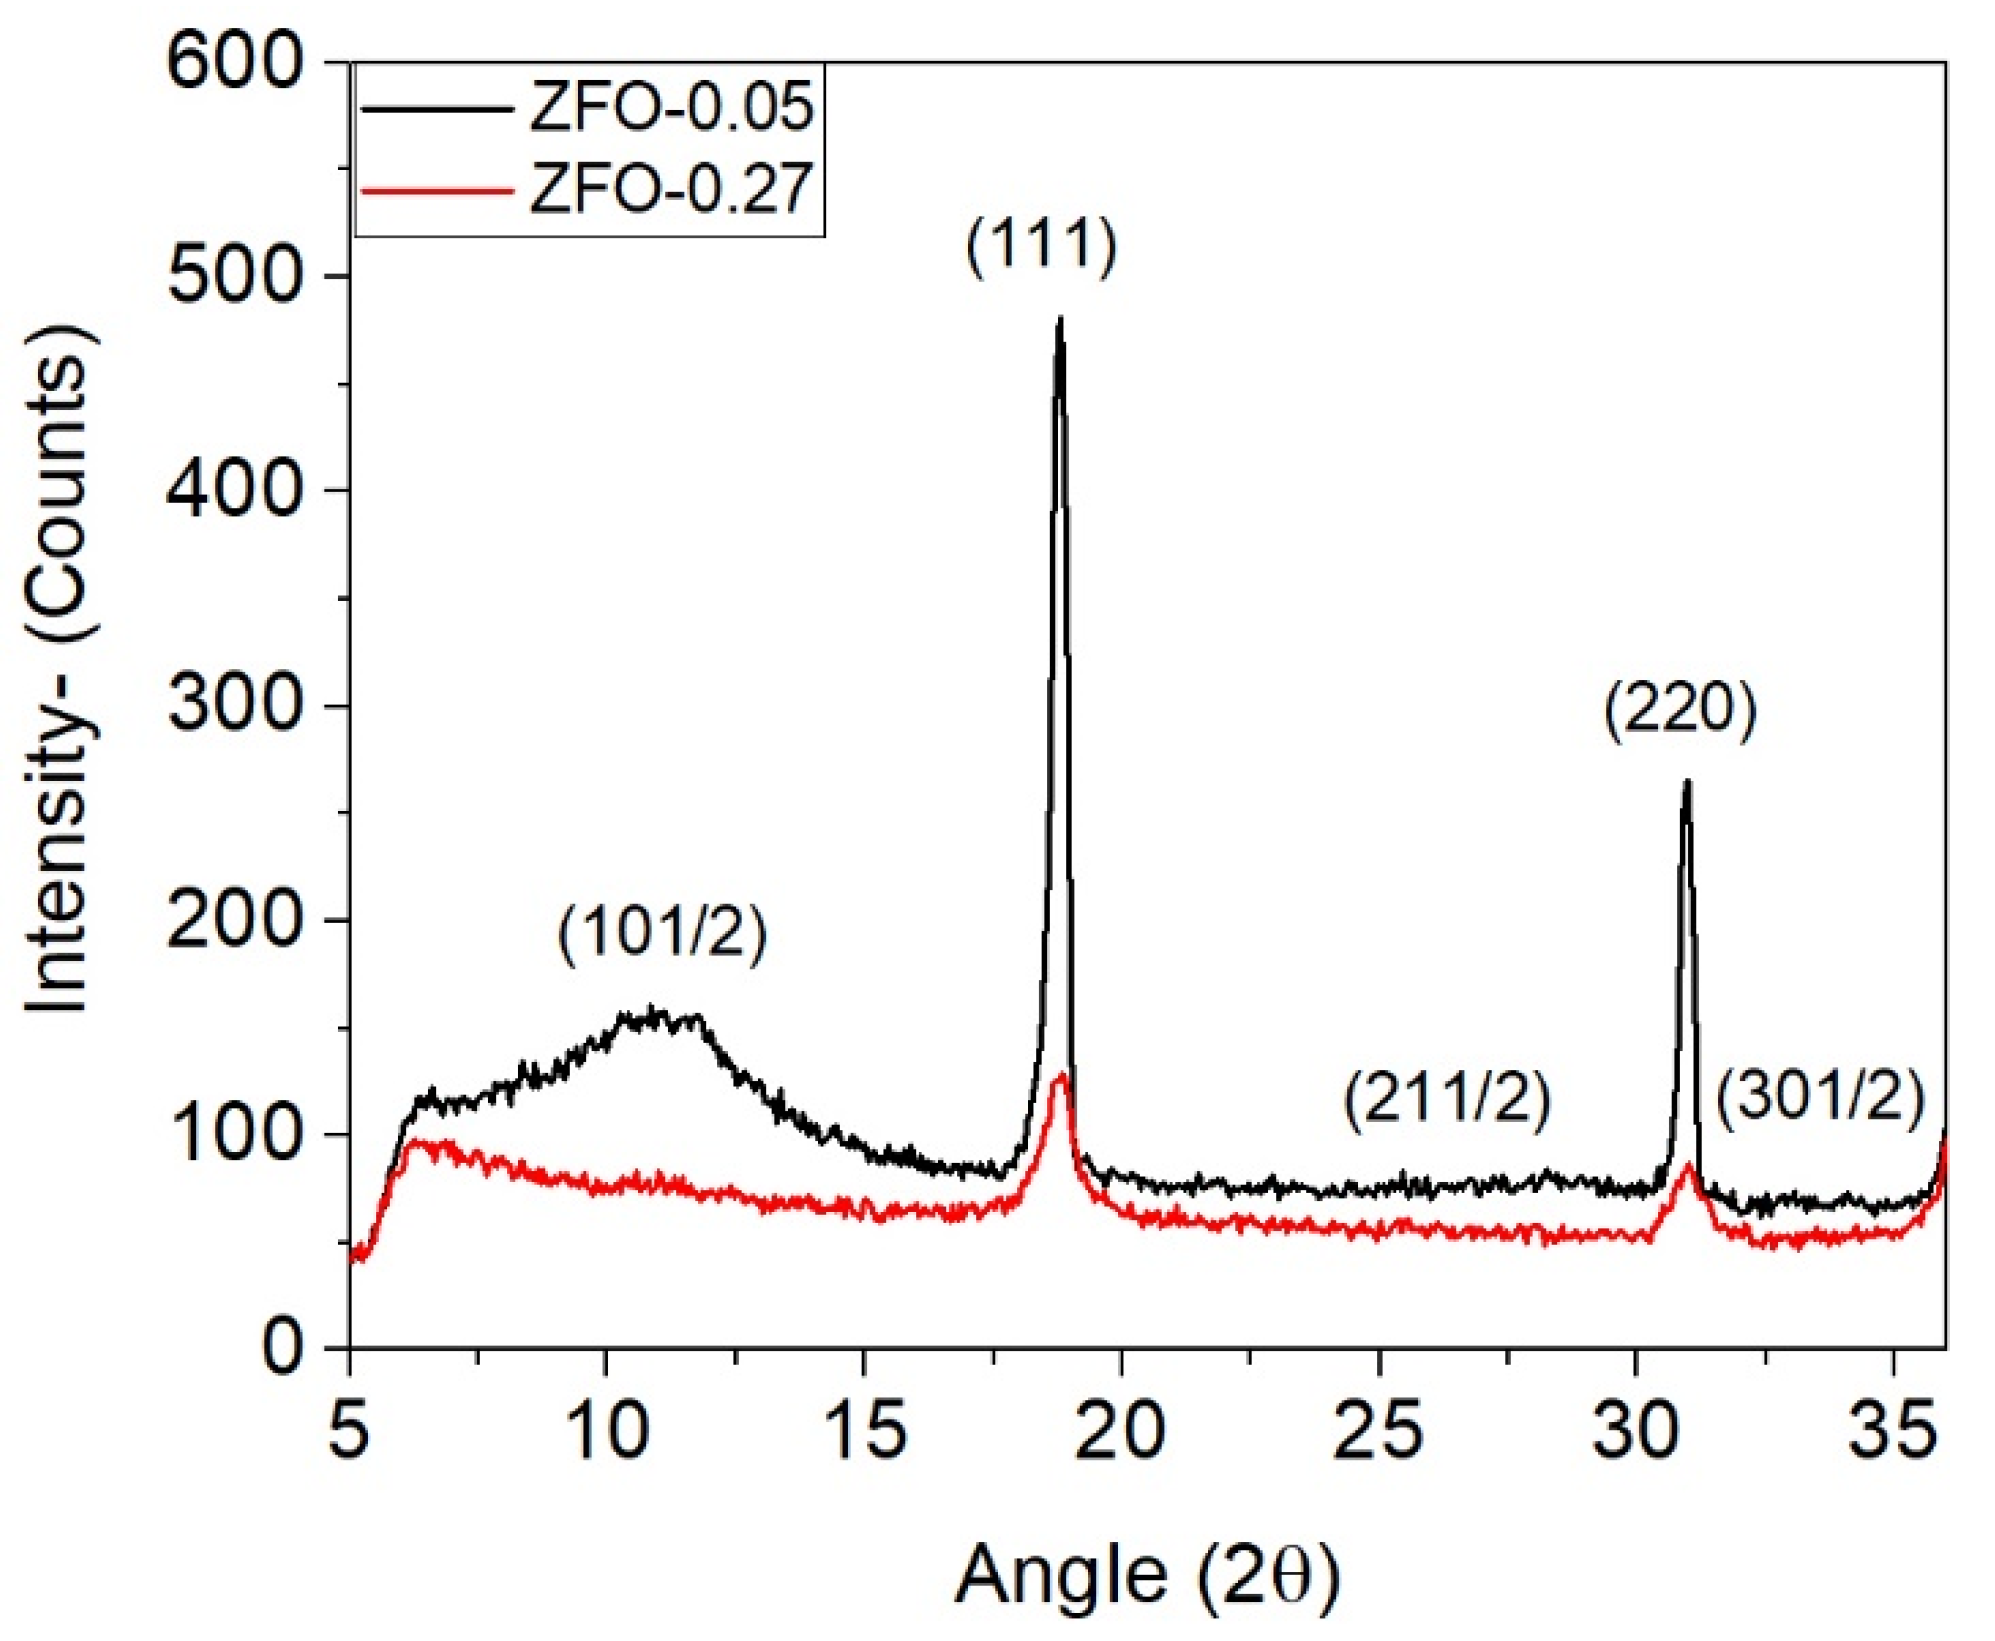
Figure 2 shows the NPD patterns for δ = 0.05 and 0.27 in the range 2θ = 5° to 37°. As the magnetic reflections superimposed the nuclear ones, an additional contribution in the intensity occurs for the peaks at (111) and (220) when some Fe3+ magnetic ions are also occupying A sites. In addition, peak broadening can occur by reducing the crystallite size and/or increasing the lattice strain. Besides differences in the height and shape of the diffraction peaks associated with these two factors, it can be observed a broad peak at a smaller angle for the sample with δ = 0.05 (Figure 2), corresponding to the (1 0 ½) reflection, which indicates the presence of a short-range order (SRO) antiferromagnetic (AFM) order. The area of this peak decreases with increasing δ. The broadness of the peak at (1 0 ½) for δ = 0.05 describes a picture of lack of AFM long-range order that has also been reported by other authors [9].
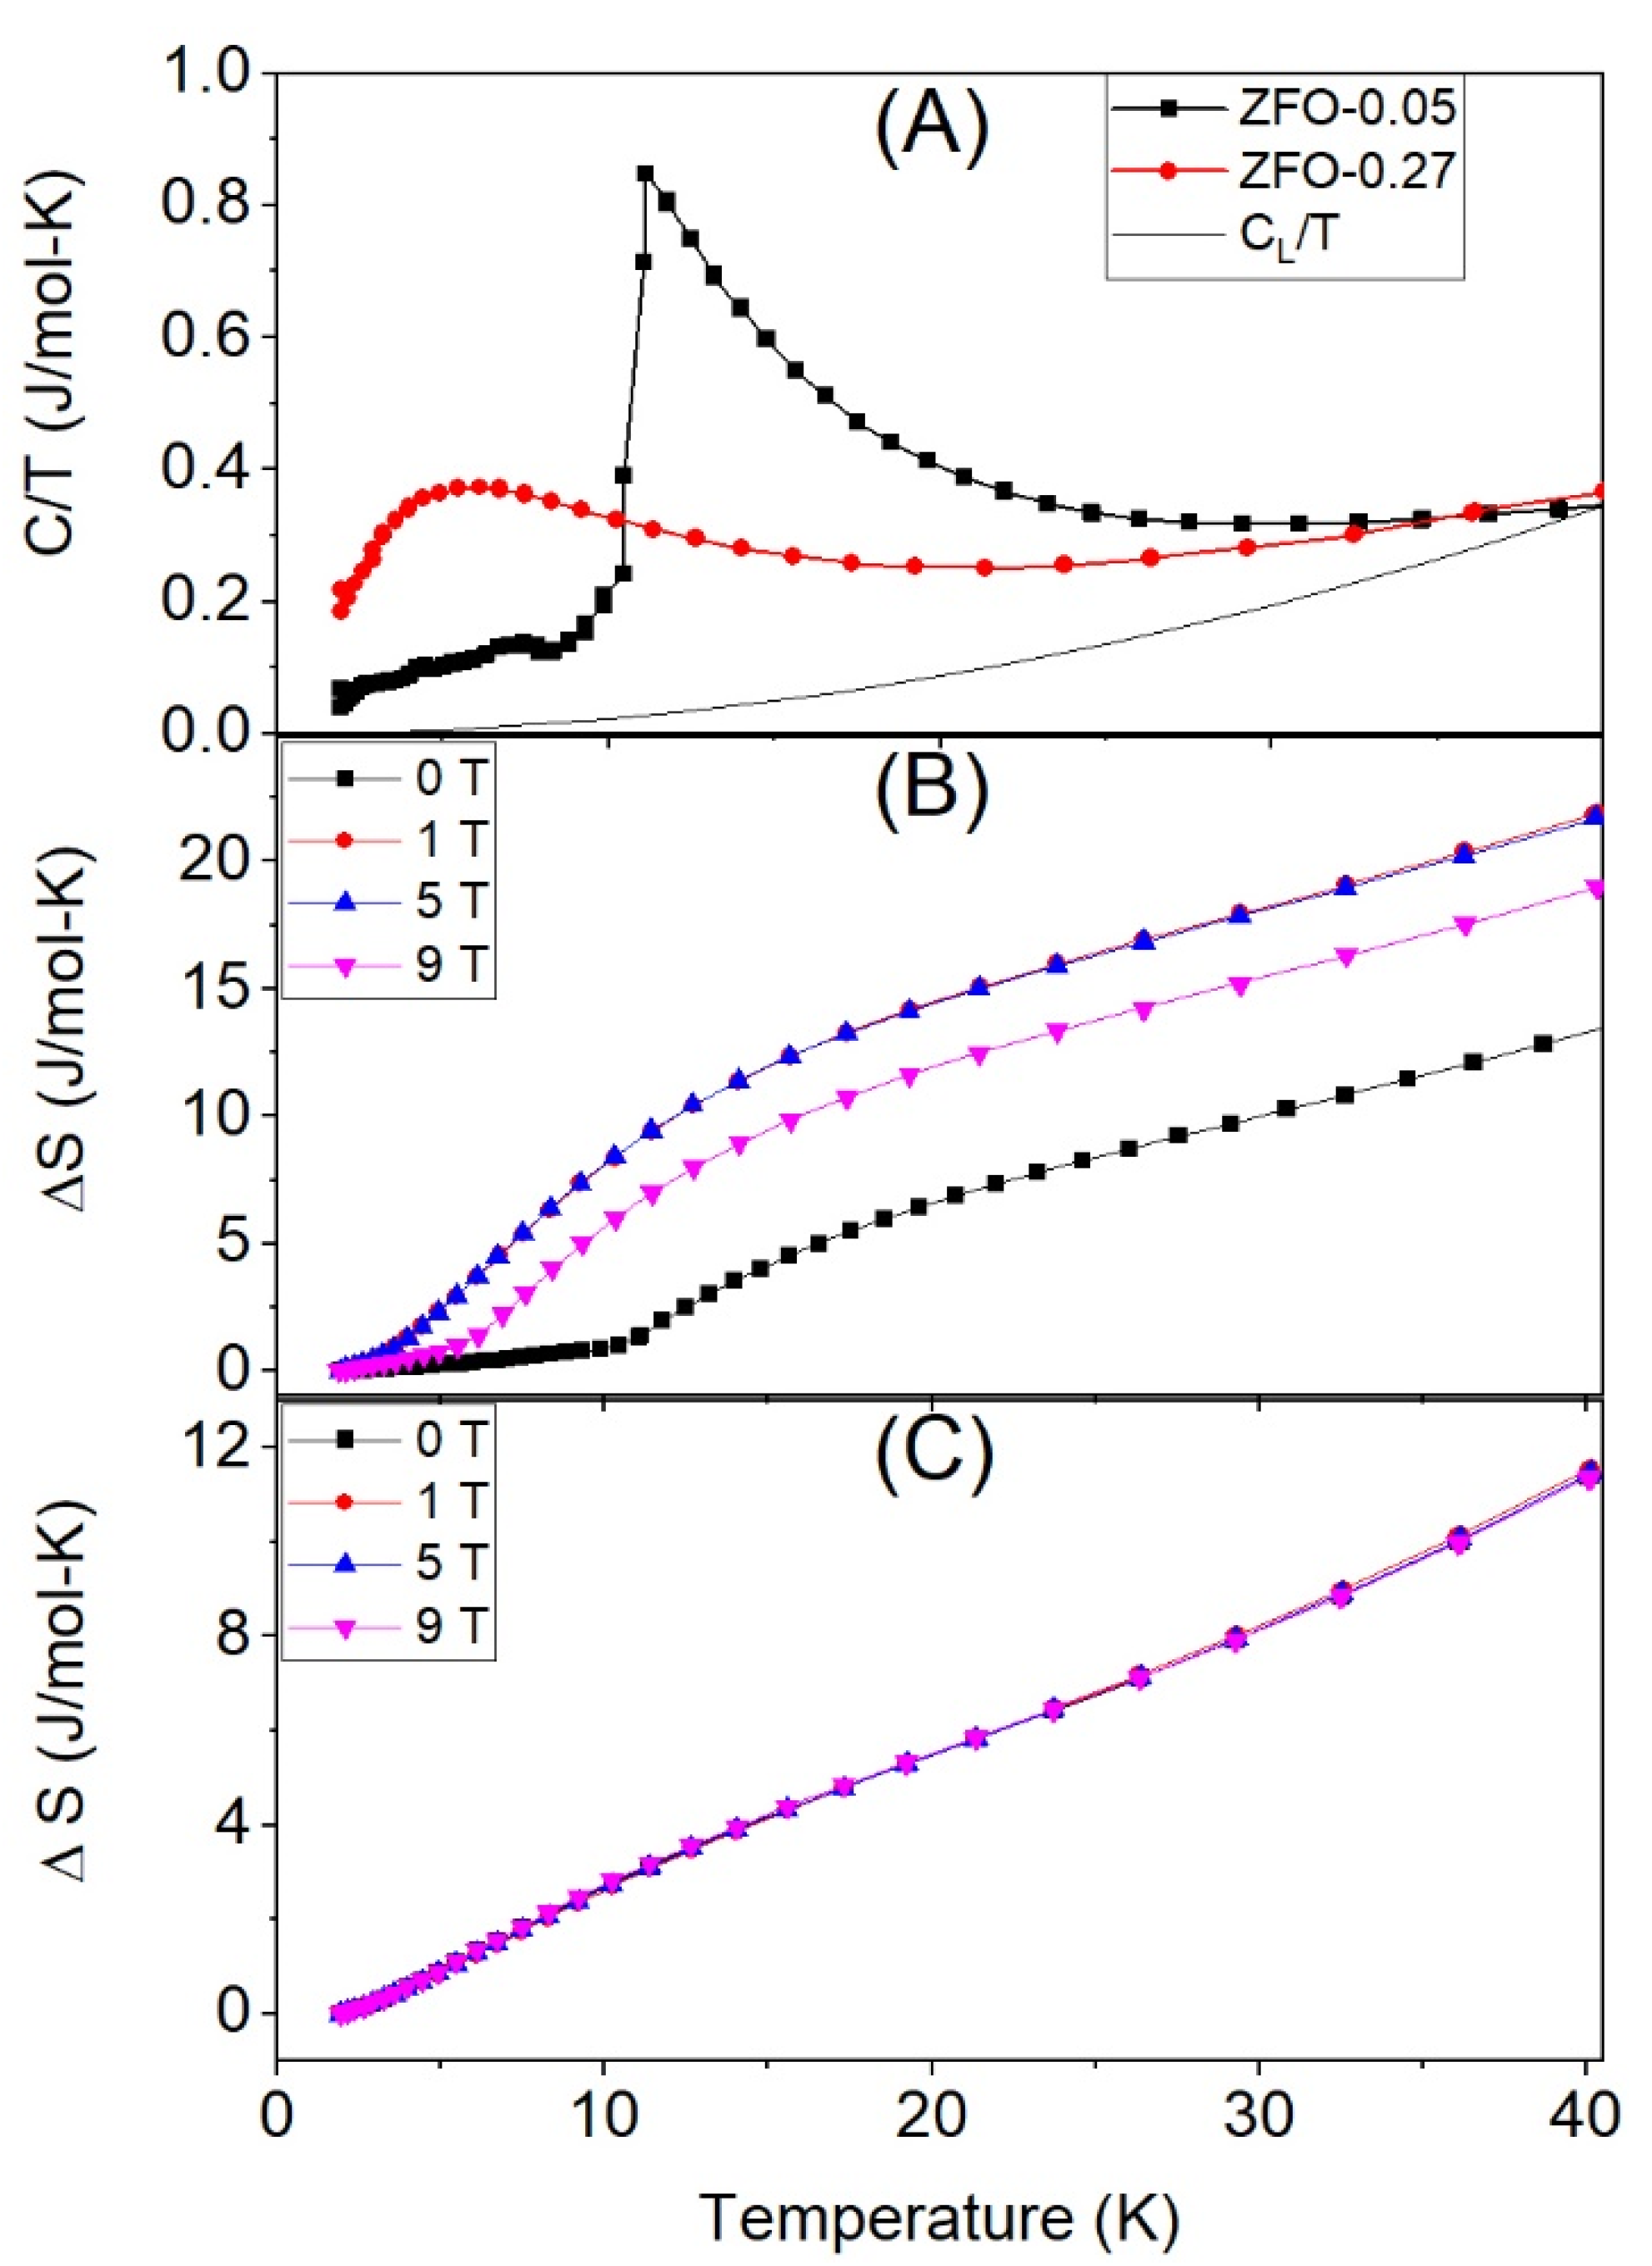
Figure 3 shows the heat capacity and the entropy increment for both samples. As can be seen in Figure 3A, C/T shows a sharp peak around 10 K for the sample with δ = 0.05, which is close to the Neel temperature of the normal zinc ferrite, whereas this peak becomes broader and shifts to lower temperatures when the inversion degree is δ = 0.27.
The total heat capacity (CT) between 2 and 40 K is the sum of both the magnetic (Cm) and vibrational (CL) heat capacities, while at 40 K, there are only vibrational contributions.
The vibrational heat capacity is given by the following equation:
where R is the ideal gas constant, θD is the Debye temperature, and T the temperature. By subtracting the vibrational contribution from the total heat capacity, the magnetic contribution to the entropy can be calculated by integrating the C/T curve.
The entropy increment is field-dependent in the case of very low inversion degree δ = 0.05 (i.e., δ ≈ 0). When magnetic fields from 1 to 5 T are applied, the entropy increment increases, being the increment almost independent of the field in this field range; however, the entropy decreases for an applied field of 9 T (Figure 3B). On the other hand, in the case of the larger inversion degree, δ = 0.27, the entropy increment is independent of the applied field (Figure 3C).
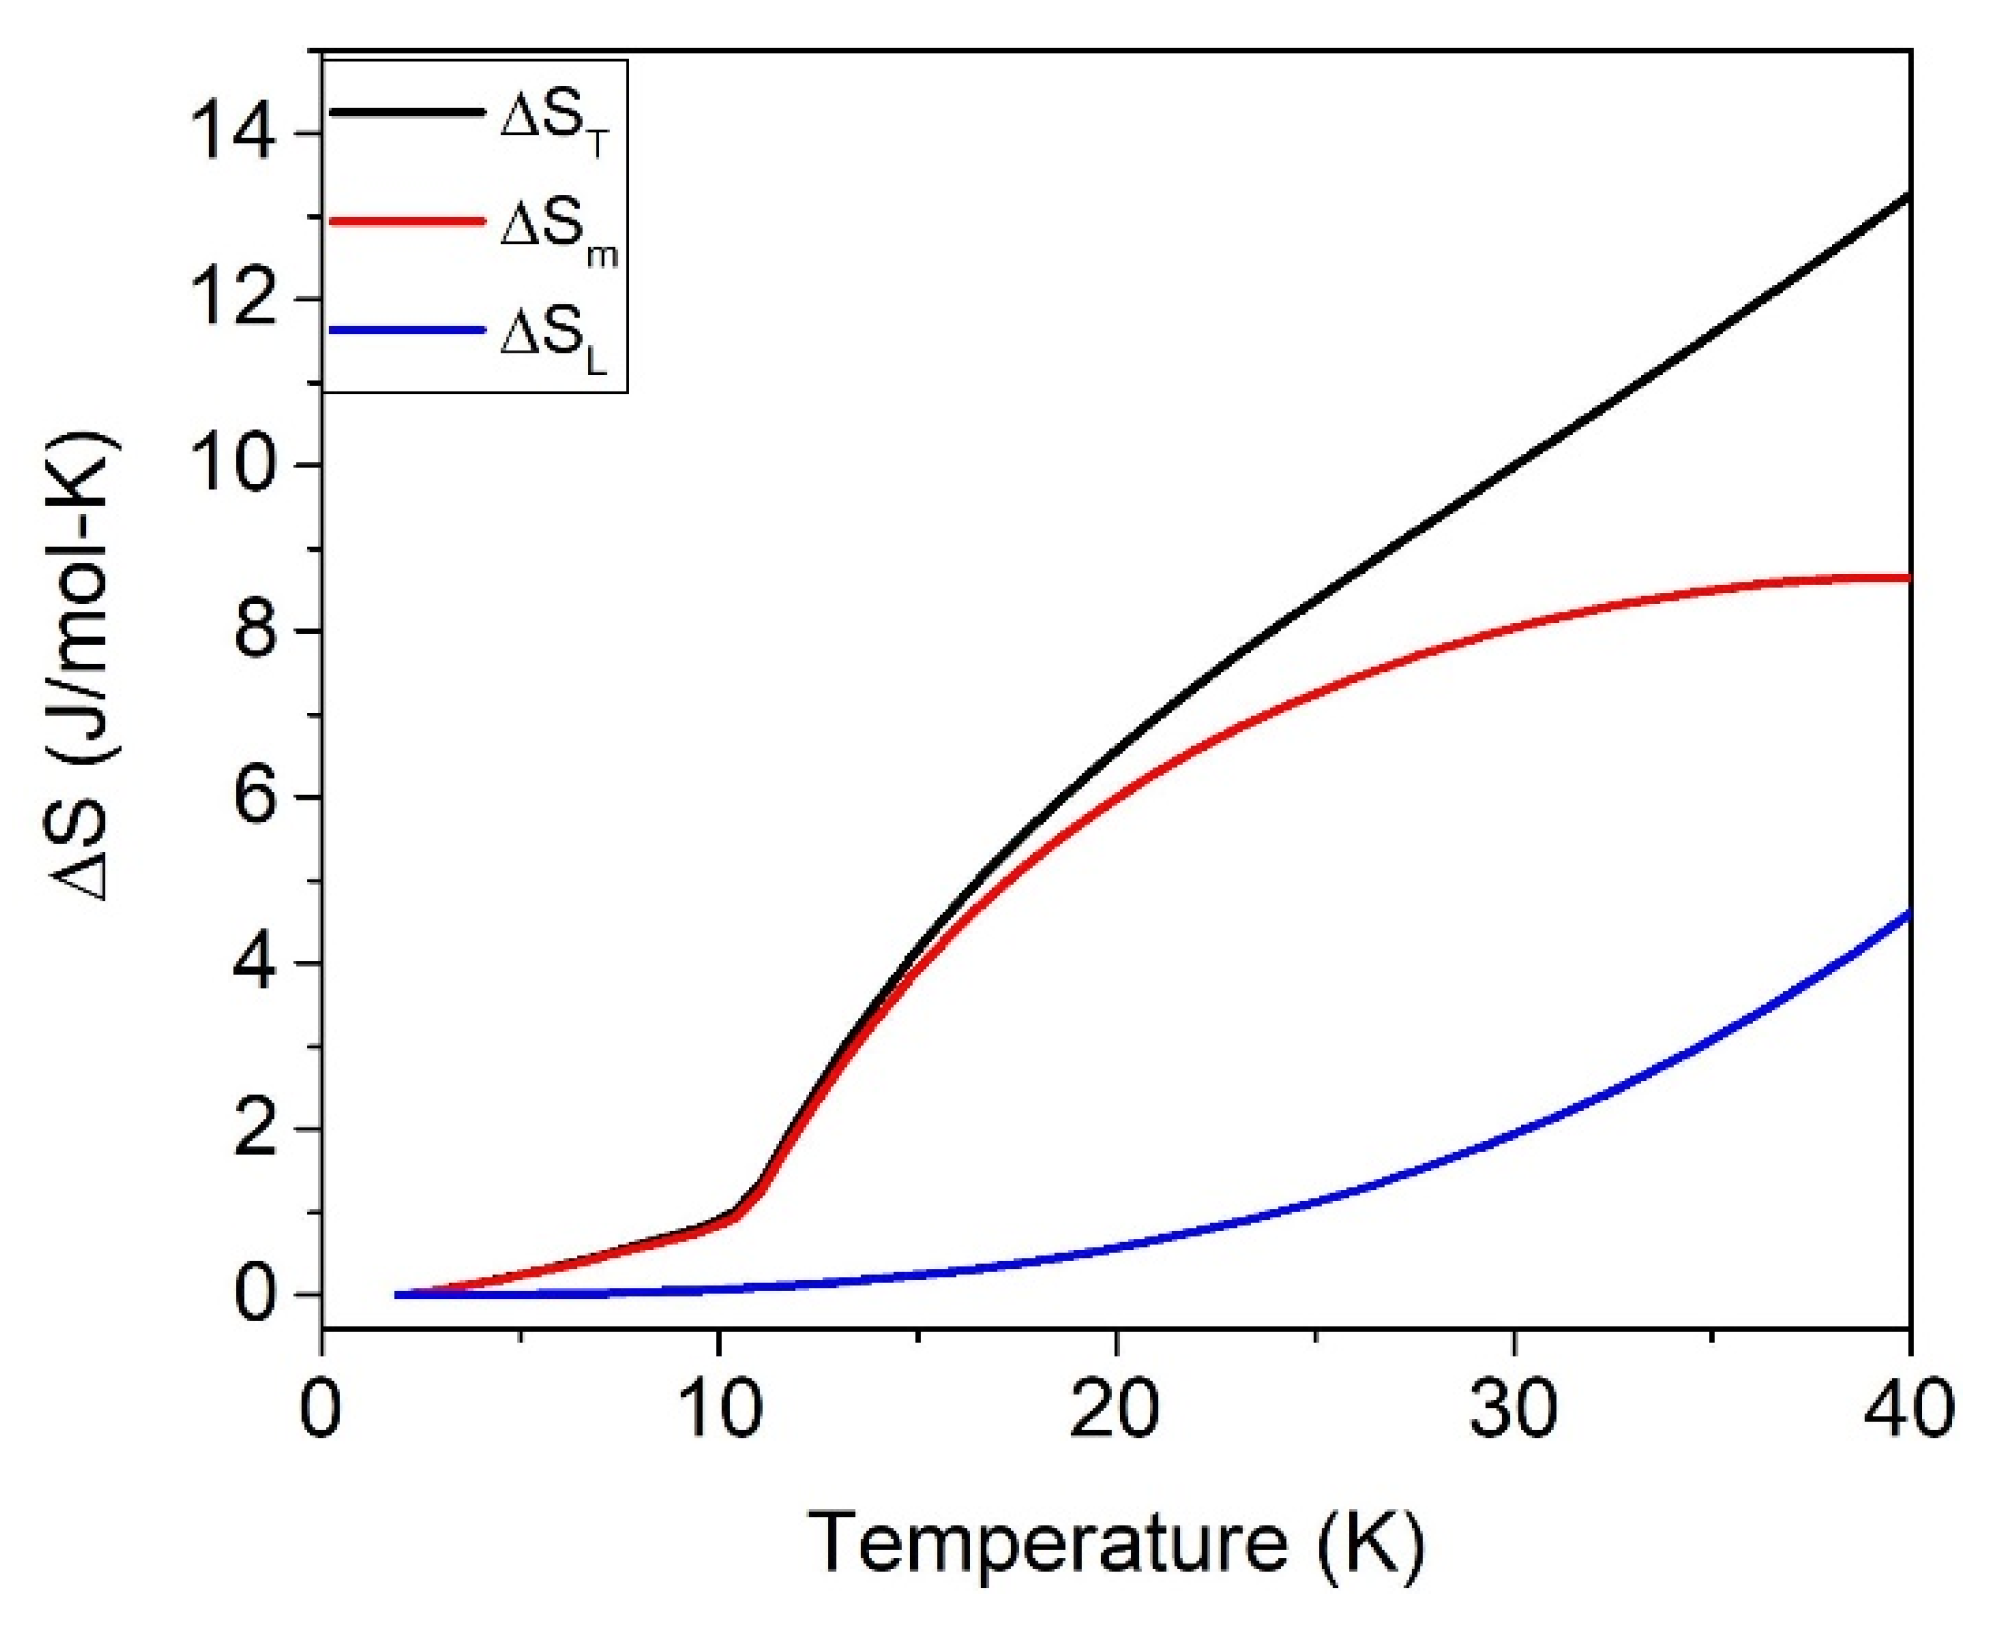
Figure 4 shows the total ΔST, magnetic ΔSm, and lattice ΔSL contributions to the entropy for δ = 0.05 at H = 0 T, and Table 2 collects the values at 40 K at different applied fields. The entropy increment for the sample with δ = 0.27 is field-independent.
In the absence of an applied field, the theoretical value of the magnetic entropy increment from the spin ordered state at 0 K to the paramagnetic (PM) state at temperatures well above the magnetic transition is , where J is the total quantum moment, with J = 5/2 for Fe3+. The difference between the theoretical and the experimental value contains information about additional contributions to the entropy, and it is defined as the zero-point entropy at 0 K [19,20]. It is important to remark that for (Zn1-δFeδ)A[ZnδFe2-δ]BO4, the parameter δ remains constant in the whole temperature range for each sample. Consequently, the entropy changes at low temperatures must be ascribed to an increment in the magnetic contribution and, to a lesser extent, to the lattice vibrational effect.
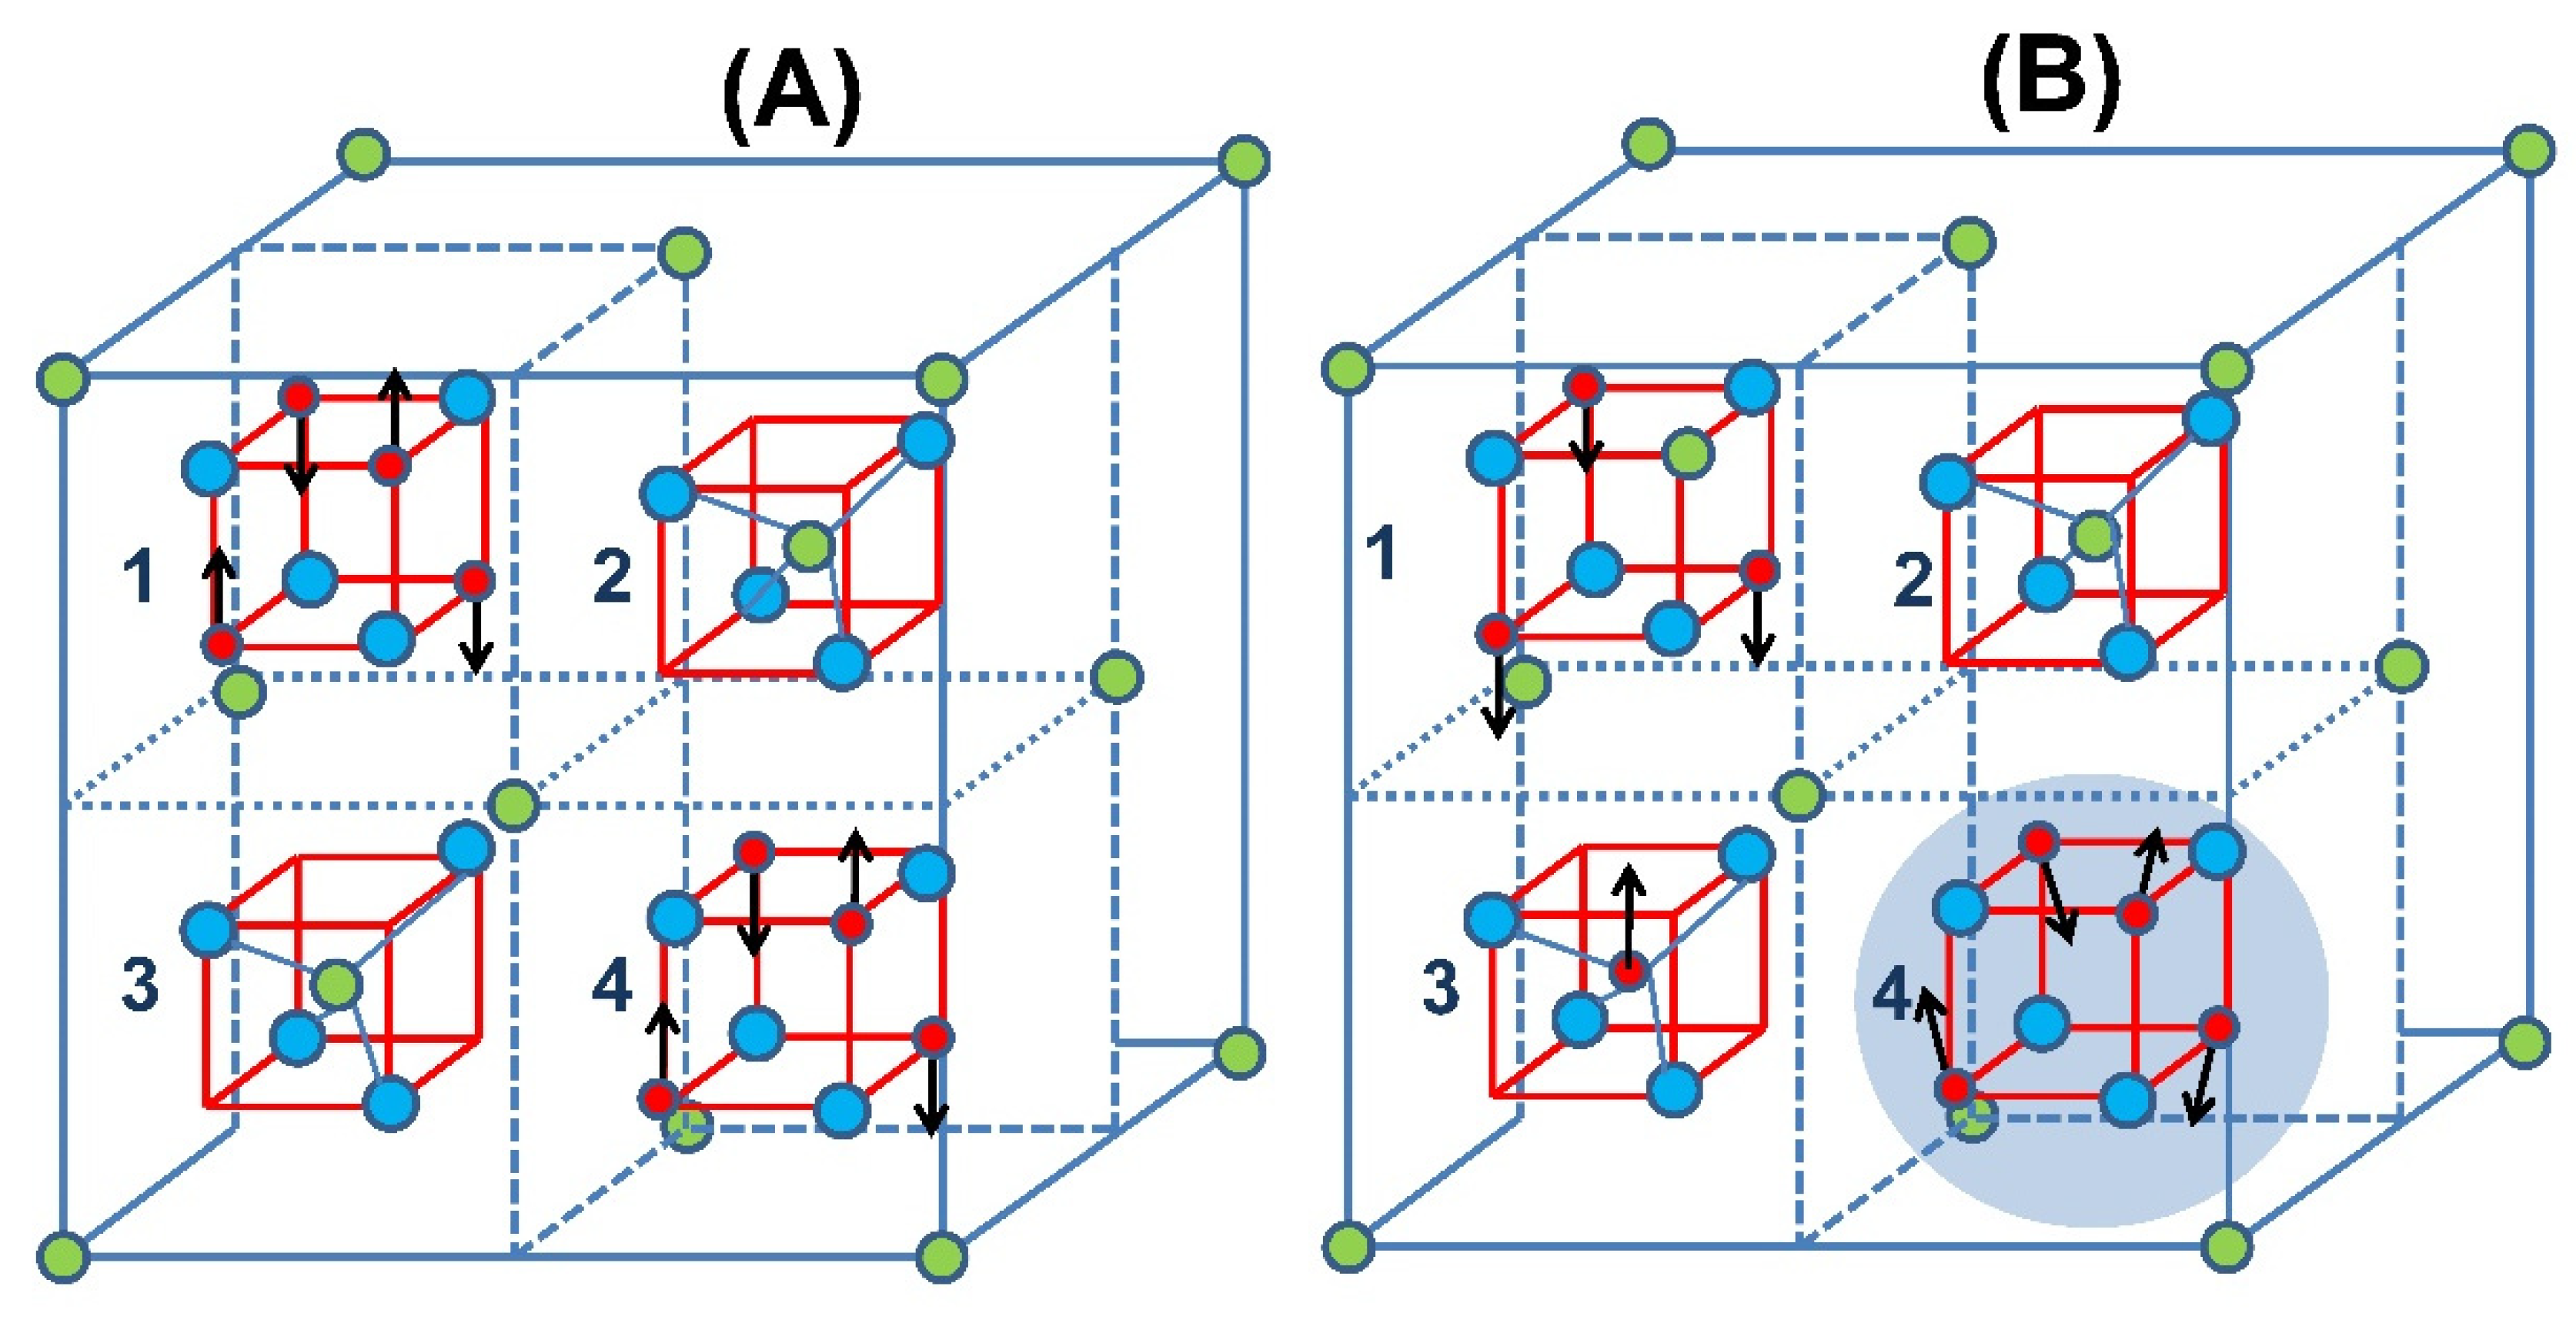
When assuming δ = 0, the only exchange interaction is the B-B which is AFM. As a pair of Fe and Zn atoms interchange their crystal positions, there appears the AFM A-B super exchange interaction, which is significantly stronger than the B-B one. This AFM A-B interaction leads to the ferromagnetic (FM) ordering of the three remaining Fe3+ in the B site. Consequently, the first neighboring Fe3+ atoms in the B sites (with 4 Fe3+ per site) surrounding the A site occupied by a Fe3+ experience some kind of frustration due to the two competing AFM and FiM interactions. Figure 5 shows a scheme of this situation.
Inside a single unit cell (see Figure 5), the smallest local inversion (δc) is either 0 or 1/8 = 0.125, the last one corresponding to the exchange of a single Zn/Fe pair in the unit cell. Assuming that only a single Zn/Fe exchange can occur in a cell, around 40% of the unit cells suffer a single Zn/Fe cations exchange when the macroscopic δ is as small as 0.05. Those unit cells with δc = 0.125 are FiM (40%) with a magnetic moment of 5.9 μB, [4] whereas for δc = 0 the cells are AFM (60%). This pictures the dramatic effect that δ ≈ 0 can have over the magnetic and calorimetric properties.
(a) Inversion degree δ ≈ 0
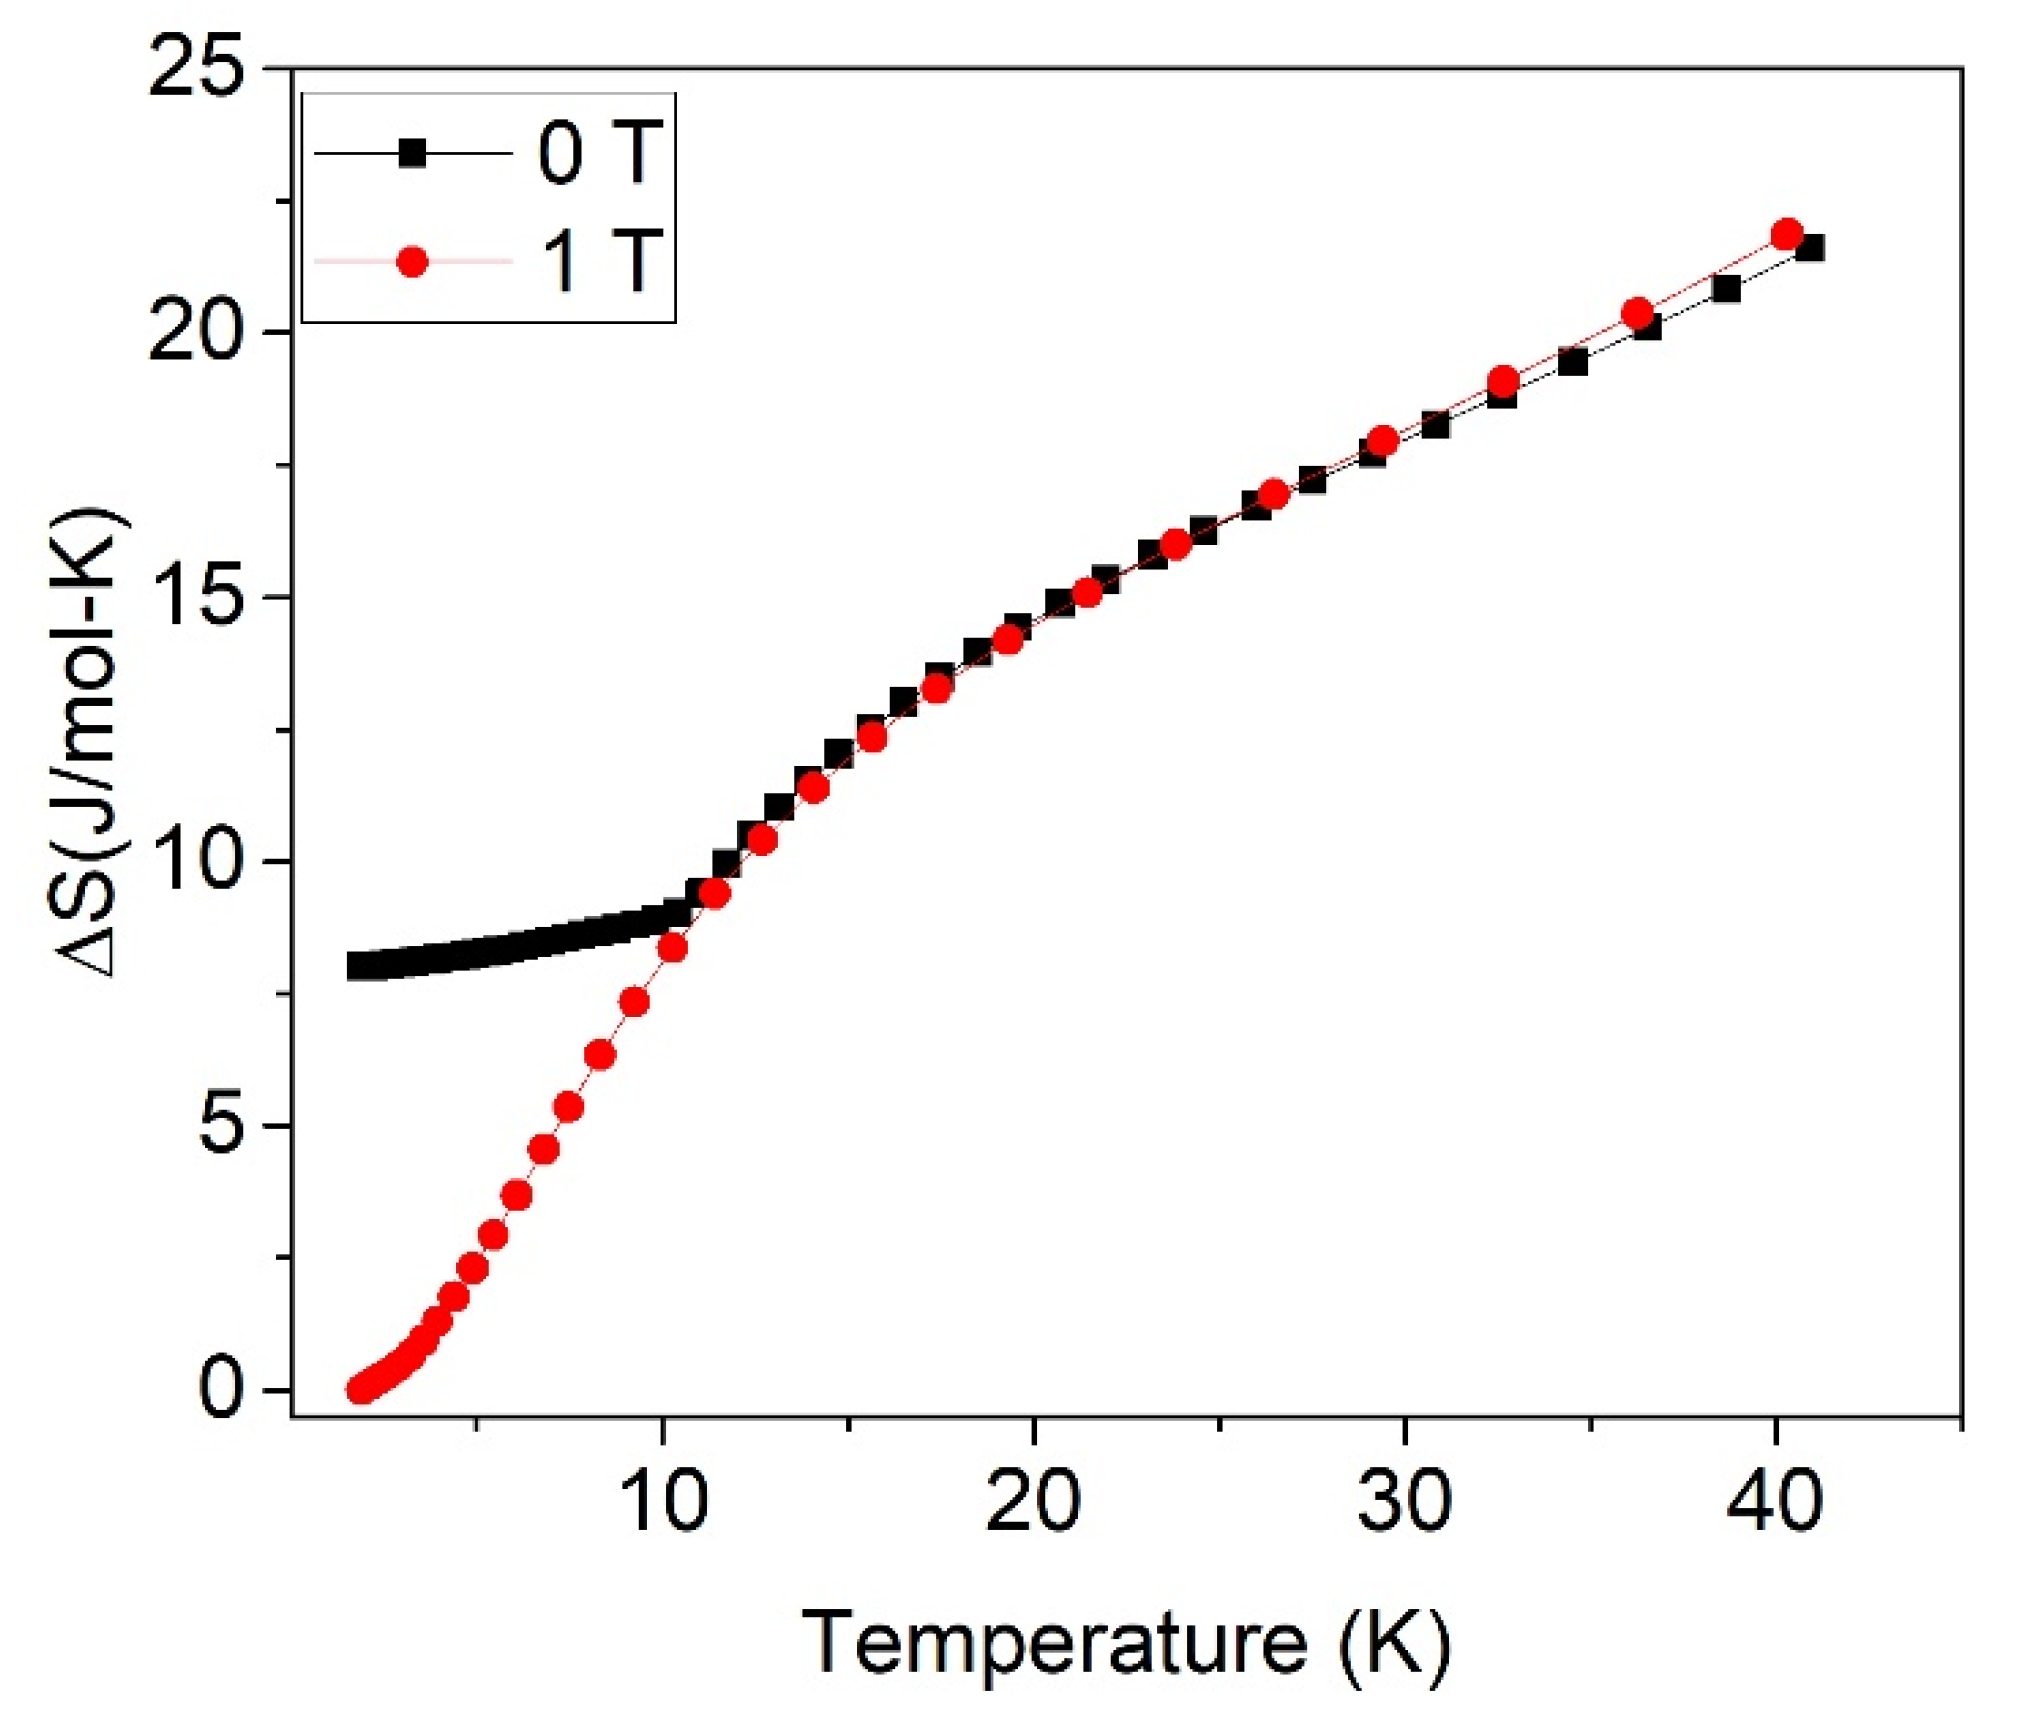
The entropy increment at different applied fields of sample ZFO-0.05 is shown in Figure 3. At H = 0 and 40 K, the magnetic entropy increment is ΔSm = 8.7 J/mol·K, which can be associated with AFM to PM transition. Assuming that for δ=0.05 a 60% of the sample is AFM, the expected ΔSm is close to ) ≈ 18 J/mol·K. Therefore, the small experimental value of 8.7 J/mol·K indicates that only 29% of the sample has evolved from AFM to the paramagnetic phase. In summary, instead of the expected 60%, only 29% of the sample seems to be AFM ordered.
The 71% of the sample volume that does not contribute to ΔSm could be ordered with transition temperature above 40 K or disordered in the whole 0–40 K range. It is normally associated with a hidden or missing entropy observed in other spinels [19,20].
By applying a magnetic field of 1 T, the corresponding ΔSm rises up to 17.1 J/mol·K, indicating that a volume fraction of 57% has evolved from 0 entropy to 29.7 J/mol·K. This 57% is close to the calculated AFM fraction of 60%. At 40 K, only contributions to the entropy of the lattice or a magnetically ordered phase are expected; therefore, both experimental curves, with and without applied field, are matched at this temperature (Figure 6). As can be seen, the effect of the field is shown to promote a decrease of the low-temperature magnetic entropy and also to raise its increasing rate nearby 0 K. According to this result, at zero applied field, a fraction of the spins seems to be disordered and thereby contributing in a small amount to the entropy increment, so giving rise to the “hidden entropy.” However, at low temperatures, the field gradually orders these disordered spins, contributing to the magnetic entropy increment when the temperature rises and the PM phase is achieved. In conclusion, the effect of the field allows us to unravel the hidden entropy origin as the spin disordered volume fraction vanishes.
In the experimental curves, two contributions can be distinguished: (a) The entropy increase associated with the AFM-PM transition ΔSm(0T, 40K) = 8.7 J/mol·K, which corresponds to a volume fraction of 29% of AFM state. (b) The contribution resulting from the spin disordered regions is field-dependent. The volume fraction of the spin disordered regions can be inferred by subtracting ΔSm(0T, 40K) = 8.7 J/mol·K to ΔSm(1T, 40K) = 17.1 J/mol·K, that leads to a spin disordered contribution of 8.4 J/mol·K, corresponding to a volume fraction of 28% of the spin disordered state. This volume fraction of spin disordered Fe3+ is expected to be located at the FiM-AFM interphase. The remaining 43% fraction is expected to have a FiM ordering with Curie temperature above the 40 K, [30]; therefore, this fraction does not contribute to the entropy increment.
The decrease of the entropy with the applied field is worth noting, from 17.1 J/mol·K at 1 T down to 14.2 J/mol·K at 9 T (Figure 3B and Table 2). This effect can be ascribed to the decrease of magnetic entropy on a PM system induced by an applied field.
Figure 7 shows the calculated ΔSm(µ0H,T) for H = 1 T and H = 9 T, according to the expression:
with , where is the Bohr magneton and µ0H is the applied magnetic field.
Equation (2) accounts for the decrease of ΔSm (T) at 9 T with respect to ΔSm (T) at 1T observed experimentally (see Figure 2), as illustrated by Figure 7.
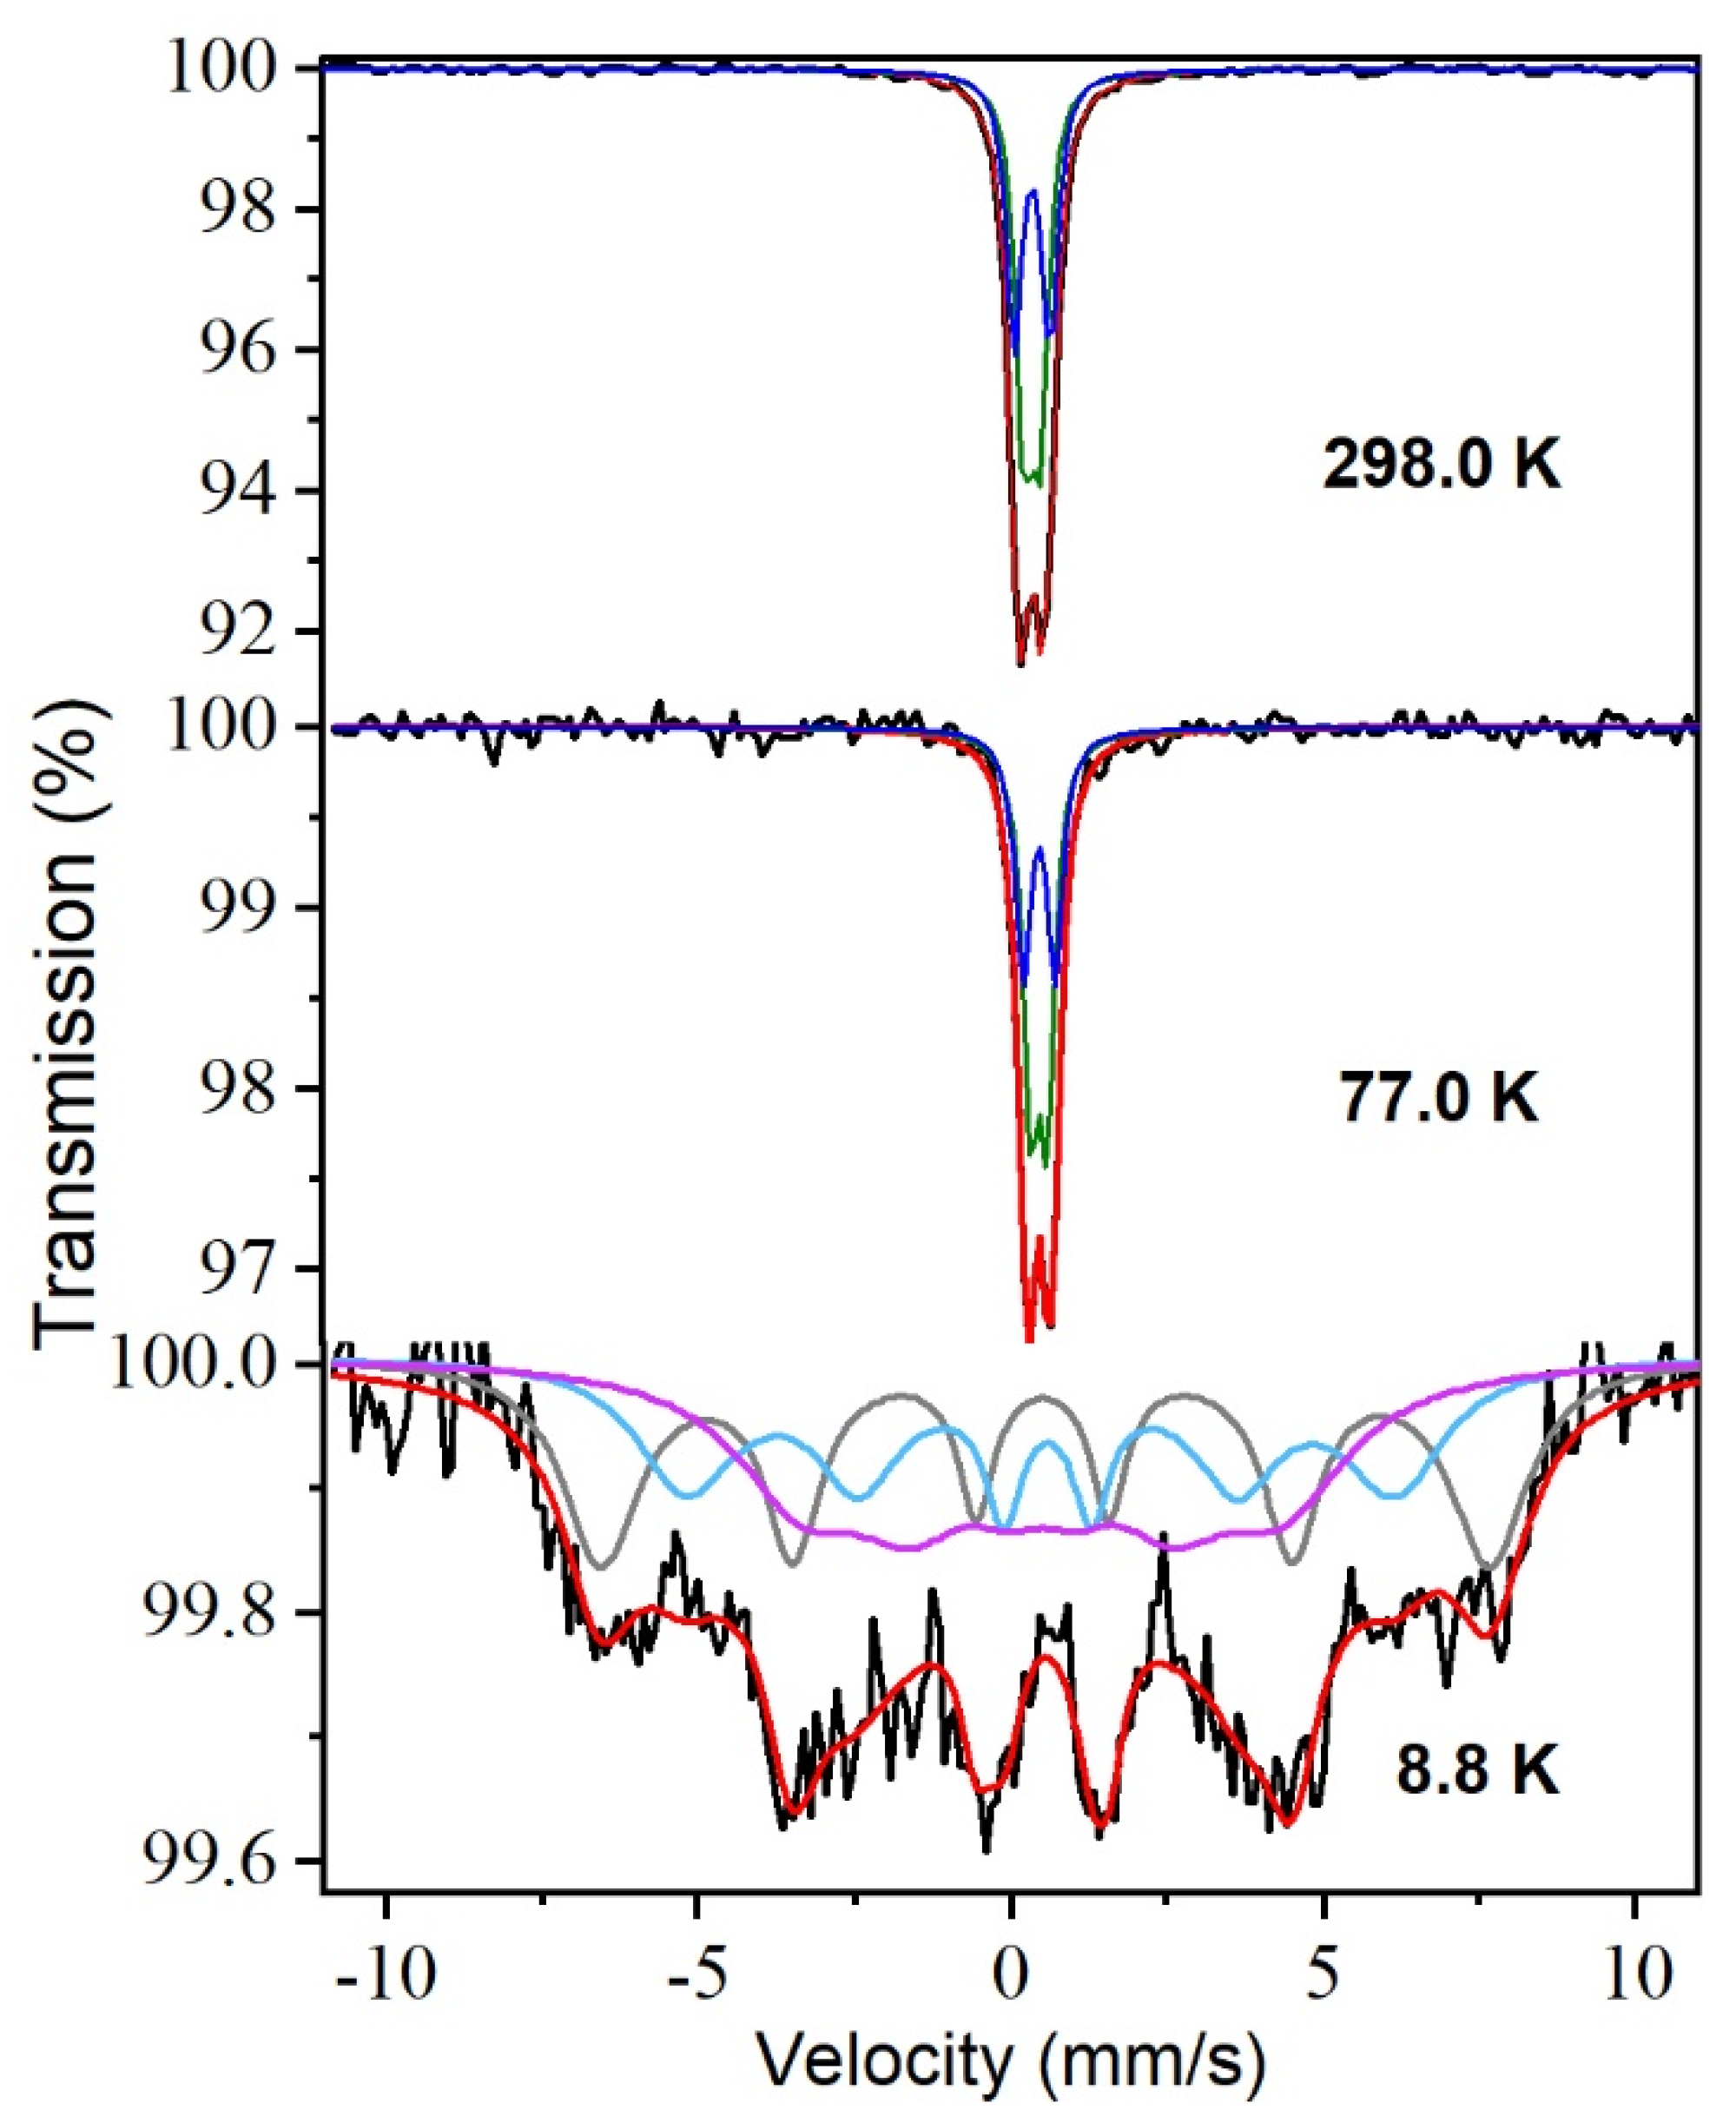
The 298 K Mossbauer’s spectrum (Figure 8) is composed by a PM quadrupole absorption, which was best-fitted to two quadrupole doublets with hyperfine parameters characteristic of high spin Fe3+ in octahedral oxygen coordination: δ1 = 0.34 mms−1, Δ1 = 0.26 mms−1 and δ2 = 0.34 mms−1, Δ1 = 0.57 mms−1. The 77 K spectrum still shows a paramagnetic doublet. The 8.8 K spectrum, however, shows a broad unresolved magnetic pattern (Figure 8). This spectrum, characteristic of a system experiencing magnetic relaxation, indicates that the measurement temperature is close to the magnetic ordering temperature of this particular zinc ferrite sample. As mentioned previously, it is known that the critical temperature of well-crystallized, canonical zinc ferrite (which should be a direct spinel) is close to 10 K and that this temperature increases if it is partially inverse [31]. Thus, the present result is compatible with a zinc ferrite sample having a very small inversion degree, as is the case.
Fitting the 8.8 K spectrum is a complicated matter. Since the sample is affected at such temperature by the relaxation induced by thermal fluctuations, it cannot be properly fitted using a static hyperfine magnetic field distribution (although this type of fit can be used as a first approximation) [32]. A more rigorous fit model should consider the occurrence of dynamical effects associated with the thermal fluctuations that strongly affect the line shape. In such a way, we can disentangle these dynamic effects from the possible existence of different configurations arising from different local environments (vide infra). Therefore, we fitted the 8.8 K spectrum following the approach described in ref. [33], which uses the Blume and Tjon line shape [34] to account for the occurrence of magnetic relaxation. The spectrum could not be satisfactorily fitted using only a unique configuration affected by thermal fluctuations as it should be the case if the sample was a direct spinel and only magnetic order arising from the Fe3+(B)-Fe3+(B) AFM exchange interaction was present. Instead, the spectrum was best-fitted using three different contributions characterized by hyperfine magnetic fields of 46.6 T, 37.2 T, and 26.7 T accounting for 34%, 29%, and 37% of the spectral area, respectively. We want to mention that because of the small inversion degree of the sample and the complexity of the 8.8 K spectrum, the isomer shifts of the various components fitted do not appear to be sensitive to differences in the Fe3+ cation coordination, being around δ = 0.50 mms−1 (i.e., mainly characteristic of octahedral sites) in the three cases.
Although in Mossbauer spectroscopy the type of magnetic order cannot be inferred without the application of an external magnetic field, we can plausibly associate, based on the entropy measurements, the components obtained from the fit of the 8.8 K Mossbauer spectrum to various regions in the solid having different magnetic order. As shown in Figure 8, the spectrum was best fitted to three different components: two relatively well-defined contributions and a very broad one. Following the reasoning above, these two well-resolved components could be associated with a ferromagnetic phase (higher hyperfine magnetic field, 46.6 T) and an AFM one (intermediate hyperfine magnetic field, 37.2 T). The broad unresolved contribution having the smaller hyperfine field (26.7 T) would correspond to a disordered spin phase due to the thermal fluctuations and local fluctuations of the super exchange interactions or structural disorder at the FiM-AFM interphase. This disordered phase accounts for 37% of the Mossbauer spectral area, a percentage that, considering the limitations of fitting a broad and complex spectrum, is reasonably close to the value obtained from the entropy measurements. The result is interesting since it confirms the statement formulated long ago that suggested that the partially inversed character of zinc ferrite, even in small proportions, makes the network of its magnetic interactions highly frustrated [31].
(b) Inversion degree δ = 0.27
For a high inversion degree, FiM cells percolate and are coupled to each other, giving rise to long-range FiM order; consequently, the presence of a large volume fraction of spin disordered atoms is not more possible. In this condition, the magnetization of the A sublattice is uniform in the whole crystal, and the mixture of magnetically coupled FiM and AFM cells gives rise to a single magnetic configuration. In other words, the long-range super exchange coupling lifts the ground state degeneracy, as just an applied magnetic field does.
In the case of δ = 0.27, this implies a large density growth of the FiM clusters that leads to a percolation among the FiM particles, reducing the volume of both AFM and spin disordered regions. Therefore, the entropy increase is insensitive to any applied magnetic field (from 1 to 9 T) (Figure 3C) with a value ΔSm = 5.5 J/mol·K. In this condition, the volume fraction of the sample contributing to ΔSm is 18%, much smaller than the corresponding sample with δ = 0.05, which was 57%. The presence of long-range order is confirmed by the macroscopic FiM associated with the decrease of the area enclosed by the halo of the NPD experiment that has almost vanished.
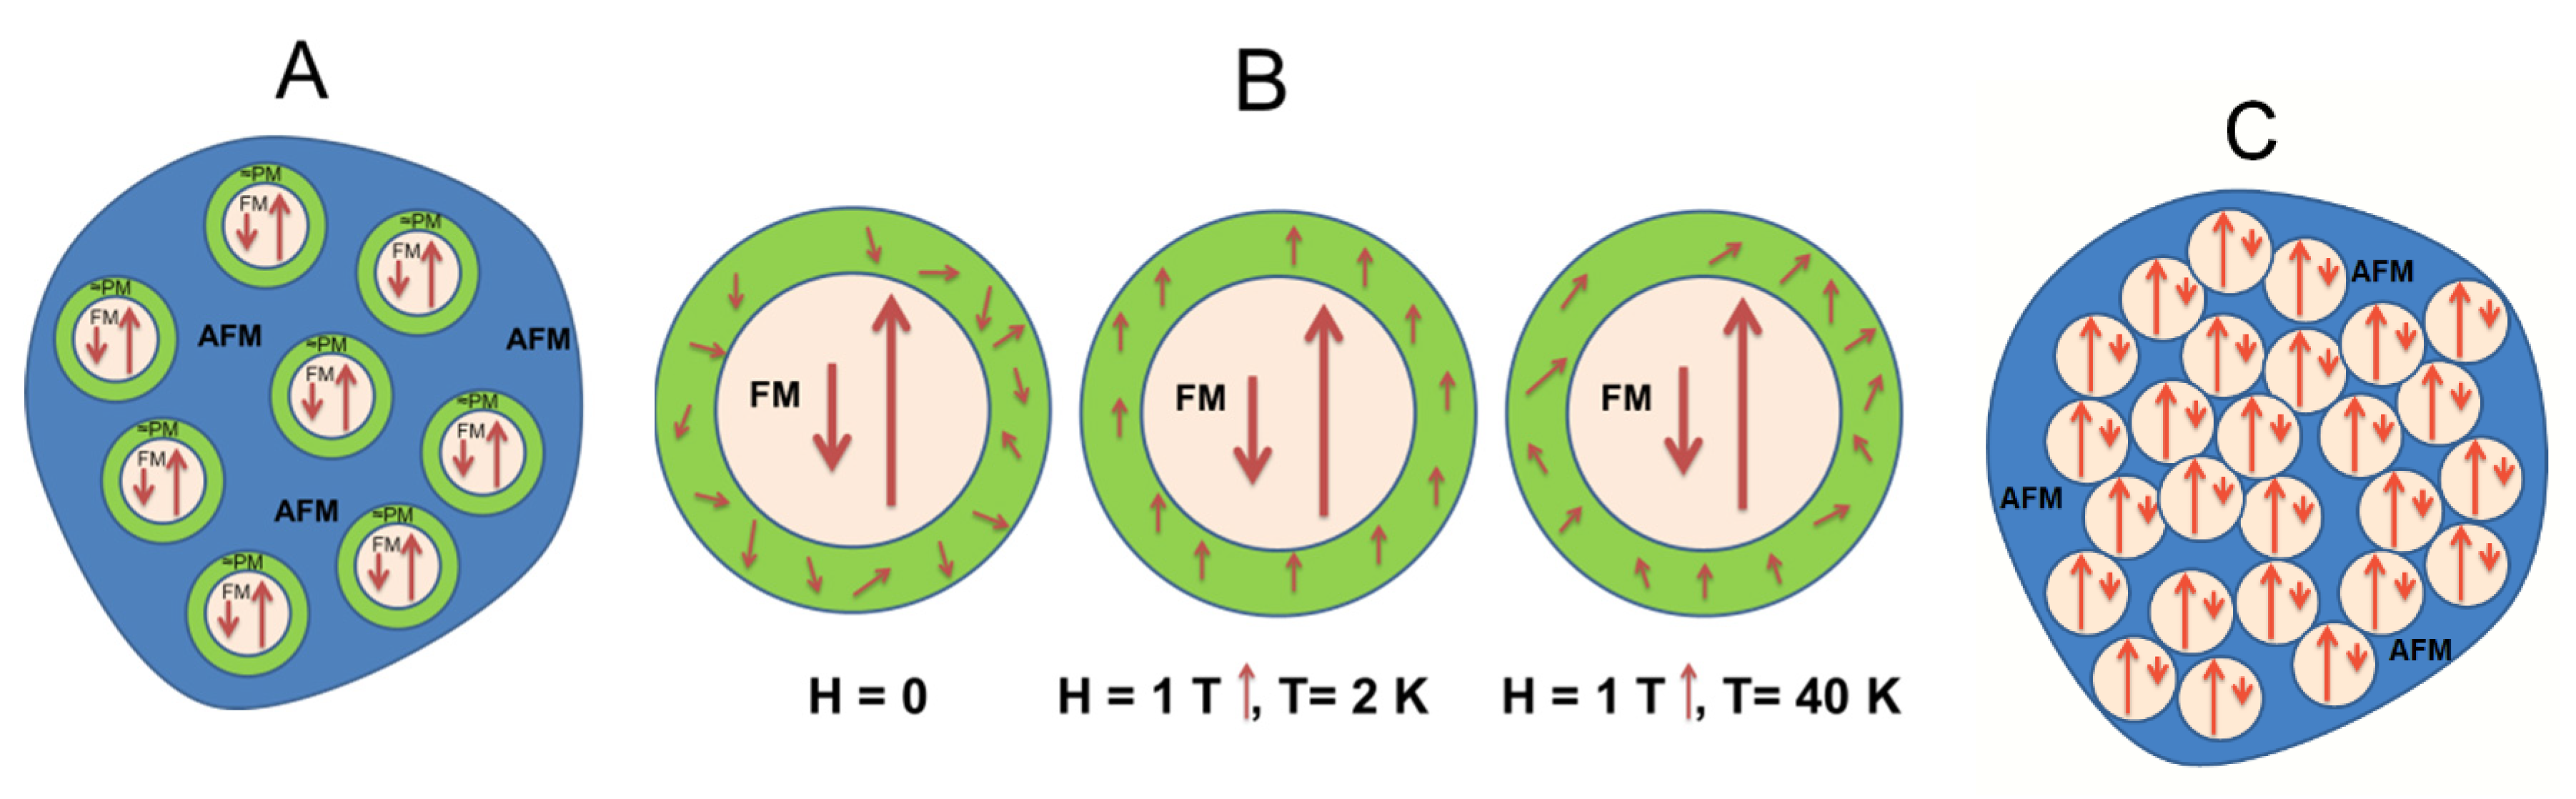
The plausible magnetic structure of the samples is represented in Figure 9. Their magnetic order evolution is interpreted in terms of the applied magnetic fields in the sample with δ ≈ 0 and of the percolation array when δ = 0.27.
4. Conclusions
Calorimetric study leads to understanding the so-called hidden entropy in samples with very low inversion degree. For a sample with δ = 0.05 (δ ≈ 0), a single pair of Zn-Fe cations have exchanged their places within the 40% of unit cells giving place to three magnetic regions: one of short-range order of FiM cluster, another one short-range order of AFM regions, and a third one in the interphase between AFM and FiM with frustrated or disordered magnetic moments. When 1 T magnetic field is applied, there is an increment of entropy with respect to H = 0 originated by the orientation of the disorder magnetic interphase lying between the FiM and AFM regions. However, for a field of 9 T, the magnetic entropy decreases because the high applied field orients all the magnetic moments more strongly at the PM high-temperature phase. The Mossbauer results show a complex spectrum with three main interactions with populations close to those determined by calorimetric experiments. Therefore, both characterizations confirm the presence of the three regions with AFM, FiM, and spin frustrations clusters with a population of around 1/3 each one. It is worth noting that the entropy is a state function, i.e., it is independent of the fluctuations of the spins near the magnetic transition observed by Mossbauer spectroscopy 8.8 K.
In the case of a high inversion degree (δ = 0.27), the magnetic entropy is invariant under the applied field, associated with the percolation of the FM cluster.
Furthermore, as a corollary, the great difficulty obtaining zinc ferrite with δ = 0 is verified because a very tiny amount of Fe3+ migrated in the A positions of the spinel produces a sufficient disturbance in the magnetic order.
Author Contributions
Conceptualization, A.H. and P.d.l.P.; methodology, M.A.C., J.F.M. and J.A.J.; validation, M.A.C., A.H., I.P.-O., I.L. and A.G.-E.; formal analysis, M.A.C., A.H., J.F.M. and J.A.J.; investigation, J.F.M., I.P.-O., I.L. and A.G.-E.; resources, M.A.C., J.A.J. and I.L.; writing—original draft, A.H., J.F.M., J.A.J. and P.d.l.P.; writing—review and editing, P.d.l.P.; visualization, P.d.l.P.; supervision, A.H.; funding acquisition, P.d.l.P. All authors have read and agreed to the published version of the manuscript.
Funding
The authors acknowledge ILL and the D1B-CRG (Ministerio de Ciencia, e Innovación, Spain) with proposal numbers CRG-2710, CRG-2797 and 5-31-274 2 for the beam time allocated at both the D1B and D2B instruments. This research has been funded by Spanish Ministries of Science Innovation and Universities and of Economy and Competitiveness by means of the AFORMAR (PID2019-109334RB), RTI2018-095303-B-C51 and RTI2018-095856-B-C21 projects. The support of the grants from the Community of Madrid numbers S2018/NMT-4381-MAT4.0-CM and P2018/NMT-4321 is also recognized.
Institutional Review Board Statement
Not applicable.
Informed Consent Statement
Not applicable.
Data Availability Statement
Not applicable.
Acknowledgments
Authors would like to acknowledge the use of Servicio General de Apoyo a la Investigación-SAI, Universidad de Zaragoza.
Conflicts of Interest
The authors declare no conflict of interest. The funders had no role in the design of the study; in the collection, analyses, or interpretation of data; in the writing of the manuscript, or in the decision to publish the results.
References
- Dolcet, P.; Kirchberg, K.; Antonello, A.; Suchomski, C.; Marschall, R.; Diodati, S.; Munoz-Espi, R.; Landfester, K.; Gross, S. Exploring wet chemistry approaches to ZnFe2O4 spinel ferrite nanoparticles with different inversion degrees: A comparative study. Inorg. Chem. Front. 2019, 6, 1527–1534. [Google Scholar] [CrossRef]
- Bohra, M.; Alman, V.; Arras, R. Nanostructured ZnFe2O4: An Exotic Energy Material. Nanomaterials 2021, 11, 1286. [Google Scholar] [CrossRef]
- Sai, R.; Arackal, S.; Kahmei, R.D.R.; Bhat, N.; Yamaguchi, M.; Shivashankar, S.A. Crystallographic inversion-mediated superparamagnetic relaxation in Zn-ferrite nanocrystals. AIP Adv. 2020, 10, 4. [Google Scholar] [CrossRef]
- Cobos, M.A.; de la Presa, P.; Llorente, I.; Alonso, J.M.; Garcia-Escorial, A.; Marin, P.; Hernando, A.; Jimenez, J.A. Magnetic Phase Diagram of Nanostructured Zinc Ferrite as a Function of Inversion Degree delta. J. Phys. Chem. C 2019, 123, 17472–17482. [Google Scholar] [CrossRef]
- Yafet, Y.; Kittel, C. Antiferromagnetic Arrangements in Ferrites. Phys. Rev. 1952, 87, 290–294. [Google Scholar] [CrossRef]
- Hastings, J.M.; Corliss, L.M. An Antiferromagnetic Transition In Zinc Ferrite. Phys. Rev. 1956, 102, 1460–1463. [Google Scholar] [CrossRef]
- Hofmann, M.; Campbell, S.J.; Ehrhardt, H.; Feyerherm, R. The magnetic behaviour of nanostructured zinc ferrite. J. Mater. Sci. 2004, 39, 5057–5065. [Google Scholar] [CrossRef]
- Ehrhardt, H.; Campbell, S.J.; Hofmann, M. Magnetism of the nanostructured spinel zinc ferrite. Scr. Mater. 2003, 48, 1141–1146. [Google Scholar] [CrossRef]
- Usa, T.; Kamazawa, K.; Sekiya, H.; Nakamura, S.; Tsunoda, Y.; Kohn, K.; Tanaka, M. Magnetic Properties of ZnFe2O4 as a 3-D Geometrical Spin Frustration System. J. Phys. Soc. Jpn. 2004, 73, 2834–2840. [Google Scholar] [CrossRef]
- Schiessl, W.; Potzel, W.; Karzel, H.; Steiner, M.; Kalvius, G.M.; Martin, A.; Krause, M.K.; Halevy, I.; Gal, J.; Schäfer, W.; et al. Magnetic properties of the ZnFe2O4 spinel. Phys. Rev. B 1996, 53, 9143–9152. [Google Scholar] [CrossRef]
- Oneill, H.S. Temperature-Dependence Of The Cation Distribution In Zinc Ferrite (ZnFe2O4) From Powder Xrd Structural Refinements. Eur. J. Mineral. 1992, 4, 571–580. [Google Scholar] [CrossRef]
- Li, F.S.; Wang, L.; Wang, J.B.; Zhou, Q.G.; Zhou, X.Z.; Kunkel, H.P.; Williams, G. Site preference of Fe in nanoparticles of ZnFe2O4. J. Magn. Magn. Mater. 2004, 268, 332–339. [Google Scholar] [CrossRef]
- Cobos, M.Á.; de la Presa, P.; Puente-Orench, I.; Llorente, I.; Morales, I.; García-Escorial, A.; Hernando, A.; Jiménez, J.A. Coexistence of antiferro- and ferrimagnetism in the spinel ZnFe2O4 with an inversion degree delta lower than 0.3. Ceram. Int. 2022. [Google Scholar] [CrossRef]
- Grimes, N.W. On the specific-heat of compounds with spinel structure—II Zinc ferrite, a paramagnetic compound with magnetic ion occupying octahedral site. Proc. R. Soc. Lond. A-Math. Phys. Sci. 1974, 338, 223–233. [Google Scholar]
- Ho, J.C.; Hamdeh, H.H.; Chen, Y.Y.; Lin, S.H.; Yao, Y.D.; Willey, R.J.; Oliver, S.A. Low-temperature calorimetric properties of zinc ferrite nanoparticles. Phys. Rev. B 1995, 52, 10122–10126. [Google Scholar] [CrossRef]
- Westrum, E.F.; Grimes, D.M. Low temperature heat capacity and thermodynamic properties of zinc ferrite. J. Phys. Chem. Solids 1957, 3, 44–49. [Google Scholar] [CrossRef] [Green Version]
- Zhang, Y.N.; Shi, Q.; Schliesser, J.; Woodfield, B.F.; Nan, Z.D. Magnetic and Thermodynamic Properties of Nanosized Zn Ferrite with Normal Spinal Structure Synthesized Using a Facile Method. Inorg. Chem. 2014, 53, 10463–10470. [Google Scholar] [CrossRef]
- Kamazawa, K.; Tsunoda, Y.; Kadowaki, H.; Kohn, K. Magnetic neutron scattering measurements on a single crystal of frustrated ZnFe2O4. Phys. Rev. B 2003, 68, 024412. [Google Scholar] [CrossRef]
- Lashley, J.C.; Stevens, R.; Crawford, M.K.; Boerio-Goates, J.; Woodfield, B.F.; Qiu, Y.; Lynn, J.W.; Goddard, P.A.; Fisher, R.A. Specific heat and magnetic susceptibility of the spinels GeNi(2)O(4) and GeCo(2)O(4). Phys. Rev. B 2008, 78, 18. [Google Scholar] [CrossRef]
- Fenner, L.A.; Wills, A.S.; Bramwell, S.T.; Dahlberg, M.; Schiffer, P. Zero-point entropy of the spinel spin glasses CuGa2O4 and CuAl2O4. J. Phys. Conf. Ser. 2009, 145, 012029. [Google Scholar] [CrossRef] [Green Version]
- Jiang, J.Z.; Wynn, P.; Morup, S.; Okada, T.; Berry, F.J. Magnetic structure evolution bn mechanically milled nanostructured ZnFe2O4 particles. Nanostruct. Mater. 1999, 12, 737–740. [Google Scholar] [CrossRef]
- Mathew, D.S.; Juang, R.S. An overview of the structure and magnetism of spinel ferrite nanoparticles and their synthesis in microemulsions. Chem. Eng. J. 2007, 129, 51–65. [Google Scholar] [CrossRef]
- Chinnasamy, C.N.; Narayanasamy, A.; Ponpandian, N.; Chattopadhyay, K.; Guerault, H.; Greneche, J.M. Magnetic properties of nanostructured ferrimagnetic zinc ferrite. J. Phys.-Condes. Matter 2000, 12, 7795–7805. [Google Scholar] [CrossRef]
- Yao, C.W.; Zeng, Q.S.; Goya, G.F.; Torres, T.; Liu, J.F.; Wu, H.P.; Ge, M.Y.; Zeng, Y.W.; Wang, Y.W.; Jiang, J.Z. ZnFe2O4 nanocrystals: Synthesis and magnetic properties. J. Phys. Chem. C 2007, 111, 12274–12278. [Google Scholar] [CrossRef] [Green Version]
- Jimenez, J.A.; Cobos, M.A.; Llorente, I.; Nassif, V.; Puente Orench, I. Evolution of the Magnetic Properties with Annealing Temperature of Spinel Zinc Ferrite Disordered by Ball Milling; Institut Laue-Langevin (ILL): Grenoble, France, 2021. [Google Scholar]
- Jimenez, J.A.; Cobos, M.A.; Llorente, I.; Puente Orench, I. Effect of Microstructural Features and Defects Introduced by Mechanical Milling and Thermal Treatments on the Magnetic Order of Spinel Zinc; Institut Laue-Langevin (ILL): Grenoble, France, 2020. [Google Scholar]
- Jiménez, J.A.; Cobos, M.A.; Llorente, I.; Puente Orench, I. Effect of Inversion Degree on the Magnetic Properties of Spinel Zinc Ferrite; Institut Laue-Langevin (ILL): Grenoble, France, 2020. [Google Scholar]
- Villars, P.; Cenzual, K. Pearson’s Crystal Data: Crystal Structure Database for Inorganic Compounds; ASM International®: Materials Park, OH, USA, 2018. [Google Scholar]
- Jansen, E.; Schafer, W.; Will, G. R values in analysis of powder diffraction data using Rietveld refinement. J. Appl. Crystallogr. 1994, 27, 492–496. [Google Scholar] [CrossRef]
- Cobos, M.A.; de la Presa, P.; Llorente, I.; García-Escorial, A.; Hernando, A.; Jiménez, J.A. Effect of preparation methods on magnetic properties of stoichiometric zinc ferrite. J. Alloys Compd. 2020, 849, 156353. [Google Scholar] [CrossRef]
- Vandenberghe, R.E.; De Grave, E. Mössbauer Effect Studies of Oxidic Spinels. In Mössbauer Spectroscopy Applied to Inorganic Chemistry; Long, G.J., Grandjean, F., Eds.; Springer US: Boston, MA, USA, 1989; pp. 59–182. [Google Scholar]
- Goya, G.F.; Leite, E.R. Ferrimagnetism and spin canting of Zn57Fe2O4nanoparticles embedded in ZnO matrix. J. Phys. Condens. Matter 2003, 15, 641–651. [Google Scholar] [CrossRef] [Green Version]
- Rancourt, D.G. Analytical Methods for Mössbauer Spectral Analysis of Complex Materials. In Mössbauer Spectroscopy Applied to Magnetism and Materials Science; Long, G.J., Grandjean, F., Eds.; Springer US: Boston, MA, USA, 1996; pp. 105–124. [Google Scholar]
- Blume, M.; Tjon, J.A. Mossbauer Spectra in a Fluctuating Environment. Phys. Rev. 1968, 165, 446–456. [Google Scholar] [CrossRef]
Figure 1.
Diffraction patterns recorded at room temperature for the sample with δ = 0.27 and δ = 0.05.
Figure 1.
Diffraction patterns recorded at room temperature for the sample with δ = 0.27 and δ = 0.05.

Figure 2.
NPD patterns for samples with δ = 0.05 and δ = 0.27.

Figure 3.
(A) C/T for sample ZFO-0.05 (black line), ZFO-0.27 (red line), and lattice contribution CL/T (continuous line); (B) Entropy increase at different applied magnetic fields for ZFO-0.05; (C) for ZFO-0.27.
Figure 3.
(A) C/T for sample ZFO-0.05 (black line), ZFO-0.27 (red line), and lattice contribution CL/T (continuous line); (B) Entropy increase at different applied magnetic fields for ZFO-0.05; (C) for ZFO-0.27.

Figure 4.
ΔS for sample with δ = 0.05, where the magnétic (red line), vibrational (blue line) and total entropy (black line) at H = 0 are shown separately.
Figure 4.
ΔS for sample with δ = 0.05, where the magnétic (red line), vibrational (blue line) and total entropy (black line) at H = 0 are shown separately.

Figure 5.
(A) Half-cells of ZnFe2O4 with δ = 0, Fe3+ (red circles), and Zn2+ (green circles) in their corresponding octahedral (cells 1, 4) and tetrahedral (cells 2, 3) sites. Blue circles are oxygen. The black arrows indicate the magnetic moments. (B) A pair of Zn-Fe cations interchanged their sites; the stronger AFM A-B super exchange interaction leads to an FM order in the B sites and promotes some kind of frustration in the first neighbor’s B sites (shadow circle).

Figure 6.
Entropy increment of ZFO-0.05 without applied field lifts up at 10 K regarding the curve at 1 T at the same temperature.
Figure 6.
Entropy increment of ZFO-0.05 without applied field lifts up at 10 K regarding the curve at 1 T at the same temperature.

Figure 7.
Calculated entropy increase for the paramagnetic region under a magnetic field of 0 T (black line), 1 T (blue line), and 9 T (red line).
Figure 7.
Calculated entropy increase for the paramagnetic region under a magnetic field of 0 T (black line), 1 T (blue line), and 9 T (red line).

Figure 8.
Mossbauer spectra recorded at different temperatures from δ = 0.05.

Figure 9.
(A) Illustration of magnetic arrangement of ZFO-0.05 sample, white circles representing ferrimagnetic particles, the blue area is AFM converted to PM at 40 K, and the green crown represents the disordered interphase between AFM and FM regions; (B) Different orientation of interphase area depending on the applied field (0, 1 T), and temperature; (C) Magnetic arrangement of ZFO-0.27 with percolating FM clusters and blue AFM regions.


Table 1.
Microstructural parameters obtained from the Rietveld refinement of the diffraction patterns recorded using XRD and NPD.
Table 1.
Microstructural parameters obtained from the Rietveld refinement of the diffraction patterns recorded using XRD and NPD.
| Sample | Source | Lattice Parameter (Å) | Inversion Degree(δ) | O-Position (x = y = z) | Crystal Size (nm) | μ-Deformation (ε) |
|---|---|---|---|---|---|---|
| ZFO-0.05 | XRD | 8.4489(5) | 0.05(1) | 0.2416(9) | >150 | - |
| NPD | 8.4498(5) | 0.05(1) | 0.2397(3) | >150 | - | |
| ZFO-0.27 | XRD | 8.4322(5) | 0.28(2) | 0.2424(5) | 15(1) | 0.0020(2) |
| NPD | 8.4373(5) | 0.20(2) | 0.2414(3) | 14(1) | 0.0019(2) |
Table 2.
Total, magnetic, and lattice entropy increment (expressed in J/mol·K) for δ = 0.05 at 40 K.
Table 2.
Total, magnetic, and lattice entropy increment (expressed in J/mol·K) for δ = 0.05 at 40 K.
| H (T) | 40 K | ||
|---|---|---|---|
| ΔST | ΔSm | ΔSL | |
| 0 | 13.2 (1) | 8.7 (1) | 4.6 (1) |
| 1–5 | 21.7 (1) | 17.1 (1) | 4.6 (1) |
| 9 | 18.9 (1) | 14.2 (1) | 4.7 (1) |
Publisher’s Note: MDPI stays neutral with regard to jurisdictional claims in published maps and institutional affiliations. |
© 2022 by the authors. Licensee MDPI, Basel, Switzerland. This article is an open access article distributed under the terms and conditions of the Creative Commons Attribution (CC BY) license (https://creativecommons.org/licenses/by/4.0/).
Share and Cite
MDPI and ACS Style
Cobos, M.A.; Hernando, A.; Marco, J.F.; Puente-Orench, I.; Jiménez, J.A.; Llorente, I.; García-Escorial, A.; de la Presa, P. Unveiling the Hidden Entropy in ZnFe2O4. Materials 2022, 15, 1198. https://doi.org/10.3390/ma15031198
AMA Style
Cobos MA, Hernando A, Marco JF, Puente-Orench I, Jiménez JA, Llorente I, García-Escorial A, de la Presa P. Unveiling the Hidden Entropy in ZnFe2O4. Materials. 2022; 15(3):1198. https://doi.org/10.3390/ma15031198
Chicago/Turabian StyleCobos, Miguel Angel, Antonio Hernando, José Francisco Marco, Inés Puente-Orench, José Antonio Jiménez, Irene Llorente, Asunción García-Escorial, and Patricia de la Presa. 2022. "Unveiling the Hidden Entropy in ZnFe2O4" Materials 15, no. 3: 1198. https://doi.org/10.3390/ma15031198
Note that from the first issue of 2016, this journal uses article numbers instead of page numbers. See further details here.