In either case, the quality of stabilized waste may be reduced, or the process time increased.
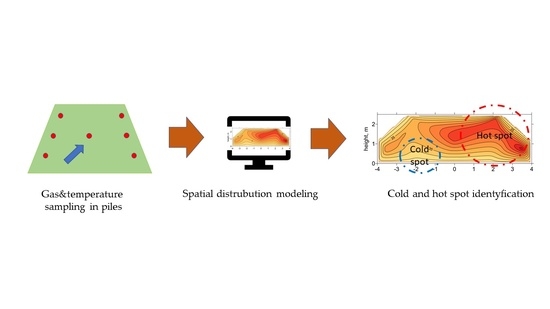
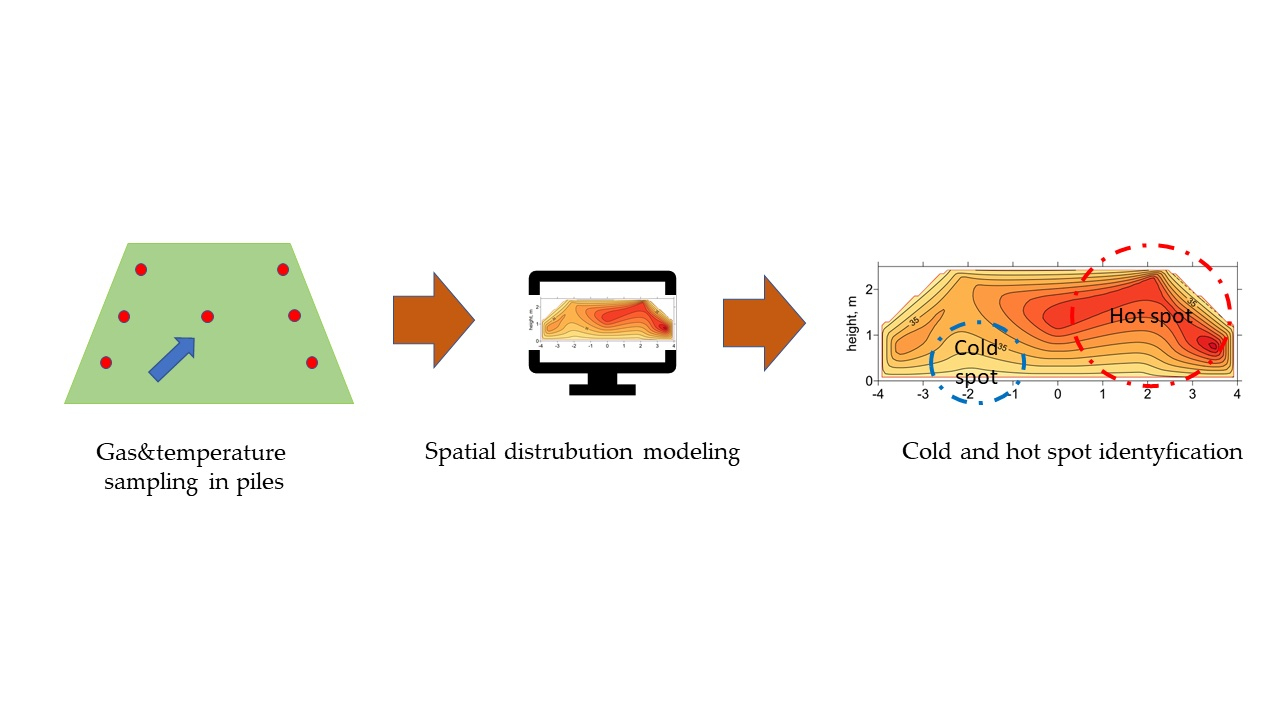
3.2.1. Spatial and Temporal Distribution of Temperature
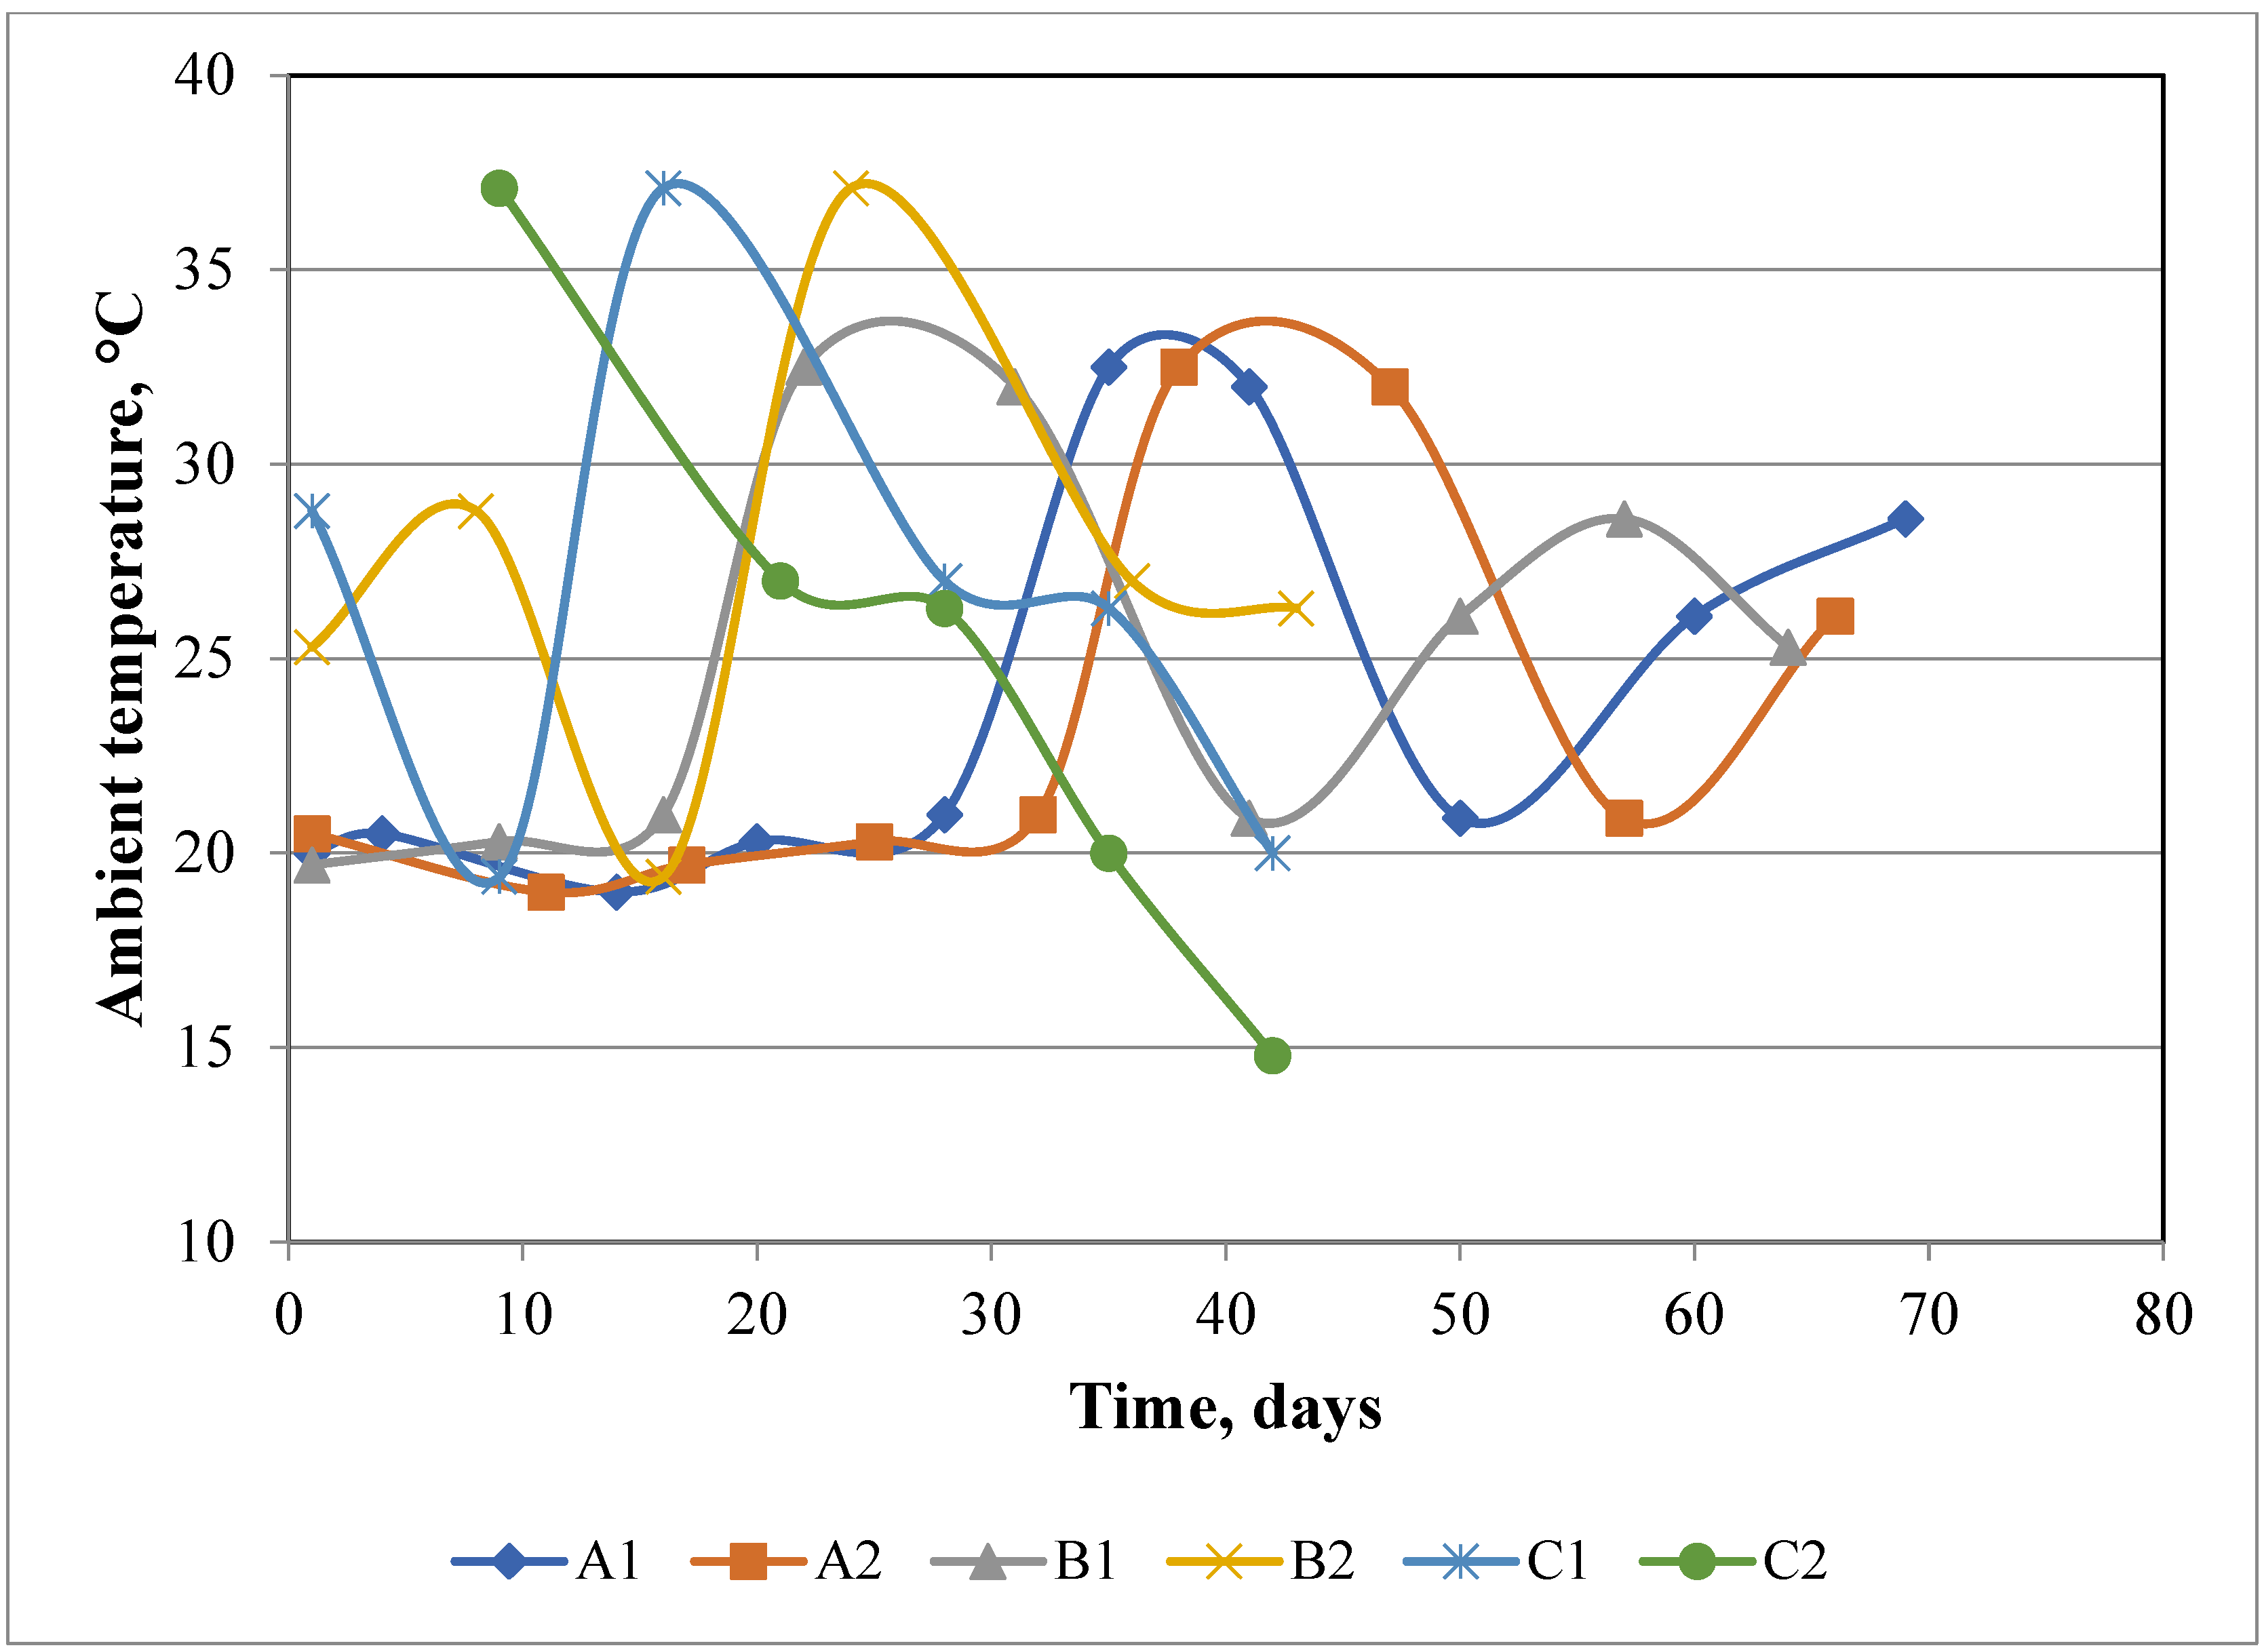
The pattern of temperature change during the waste composting process was expected to follow the “classic” pattern described by Cooperband, (2002) [
36] and Kowal et al. (2017) [
37], with an initial rapid increase in temperature (1st phase of composting) followed by a gradual drop in temperature during maturation/cooling (2nd phase of composting). In contrast, temperatures in piles A1 and A2 (
Supplementary Material Figures S1–S3, S10 and S11) remained close to ambient (
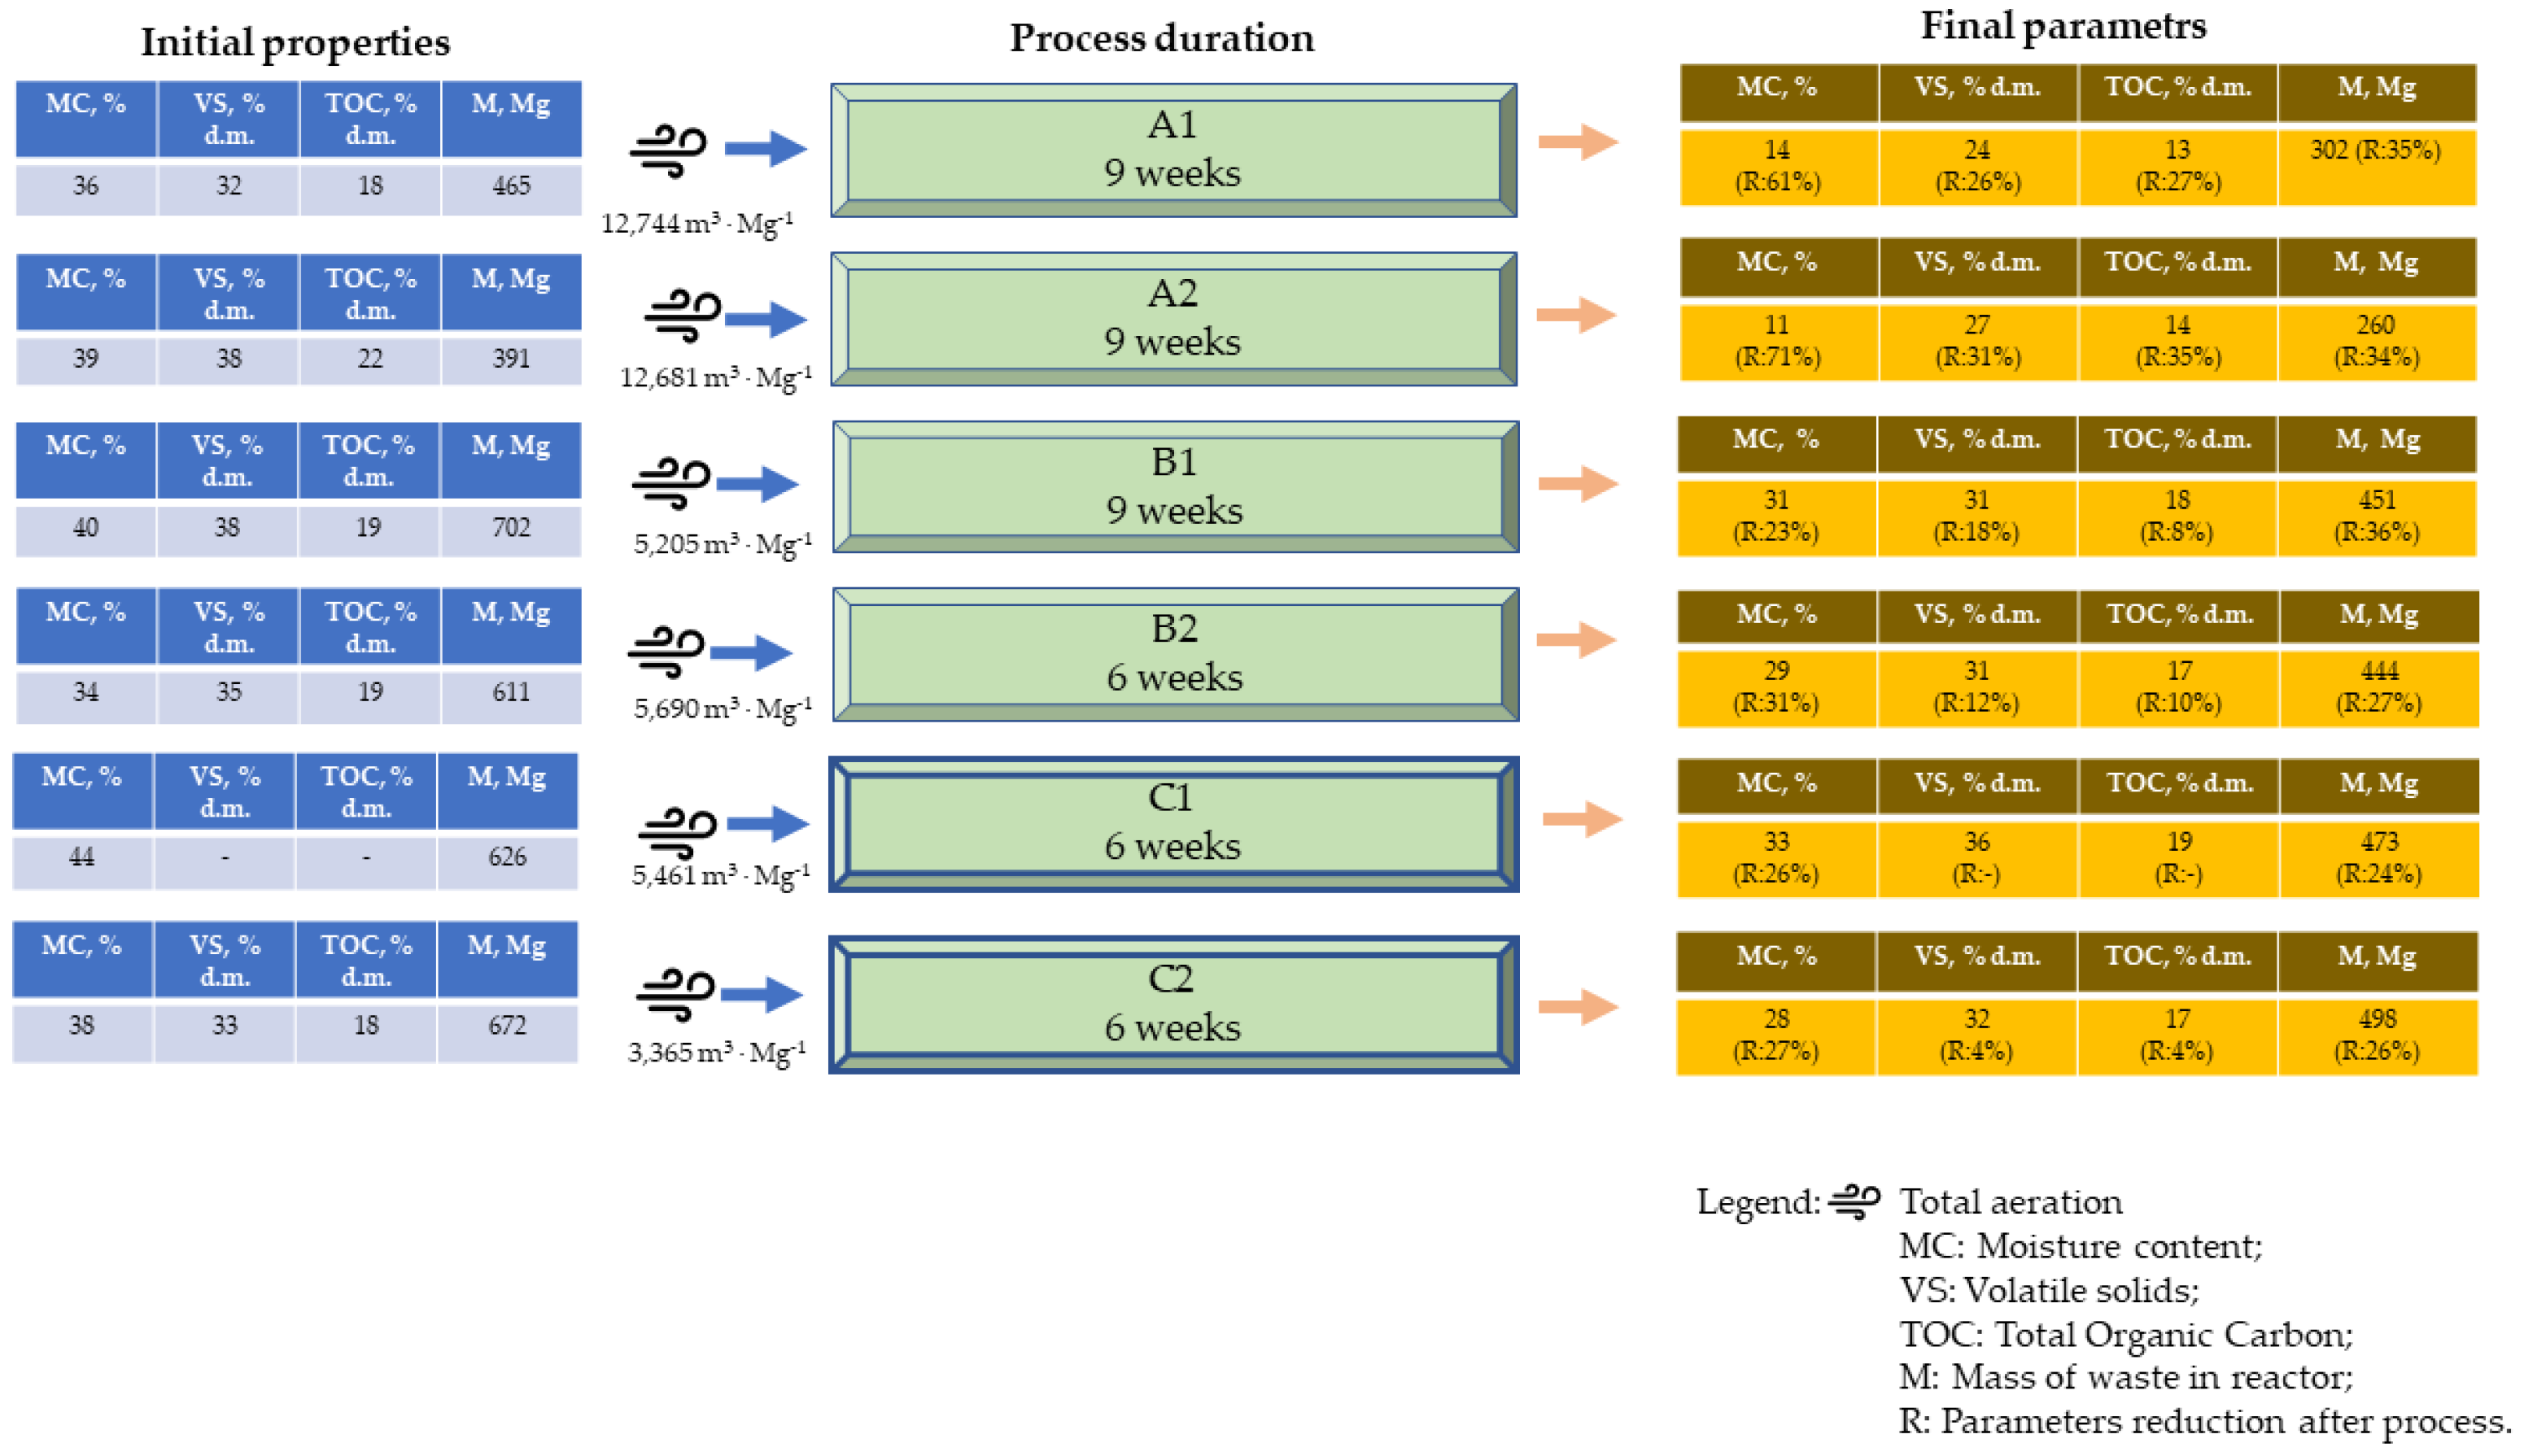
Figure 3) throughout the entire prism profile (~20 °C) during the first two weeks of the process. This lag phase resulted from the high aeration rate (>12,000 m
3∙Mg
−1) and the small mass weight in the reactors (300–400 Mg: ~40% less than normal for this treatment plant). From day 20, in both piles, internal temperatures increased to ~60–70 °C (
Supplementary Material Figures S4, S5 and S12), three hot spots where found (high temperature coupled with low O
2:
Table 5), and further small increases were observed from weeks 5 to 7. Similar temperature patterns were observed in a reactor without forced aeration by Jiang et al. (2015) [
38], during composting of green waste [
39], kitchen waste [
40], and vermicomposting of duck manure [
41]. However, Mulbry and Ahn (2014) showed that, in much larger scale piles, passive aeration allows them to heat up as quickly as during forced aeration [
27].
An interesting trend was observed in pile A1—the highest temperatures, even >70 °C, were found at the end furthest from the fan (
Supplementary material section 47.5 m Figures S4d and S5c,d) from where the heat spread towards the front of the pile. This could be due to a poorer air supply to the far end of the pile, resulting in self-heating and poor heat removal. In pile A2 this did not occur (
Supplementary Material Figures S13–S16), despite a similar air load and a mass of waste greater by about 15% greater. In addition, lower aeration values were noted by about 1.5 m
3∙Mg
−1∙h
−1 in the first 3 weeks of the research (Supplementary Material Table S1 Stegenta-Dąbrowska et al. (2020)) [
22]. The opposite effect was noticed in pile B2 (
Supplementary Material Figure S30a) which showed greater cooling close to the fan on the final day. This may be the result of faster decomposition of waste located near the fan, which at the end of the process significantly reduced endothermic processes due to the lower activity of microorganisms.
At the same time a few cold spots were observed (
Table 6), located mainly at the bottom of pile, due to the forced aeration. The cooling effect of aeration by the three channels below each pile is clear in the visualization (
Supplementary Material Figures S13a, S47b and S134b). Typically, this occurs in both the first week of biostabilization when internal heat takes longer to accumulate, and in the final week when the need for O
2 is lower.
The observation that, in piles A1 and A2 high temperatures > 50 °C remained during the final days of the process despite the continuous high air stream (
Supplementary Material Figures S9 and S17) indicates high bio-activity of the stabilized waste and consequent high O
2 demand. However, it could result from the unexpected initial two week lag phase in heating the pile.
The highest observed temperatures occurred in pile B1 (from day 16: >70 °C inside the pile, >60 °C at the edge), which contained the highest TOC and organic substances (VS) of all analyzed samples, as well as having twice the mass of piles A1 and A2, but half the rate of aeration.
In piles C1 and C2 the sidewalls apparently contributed to an overall reduction of temperature (
Supplementary material Figures S35–S38, S41 and 42). The cooling of the waste at the border with the walls is visible, especially at the beginning and at the end of the process—a few cold spots were identified near to the sidewalls and at the bottom (
Table 6). Despite favorable conditions (large mass of waste; less aeration), no elevation of temperature was noticed.
Experiments carried out under similar conditions by Ermolaev et al. (2012) showed that, despite continuous operation, fans may be unable to maintain an appropriate temperature [
26]. Our observations of cold spots (low temperatures) at the base of the pile (e.g.,
Figure 5;
Supplementary Material Figure S30 and
Table 6) indicates the impact of pumping large amounts of air, resulting in removal of warm air from the center and overall cooling of the pile. Similar effects of lowering temperature by increased aeration were observed by Shen et al. (2011) and Sołowiej et al. (2010) [
42,
43]. In bigger piles, B1–2 and C1–2, the optimal temperature for the biostabilization process, around 60 °C, was reached much faster, an effect also noted by [
44]. Although heat contributes to elimination of pathogenic organisms (Stentiford, (1996) it does not ensure maximum mass removal [
45]. According to many authors, greater mass reduction can be achieved at temperatures between 40 and 60 °C [
45,
46,
47]. On the other hand, Richard, (1993) claims that maintaining the temperature in the range of 56–70 °C for too long (over a week) reduces biodiversity and increases the intensity of odor compounds [
47].
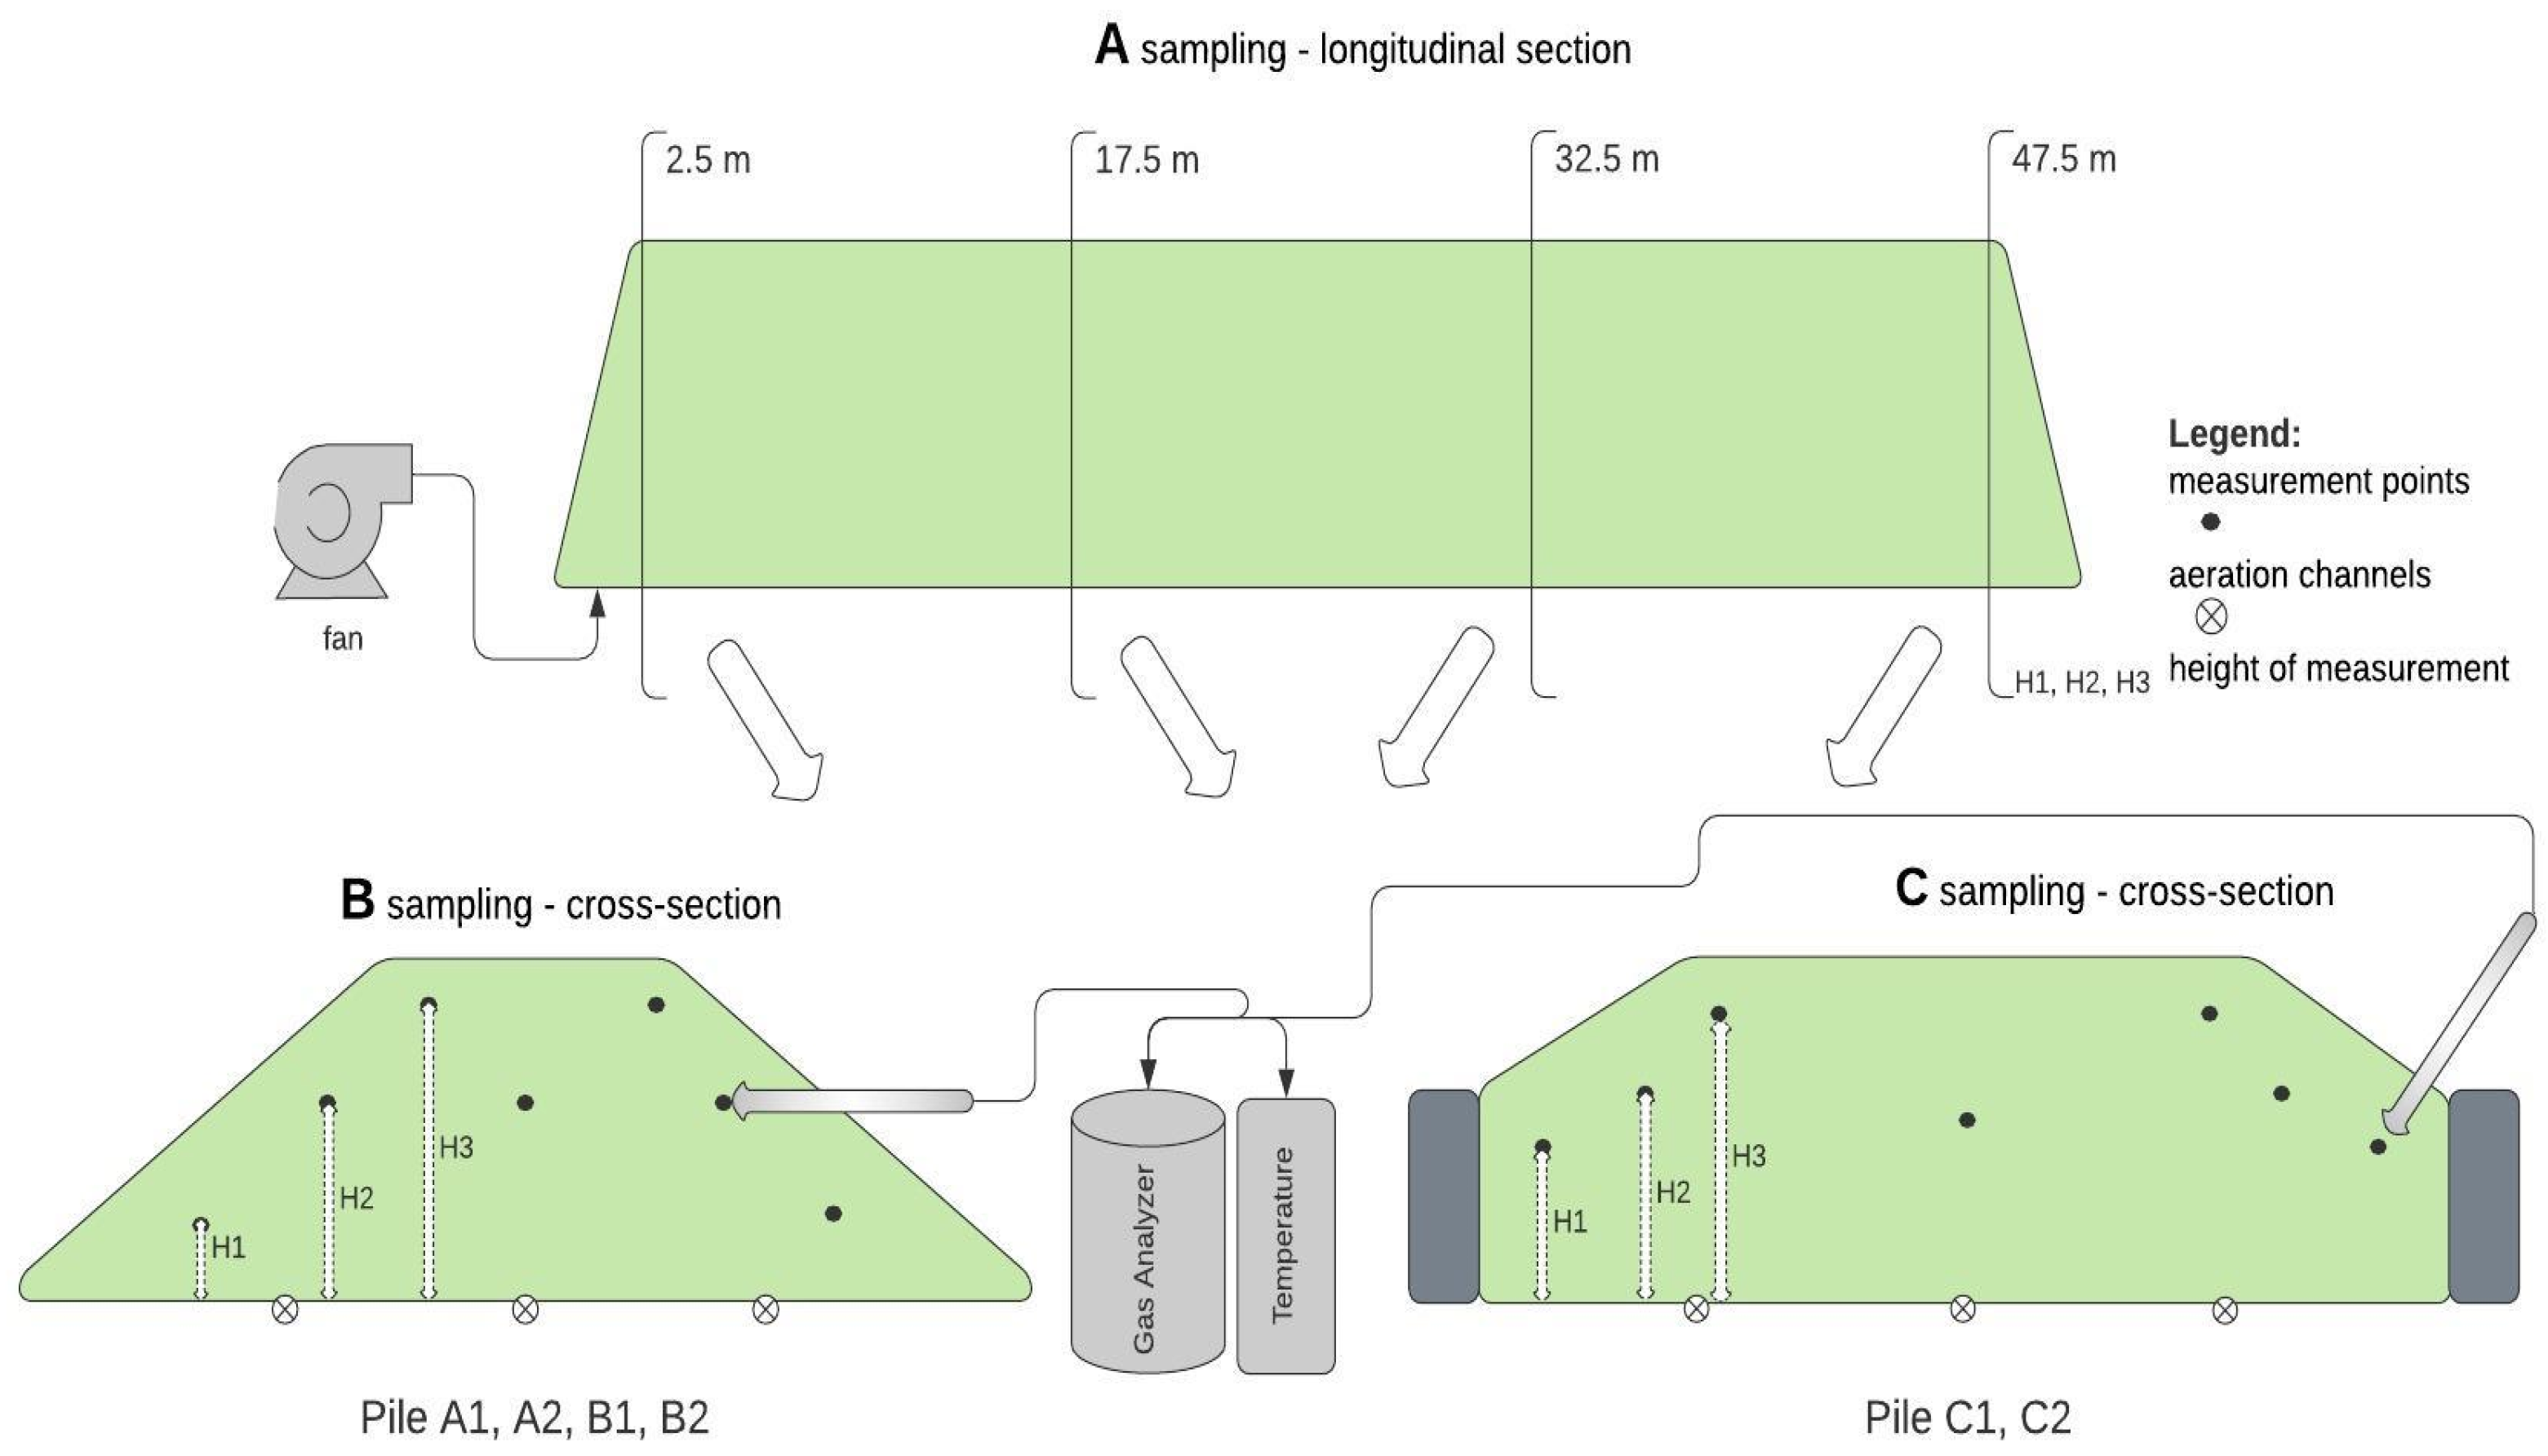
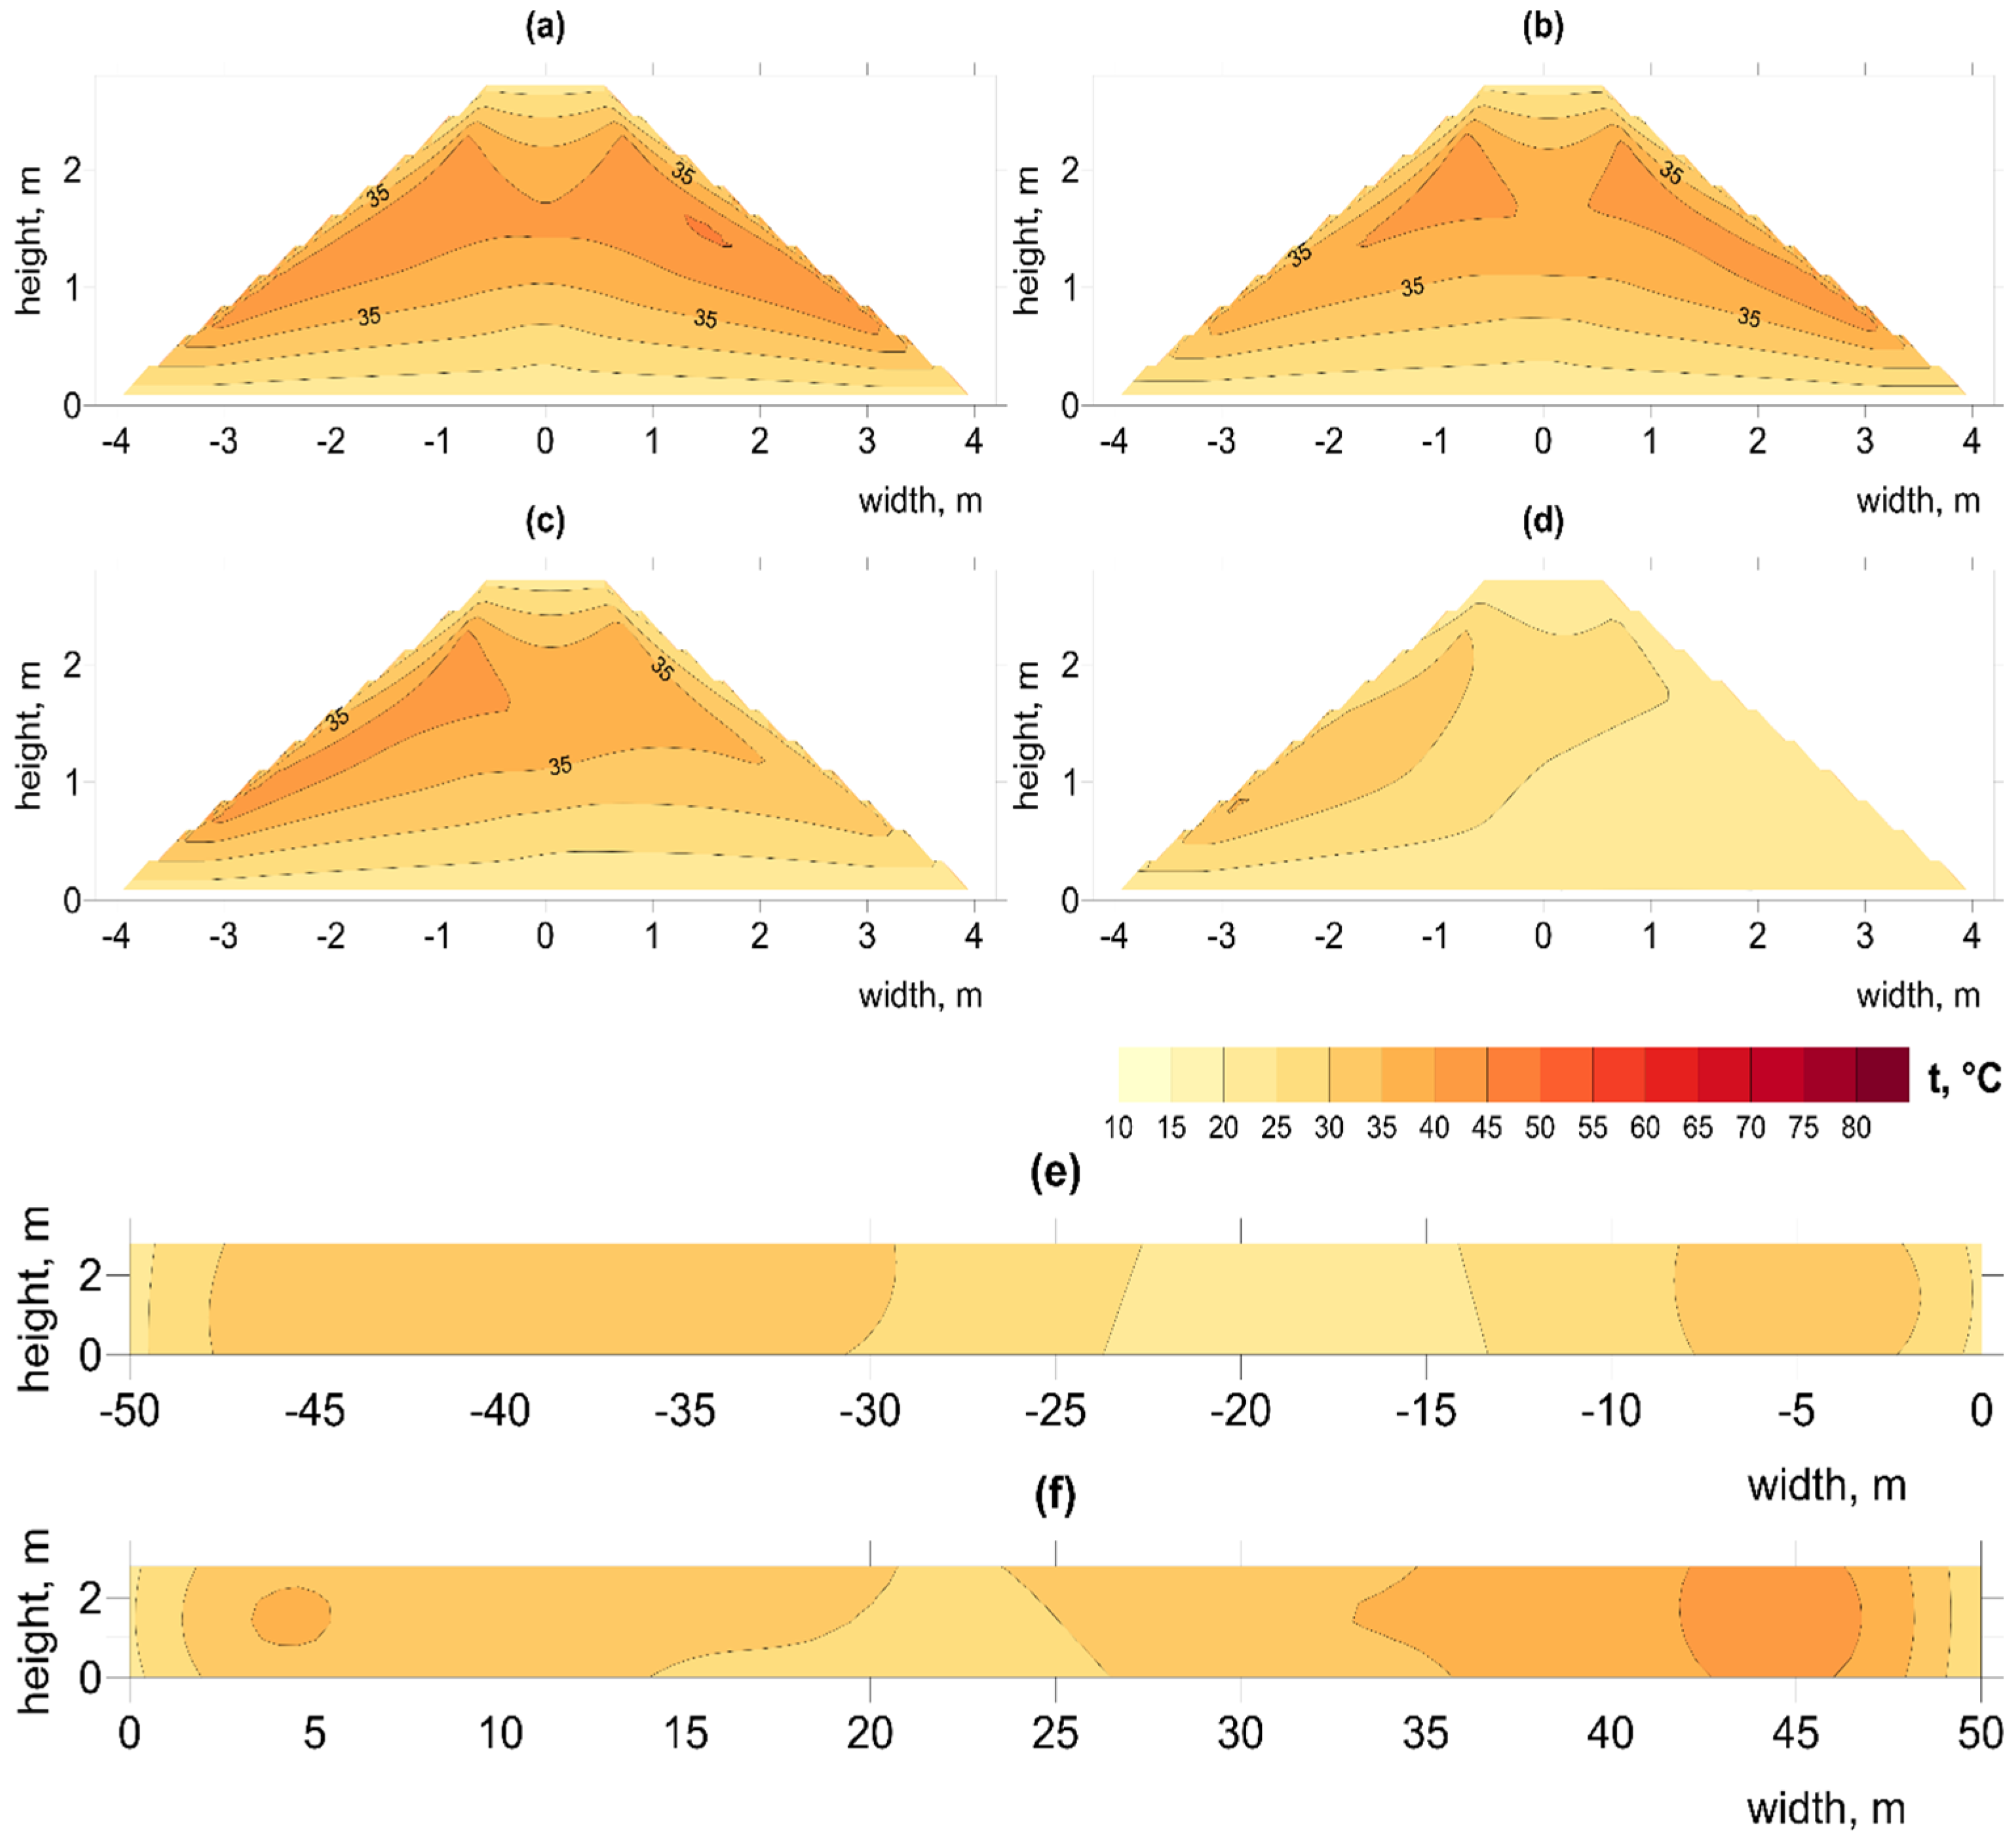
Figure 5.
Spatial distribution of temperature changes on day 1 in pile B1, at distances from the aeration fan (a) 2.5 m, (b) 17.5 m, (c) 31.5 m, (d) 47.5 m, longitudinal sections (e) left (f) right. Illustration of the problem with irregular temperature in pile.
Figure 5.
Spatial distribution of temperature changes on day 1 in pile B1, at distances from the aeration fan (a) 2.5 m, (b) 17.5 m, (c) 31.5 m, (d) 47.5 m, longitudinal sections (e) left (f) right. Illustration of the problem with irregular temperature in pile.
3.2.2. Spatial Distribution of O2 and CO2 Concentration
Despite the high aeration in piles A1 and A2 during the first two weeks, low O
2 concentrations were recorded, together with low temperatures (
Supplementary Material Figures S43, S44, S52 and S53). The high rate of airflow would have created optimal conditions for the activity of psychro- and mesophilic microorganisms at that time, leading to depletion of oxygen by respiration. However, the inhomogeneity of the OFMSW and differences in bulk density could also affect airflow through the pores creating local “hot spots”. O
2 levels were particularly low in most cases at the center of the pile early in the process (e.g.,
Supplementary Material Figures S46, S47, S54 and S62), but hot spots were discovered in pile A2 at 2.5 m length on day 25 (
Table 5). In pile A1, reduced O
2 concentrations (~15% lower) occurred on the left side of the pile (
Supplementary Material Figures S46–S48), corresponding to the higher temperatures in the same areas (
Supplementary Material Figures S4–S6). The above examples were all identified as a hot spot (
Table 5). Low O
2 concentrations result from the high intensity of biodegradation early in the process (Jiang et al. (2015) especially if aeration is insufficient [
38]. Mohajer et al. (2010) note that the O
2 consumption strongly increases in the first 4 days of composting to as much as 40 mmol∙h
−1∙kg
−1 d.m., and then decreases with the duration of the process [
48].
O
2 concentrations increased during the process, related to decreasing O
2 consumption, while supply of forced air remained stable (Supplementary Material Table S3, [
22]). From day 30, O
2 concentrations > 17% were observed in most piles, indicating excellent oxygenation of the waste and sufficient air forced into the pile to promote aerobic digestion.
Data obtained in this experiment shows a generally better aeration system (few locations with less than 15% O
2) compared to composting in active aerated and static piles reported by Szanto et al. (2007) [
49]. Although the total aeration intensity per waste mass m
3·Mg
−1 (Supplementary Material Table S1, [
22]) was below the recommended level, >10 m
3∙Mg
−1∙h
−1 [
4], this did not appear to affect the O
2 concentration observed in the piles.
In pile B2, lower concentrations of O
2 were observed at its sides (
Supplementary Material Figures S69–S72) with hot spots mainly in the center of the pile (
Table 5), which may also confirm insufficient air supply where the total waste mass exceeds 600 Mg. The influence of reactor design during biological waste treatment process has been noted by Mason and Milke, (2005) [
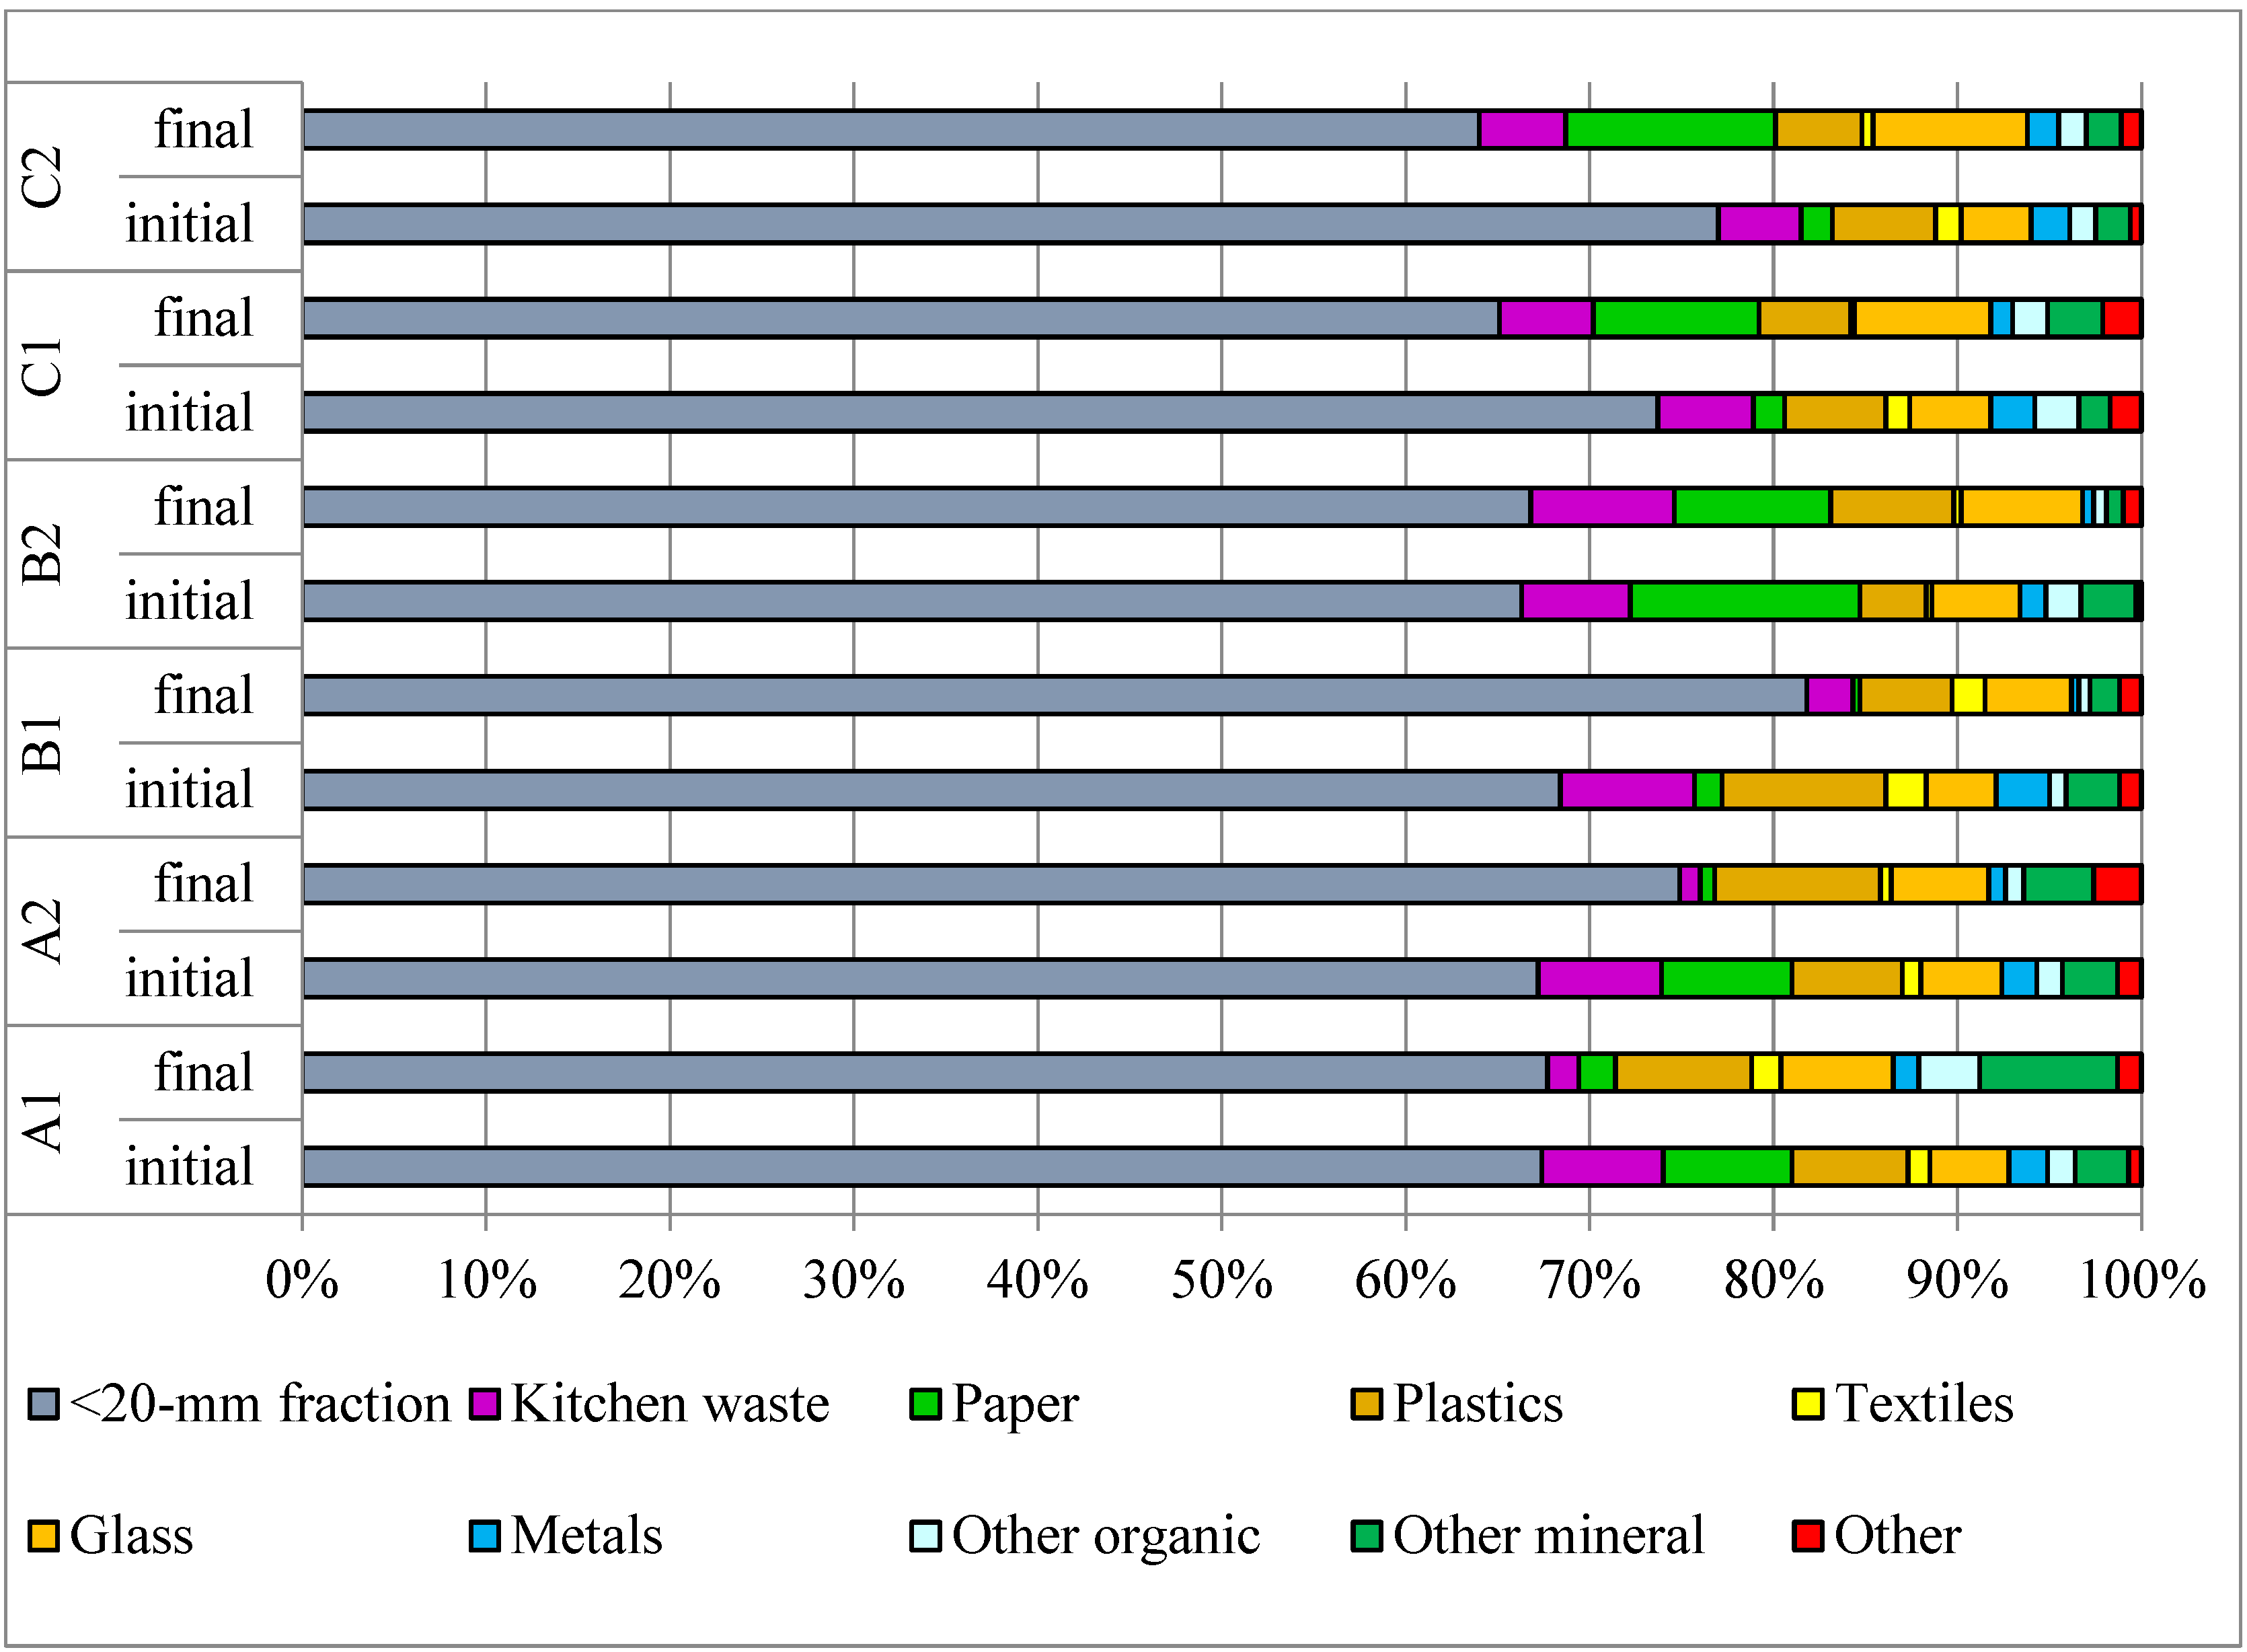
20]. Another explanation could be the structure of the waste, consisting mainly of waste fractions < 20 mm (
Supplementary Material Figure S3), which could reduce the free air spaces and obstruct the air from the aeration channels. Whether aeration is passive or active, airspace within the substrate plays an important role in the composting process [
51]. Air porosity influences not only air permeability, but also determines O
2 transport and the removal of water and heat from the pile.
Very high concentrations of O
2 > 18% were observed in C1 and C2, where sidewalls were constructed. Low concentrations of O
2 < c8% (
Supplementary Material Figures S84b and S85b) and high concentrations of CO
2 (
Figures S128b and S129b) occurred at only a few points (e.g., the cross-section of 17.5 m) indicating hot spots (
Table 5). CO
2 concentrations are consistent with results obtained by Clemens and Cuhls, (2003) from various types of piles composting municipal solid waste [
52]. The spatial distribution of CO
2 showed an inverse relationship with O
2 (e.g., in pile A1, higher CO
2 concentrations occurred on the left side of the pile together with high temperature and lower O
2), which is typical for aerobic waste treatment [
53,
54]. The highest content of CO
2 > 10% was observed in B1, mainly up to week 2, but levels were mostly very low (2 to 3%) and occurred in the center of the pile as single hot spots. Similarly, the highest CO
2 concentrations were observed in the first phase of composting a mixture of manure and sawdust, and then its gradual reduction as the compost matures [
55], and at a small scale during home composting [
56].
The influence of the sidewalls in piles C1 and C2 was also noticed as an increase in the occurrence of hypoxic zones near to the border of the walls. This could have resulted from poorly located aeration channels, which were originally designed for non-compacted piles, or from the small amount of air supplied to the pile. Despite such issues of reactor design, an active aeration system is essential, since CO
2 may increase to over 25% with inadequate aeration [
49].
Table 5.
Localization of hot spots during biostabilization process.
Table 5.
Localization of hot spots during biostabilization process.
| Hot Spots |
|---|
| Pile | Place (Length), m | Time, Day | Localization | Figures (Supplementary Material) |
|---|
| A1 | 2.5; 17.5, 32.5 | 20 | In the center | Figures S4, S45 and S89 |
| A1 | 2.5, 32.5 | 28 | In the center | Figures S5, S47 and S90 |
| A1 | 32.5 | 41 | In the top left corner | Figures S7, S49 and S92 |
| A2 | 2.5 | 25 | In the center of pile | Figures S13, S55, S98 |
| A2 | 2.5 | 32 | In the top left corner | Figures S14, S56 and S99 |
| A2 | 17.5 | 47 | In the top left corner | Figures S16, S58 and S101 |
| B1 | 17.5 | 9 | In the center of pile | Figures S18, S61 and S104 |
| B1 | 2.5, 17.5, 32.5, 47.5 | 16 | In the center and left side | Figures S19, S62 and S105 |
| B1 | 2.5, 17.5, 32.5, 47.5 | 22 | In the center and left side | Figures S20 and S106 |
| B1 | 2.5, 17.5, 32.5, 47.5 | 31 | In the center and left side | Figures S21, S63 and S107 |
| B1 | 2.5, 17.5, 32.5, 47.5 | 41 | In the center and left side | Figures S22, S64 and S107 |
| B1 | 17.5 | 57 | In the left bottom corner | Figures S23, S66 and S109 |
| B2 | 2.5, 32.5, 47.5 | 8 | In the center and left side | Figures S26, S69 and S112 |
| B2 | 32.5 | 16 | In the left bottom corner | Figures S27, S70 and S113 |
| B2 | 17.5, 32.5, 47.5 | 24 | In the center and right side | Figures S28, S71 and S114 |
| B2 | 32.5 | 43 | Right down corner | Figures S30, S73 and S116 |
| C1 | 32.5 | 28 | In the center | Figures S34, S77 and S120 |
| C2 | 17.5 | 9 | On the right side | Figures S38, S81 and S124 |
| C2 | 32.5 | 21 | On the left side | Figures S39, S82 and S125 |
| C2 | 17.5 | 35 | On the left and right corner | Figures S41, S84 and S127 |
Table 6.
Localization of cold spots during biostabilization process (excluding data from first three weeks of biostabilization in piles A1 and A2, due to low temperature in all piles).
Table 6.
Localization of cold spots during biostabilization process (excluding data from first three weeks of biostabilization in piles A1 and A2, due to low temperature in all piles).
| Hot Spots |
|---|
| Pile | Place (Length), m | Time, day | Localization | Figures (Supplementary Material) |
|---|
| A1 | 2.5; 17.5, 32.5 | 20 | In the left side in the bottom | Figures S4, S46 and S89 |
| A1 | 2.5, 32.5 | 28 | In the bottom | Figures S5, S47 and S90 |
| A2 | 2.5, 17.5 | 17 | In the bottom | Figures S12, S54 and S97 |
| A2 | 2.5, 17.5, 32.5 | 25 | In the bottom | Figures S13, S55 and S98 |
| A2 | 2.5, 17.5 | 38 | In the bottom | Figures S15, S57 and S100 |
| A2 | 2.5, 17.5, 32.5, 47.5 | 57 | In the bottom | Figures S17, S59 and S102 |
| B1 | 32.5, 47.5 | 1 | In the bottom and in the center | Figures S60 and S103 |
| B2 | 2.5, 17.5, 32.5, 47.5 | 1 | In the bottom | Figures S25, S69 and S111 |
| B2 | 2.5 | 43 | In the bottom and in the center | Figures S30, S74 and S116 |
| C1 | 2.5, 17.5 | 28 | left side, near to sidewalls and in the bottom | Figures S34, S77 and S120 |
| C1 | 2.5, 32.5, 47.5 | 35 | left side, near to sidewalls | Figures S35, S78 and S121 |
| C1 | 2.5, 32.5, 47.5 | 42 | Left and right side, near to sidewalls | Figures S36, S79 and S122 |
| C2 | 2.5, 17.5, 32.5, 47.5 | 1 | In the bottom | Figures S37, S80 and S123 |
| C2 | 32.5, 47.5 | 28 | In the bottom | Figures S40, S83 and S126 |
| C2 | 2.5, 32.5, 47.5 | 35 | In the bottom, left side, near to sidewalls | Figures S41, S84 and S127 |
| C2 | 2.5, 32.5, 47.5 | 42 | In the bottom, left side, near to sidewalls | Figures S42, S85 and S128 |
It has been shown that the number of hot and cold spots depended on the size of the pile and aeration rate. Comparison between piles A1–2 and B1–2 shows that when the mass of stabilized waste is significantly lower and the aeration rate is two-fold higher the number of hot spots decreases, while cold spots increase. In the case of piles A1–2, the number of hot spots was 6 and 3, respectively, while in piles B1–2, 16 and 8. The opposite situation was in the case of cold spots 5–11 (A1–2) and 2–5 (B1–2) (
Table 5). It shows that the application of hot and cold spot monitoring may be a useful tool for the optimization of the AB process. The elimination of hot and cold spots should be the aim, to achieve proper conditions for an efficient process, however, it requires further investigation. Additionally, our results indicated that construction with sidewalls (piles C1–2) decreased the number of hot spots to just 1 and 3, respectively (
Table 4). This decrease may be due to improved airflow through the waste by eliminating air escape near the base of the pile. However, in piles B1–2, with similar waste mass and airflow rate, the channelized airflow increased the number of cold spots to 8 and 12, respectively (
Table 5), indicating that differing reactor constructions also requires an optimal airflow rate to avoid inadequate aeration.
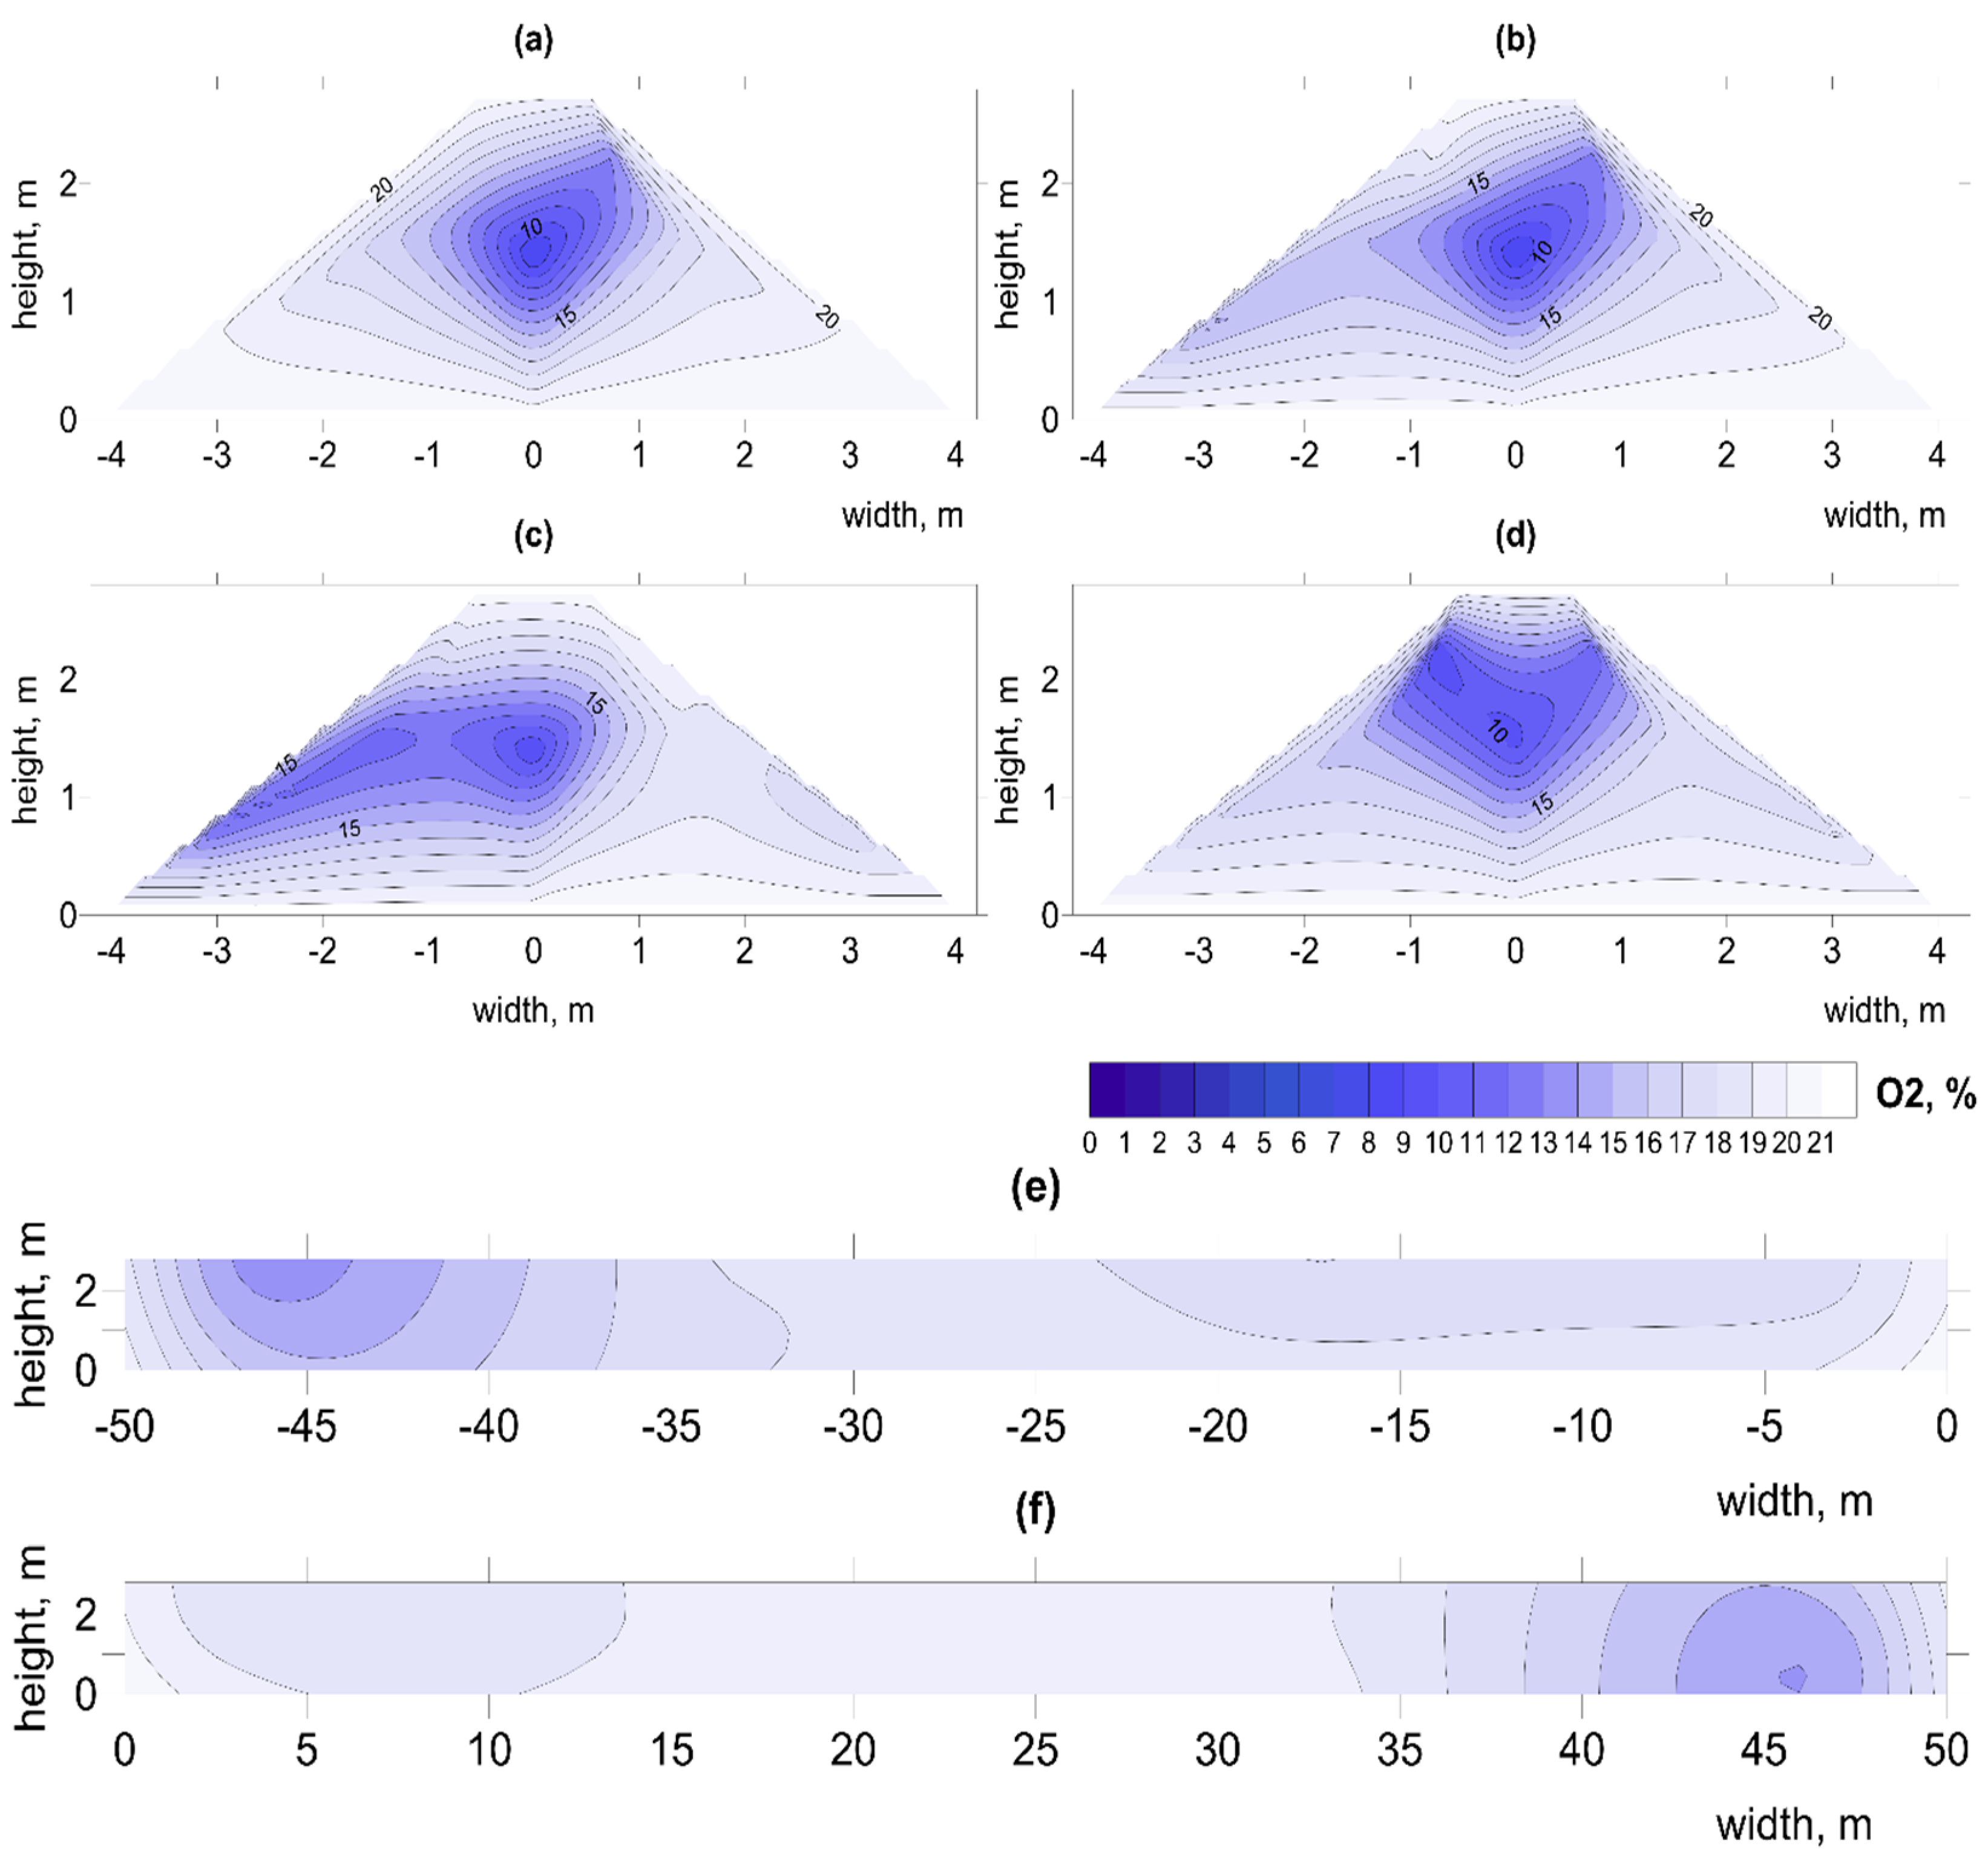
Figure 6.
Spatial distribution of O2 changes on day 22 in pile B1, at distances from aeration fan (a) 2.5 m, (b) 17.5 m, (c) 31.5 m, (d) 47.5 m, longitudinal sections (e) left (f) right. Illustration of low O2 concentration in center of pile.
Figure 6.
Spatial distribution of O2 changes on day 22 in pile B1, at distances from aeration fan (a) 2.5 m, (b) 17.5 m, (c) 31.5 m, (d) 47.5 m, longitudinal sections (e) left (f) right. Illustration of low O2 concentration in center of pile.
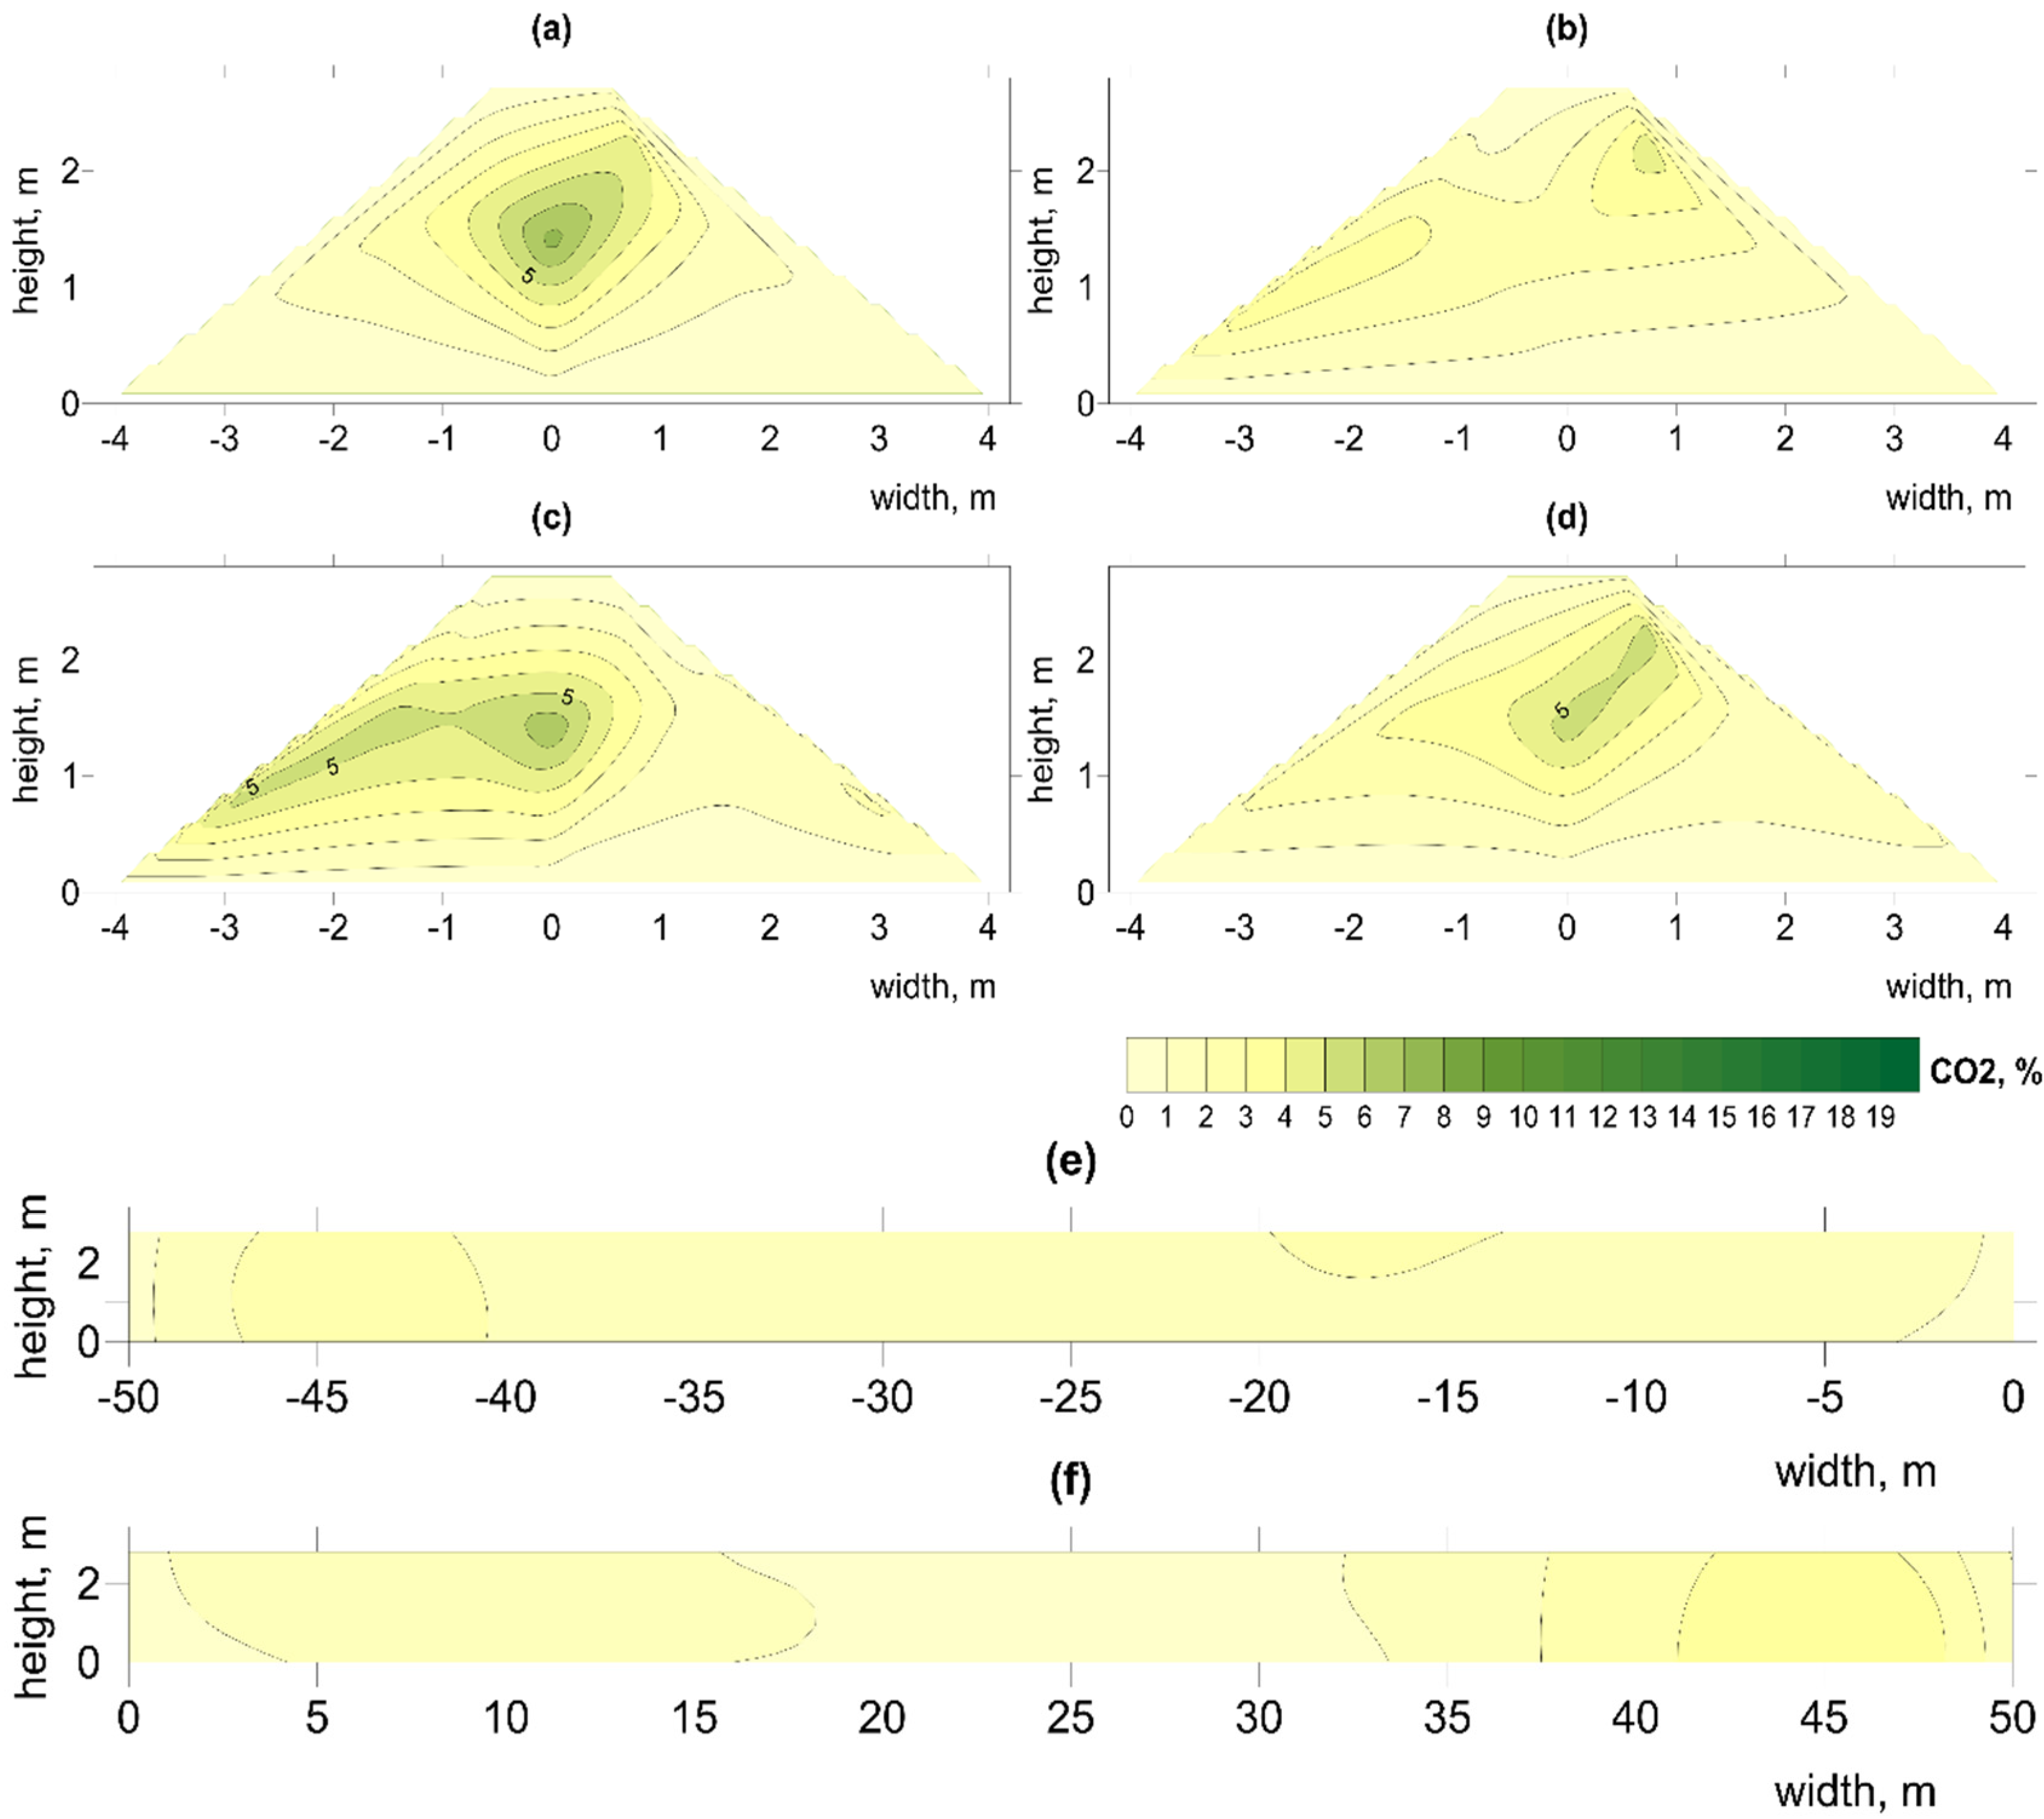
Figure 7.
Spatial distribution of CO2 changes on day 22 in pile B1, at distances from aeration fan (a) 2.5 m, (b) 17.5 m, (c) 31.5 m, (d) 47.5 m, longitudinal sections (e) left (f) right. Illustration of high CO2 concentration in center of pile.
Figure 7.
Spatial distribution of CO2 changes on day 22 in pile B1, at distances from aeration fan (a) 2.5 m, (b) 17.5 m, (c) 31.5 m, (d) 47.5 m, longitudinal sections (e) left (f) right. Illustration of high CO2 concentration in center of pile.
3.2.3. Spatial Distribution of CO Concentration
CO was widely distributed throughout the entire process in all piles. In most cases the highest concentrations were observed in the center of the piles and during the first two weeks, in accordance with research carried out on other materials such as organic waste [
57], green waste with sewage sludge [
16,
58], and municipal waste [
15]. Similar relationships were noted by Boldrin et al. (2009) [
59] during the composting of green waste, and Andersen et al. (2010) [
39] who observed increased CO concentration in the early stages, which continued in composted material for a year.
Low concentrations, up to about 200 ppm, were observed during day 1 of the process in piles A1, A2, B1, and C1 (
Supplementary Material Figures S130, S139, S146 and S159), while in B2 and C2 there were unusually high values from the start, even over 1000 ppm, in the whole volume of the pile (
Supplementary Material Figures S153 and S165). High concentrations of CO throughout the pile during the whole process indicate the dynamic nature of CO production, resulting from the relatively large inhomogeneity of the waste material used.
High CO concentrations were clearly associated with locations of highest temperature. In the case of pile A1, following the initial lag phase, significant increases in both CO and temperature occurred from day 20 of the process (
Supplementary Material Figures S4 and S133). The highest concentration of CO was observed first at the beginning of the process (1st week, near the fan), which could be associated with the low O
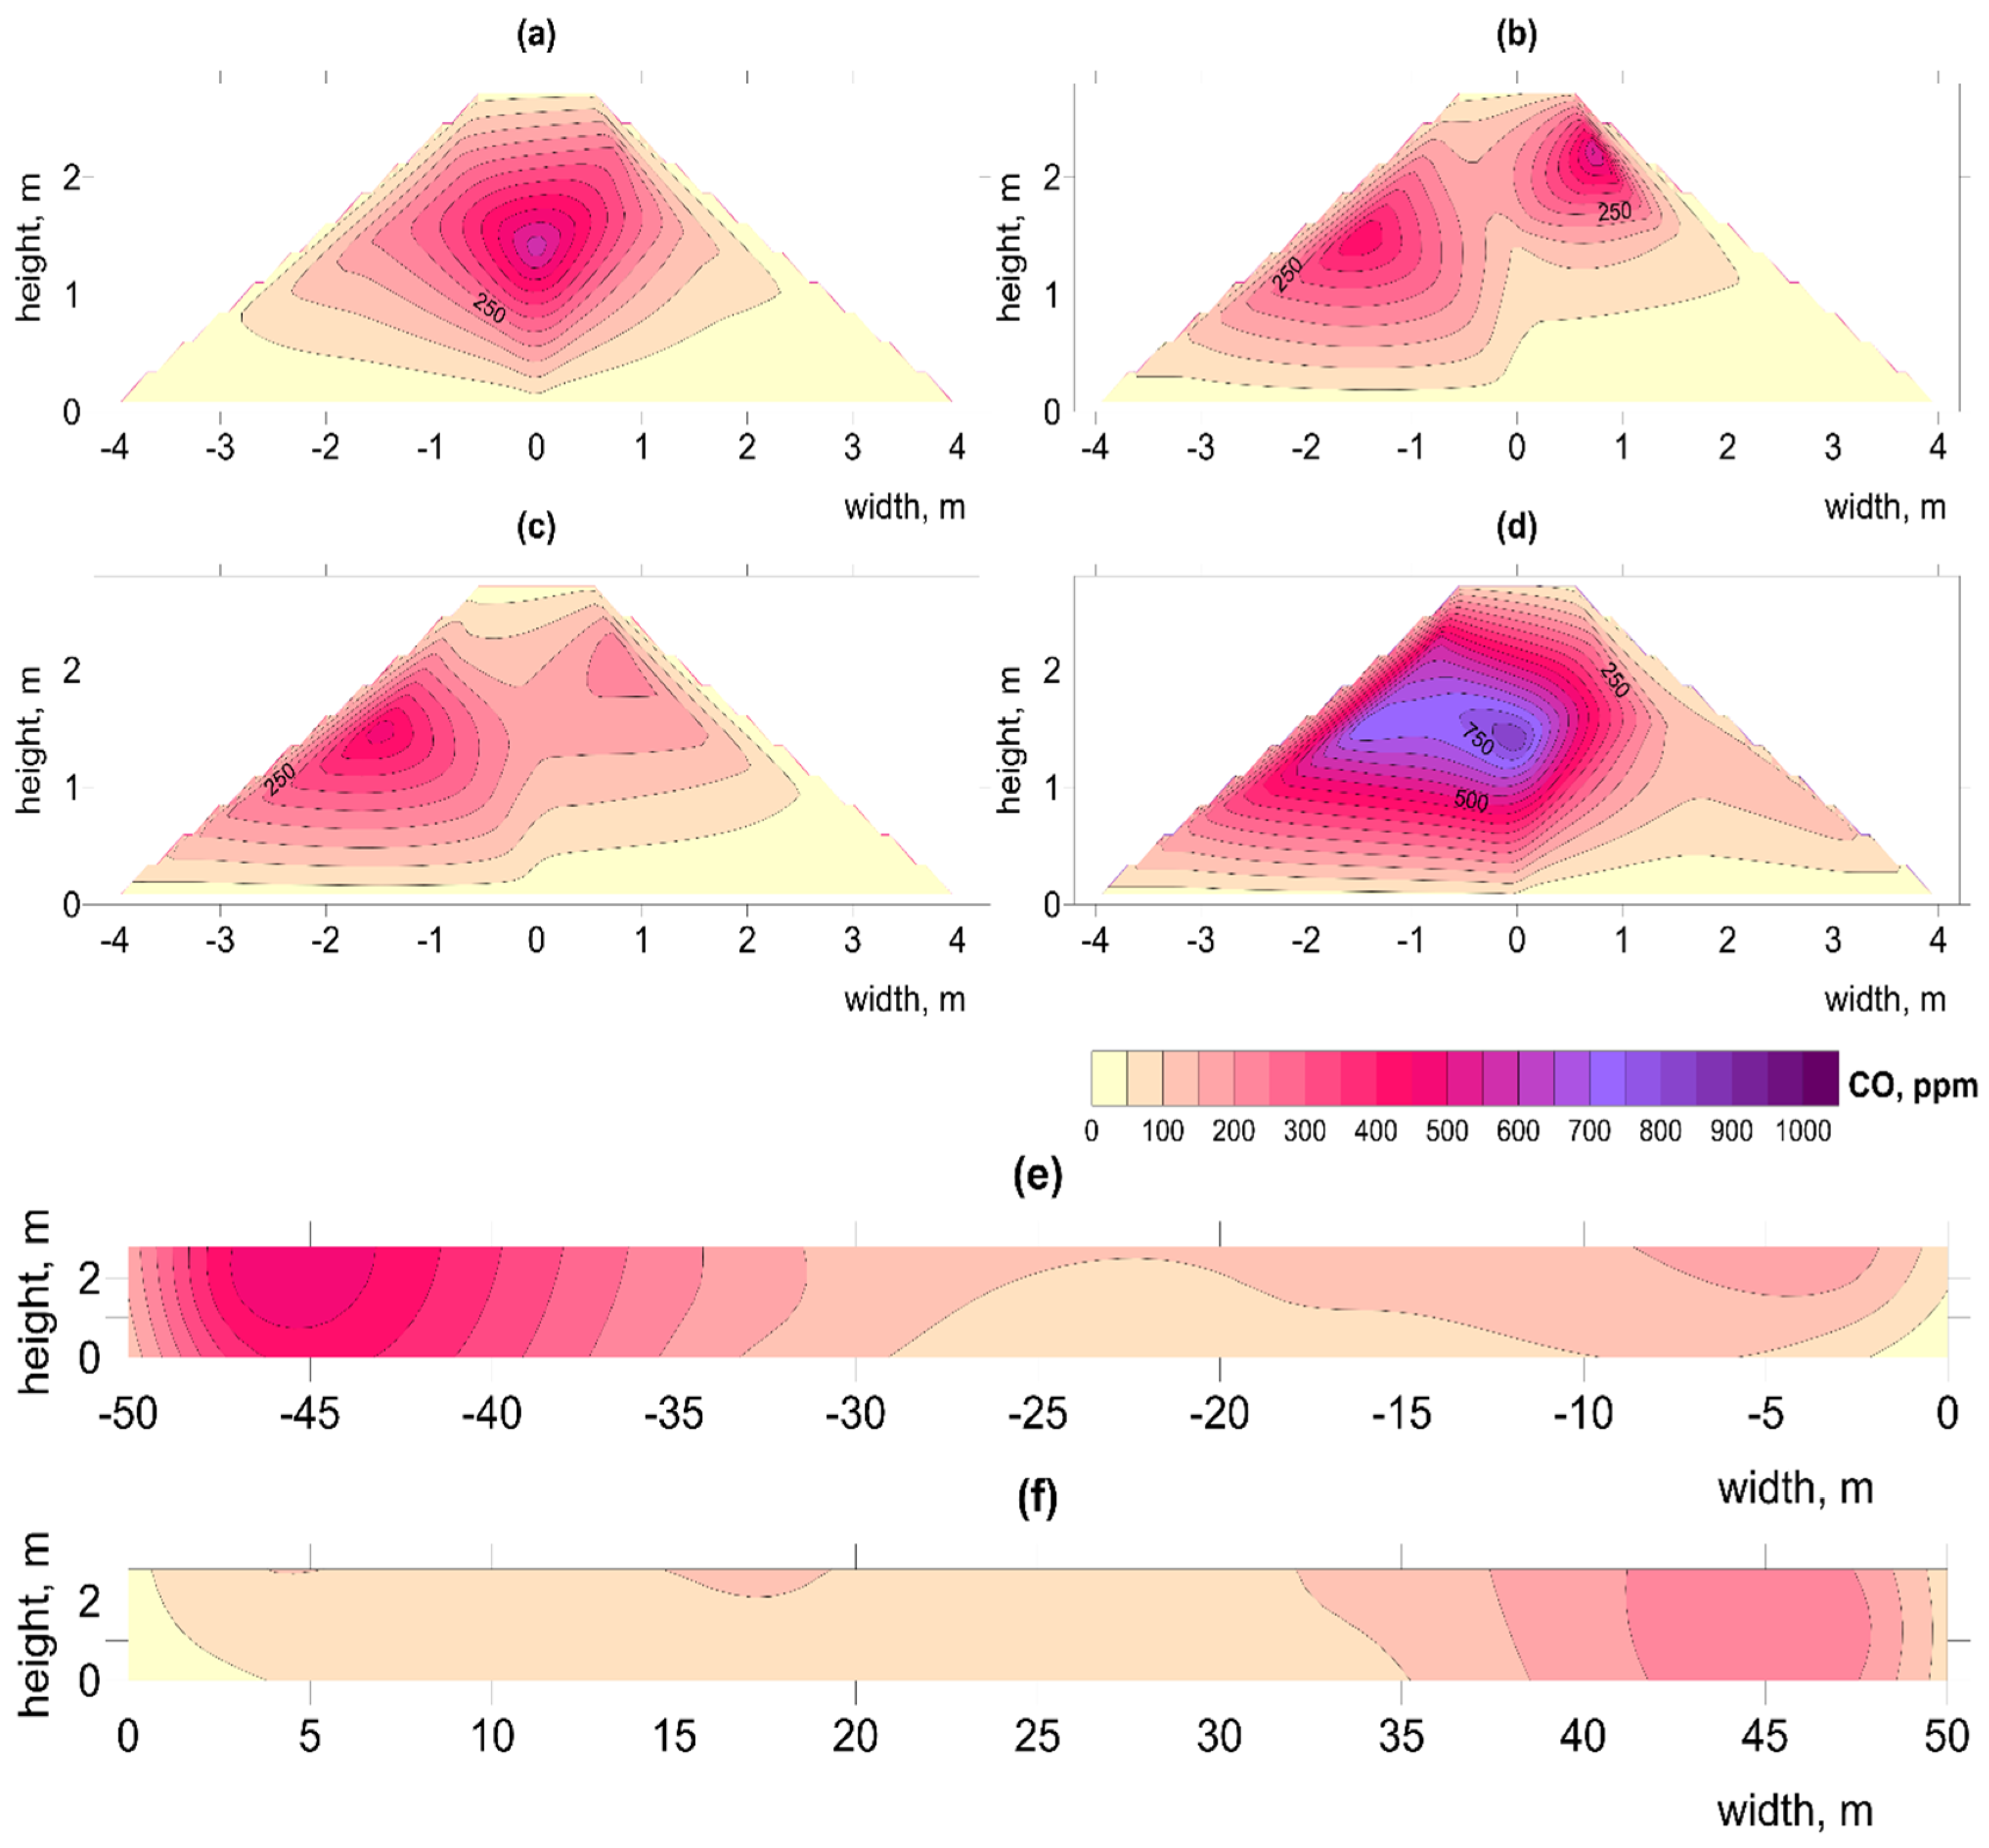
2 content, and at the far end of the pile over the whole duration. Around week 3, increased CO concentration was also noticed. In piles B1 and C1, from the first days of the process, temperatures > 60 °C were associated with very high concentrations of CO (>1000 ppm) (
Figure 8;
Supplementary Material Figures S149, S158 and S160). Similarly, Phillip et al. (2011) observed high CO concentrations during the first 6 h [
60]. Also, in pile B1, very low O
2 concentrations (<5%) were observed in the early stages (
Supplementary Material Figure S60), while in pile C1, only single hot spots were observed near the sidewalls, together with a lower O
2 concentration (
Supplementary Material Figure S73a–d). Hellebrand, (1999) showed that intensive aeration stimulates microorganisms to produce CO, greatly increasing its concentration [
61]. In the present and previous studies [
16,
57], CO production coincides with the highest temperatures in the piles (up to 1800 ppm at 75 °C), which implies a thermochemical basis for the process.
The zones of lower oxygenation and higher temperatures near the sidewalls of the reactor in piles C1 and C2 coincided with higher concentrations of CO (
Supplementary Material Figures S158, S161, S166, S167 and S169). Research by Hellebrand and Kalk, (2001) linked the release of CO directly to the availability of O
2 in the pile, indicating that CO production is favored under both hypoxic and high temperature conditions [
62]. As shown in previous studies, CO is also formed under aerobic conditions, but biotic production is more favorable at lower temperatures <40 °C, whereas at >60 °C, CO production is more thermochemical [
57]. This clearly indicates the need for a waste treatment technology that will not form hot spots. The use of technologies that homogenize municipal solid waste, before placing it in the reactor may prove effective [
63].
In piles where sidewalls were not used (A1, A2, B1, and B2), the biggest concentrations of CO increased in the center of the piles (
Figure 8; e.g.,
Supplementary Material Figures S133, S134, S141, S142, S145 and S148) or at the top of the pile, but smaller concentrations were observed, mainly at the end of the process (
Supplementary Material Figures S132, S138 and S154). This may result from the aeration channels, which promote faster decomposition inside the pile, followed by decomposition in the upper regions of the material.
Several studies conclude that, in the decomposition of organic materials, microbial activity has a significant influence on CO production [
60,
62,
64,
65]. High temperatures > 60 °C prevailing in most of the piles, combined with a pH of about 7 at the end of the process, were optimal conditions for colonization by CO-metabolizing microorganisms [
66]. Such microorganisms could then reduce CO production after the 4th week of the process, despite the high temperatures still prevailing.
Research by Moxley and Smith, (1998) showed the importance of moisture content for CO concentrations from various types of soils, with an optimum of 15 to 25% moisture [
67]. Above and below these levels, CO concentration was reduced. Piles B1, C1, and C2 recorded the highest concentrations of CO but the lowest moisture removal, suggesting that the optimal value of moisture (in relation to CO production) of the OFMSW is rather higher, between 30 and 35%.


