Controlling the Wettability of ZnO Thin Films by Spray Pyrolysis for Photocatalytic Applications


 , , and
Abstract
:1. Introduction
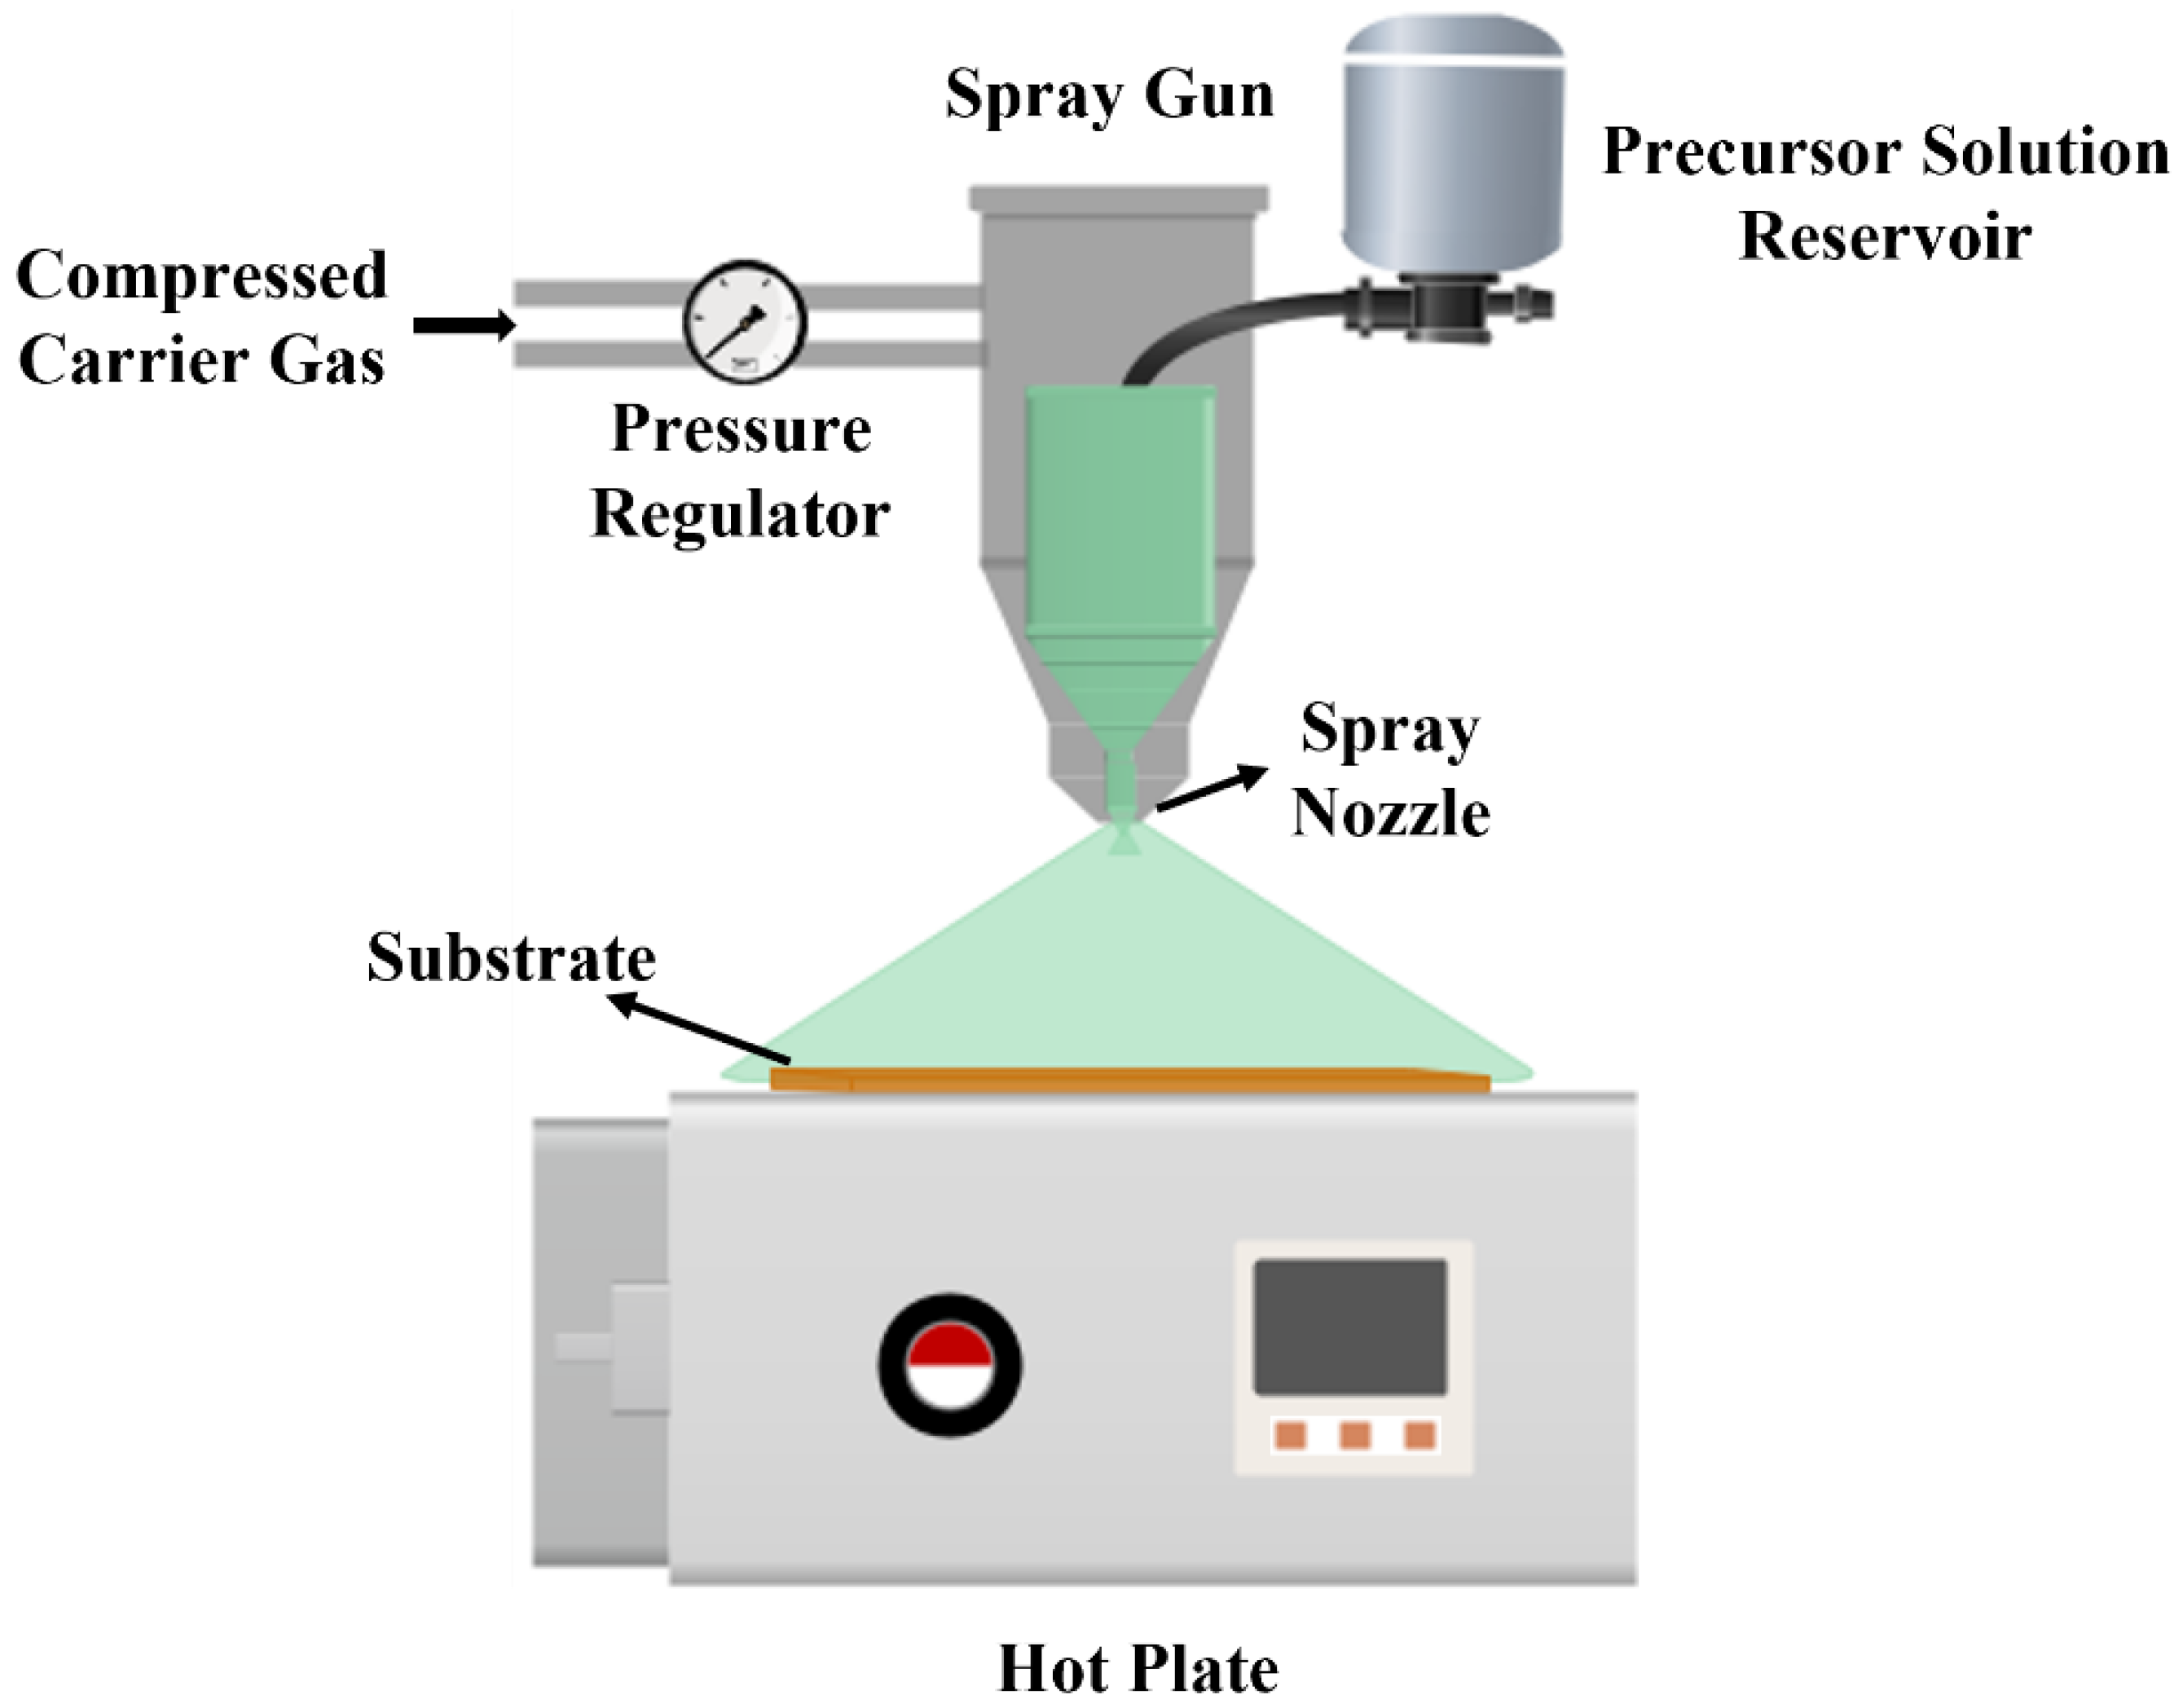
2. Materials and Methods
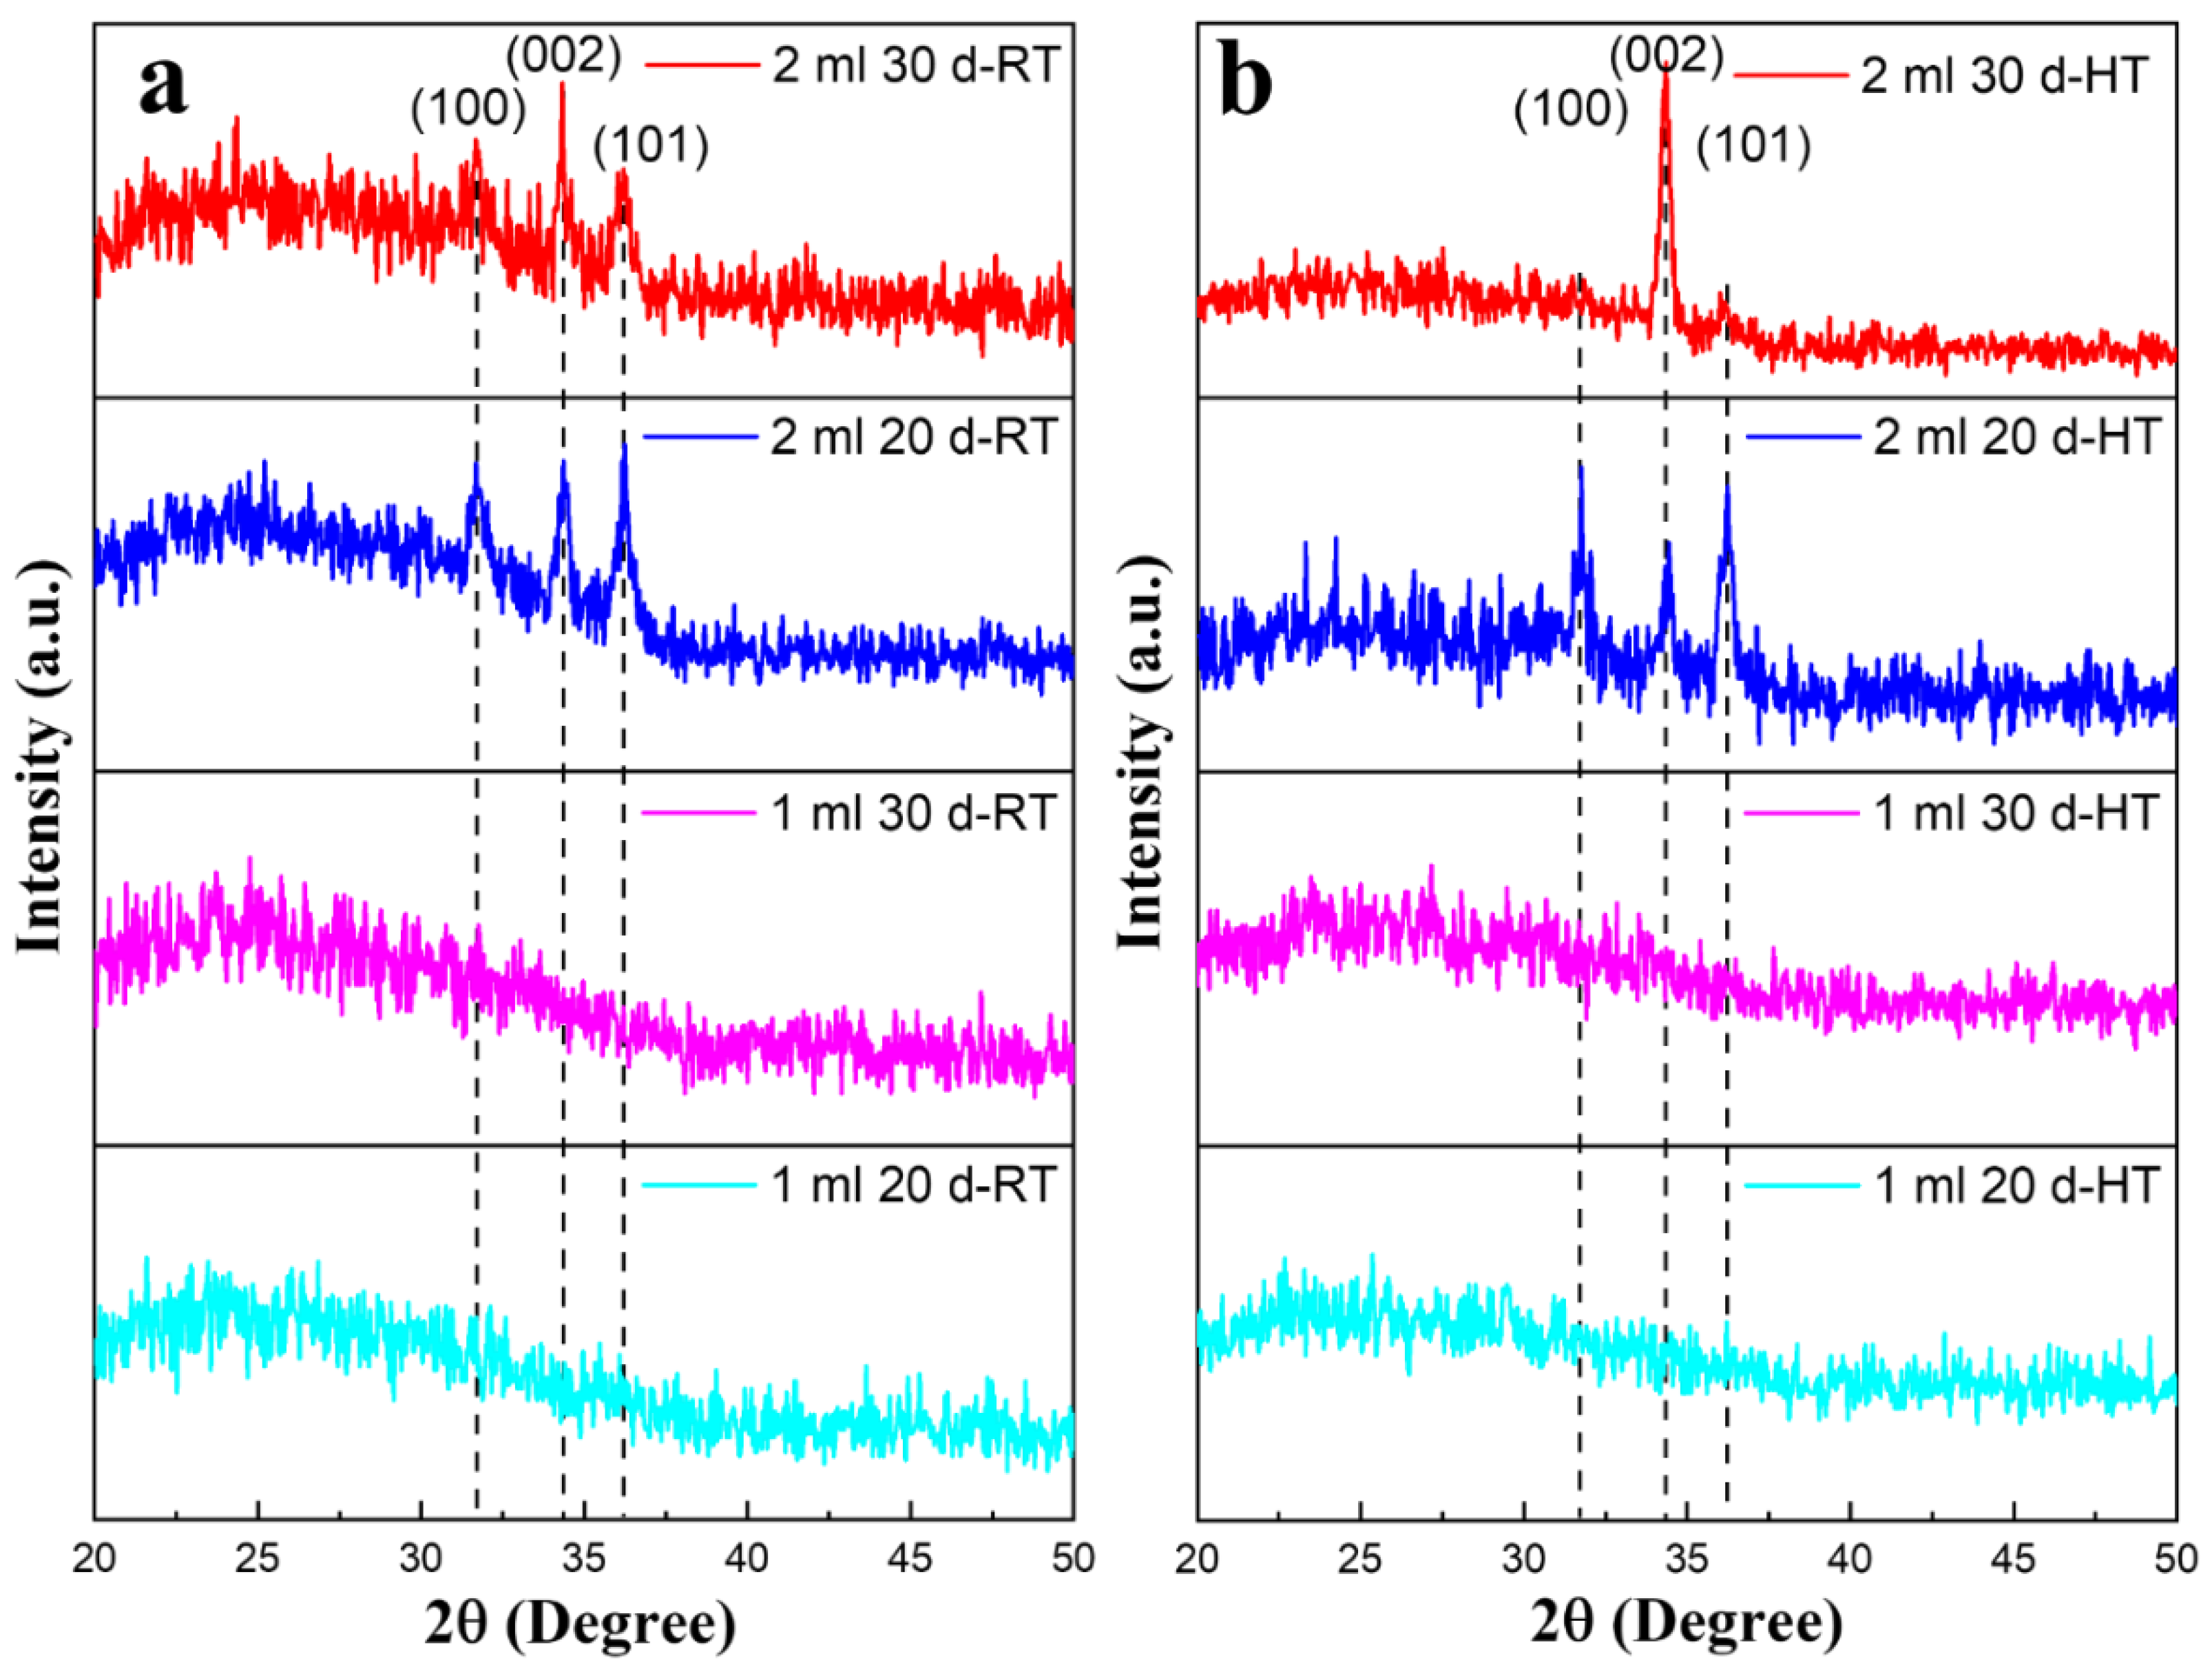
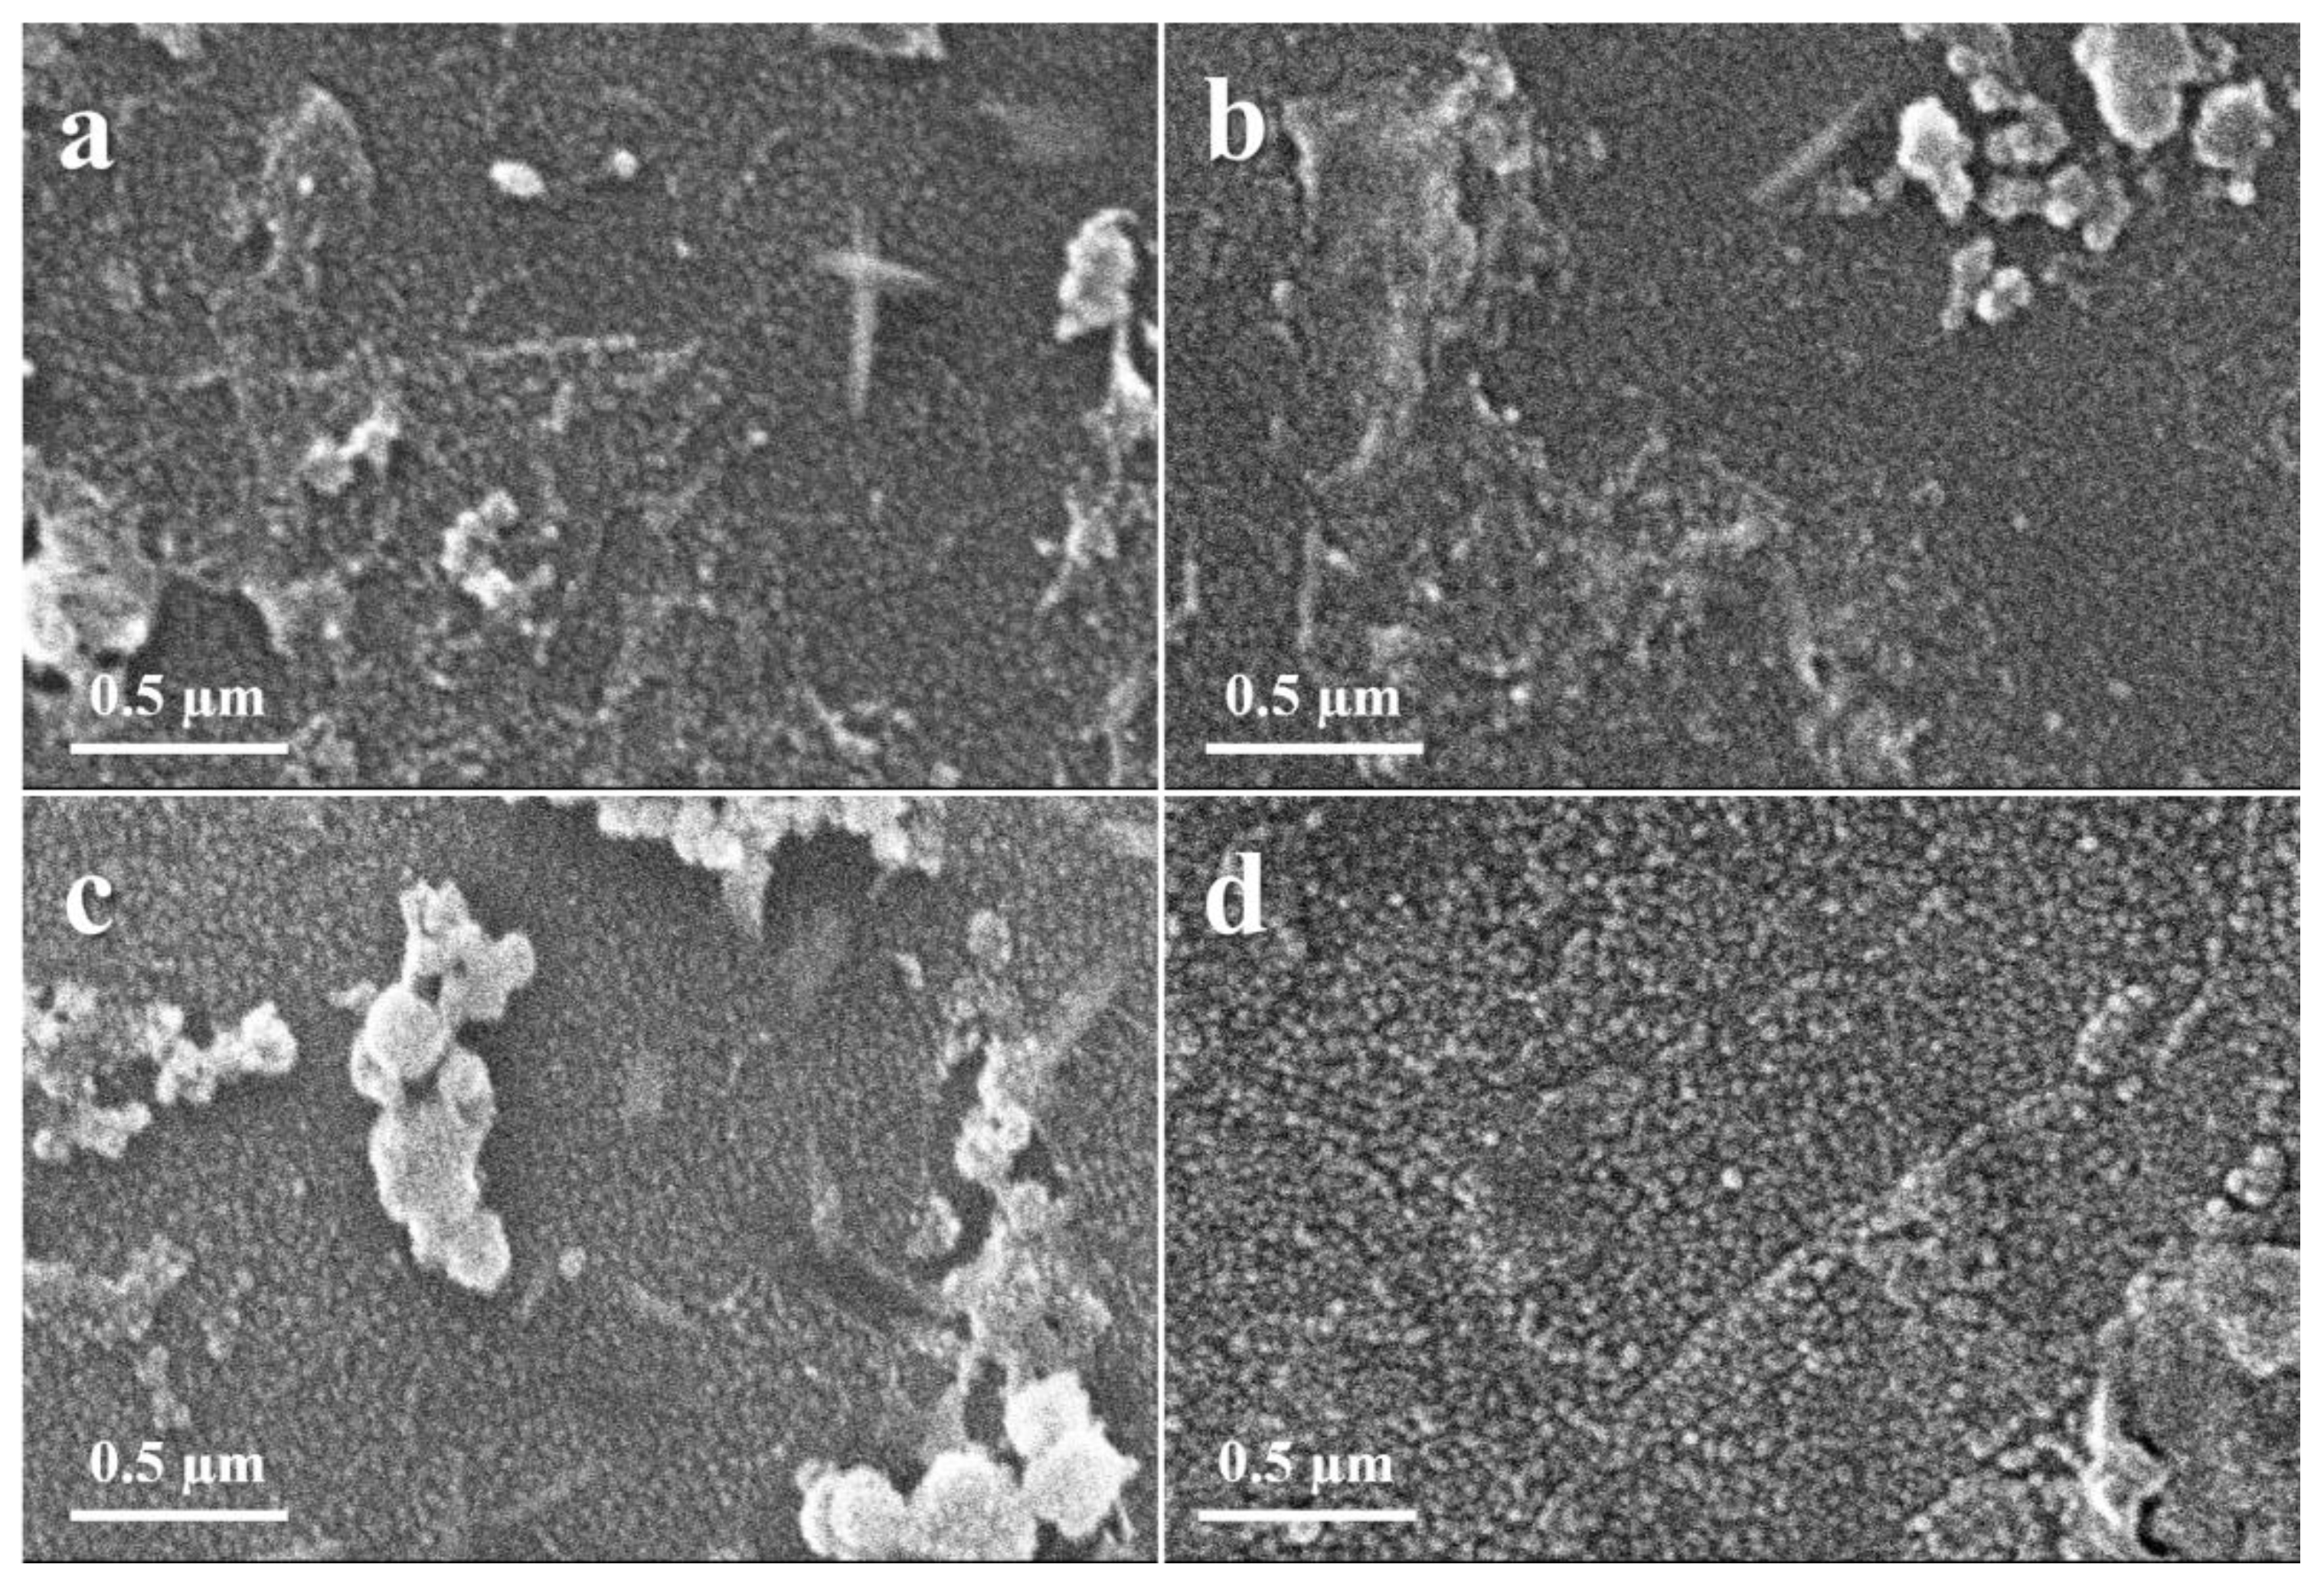
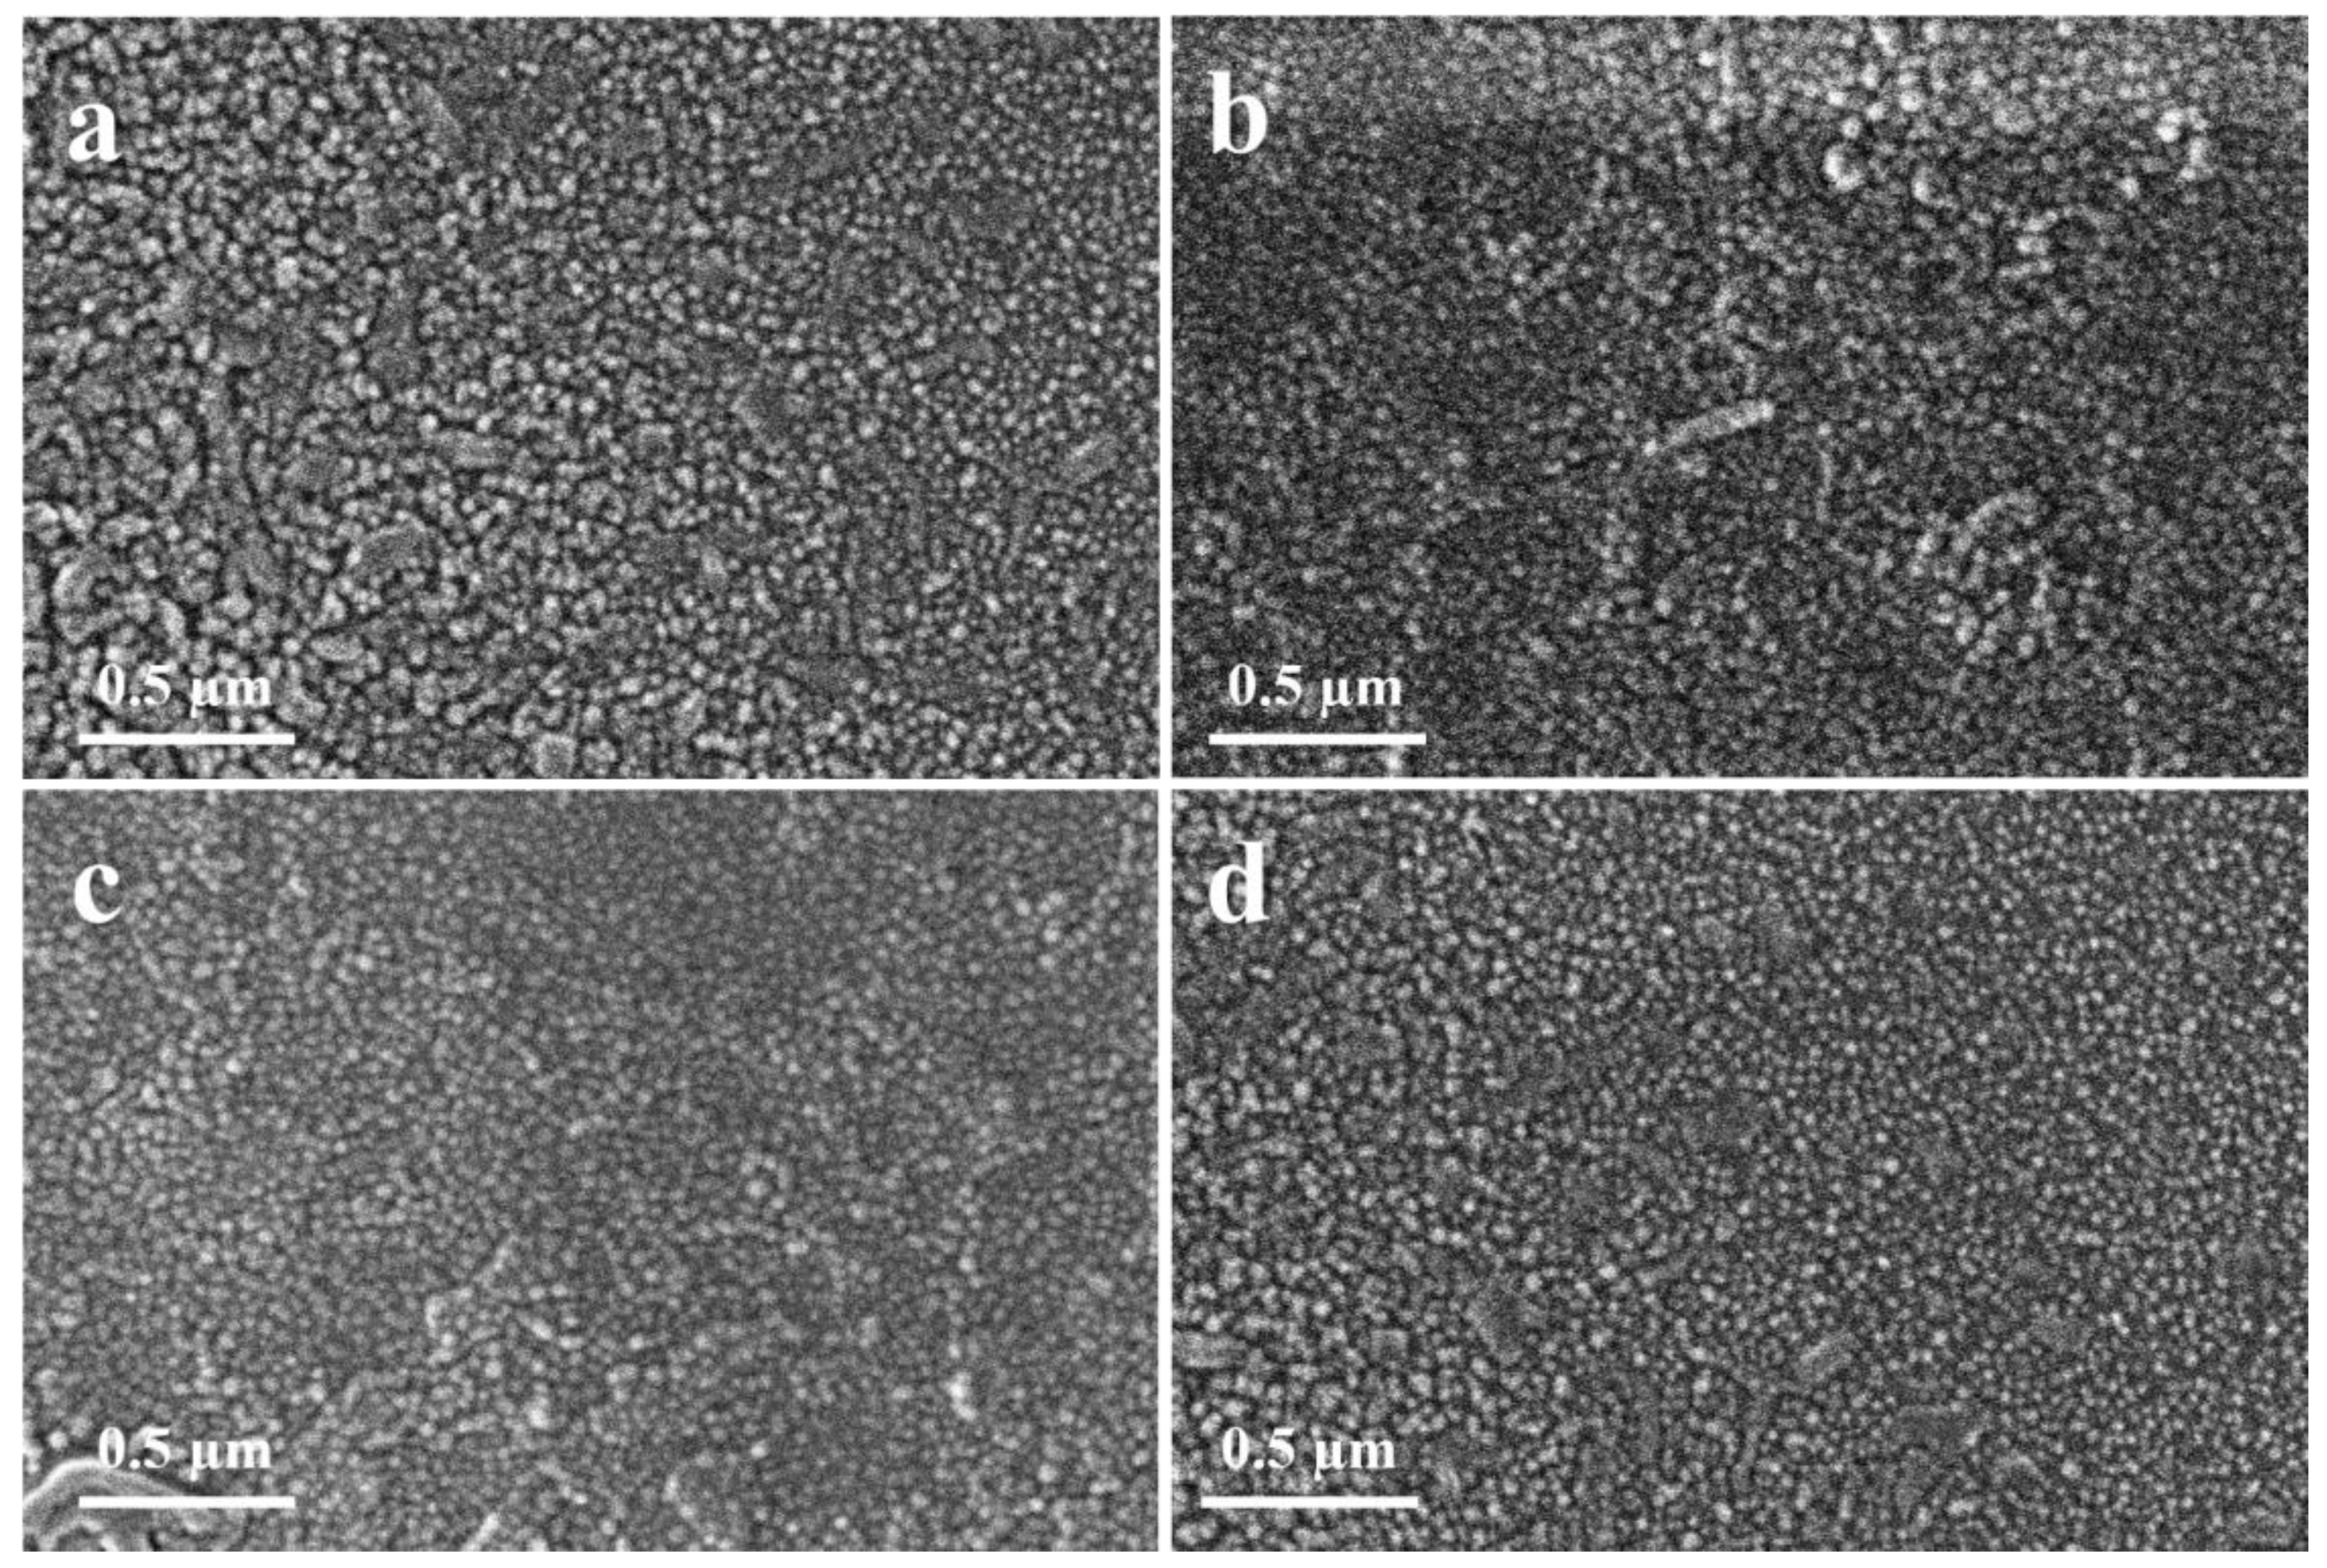
3. Results and Discussion
4. Conclusions
Supplementary Materials
Author Contributions
Funding
Institutional Review Board Statement
Informed Consent Statement
Data Availability Statement
Acknowledgments
Conflicts of Interest
References
- Ganga, G.L.; Nastasi, F.; Campagna, S.; Puntoriero, F. Photoinduced Water Oxidation Sensitized by a Tetranuclear Ru(II) Dendrimer. Dalton Trans. 2009, 45, 9997–9999. [Google Scholar] [CrossRef] [PubMed]
- Parkin, I.P.; Palgrave, R.G. Self-Cleaning Coatings. J. Mater. Chem. 2005, 15, 1689–1695. [Google Scholar] [CrossRef]
- Ragesh, P.; Ganesh, V.A.; Nair, S.V.; Nair, A.S. A Review on ‘Self-Cleaning and Multifunctional Materials’. J. Mater. Chem. A 2014, 2, 14773–14797. [Google Scholar] [CrossRef]
- Gao, N.; Yan, Y. Characterisation of Surface Wettability Based on Nanoparticles. Nanoscale 2012, 4, 2202–2218. [Google Scholar] [CrossRef] [PubMed]
- Midtdal, K.; Jelle, B.P. Self-Cleaning Glazing Products: A State-of-the-Art Review and Future Research Pathways. Sol. Energy Mater. Sol. Cells 2013, 109, 126–141. [Google Scholar] [CrossRef] [Green Version]
- Liang, Z.; Zhao, L.; Meng, W.; Zhong, C.; Wei, S.; Dong, B.; Xu, Z.; Wan, L.; Wang, S. Tungsten-Doped Vanadium Dioxide Thin Films as Smart Windows with Self-Cleaning and Energy-Saving Functions. J. Alloys Compd. 2017, 694, 124–131. [Google Scholar] [CrossRef]
- Kafizas, A.; Kellici, S.; Darr, J.A.; Parkin, I.P. Titanium Dioxide and Composite Metal/Metal Oxide Titania Thin Films on Glass: A Comparative Study of Photocatalytic Activity. J. Photochem. Photobiol. A Chem. 2009, 204, 183–190. [Google Scholar] [CrossRef]
- Baudys, M.; Krýsa, J.; Mills, A. Smart Inks as Photocatalytic Activity Indicators of Self-Cleaning Paints. Catal. Today 2017, 280, 8–13. [Google Scholar] [CrossRef] [Green Version]
- Graziani, L.; Quagliarini, E.; Bondioli, F.; D’Orazio, M. Durability of Self-Cleaning TiO2 Coatings on Fired Clay Brick Façades: Effects of UV Exposure and Wet & Dry Cycles. Build. Environ. 2014, 71, 193–203. [Google Scholar] [CrossRef]
- Erbil, H.Y.; Demirel, A.L.; Avcı, Y.; Mert, O. Transformation of a Simple Plastic into a Superhydrophobic Surface. Science 2003, 299, 1377–1380. [Google Scholar] [CrossRef]
- Sakai, N.; Fujishima, A.; Watanabe, T.; Hashimoto, K. Quantitative Evaluation of the Photoinduced Hydrophilic Conversion Properties of TiO2 Thin Film Surfaces by the Reciprocal of Contact Angle. J. Phys. Chem. B 2003, 107, 1028–1035. [Google Scholar] [CrossRef]
- Sutha, S.; Suresh, S.; Raj, B.; Ravi, K.R. Transparent Alumina Based Superhydrophobic Self–Cleaning Coatings for Solar Cell Cover Glass Applications. Sol. Energy Mater. Sol. Cells 2017, 165, 128–137. [Google Scholar] [CrossRef]
- Diby, N.D.; Wang, J.; Duan, Y. Motion Behaviour of Water-Droplet on Alternate Superhydrophobic/Hydrophilic ZnO Wetting-Patterned Surface. Surf. Eng. 2020, 36, 636–642. [Google Scholar] [CrossRef]
- Soltani, N.; Saion, E.; Hussein, M.Z.; Erfani, M.; Abedini, A.; Bahmanrokh, G.; Navasery, M.; Vaziri, P. Visible Light-Induced Degradation of Methylene Blue in the Presence of Photocatalytic ZnS and CdS Nanoparticles. Int. J. Mol. Sci. 2012, 13, 12242–12258. [Google Scholar] [CrossRef] [PubMed]
- Mote, V.D.; Dargad, J.S.; Dole, B.N. Effect of Mn Doping Concentration on Structural, Morphological and Optical Studies of ZnO Nano-Particles. Nanosci. Nanoeng. 2013, 1, 116–122. [Google Scholar] [CrossRef]
- Intarasuwan, K.; Amornpitoksuk, P.; Suwanboon, S.; Graidist, P. Photocatalytic Dye Degradation by ZnO Nanoparticles Prepared from X2C2O4 (X = H, Na and NH4) and the Cytotoxicity of the Treated Dye Solutions. Sep. Purif. Technol. 2017, 177, 304–312. [Google Scholar] [CrossRef]
- Badawy, M.I.; Mahmoud, F.A.; Abdel-Khalek, A.A.; Gad-Allah, T.A.; Samad, A.A.A. Solar Photocatalytic Activity of Sol–Gel Prepared Ag-Doped ZnO Thin Films. Desalin. Water Treat. 2014, 52, 2601–2608. [Google Scholar] [CrossRef]
- Wang, J.; Li, Y.; Kong, Y.; Zhou, J.; Wu, J.; Wu, X.; Qin, W.; Jiao, Z.; Jiang, L. Non-Fluorinated Superhydrophobic and Micro/Nano Hierarchical Al Doped ZnO Film: The Effect of Al Doping on Morphological and Hydrophobic Properties. RSC Adv. 2015, 5, 81024–81029. [Google Scholar] [CrossRef]
- Sun, J.-H.; Dong, S.-Y.; Wang, Y.-K.; Sun, S.-P. Preparation and Photocatalytic Property of a Novel Dumbbell-Shaped ZnO Microcrystal Photocatalyst. J. Hazard. Mater. 2009, 172, 1520–1526. [Google Scholar] [CrossRef]
- Xie, W.; Li, Y.; Sun, W.; Huang, J.; Xie, H.; Zhao, X. Surface Modification of ZnO with Ag Improves Its Photocatalytic Efficiency and Photostability. J. Photochem. Photobiol. A Chem. 2010, 216, 149–155. [Google Scholar] [CrossRef]
- Trandafilović, L.V.; Jovanović, D.J.; Zhang, X.; Ptasińska, S.; Dramićanin, M.D. Enhanced Photocatalytic Degradation of Methylene Blue and Methyl Orange by ZnO:Eu Nanoparticles. Appl. Catal. B Environ. 2017, 203, 740–752. [Google Scholar] [CrossRef] [Green Version]
- Rahman, A.; Jayaganthan, R.; Jain, R.K.; Chawla, A.K.; Chandra, R.; Ambardar, R. Study of Nanostructured Al Doped ZnO Films. Surf. Eng. 2013, 29, 440–446. [Google Scholar] [CrossRef]
- Akram, M.A.; Javed, S.; Mujahid, M. Synthesis and Surface Modification of ZnO Nanorods Arrays. Adv. Mater. Res. 2015, 1119, 49–53. [Google Scholar] [CrossRef]
- Akram, M.A.; Javed, S.; Xu, J.; Mujahid, M.; Lee, C.-S. Arrays of ZnO/CuInxGa1−xSe2 Nanocables with Tunable Shell Composition for Efficient Photovoltaics. J. Appl. Phys. 2015, 117, 205306. [Google Scholar] [CrossRef]
- Aftab Akram, M.; Javed, S.; Islam, M.; Mujahid, M.; Safdar, A. Arrays of CZTS Sensitized ZnO/ZnS and ZnO/ZnSe Core/Shell Nanorods for Liquid Junction Nanowire Solar Cells. Sol. Energy Mater. Sol. Cells 2016, 146, 121–128. [Google Scholar] [CrossRef]
- Stieberova, B.; Zilka, M.; Ticha, M.; Freiberg, F.; Caramazana-González, P.; McKechnie, J.; Lester, E. Application of ZnO Nanoparticles in a Self-Cleaning Coating on a Metal Panel: An Assessment of Environmental Benefits. ACS Sustain. Chem. Eng. 2017, 5, 2493–2500. [Google Scholar] [CrossRef]
- Kenanakis, G.; Giannakoudakis, Z.; Vernardou, D.; Savvakis, C.; Katsarakis, N. Photocatalytic Degradation of Stearic Acid by ZnO Thin Films and Nanostructures Deposited by Different Chemical Routes. Catal. Today 2010, 151, 34–38. [Google Scholar] [CrossRef]
- Farahani, N.; Kelly, P.J.; West, G.; Ratova, M.; Hill, C.; Vishnyakov, V. Photocatalytic Activity of Reactively Sputtered and Directly Sputtered Titania Coatings. Thin Solid Film. 2011, 520, 1464–1469. [Google Scholar] [CrossRef]
- Dong, B.; Yu, X.; Dong, Z.; Yang, X.; Wu, Y. Facile Synthesis of ZnO Nanoparticles for the Photocatalytic Degradation of Methylene Blue. J. Sol-Gel Sci. Technol. 2017, 82, 167–176. [Google Scholar] [CrossRef]
- Ravichandran, K.; Saravanakumar, K.; Muruganantham, G.; Sakthivel, B. Low Temperature Fabrication of Highly Transparent Conducting SnO2–ZnO Films by Inexpensive, Simplified Spray Technique. Surf. Eng. 2010, 26, 620–622. [Google Scholar] [CrossRef]
- Navidpour, A.H.; Hosseinzadeh, A.; Zhou, J.L.; Huang, Z. Progress in the Application of Surface Engineering Methods in Immobilizing TiO2 and ZnO Coatings for Environmental Photocatalysis. Catal. Rev. Sci. Eng. 2021, 1–52. [Google Scholar] [CrossRef]
- Hunge, Y.M.; Yadav, A.A.; Kulkarni, S.B.; Mathe, V.L. A Multifunctional ZnO Thin Film Based Devices for Photoelectrocatalytic Degradation of Terephthalic Acid and CO2 Gas Sensing Applications. Sens. Actuators B Chem. 2018, 274, 1–9. [Google Scholar] [CrossRef]
- Tarwal, N.L.; Patil, P.S. Superhydrophobic and Transparent ZnO Thin Films Synthesized by Spray Pyrolysis Technique. Appl. Surf. Sci. 2010, 256, 7451–7456. [Google Scholar] [CrossRef]
- Ravichandran, K.; Sindhuja, E.; Uma, R.; Arun, T. Photocatalytic Efficacy of ZnO Films—Light Intensity and Thickness Effects. Surf. Eng. 2017, 33, 512–520. [Google Scholar] [CrossRef]
- Antar, B.; Youcef, B. Facile Synthesis of Spray Pyrolyzed ZnO/NiO Nanocomposites Thin Films. Phosphorus Sulfur Silicon Relat. Elem. 2020, 195, 895–900. [Google Scholar] [CrossRef]
- Islam, M.R.; Azam, M.G. Enhanced Photocatalytic Activity of Mg-Doped ZnO Thin Films Prepared by Sol–Gel Method. Surf. Eng. 2021, 37, 775–783. [Google Scholar] [CrossRef]
- Zirak, M.; Alehdaghi, H.; Shakoori, A.M. Preparation of ZnO-Carbon Quantum Dot Composite Thin Films with Superhydrophilic Surface. Mater. Technol. 2021, 36, 72–80. [Google Scholar] [CrossRef]
- Salam, S.; Islam, M.; Akram, A. Sol–Gel Synthesis of Intrinsic and Aluminum-Doped Zinc Oxide Thin Films as Transparent Conducting Oxides for Thin Film Solar Cells. Thin Solid Film. 2013, 529, 242–247. [Google Scholar] [CrossRef]
- Allah, F.K.; Abé, S.Y.; Núñez, C.M.; Khelil, A.; Cattin, L.; Morsli, M.; Bernède, J.C.; Bougrine, A.; del Valle, M.A.; Díaz, F.R. Characterisation of Porous Doped ZnO Thin Films Deposited by Spray Pyrolysis Technique. Appl. Surf. Sci. 2007, 253, 9241–9247. [Google Scholar] [CrossRef]
- Kalyanasundaram, K. Photochemical Applications of Solar Energy: Photocatalysis and Photodecomposition of Water. In Photochemistry; Royal Society of Chemistry: London, UK, 2013; pp. 182–265. [Google Scholar]
- Dodoo-Arhin, D.; Asiedu, T.; Agyei-Tuffour, B.; Nyankson, E.; Obada, D.; Mwabora, J.M. Photocatalytic Degradation of Rhodamine Dyes Using Zinc Oxide Nanoparticles. Mater. Today Proc. 2021, 38, 809–815. [Google Scholar] [CrossRef]
- Kim, S.K.; Hoffmann-Eifert, S.; Reiners, M.; Waser, R. Relation Between Enhancement in Growth and Thickness-Dependent Crystallization in ALD TiO2 Thin Films. J. Electrochem. Soc. 2010, 158, D6. [Google Scholar] [CrossRef]
- Kozlovskiy, A.; Shlimas, I.; Dukenbayev, K.; Zdorovets, M. Structure and Corrosion Properties of Thin TiO2 Films Obtained by Magnetron Sputtering. Vacuum 2019, 164, 224–232. [Google Scholar] [CrossRef]
- Li, C.; Zhang, J.; Han, J.; Yao, B. A Numerical Solution to the Effects of Surface Roughness on Water–Coal Contact Angle. Sci. Rep. 2021, 11, 459. [Google Scholar] [CrossRef] [PubMed]
- Wang, X.L.; Wang, W.K.; Qu, Z.G.; Ren, G.F.; Wang, H.C. Surface Roughness Dominated Wettability of Carbon Fiber in Gas Diffusion Layer Materials Revealed by Molecular Dynamics Simulations. Int. J. Hydrogen Energy 2021, 46, 26489–26498. [Google Scholar] [CrossRef]
- Shirolkar, M.M.; Phase, D.; Sathe, V.; Rodríguez-Carvajal, J.; Choudhary, R.J.; Kulkarni, S.K. Relation between Crystallinity and Chemical Nature of Surface on Wettability: A Study on Pulsed Laser Deposited TiO2 Thin Films. J. Appl. Phys. 2011, 109, 123512. [Google Scholar] [CrossRef]
- Khan, R.; Riaz, A.; Rabeel, M.; Javed, S.; Jan, R.; Akram, M.A. TiO2@NbSe2 Decorated Nanocomposites for Efficient Visible-Light Photocatalysis. Appl. Nanosci. 2019, 9, 1915–1924. [Google Scholar] [CrossRef]
- Riaz, A.; Ashraf, A.; Taimoor, H.; Javed, S.; Akram, M.A.; Islam, M.; Mujahid, M.; Ahmad, I.; Saeed, K. Photocatalytic and Photostability Behavior of Ag- and/or Al-Doped ZnO Films in Methylene Blue and Rhodamine B under UV-C Irradiation. Coatings 2019, 9, 202. [Google Scholar] [CrossRef] [Green Version]


| Sample Name (ZnO) | Temperature | Distance | Volume |
|---|---|---|---|
| 1 mL 20 d-RT | Room Temperature | 20 cm | 1 mL |
| 1 mL 20 d-HT | 250 °C | 20 cm | 1 mL |
| 1 mL 30 d-RT | Room Temperature | 30 cm | 1 mL |
| 1 mL 30 d-HT | 250 °C | 30 cm | 1 mL |
| 2 mL 20 d-RT | Room Temperature | 20 cm | 2 mL |
| 2 mL 20 d-HT | 250 °C | 20 cm | 2 mL |
| 2 mL 30 d-RT | Room Temperature | 30 cm | 2 mL |
| 2 mL 30 d-HT | 250 °C | 30 cm | 2 mL |
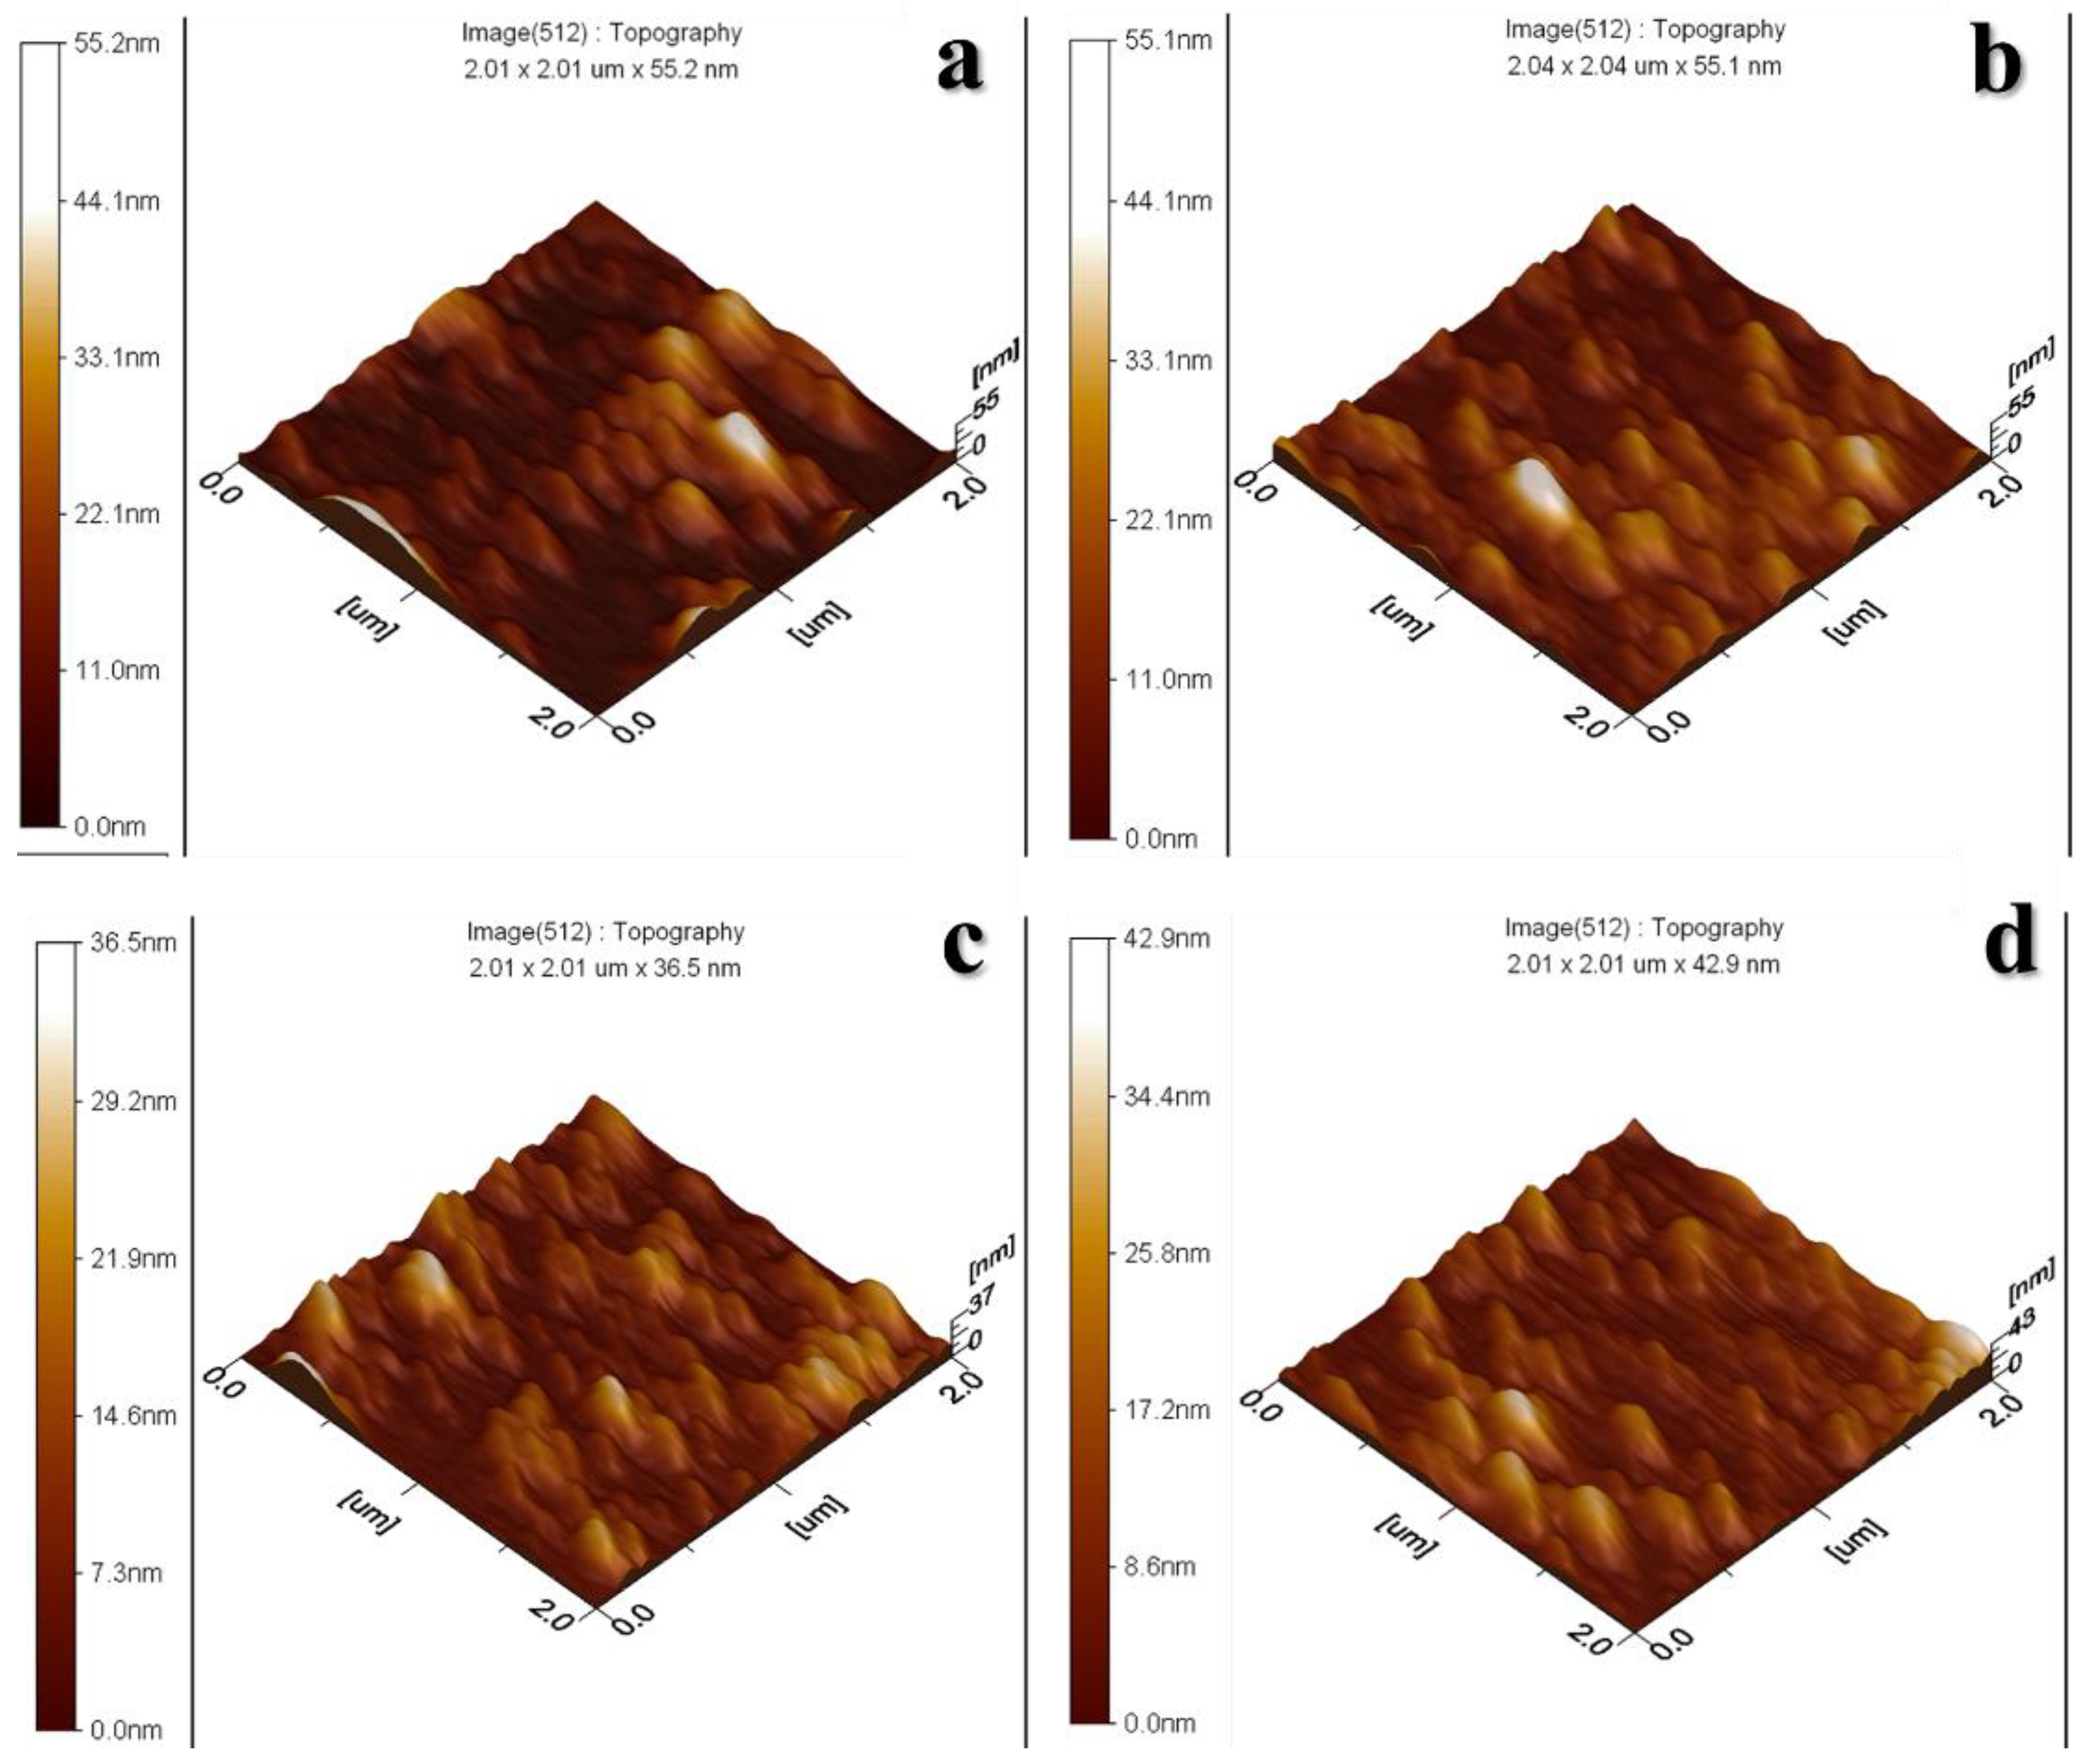
| Samples Name (ZnO) | Rq (nm) |
|---|---|
| 1 mL 20 d-RT | 9.52 ± 0.97 |
| 1 mL 20 d-HT | 6.90 ± 0.72 |
| 1 mL 30 d-RT | 8.00 ± 0.71 |
| 1 mL 30 d-HT | 7.58 ± 0.68 |
| 2 mL 20 d-RT | 9.44 ± 1.08 |
| 2 mL 20 d-HT | 6.68 ± 0.62 |
| 2 mL 30 d-RT | 8.47 ± 0.90 |
| 2 mL 30 d-HT | 7.25 ± 0.74 |
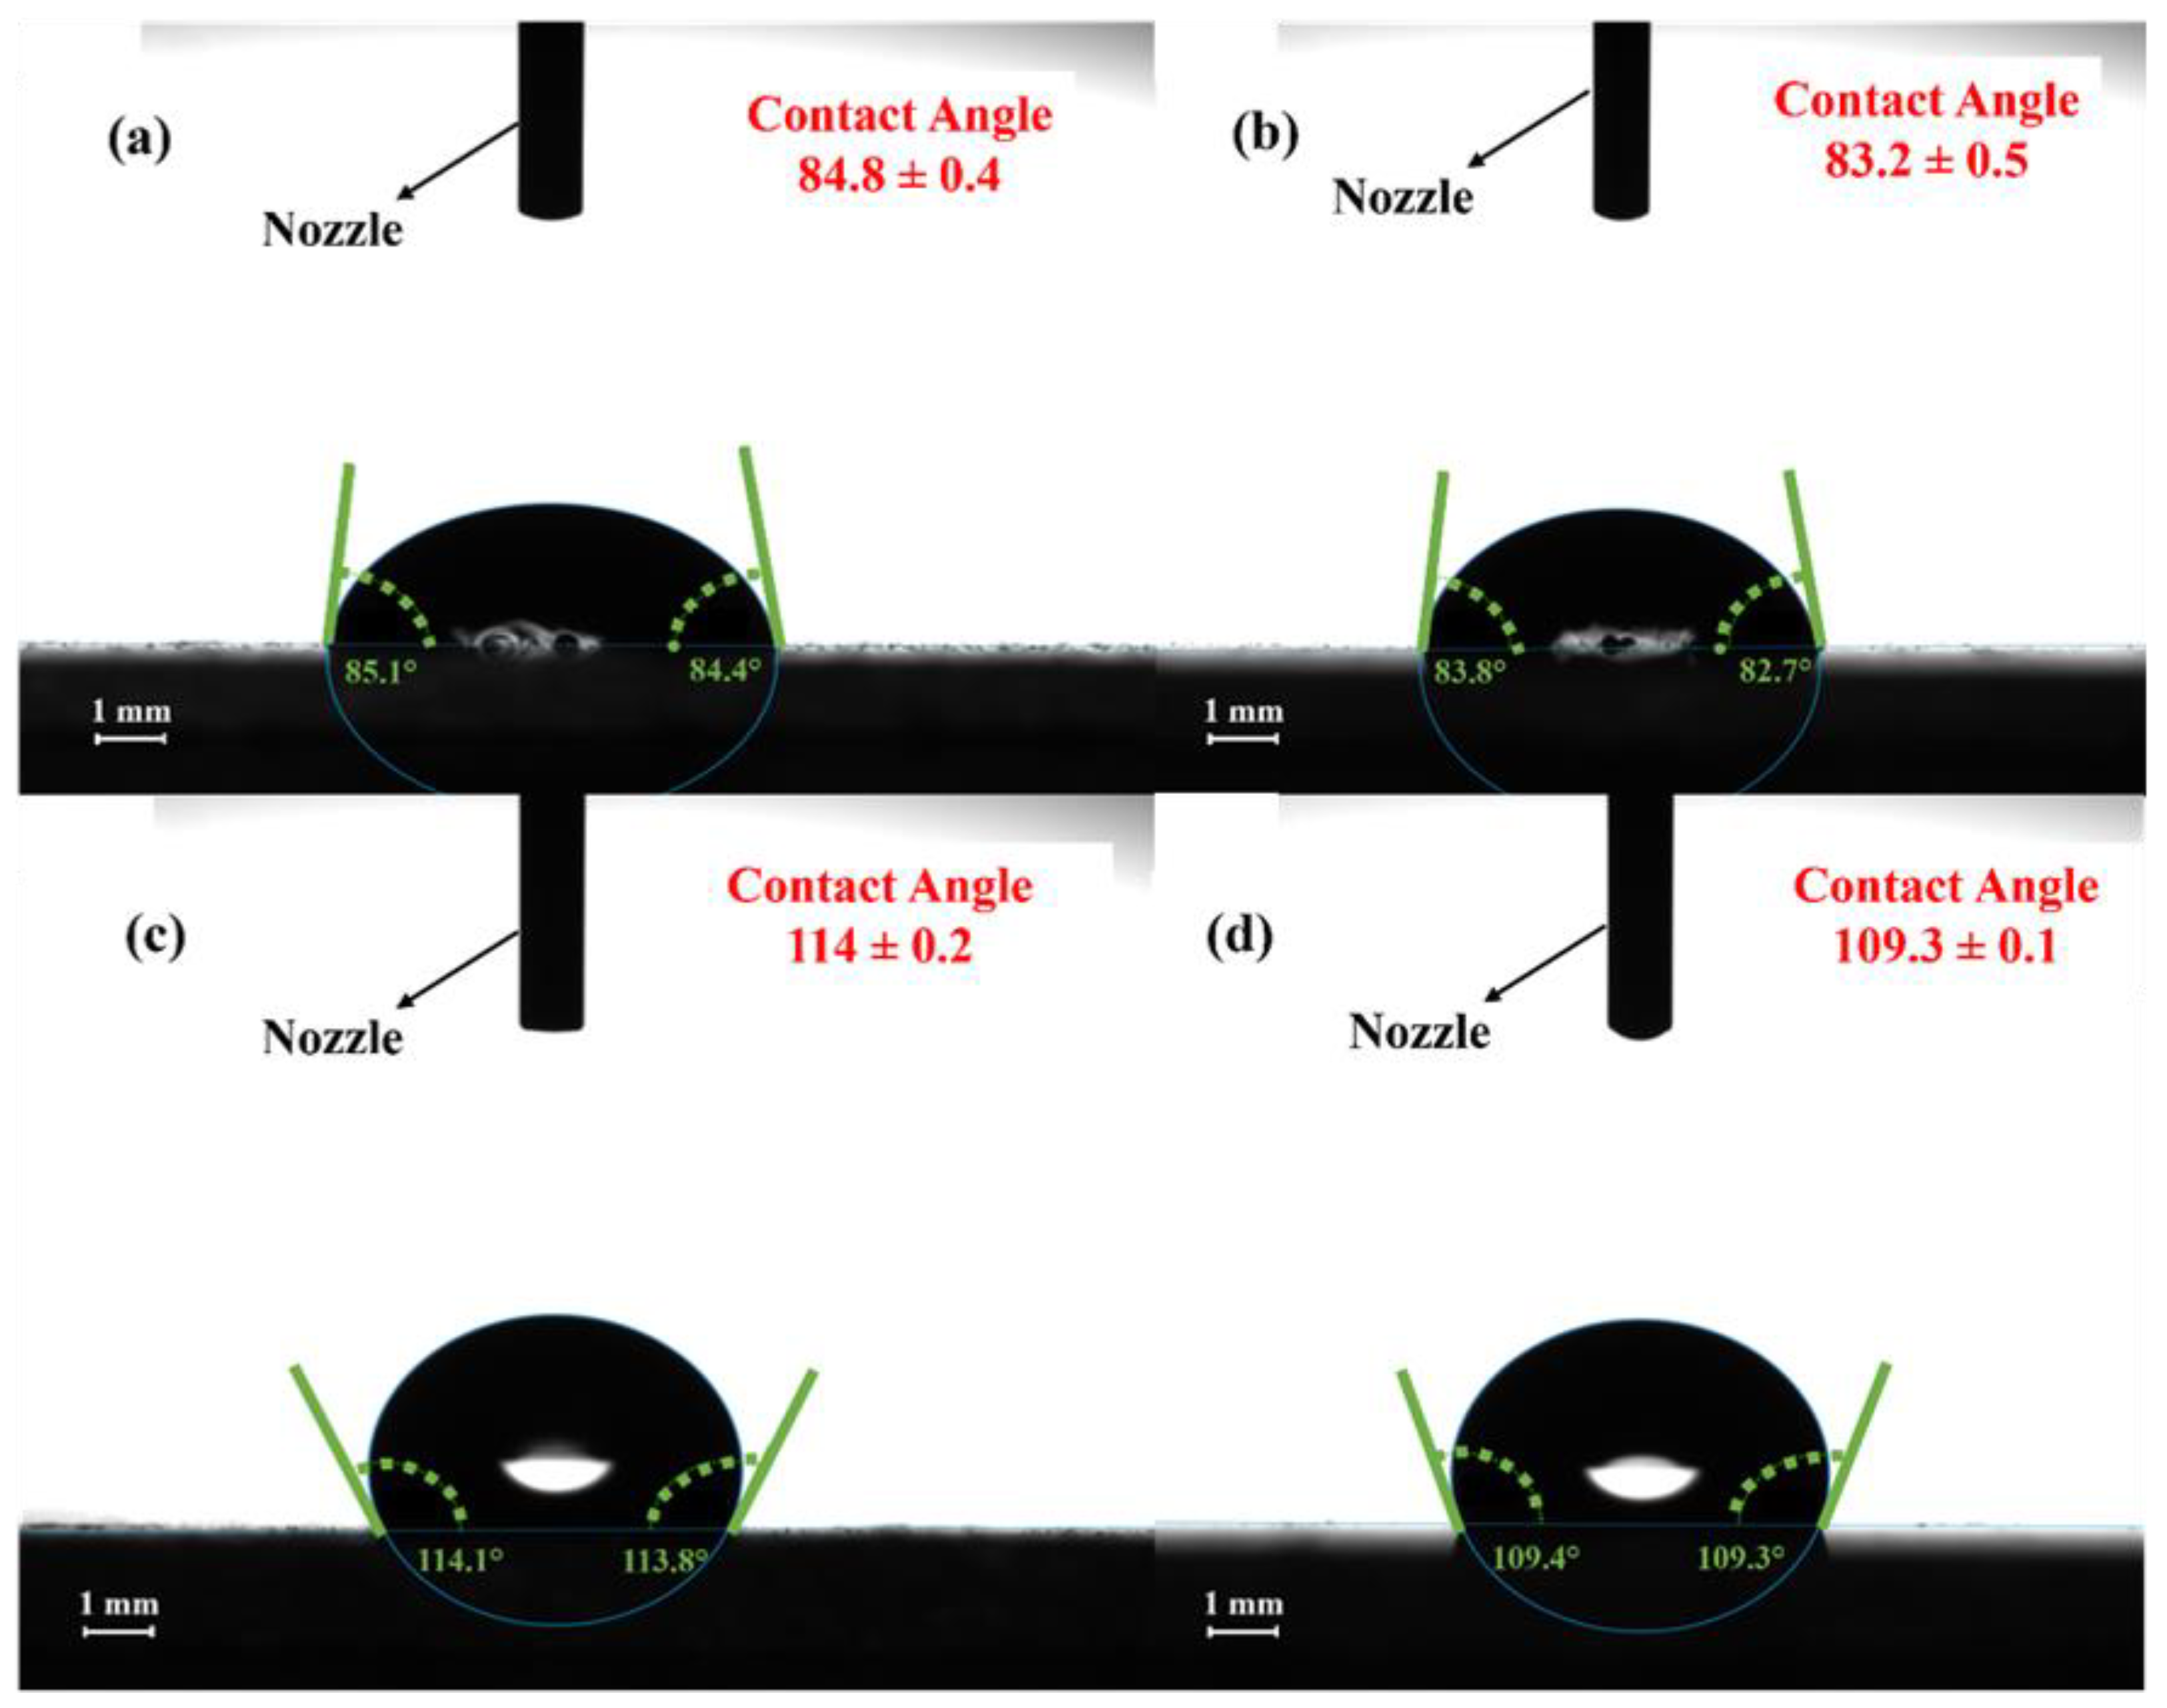
| Sample Name (ZnO) | Contact Angle |
|---|---|
| 1 mL 20 d-RT | 74.5° |
| 1 mL 20 d-HT | 108° |
| 1 mL 30 d-RT | 67° |
| 1 mL 30 d-HT | 102° |
| 2 mL 20 d-RT | 85° |
| 2 mL 20 d-HT | 114° |
| 2 mL 30 d-RT | 83° |
| 2 mL 30 d-HT | 109° |
Publisher’s Note: MDPI stays neutral with regard to jurisdictional claims in published maps and institutional affiliations. |
© 2022 by the authors. Licensee MDPI, Basel, Switzerland. This article is an open access article distributed under the terms and conditions of the Creative Commons Attribution (CC BY) license (https://creativecommons.org/licenses/by/4.0/).
Share and Cite
Rabeel, M.; Javed, S.; Khan, R.; Akram, M.A.; Rehman, S.; Kim, D.-k.; Khan, M.F. Controlling the Wettability of ZnO Thin Films by Spray Pyrolysis for Photocatalytic Applications. Materials 2022, 15, 3364. https://doi.org/10.3390/ma15093364
Rabeel M, Javed S, Khan R, Akram MA, Rehman S, Kim D-k, Khan MF. Controlling the Wettability of ZnO Thin Films by Spray Pyrolysis for Photocatalytic Applications. Materials. 2022; 15(9):3364. https://doi.org/10.3390/ma15093364
Chicago/Turabian StyleRabeel, Muhammad, Sofia Javed, Ramsha Khan, Muhammad Aftab Akram, Shania Rehman, Deok-kee Kim, and Muhammad Farooq Khan. 2022. "Controlling the Wettability of ZnO Thin Films by Spray Pyrolysis for Photocatalytic Applications" Materials 15, no. 9: 3364. https://doi.org/10.3390/ma15093364