Article

Characteristics of Methyl Cellulose Based Solid Polymer Electrolyte Inserted with Potassium Thiocyanate as K+ Cation Provider: Structural and Electrical Studies

by
Shujahadeen B. Aziz
1,2,*,
Elham M. A. Dannoun
3,
Ari A. Abdalrahman
1,
Rebar T. Abdulwahid
1,4,
Sameerah I. Al-Saeedi
5,
Mohamad A. Brza
6,
Muaffaq M. Nofal
7,
Ranjdar M. Abdullah
1,
Jihad M. Hadi
8 and
Wrya O. Karim
9
1
Hameed Majid Advanced Polymeric Materials Research Laboratory, Physics Department, College of Science, University of Sulaimani, Qlyasan Street, Kurdistan Regional Government, Sulaimani 46001, Iraq
2
The Development Center for Research and Training (DCRT), University of Human Development, Sulaimani 46001, Iraq
3
Associate Chair of the Department of Mathematics and Science, Woman Campus, Prince Sultan University, P.O. Box 66833, Riyadh 11586, Saudi Arabia
4
Department of Physics, College of Education, University of Sulaimani, Old Campus, Sulaimani 46001, Iraq
5
Department of Chemistry, College of Science, Princess Nourah bint Abdulrahman University, P.O. Box 84428, Riyadh 11671, Saudi Arabia
6
Medical Physics Department, College of Medicals and Applied Science, Charmo University, Sulaimani 46023, Iraq
7
Department of Mathematics and Science, Prince Sultan University, P.O. Box 66833, Riyadh 11586, Saudi Arabia
8
Nursing Department, College of Nursing, University of Human Development, Kurdistan Regional Government, Sulaimani 46001, Iraq
9
Department of Chemistry, College of Science, University of Sulaimani, Qlyasan Street, Kurdistan Regional Government, Sulaimani 46001, Iraq
*
Author to whom correspondence should be addressed.
Materials 2022, 15(16), 5579; https://doi.org/10.3390/ma15165579
Submission received: 21 July 2022 / Revised: 10 August 2022 / Accepted: 11 August 2022 / Published: 14 August 2022
(This article belongs to the Special Issue Nanostructured Materials for Energy Applications)

Abstract

:
The attention to a stable and ionic conductive electrolyte is driven by the limitations of liquid electrolytes, particularly evaporation and leakage, which restrain their widespread use for electrochemical device applications. Solid polymer electrolyte (SPE) is considered to be a potential alternative since it possesses high safety compared to its counterparts. However, it still suffers from low device efficiency due to an incomplete understanding of the mechanism of ion transport parameters. Here, we present a simple in situ solution casting method for the production of polymer-based electrolytes using abundantly available methylcellulose (MC) doped at different weight percentages of potassium thiocyanate (KSCN) salt. Fourier transform infrared (FTIR), and electrochemical impedance spectroscopy (EIS) methods were used to characterize the prepared samples. Based on EIS simulation and FTIR deconvolution associated with the SCN anion peak, various ion transport parameters were determined. The host MC medium and KSCN salt have a strong interaction, which was evident from both peak shifting and intensity alteration of FTIR spectra. From the EIS modeling, desired electric circuits correlated with ion movement and chain polarization were drawn. The highest ionic conductivity of 1.54 × 10⁻⁷ S cm−1 is determined from the fitted EIS curve for the film doped with 30 wt.% of KSCN salt. From the FTIR deconvoluted peak, free ions, ions in contact with one another, and ion aggregates were separated. The extracted ion transport parameters from the EIS method and FTIR spectra of the SCN anion band confirm that both increased carrier concentration and their mobility were crucial in improving the overall conductivity of the electrolyte. The dielectric investigations were further used to understand the conductivity of the films. High dielectric constants were observed at low frequencies for all MC:KSCN systems. The dispersion with a high dielectric constant in the low-frequency band is ascribed to the dielectric polarization. The wide shift of M″ peak towards the high frequency was evidenced by the MC-based electrolyte impregnated with 30 wt.% of KSCN salt, revealing the improved ionic movement assisted with chain segmental motion. The AC conductivity pattern was influenced by salt concentration.

1. Introduction

Recently, the design of emerging clean and renewable energy, and its related technology breakthroughs have gained interest due to the widespread use of fossil fuel, the restrictions of a global society on carbon dioxide emissions, and the cost of crude oil. The development of lithium metal-based devices has attracted a lot of attention, signifying their enormous potential as power sources. However, despite its high-energy density and wide range of applications, there are still many problems that impact its performance, rate capability, safety, and cost [1,2,3].
Many attempts have been made to utilize benign and harmless electrolytes in energy storage devices. However, it is hard to achieve satisfactory devices with suitable sizes and shapes that compete with liquid electrolytes [3,4]. Therefore, researchers have to think about safe, efficient, and relatively stable solid polymer electrolytes (SPEs). SPEs have several properties, including lightweight, satisfactory thermal stability, high flexibility, low cost, ease of handling, and harmlessness [5,6]. A dye-sensitized solar cell, a battery, a supercapacitor, an electrochemical double-layer capacitor (EDLC), and a fuel cell are just a few examples of electrochemical devices in which the cells typically consist of an electrolyte and two electrodes. The electrolyte plays at the heart of the cells in the electrochemical devices [7,8,9,10,11,12]. Polymer electrolytes (PEs) have been the subject of intensive research in an effort to develop systems with good thermal, electrical, electrochemical, and mechanical properties that are also inexpensive and environmentally friendly [7,13,14]. However, the SPEs are not free from drawbacks, the most common one is the low ionic conductivity [15].
Global warming and water contamination are two of the negative effects of discharging plastic garbage into the environment. These two problems raise the awareness and motivation of researchers to investigate biodegradable and biocompatible polymers [16,17]. Natural polymers are attracting the attention of researchers due to their abundance, cost-effectiveness, biodegradability, and biocompatibility [18,19]. In other words, green or natural biopolymers degrade gradually in contrast to synthetic or human-made polymers [20,21]. As a host natural polymer, SPE-based polymers have been investigated previously, such as chitosan [22], starch [23], and poly(vinyl alcohol) (PVA) [24]. Excellent chemical, physical, and relative ionic conductivity combine to produce these natural polymers’ remarkable performance [25]. Additionally, natural polymers are renewable, inexpensive, abundant, nontoxic, biodegradable, and biocompatible [26,27].
Natural polymers such as cellulose in their neat state are insoluble in water [28,29]. Thus, modification of cellulose is necessary to solubilize it in aqueous media. Herein, the incorporation of methyl chloride into the cellulose (methylation) results in the formation of methyl cellulose (MC). This modification of cellulose by methylation is not expensive and eco-friendly, in addition to its ability to form a film. Furthermore, MC has transparency as well as convincing mechanical and electrical properties [30,31].
Cations usually interact with oxygen bound within the backbone of MC via a dative bond. MC has many functional groups rich in lone pair electrons, including C-O-C, O-H, and O-CH3, which are responsible for the conduction of ions [32]. The MC is well-known as an amorphous polymer, possessing Tg, in the range of 184–200 °C [33]. MC was chosen as the host polymer in this study because its properties change when KSCN is added at different concentrations. In addition, the system becomes an ionic conducting phase beyond dissolving salts in a high molecular weight host matrix. From an atomic level perspective, the local relaxation in high molecular weight polymer provides degrees of freedom as such in liquids, in addition to cordial. Furthermore, the mentioned polymer system also provides a compatible interface with electrode materials [34].
The σdc of 9.334 × 10⁻⁵ S/cm was recorded by Mallaiah et al. for the PEO:PVdF:NaNO3 system [35]. Moreover, the σdc of 6.34 × 10⁻⁷ S/cm has been documented for blended CS with starch doped with NH4NO3 SPEs [36]. Importantly, insertion of 10 wt.% of AgTf salt into CS with recording 4.2 × 10⁻⁸ S/cm ionic conductivity [37]. The MC:PVA system has an ionic conductivity of 1.53 × 10⁻⁵ S/cm when 50% of sodium iodide (NaI) is loaded into it [38]. Despite the host polymer enriching in functional groups, the absence of free ion carriers results in weak conduction. Thus, choosing a suitable dopant salt for the polymeric host medium is decisive. Several characteristics, such as lattice energy of the salt, cation size, ion concentration, and mobility have to be taken into consideration in enhancing the ionic conductivity of the SPE [39,40,41,42]. While lithium-based salts have a higher lattice energy than potassium thiocyanate (KSCN) salts (616 kJ/mol); K-salts are safer [43,44]. The dielectric constant of the polymer host and the rate at which ions aggregate appear to be important determinants of ionic conduction as a parameter for evaluating the effectiveness of an SPE [45,46]. Thus, to fully understand how ions interact with polymers between molecules and how ions move through SPE, it is important to look at the dielectric properties of the host polymer [47,48].
An SPE based on MC polymer with various amounts of KSCN dopant salt will be synthesized using the solution casting process, which is being used in this study. Analysis of the blended polymer was carried out utilizing FTIR and electrochemical impedance spectroscopy (EIS). Free ion concentration and its effect on ion conductivity are hotly debated issues. Additional characterization and analysis are carried out to better understand how salt’s ionic charge carriers interact with the polymer’s polar functional groups. For example, deconvoluted FTIR was utilized to categorize aggregated and free ions inside the polymer host. Using EIS and EEC modeling, the circuit architecture for each MC electrolyte will be shown. Then, it will be used to figure out the conductivity of ions by measuring the bulk resistance in circuit designs.

2. Materials and Methods

2.1. SPE Preparation

MC polymer and KSCN were purchased from Sigma-Aldrich and used as received without purification. The solution cast process was used to insert a range of quantities of KSCN into the MC polymer matrix. The first solution was made by dissolving 1 g of MC in 100 mL of 1% acetic acid and stirring with a magnetic stirrer until a homogeneous aqueous solution was achieved. The SPEs are prepared by adding various amounts of KSCN salt into the MC solution separately and stirred for 24 h to gain a fully dissolved salt and homogenous solution. The samples were coded as MCK1, MCK2, MCK3, MCK4, and MCK5 for the inclusion of 10, 20, 30, 40, and 50 wt.% of KSCN salt. Afterward, the samples were cast into dry, clean, labeled Petri dishes and left for 14 days for the films to form at ambient temperature with 20% relative humidity. To ensure the complete dryness of the films, a further drying process was carried out by putting the samples in a desiccator filled with silica gel. Ultimately, a uniform solvent free of ~ 0.026 cm thick SPEs films was achieved and ready to be characterized.

2.2. Electrical Impedance Spectroscopy (EIS)

Solid-state materials can be examined by utilizing complex impedance spectroscopy (CIS) in order to better understand their electrochemical properties [49]. Materials’ electrical characteristics and their relationship to electrodes with electronic conductivity are better understood using CIS. The SPE films were prepared by cutting them into tiny discs (1 cm in radius), in which a spring was used to compress the electrolyte between two stainless steel electrodes. The HIOKI 3531 Z Hi-tester employed for the impedance to be achieved. The room temperature and from 100 Hz to 2 MHz the frequency ranged when the device is linked to the computer. In order to obtain the real and imaginary components of impedance, we used software to control all measurements and computations. The bulk resistance was determined by plotting the actual impedance axis with the intercept of the plot. The equation for calculating conductivity is presented below [50]:
σ D C = 1 R b × t A
where, A is the film’s area, whereas t is its thickness. The measurements of EIS were made from a cell consisting of stainless steel SS |SPE film| SS as explained in Figure 1.
The real and imaginary components of permittivity ( ε * ) and modulus ( M * ) can be calculated from the complex impedance ( Z * ) using the following equations [51,52,53].
Z * = Z j Z
ε * = ε j ε = 1 j ω ε o Z *
M * = 1 ε * = j ω C o Z * = M + j M
From Equations (2)–(4) the following relationships can be achieved,
ε = Z C o ω Z 2 + Z 2
M = ε ( ε 2 + ε 2 ) = C o ω   Z
M = ε ε 2 + ε 2 = C o ω Z
where ε , and ε as usual are the dielectric constant, and dielectric loss, Co is the vacuum capacitance ( ε o A/t). The real part and imaginary part of the complex electric modulus are denoted by M′ and M″, respectively. The angular frequency ω is equal to (2πf), with f representing applied field frequency.

2.3. Fourier Transform Infrared (FTIR) Spectroscopy

In this study, the complexation between the components of the SPE systems was confirmed using FTIR spectroscopy. FTIR spectra of the films were acquired using a Perkin Elmer Spotlight 400 spectrometer (Waltham, MA, USA) in the wavenumber range (400–4000 cm−1) at a resolution of 1 cm−1. Both the Gaussian–Lorentzian function and the deconvolution method were employed to extract the overlapping peaks and fit the curves from which ion transport parameters were determined.

3. Results and Discussion

3.1. Impedance Analysis
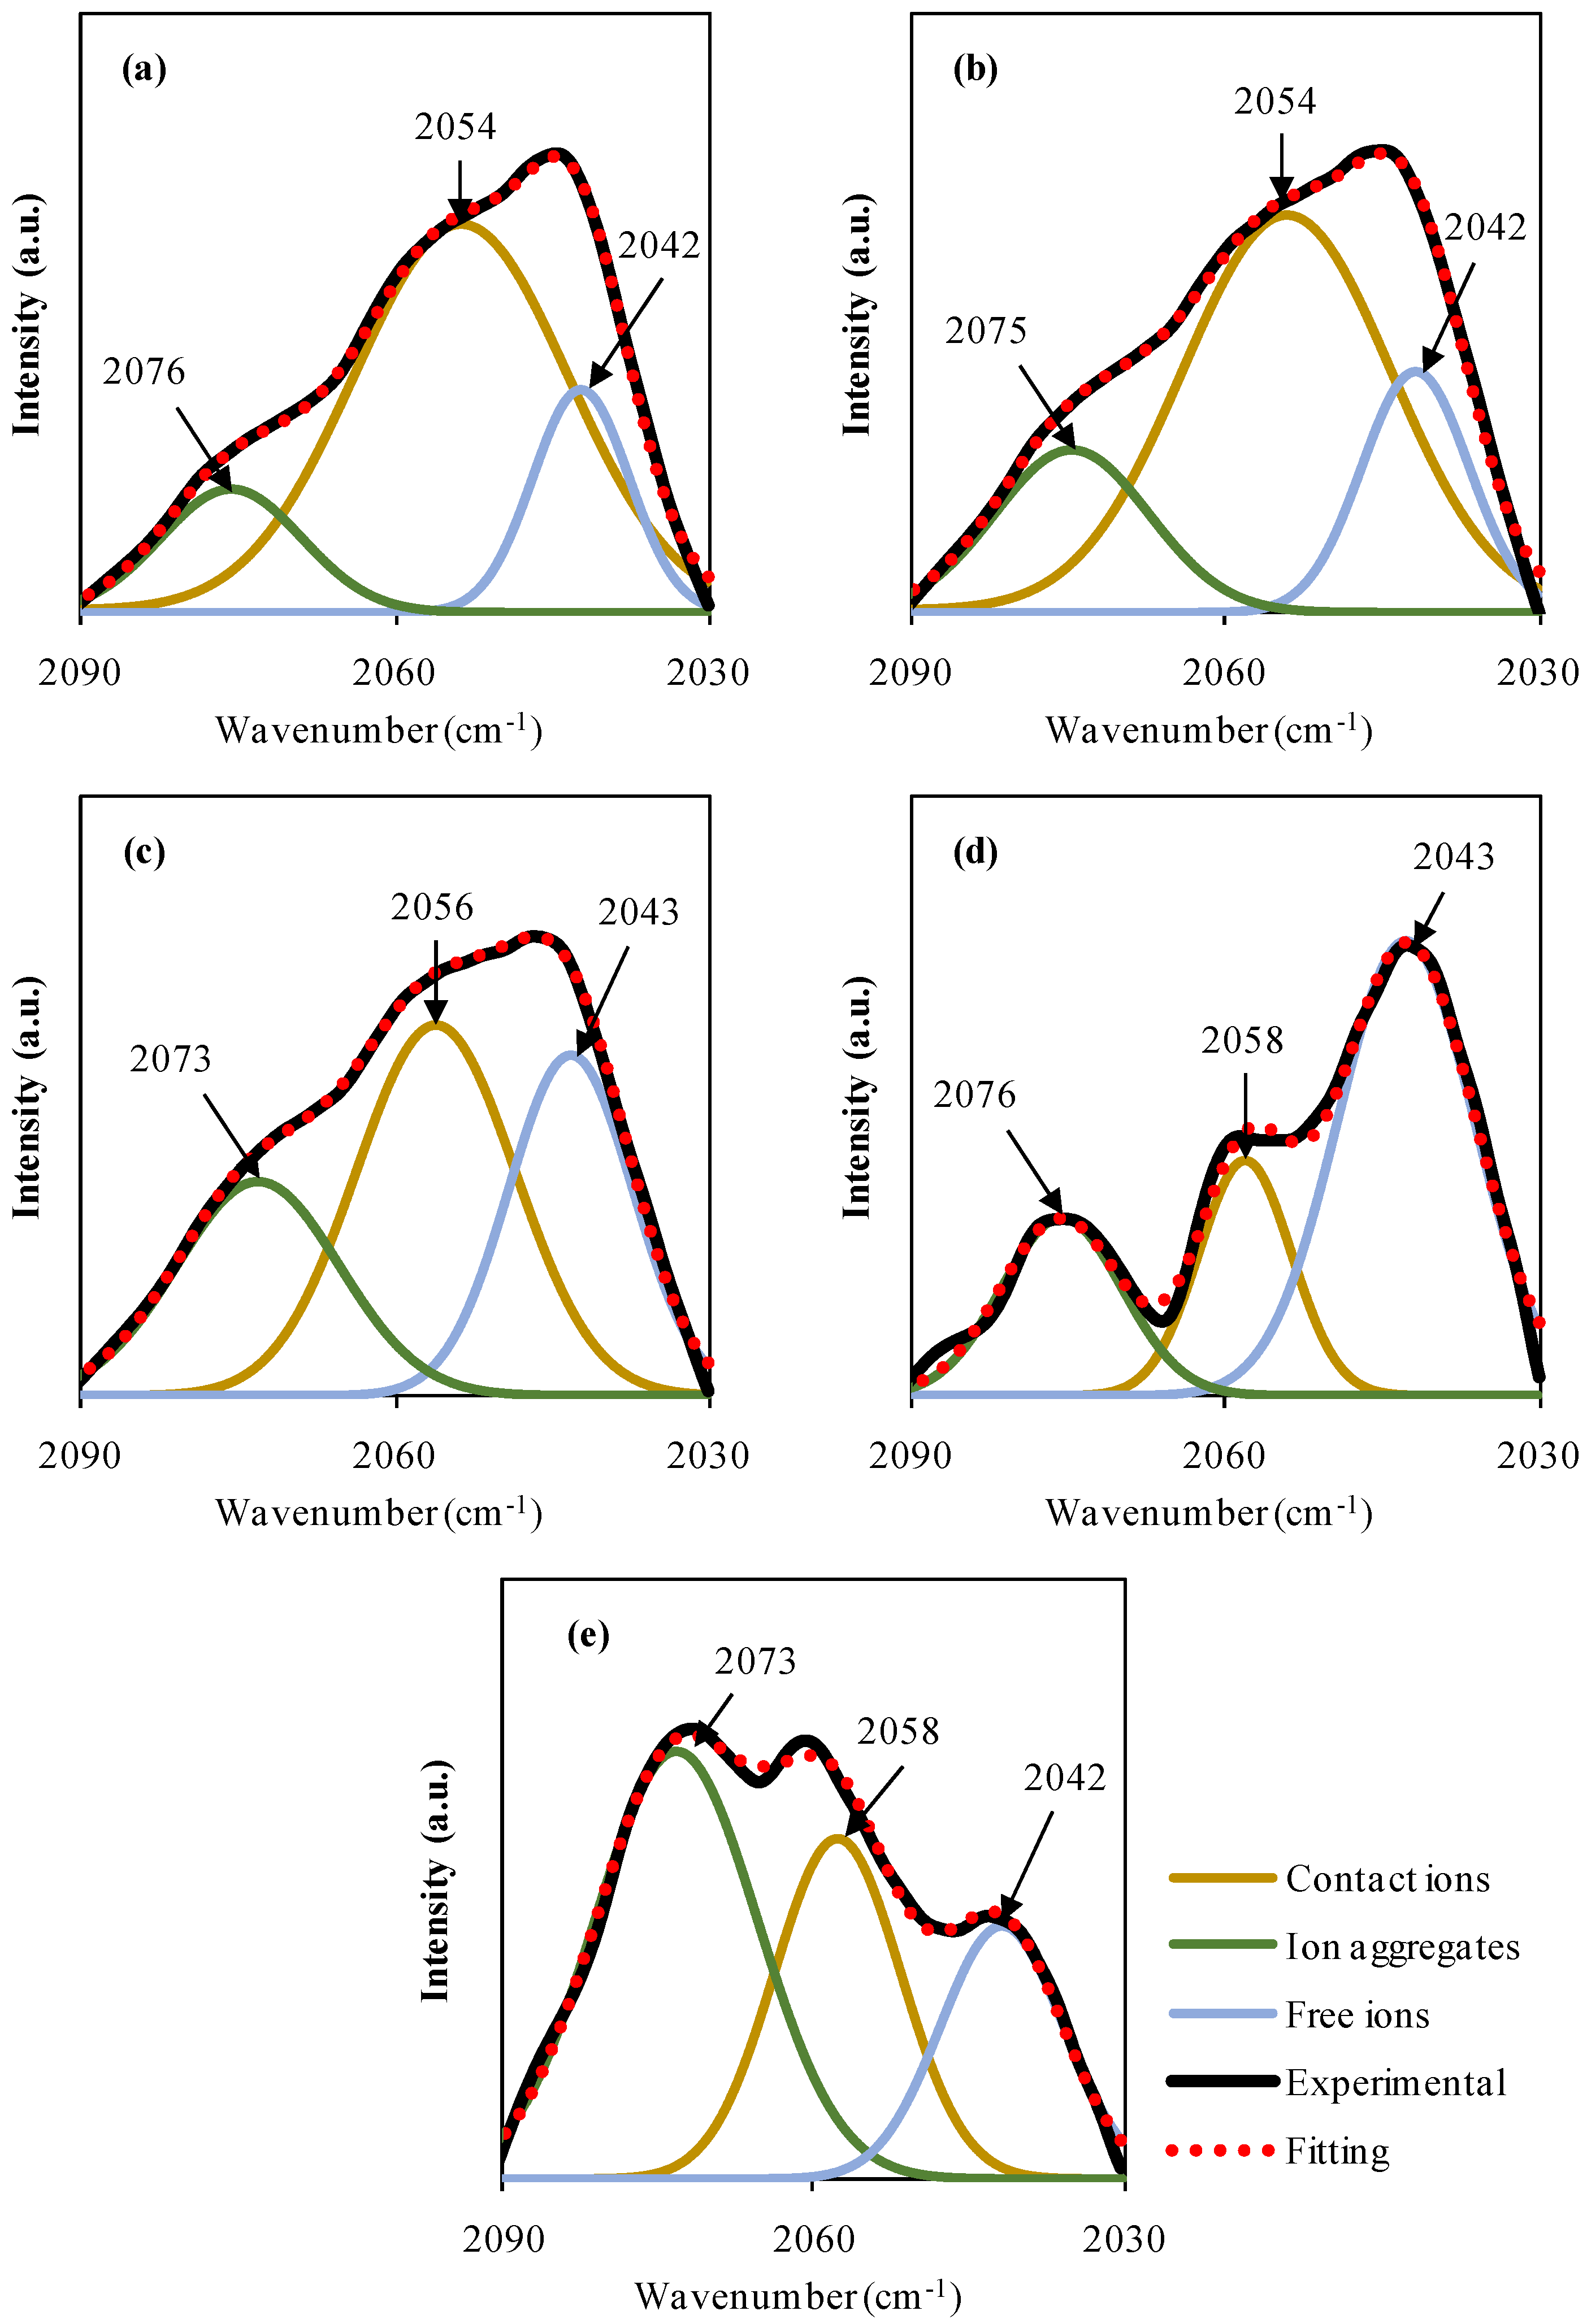
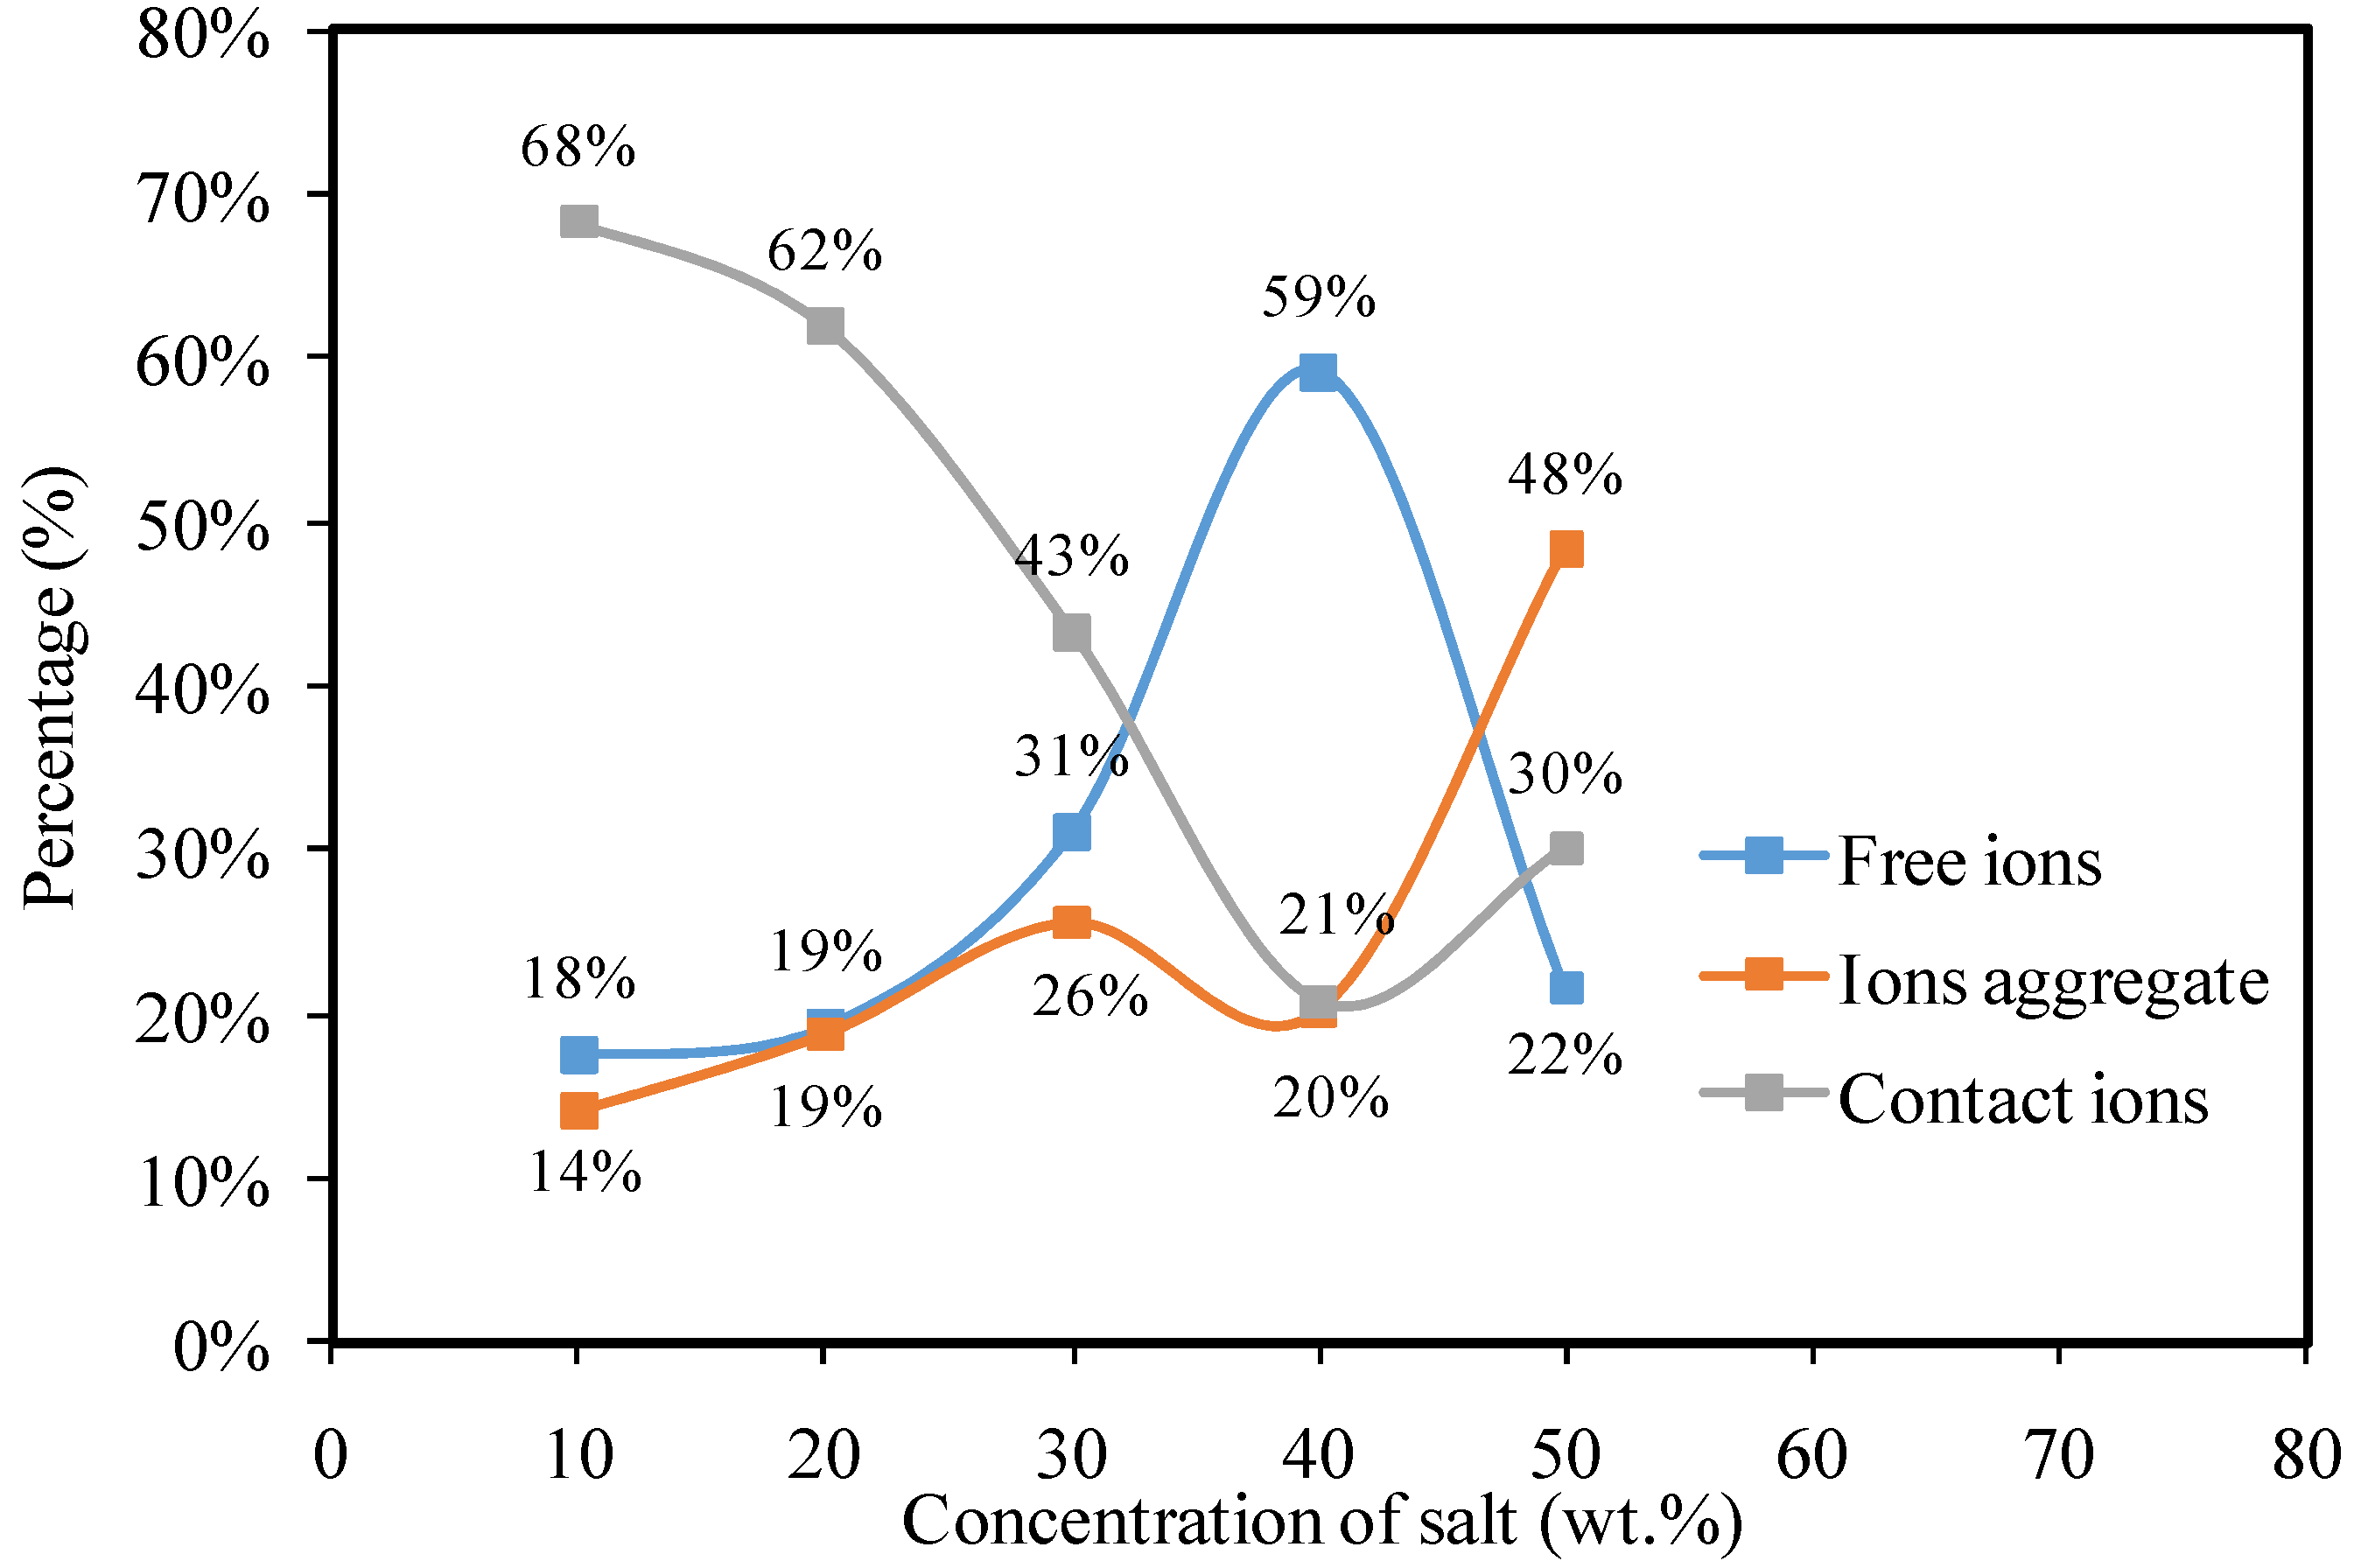
Ion dynamics in PE systems can be well characterized using impedance spectroscopy. The outcomes of the impedance of the present SPE were used to have a comprehensive understanding of the electrolyte conductivity and its frequency behavior. Both MCK1- and MCK2-based polymer electrolytes have the Cole-Cole plots (Nyquist plots) at room temperature as exhibited in Figure 2a,b in which a semicircle is seen only. A high-frequency semi-circle and a low-frequency spike are frequently observed when the salt concentration is high Figure 2c,d. Bulk resistance (resulting from ion mobility) and bulk capacitance originating from immobile polymer chains are combined to generate a high-frequency semi-circle [51]. The size of the high-frequency semi-circle decreased considerably as KSCN concentrations climbed. The emergence of a spike from 30 wt.% to 50 wt.% of KSCN demonstrates an increase in conductivity [54,55]. The spike length is reduced at 40 and 50 wt.% of KSCN salt, indicating a reduction in conductivity. Calculating bulk resistance (Rb) at low and high salt concentrations is made easy using the impedance plot’s inset. It is fascinating to see that when KSCN concentration increases up to 40 wt.%, Rb declines.
Impedance spectroscopy analysis following EECs modeling is a simple, fast, and comprehensive method for obtaining a full view of the electrolyte system [56]. The picture of the measured impedance plots in relation to the equivalent circuit is presented in the insets of Figure 2, which includes Rb for the sample’s charge carriers and two CPEs (constant phase elements). Rb and CPE1 make up the high-frequency zone, while CPE2, which is derived from the region between the electrodes and SPE that created double layer capacitance, makes up the low-frequency area. As previously mentioned, in an analogous circuit, a CPE shortened word is used instead of an ideal capacitor in the actual system. When it comes to a pure semicircular pattern, the real SPE behaves differently from an ideal capacitor [57]. The CPE has been used instead of a capacitor to represent the depressed semicircle [53]. ZCPE1 is the capacitance response at the electrode–solid PE interface. [57]. It is possible to write Ztotal as Rb + ZCPE impedance as [39,58,59,60]:
Z t o t a l = R b + 1 C ω p cos π p 2 i sin π p 2
In the right-hand side model, there is a second term ZCPE known as the impedance of the constant phase element. Here, the reciprocal of capacitance is K, and the deviation of the inclined line from the real axis is represented by p. If p has the value of unity, Z t o t a l = R j ω C   . Whereas, when p is zero, a perfect resistor is considered instead of the constant phase element, in which Ztotal becomes independent on frequency. Furthermore, when p value lies between zero and one, CPE behaves as an intermediate between a resistor and a capacitor, while at p = 0.5, the impedance is the Warburg impedance.
Zr and Zi are the real and imaginary complex impedance (Z*) values in the analogous circuit, respectively, and their mathematical basis is shown below in Figure 2c–e [39,52,59,60]:
Z r = R b C 1 ω p 1 cos π p 1 2 + R b 2 R b C 1 ω p cos π p 2 + R b 2 C 2 ω 2 p + 1 + cos π p 2 2 C 2 ω p 2
Z i = R b C 1 ω p 1 sin π p 1 2 2 R b C 1 ω p cos π p 2 + R b 2 C 2 ω 2 p + 1 + sin π p 2 2 C 2 ω p 2
While for Figure 2a,b, the mathematical equations are:
Z r = R b C 1 ω p 1 cos π p 1 2 + R b 2 R b C 1 ω p cos π p 2 + R b 2 C 2 ω 2 p + 1
Z i = R b C 1 ω p 1 sin π p 1 2 2 R b C 1 ω p cos π p 2 + R b 2 C 2 ω 2 p + 1
Figure 2 shows a good simulation (red solid lines) of the experimental impedance plots based on Equations (10)–(13) and EECs are shown in the figure insets. One can determine the ionic conductivity ( σ ) of SPEs samples by using Equation (1). Table 1 shows the bulk resistance and circuit elements for MC: KSCN SPE films. Table 1 reveals that as KSCN concentration is increased, higher values of DC conductivity for SPE films were recorded accordingly. Due to an increase in the number of mobile charge carriers, there is a significant decrease in R b with rising KSCN salt. Moreover, the charge carrier concentration increasing leads to increasing DC conductivity at ambient temperature as mathematically shown in Equation (14) [37,47,61],
σ = i n i   z i   μ i
Here, ni is the density of charge carriers with the ion mobility denoted by µi, and 1.6 × 10⁻¹⁹ C is the value of q. Variables such as ionic conducting charge species concentration, temperature, and carrier mobility can all affect ionic DC conductivity [62]. Thus, substantial growth in DC conductivity for the sample with 30 wt.% of KSCNis correlated to the increase in charge carrier concentration as a consequence of salt involvement at room temperature [37,47,63]. For more clarification, an EEC diagram for impedance plots, which indicates a high-frequency semicircle and a low-frequency spike as a schematic representation, is shown in Figure 3.
As the (MCKN3, MCKN4, and MCKN5) films contain a spike and a semicircle, the diffusion coefficient (D), mobility of ions (μ), and number density (n) of ions are determined by the below relations [63]:
The D of the (MCKN3, MCKN4, and MCKN5) samples is achieved using Equation (15),
D = ( K 2 ε o ε r A ) 2 τ 2
where τ2 denotes the reciprocal of angular frequency corresponding to the minimum in Zi.
The µ of the above films is achieved using the Equation (16),
μ = e D K b T
where T stands for the absolute temperature and Kb stands for the Boltzmann constant.
Since conductivity is written by
σ D c = n e μ
So, the n of the above films is achieved by Equation (18):
n = σ d c K b T τ 2 ( e K 2 ε o ε r A ) 2
Table 2 lists the parameters of ion transport for the samples.
In Table 2, the D, μ, and n are increased when the salt is increased. This increase in the D, μ, and also n increased the conductivity. The number of ions increases as the concentration of salt increases [63].

3.2. FTIR Study

Figure 4 shows the FTIR spectra at a wave number from 400 to 4000 cm−1 for the MC:KSCN based biopolymer electrolytes. FTIR is the best method for determining the structure and content of novel organic compounds generated during chemical processes. Position shifting and intensity fluctuation of bands in electrolyte samples are considered the best indicators of the existence of specific interaction among salts cation and polymers functional groups. Heteroatoms (such O and N) are shown to be important elements in the electrolyte and lone pair electron interaction in the polymer host [64]. It is possible to highlight SPEs system interactions between MC and KSCN by taking FTIR spectra of them.
The existence of the C-H stretching modes seen in Figure 4 is indicated by the formation of a significant peak at roughly 2900 cm−1 [65,66,67,68,69], and the salt content also reduced its intensity. Furthermore, doping has been shown to have a major impact on this process, as seen in Figure 4, which depicts a large peak centered at 3359 cm−1 as the source of the -OH stretching [65]. As a result of both peak shifting and intensity change, a significant interaction arises between the host medium and KSCN salt. As a result of past research [33,69], this polymer has distinct vibrational frequencies in the FTIR spectra of O=C-NHR and -OH. Increased KSCN concentration causes the peak intensity to decrease and shift somewhat. In fact, the complexation process is proven by the fact that the polymer body and the KSCN salt are in close contact with each other through a coordination link.
This technique is also effective for measuring the dissociation of ions [70]. Thiocyanate anion (SCN-) has two possible reactive sites and regarded as a linear molecular ion. This ion can form bridge complexes between N and S atoms in addition to S-bonding (CS stretching) and N-bonding (CN stretching). It has been suggested by Woo et al. that the wavelengths at which the bands appear correspond to free ions at 2040 cm−1, pair contact ions at 2058 cm−1, and ions aggregates at 2074 cm−1 [71]. Equation (19) is used to determine the percentage of ions [63]. Ion association and dissociation were distinguished by deconvoluting the overlapped complex spectra between 2030 and 2090 cm−1.
When compared to other methods, such as impedance spectroscopy and Trukhan, Rice and Roth, Schutt and Gerdes models, the precision of FTIR-extracted ion transport parameters reveals that this method is superior [38,72]. FTIR spectroscopy is very sensitive to even small structural changes, making it a dependable method of spectroscopic analysis. In particular, the location and strength of some band peaks [73] clearly demonstrate this. This strategy of fitting the curve and separating single fine peaks corresponds to free ions, contact ion couples (K+. SCN-), and ion aggregates through the Gaussian–Lorentzian fitting approach and baseline correction [7,74]. Free SCN-linear anion has an estimated peak band position of 2040 cm−1; ion contact, and ion aggregates have peak band values of 2058 cm−1 and 2074 cm−1, respectively [71,75]. After the fitting procedure, the following equation [7,76] may be used to calculate the proportion of these ionic species in the region beneath each of the bands:
percentage   of   free   ions   % = A f A f + A c + A a × 100 %      
Areas under free ions, ions in contact with one another, and ion aggregates are all represented by, A f ,   A c , and A a . Figure 5d shows that the CSPSK4 sample has reached its maximum salt concentration (the area of free ions grows). Increasing KSCN salt, up to 40 weight percent, causes the peak area of contact ions to steadily decrease (see Figure 5a–d). Accordingly, the number of mobile carriers is reduced as more free ions are available, which is known to have an effect on the conductivity of ions. Carboxyl methylcellulose hosts doped with NH4SCN [7] and oleic acid [77] have also shown similar results. The overall performance of the SPE and its ionic conduction is influenced by a number of factors, including free ions. Mobility ( μ ), diffusion coefficient (D), and the density of the carriers (n) are other important considerations which can also be determined using the FTIR method. The following formulae [74,76] were used to determine these parameters:
n = M × N A V T o t a l × free   ion   %
μ = σ n   e    
  D = μ   K b T e
here, the total volume of the SPE is ( V T o t a l ) and ( M ) is the number of mole. ( N A ) and ( e ) possess usual meanings which are 6.02 × 10 23   mol 1 and 1.6 × 10 19   C , respectively. Both K b ( 1.38 × 10 23   J   K 1 ) and T have normal meanings.
According to the μ and D values in Table 3, the optimal quantity of salt for both transport parameters is 40 wt.% of salt. Free SCN-nucleophile anion possesses two highly reactive sites for N and S bonding, in addition to a bridge complex with the host polymer (SCN bending) [78,79]. When the polymers lose their structural order and intermolecular interaction, resulting in a more amorphous phase that facilitates better ion diffusion [80]. On the other hand, at a salt concentration of 50 wt.%, both μ and D values decrease, which is consistent with the obstruction effect of free ion movement caused by the creation of an ion cloud and an ion cluster [76,77]. For more clarification, the percentage (%) of free ions, contact ions, and ion aggregates versus salt concentrations are shown in Figure 6.

3.3. Dielectric Properties

3.3.1. Complex Permittivity

Through dielectric spectroscopy, the frequency-dependent dielectric properties of the medium are established. It means that the dielectric parameters can be calculated from the relationship between the measured impedance parameters versus frequency. Using a broad variety of frequencies, this approach includes the interaction of an electric dipole with an external field. The acquired data may also be used to estimate the material’s ac conductivity over a certain frequency range. The necessary energy for dipole alignment is represented by the imaginary portion ( ε ), whereas the real part ( ε ) is connected to ion storage effectiveness or polarizing ability. The dielectric constant and loss were measured using Equations (5) and (6). In both dielectric constant and loss (Figure 7 and Figure 8), dispersion is seen at low frequencies. Space charge polarization was observed to exist at the electrode–electrolyte interface, as dielectric constant and loss were significant in the area [81,82,83,84,85]. It should be noted that the system with a 30 wt.% KSCN integration has the largest dielectric constant at low-frequency range. It could be caused by space charge effects in addition to electrode polarization. This suggests the presence of many charge carriers, leading to relatively high conductivity [85,86,87]. In the low frequency range, dipoles and charge carriers have sufficient time to align themselves with respect to the direction of the applied field. Electrode polarization is caused by charge buildup at the electrode/electrolyte contact, which suppresses high frequency dielectric characteristics (bulk property) [86,87,88]. The dielectric loss value is clearly greater than the dielectric constant value, showing a contribution to the dielectric loss values from carrier motion (DC conductivity) [89,90]. Due to the marginalization of the electrode–electrolyte interfaces with increasing frequency, the dielectric values are steady in high-frequency areas. The electrolyte films exhibit non-Debye behavior because the values of both ( ε ) and ( ε ) drop with increasing frequency [91,92].

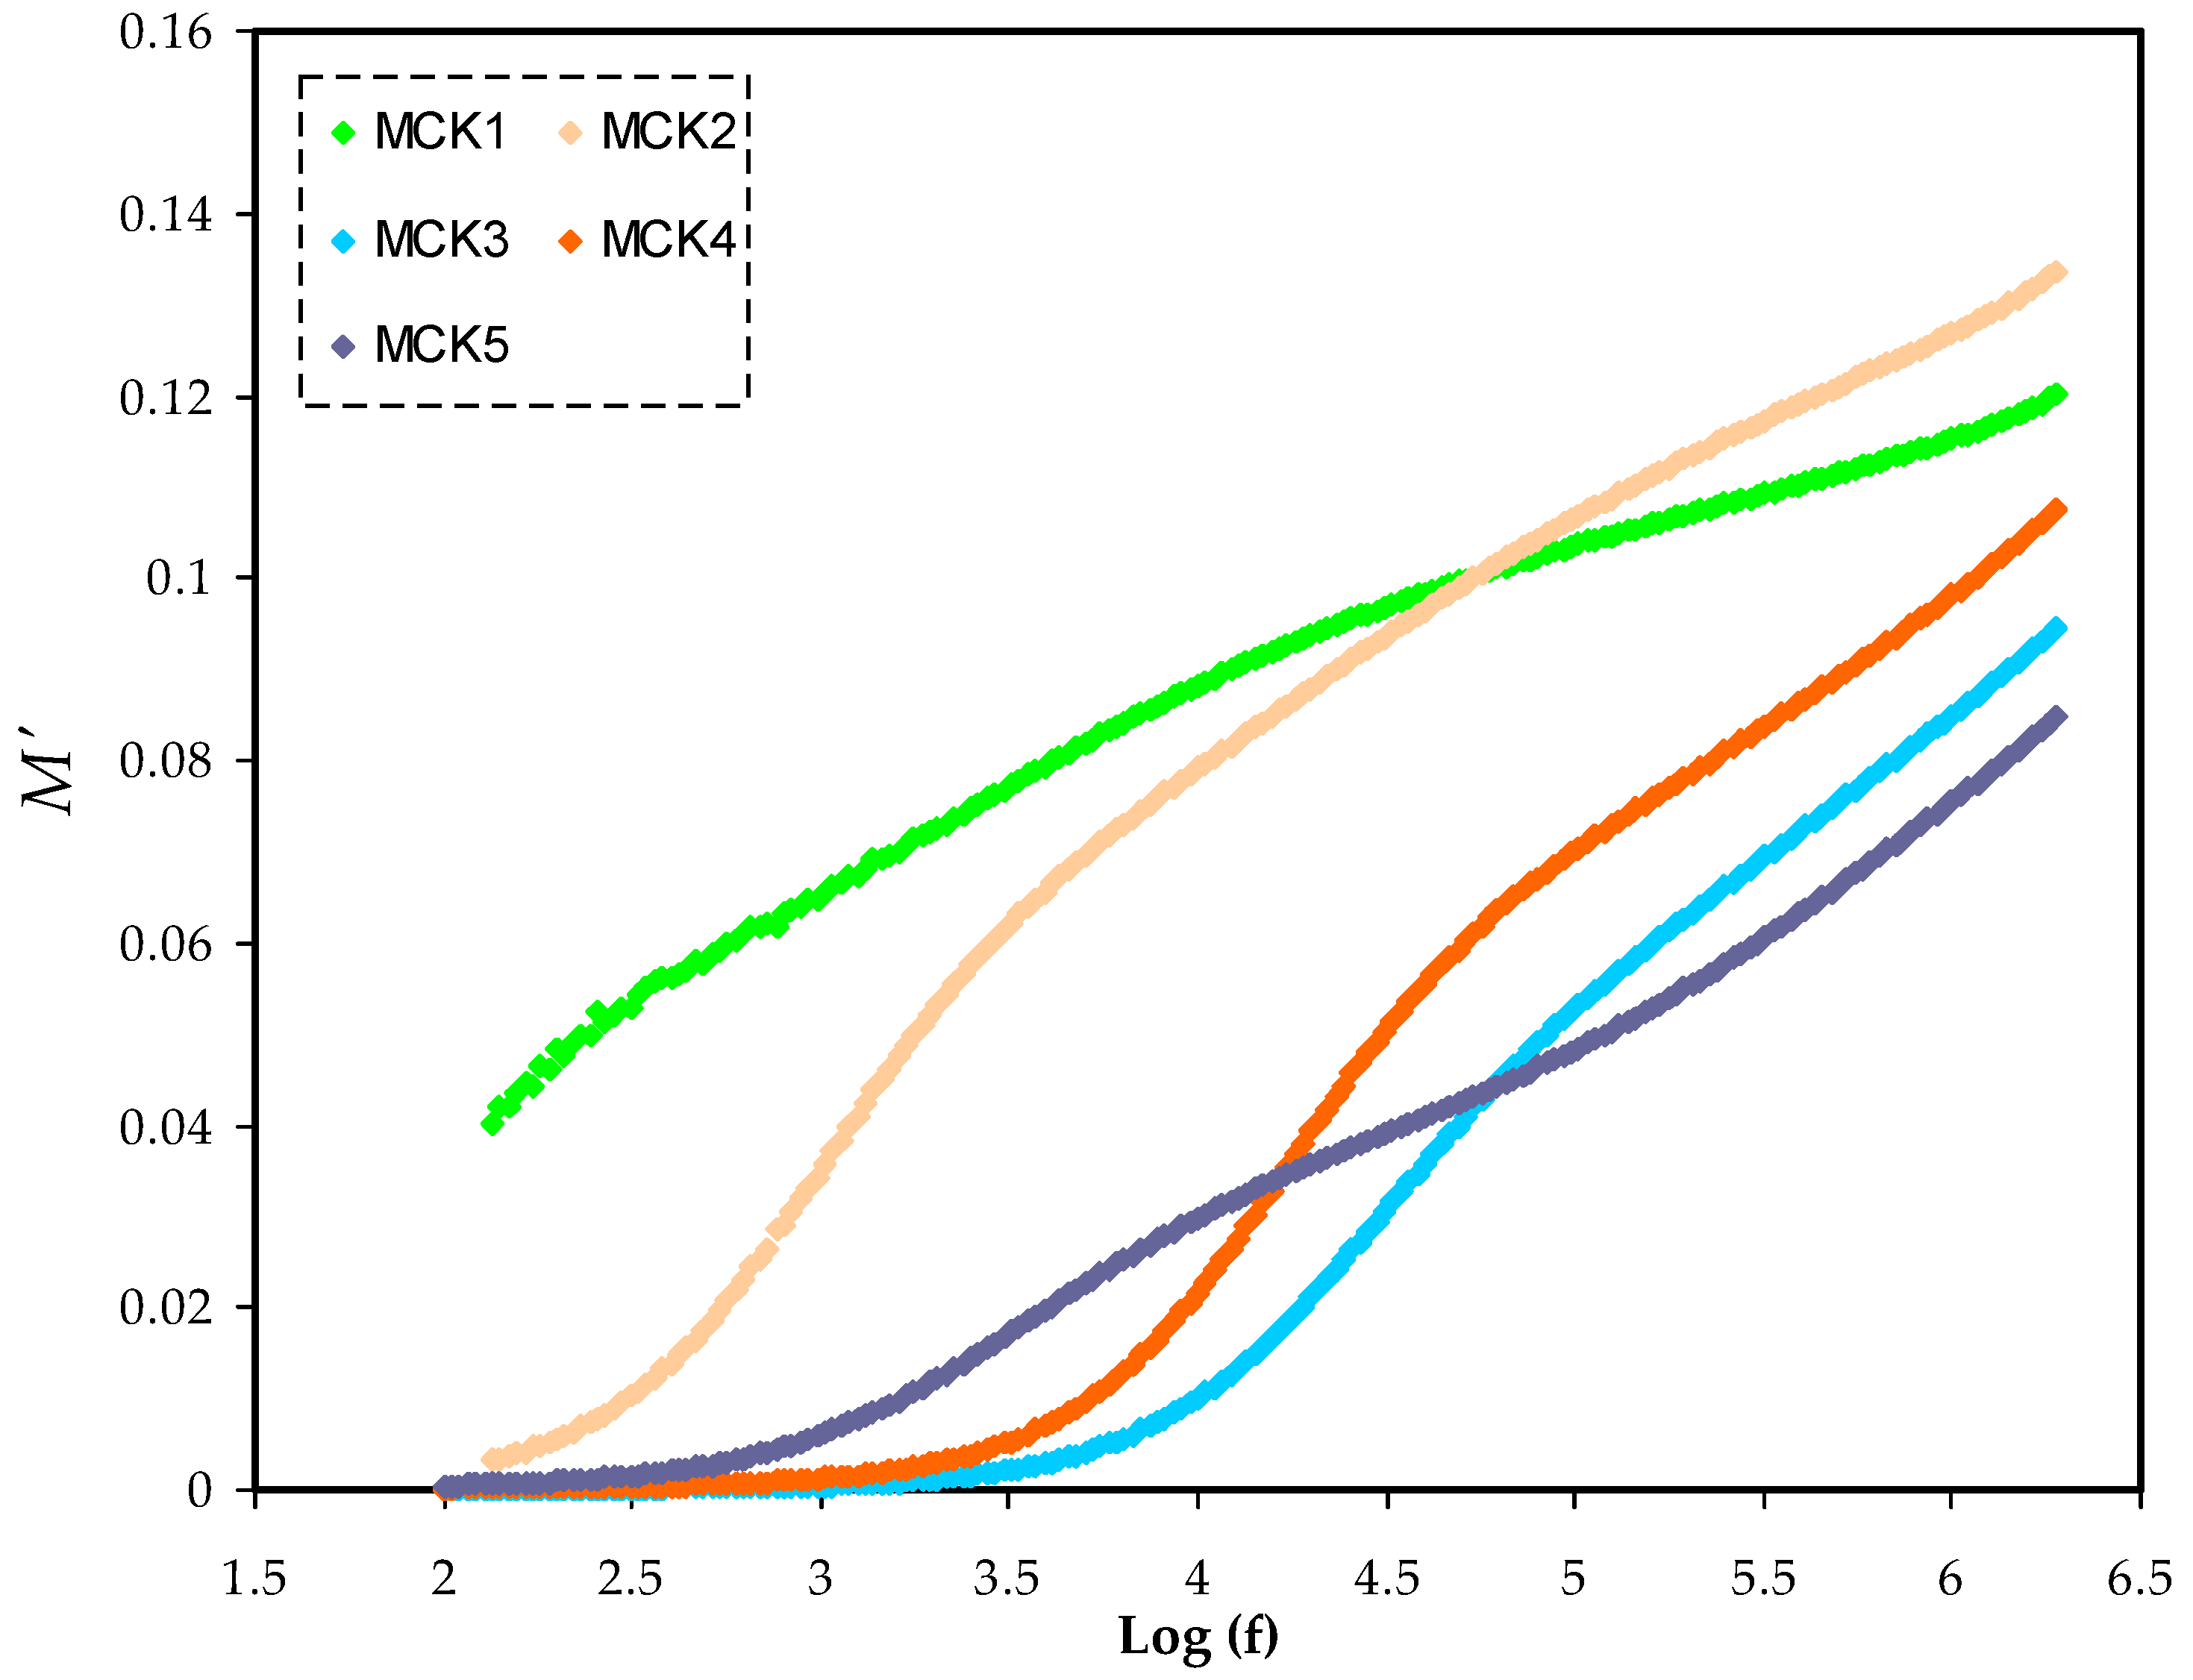
3.3.2. Complex Electric Modulus

The complex electric modulus ( M * ) has the following mathematical foundation for the real (M′) and imaginary (M″) portions as shown in Equations (7) and (8). Figure 9 and Figure 10 show M′ and M″ in opposition to frequency for the PCEs at room temperature. At low frequencies, both M′ and M″ decrease as the tails lengthen, demonstrating that electrode polarization has a minor role. It implies that the polarization of the electrodes causes the SS electrodes to build up charges [93]. The spectra of M′ and M″ vary from those of ε and ε . Figure 7 and Figure 8 show the large ε and ε values at low frequencies. In reality, the inverses of ε and ε in ε * were used to create the M′ and M″ in M * . When it comes to low-frequency capacitive behavior, these are the parameters that are most important.
Figure 9 and Figure 10 show the long tails at low frequencies. If the electrode/PE films had a considerable capacitance at low frequencies, the electrochemical double layer at the electrodes would be suppressed. Due to the fact that ε decreases to its lowest value, M′ rises to its greatest value at high frequencies [86]. The M″ spectra of the electrolyte show a notable peak as a consequence of the relaxation of conductivity (see Figure 10). It is because M′ in the M * corresponds to ε in the ε * that the loss peaks do not appear in the M′ spectra (see Figure 9). M′ is a symbol denoting the energy storage capacity of the substance [94].

3.4. AC Conductivity

To realize the ion dynamics in polymer electrolytes, the frequency dependence of AC conductivity at room temperatures was examined for all samples, which can be seen in Figure 11. According to documents recorded in the literature [95] conductivity in polymer electrolytes progresses via two main mechanisms. The first mechanism is in action by ion charge migration across coordinated sites in the host polymer and results in DC contribution. The second one is in progress after increasing conductivity as a result of polymer segmental motion and polarization and results in AC dispersion. Equation (23) is applied to gain the AC conductivities:
σ a c = Z Z 2 + Z 2 × t A
In Figure 11, three different areas are recognized; firstly, the low-frequency range inclined line, resulting from the electrode polarization; secondly, the plateau area at the medium frequency, which is caused by DC conductivity at the bulk; lastly, the area of the high frequency, which shifts in position to the higher frequency as salt concentration is increased due to conductivity relaxation [96]. In the previous document, the AC conductivity dependency on the applied electrical signal frequency was applied as a method to accurately evaluate DC conductivity [97]. The extension of the plateau area to the y-axis is useful in estimating DC electrical conductivity. It is important to note that the rise in AC conductivity (the frequency dependence) would still be observed at relatively high frequencies. Furthermore, the rise in AC conductivity with frequency implies the presence of a hopping conduction mechanism, which enhances charge carrier hopping among localized states [98]. The origin of this strong relationship between frequency and conductivity belongs to Jonscher [99], in which the relaxation process is caused by mobile charge carriers (related to the jump relaxation model) [100]. As stated, the AC conductivity at high frequencies can be linked to the possibility of connected forward–backward hopping in conjunction with ion relaxation in the bulk of the materials. The Jonscher’s relation accurately establish the relationship between AC conductivity and charge carrier motion [101],
σ a c ω = σ D C + A   ω s 0 < s < 1
where s is an exponent that expresses charge carrier interactions throughout hopping processes in DC conductivity [102]. Secondly, dipole polarization (limited movement) and charge buildup at the interface result in the polarization (limited movement) component (permanent/induced). As the frequency rises, so does the second component’s contribution to overall conductivity [103].

4. Conclusions

The solid polymer electrolyte that conducts potassium ions has been made using the solution cast method at room temperature. Investigations have been conducted into how variations in salt concentration affect the structural, dielectric, and ion transport characteristics of produced films. According to the FTIR analysis, the complexation between the polymer and salt was confirmed. When KSCN salt content increased up to 40 wt.%, the free ion is dominant based on FTIR deconvolution. From the fitted EIS plot and EEC diagram, the entire figure of the system was visualized. The highest conductivity of 1.54 × 10⁻⁷ S cm−1 is achieved when the salt concentration has reached 30 wt.% based on EIS approach. The extracted ion transport parameters from the deconvoluted anion peak revealed a clear enhancement in the transport parameters for the MCK4 sample, which is not in accordance with the EIS investigations. Dielectric polarization is the explanation for the dispersion with a high value of dielectric constant in the low frequency range. The highest conducting sample has the greatest value of dielectric constant, and often follows the same pattern as the conductivity study. No discernible dielectric loss peak is seen because the electrode polarization effect might have covered it. In the M″ versus frequency plot, the long-range conductivity relaxation is shown as a resonance peak. The faster ion migration via the segmental motion of the polymer chain and the presence of more free charge carriers in the system may account for the improvement in dielectric properties. When the frequency-dependent conductivity shows a large flat area, it means that ions are moving, which gives rise to the conductivity.

Author Contributions

Conceptualization, S.B.A. and M.M.N.; formal analysis, A.A.A. and R.T.A.; funding acquisition, E.M.A.D., S.I.A.-S. and M.M.N.; investigation, A.A.A.; methodology, A.A.A.; project administration, S.B.A., E.M.A.D., S.I.A.-S. and M.M.N.; resources, S.I.A.-S. and M.A.B.; validation, S.B.A., E.M.A.D., R.T.A., S.I.A.-S., M.A.B., R.M.A., J.M.H. and W.O.K.; writing—original draft, S.B.A.; writing—review and editing, E.M.A.D., R.T.A., S.I.A.-S., M.A.B., M.M.N., R.M.A., J.M.H. and W.O.K. All authors have read and agreed to the published version of the manuscript.

Funding

This research was funded by Princess Nourah bint Abdulrahman University Researchers Supporting Project Number (PNURSP2022R58), Princess Nourah bint Abdulrahman University, Riyadh, Saudi Arabia. The authors would like to acknowledge the support of Prince Sultan University for paying the Article Processing Charges (APC) of this publication and for their financial support.

Institutional Review Board Statement

Not applicable.

Informed Consent Statement

Not applicable.

Acknowledgments

We would like to acknowledge all support for this work by the University of Sulaimani, Prince Sultan University, and University of Human Development. The authors express their gratitude to the support of Princess Nourah bint Abdulrahman University Researchers Supporting Project Number (PNURSP2022R58), Princess Nourah bint Abdulrahman University, Riyadh, Saudi Arabia. The authors would like to acknowledge the support of Prince Sultan University for paying the Article Processing Charges (APC) of this publication and for their financial support.

Conflicts of Interest

The authors declare no conflict of interest.

References

  1. Yasin, G.; Arif, M.; Mehtab, T.; Lu, X.; Yu, D.; Muhammad, N.; Nazir, M.T.; Song, H. Understanding and suppression strategies toward stable Li metal anode for safe lithium batteries. Energy Storage Mater. 2020, 25, 644–678. [Google Scholar] [CrossRef]
  2. Wang, H.; Sheng, L.; Yasin, G.; Wang, L.; Xu, H.; He, X. Reviewing the current status and development of polymer electrolytes for solid-state lithium batteries. Energy Storage Mater. 2020, 33, 188–215. [Google Scholar] [CrossRef]
  3. Yasin, G.; Arif, M.; Ma, J.; Ibraheem, S.; Yu, D.; Zhang, L.; Liu, D.; Dai, L. Self-templating synthesis of heteroatom-doped large-scalable carbon anodes for high-performance lithium-ion batteries. Inorg. Chem. Front. 2022, 9, 1058–1069. [Google Scholar] [CrossRef]
  4. Aziz, S.; Brza, M.; Nofal, M.; Abdulwahid, R.; Hussen, S.; Hussein, A.; Karim, W. A comprehensive review on optical properties of polymer electrolytes and composites. Materials 2020, 13, 3675. [Google Scholar] [CrossRef] [PubMed]
  5. CLiew, C.-W.; Ramesh, S.; Arof, A. Good prospect of ionic liquid based-poly (vinyl alcohol) polymer electrolytes for supercapacitors with excellent electrical, electrochemical and thermal properties. Int. J. Hydrogen Energy 2014, 39, 2953–2963. [Google Scholar] [CrossRef]
  6. Aziz, S.B.; Woo, T.J.; Kadir, M.; Ahmed, H.M. A conceptual review on polymer electrolytes and ion transport models. J. Sci. Adv. Mater. Devices 2018, 3, 1–17. [Google Scholar] [CrossRef]
  7. Noor, N.A.M.; Isa, M.I.N. Investigation on transport and thermal studies of solid polymer electrolyte based on carboxymethyl cellulose doped ammonium thiocyanate for potential application in electrochemical devices. Int. J. Hydrogen Energy 2019, 44, 8298–8306. [Google Scholar] [CrossRef]
  8. Du, J.F.; Bai, Y.; Chu, W.Y.; Qiao, L.J. Synthesis and performance of proton conducting chitosan/NH4Cl electrolyte. J. Polym. Sci. Part B Polym. Phys. 2010, 48, 260–266. [Google Scholar] [CrossRef]
  9. Gupta, A.; Jain, A.; Kumari, M.; Tripathi, S. Structural, electrical and electrochemical studies of sodium ion conducting blend polymer electrolytes. Mater. Today Proc. 2019, 34, 780–786. [Google Scholar] [CrossRef]
  10. Su’Ait, M.; Ahmad, A.; Badri, K.; Mohamed, N.; Rahman, M.; Ricardo, C.A.; Scardi, P. The potential of polyurethane bio-based solid polymer electrolyte for photoelectrochemical cell application. Int. J. Hydrogen Energy 2014, 39, 3005–3017. [Google Scholar] [CrossRef]
  11. Liew, C.-W.; Ramesh, S.; Arof, A. Enhanced capacitance of EDLCs (electrical double layer capacitors) based on ionic liquid-added polymer electrolytes. Energy 2016, 109, 546–556. [Google Scholar] [CrossRef]
  12. Liew, C.-W.; Ramesh, S.; Arof, A.K. Characterization of ionic liquid added poly(vinyl alcohol)-based proton conducting polymer electrolytes and electrochemical studies on the supercapacitors. Int. J. Hydrogen Energy 2015, 40, 852–862. [Google Scholar] [CrossRef]
  13. Aziz, S.B.; Hamsan, M.H.; Brza, M.A.; Kadir, M.F.Z.; Abdulwahid, R.T.; Ghareeb, H.O.; Woo, H.J. Fabrication of energy storage EDLC device based on CS:PEO polymer blend electrolytes with high Li+ ion transference number. Results Phys. 2019, 15, 102584. [Google Scholar] [CrossRef]
  14. Rani, M.S.A.; Ahmad, A.; Mohamed, N.S. Influence of nano-sized fumed silica on physicochemical and electrochemical properties of cellulose derivatives-ionic liquid biopolymer electrolytes. Ionics 2018, 24, 807–814. [Google Scholar] [CrossRef]
  15. Aziz, S.B.; Brza, M.A.; Hamsan, M.H.; Kadir, M.F.Z.; Muzakir, S.K.; Abdulwahid, R.T. Effect of ohmic-drop on electrochemical performance of EDLC fabricated from PVA:dextran:NH4I based polymer blend electrolytes. J. Mater. Res. Technol. 2020, 9, 3734–3745. [Google Scholar] [CrossRef]
  16. Abdulwahid, R.T.; Aziz, S.B.; Kadir, M.F.Z. Design of proton conducting solid biopolymer blend electrolytes based on chitosan-potato starch biopolymers: Deep approaches to structural and ion relaxation dynamics of H+ ion. J. Appl. Polym. Sci. 2022, e52892. [Google Scholar] [CrossRef]
  17. Shaffie, A.H.; Misenan, M.; Isa, M.; Khiar, A.S.A. Effect of Ionic Liquid BMIMNO3 to Chitosan-Starch Blend Biopolymer Electrolyte System. Solid State Phenom. 2019, 290, 177–182. [Google Scholar] [CrossRef]
  18. Aziz, N.A.N.; Idris, N.K.; Isa, M.I.N. Solid Polymer Electrolytes Based on Methylcellulose: FT-IR and Ionic Conductivity Studies. Int. J. Polym. Anal. Charact. 2010, 15, 319–327. [Google Scholar] [CrossRef]
  19. Aziz, S.B.; Nofal, M.M.; Abdulwahid, R.T.; Kadir, M.; Hadi, J.M.; Hessien, M.M.; Kareem, W.O.; Dannoun, E.M.; Saeed, S.R. Impedance, FTIR and transport properties of plasticized proton conducting biopolymer electrolyte based on chitosan for electrochemical device application. Results Phys. 2021, 29, 104770. [Google Scholar] [CrossRef]
  20. Mantravadi, R.; Chinnam, P.R.; Dikin, D.A.; Wunder, S.L. High Conductivity, High Strength Solid Electrolytes Formed by in Situ Encapsulation of Ionic Liquids in Nanofibrillar Methyl Cellulose Networks. ACS Appl. Mater. Interfaces 2016, 8, 13426–13436. [Google Scholar] [CrossRef] [PubMed]
  21. Aziz, S.B.; Hamsan, M.H.; Abdullah, R.M.; Abdulwahid, R.T.; Brza, M.A.; Marif, A.S.; Kadir, M.F.Z. Protonic EDLC cell based on chitosan (CS): Methylcellulose (MC) solid polymer blend electrolytes. Ionics 2020, 26, 1829–1840. [Google Scholar] [CrossRef]
  22. Majumdar, S.; Sen, P.; Ray, R. Ionic interactions and transport properties in chitosan-starch based blend solid biopolymer electrolytes. Mater Today Proc. 2019, 18, 4913–4920. [Google Scholar] [CrossRef]
  23. Amran, N.N.A.; Manan, N.S.A.; Kadir, M.F.Z. The effect of LiCF3SO3 on the complexation with potato starch-chitosan blend polymer electrolytes. Ionics 2016, 22, 1647–1658. [Google Scholar] [CrossRef]
  24. Lim, C.-S.; Teoh, K.H.; Liew, C.-W.; Ramesh, S. Capacitive behavior studies on electrical double layer capacitor using poly (vinyl alcohol)–lithium perchlorate based polymer electrolyte incorporated with TiO2. Mater. Chem. Phys. 2014, 143, 661–667. [Google Scholar] [CrossRef]
  25. Shamsudin, I.; Ahmad, A.; Hassan, N.; Kaddami, H. Bifunctional ionic liquid in conductive biopolymer based on chitosan for electrochemical devices application. Solid State Ionics 2015, 278, 11–19. [Google Scholar] [CrossRef]
  26. Leones, R.; Sabadini, R.C.; Esperança, J.; Pawlicka, A.; Silva, M.M. Playing with ionic liquids to uncover novel polymer electrolytes. Solid State Ionics 2017, 300, 46–52. [Google Scholar] [CrossRef]
  27. Moniha, V.; Alagar, M.; Selvasekarapandian, S.; Sundaresan, B.; Boopathi, G. Conductive bio-polymer electrolyte iota-carrageenan with ammonium nitrate for application in electrochemical devices. J. Non-Cryst. Solids 2018, 481, 424–434. [Google Scholar] [CrossRef]
  28. Chai, M.N.; Isa, M.I.N. The Oleic Acid Composition Effect on the Carboxymethyl Cellulose Based Biopolymer Electrolyte. J. Cryst. Process. Technol. 2013, 3, 1–4. [Google Scholar] [CrossRef]
  29. Aziz, S.B.; Hamsan, M.H.; Brza, M.A.; Kadir, M.F.Z.; Muzakir, S.K.; Abdulwahid, R.T. Effect of glycerol on EDLC characteristics of chitosan:methylcellulose polymer blend electrolytes. J. Mater. Res. Technol. 2020, 9, 8355–8366. [Google Scholar] [CrossRef]
  30. Shuhaimi, N.; Teo, L.; Majid, S.; Arof, A. Transport studies of NH4NO3 doped methyl cellulose electrolyte. Synth. Met. 2010, 160, 1040–1044. [Google Scholar] [CrossRef]
  31. Salleh, N.S.; Aziz, S.B.; Aspanut, Z.; Kadir, M.F.Z. Electrical impedance and conduction mechanism analysis of biopolymer electrolytes based on methyl cellulose doped with ammonium iodide. Ionics 2016, 22, 2157–2167. [Google Scholar] [CrossRef]
  32. Taghizadeh, M.T.; Seifi-Aghjekohal, P. Sonocatalytic degradation of 2-hydroxyethyl cellulose in the presence of some nanoparticles. Ultrason. Sonochemistry 2015, 26, 265–272. [Google Scholar] [CrossRef] [PubMed]
  33. Aziz, S.B.; Rasheed, M.A.; Ahmed, H.M. Synthesis of Polymer Nanocomposites Based on [Methyl Cellulose] (1−x):(CuS)x (0.02 M ≤ x ≤ 0.08 M) with Desired Optical Band Gaps. Polymers 2017, 9, 194. [Google Scholar] [CrossRef] [PubMed]
  34. Suganya, N.; Jaisankar, V. A Study on the effect of dye and polymer nanocomposite electrolyte on the performance of natural dye sensitized solar cells. Mater. Today Proc. 2019, 14, 471–481. [Google Scholar] [CrossRef]
  35. Mallaiah, Y.; Jeedi, V.R.; Swarnalatha, R.; Raju, A.; Reddy, S.N.; Chary, A.S. Impact of polymer blending on ionic conduction mechanism and dielectric properties of sodium based PEO-PVdF solid polymer electrolyte systems. J. Phys. Chem. Solids 2021, 155, 110096. [Google Scholar] [CrossRef]
  36. Shaffie, A.H.; Khiar, A.S.A. Characterization of chitosan-starch blend based biopolymer electrolyte doped with ammonium nitrate. AIP Conf. Proc. 2018, 1972, 030011. [Google Scholar] [CrossRef]
  37. Aziz, S.; Abidin, Z.; Arof, A. Effect of silver nanoparticles on the DC conductivity in chitosan–silver triflate polymer electrolyte. Phys. B Condens. Matter 2010, 405, 4429–4433. [Google Scholar] [CrossRef]
  38. Abdullah, A.M.; Aziz, S.B.; Saeed, S.R. Structural and electrical properties of polyvinyl alcohol (PVA):Methyl cellulose (MC) based solid polymer blend electrolytes inserted with sodium iodide (NaI) salt. Arab. J. Chem. 2021, 14, 103388. [Google Scholar] [CrossRef]
  39. Aziz, S.B.; Brza, M.; Mohamed, P.A.; Kadir, M.; Hamsan, M.; Abdulwahid, R.T.; Woo, H. Increase of metallic silver nanoparticles in Chitosan:AgNt based polymer electrolytes incorporated with alumina filler. Results Phys. 2019, 13, 102326. [Google Scholar] [CrossRef]
  40. Aziz, S.B. The Mixed Contribution of Ionic and Electronic Carriers to Conductivity in Chitosan Based Solid Electrolytes Mediated by CuNt Salt. J. Inorg. Organomet. Polym. Mater. 2018, 28, 1942–1952. [Google Scholar] [CrossRef]
  41. Alipoori, S.; Mazinani, S.; Aboutalebi, S.H.; Sharif, F. Review of PVA-based gel polymer electrolytes in flexible solid-state supercapacitors: Opportunities and challenges. J. Energy Storage 2019, 27, 101072. [Google Scholar] [CrossRef]
  42. Aziz, S.B.; Brza, M.; Saed, S.R.; Hamsan, M.H.; Kadir, M. Ion association as a main shortcoming in polymer blend electrolytes based on CS:PS incorporated with various amounts of ammonium tetrafluoroborate. J. Mater. Res. Technol. 2020, 9, 5410–5421. [Google Scholar] [CrossRef]
  43. Yoder, C.H.; Flora, N.J. Geochemical applications of the simple salt approximation to the lattice energies of complex materials. Am. Miner. 2005, 90, 488–496. [Google Scholar] [CrossRef]
  44. Pan, Q.; Gong, D.; Tang, Y. Recent progress and perspective on electrolytes for sodium/potassium-based devices. Energy Storage Mater. 2020, 31, 328–343. [Google Scholar] [CrossRef]
  45. Polu, A.R.; Kumar, R. AC impedance and dielectric spectroscopic studies of Mg2+ ion conducting PVA–PEG blended polymer electrolytes. Bull. Mater. Sci. 2011, 34, 1063–1067. [Google Scholar] [CrossRef]
  46. Varshney, P.K.; Gupta, S. Natural polymer-based electrolytes for electrochemical devices: A review. Ionics 2011, 17, 479–483. [Google Scholar] [CrossRef]
  47. Ibrahim, S.; Yasin, S.M.M.; Nee, N.M.; Ahmad, R.; Johan, M.R. Conductivity and dielectric behaviour of PEO-based solid nanocomposite polymer electrolytes. Solid State Commun. 2012, 152, 426–434. [Google Scholar] [CrossRef]
  48. Pradhan, D.K.; Choudhary, R.N.P.; Samantaray, B.K. Studies of dielectric relaxation and AC conductivity behavior of plasticized polymer nanocomposite electrolytes. Int. J. Electrochem. Sci. 2008, 3, 597–608. [Google Scholar]
  49. Asami, K. Characterization of heterogeneous systems by dielectric spectroscopy. Prog. Polym. Sci. 2002, 27, 1617–1659. [Google Scholar] [CrossRef]
  50. Aziz, S.B.; Asnawi, A.S.; Abdulwahid, R.T.; Ghareeb, H.O.; Alshehri, S.M.; Ahamad, T.; Hadi, J.M.; Kadir, M. Design of potassium ion conducting PVA based polymer electrolyte with improved ion transport properties for EDLC device application. J. Mater. Res. Technol. 2021, 13, 933–946. [Google Scholar] [CrossRef]
  51. Sadiq, N.M.; Aziz, S.B.; Kadir, M.F.Z. Development of Flexible Plasticized Ion Conducting Polymer Blend Electrolytes Based on Polyvinyl Alcohol (PVA): Chitosan (CS) with High Ion Transport Parameters Close to Gel Based Electrolytes. Gels 2022, 8, 153. [Google Scholar] [CrossRef] [PubMed]
  52. Hadi, J.M.; Aziz, S.B.; Nofal, M.M.; Hussein, S.A.; Hamsan, M.H.; Brza, M.A.; Abdulwahid, R.T.; Kadir, M.F.Z.; Woo, H.J. Electrical, Dielectric Property and Electrochemical Performances of Plasticized Silver Ion-Conducting Chitosan-Based Polymer Nanocomposites. Membranes 2020, 10, 151. [Google Scholar] [CrossRef] [PubMed]
  53. Shukur, M.F.; Ithnin, R.; Kadir, M.F.Z. Electrical characterization of corn starch-LiOAc electrolytes and application in electrochemical double layer capacitor. Electrochim. Acta 2014, 136, 204–216. [Google Scholar] [CrossRef]
  54. Khiar, A.S.A.; Arof, A.K. Conductivity studies of starch-based polymer electrolytes. Ionics 2010, 16, 123–129. [Google Scholar] [CrossRef]
  55. Hema, M.; Selvasekerapandian, S.; Hirankumar, G. Vibrational and impedance spectroscopic analysis of poly(vinyl alcohol)-based solid polymer electrolytes. Ionics 2007, 13, 483–487. [Google Scholar] [CrossRef]
  56. Pradhan, D.K.; Samantaray, B.K.; Choudhary, R.N.P.; Karan, N.K.; Thomas, R.; Katiyar, R.S. Effect of plasticizer on structural and electrical properties of nanocomposite solid polymer electrolytes. Ionics 2011, 17, 127–134. [Google Scholar] [CrossRef]
  57. Mohapatra, S.R.; Thakur, A.K.; Choudhary, R.N.P. Effect of nanoscopic confinement on improvement in ion conduction and stability properties of an intercalated polymer nanocomposite electrolyte for energy storage applications. J. Power Sources 2009, 191, 601–613. [Google Scholar] [CrossRef]
  58. Shuhaimi, N.E.A.; Teo, L.P.; Woo, H.J.; Majid, S.R.; Arof, A.K. Electrical double-layer capacitors with plasticized polymer electrolyte based on methyl cellulose. Polym. Bull. 2012, 69, 807–826. [Google Scholar] [CrossRef]
  59. Aziz, S.B.; Abdullah, R.M.; Kadir, M.F.Z.; Ahmed, H.M. Non suitability of silver ion conducting polymer electrolytes based on chitosan mediated by barium titanate (BaTiO3) for electrochemical device applications. Electrochim. Acta 2019, 296, 494–507. [Google Scholar] [CrossRef]
  60. Aziz, S.B.; Abdulwahid, R.T.; Kadir, M.F.Z.; Ghareeb, H.O.; Ahamad, T.; Alshehri, S.M. Design of non-faradaic EDLC from plasticized MC based polymer electrolyte with an energy density close to lead-acid batteries. J. Ind. Eng. Chem. 2021, 105, 414–426. [Google Scholar] [CrossRef]
  61. Aziz, N.A.; Majid, S.R.; Arof, A.K. Synthesis and characterizations of phthaloyl chitosan-based polymer electrolytes. J. Non. Cryst. Solids 2012, 358, 1581–1590. [Google Scholar] [CrossRef]
  62. Das, S.; Ghosh, A. Ionic conductivity and dielectric permittivity of PEO-LiClO4 solid polymer electrolyte plasticized with propylene carbonate. AIP Adv. 2015, 5, 027125. [Google Scholar] [CrossRef]
  63. Hadi, J.M.; Aziz, S.B.; Brza, M.; Kadir, M.; Abdulwahid, R.T.; Al-Asbahi, B.A.; Ahmed, A.A.A. Structural and energy storage behavior of ion conducting biopolymer blend electrolytes based on methylcellulose: Dextran polymers. Alex. Eng. J. 2022, 61, 9273–9285. [Google Scholar] [CrossRef]
  64. Lu, G.; Kong, L.; Sheng, B.; Wang, G.; Gong, Y.; Zhang, X. Degradation of covalently cross-linked carboxymethyl chitosan and its potential application for peripheral nerve regeneration. Eur. Polym. J. 2007, 43, 3807–3818. [Google Scholar] [CrossRef]
  65. Ravi, M.; Song, S.-H.; Gu, K.-M.; Tang, J.-N.; Zhang, Z.-Y. Effect of lithium thiocyanate addition on the structural and electrical properties of biodegradable poly(ε-caprolactone) polymer films. Ionics 2015, 21, 2171–2183. [Google Scholar] [CrossRef]
  66. Ramesh, S.; Yuen, T.F.; Shen, C.J. Conductivity and FTIR studies on PEO–LiX [X: CF3SO3, SO42−] polymer electrolytes. Spectrochim. Acta Part A Mol. Biomol. Spectrosc. 2008, 69, 670–675. [Google Scholar] [CrossRef] [PubMed]
  67. Wang, X.; Chen, Y.; Zheng, B.; Qi, F.; He, J.; Li, Q.; Li, P.; Zhang, W. Graphene-like WSe2 nanosheets for efficient and stable hydrogen evolution. J. Alloy. Compd. 2017, 691, 698–704. [Google Scholar] [CrossRef]
  68. Agrawal, P.; Strijkers, G.J.; Nicolay, K. Chitosan-based systems for molecular imaging. Adv. Drug Deliv. Rev. 2010, 62, 42–58. [Google Scholar] [CrossRef]
  69. Aziz, S.; Abidin, Z.H.Z. Electrical Conduction Mechanism in Solid Polymer Electrolytes: New Concepts to Arrhenius Equation. J. Soft Matter 2013, 2013, 323868. [Google Scholar] [CrossRef]
  70. Painuly, J. Barriers to renewable energy penetration; a framework for analysis. Renew. Energy 2001, 24, 73–89. [Google Scholar] [CrossRef]
  71. Woo, H.; Majid, S.; Arof, A. Conduction and thermal properties of a proton conducting polymer electrolyte based on poly (ε-caprolactone). Solid State Ionics 2011, 199, 14–20. [Google Scholar] [CrossRef]
  72. Singh, R.; Singh, P.K.; Singh, V.; Bhattacharya, B. Quantitative analysis of ion transport mechanism in biopolymer electrolyte. Opt. Laser Technol. 2019, 113, 303–309. [Google Scholar] [CrossRef]
  73. Flora, X.H.; Ulaganathan, M.; Rajendran, S. Influence of lithium salt concentration on PAN-PMMA blend polymer electrolytes. Int. J. Electrochem. Sci. 2012, 7, 7451–7462. [Google Scholar]
  74. Rahaman, M.H.A.; Khandaker, M.U.; Khan, Z.R.; Kufian, M.Z.; Noor, I.S.M.; Arof, A.K. Effect of gamma irradiation on poly(vinyledene difluoride)–lithium bis(oxalato)borate electrolyte. Phys. Chem. Chem. Phys. 2014, 16, 11527–11537. [Google Scholar] [CrossRef] [PubMed]
  75. Woo, H.; Arof, A. Vibrational studies of flexible solid polymer electrolyte based on PCL–EC incorporated with proton conducting NH4SCN. Spectrochim. Acta Part A Mol. Biomol. Spectrosc. 2016, 161, 44–51. [Google Scholar] [CrossRef]
  76. Ramlli, M.A.; Isa, M.I.N. Structural and Ionic Transport Properties of Protonic Conducting Solid Biopolymer Electrolytes Based on Carboxymethyl Cellulose Doped with Ammonium Fluoride. J. Phys. Chem. 2016, 120, 11567–11573. [Google Scholar] [CrossRef] [PubMed]
  77. Chai, M.N.; Isa, M.I.N. Electrical Characterization and Ionic Transport Properties of Carboxyl Methylcellulose-Oleic Acid Solid Polymer Electrolytes. Int. J. Polym. Anal. Charact. 2013, 18, 280–286. [Google Scholar] [CrossRef]
  78. Hemalatha, R.; Alagar, M.; Selvasekarapandian, S.; Sundaresan, B.; Moniha, V. Studies of proton conducting polymer electrolyte based on PVA, amino acid proline and NH4SCN. J. Sci. Adv. Mater. Devices 2019, 4, 101–110. [Google Scholar] [CrossRef]
  79. Ramya, C.S.; Selvasekarapandian, S.; Savitha, T.; Hirankumar, G.; Angelo, P.C. Vibrational and impedance spectroscopic study on PVP-NH4SCN based polymer electrolytes. Phys. B Condens. Matter 2007, 393, 11–17. [Google Scholar] [CrossRef]
  80. Jayanthi, S.; Arulsankar, A.; Kokila, G.P.; Banulakshmi, S.; Sundaresan, B. FTIR, XRD and AC impedance studies of the polymer electrolyte PEMA—KSCN added with SrTiO3. Int. J. Chem. Tech. Res. 2014, 6, 5366–5371. [Google Scholar]
  81. Das, S.; Ghosh, A. Ionic conductivity and dielectric permittivity of polymer electrolyte plasticized with polyethylene glycol. AIP Conf. Proc. 2016, 1731, 110012. [Google Scholar] [CrossRef]
  82. Arya, A.; Sadiq, M.; Sharma, A. Salt concentration and temperature dependent dielectric properties of blend solid polymer electrolyte complexed with NaPF6. Mater. Today Proc. 2019, 12, 554–564. [Google Scholar] [CrossRef]
  83. Aziz, S.; Hadi, J.M.; Dannoun, E.; Abdulwahid, R.; Saeed, S.R.; Marf, A.S.; Karim, W.; Kadir, M. The Study of Plasticized Amorphous Biopolymer Blend Electrolytes Based on Polyvinyl Alcohol (PVA): Chitosan with High Ion Conductivity for Energy Storage Electrical Double-Layer Capacitors (EDLC) Device Application. Polymers 2020, 12, 1938. [Google Scholar] [CrossRef] [PubMed]
  84. Nofal, M.M.; Aziz, S.B.; Hadi, J.M.; Abdulwahid, R.T.; Dannoun, E.M.A.; Marif, A.S.; Al-Zangana, S.; Zafar, Q.; Brza, M.A.; Kadir, M.F.Z. Synthesis of Porous Proton Ion Conducting Solid Polymer Blend Electrolytes Based on PVA: CS Polymers: Structural, Morphological and Electrochemical Properties. Materials 2020, 13, 4890. [Google Scholar] [CrossRef] [PubMed]
  85. Abarna, S.; Hirankumar, G. Electrical, dielectric and electrochemical studies on new Li ion conducting solid polymer electrolytes based on polyethylene glycol p-tert-octylphenyl ether. Polym. Sci.-Ser. A 2017, 59, 660–668. [Google Scholar] [CrossRef]
  86. Hadi, J.M.; Aziz, S.B.; Mustafa, M.S.; Hamsan, M.H.; Abdulwahid, R.T.; Kadir, M.F.Z.; Ghareeb, H.O. Role of nano-capacitor on dielectric constant enhancement in PEO:NH4SCN:xCeO2 polymer nano-composites: Electrical and electrochemical properties. J. Mater. Res. Technol. 2020, 9, 9283–9294. [Google Scholar] [CrossRef]
  87. Pradhan, D.K.; Choudhary, R.; Samantaray, B. Studies of dielectric and electrical properties of plasticized polymer nanocomposite electrolytes. Mater. Chem. Phys. 2009, 115, 557–561. [Google Scholar] [CrossRef]
  88. Kulshrestha, N.; Chatterjee, B.; Gupta, P.N. Structural, thermal, electrical, and dielectric properties of synthesized nanocomposite solid polymer electrolytes. High Perform. Polym. 2014, 26, 677–688. [Google Scholar] [CrossRef]
  89. Choudhary, S.; Sengwa, R.J. Structural and dielectric studies of amorphous and semicrystalline polymers blend-based nanocomposite electrolytes. J. Appl. Polym. Sci. 2015, 132, 23–29. [Google Scholar] [CrossRef]
  90. Hadi, J.M.; Aziz, S.B.; Saeed, S.R.; Brza, M.A.; Abdulwahid, R.T.; Hamsan, M.H.; Abdullah, R.M.; Kadir, M.F.Z.; Muzakir, S.K. Investigation of Ion Transport Parameters and Electrochemical Performance of Plasticized Biocompatible Chitosan-Based Proton Conducting Polymer Composite Electrolytes. Membranes 2020, 10, 363. [Google Scholar] [CrossRef]
  91. Rauf, H.G.; Hadi, J.M.; Aziz, S.B.; Abdulwahid, R.T.; Mustafa, M.S. A Novel Approach to Design High Resistive Polymer Electrolytes Based on PVC: Electrochemical Impedance and Dielectric Properties. Int. J. Electrochem. Sci. 2022, 17, 22051. [Google Scholar] [CrossRef]
  92. Ayesh, A. Dielectric Relaxation and Thermal Stability of Polycarbonate Doped with MnCl2 Salt. J. Thermoplast. Compos. Mater. 2008, 21, 309–322. [Google Scholar] [CrossRef]
  93. Ramya, C.; Selvasekarapandian, S.; Hirankumar, G.; Savitha, T.; Angelo, P. Investigation on dielectric relaxations of PVP–NH4SCN polymer electrolyte. J. Non-Cryst. Solids 2008, 354, 1494–1502. [Google Scholar] [CrossRef]
  94. Aziz, S.B.; Karim, W.O.; Brza, M.A.; Abdulwahid, R.T.; Saeed, S.R.; Al-Zangana, S.; Kadir, M.F.Z. Ion Transport Study in CS: POZ Based Polymer Membrane Electrolytes Using Trukhan Model. Int. J. Mol. Sci. 2019, 20, 5265. [Google Scholar] [CrossRef] [PubMed]
  95. Di Noto, V.; Vittadello, M. Mechanism of ionic conductivity in poly (ethylene glycol 400)/(MgCl2) x polymer electrolytes: Studies based on electrical spectroscopy. Solid State Ionics 2002, 147, 309–316. [Google Scholar] [CrossRef]
  96. Selvin, P.C.; Perumal, P.; Selvasekarapandian, S.; Monisha, S.; Boopathi, G.; Chandra, M.V.L. Study of proton-conducting polymer electrolyte based on K-carrageenan and NH4SCN for electrochemical devices. Ionics 2018, 24, 3535–3542. [Google Scholar] [CrossRef]
  97. Aziz, S.B.; Abdullah, R.M.; Rasheed, M.A.; Ahmed, H.M. Role of Ion Dissociation on DC Conductivity and Silver Nanoparticle Formation in PVA:AgNt Based Polymer Electrolytes: Deep Insights to Ion Transport Mechanism. Polymers 2017, 9, 338. [Google Scholar] [CrossRef]
  98. Hassib, H.; Razik, A.A. Dielectric properties and AC conduction mechanism for 5,7-dihydroxy-6-formyl-2-methylbenzo-pyran-4-one bis-schiff base. Solid State Commun. 2008, 147, 345–349. [Google Scholar] [CrossRef]
  99. Sahoo, P.S.; Panigrahi, A.; Patri, S.K.; Choudhary, R.N.P. Impedance spectroscopy of Ba3Sr2DyTi3V7O30 ceramic. Bull. Mater. Sci. 2010, 33, 129–134. [Google Scholar] [CrossRef]
  100. Natesan, B.; Karan, N.K.; Katiyar, R.S. Ion relaxation dynamics and nearly constant loss behavior in polymer electrolyte. Phys. Rev. E 2006, 74, 042801. [Google Scholar] [CrossRef]
  101. Yang, J.; Meng, X.J.; Shen, M.R.; Fang, L.; Wang, J.L.; Lin, T.; Sun, J.L.; Chu, J.H. Hopping conduction and low-frequency dielectric relaxation in 5mol% Mn doped (Pb,Sr)TiO3 films. J. Appl. Phys. 2008, 104, 104113. [Google Scholar] [CrossRef]
  102. Migahed, M.; Ishra, M.; Fahmy, T.; Barakat, A. Electric modulus and AC conductivity studies in conducting PPy composite films at low temperature. J. Phys. Chem. Solids 2004, 65, 1121–1125. [Google Scholar] [CrossRef]
  103. Bhadra, S.; Singha, N.K.; Khastgir, D. Dielectric properties and EMI shielding efficiency of polyaniline and ethylene 1-octene based semi-conducting composites. Curr. Appl. Phys. 2009, 9, 396–403. [Google Scholar] [CrossRef]
Figure 1. Schematic representation of the cell used to measure conductivity.
Materials 15 05579 g001
Figure 2. The EIS and simulated data for (a) MCK1, (b) MCK2, (c) MCK3, (d) MCK4, and (e) MCK5.
Materials 15 05579 g002
Figure 3. An EEC diagram for impedance graphs shows a high-frequency semicircle and a low-frequency tail as a schematic representation.
Materials 15 05579 g003
Figure 4. Full range of FTIR spectra for MC:KSCN systems.
Materials 15 05579 g004
Figure 5. The SCN deconvoluted band for (a) MCK1, (b) MCK2, (c) MCK3, (d) MCK4 and (e) MCK5.
Materials 15 05579 g005
Figure 6. The percentage (%) of free ions, contact ions and ion aggregates vs. salt concentrations.
Materials 15 05579 g006
Figure 7. Illustrates the frequency dependence of the dielectric constant for all MC:KSN systems in frequency range (100–2 MHZ).
Materials 15 05579 g007
Figure 8. The relationship between dielectric loss versus frequency for all MC:KSN systems in frequency range (100–2 MHZ).
Materials 15 05579 g008
Figure 9. Illustrates the frequency dependence of the M′ for all MC:KSN systems in frequency range (100–2 MHZ).
Materials 15 05579 g009
Figure 10. Illustrates the frequency dependence of the M″ for all MC:KSN systems in frequency range (100–2 MHZ).
Materials 15 05579 g010
Figure 11. AC conductivity spectra for all MC:KSN systems in frequency range (100–2 MHZ). Based on AC spectra also MCK3 is the highest conducting electrolyte.
Materials 15 05579 g011
Table 1. Bulk resistance and circuit elements for MC:KSCN SPE films.
Samplep1 (Rad)p2 (Rad)CPE1 (F)CPE2 (F)Rb (Ω)Conductivity (S/cm)
MCKN10.91-4.00 × 10⁻¹⁰-1.15 × 1071.34 × 10−9
MCKN20.86-7.41 × 10⁻¹⁰-1.66 × 1069.30 × 10−9
MCKN30.830.511.82 × 10−92.22 × 10−65.15 × 1042.99 × 10−7
MCKN40.860.431.33 × 10−91.43 × 10−61.00 × 1051.54 × 10−7
MCKN50.900.431.17 × 10−95.26 × 10−72.60 × 1055.93 × 10−8
Table 2. The values of D, µ, and n at room temperature from EIS measurement.
Sampleµ (cm2 V−1 s)D (cm2 s−1)n (cm−3)
MCKN1---
MCKN2---
MCKN35.92 × 10−101.52 × 10−113.16 × 10²¹
MCKN41.13 × 10−92.90 × 10−118.52 × 10²⁰
MCKN53.45 × 10−98.84 × 10−111.07 × 10²⁰
Table 3. The values of D, µ, and n at room temperature using FTIR method.
Samplen (cm−3)µ (cm2 V−1 s)D (cm2 s−1)
MCKN11.94 × 10214.32 × 10−121.13 × 10⁻¹³
MCKN24.78 × 10211.21 × 10−113.17 × 10⁻¹³
MCKN31.33 × 10221.41 × 10−103.68 × 10⁻¹²
MCKN43.92 × 10222.46 × 10−116.41 × 10⁻¹³
MCKN52.15 × 10221.72 × 10−114.49 × 10⁻¹³
Publisher’s Note: MDPI stays neutral with regard to jurisdictional claims in published maps and institutional affiliations.

