
Non-Destructive Detection of Real Defects in Polymer Composites by Ultrasonic Testing and Recurrence Analysis

 , , , , and
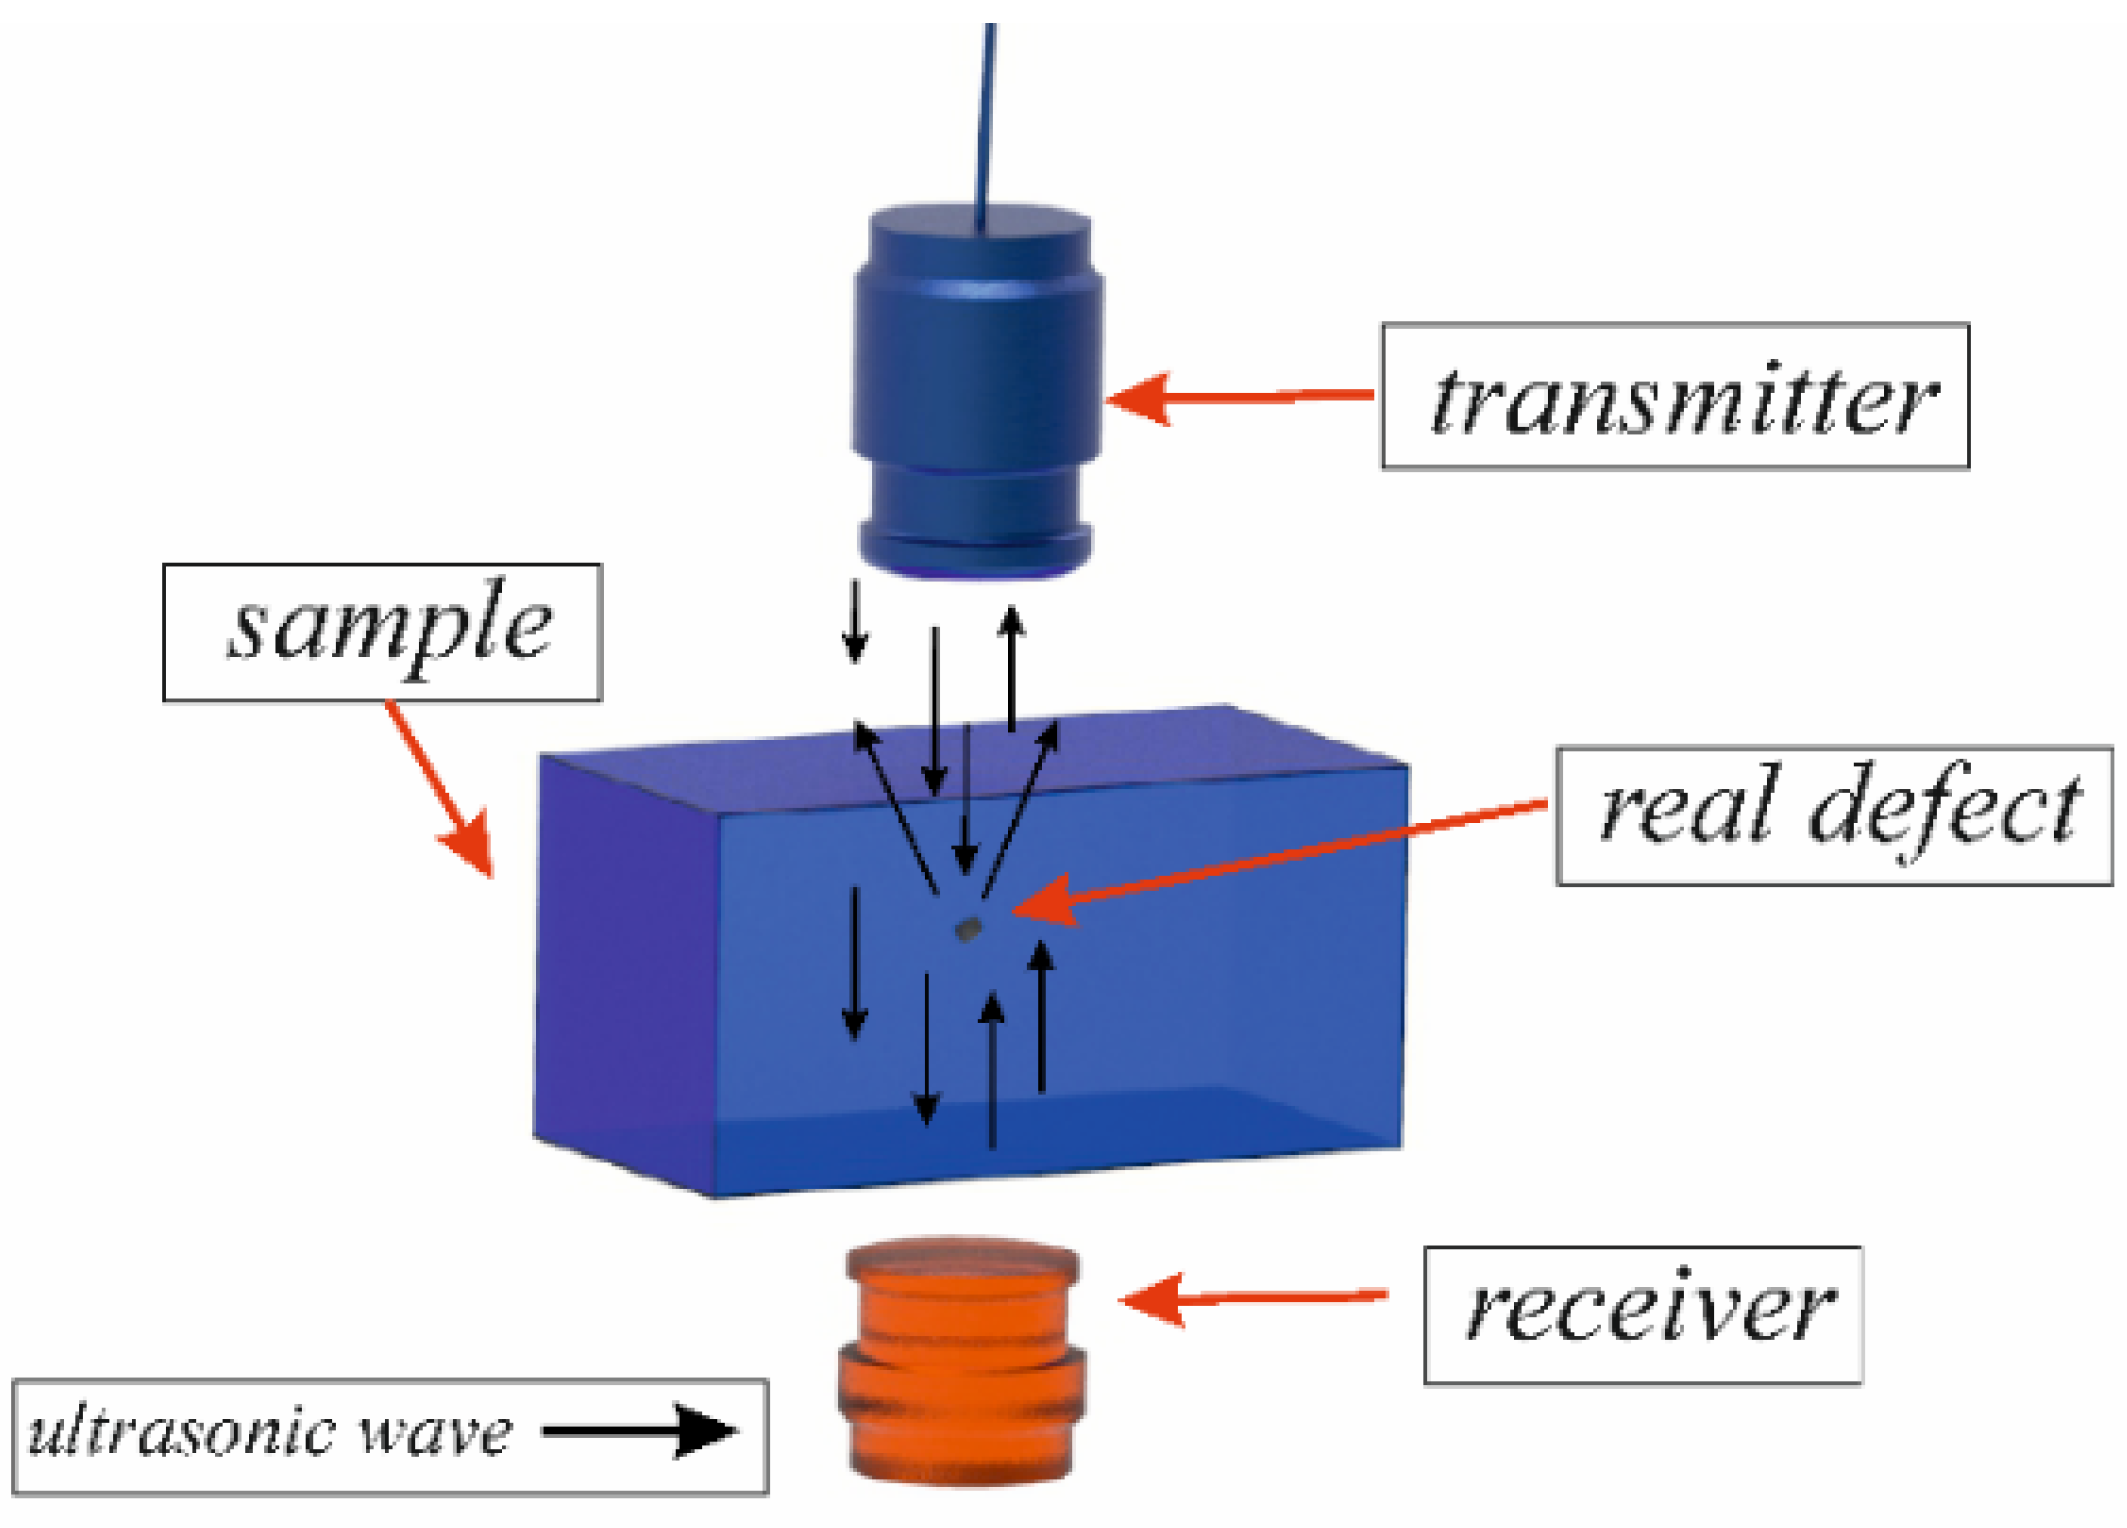
Abstract
:1. Introduction
1.1. Non-Destructive Testing
1.2. Ultrasonic Testing
1.3. Non-Linear Method for Defect Detection
1.4. Motivation and Aim
2. Materials and Methods
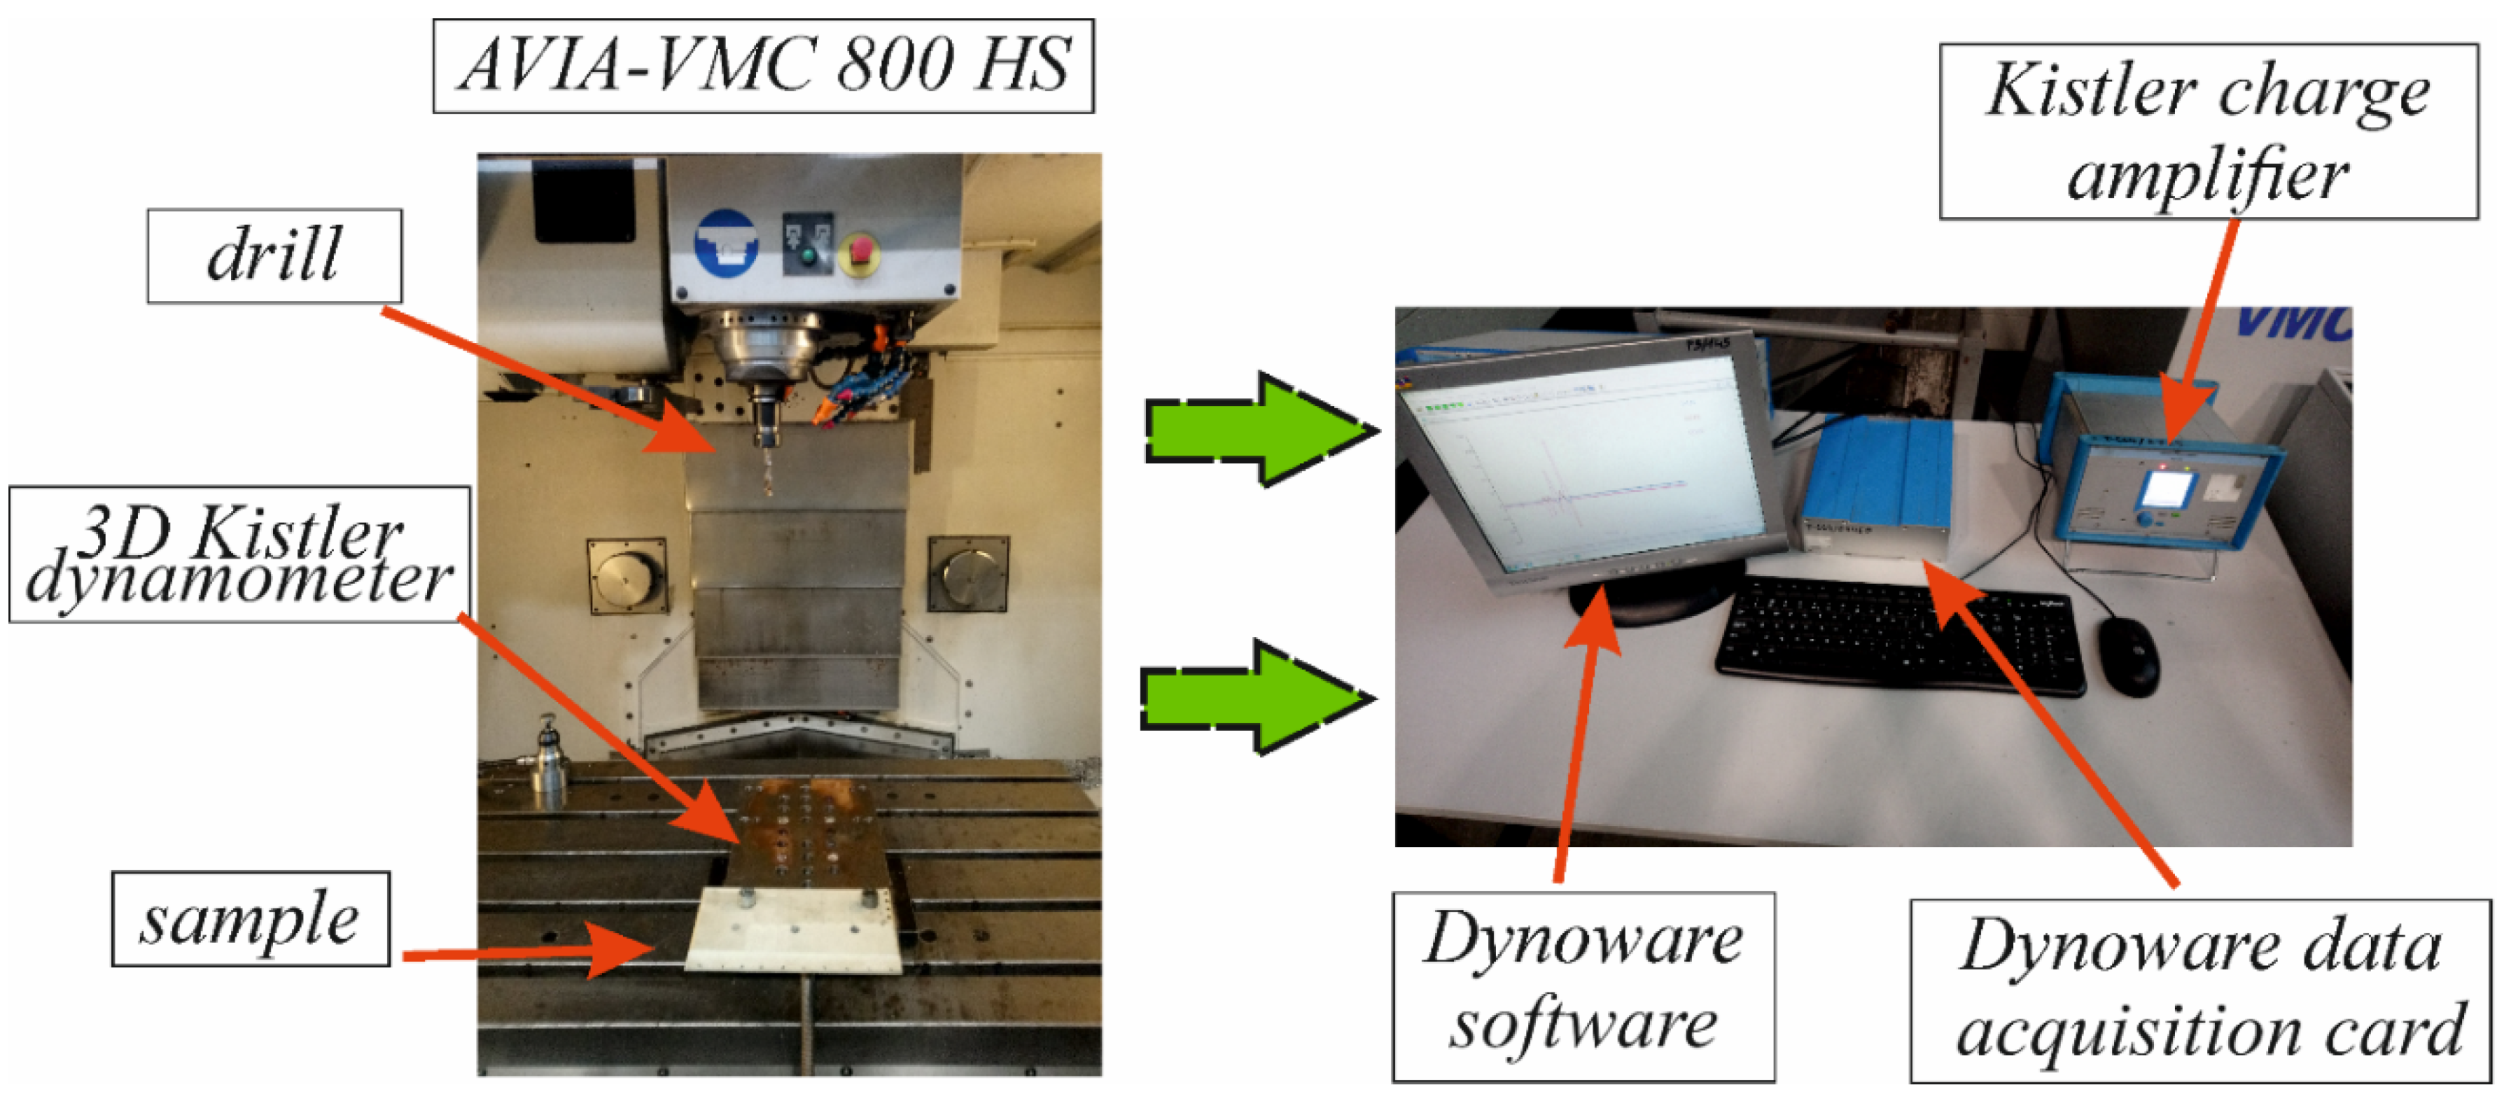
2.1. Specimens, Tools and Equipment
2.2. Machining and Measurements
3. Results and Discussion
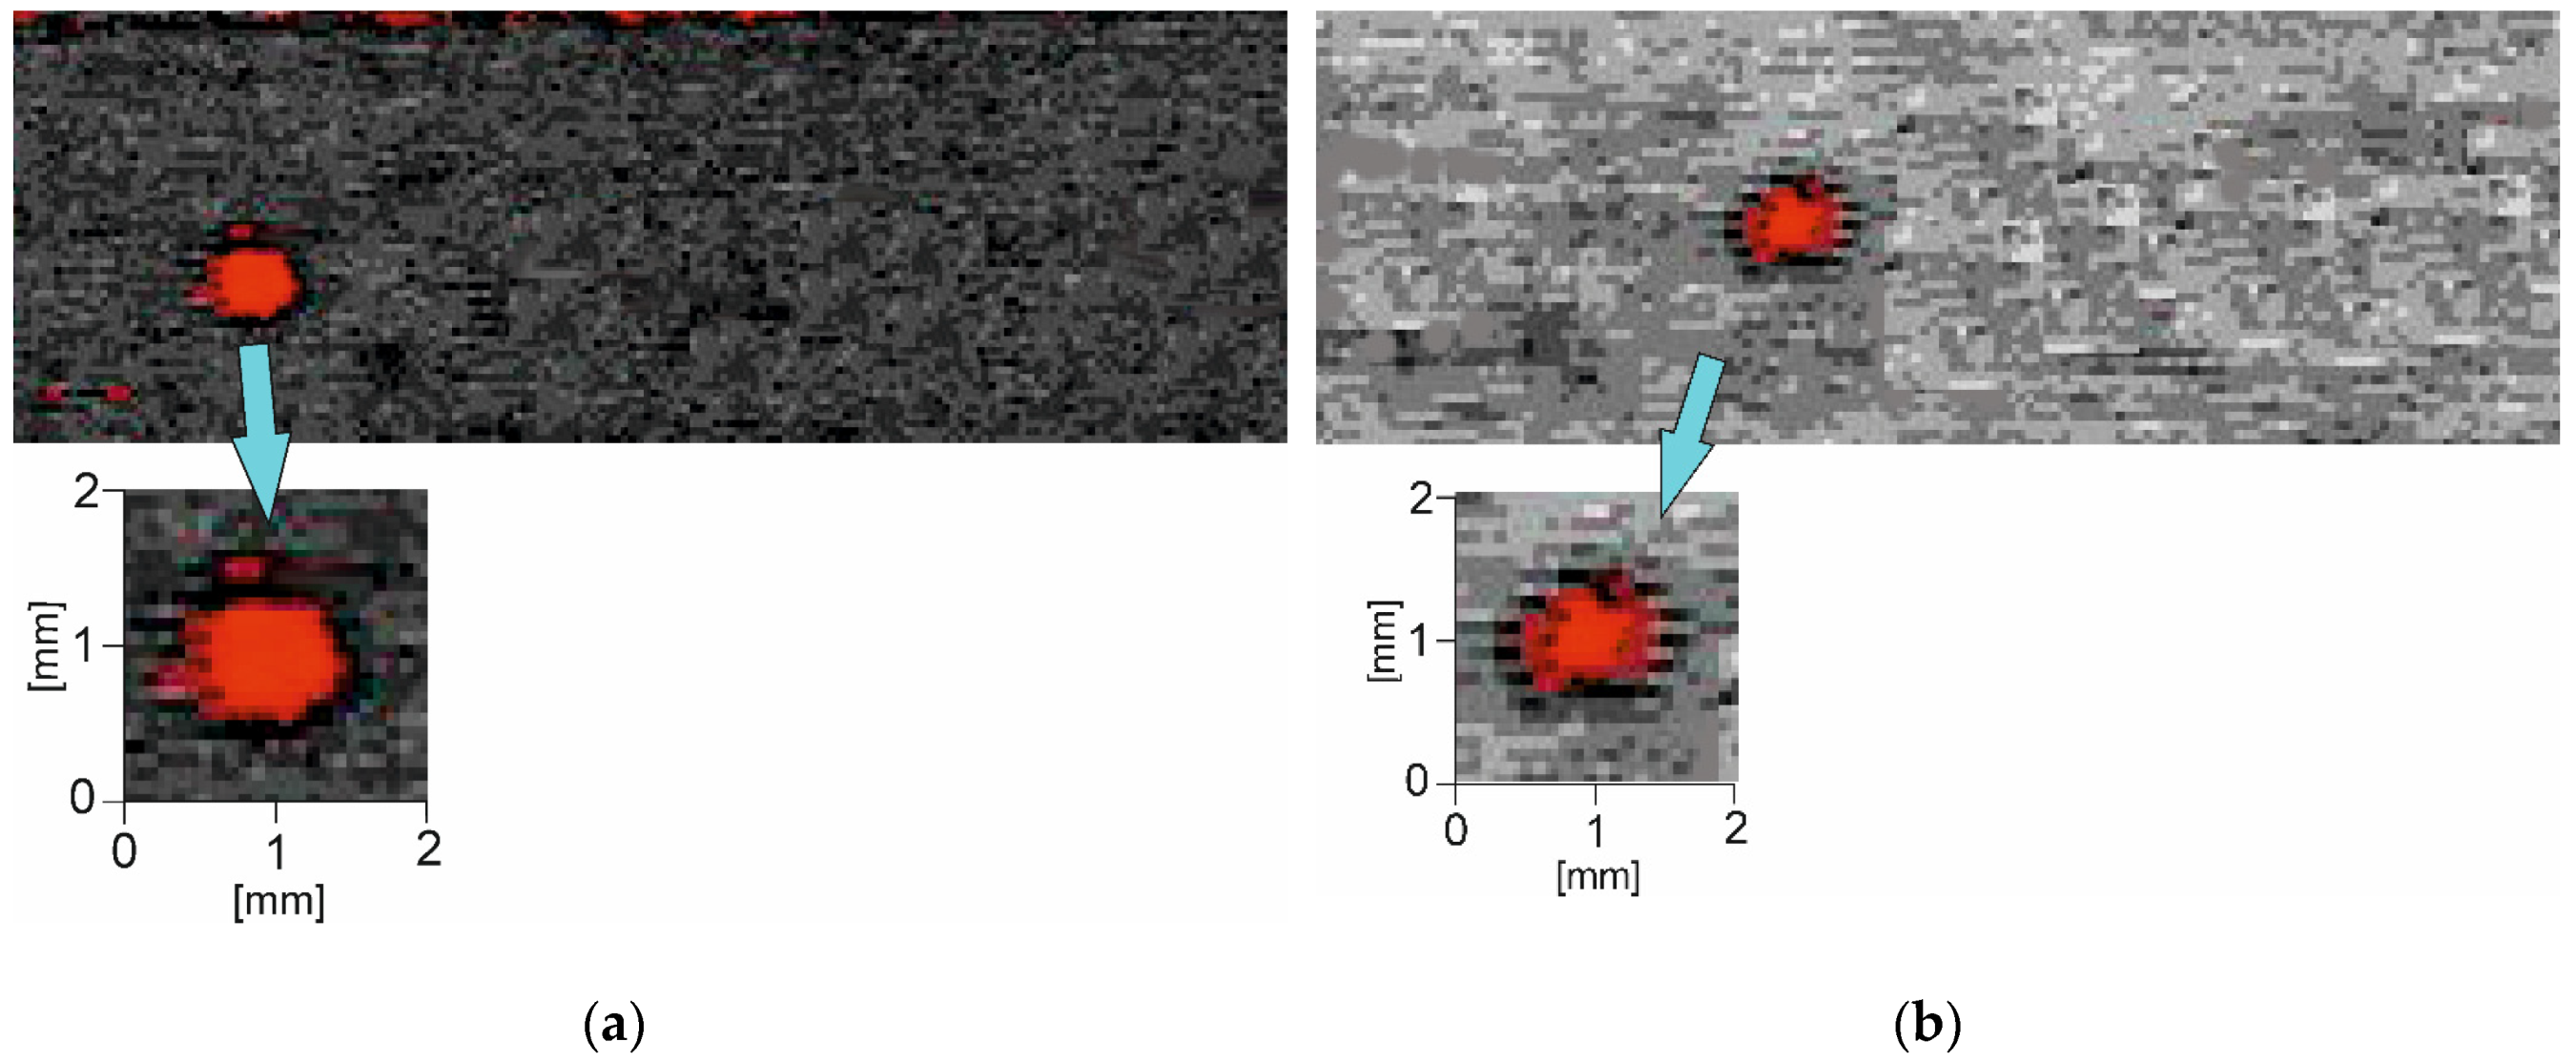
3.1. C-Scan Defect Detection
3.2. Recurrence Analysis
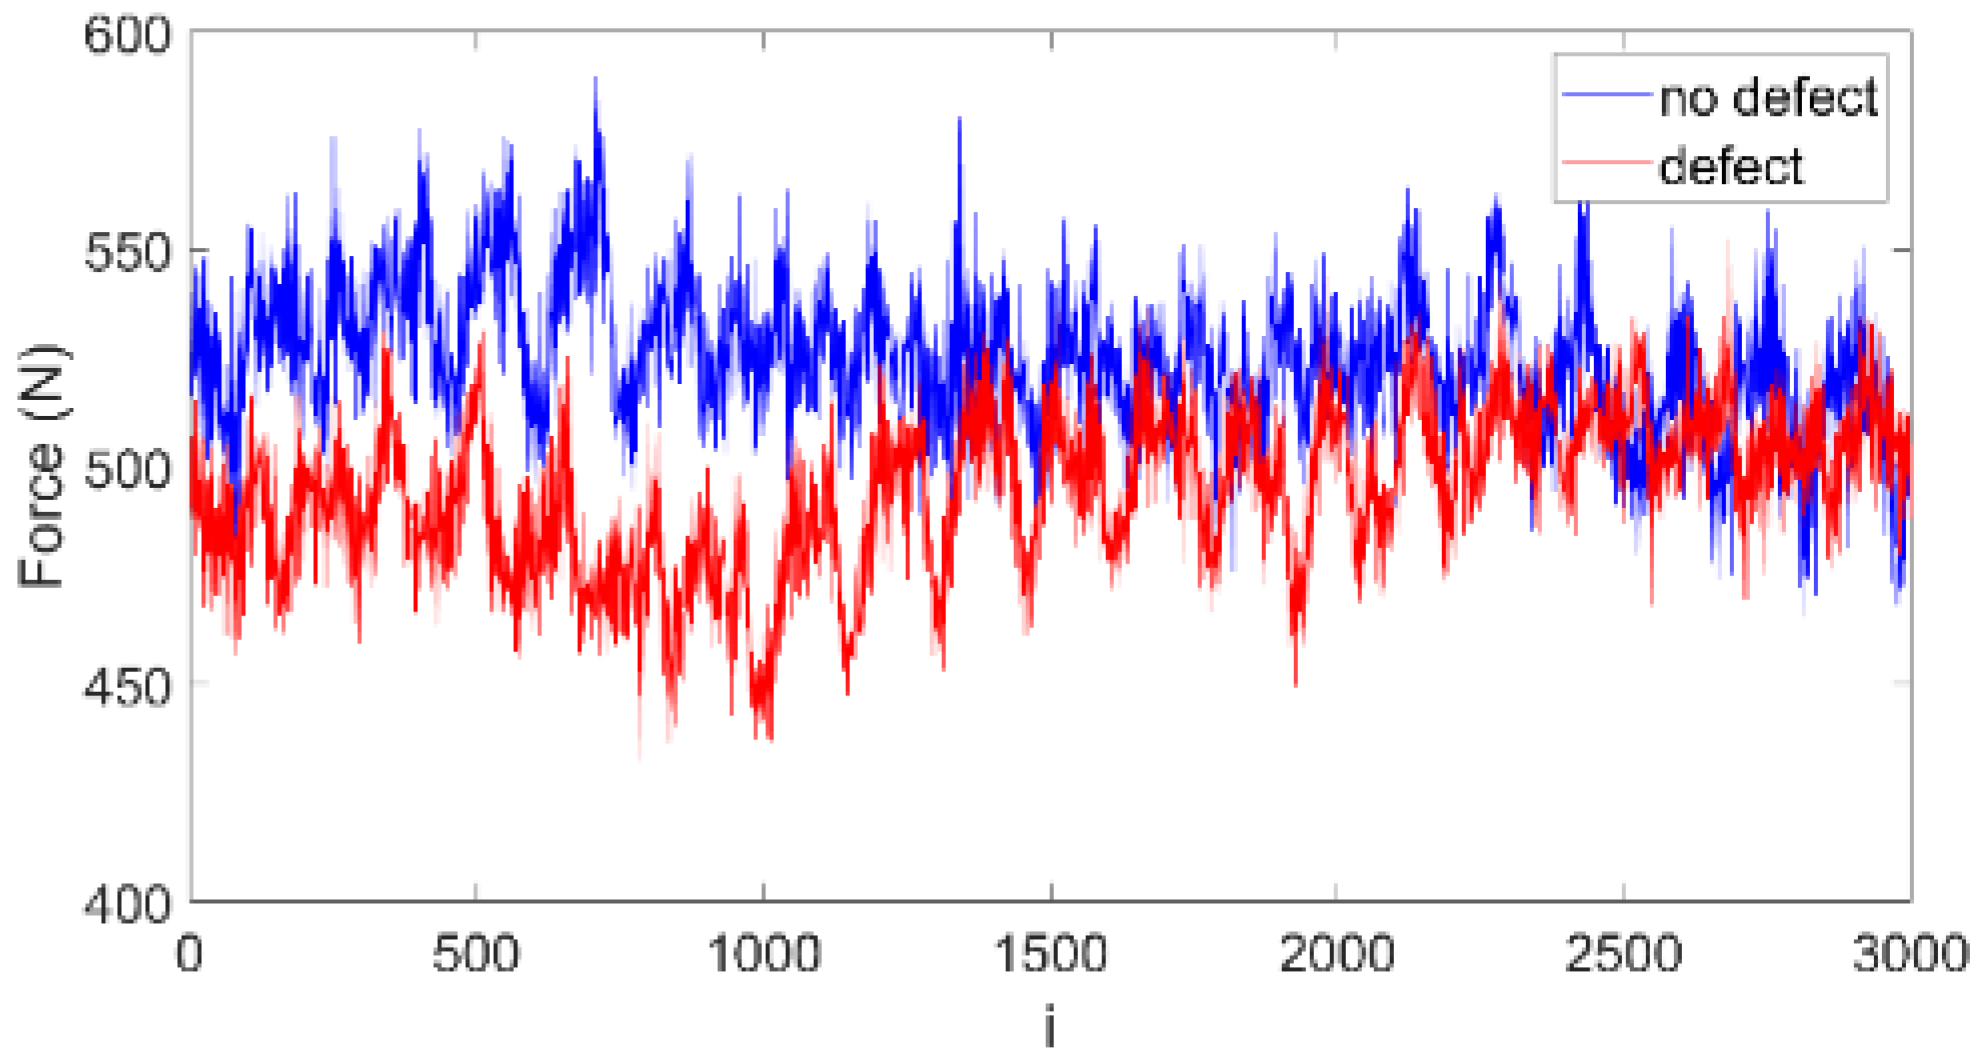
3.2.1. Recurrence Quantification Analysis of CFRP Drilling Signals
3.2.2. Recurrence Quantification Analysis of GFRP Drilling Signals
4. Conclusions
Author Contributions
Funding
Institutional Review Board Statement
Informed Consent Statement
Data Availability Statement
Conflicts of Interest
References
- Bowkett, M.; Thanapalan, K. Comparative Analysis of Failure Detection Methods of Composites Materials’ Systems. Syst. Sci. Control Eng. 2017, 5, 168–177. [Google Scholar] [CrossRef]
- Zhang, Z. Relation of Damping and Fatigue Damage of Unidirectional Fibre Composites. Int. J. Fatigue 2002, 24, 713–718. [Google Scholar] [CrossRef]
- Wang, B.; Zhong, S.; Lee, T.L.; Fancey, K.S.; Mi, J. Non-Destructive Testing and Evaluation of Composite Materials/Structures: A State-of-the-Art Review. Adv. Mech. Eng. 2020, 12. [Google Scholar] [CrossRef] [Green Version]
- Skoczylas, A.; Zaleski, K.; Zaleski, R.; Gorgol, M. Analysis of Surface Properties of Nickel Alloy Elements Exposed to Impulse Shot Peening with the Use of Positron Annihilation. Materials 2021, 14, 7328. [Google Scholar] [CrossRef]
- Brown, M.; Wright, D.; M’Saoubi, R.; McGourlay, J.; Wallis, M.; Mantle, A.; Crawforth, P.; Ghadbeigi, H. Destructive and Non-Destructive Testing Methods for Characterization and Detection of Machining-Induced White Layer: A Review Paper. CIRP J. Manuf. Sci. Technol. 2018, 23, 39–53. [Google Scholar] [CrossRef]
- Gholizadeh, S. A Review of Non-Destructive Testing Methods of Composite Materials. Procedia Struct. Integr. 2016, 1, 50–57. [Google Scholar] [CrossRef] [Green Version]
- Lopez, A.; Bacelar, R.; Pires, I.; Santos, T.G.; Sousa, J.P.; Quintino, L. Non-Destructive Testing Application of Radiography and Ultrasound for Wire and Arc Additive Manufacturing. Addit. Manuf. 2018, 21, 298–306. [Google Scholar] [CrossRef]
- Shaloo, M.; Schnall, M.; Klein, T.; Huber, N.; Reitinger, B. A Review of Non-Destructive Testing (NDT) Techniques for Defect Detection: Application to Fusion Welding and Future Wire Arc Additive Manufacturing Processes. Materials 2022, 15, 3697. [Google Scholar] [CrossRef]
- Wronkowicz, A.; Dragan, K.; Lis, K. Assessment of Uncertainty in Damage Evaluation by Ultrasonic Testing of Composite Structures. Compos. Struct. 2018, 203, 71–84. [Google Scholar] [CrossRef]
- Olisa, S.C.; Khan, M.A.; Starr, A. Review of Current Guided Wave Ultrasonic Testing (GWUT) Limitations and Future Directions. Sensors 2021, 21, 811. [Google Scholar] [CrossRef]
- Honarvar, F.; Varvani-Farahani, A. A Review of Ultrasonic Testing Applications in Additive Manufacturing: Defect Evaluation, Material Characterization, and Process Control. Ultrasonics 2020, 108, 106227. [Google Scholar] [CrossRef]
- Hung, Y.Y.; Yang, L.X.; Huang, Y.H. Non-Destructive Evaluation (NDE) of Composites: Digital Shearography. In Non-Destructive Evaluation (NDE) of Polymer Matrix Composites; Elsevier: Amsterdam, The Netherlands, 2013; pp. 84–115. ISBN 978-0-85709-344-8. [Google Scholar]
- Lindgren, E. Detection, 3-D Positioning, and Sizing of Small Pore Defects Using Digital Radiography and Tracking. EURASIP J. Adv. Signal Process. 2014, 2014, 9. [Google Scholar] [CrossRef] [Green Version]
- Fotouhi, S.; Pashmforoush, F.; Bodaghi, M.; Fotouhi, M. Autonomous Damage Recognition in Visual Inspection of Laminated Composite Structures Using Deep Learning. Compos. Struct. 2021, 268, 113960. [Google Scholar] [CrossRef]
- Ray, B.C. Temperature Effect during Humid Ageing on Interfaces of Glass and Carbon Fibers Reinforced Epoxy Composites. J. Colloid Interface Sci. 2006, 298, 111–117. [Google Scholar] [CrossRef]
- Šturm, R.; Grimberg, R.; Savin, A.; Grum, J. Destructive and Nondestructive Evaluations of the Effect of Moisture Absorption on the Mechanical Properties of Polyester-Based Composites. Compos. Part B Eng. 2015, 71, 10–16. [Google Scholar] [CrossRef]
- El-Sabbagh, A.; Steuernagel, L.; Ziegmann, G. Characterisation of Flax Polypropylene Composites Using Ultrasonic Longitudinal Sound Wave Technique. Compos. Part B Eng. 2013, 45, 1164–1172. [Google Scholar] [CrossRef]
- Rojek, M.; Stabik, J.; Wróbel, G. Ultrasonic Methods in Diagnostics of Epoxy-Glass Composites. J. Mater. Process. Technol. 2005, 162–163, 121–126. [Google Scholar] [CrossRef] [Green Version]
- Talreja, R. Damage and Fatigue in Composites—A Personal Account. Compos. Sci. Technol. 2008, 68, 2585–2591. [Google Scholar] [CrossRef]
- Aggelis, D.G.; Paipetis, A.S. Monitoring of Resin Curing and Hardening by Ultrasound. Constr. Build. Mater. 2012, 26, 755–760. [Google Scholar] [CrossRef]
- Kersemans, M.; De Baere, I.; Degrieck, J.; Van Den Abeele, K.; Pyl, L.; Zastavnik, F.; Sol, H.; Van Paepegem, W. Nondestructive Damage Assessment in Fiber Reinforced Composites with the Pulsed Ultrasonic Polar Scan. Polym. Test. 2014, 34, 85–96. [Google Scholar] [CrossRef]
- Loganathan, T.M.; Sultan, M.T.; Gobalakrishnan, M.K. Ultrasonic Inspection of Natural Fiber-Reinforced Composites. In Sustainable Composites for Aerospace Applications; Woodhead Publishing: Sawston, UK, 2018; pp. 227–257. [Google Scholar] [CrossRef]
- Giurgiutiu, V. Damage and Failure of Aerospace Composites. In Structural Health Monitoring of Aerospace Composites; Elsevier: Amsterdam, The Netherlands, 2016; pp. 125–175. [Google Scholar]
- Narita, F.; Shindo, Y.; Takada, T.; Kuronuma, Y.; Sanada, K. Loading Rate-Dependent Fracture Properties and Electrical Resistance-Based Crack Growth Monitoring of Polycarbonate Reinforced with Carbon Nanotubes Under Tension. J. Test. Eval. 2014, 41, 20130334. [Google Scholar] [CrossRef]
- Short, G.J.; Guild, F.J.; Pavier, M.J. Delaminations in Flat and Curved Composite Laminates Subjected to Compressive Load. Compos. Struct. 2002, 58, 249–258. [Google Scholar] [CrossRef]
- Salski, B.; Gwarek, W.; Korpas, P.; Reszewicz, S.; Chong, A.Y.B.; Theodorakeas, P.; Hatziioannidis, I.; Kappatos, V.; Selcuk, C.; Gan, T.H.; et al. Non-Destructive Testing of Carbon-Fibre-Reinforced Polymer Materials with a Radio-Frequency Inductive Sensor. Compos. Struct. 2015, 122, 104–112. [Google Scholar] [CrossRef]
- Zhang, H.; Sfarra, S.; Sarasini, F.; Santulli, C.; Fernandes, H.; Avdelidis, N.P.; Ibarra-Castanedo, C.; Maldague, X.P.V. Thermographic Non-Destructive Evaluation for Natural Fiber-Reinforced Composite Laminates. Appl. Sci. 2018, 8, 240. [Google Scholar] [CrossRef] [Green Version]
- Cioffi, M.O.H.; Volpiano, G.; Voorwald, H.J.C.; Rezende, M.C. Carbon Fiber Non-Crimp Multi-Axial Reinforcement and Epoxy Mono-Component System Composite: Fatigue Behavior. Procedia Eng. 2010, 2, 341–348. [Google Scholar] [CrossRef] [Green Version]
- Kersemans, M.; Verboven, E.; Segers, J.; Hedayatrasa, S.; Paepegem, W.V. Non-Destructive Testing of Composites by Ultrasound, Local Defect Resonance and Thermography. Proceedings 2018, 2, 554. [Google Scholar] [CrossRef] [Green Version]
- Santos, M.; Santos, J.B.; Reis, P.; Amaro, A.P.B.M. Ultrasonic C-Scan Techniques for Damage Evaluation of Carbon Fiber Reinforced Polymers Submitted to Low Energy Impacts. Proc. Meet. Acoust. Acoust. Soc. Am. 2019, 38, 030002. [Google Scholar] [CrossRef]
- Meza, C.A.; Franco, E.E.; Ealo, J.L. Implementation of the Ultrasonic Through-Transmission Technique for the Elastic Characterization of Fiber-Reinforced Laminated Composite. DYNA 2019, 86, 153–161. [Google Scholar] [CrossRef]
- Brandt, C. Recurrence Quantification Analysis as an Approach for Ultrasonic Testing of Porous Carbon Fibre Reinforced Polymers. In Recurrence Plots and Their Quantifications: Expanding Horizons; Webber, C.L., Ioana, C., Marwan, N., Eds.; Springer Proceedings in Physics; Springer International Publishing: Cham, Switzerland, 2016; Volume 180, pp. 355–377. ISBN 978-3-319-29921-1. [Google Scholar]
- Castellano, A.; Foti, P.; Fraddosio, A.; Marzano, S.; Piccioni, M.D. Mechanical Characterization of CFRP Composites by Ultrasonic Immersion Tests: Experimental and Numerical Approaches. Compos. Part B Eng. 2014, 66, 299–310. [Google Scholar] [CrossRef]
- Bader, T.K.; Dastoorian, F.; Ebrahimi, G.; Unger, G.; Lahayne, O.; Hellmich, C.; Pichler, B. Combined Ultrasonic-Mechanical Characterization of Orthotropic Elastic Properties of an Unrefined Bagasse Fiber-Polypropylene Composite. Compos. Part B Eng. 2016, 95, 96–104. [Google Scholar] [CrossRef]
- Mat Daud, A.N.; Jaafar, R.; Ayop, S.K.; Yaacob, M.I.H.; Rohani, M.S. Elastic Constant Determination of Hardwoods Using Ultrasonic Insertion Technique. Ultrasonics 2017, 75, 194–198. [Google Scholar] [CrossRef]
- Asokkumar, A.; Jasiūnienė, E.; Raišutis, R.; Kažys, R.J. Comparison of Ultrasonic Non-contact Air-coupled Techniques for Characterization of Impact-type Defects in Pultruded Gfrp Composites. Materials 2021, 14, 1058. [Google Scholar] [CrossRef]
- Jorge Aldave, I.; Venegas Bosom, P.; Vega González, L.; López De Santiago, I.; Vollheim, B.; Krausz, L.; Georges, M. Review of Thermal Imaging Systems in Composite Defect Detection. Infrared Phys. Technol. 2013, 61, 167–175. [Google Scholar] [CrossRef]
- Eckmann, J.-P.; Kamphorst, S.O.; Ruelle, D. Recurrence Plots of Dynamical Systems. Europhys. Lett. 1987, 4, 973–977. [Google Scholar] [CrossRef] [Green Version]
- Schinkel, S.; Dimigen, O.; Marwan, N. Selection of Recurrence Threshold for Signal Detection. Eur. Phys. J. Spec. Top. 2008, 164, 45–53. [Google Scholar] [CrossRef]
- Fraser, A.M.; Swinney, H.L. Independent Coordinates for Strange Attractors from Mutual Information. Phys. Rev. A 1986, 33, 1134–1140. [Google Scholar] [CrossRef]
- Kennel, M.B.; Brown, R.; Abarbanel, H.D.I. Determining Embedding Dimension for Phase-Space Reconstruction Using a Geometrical Construction. Phys. Rev. A 1992, 45, 3403–3411. [Google Scholar] [CrossRef] [Green Version]
- Marwan, N.; Carmenromano, M.; Thiel, M.; Kurths, J. Recurrence Plots for the Analysis of Complex Systems. Phys. Rep. 2007, 438, 237–329. [Google Scholar] [CrossRef]
- Webber, C.L.; Zbilut, J.P. Dynamical Assessment of Physiological Systems and States Using Recurrence Plot Strategies. J. Appl. Physiol. 1994, 76, 965–973. [Google Scholar] [CrossRef]
- Zbilut, J.P.; Webber, C.L. Embeddings and Delays as Derived from Quantification of Recurrence Plots. Phys. Lett. A 1992, 171, 199–203. [Google Scholar] [CrossRef]
- Ciecieląg, K.; Skoczylas, A.; Matuszak, J.; Zaleski, K.; Kęcik, K. Defect Detection and Localization in Polymer Composites Based on Drilling Force Signal by Recurrence Analysis. Meas. J. Int. Meas. Confed. 2021, 186, 110126. [Google Scholar] [CrossRef]
- Kecik, K.; Ciecielag, K.; Zaleski, K. Damage Detection of Composite Milling Process by Recurrence Plots and Quantifications Analysis. Int. J. Adv. Manuf. Technol. 2017, 89, 133–144. [Google Scholar] [CrossRef] [Green Version]
- Iwaniec, J.; Iwaniec, M. Application of Recurrence-Based Methods to Heart Work Analysis. In Advances in Technical Diagnostics; Springer: Berlin/Heidelberg, Germany, 2018; pp. 343–352. [Google Scholar]
- Ciecieląg, K.; Kecik, K.; Zaleski, K. Defects Detection from Time Series of Cutting Force in Composite Milling Process by Recurrence Analysis. J. Reinf. Plast. Compos. 2020, 39, 890–901. [Google Scholar] [CrossRef]
- Kęcik, K.; Ciecieląg, K.; Zaleski, K. Damage Detection by Recurrence and Entropy Methods on the Basis of Time Series Measured during Composite Milling. Int. J. Adv. Manuf. Technol. 2020, 111, 549–563. [Google Scholar] [CrossRef]
- Marwan, N.; Kurths, J.; Foerster, S. Analysing Spatially Extended High-Dimensional Dynamics by Recurrence Plots. Phys. Lett. A 2015, 379, 894–900. [Google Scholar] [CrossRef] [Green Version]
- Marwan, N.; Donges, J.F.; Zou, Y.; Donner, R.V.; Kurths, J. Complex Network Approach for Recurrence Analysis of Time Series. Phys. Lett. A 2009, 373, 4246–4254. [Google Scholar] [CrossRef] [Green Version]
- Gao, J.; Cai, H. On the Structures and Quantification of Recurrence Plots. Phys. Lett. A 2000, 270, 75–87. [Google Scholar] [CrossRef]


Publisher’s Note: MDPI stays neutral with regard to jurisdictional claims in published maps and institutional affiliations. |
© 2022 by the authors. Licensee MDPI, Basel, Switzerland. This article is an open access article distributed under the terms and conditions of the Creative Commons Attribution (CC BY) license (https://creativecommons.org/licenses/by/4.0/).
Share and Cite
Ciecieląg, K.; Kęcik, K.; Skoczylas, A.; Matuszak, J.; Korzec, I.; Zaleski, R. Non-Destructive Detection of Real Defects in Polymer Composites by Ultrasonic Testing and Recurrence Analysis. Materials 2022, 15, 7335. https://doi.org/10.3390/ma15207335
Ciecieląg K, Kęcik K, Skoczylas A, Matuszak J, Korzec I, Zaleski R. Non-Destructive Detection of Real Defects in Polymer Composites by Ultrasonic Testing and Recurrence Analysis. Materials. 2022; 15(20):7335. https://doi.org/10.3390/ma15207335
Chicago/Turabian StyleCiecieląg, Krzysztof, Krzysztof Kęcik, Agnieszka Skoczylas, Jakub Matuszak, Izabela Korzec, and Radosław Zaleski. 2022. "Non-Destructive Detection of Real Defects in Polymer Composites by Ultrasonic Testing and Recurrence Analysis" Materials 15, no. 20: 7335. https://doi.org/10.3390/ma15207335