Article

Optical and Structural Properties of Composites Based on Poly(urethane) and TiO2 Nanowires

1
National Institute of Materials Physics, P.O. Box MG-7, Bucharest, Atomistilor Street 405A, 077125 Bucharest, Romania
2
SC All Green SRL, 8 George Cosbuc Str., 700470 Iasi, Romania
3
Electrical Engineering Faculty, Gheorghe Asachi Technical University of Iasi, Dimitrie Mangeron Bd. 67, 700050 Iasi, Romania
*
Author to whom correspondence should be addressed.
Materials 2023, 16(4), 1742; https://doi.org/10.3390/ma16041742
Submission received: 15 January 2023 / Revised: 17 February 2023 / Accepted: 19 February 2023 / Published: 20 February 2023

Abstract

:
This article’s objective is the synthesis of new composites based on thermoplastic polyurethane (TPU) and TiO2 nanowires (NWs) as free-standing films, highlighting their structural and optical properties. The free-standing TPU–TiO2 NW films were prepared by a wet chemical method accompanied by a thermal treatment at 100 °C for 1 h, followed by air-drying for 2 h. X-ray diffraction (XRD) studies indicated that the starting commercial TiO2 NW sample contains TiO2 tetragonal anatase (A), cubic Ti0.91O (C), and orthorhombic Ti2O3 (OR), as well as monoclinic H2Ti3O7 (M). In the presence of TPU, an increase in the ratio between the intensities of the diffraction peaks at 43.4° and 48° belonging to the C and A phases of titanium dioxide, respectively, is reported. The increase in the intensity of the peak at 43.4° is explained to be a consequence of the interaction of TiO2 NWs with PTU, which occurs when the formation of suboxides takes place. The variation in the ratio of the absorbance of the IR bands peaked at 765–771 cm−1 and 3304–3315 cm−1 from 4.68 to 4.21 and 3.83 for TPU and the TPU–TiO2 NW composites, respectively, with TiO2 NW concentration equal to 2 wt.% and 17 wt.%, indicated a decrease in the higher-order aggregates of TPU with a simultaneous increase in the hydrogen bonds established between the amide groups of TPU and the oxygen atoms of TiO2 NWs. The decrease in the ratio of the intensity of the Raman lines peaked at 658 cm−1 and 635 cm−1, which were assigned to the vibrational modes Eg in TiO2 A and Eg in H2Ti3O7 (ITiO2-A/IH2Ti3O7), respectively, from 3.45 in TiO2 NWs to 0.94–0.96 in the TPU–TiO2 NW composites, which indicates that the adsorption of TPU onto TiO2 NWs involves an exchange reaction of TPU in the presence of TiO2 NWs, followed by the formation of new hydrogen bonds between the -NH- of the amide group and the oxygen atoms of TixO2x-mn, Ti2O3, and Ti0.91O. Photoluminescence (PL) studies highlighted a gradual decrease in the intensity of the TPU emission band, which is situated in the spectral range 380–650 nm, in the presence of TiO2 NW. After increasing the TiO2 NW concentration in the TPU–TiO2 NW composite mass from 0 wt.% to 2 wt.% and 17 wt.%, respectively, a change in the binding angle of the TPU onto the TiO2 NW surface from 12.6° to 32° and 45.9°, respectively, took place.

1. Introduction

Various conformations of TiO2 particles, such as nanowires, nanorods, and nanobelts, have been synthesized [1]. The protocols used for the synthesis of TiO2 particles were: (i) hydrothermal/solvothermal [2]; (ii) sol–gel synthesis [3]; (iii) surfactant-assisted [4]; (iv) microwave-assisted [5]; (v) sonochemical synthesis [6]; (vi) high-temperature pyrolysis [7]; (vii) electrospinning [8]; (viii) chemical/physical vapor deposition [9,10]; (ix) atomic layer deposition [11]; (x) pulsed laser deposition [12]; (xi) suspended molecular template [13]; and (xii) electrochemical deposition [1,14]. That used by Sigma-Aldrich for the synthesis of TiO2 NWs was the hydrothermal method. Other conformations of TiO2 particles, such as nanocubes [5], nanospheres [5], nanorods [5], nanowires [15], nanotubes [16], nanosheets [17], nanobelts [18], etc., were reported. Considerable information concerning the polycrystallinity of TiO2 was discovered by X-ray diffraction in 2016 [19]. The main crystalline phases reported in the case of TiO2 nanoparticles were rutile [20], anatase [21], and brookite [22]. The band gap of TiO2 nanoparticles with a rutile-, anatase-, or brookite-type crystalline phase was of 1.78 eV, 2.04 eV, and 2.2 eV, respectively [23]. One of the most considerable applications of TiO2 was in the field of photocatalysis [24]. To enhance the photocatalytic properties of TiO2, different strategies have been adopted for doping TiO2 with metals and non-metals, as recently reported by P.S. Basavarajappa et al. [24]. To develop other applications, special attention was paid to the synthesis of composites based on TiO2 particles and polymers of types such as poly(vinylidene fluoride) [25], polyacrylonitrile [26], polypyrrole–chitosan [27], fluor-polydopamine [28], poly(3-methyl thiophene) [29], poly(3-hexyl thiophene) [30], poly(3,4-ethylenedioxythiopene):poly(2-styrene sulfonate) [31], polyaniline [32], and thermoplastic polyurethane [33]. The main applications of composites based on thermoplastic polyurethane (TPU) and TiO2 nanoparticles were reported in Li-ion batteries [34], binder for asphalt [35], water filters [36], the adsorption of oils spilled in water [37], and photocatalysis [38]. For such applications, composites containing TiO2 nanoparticles with anatase- (A) [33,35,39] and rutile-type (R) [40] crystalline phases were used. The synthesis methods used to prepare the TPU–TiO2 composites included phase inversion [34], mixing in the melting [39], and the wet-spinning process [38]. The most used methods for the characterization of the TPU–TiO2 composites were X-ray diffraction (XRD) [34], FTIR spectroscopy [34,35,39,40], scanning electron microscopy (SEM) [37,40], and thermogravimetry [38,39]. Cross-linked composites reportedly resulted from the interaction between TPU with TiO2 nanoparticles and a type-R crystalline phase [40]. Compared with the progress made in the literature, our work was focused on the synthesis of composites based on TPU and TiO2 nanowires (NWs) and then on highlighting their structural and optical properties by XRD, Raman scattering, FTIR spectroscopy, photoluminescence, scanning electron microscopy (SEM), and energy-dispersive X-ray spectroscopy (EDS). Our motivation for this study was to consider the possibility of using a TPU–TiO2 NW composite in the field of ventricular catheters, which are currently manufactured from poly(dimethyl)siloxane (PDMS) and polyurethanes (PU) [41,42]. The main disadvantages of these ventricular catheters are protein adsorption, shunt obstruction, and the appearance of infections [41,42]. The interaction of polymers with compounds with increased hydrophilicity and photocatalytic properties, such as TiO2, can overcome these inconveniences. Consequently, our aim was the synthesis of TPU–TiO2 NW composites, highlighting the potential interactions between the two constituents of these composites. Our preliminary results will open new opportunities for optimizing these composites and evaluating their performance in the field of ventricular catheters.
Here, we used XRD to uncover information about the crystalline planes of TiO2 NWs. We show that the NWs contain tetragonal TiO2 anatase (A), cubic Ti0.91O (C), orthorhombic Ti2O3 (OR), and monoclinic H2Ti3O7 (M). To highlight the potential changes in the chemical structure of TPU and TiO2 NWs, we show the correlated studies by Raman scattering and FTIR spectroscopy. According to our previous study, these characterization methods are valuable tools to highlight the exchange reaction of TPU in the presence of BaTiO3 nanoparticles [43]. Using scanning electron microscopy (SEM), we show the fibrous structure of the TPU–TiO2 NW composites. To assess the binding angle of TPU onto the TiO2 NW surface, we performed anisotropic PL measurements. Our research allows an understanding of TPU’s adsorption process onto the TiO2 NW surface. Recently, we demonstrated that TPU shows, at an excitation wavelength of 350 nm, a photoluminescence (PL) band with maximum at 410 nm [43]. We also analyzed the influence of TiO2 NWs on TPU PL properties.

2. Materials and Methods

2.1. Materials

TPU was purchased from the Elastollan-BASF Chemical Company (Cleveland, OH, USA), while TiO2 NWs and N,N′-dimethyl formamide (DMF, 99.8%) were purchased from Sigma-Aldrich (St. Louis, MO, USA). According to the TiO2 NWs specification sheet, the diameter and length of the NWs were ~10 nm and ~10 μm.

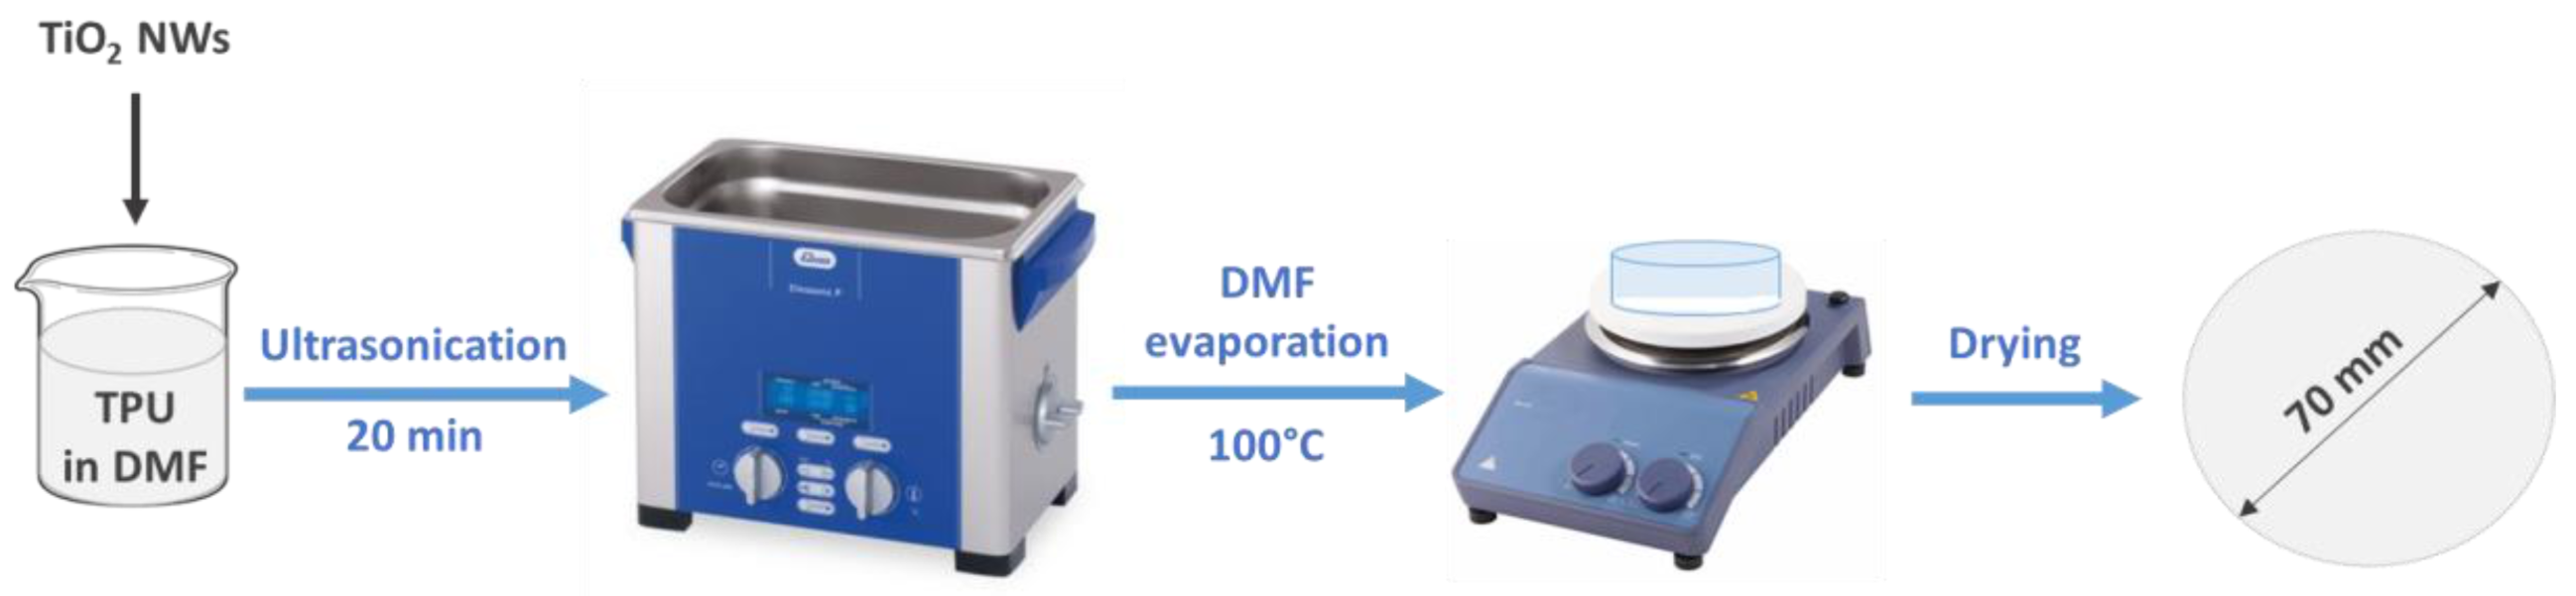
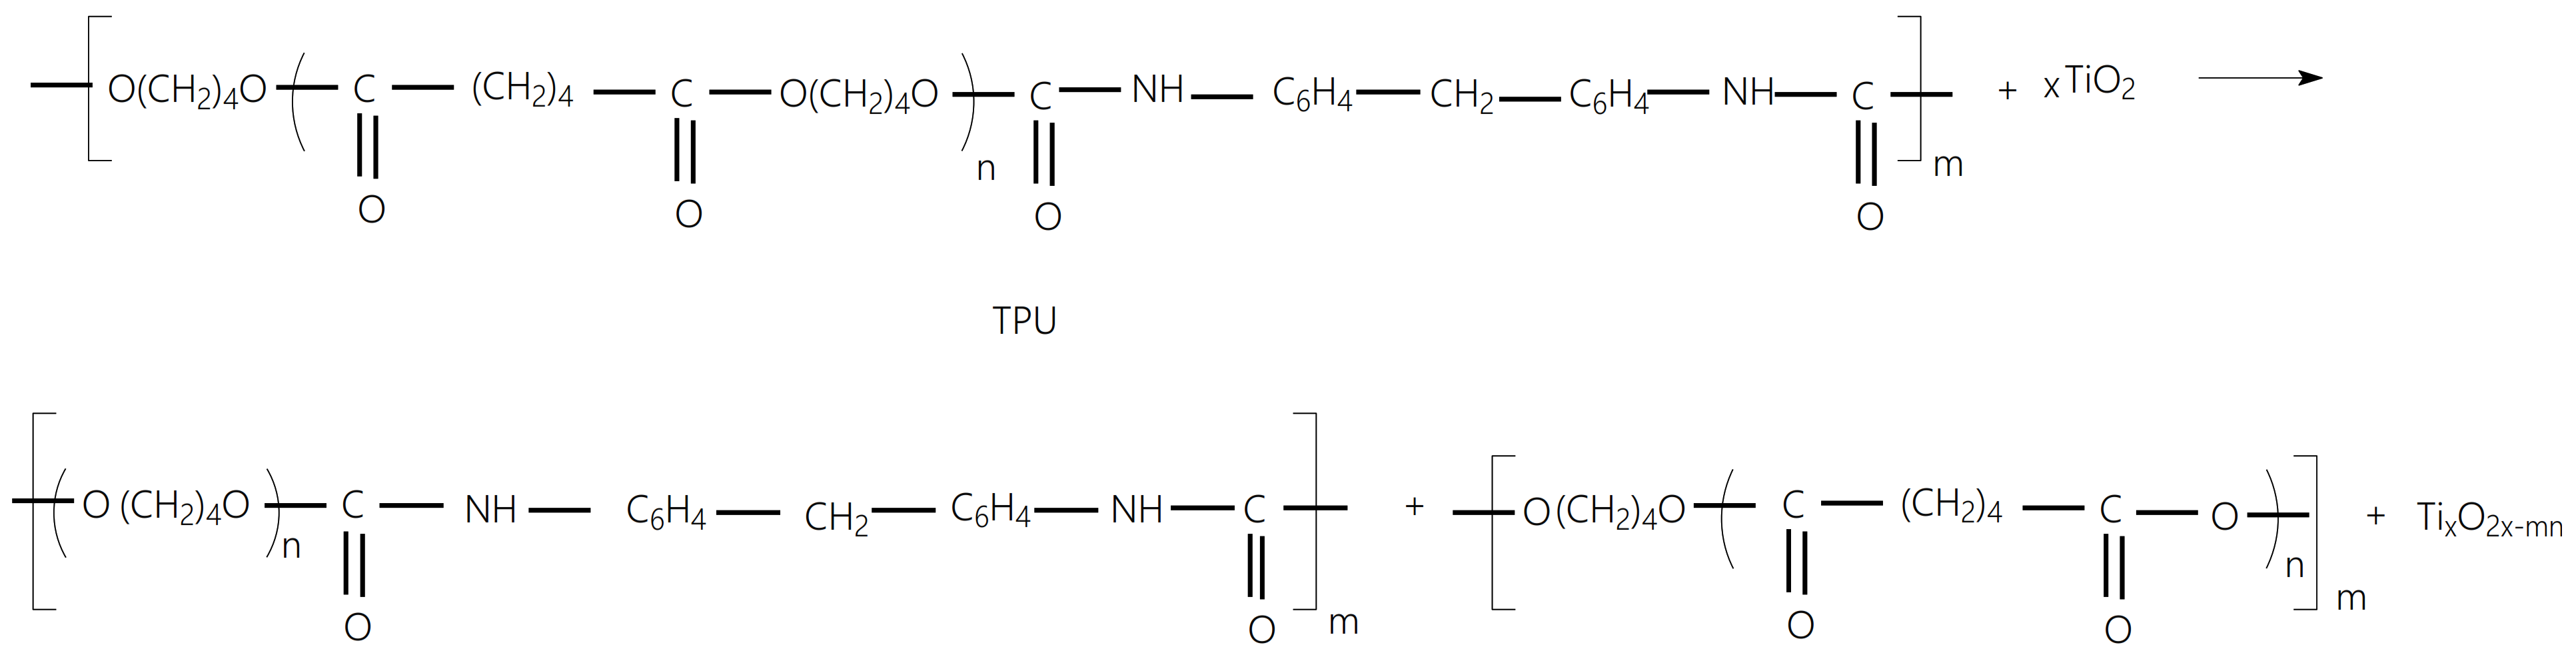
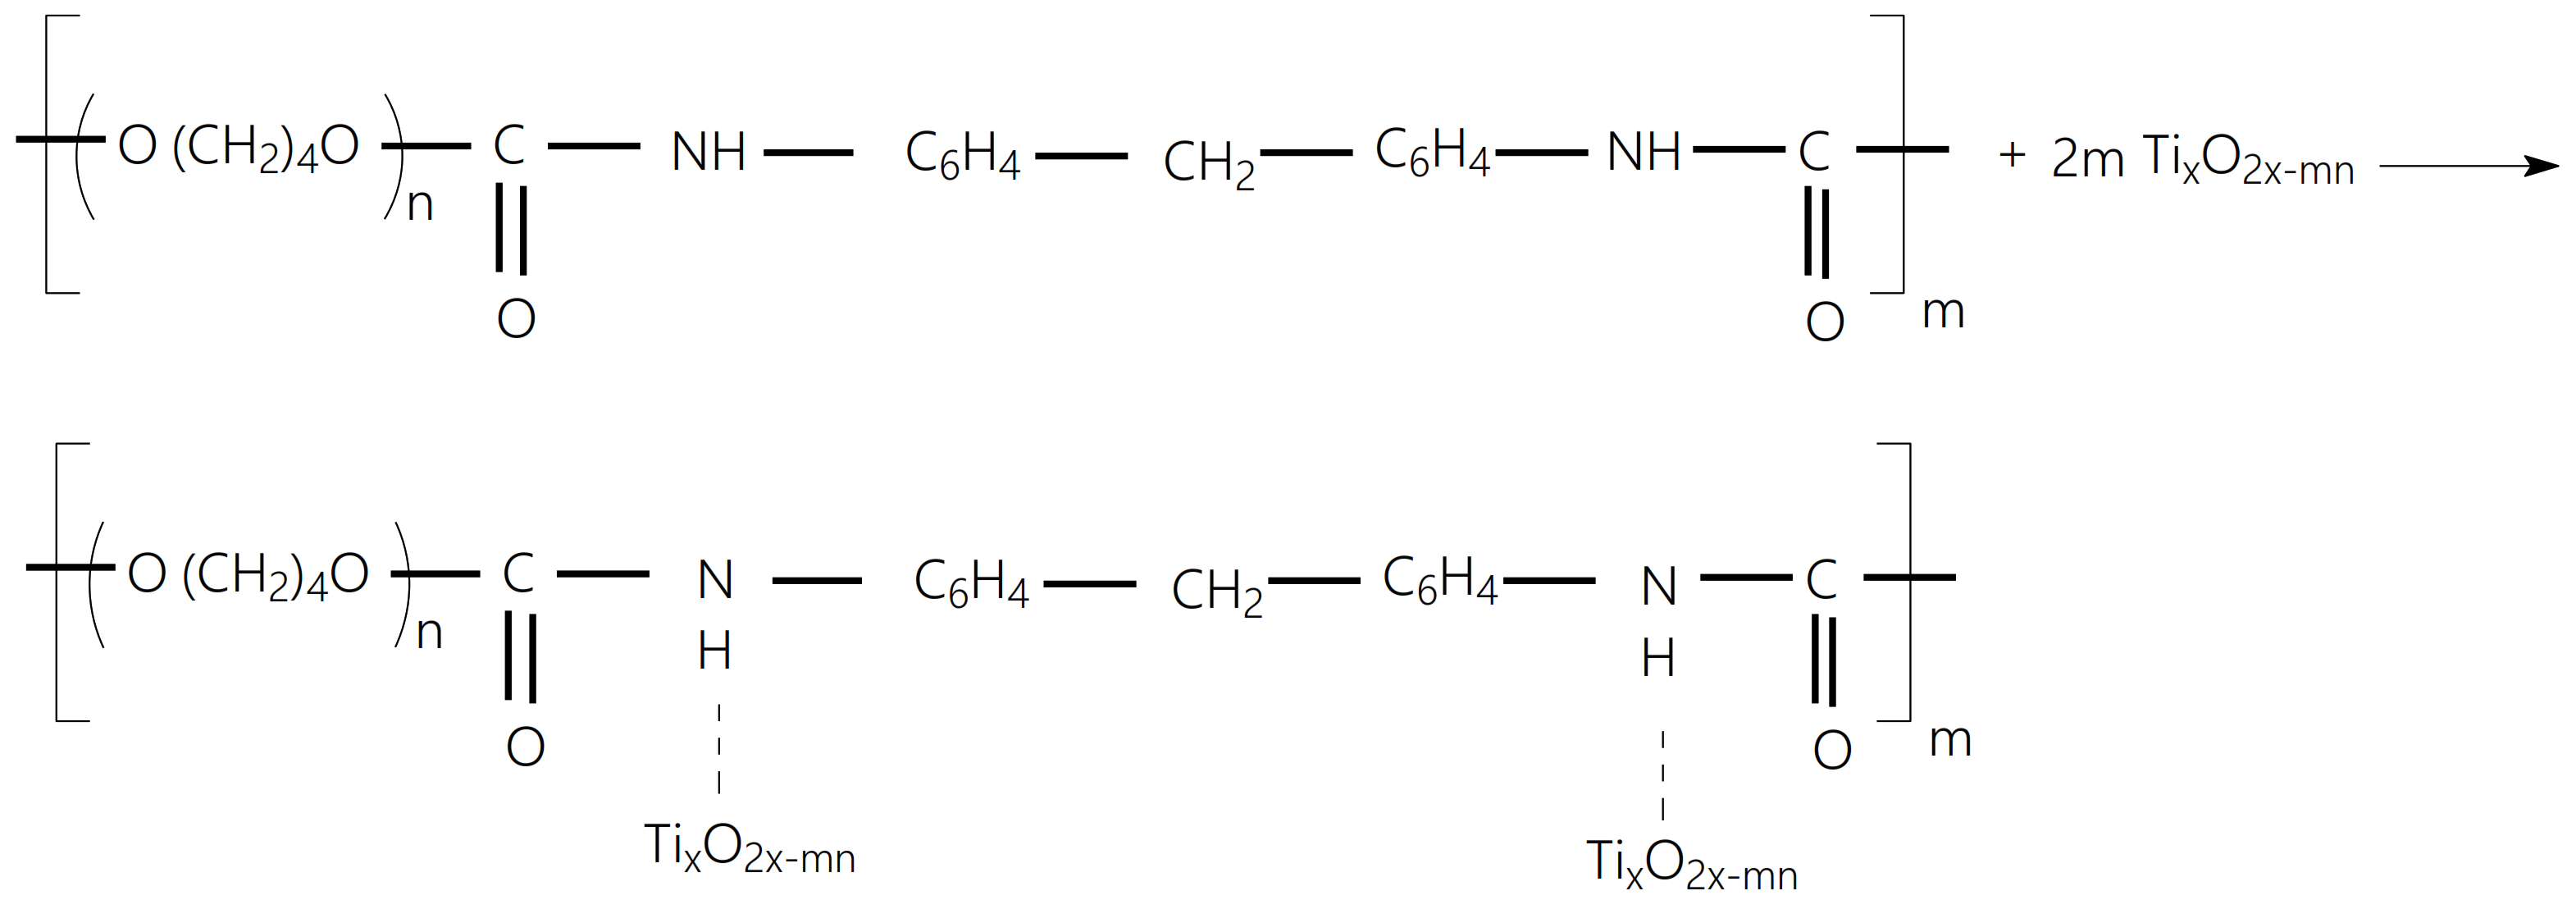
2.2. Synthesis Method of TPU–TiO2 NW Composites

The free-standing-film TPU–TiO2 NW composites were prepared by the wet chemistry method as follows: (a) we dissolved 0.5 g TPU in 16 mL DMF under ultrasonication; (b) in each solution of TPU in DMF (0.5 g/16 mL), we added 50 or 100 mg of TiO2 NW; (c) the dispersion of TiO2 particles in the TPU solution was performed under ultrasonication for 20 min; (d) the TiO2 suspensions in the solutions of TPU in DMF were poured into a petri vessel and subjected to a thermal treatment for 1 h at a temperature of 100 °C for DMF evaporation; and (ed) we dried the TPU samples with different TiO2 concentrations, i.e., 2 wt.% and 17 wt.%, in air for 2 h until the free-standing films’ mass remained constant.
The TPU free-standing films were prepared as above without adding the TiO2 NWs.
Figure 1 shows the schematic synthesis method for TPU–TiO2 NW composites as free-standing films.

2.3. Methods

2.3.1. X-ray Diffraction Analysis

The XRD patterns of the TiO2 NWs and TPU–TiO2 NW composites, which have a TiO2 NW concentration equal to 2 wt.% and 17 wt.%, respectively, were carried out using a Bruker D8 Advance diffractometer (Bruker, Hamburg, Germany) in Bragg–Brentano geometry, which was equipped with a Cu tube, and which had a Cu Kα-line of λ = 1.5406 Å.

2.3.2. Fourier-Transform Infrared (FTIR) Spectroscopic Analysis

The IR spectra of TPU and the TPU–TiO2 NW composites, which had TiO2 NW concentrations equal to 2 wt.% and 17 wt.%, respectively, were recorded using an FTIR spectrophotometer Vertex 80 model from Bruker (Billerica, MA, USA).

2.3.3. FT-Raman Spectroscopic Analysis

The Raman spectra of TPU and the TPU–TiO2 NW composites, which have TiO2 NW concentrations equal to 2 wt.% and 17 wt.%, respectively, were recorded with an FT-Raman spectrophotometer MultiRam model from Bruker at an excitation wavelength of 1064 nm (Ettlingen, Germany).

2.3.4. Photoluminescence Analysis

The photoluminescence (PL) spectra of TPU and the TPU–TiO2 NW composites, which have TiO2 NW concentrations equal to 2 wt.% and 17 wt.%, respectively, were recorded with a Fluorolog-3 spectrophotometer FL3-2.2.1 model from Horiba Jobin Yvon (Palaiseau, France).

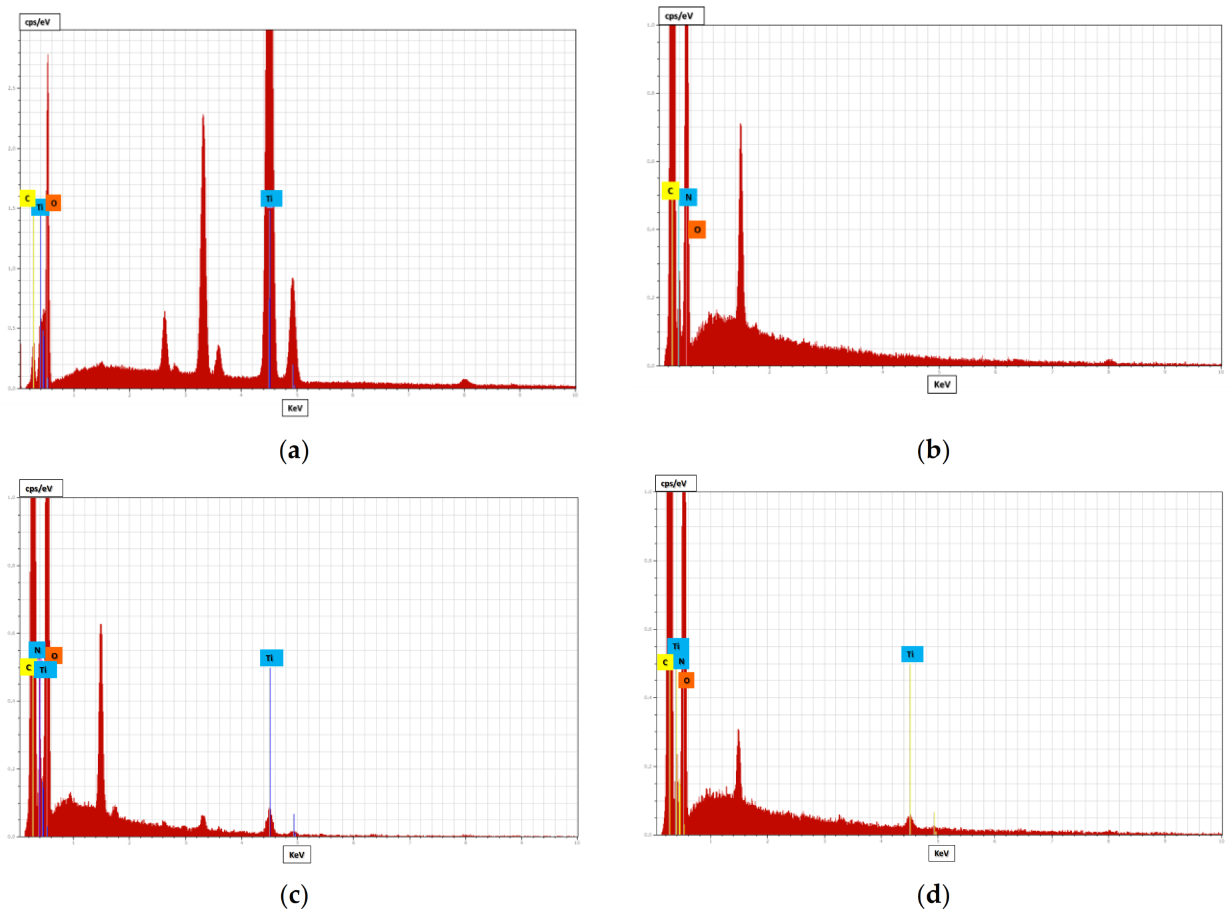
2.3.5. Scanning Electron Microscopy and Energy-Dispersive X-Ray Analysis

Scanning electron microscopy (SEM) and energy-dispersive X-ray (EDS) analysis of TPU and the TPU–TiO2 NW composites, which have TiO2 NW concentrations equal to 2 wt.% and 17 wt.%, respectively, were achieved with a Zeiss Gemini 500 field-emission scanning electron microscope and a Zeiss EVO 50 XVP system (Zeiss, Oberkochen, Germany) equipped with a Bruker EDS detector, respectively.

3. Results and Discussion

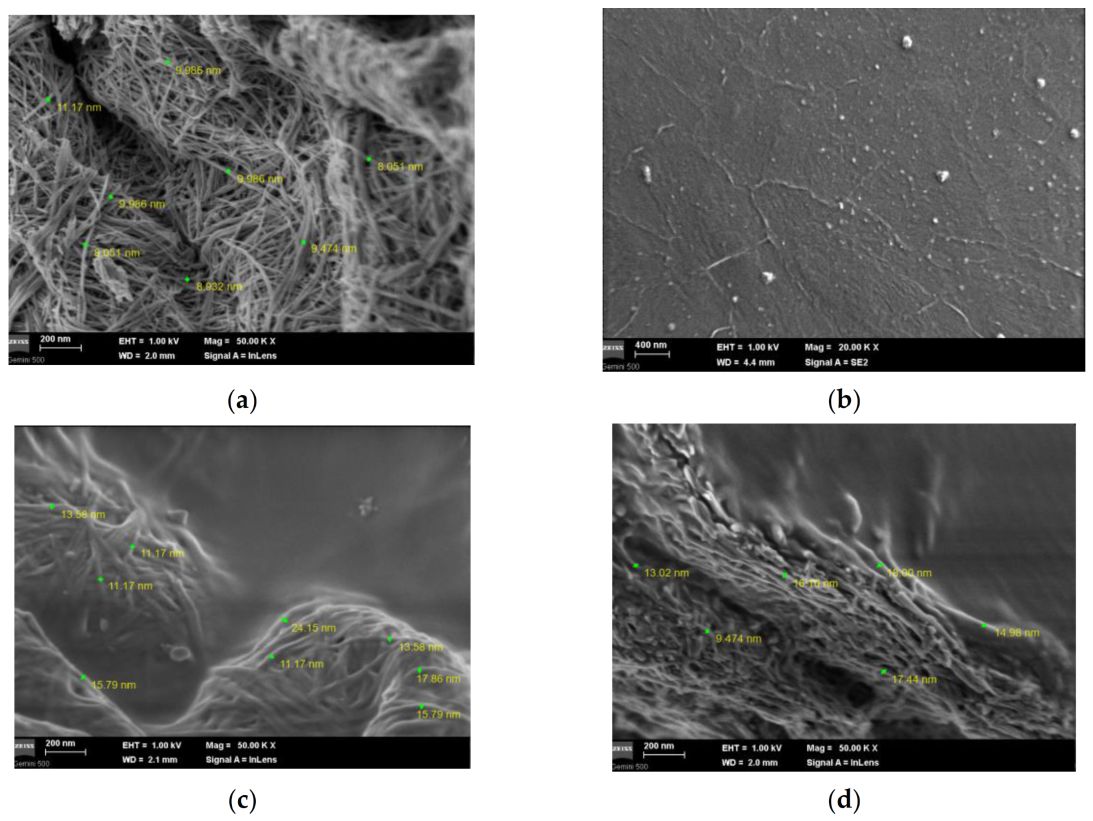
3.1. Morphological Properties of TiO2 NWs and the TPU–TiO2 Composites

Figure 2 shows the SEM images of TiO2 NWs, as well as TPU and the TPU–TiO2 NW composites, which have TiO2 NW concentrations equal to 2 wt.% and 17 wt.%, respectively.
According to Figure 2a, the TiO2 NWs diameter varies between 8 and 11 nm. In contrast with Figure 2b, which shows an SEM image of TPU, in the case of Figure 2c,d, one can observe that the TPU–TiO2 NW composites show a fibrous structure, while the TiO2 NW diameter varies in the case of the TPU–TiO2 NW composites that have TiO2 NW concentrations of 2 wt.% and 17 wt.%, respectively, between 11 and 24 nm and 9 and 18 nm, respectively. The apparent increase in the diameter of TiO2 NWs is caused by the adsorption of polymer on the surface of TiO2 nanoparticles. Figure 3 shows the EDS spectra of TiO2 NWs, as well as the TPU and the TPU–TiO2 NW composites, which have a TiO2 NW concentration equal to 2 wt.% (c) and 17 wt.%, respectively.
As we expected, Figure 3a,c,d proved the presence of Ti, which in the case of the TPU–TiO2 NW composites confirms the embedding TiO2 NWs in the TPU matrix, inducing a fibrous structure in the free-standing films.

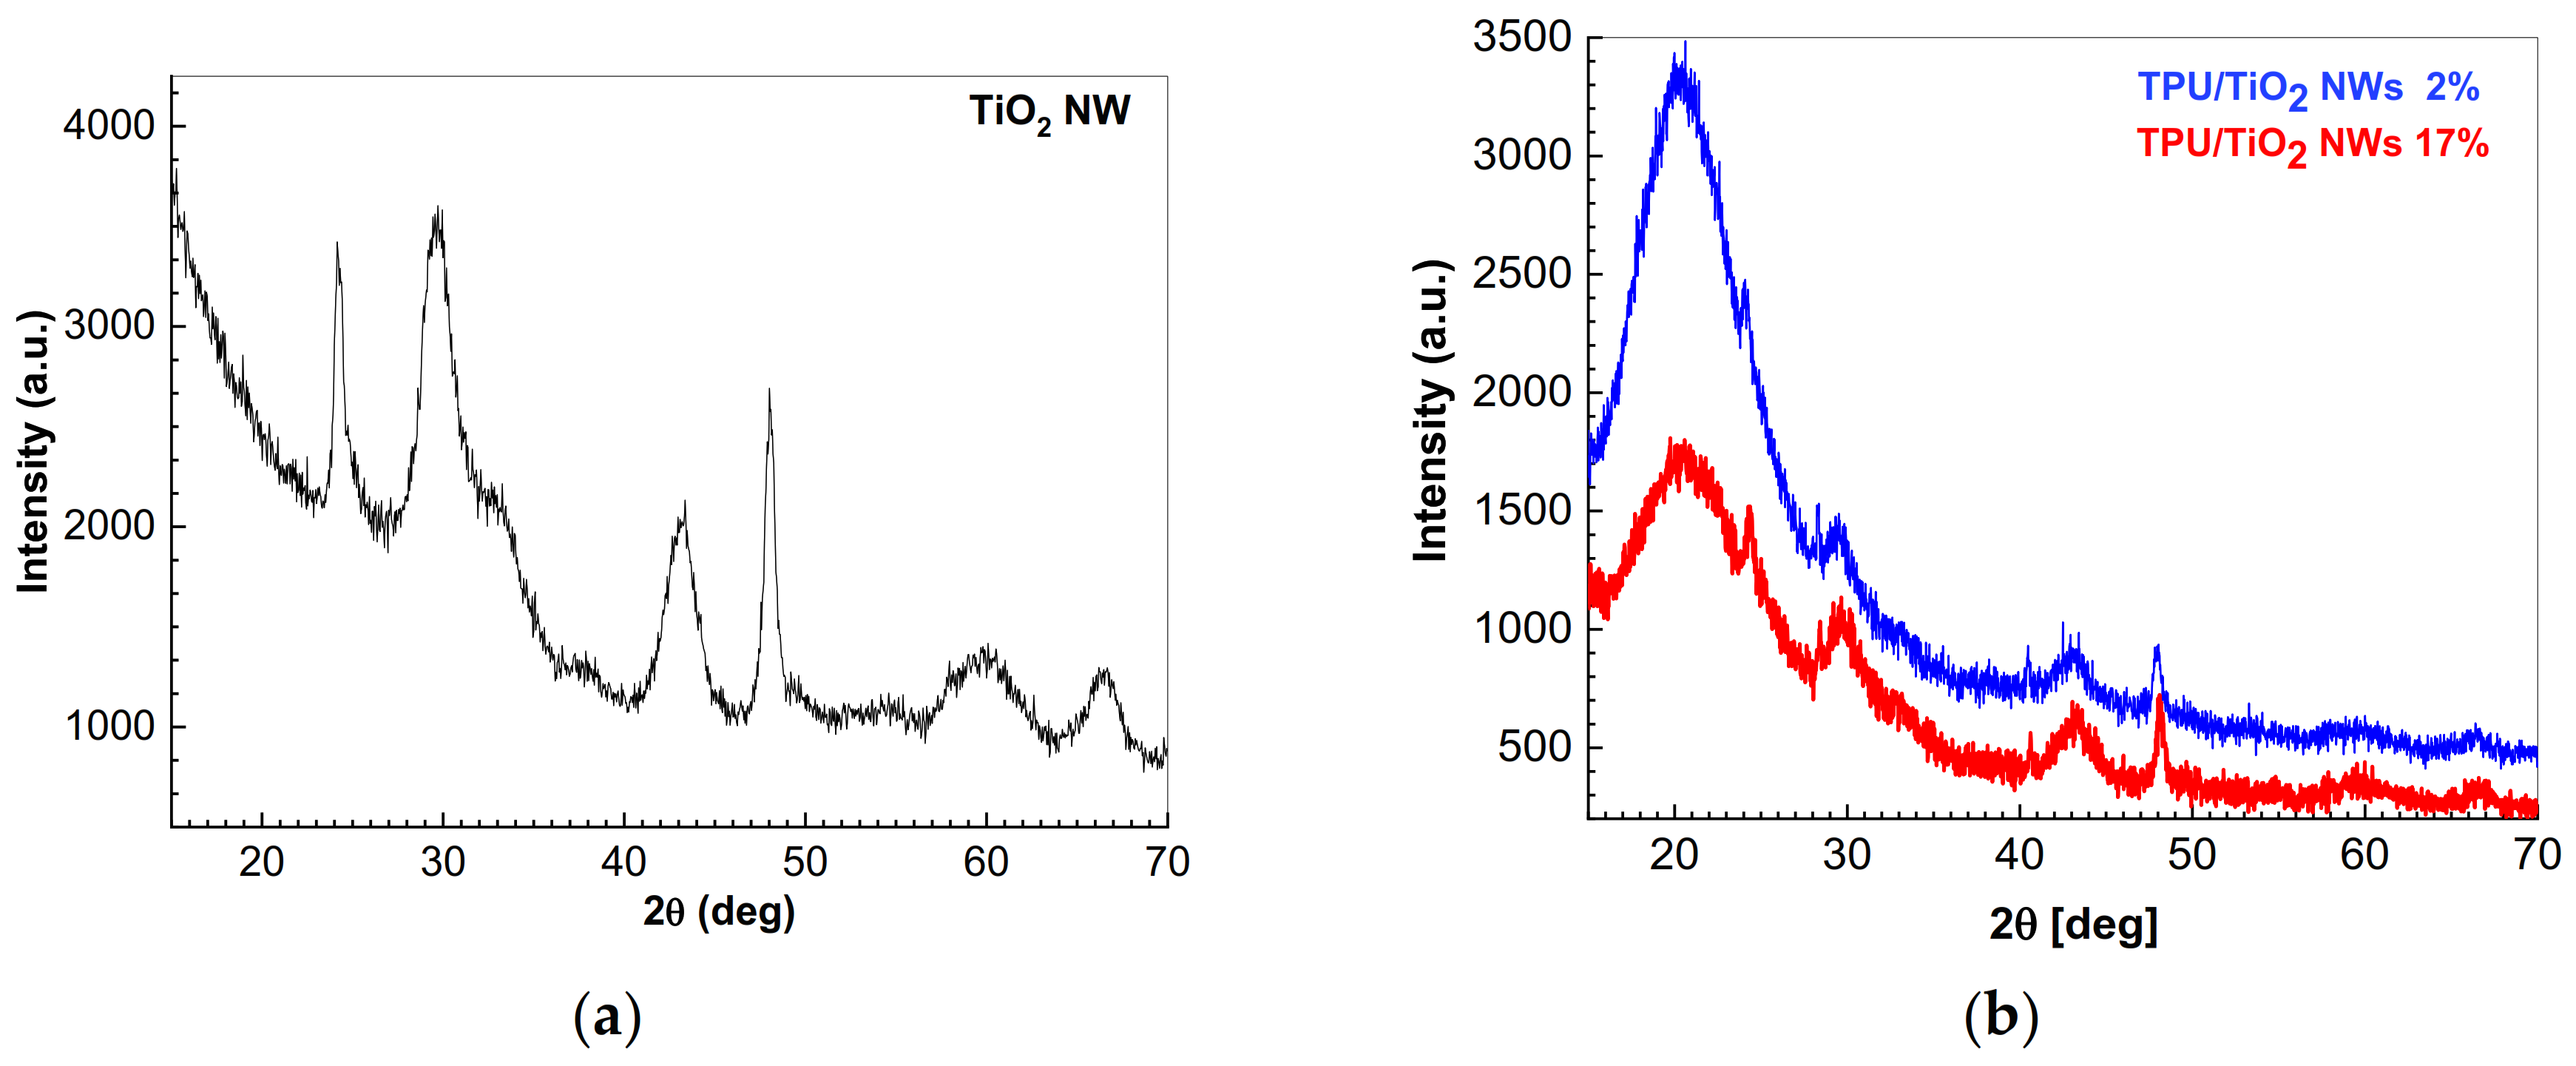
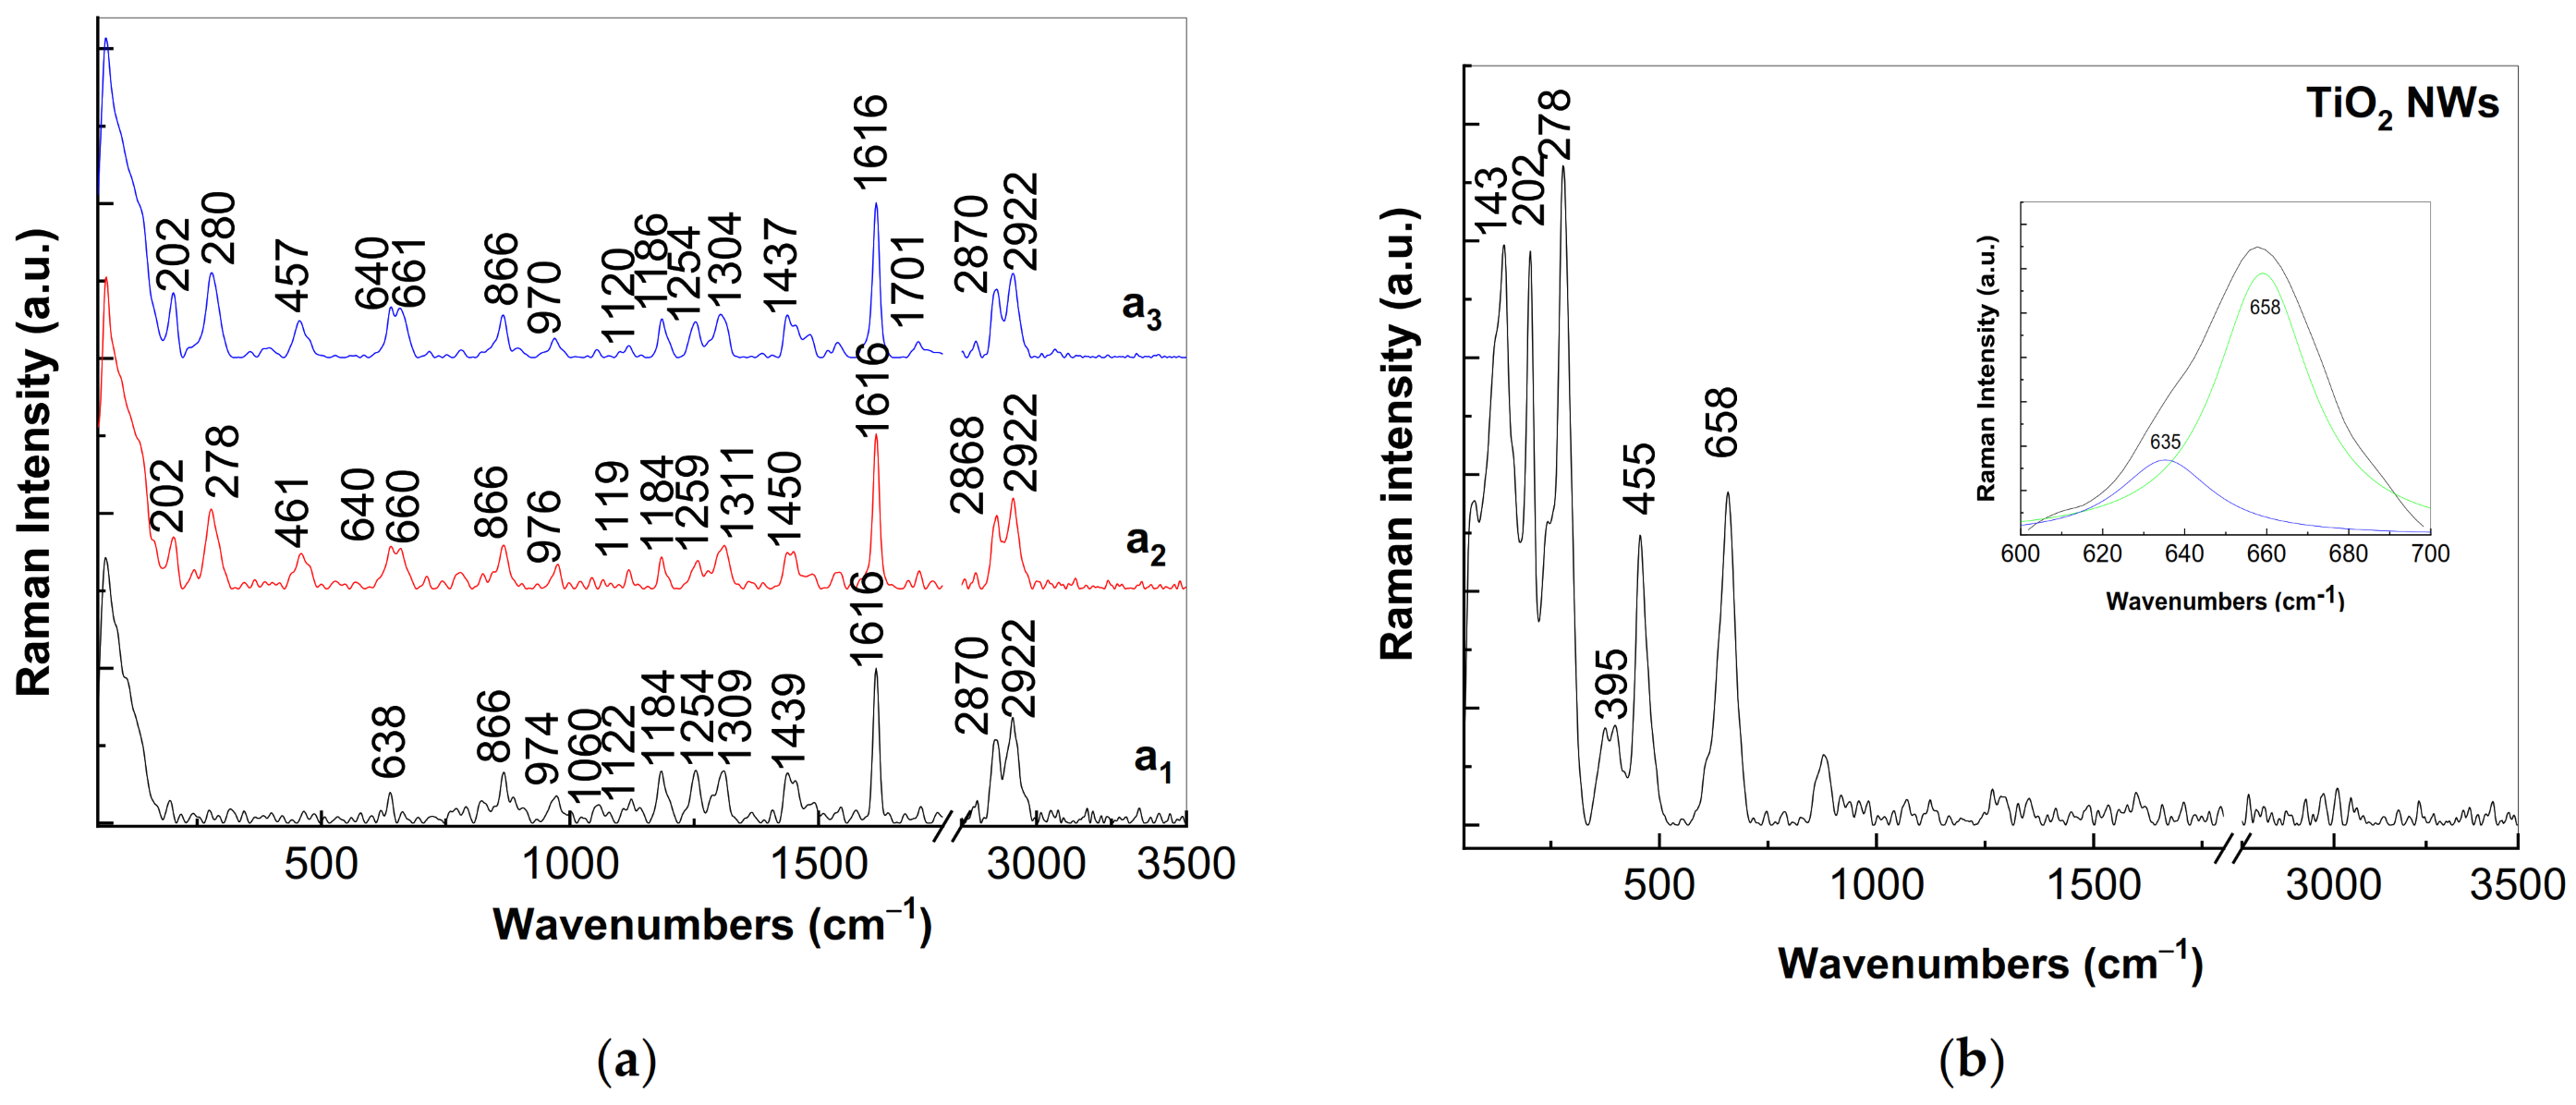
3.2. Structural Properties of TiO2 NWs and the TPU–TiO2 Composites

Figure 4 shows the XRD patterns of TPU and the TPU–TiO2 NW composites, which have TiO2 NW concentrations equal to 2 wt.% and 17 wt.%, respectively. Figure 4a highlights the XRD patterns of TiO2 NWs peak at 24.2°, 29.7°, 43.4°, 48°, 59.9°, and 66.5° in two theta. According to the standard International Centre for Diffraction Data (ICDD) database, the first two peaks situated at 24.2° and 29.7° belong to the crystalline (110) and (310) planes of the monoclinic (M) H2Ti3O7 [44], PDF no.00-041-0192, while the peaks localized at 43.4° and 48° were assigned to the (200) plane in Ti0.91O, which has a cubic (C) crystalline structure [PDF no.04-004-2981], and the (200) plane in TiO2 of the type tetragonal anatase (A) [45,46], PDF no. 00-021-1272, respectively. The peaks around 60.2° and 66.3° in 2θ belong to the (501) and (404) planes, respectively, of a Ti2O3 phase with an orthorhombic (OR) crystalline structure (PDF04-018-9746).
Compared with Figure 4a, in the case of the TPU–TiO2 NW composites with TiO2 NW concentrations equal to 2 wt.% and 17 wt.%, one observes that: (i) the gradual increase in the added TiO2 NWs is clearly visible at the NWs’ specific 2θ angles; (ii) the peak in the range 15–25° (Figure 4b) belongs to TPU [43]; (iii) a shift in the peaks from 43.4° and 48° (Figure 4a) to 43.5° and 48.3° (blue curve in Figure 4b) or 43.6° and 48.1° (red curve in Figure 4b) occurs; and (iv) there is a change in the ratio between the intensities of the peaks at 43.4–43.6° and 48–48.3° from 0.78 (Figure 4a) to close to 1, i.e., 1.03 (blue curve in Figure 4b) and 0.96 (red curve in Figure 4b). This decrease in the intensity of the peak at 48–48.3° can only be explained if an interaction of TiO2 NWs with PTU occurs, when we estimate that the formation of suboxides takes place. To prove this claim, correlated Raman scattering and FTIR spectroscopy studies are presented below.

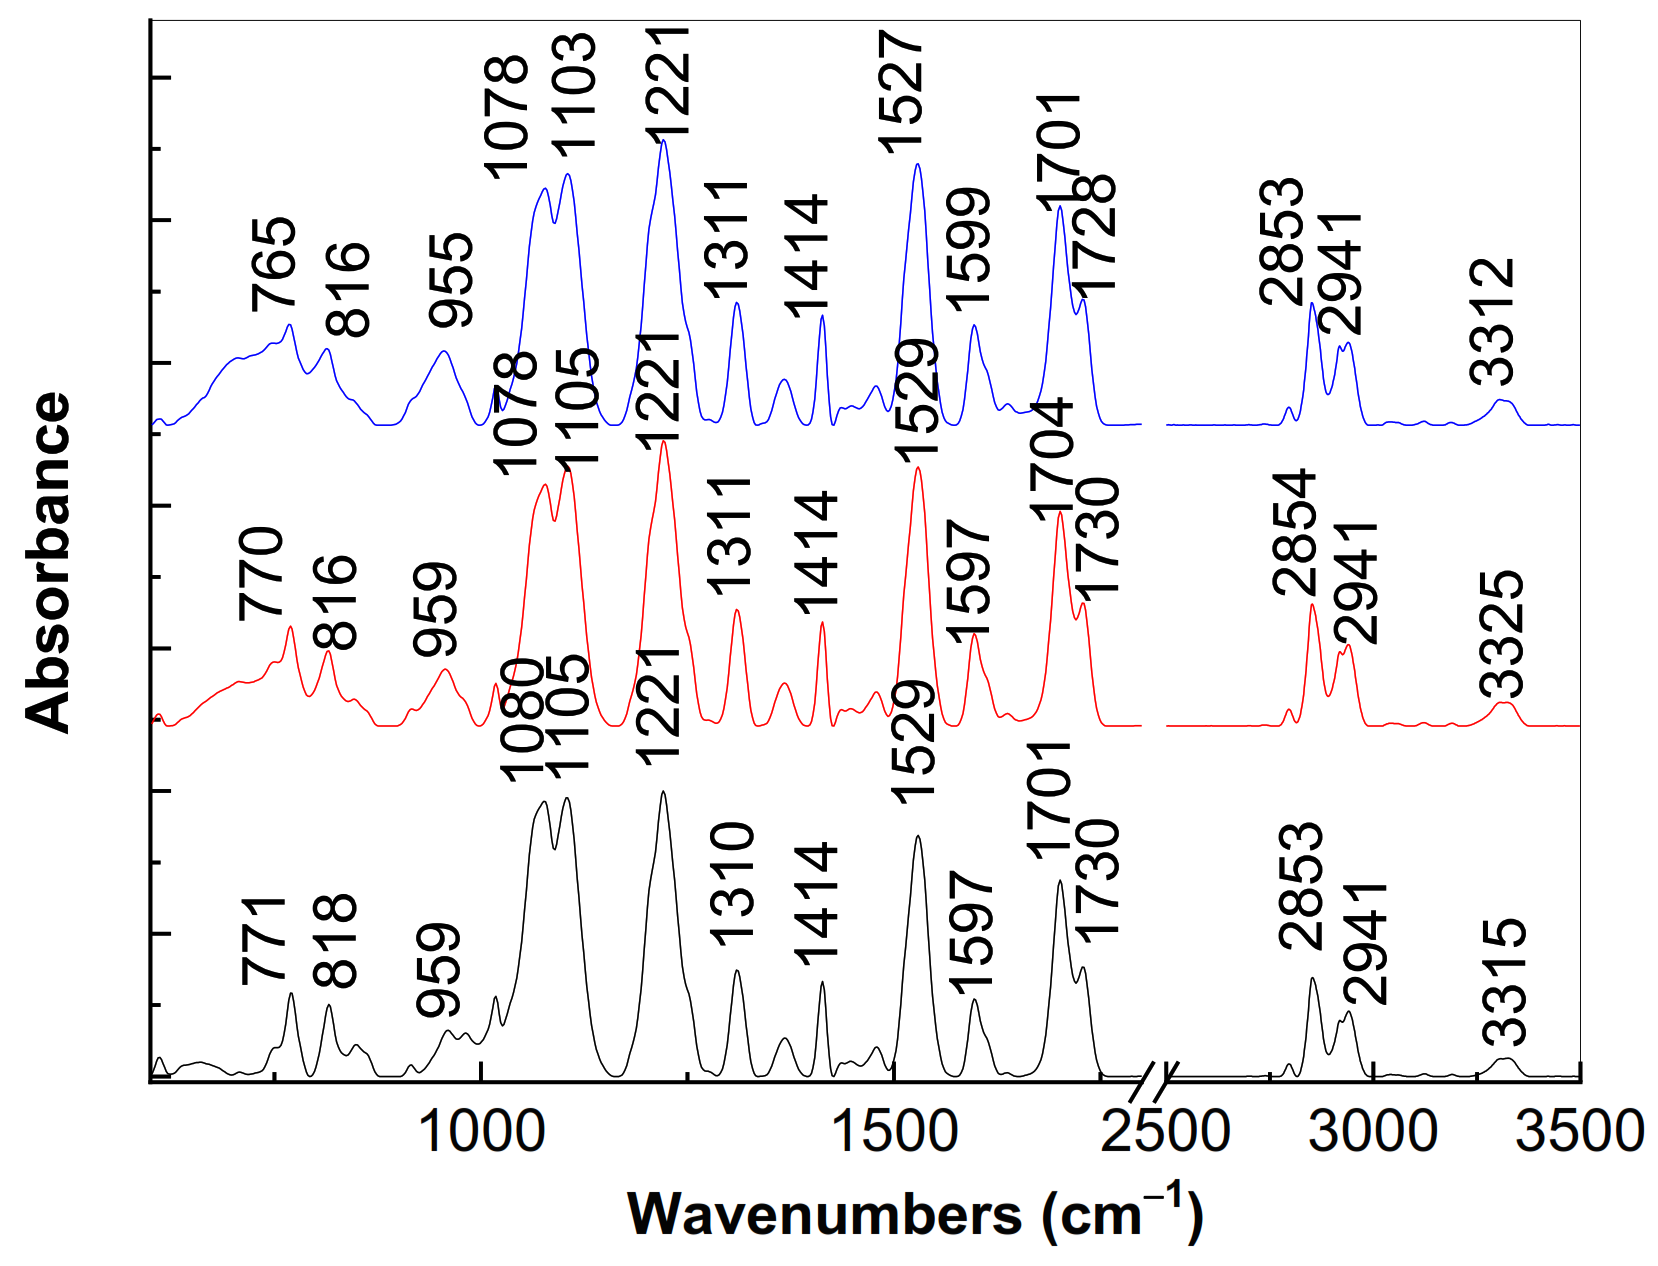
3.3. Vibrational Properties of TPU and the TPU–TiO2 NW Composites

Figure 5 and Figure 6 show the IR and Raman spectra of the TPU–TiO2 NW composites with TiO2 NW concentrations equal to 2 wt.% and 17 wt.%. The main IR bands of TPU peaked at 771, 818, 959, 1080–1105, 1221, 1310, 1414, 1529, 1597, 1701, 1730, 2853–2941, and 3315 cm−1 (Figure 5a). They are assigned to the vibrational modes of the N-H bond, C-H bond, higher-order aggregates, stretching C(O)–OC, CO stretching in the ether group, C-N bond, C-H bond, urethane group, C-C + C=C bonds in the benzene ring, hydrogen-linked urethane carbonyl group (C=O), the free carbonyl group, the antisymmetric and symmetrical vibrational modes of the CH bonds, and a partial inter- and intramolecular hydrogen linkage of the NH groups of the adjacent urethane segments [47,48,49,50,51,52,53], respectively.
Figure 5 shows that as the TiO2 NW concentration in the mass of the TPU–TiO2 NW composites increases: (i) there is a shift of the IR band from 771 cm−1 (Figure 5a) to 765 cm−1 (Figure 5c); (ii) a shift of the IR band from 959 cm−1 (Figure 5a) to 955 cm−1 (Figure 5b,c), the variation accompanied by a decrease in the ratio between the absorbance of the IR bands from 771–765 and 955–959 cm−1 from 1.82 (Figure 5a) to 1.75 (Figure 5b) and 1.32 (Figure 5c); (iii) a shift in the IR band from 3315 cm−1 (Figure 5a) to 3304 cm−1 (Figure 5c); and (iv) a variation in the ratio between the absorbance of the IR bands peaked at 765–771 cm−1 and 3304–3315 cm−1 from 4.68 (Figure 5a) to 4.21 (Figure 5b) and 3.83 (Figure 5c). These variations indicate a decrease in the higher-order aggregates of TPU simultaneous with the increase in the hydrogen bonds established between the amide groups of TPU and oxygen atoms of TiO2 NWs.
Additional information concerning the chemical structure of the TPU–TiO2 NW composites is shown in Figure 6. The main Raman lines of TPU are situated at 638, 866, 974, 1060, 1122, 1184, 1254, 1309, 1439, 1616, and 2870–2922 cm−1 (Figure 6a1), and they are assigned to the following vibrational modes: O-C=O in-plane deformation, out-of-plane benzene-ring deformation, out-of-plane C-H wagging, C-C skeletal stretching in alkane group, C-O-C, urethane amide, urethane amide III, deformation of the C-H bond in urethane amide III, symmetric stretching of N=C=O + deformation of CH2 group, stretching of the bonds C-C + C=C in aryl ring, and stretching of CH bond in aromatic structure [54,55], respectively.
Figure 6b shows that the main Raman lines of TiO2 NWs are localized at 143, 202, 278, 395, 455, and 658 cm−1, and they are assigned to the vibrational modes Eg in TiO2 A [56,57], stretching O-Ti-O in Ti2O3 [58], O-Ti-O in TinO2n-1 [58], B1g in TiO2 A [56], A1g in H2Ti3O7 [44], and Eg in H2Ti3O7, respectively [44]. Increasing the concentration of TiO2 NWs in the mass of the TPU–TiO2 NW composites induces an increase in the intensity of the Raman lines peaking at 278–280 cm−1, an upshift of the Raman line from 455 cm−1 (Figure 6b) to 457–461 cm−1 (Figure 6a2,a3), and a change in the profile of the Raman line at 658 cm−1 (Figure 6b). The insert in Figure 6b shows that the Raman line at 658 cm−1 displays an asymmetric profile to small wavenumbers as a consequence of the presence of a Raman line peaked at 635 cm−1, belonging to the vibrational mode Eg of H2Ti3O7 [56]. Regarding the Raman spectra of TiO2 NWs, the ratio between the intensity of the Raman lines peaked at 658 cm−1 and 635 cm−1, which were assigned to the vibrational modes Eg in TiO2 A and Eg in H2Ti3O7 (ITiO2-A/IH2Ti3O7), respectively, is equal to 3.45. Regarding the Raman spectra of the TPU–TiO2 NW composites with the TiO2 NW concentrations of 2 wt.% and 17 wt.%, the ITiO2-A/IH2Ti3O7 ratio is equal to 0.94 (Figure 6a2) and 0.96 (Figure 6a3), respectively. The decrease in the value of the ITiO2-A/IH2Ti3O7 ratio in the case of the TPU–TiO2 NW composites indicates a diminution of TiO2 A in the TiO2 NWs mass. This fact can be explained by taking into account the exchange reaction of TPU according to Scheme 1, which is followed by the formation of new hydrogen bonds between the NH bonds of the amide groups and the oxygen atoms of TixO2x-mn (Scheme 2).
The reaction products of Scheme 1 can be described as follows: (a) the first corresponds to a macromolecular compound with amide groups in the repeating units; (b) the second corresponds to a macromolecular compound characterized by the repeating units having acetate groups; and (c) the third corresponds to suboxide TixO2x-mn.
Similar to Scheme 2, new hydrogen bonds emerge between the -NH- bond of the TPU amide group and the oxygen atoms of TixO2x-mn. Such hydrogen bonds can be invoked to occur between the -NH- bonds of the TPU amide groups and the oxygen atoms of Ti2O3 and Ti0.91O.
Summarizing these results, the exchange reaction presented in Scheme 1 is confirmed by the change in the ratio between the intensities of the peaks at 43.4–43.6° and 48–48.3° from 0.78 (Figure 4a) to close to 1, i.e., 1.03 (blue curve in Figure 4b) and 0.96 (red curve in Figure 4b), which indicates the emergence of suboxide TixO2x-mn, as well as the decrease in the ratio between the intensity of the Raman lines peaked at 658 cm−1 and 635 cm−1, which is assigned to the vibrational modes Eg in TiO2 A and Eg of H2Ti3O7, from 3.45 to 0.94–0.95 in the case of TPU and the TPU–TiO2 NW composites (Figure 6). This indicates that there is a decrease in the higher-order aggregates as a consequence of the emergence of new hydrogen bonds between the -NH-, which belongs to the TPU amide groups, and the oxygen atoms of TixO2x-mn, Ti2O3, and Ti0.91O.

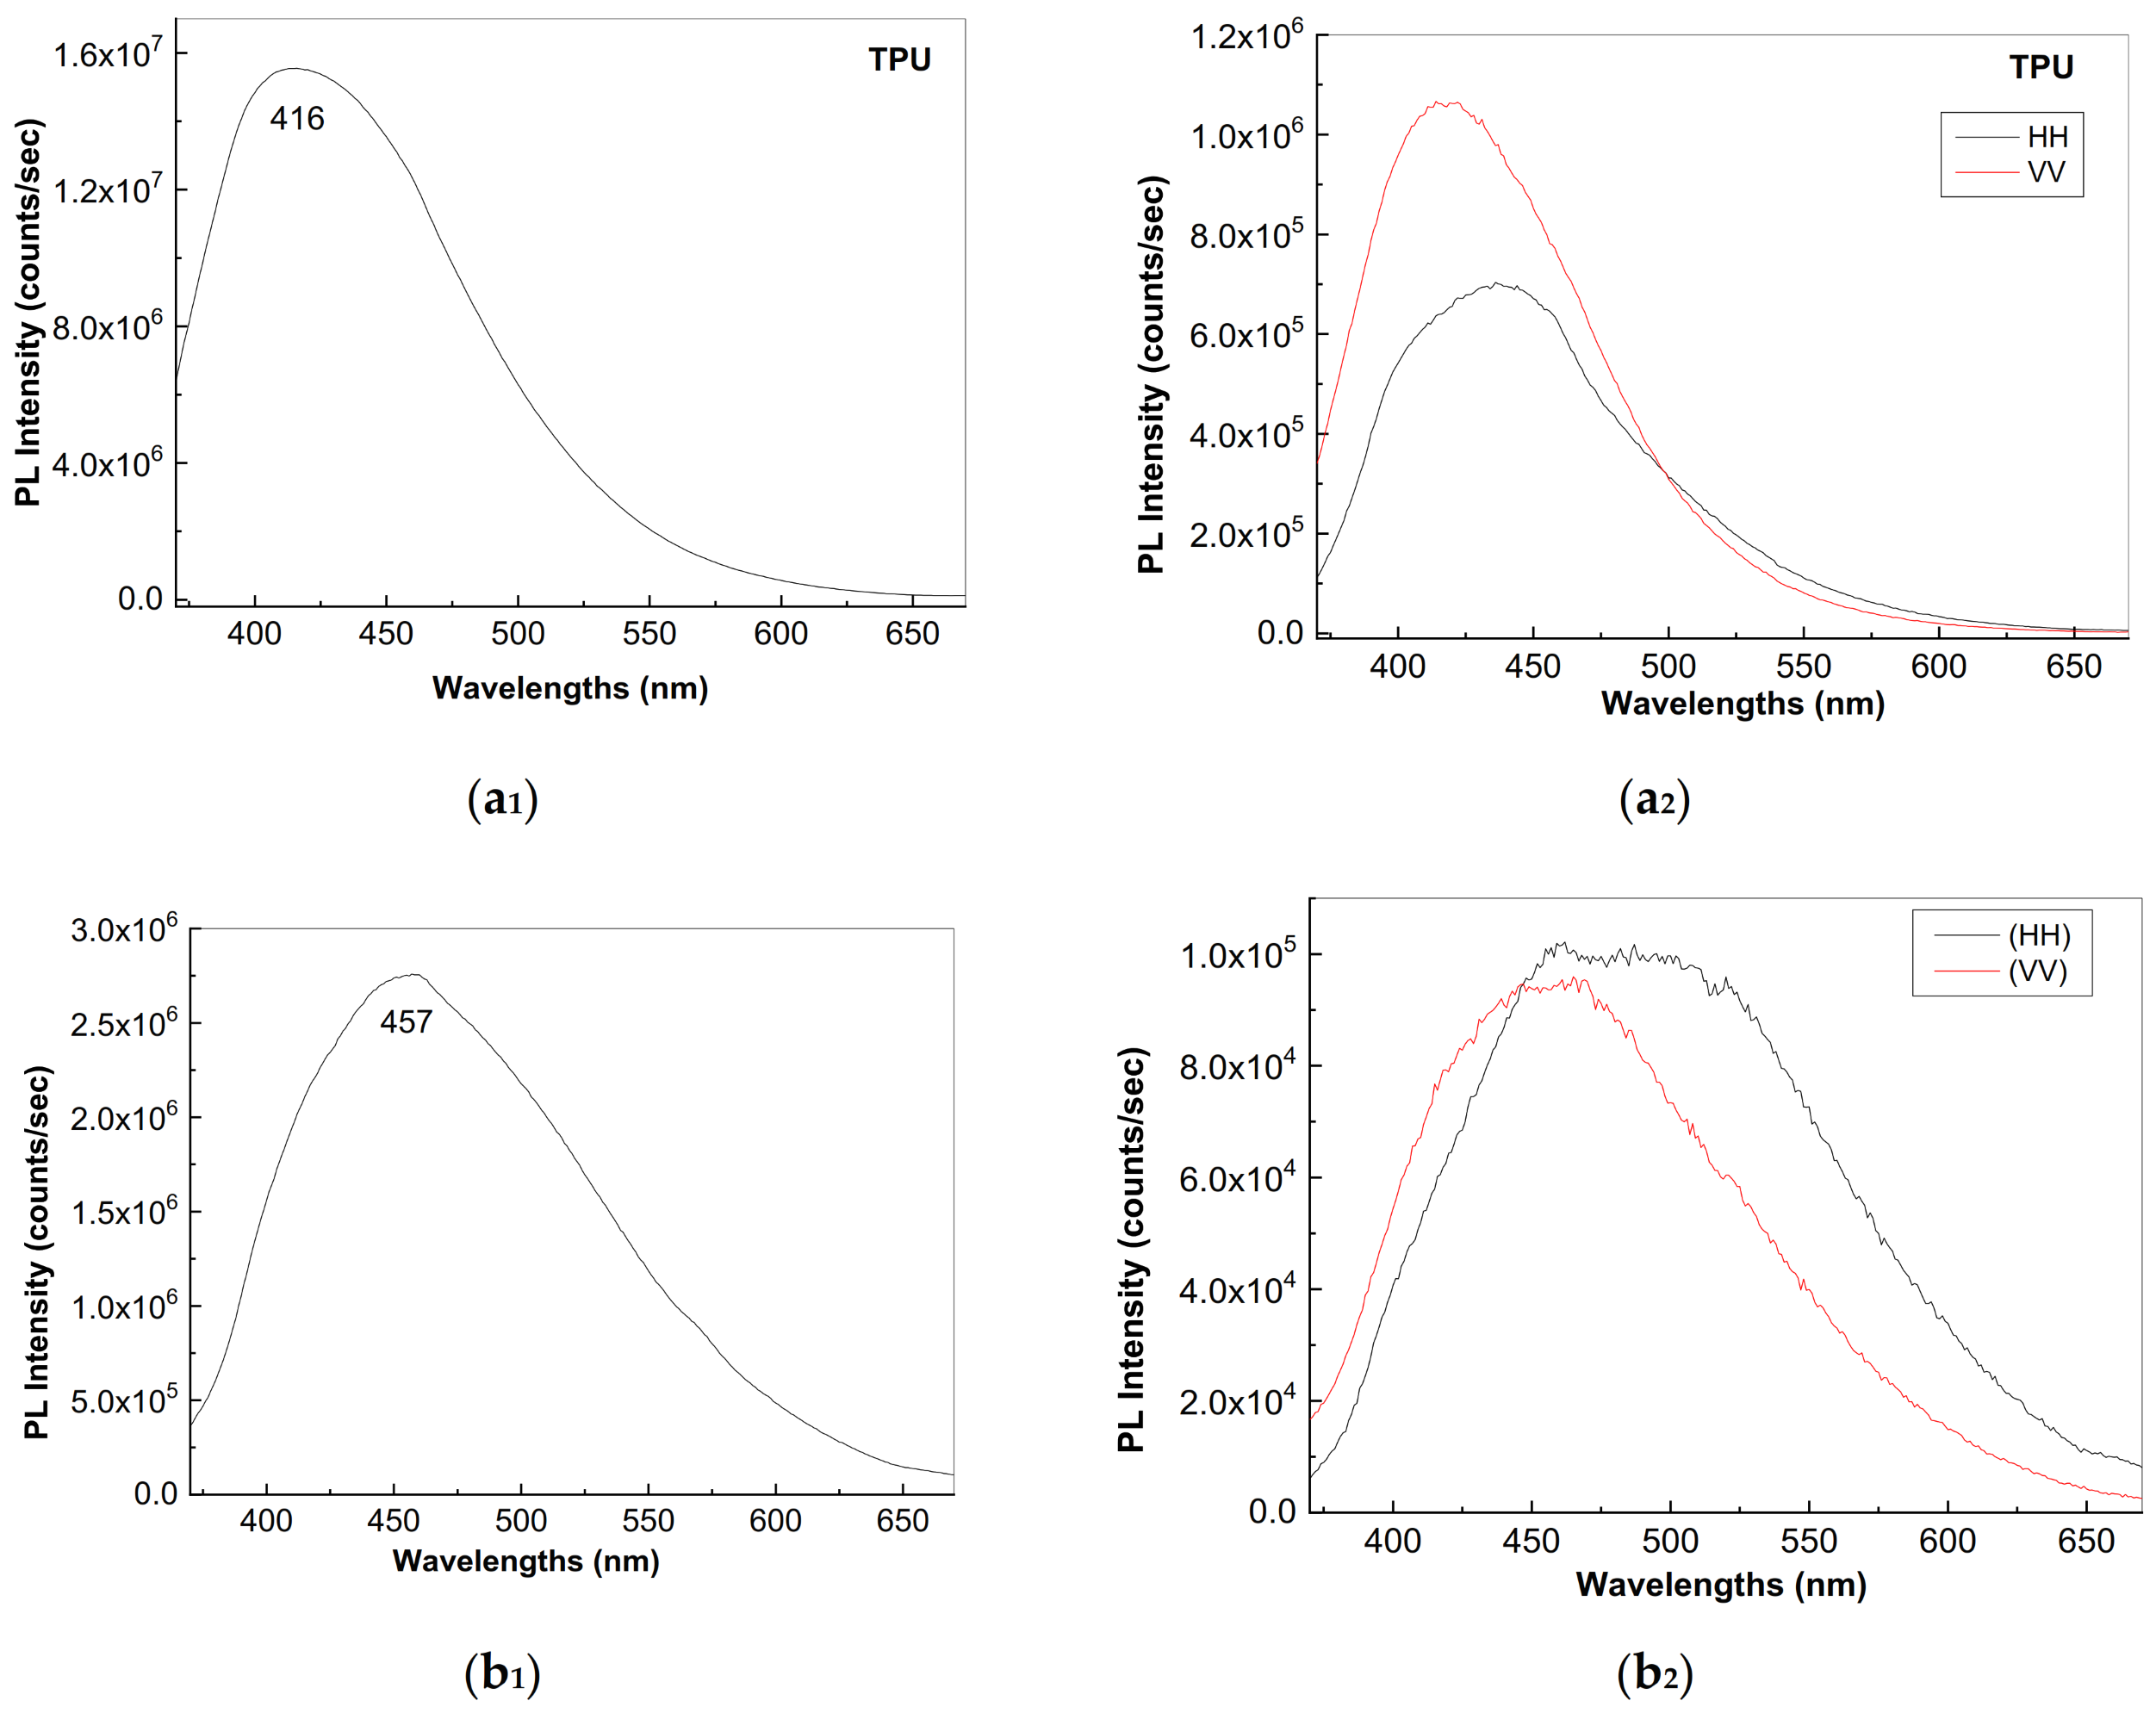
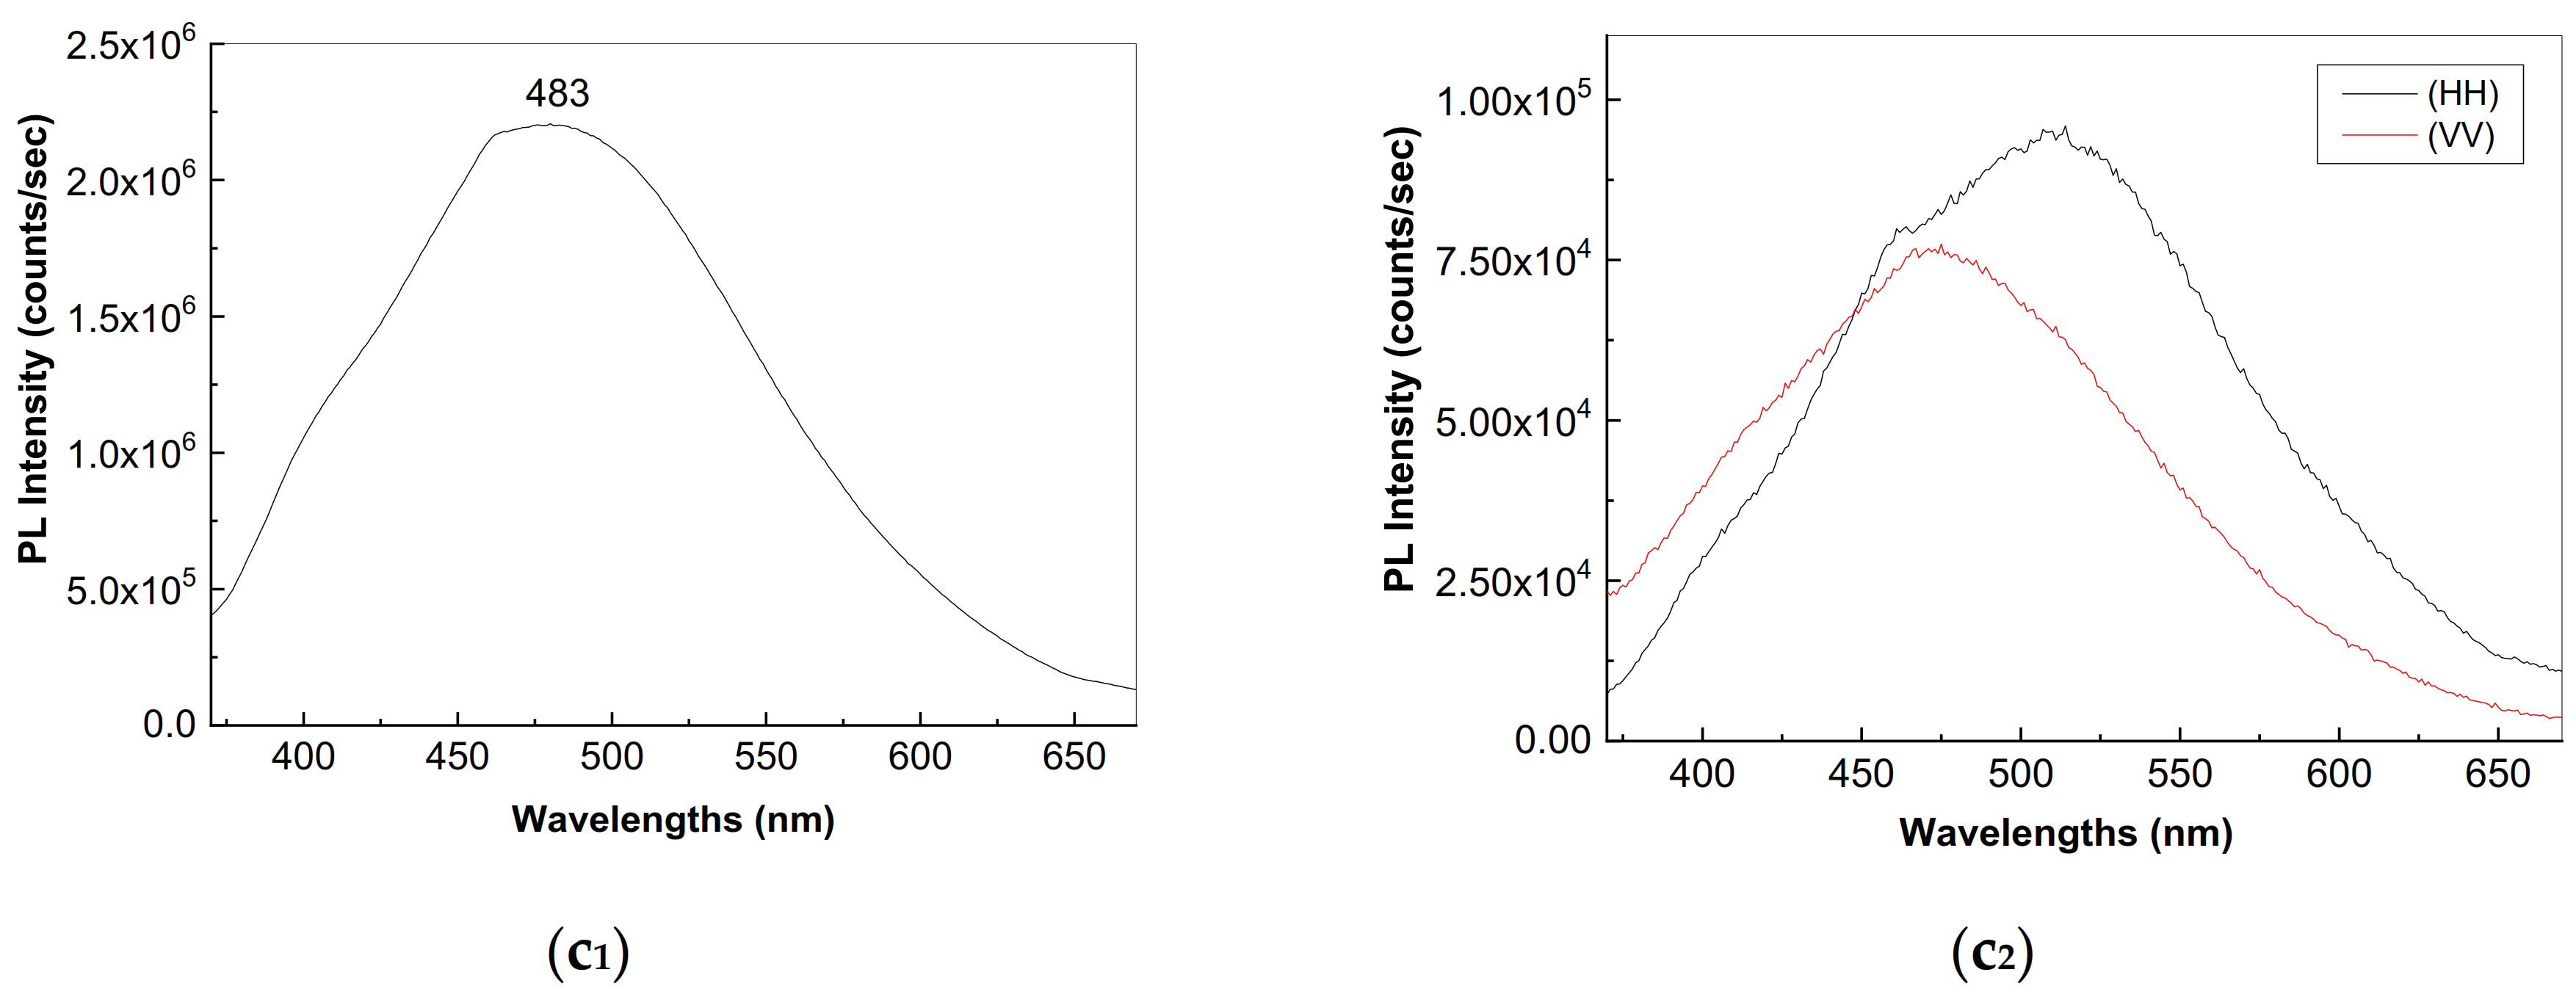
3.4. Photoluminescence of TPU and the TPU–TiO2 NWs Composites

Figure 7 shows the PL spectra of TPU and the TPU–TiO2 NW composites have a TiO2 NW concentration equal to 2 wt.% and 17 wt.%. The increase in the TiO2 NW concentration in the TPU–TiO2 NW composites mass from 0 wt.% to 17 wt.% induces a shift in the maximum level of the emission band from 416 nm (Figure 7a1) to 457 nm (Figure 7b1) and 480 nm (Figure 7c1), as well as a decrease in the intensity of the PL band from 1.55 × 10⁷ counts/sec (Figure 7a1) to 2.76 × 10⁶ counts/sec (Figure 7b1) and 2.2 × 10⁶ counts/sec (Figure 7c1). This decrease in the PL band indicates that TiO2 NWs are PTU PL quenching agents. According to G. Strat et al., the redshift of the TPU’s PL band results from the luminescence centers belonging the small-order aggregates [59], which in our case appear as a consequence of the reactions shown in Scheme 1 and Scheme 2.
Using the mathematic protocol reported in [60], the calculated values of the anisotropy (r) and binding angle (θPL) for TPU are 0.3712 and 12.6°, respectively, while the PTU–TiO2 NW composite has a TiO2 NW concentration equal to 2 wt.%, which is 0.2315 and 32°, and the PTU–TiO2 NW composite has a TiO2 NW concentration of 17 wt.%, which is 0.0905 and 45.9°. These values indicate that increasing the TiO2 NW concentration in the PTU–TiO2 NW composite mass results in an increase in θPL of TPU onto the TiO2 NW surface. As shown above, the θPL values are different from 0°, which suggests that the TPU’s excitation and emission transition dipoles are not parallel with the TiO2 NW plane. The orientation of TPU onto the TiO2 NW surface must consider the hydrogen bonds established between TiO2 NWs and TPU as well as the products of TPU’s exchange reaction with TiO2 NWs.

4. Conclusions

In this work, we reported new results concerning the optical and structural properties of TPU–TiO2 NW composites as free-standing films. Our results highlight the following conclusions: (i) using X-ray diffraction, we demonstrated that TiO2 NWs contain TiO2 anatase (A), Ti0.91O and Ti2O3 have cubic (C)- and orthorhombic (OR)-type crystalline structures, respectively, while H2Ti3O7 has a monoclinic (M)-type structure; (ii) in the case of TPU–TiO2 NW composites, with TiO2 NW concentration 2 wt.% and 17 wt.%, the increase in the intensity of the diffraction peak localized at 43.2° indicated the formation of titanium suboxides; (iii) according to studies using FTIR spectroscopy, the interaction of TPU with TiO2 NWs involved a decrease in the higher-order aggregates of TPU simultaneous with an increase in the hydrogen bonds established between the TPU amide groups and oxygen atoms of TiO2 NWs, facts that were highlighted by the variation of the ratio between the absorbance of the IR bands peaking at 765–771 cm−1 and 3304–3315 cm−1 from 4.68 to 3.83 when the concentration of TiO2 NWs in the composite mass was 0 wt.% and 17 wt.%; (iv) according to Raman spectroscopy, the decrease in the ratio between the intensity of the Raman lines peaked at 658 cm−1 and 635 cm−1, which were assigned to the vibrational modes Eg in TiO2 A and Eg in H2Ti3O7 (ITiO2-A/IH2Ti3O7), respectively, from 3.45 in TiO2 NWs to 0.94–0.96 in the TPU–TiO2 NW composites, indicating that the adsorption of TPU onto TiO2 NWs involves an exchange reaction of TPU in the presence of TiO2 NWs, which is followed by the formation of new hydrogen bonds between the -NH- of the amide group and the oxygen atoms of TixO2x-mn, Ti2O3, and Ti0.91O; (v) we demonstrated that the TiO2 NWs are TPU PL quenching agents, which was evidenced by the decrease in the intensity of the emission band of the TPU–TiO2 NW composite, which was localized in the spectral range 380–650 nm as increasing TiO2 NW concentration; and (vi) anisotropic photoluminescence studies indicated a preferential orientation of TPU onto the TiO2 NW surface, such as when increasing the TiO2 NW concentration in the PTU–TiO2 NW composite mass from 0 wt.% to 2 wt.% and 17 wt.%, which induced the increase in the polymer binding angle onto the TiO2 NW surface (θPL) from 12.6° to 32° and 45.9°.

Author Contributions

Conceptualization, M.B. and R.C.; methodology, M.B.; investigation, M.S., T.B., M.P., A.L., E.M. and M.B.; writing—original draft preparation, M.B. and R.C.; writing—review and editing, M.B.; visualization, M.S., T.B., M.P., A.L., E.M. and R.C.; supervision, M.B.; funding acquisition, M.B. All authors have read and agreed to the published version of the manuscript.

Funding

This research was funded by the European Regional Development Fund under the Competitiveness Operational Program 2014–2020, financing contract 58/05.09.2016 (POC), type D subcontract 62/13.04.2022.

Institutional Review Board Statement

Not applicable.

Informed Consent Statement

Not applicable.

Data Availability Statement

The data reported in this manuscript are available upon request from the corresponding author.

Acknowledgments

This research was funded by the European Regional Development Fund under the Competitiveness Operational Program 2014–2020, financing contract 58/05.09.2016 (POC), type D subcontract of 62/13.04.2022.

Conflicts of Interest

The authors declare no conflict of interest. The funders had no role in the design of the study, collection, analyses, or interpretation of data, writing of the manuscript, or decision to publish the results.

References

  1. Wang, X.; Li, Z.; Shi, J.; Yu, Y. One-dimensional titanium dioxide nanomaterials: Nanowires, nanorods and nanobelts. Chem. Rev. 2014, 114, 9346–9384. [Google Scholar] [CrossRef] [PubMed]
  2. Liu, Y.; Zhao, C.; Wang, X.; Xu, H.; Wang, H.; Zhao, X.; Feng, J.; Yan, W.; Ren, Z. Preparation of PPY/TiO2 core-shell nanorods film and its photocathodic protection for 304 stainless steel under visible light. Mat. Res. Bull. 2020, 124, 110751. [Google Scholar] [CrossRef]
  3. Sathasivam, K.; Wang, M.Y.; Anbalagan, A.K.; Lee, C.H.; Yeh, T.K. Prolonged and enhanced protection against corrosion over titanium oxide-coated 304L stainless steels having been irradiated with ultraviolet. Front. Mater. 2022, 9, 8630603. [Google Scholar] [CrossRef]
  4. Gordon, T.R.; Cargnello, M.; Paik, T.; Mangolini, F.; Weber, R.T.; Fornasiero, P.; Murray, C.B. Nonaqueous synthesis of TiO2 nanocrystals using TiFu to engineer morphology, oxygen, vacancy concentration, and photocatalytic activity. J. Am. Chem. Soc. 2012, 134, 6751–6761. [Google Scholar] [CrossRef]
  5. Suprabha, T.; Roy, H.G.; Thomas, J.; Kumar, K.P.; Mathew, S. Microwave-assisted synthesis of titania nanocubes, nanospheres and nanorods for photocatalytic dye degradation. Nanoscale Res. Lett. 2009, 4, 144–154. [Google Scholar] [CrossRef] [Green Version]
  6. Arami, H.; Mazloumi, M.; Khalifehzadeh, R.; Sadrnezhaad, S.K. Sonochemical properties of TiO2 nanoparticles. Mat. Lett. 2007, 61, 4559–4561. [Google Scholar] [CrossRef]
  7. Raut, N.C.; Mathews, T.; Chandramohan, P.; Srinivasan, M.P.; Dash, S.; Tyagi, A.K. Effect of temperature on the growth of TiO2 thin films synthesized by spray pyrolysis: Structural, compositional and optical properties. Mat. Research. Bull. 2011, 46, 2057–2063. [Google Scholar] [CrossRef]
  8. Zhang, Z.Y.; Shao, C.; Li, X.H.; Sun, Y.Y.; Zhang, M.Y.; Mu, J.B.; Zhang, P.; Guo, Z.C.; Liu, Y.C. Hierarchical assembly of ultrathin hexagonal SnS2 nanosheets onto electrospun TiO2 nanofibers: Enhanced photocatalytic activity based on photoinduced interfacial charge transfer. Nanoscale 2013, 5, 606–618. [Google Scholar] [CrossRef] [Green Version]
  9. Liu, W.; Tang, H.J.; Liu, D.Y. Combining density functional theory and CFD-PBM model to predict TiO2 nanoparticle evolution during chemical vapor deposition. Chem. Eng. J. 2023, 454, 140174. [Google Scholar] [CrossRef]
  10. Jain, N.; Zhu, Y.; Maurya, D.; Varghese, R.; Priya, S.; Hudait, M.K. Interfacial band alignment and structural properties of nanoscale TiO2 thin films for integration with epitaxial crystallographic oriented germanium. J. Appl. Phys. 2014, 115, 024303. [Google Scholar] [CrossRef] [Green Version]
  11. Aarik, J.; Aidla, A.; Sammelselg, V.; Uustare, T. Effect of growth conditions on formation of TiO2-II thin films in atomic layer deposition process. J. Cryst. Growth 1997, 181, 259–264. [Google Scholar] [CrossRef]
  12. Zhou, X.H.; Zhou, X.F. Pulse laser deposition preparation and laser-induced voltage signals of TiO2 thin films. Thin Solid Films 2022, 756, 139375. [Google Scholar] [CrossRef]
  13. Lee, Y.H.; Yoo, J.M.; Park, D.H.; Kim, D.H.; Jee, B.K. Co-doped TiO2 nanowire electric field-effect transistors fabricated by suspended molecular template method. Appl. Phys. Lett. 2005, 86, 033110. [Google Scholar] [CrossRef]
  14. Li, M.; Luo, S.; Wu, P.; Shen, J. Photocathodic protection effect of TiO2 films for carbon steel in 3% NaCl solutions. Electrochim. Acta 2005, 50, 3401–3406. [Google Scholar] [CrossRef]
  15. Safajou, H.; Khojasteh, H.; Salavati-Niasari, M.; Mortazavi-Derazkola, S. Enhanced photocatalytic degradation of dyes over graphene/Pd/TiO2 nanocomposites: TiO2 nanowires versus TiO2 nanoparticles. J. Colloid. & Interface Sci. 2017, 498, 423–432. [Google Scholar]
  16. Zhou, X.M.; Liu, N.; Schmuki, P. Photocatalysis with TiO2 nanotubes: “Colorful” reactivity and designing site-specific photocatalytic centers into TiO2 nanotubes. ACS Catal. 2017, 7, 3210–3235. [Google Scholar] [CrossRef] [Green Version]
  17. Esmat, M.; El-Hosainy, H.; Tahawy, R.; Jevasuwan, W.; Tsunoji, N.; Fukata, N.; Ide, Y. Nitrogen doping-mediated oxygen vacancies enhancing co-catalyst-free solar photocatalytic H2 production activity in anatase TiO2 nanosheet assembly. Appl. Catal. B-Environ. 2021, 285, 119755. [Google Scholar] [CrossRef]
  18. Xiong, Z.G.; Zhao, X.S. Nitrogen-doped titanate-anatase core-shell nanobelts with exposed {101} anatase facets and enhanced visible light photocatalytic activity. J. Am. Chem. Soc. 2012, 134, 5754–5757. [Google Scholar] [CrossRef]
  19. Vajda, K.; Saszet, K.; Kedves, E.Z.; Kasa, Z.; Danciu, V.; Baia, L.; Magyari, K.; Hernadi, K.; Kovacs, G.; Pap, Z. Shape-controlled agglomeration of TiO2 nanoparticles. New insights on polycrystallinity vs. single crystals in photocatalysis. Ceramics Int. 2016, 42, 3077. [Google Scholar] [CrossRef] [Green Version]
  20. Li, L.D.; Yan, J.Q.; Wang, T.; Zhao, Z.J.; Zhang, J.; Gong, J.L.; Guan, N.J. Sub-10 nm rutile titanium dioxide nanoparticles for efficient visible-light-driven photocatalytic hydrogen production. Nature Commun. 2015, 6, 5881. [Google Scholar] [CrossRef] [Green Version]
  21. Kibasomba, P.M.; Dhlamini, S.; Maaza, M.; Liu, C.P.; Rashad, M.M.; Rayan, D.A.; Mwakikunga, B.W. Strain and grain size of TiO2 nanoparticles from TEM, Raman spectroscopy and XRD.; The revisiting of the Williamson-Hall plot method. Results Phys. 2018, 9, 628–635. [Google Scholar] [CrossRef]
  22. Ou, H.H.; Liao, C.H.; Lo, S.L. Determination of X-ray diffraction on the phase transformation of microwave-assisted titanate nanotubes during thermal treatment. J. Nanomat. 2010, 837384, 2010. [Google Scholar] [CrossRef] [Green Version]
  23. Di Paola, A.; Bellardita, M.; Palmisano, L. Brookite, the least known TiO2 photocatalyst. Catalyst 2013, 3, 36–73. [Google Scholar] [CrossRef] [Green Version]
  24. Basavarajappa, P.S.; Patil, S.B.; Ganganappa, N.; Reddy, K.R.; Raghu, A.V.; Reddy, C.V. Recent progress in metal-doped TiO2, non-metal doped/co-doped TiO2 and TiO2 nanostructured hybrids for enhanced photocatalysis. Int. J. Hydrog. Energy 2020, 45, 7764–7778. [Google Scholar] [CrossRef]
  25. Arthi, R.; Jaikumar, V.; Muralidharan, P. Comparative performance analysis of electrospun TiO2 embedded poly(vinylidene fluoride) nanocomposite membrane for supercapacitors. J. Appl. Polym. Sci. 2020, 138, e50323. [Google Scholar] [CrossRef]
  26. Matysia, W.; Tanski, T.; Jarka, P.; Nowak, M.; Kepinska, M.; Szperlich, P. Comparison of optical materials of PAN/TiO2, PAN/Bi2O3, and PAN/SbSl nanofibers. Opt. Mater. 2018, 83, 145–151. [Google Scholar] [CrossRef]
  27. Al-Mokaram, A.M.A.A.; Yahya, R.; Abdi, M.M.; Mahmud, H.N.M.E. The development of non-enzymatic glucose biosensors based on electrochemically prepared polypyrrole-chitosan-titanium dioxide nanocomposite films. Nanomaterials 2017, 7, 129. [Google Scholar] [CrossRef] [Green Version]
  28. Wang, G.J.; Huang, X.J.; Jiang, P.K. Mussel-inspired fluoro-polydopamine functionalization of titanium dioxide nanowires for polymer nanocomposites with significantly enhanced energy storage capability. Sci. Rep. 2017, 7, 43071. [Google Scholar] [CrossRef]
  29. Behniafar, H.; Yazdi, M.; Saki, F. Chemical preparation and characterization of fibrous poly(3-methyl thiophene) decorated by TiO2 nanoparticles. Int.J. Polym. Anal. Charact. 2016, 21, 584–589. [Google Scholar] [CrossRef]
  30. Chiang, C.J.; Lee, Y.H.; Lee, Y.P.; Lin, G.T.; Yang, M.H.; Wang, L.; Hsieh, C.C.; Dai, C.A. One-step in situ hydrothermal fabrication of D/A poly(3-hexyl thiophene)/TiO2 hybrid nanowires and its application in photovoltaic devices. J. Mater. Chem. A. 2016, 4, 908–919. [Google Scholar] [CrossRef]
  31. Siuzdak, P.; Sawczak, M.; Lisowska-Oleksiak, A. Fabrication and properties of electrode materials composed of order titanium nanotubes and PEDOT:PSS. Solid State Ionics 2015, 271, 56–62. [Google Scholar] [CrossRef]
  32. Guo, Y.N.; He, D.L.; Xia, S.B.; Xie, X.; Gao, X.; Zhang, Q. Preparation of a novel nanocomposite of polyaniline core decorated with anatase-TiO2 nanoparticles in ionic liquid/water microemulsion. J. Nanomater. 2012, 2012, 202794. [Google Scholar] [CrossRef] [Green Version]
  33. Glouia, Y.; Dhorib, S.; Abid, K. A comparative study of the effect of clay and titanium dioxide on the mechanical properties and permeability of nanocoated cotton fabrics. J. Appl. Polym. Sci. 2017, 135, 45642. [Google Scholar] [CrossRef]
  34. Jian, Y.; Li, F.; Mei, Y.; Ding, Y.; Pang, H.; Zhang, P. Gel polymer electrolyte based on hydrophilic-lipophilic TiO2–modified thermoplastic polyurethane for high-performance Li-ion batteries. J. Mater Sci. 2021, 56, 2474–2485. [Google Scholar] [CrossRef]
  35. Ji, H.; He, D.; Li, B.; Lu, G.; Wang, C. Evaluation of rheological and anti-aging properties of TPU/nano-TiO2 composite–modified asphalt binder. Materials 2022, 15, 3000. [Google Scholar] [CrossRef]
  36. Simsek, R.; Polat, Y.; Pampal, E.S.; Agna, O.; Kibic, A. Ultrasonic coating of nanofibrous webs: A feasible approach to photocatalytic water filters. J. Coat. Technol. Res. 2016, 13, 89–95. [Google Scholar] [CrossRef]
  37. Wei, O.; Oribayo, O.; Feng, X.; Remple, G.L.; Pan, Q. Synthesis of polyurethane foams loaded with TiO2 nanoparticles and their modifications for enhanced performance in oil spill cleanup. Ind. Eng. Chem. Res. 2018, 57, 8918–8926. [Google Scholar] [CrossRef]
  38. Zhang, J.; Li, X.; Guo, J.; Zhou, G.; Xiang, L.; Wang, X.; He, Z. Novel TiO2/TPU composite fiber-based smart textiles for photocatalytic applications. Mater Adv. 2022, 3, 1518. [Google Scholar] [CrossRef]
  39. Chen, X.; Wang, W.; Li, S.; Qian, Y.; Jiao, C. Synthesis of TPU/TiO2 nanocomposites by molten blending method. J. Therm. Ana. Calorim. 2018, 132, 793–803. [Google Scholar] [CrossRef]
  40. Rehman, W.U.; Rasheed, T.; Naveed, A.; Ali, A. Thermoplastic polyurethane/rutile titanium dioxide composites turned for hydrophobicity with effective reinforcement. J. Polym. Res. 2022, 29, 188. [Google Scholar] [CrossRef]
  41. Suresh, S.; Black, R.A. Electrospun polyurethane as an alternative ventricular catheter and in vitro model of shunt obstruction. J. Biomat. Appl. 2015, 29, 1028–1038. [Google Scholar] [CrossRef] [Green Version]
  42. Harris, C.A.; Resau, J.H.; Hedson, E.A. Effects of surface wettability, flow and protein concentration on macrophage and astrocyte adhesion in an in vitro model of central nervous system catheter obstruction. J. Biomed. Mater. Res. Part A 2011, 97, 433–440. [Google Scholar] [CrossRef] [PubMed]
  43. Baibarac, M.; Nila, A.; Smaranda, I.; Stroe, M.; Stingescu, L.; Cristea, M.; Cercel, R.C.; Lorinczi, A.; Ganea, P.; Mercioniu, I.; et al. Optical, structural and dielectric properties of composites based on thermoplastic polymers of the polyolefin and polyurethane type and BaTiO3 nanoparticles. Materials 2021, 14, 753. [Google Scholar] [CrossRef] [PubMed]
  44. Garcia-Contreras, L.A.; Flores-Flores, J.O.; Arenas-Alatorre, J.A.; Chavez-Carvayar, J.A. Synthesis, characterization and study of the structural change of nanobelts of TiO2 (H2Ti3O7) to nanobelts with anatase, brookite and rutile phases. J. Alloys Compd. 2022, 923, 166236. [Google Scholar] [CrossRef]
  45. Li, W.; Liang, R.; Hu, A.; Huang, Z.; Zhou, Y.N. Generation of oxygen vacancies in visible light activated one-dimensional iodine TiO2 photocatalysts. RSC Adv. 2014, 4, 36959. [Google Scholar] [CrossRef]
  46. Sofyan, N.; Ridhova, A.; Yuwono, A.H.; Udhiarto, A. Preparation of anatase TiO2 nanoparticles using low hydrothermal temperature for dye-sensitized solar cell. IOP conf. Ser. Mater. Sci. Eng. 2018, 316, 012055. [Google Scholar] [CrossRef] [Green Version]
  47. Ferry, A.; Jacobsson, P.; Van Heumen, J.; Stevens, J. Raman, infra-red and d.s.c. studies of lithium coordination in a thermoplastic polyurethane. Polymer 1996, 37, 737–744. [Google Scholar] [CrossRef]
  48. Pattamaprom, C.; Wu, C.H.; Chen, P.H.; Huang, Y.L.; Raganathan, P.; Rwei, S.R.; Chuan, F.S. Solvent-free one-shot synthesis of thermoplastic polyurethane based in bio-poly(1, 3-propylene succinate)glycol with temperature-sensitive shape memory behavior. ACS Omega 2020, 5, 4058–4066. [Google Scholar] [CrossRef] [Green Version]
  49. Sen, F.; Basturk, E.; Karadogan, B.; Madakbas, S.; Kahraman, M.V. Effect of barium titanate in the thermal, morphology, surface and mechanical properties of the thermoplastic polyurethane/barium titanate composites. Polym. Plast. Technol. Eng. 2016, 55, 1325–1331. [Google Scholar] [CrossRef]
  50. Sarabiyan Nejad, S.; Babaie, A.; Bagheri, M.; Rezaei, M.; Abbasi, F.; Shomali, A. Effects of graphene quantum dot (GQD) on photoluminescence, mechanical, thermal and sharpe memory properties of thermoplastic polyurethane nanocomposites. Polym. Adv. Technol. 2020, 31, 2279–2289. [Google Scholar]
  51. Ning, L.; De-Ning, W.; Sheng-Kang, Y. Crystallinity and hydrogen bonding of hard segments in segmented poly(urethane urea) copolymers. Polymer 1996, 37, 3577–3583. [Google Scholar] [CrossRef]
  52. Mattia, J.; Painter, P. A comparison of hydrogen bonding and other in a polyurethane and poly(urethane-urea) and their blends with poly(ethylene glycol). Macromolecules 2007, 40, 1546–1554. [Google Scholar] [CrossRef]
  53. Allen, N.S.; McKellar, J.F. Photochemical reactions in an MDI-based elastomeric polyurethane. J. Appl. Polym. Sci. 1976, 20, 1441–1447. [Google Scholar] [CrossRef]
  54. Parnell, S.; Min, K.; Cakmak, M. Kinetic studies of polyurethane polymerization with Raman spectroscopy. Polymer 2003, 44, 5137–5144. [Google Scholar] [CrossRef]
  55. Lin-Vien, D.; Colthup, N.; Fateley, W.; Grasselli, J. The Handbook of Infrared and Raman Characteristic Frequencies of Organic Moleucles, 1st ed.; Academic Press: San Diago, CA, USA, 1991. [Google Scholar]
  56. Choi, H.C.; Jung, Y.M.; Kim, S.B. Size effects in the Raman spectra of TiO2 nanoparticles. Vib. Spectrosc. 2005, 37, 33–38. [Google Scholar] [CrossRef]
  57. Challagulla, S.; Tarafder, K.; Ganesan, R.; Roy, S. Structure sensitive photocatalytic reduction of nitroarenes over TiO2. Sci. Rep. 2017, 7, 8783. [Google Scholar] [CrossRef]
  58. Chen, Y.; Mao, J. Sol-gel preparation and characterization of black titanium oxides Ti2O3 and Ti3O5. J. Mater Sci. Mater. Electron. 2014, 25, 1284–1288. [Google Scholar] [CrossRef]
  59. Strat, G.; Buruiana, E.; Buruiana, T.; Pohoata, V.; Strat, M. Fluorescence properties of the polyurethane with anchored stilbene chromophore. J. Optoelectr. Adv. Mater. 2005, 7, 925–928. [Google Scholar]
  60. Baibarac, M.; Ilie, M.; Baltog, I.; Lefrant, S.; Humbert, B. Infrared dichroism studies and anisotropic photoluminescence properties of poly(para-phenylene vinylene) functionalized reduced graphene. RSC Adv. 2017, 7, 6931–6942. [Google Scholar] [CrossRef] [Green Version]
Figure 1. Synthesis method for TPU–TiO2 NW composites as free-standing films.
Materials 16 01742 g001
Figure 2. The SEM images of TiO2 NWs (a), as well as TPU (b) and the TPU–TiO2 NW composites, which have TiO2 NW concentrations equal to 2 wt.% (c) and 17 wt.% (d), respectively.
Materials 16 01742 g002
Figure 3. The EDS spectra of TiO2 NWs (a), TPU (b) and the TPU–TiO2 NW composites having the TiO2 NW concentration equal to 2 wt.% (c) and 17 wt.% (d). The unassigned maxima belong to the sample fixation substrate.
Materials 16 01742 g003
Figure 4. The XRD patterns of TiO2 NWs (a) and the TPU–TiO2 NW composites (b) with TiO2 NW concentrations equal to 2 wt.% (blue curve in Figure 4b) and 17 wt.% (red curve in Figure 4b).
Materials 16 01742 g004
Figure 5. IR spectra of TPU (a, black curve) and TPU–TiO2 NW composites, which have TiO2 NW concentrations equal to 2 wt.% (b, red curve) and 17 wt.% (c, blue curve).
Materials 16 01742 g005
Figure 6. Raman spectra of: (a) TPU (a1); TPU–TiO2 NW composites have TiO2 NW concentrations equal to 2 wt.% (a2) and 17 wt.% (a3); and (b) TiO2 NWs.
Materials 16 01742 g006
Scheme 1. Exchange reaction of TPU in presence of TiO2 NWs.
Materials 16 01742 sch001
Scheme 2. Physical adsorption of polymer with repeating units containing amide groups onto TixO2x-mn surface.
Materials 16 01742 sch002
Figure 7. PL spectra of TPU (a1), PTU–TiO2 NWs 2% (b1), and PTU–TiO2 NWs 17% (c1). Anisotropic PL of TPU (a2), PTU–TiO2 NWs 2% (b2), and PTU–TiO2 NWs 17% (c2). In (a2,b2,c2), blue and red curves correspond to PL spectra recorded when measurement geometry for emission and excitation polarizers are both in horizontal (HH) and vertical (VV) position.
Materials 16 01742 g007aMaterials 16 01742 g007b
Disclaimer/Publisher’s Note: The statements, opinions and data contained in all publications are solely those of the individual author(s) and contributor(s) and not of MDPI and/or the editor(s). MDPI and/or the editor(s) disclaim responsibility for any injury to people or property resulting from any ideas, methods, instructions or products referred to in the content.

