Article

Development and Validation of a Vibration-Based Virtual Sensor for Real-Time Monitoring NOx Emissions of a Diesel Engine

1
Department of Vehicle Engineering, Taiyuan University of Technology, Taiyuan 030024, China
2
Centre for Efficiency and Performance Engineering, University of Huddersfield, Huddersfield HD1 3DH, UK
*
Author to whom correspondence should be addressed.
Machines 2022, 10(7), 594; https://doi.org/10.3390/machines10070594
Submission received: 13 June 2022 / Revised: 12 July 2022 / Accepted: 15 July 2022 / Published: 21 July 2022
(This article belongs to the Section Electrical Machines and Drives)

Abstract

:
With a strong legal basis and regulatory authority, cost-effective transient emission sensors that reflect real-driving emissions are key factors for accomplishing environmental requirements. It is difficult for the existing NOx emission monitoring techniques to achieve a balance between accuracy and timeliness. Fundamentally, in-cylinder combustion is the thermodynamic cause of NOx emissions and the main excitation source for engine vibration and noise emissions. A novel vibration-based virtual NOx sensor is developed based on these critical relationships for real-time NOx monitoring. First, the correlation between vibration and NOx emission was characterized in-depth. Then, a technique of constructing two-dimensional filters for vibration signals is proposed to extract combustion-related information. A principal component regression (PCR) model for NOx prediction was established based on the reconstructed in-cylinder pressure. Finally, the virtual NOx sensor is tested and validated on a single-cylinder diesel engine bench. The virtual NOx sensor is proven to meet the accuracy requirement of vehicle emission monitoring for both steady-state and transient conditions and has a better frequency response compared to the emission measurement system.

1. Introduction

Nitrogen oxide (NOx) is one of the main emissions from combustion ignition (CI) engines which causes ambient air pollution, resulting in large numbers of premature deaths, especially in urban areas where traffic congestion is increasing. NO2 also contributes to global warming, and in some cases can cause acid rain. Tight emission regulations have been put forward to monitor real driving emissions, increasing interest in cost-effective transient emission sensors. The high cost of the physical sensors and the need to improve response speed limit its applications in NOx emission monitoring and transient control. It has great significance to develop a low-cost, portable, and reliable on-board real-time emission monitoring method. Virtual sensing technology is regarded as one of the most feasible alternatives.
Virtual sensors can be categorized into physics-based, black-box, and grey-box models [1]. The physics-based virtual sensor is constructed based on the operating mechanism of behavior to be measured, accurately describing the essential correspondence between input and output physical quantities. However, the construction of physics-based virtual sensors heavily relies on abundant measured inputs, leading to a large demand for computing resources and high cost of information collection. Black-box virtual sensors are typically created through a data-driven fitting process and strive to describe the correspondence between input and output quantities with fewer parameters. It provides high computational efficiency but relies on high calibration effort. The grey-box method is the preferred solution in practice because of its balance of efficiency and accuracy. The feature extraction based on the physical model enables the grey-box virtual sensor to handle the prediction of transient conditions better. The simplified mathematical model enables the grey-box method to be applied more efficiently and cost-effectively.
Previous works have developed several virtual NOx sensors for diesel engines and achieved many beneficial results. Most existing virtual NOx sensors are developed based on characteristic parameters extracted from measured in-cylinder pressure signals. This is because the generation of NOx is mainly related to in-cylinder combustion behaviors, and one of the most important characteristic parameters of the combustion state in-cylinder pressure. In 2011, C. Guardiola et al. [2] proposed a NOx model and developed NOx predictive emission control in diesel engines. Only in-cylinder pressure and several mean variables available in the ECU were selected as the predictive model’s input signal. Experiments show that the proposed predictive model possesses high computational efficiency that only takes less than one cycle to complete the NOx prediction, making it suitable for real-time application. In 2014, Simone Formentin et al. [3] proposed an engine speed and indicated a pressure measurement NOx estimation method. The principal component analysis (PCA) is performed to construct predictive variables based on in-cylinder pressure and L2 regularization techniques to derive the NOx estimator. Based on the NOx formation model proposed by Seykens et al. [4], Paul Mentink et al. [5] developed a virtual NOx sensor with in-cylinder pressure as the primary input. Their verification test demonstrated the potential of a virtual NOx sensor for real-time engine control and transient emission improvement. They also validated their virtual NOx sensor on a EURO-VI heavy-duty diesel engine [1], which indicates that the virtual NOx sensor meets the accuracy of a commercial NOx sensor for steady-state conditions. Christian Benatzky et al. [6] established a virtual NOx sensor based on static polynomial black-box modeling for heavy-duty off-road diesel engines. It is shown that black-box virtual sensors achieved high-accuracy NOx prediction with fewer regressors. In 2014, Sumit Roy et al. [7] developed an artificial neural network (ANN)-based virtual sensor for emissions monitoring of a diesel–CNG dual-fuel engine. Similarly, Dipankar Kakati et al. [8] developed an ANN-based black-box virtual sensor to predict NOx emissions of a diesel–methanol dual-fuel engine, which further confirmed the feasibility of applying a pressure-based virtual sensor to achieve real-time engine emissions control. However, an in-cylinder pressure sensor is more expensive than the production NOx sensor, making the pressure-based virtual NOx sensor impractical for popularization and application. It is necessary to explore more cost-effective virtual sensors for NOx emission monitoring.
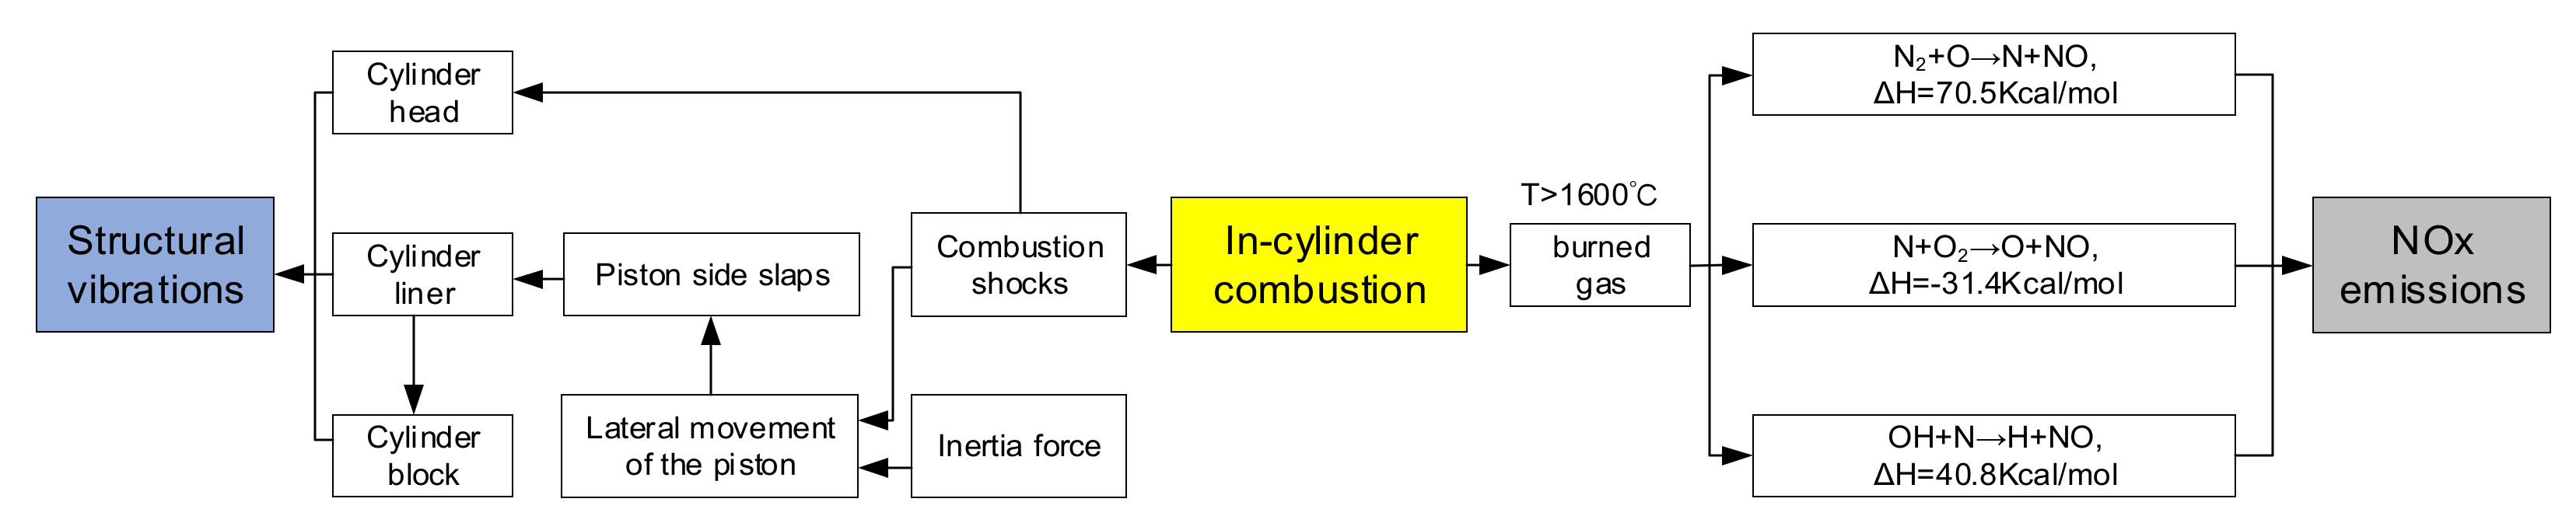
The main thermodynamic cause of NOx emissions and one of the main excitation sources for engine vibration is in-cylinder combustion. The structural vibration of engines contains abundant response characteristics related to in-cylinder combustion behaviors. The study on structural vibration and in-cylinder combustion laid a solid foundation for emission monitoring based on vibration signal analysis. Tang et al. [9] proposed a finite element model showing that the changes in combustion pressure can replicate by the deformation of cylinder head. Cheng et al. [10] confirmed the similarity between the cylinder head vibration velocity and increasing in-cylinder pressure rate. Zhao et al. [11] and Chiatti et al. [12] identified key features of the in-cylinder combustion process based on measured vibration signals. Polnowski et al. [13] and Ornella et al. [14] further investigated the correspondence between structural acceleration and in-cylinder pressure of heavy-duty diesel engines. El-Ghamrya et al. [15] remodeled the in-cylinder pressure of a diesel engine based on measured acoustic emission using complex spectrum analysis.
However, the credibility and accuracy of remodeled in-cylinder pressure curves based on vibration signals are always unsatisfactory due to the interference of mechanical events and strong background noise, thus limiting its further research and application. Cali et al. [16] extracted similarity information from different digital images by introducing the structural similarity index measure (SSIM) method. A two-dimensional matrix describing the global similarity of two images was obtained, which inspired the development of a similarity analysis technique for different signals in the time-frequency domain. Yang et al. [17] evaluated cylinder vibration and in-cylinder pressure similarity based on the SSIM method and explored the reconstruction of in-cylinder pressure based on measured vibration signals.
This work aims to propose a technique for predicting NOx emissions based on measured structural vibration. First, the correlation between vibration and NOx emission was analyzed. Then, a technique of designing two-dimensional filters for vibration signals was proposed to extract combustion-related information. A PCR model for NOx prediction, i.e., a virtual NOx sensor, was established based on the reconstructed in-cylinder pressure. Finally, the predictive performance of the proposed virtual NOx sensor was evaluated through both steady-state and quasi-transient tests.

2. Characterizing the Correlation between Vibration and NOx Emission

In-cylinder combustion is the primary cause of engine vibration and NOx emissions. An in-depth understanding of combustion’s role in structural vibration and NOx generation is critical for modeling the complex correspondence between structural vibrations and NOx emissions.

2.1. The Correlation between Combustion and NOx Emission

NOx is a collective term for nitrogen monoxide (NO) and nitrogen dioxide (NO2). The proportion of NO2 in NOx emissions after combustion in the exhaust is much lower than that of NO, accounting for only 10–15%. Therefore, the research on the correlation between combustion and NOx emissions should be focused on NO formation.
There are five ways for NOx producing: Zeldovich (thermal NOX), Fenimore (prompt NOx), N2O (nitrous oxide), Fuel-bound (fuel-bound nitrogen), and the Diazanul (NNH). The principal reactions of NO formation from molecular nitrogen and oxygen in the period of combustion are often showed by the Zeldovich method, which consists of three chemical reactions and seven components for NO production [18], as shown in Figure 1. On the one hand, the Zeldovich mechanism supposes that NOx production occurs when the combustion chamber temperature is highest [2,19,20]. The adiabatic flame temperature (Tad) is the most appropriate variable to characterize the NOx formation. In contrast, it considers that fuel combusts at the fuel/air stoichiometric equivalence ratio (φ = 1) and the temperature is near-adiabatic. Therefore, it is concluded that the formation of NOx is closely dependent on the instantaneous evolution of adiabatic flame temperature and heat release rate.
The vital characteristic constraint for indicating the performance of in-cylinder combustion in diesel engines is in-cylinder pressure. In practice, adiabatic flame temperature and heat release rate are usually measured based on characteristic parameters from the in-cylinder pressure evolution. It has been confirmed that there is a solid theoretical basis for indirect assessment of NOx emission based on measured in-cylinder pressure. Several pressure-based virtual NOx sensors have been developed and have achieved promising results [1,5,6,7,8,21].

2.2. The Correlation between Combustion and Vibration

Combustion shocks are the main causes of engine vibration and noise emissions. The structural vibration of IC engines contains abundant response characteristics related to combustion shocks. Many previous studies on identifying and reconstructing in-cylinder pressure information from vibration signals have been carried out. Many researchers categorize and locate combustion events on the time-domain vibration curve without extracting frequency information and resonance responses. Li et al. [22] found that the resonance response to combustion shock can effectively reflect the excitation event’s frequency components and energy distribution. It is necessary to investigate the correlation between structural vibration and in-cylinder combustion to explore a suitable method for extracting combustion-related information from vibration signals.
There are two main pathways for combustion shock to cause vibration responses, as shown in Figure 1. The first is the direct impact of combustion gas on the chamber walls, and the other is the gas-driven piston knocks on the cylinder liners. Inertial force, kinetic characteristics of crank-link mechanism and oil damping characteristics are also factors to product piston knocking in cylinder combustion [22]. The connection between the piston knock-induced vibration response and in-cylinder combustion behavior is weak and indirect, therefore only the vibration response to the combustion shock is selected as the data source for combustion information extraction.
The in-cylinder pressure signal mainly contains two frequency components: the low-frequency components associated with speed frequency and high-frequency components associated with combustion oscillations. The pressure rise rate (PRR) operating at a speed of 1800 r/min and load of 40 Nm clearly shows results by short-time Fourier transform (STFT), and that the combustion shock contains abundant frequency components at a wide frequency range, as shown in Figure 2a. The (PRR) and measured pressure signals are drawn below by the STFT in Figure 2b. Short-time Fourier transform (STFT) results in Figure 2a show a series of oscillations at a frequency range of 4000–8000 Hz during premixed combustion phase around 370°, marked as Impact Co. Unstable gas turbulence in the combustion chamber and lack of homogeneity cause these vibration oscillations [23].
A transient dynamic model of a single-cylinder engine was established to simulate the vibration response of cylinder liners and to facilitate the study of the correspondence between structural vibration and in-cylinder pressure [22]. Figure 3 shows the predicted liner responses to a measured in-cylinder pressure at an operating condition of 1800 r/min and 40 Nm. The predicted displacement curve is close to the measured pressure with significant responses cluster near the combustion top dead center (TDC), as shown in Figure 3b. The response feature around combustion TDC and located in the frequency range of 5–8 kHz is labeled as Impact Co in the Figure 3a. The high similarity between the oscillatory features of the predicted dynamic response and measured in-cylinder pressure indicates that the Impact Co in predicted displacement is primarily a forced response caused by in-cylinder gas shocks, as shown in Figure 2a.
Furthermore, a series of high-frequency responses in the 8–12 kHz band sustain for a longer duration, marked as Impact Cs in Figure 3a. This structural mode-dependent high frequency resonance is excited by a pressure shock during premixed combustion period, which can be used to estimate the heat release rate and adiabatic flame temperature.
It can be concluded that the structural vibrations of the combustion chamber contain abundant response characteristics related to in-cylinder combustion, which provides a solid basis for the subsequent evaluation of the in-cylinder combustion state and reconstruction of the pressure based on measured vibration signal.

2.3. Vibration-Based NOx Virtual Sensing

The formation of NOx is closely related to the in-cylinder pressure trace that can be identified and reconstructed from the structural vibration response [3]. Therefore, it is feasible to develop a vibration-based virtual NOx sensor based on the connection between the three.
The key to developing a vibration-based virtual NOx sensor is to accurately identify combustion information and reconstruct in-cylinder pressure from measured vibration signals. Previous studies on the reconstruction of in-cylinder pressure mostly focused on temporal information extraction [3], in which frequency characteristics are not adequately included and often result in less accurate reconstruction. In contrast, reconstruction methods in the frequency domain inevitably introduce interferences caused by other mechanical events, such as valve impacts that are less related to combustion.
To overcome the limitations of previous methods, this paper proposes a combustion information extraction technique based on a two-dimensional filtration of vibration signals in the joint time and frequency domain.
The main procedure of model construction (blue dashed box) and emission prediction (yellow dotted box) of the virtual NOx sensor are shown in Figure 4. First, time-frequency analysis and corresponding grayscale image conversion are performed on the in-cylinder pressure, and structural vibration is measured simultaneously under steady-state conditions. A two-dimensional filter is constructed through structural similarity index (SSIM) analysis to extract pressure-related features from measured vibration signals. Then, principal component analysis (PCA) is performed on the reconstructed in-cylinder pressure trace to construct predictor variables, thereby constructing a principal component regression (PCR) prediction model.
In practical applications, time-frequency transformation and grayscale processing are firstly performed on the measured vibrations. The above established two-dimensional filter corresponding to a specific operating condition is called to construct the predictor variables. The NOx emission level can be predicted in real-time based on the established PCR model.

3. Test Design

Test studies were performed based on a single-cylinder diesel engine to evaluate the proposed method. The main specification of the engine is listed in Table 1. This single cylinder engine avoids multiple events influences and focuses on the identification and extraction of characteristics related to combustion events from measured vibration response.
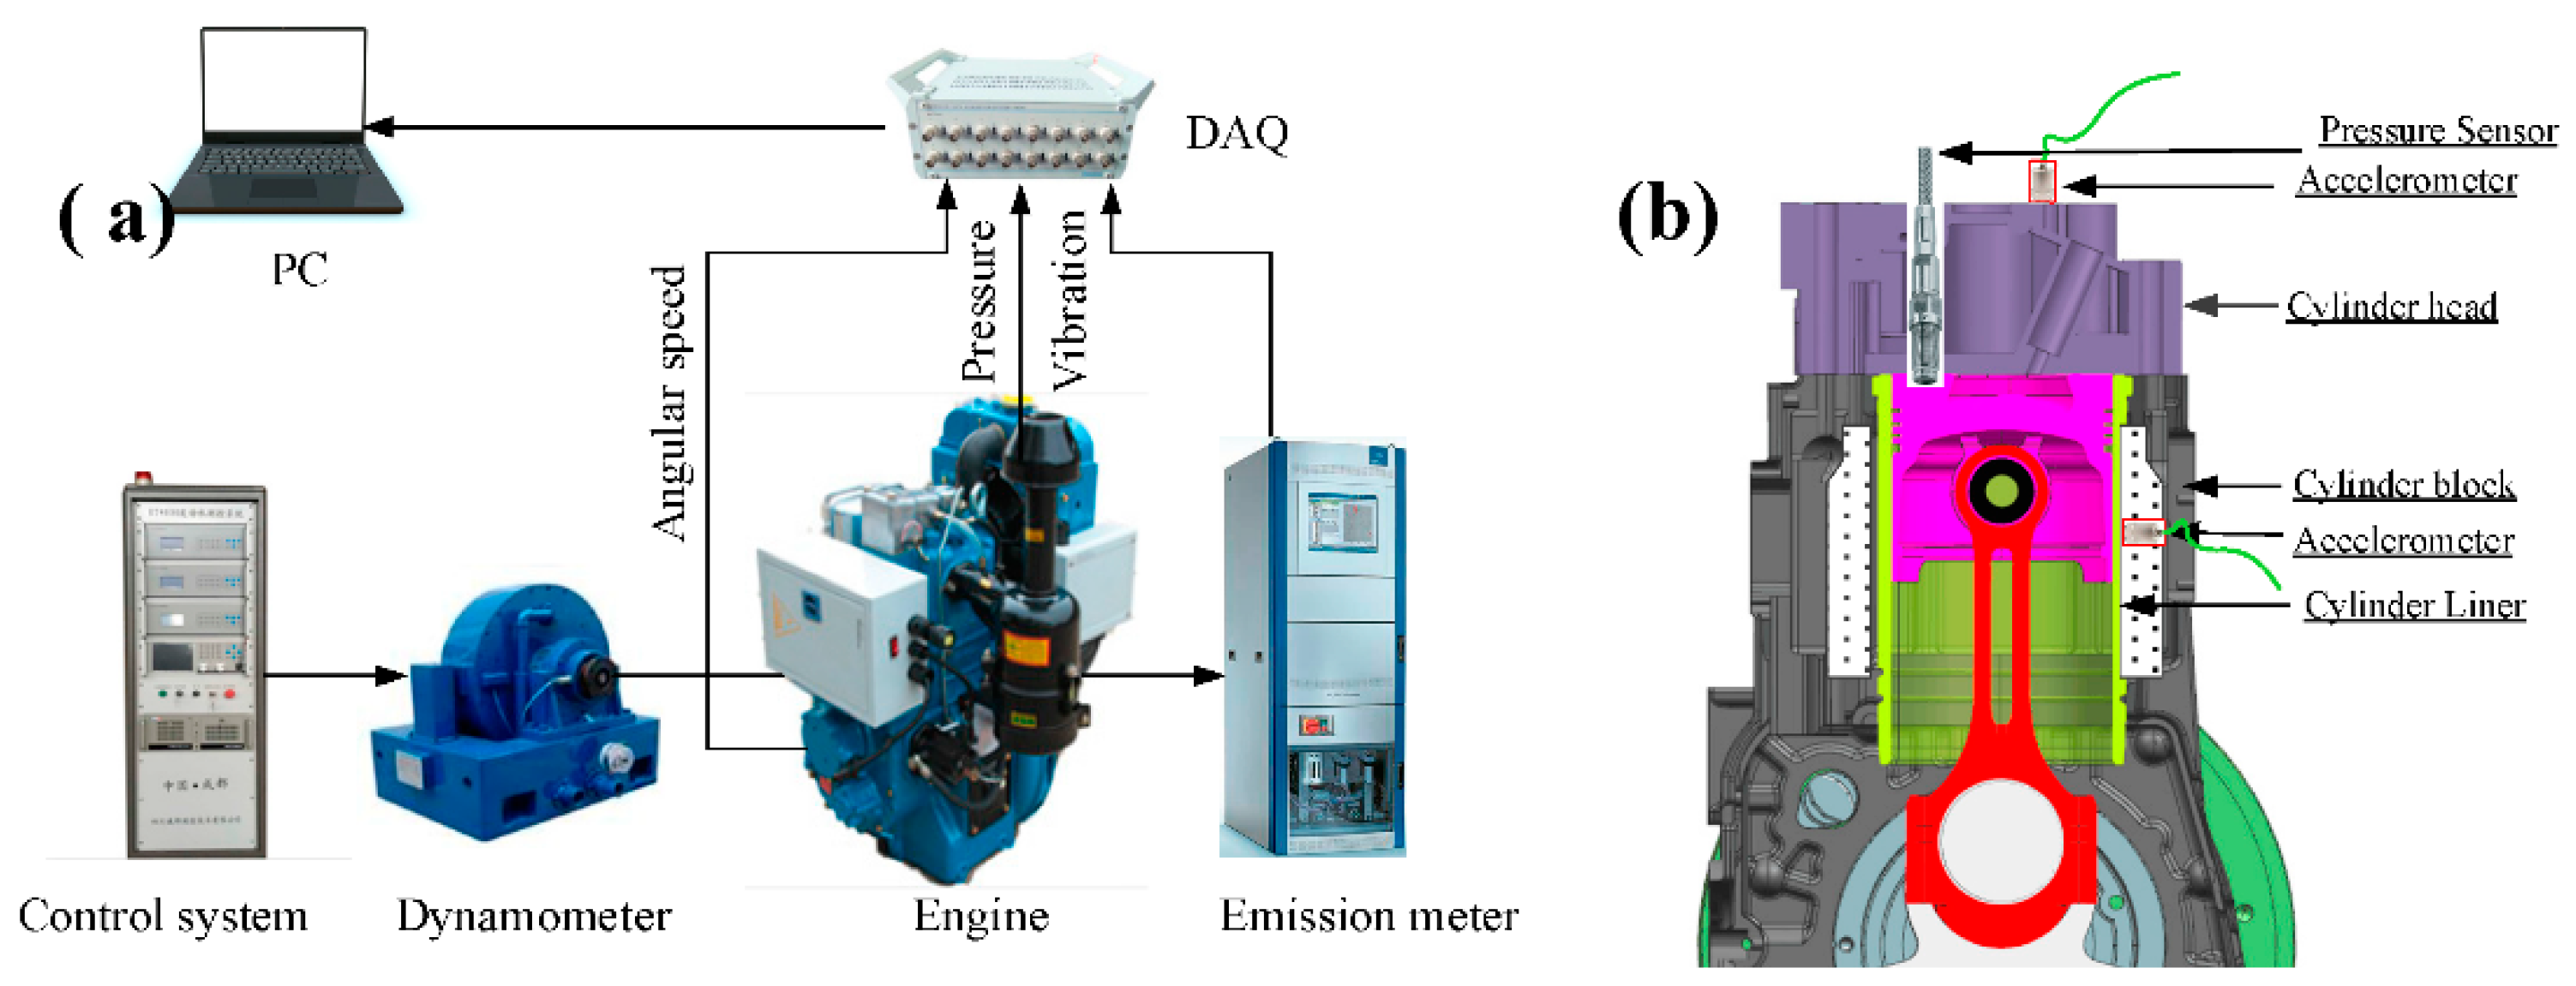
The schematic diagram of the test bench is shown in Figure 5a and sensor arrangement scheme, as shown in Figure 5b. Structural vibrations can be measured by accelerometers installed on the cylinder liner and cylinder head. AVL FTIR multi-component emission meter is used to measure NOx emissions. Furthermore, time-based crank angle, engine speed, and in-cylinder pressure were also recorded with the data acquisition system (Sinocera YE6232B, SINOCERA PIEZOTRONICS, INC, Jiangsu China) for further analysis. The sampling frequency of vibration and pressure signal is 96 kHz, and the sampling frequency of NOx emissions is 1 Hz. The sampling time for each steady-state condition is 30 s. The sensor arrangement scheme in which the pressure sensor and accelerometer are installed on cylinder head, and another accelerometer is installed on cylinder liner, is shown in Figure 5b.
Two types of test schemes are proposed for model construction and performance verification. The first is a steady-state test composed of 15 operating conditions, and the other is a grid measurement with 44 operating conditions at various engine speeds and loads. In the steady-state condition, the engine was running at five speeds, respectively, 1000, 1200, 1400, 1600, and 1800 r/min with three different constant 10, 30, and 50 Nm engine loads.
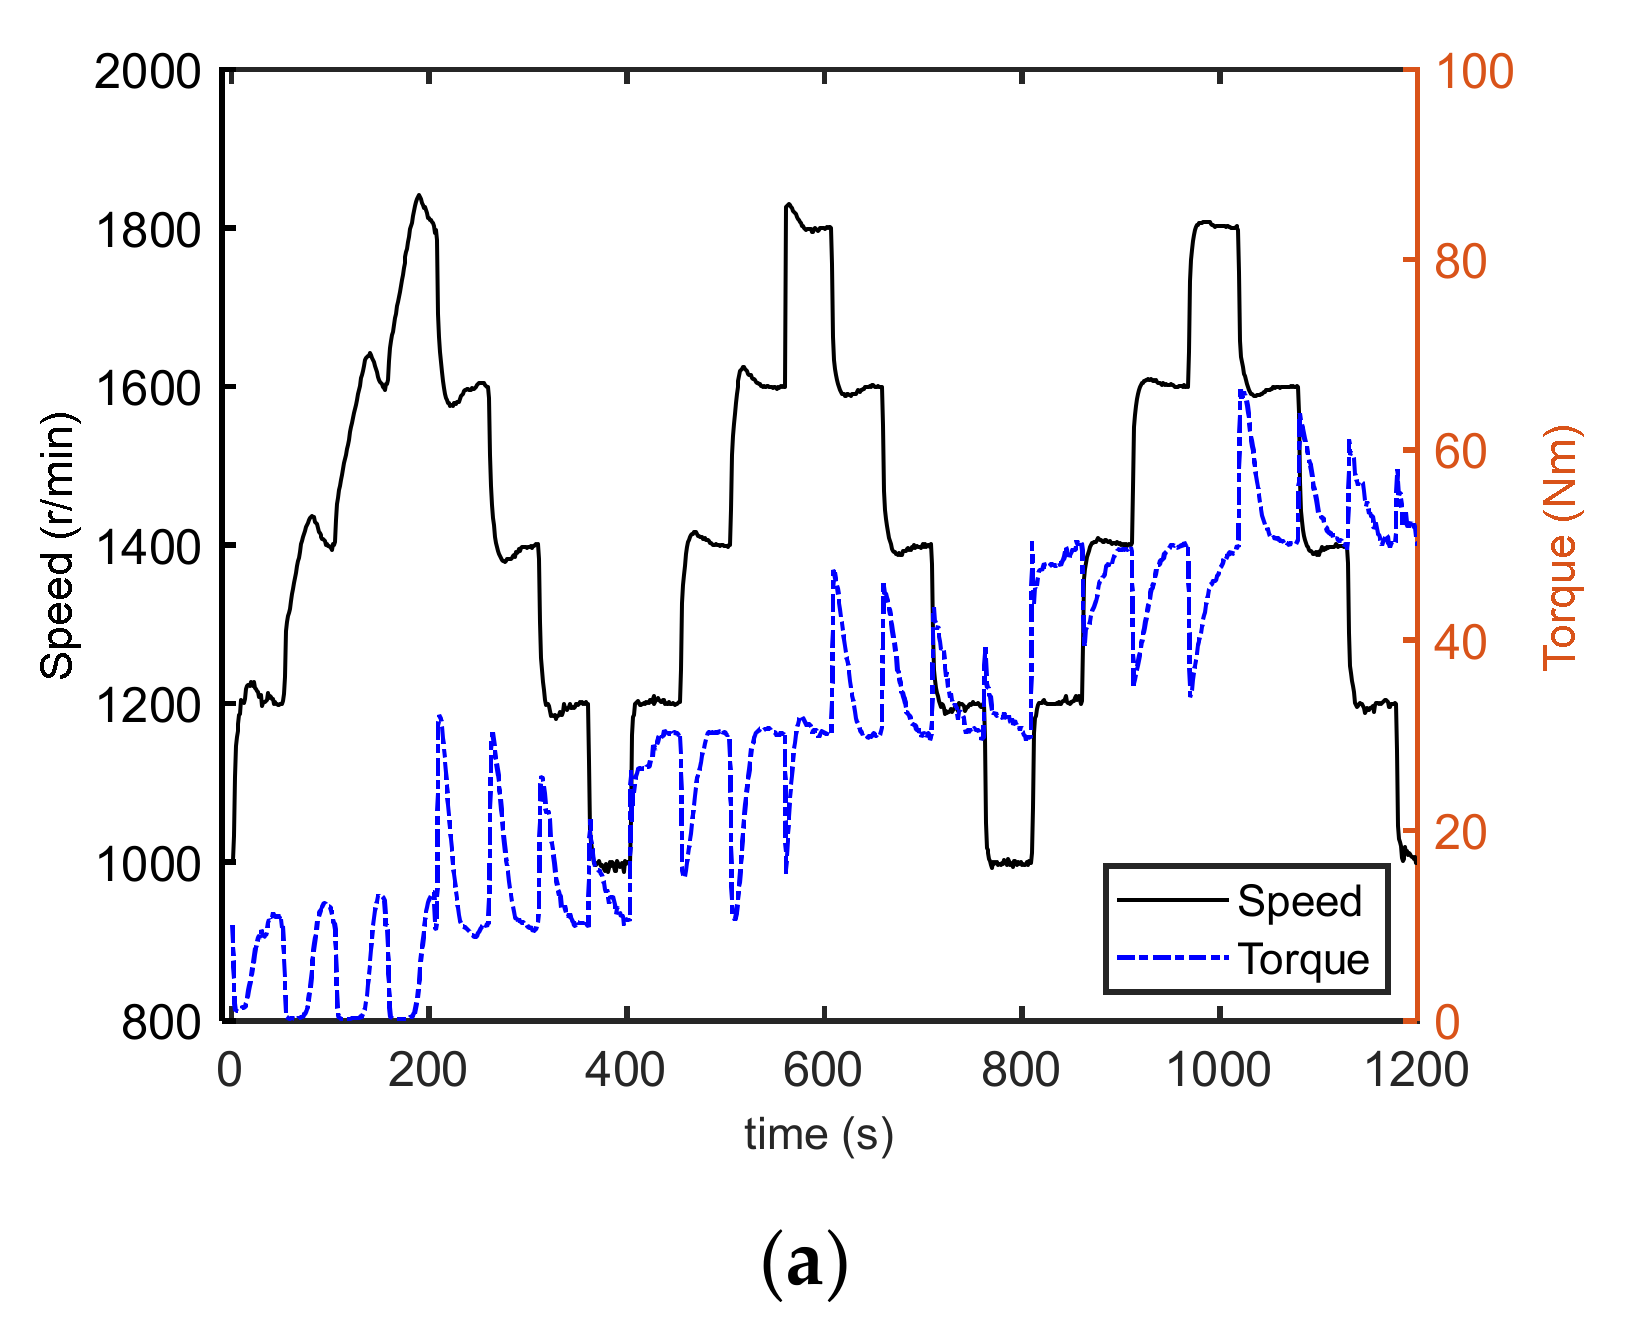
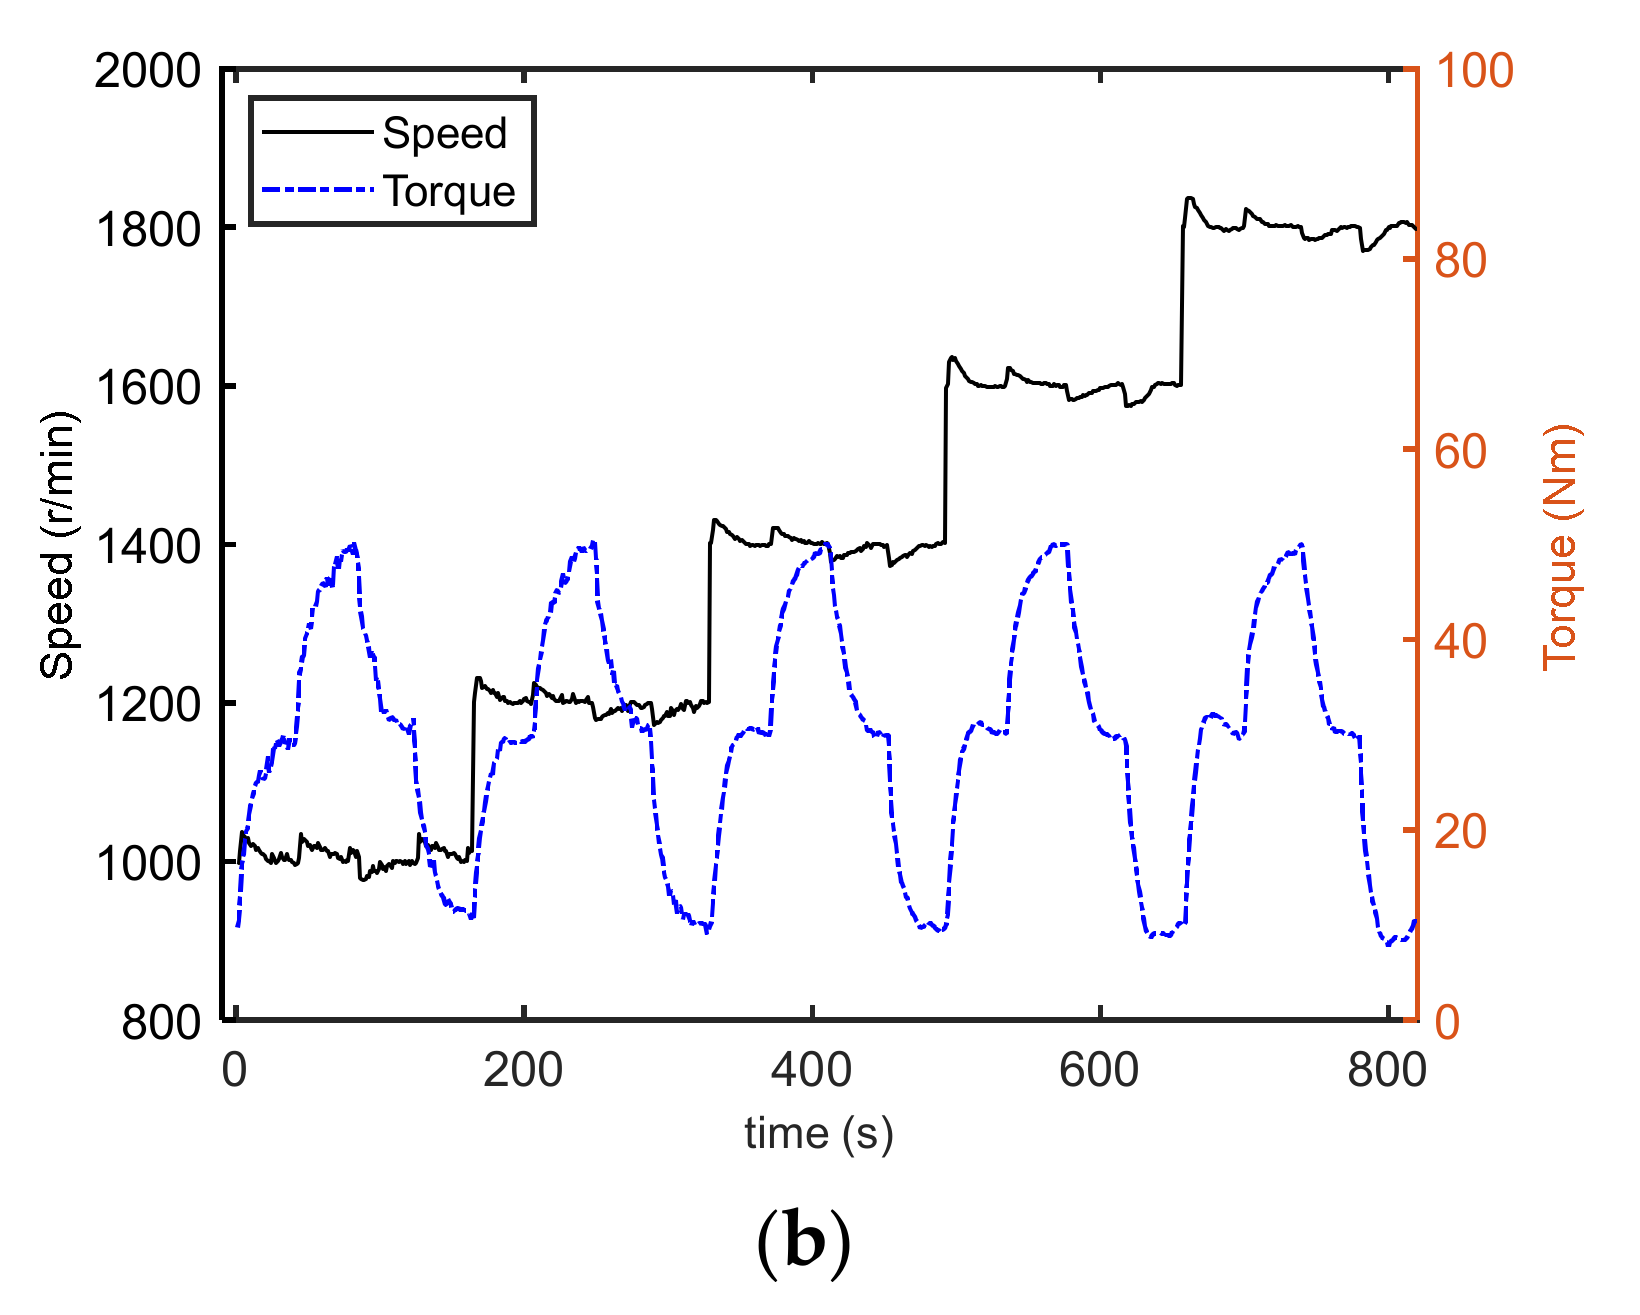
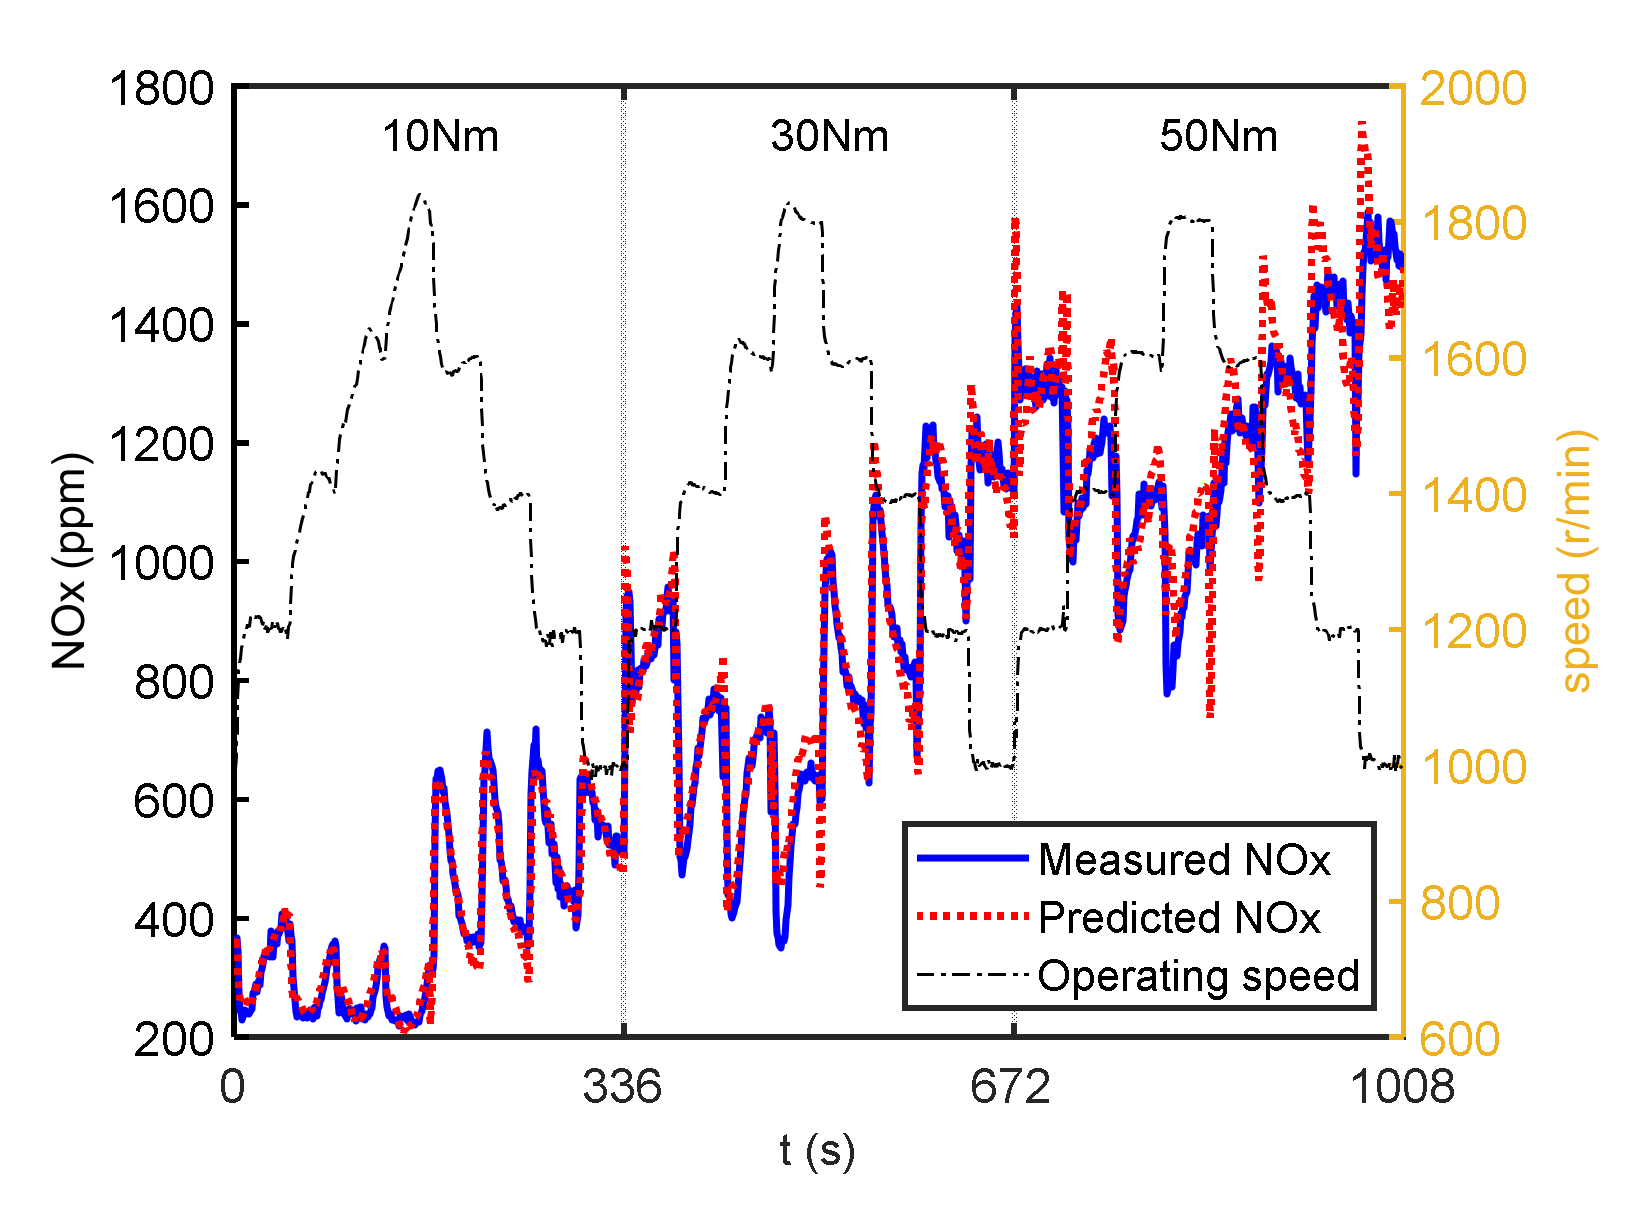
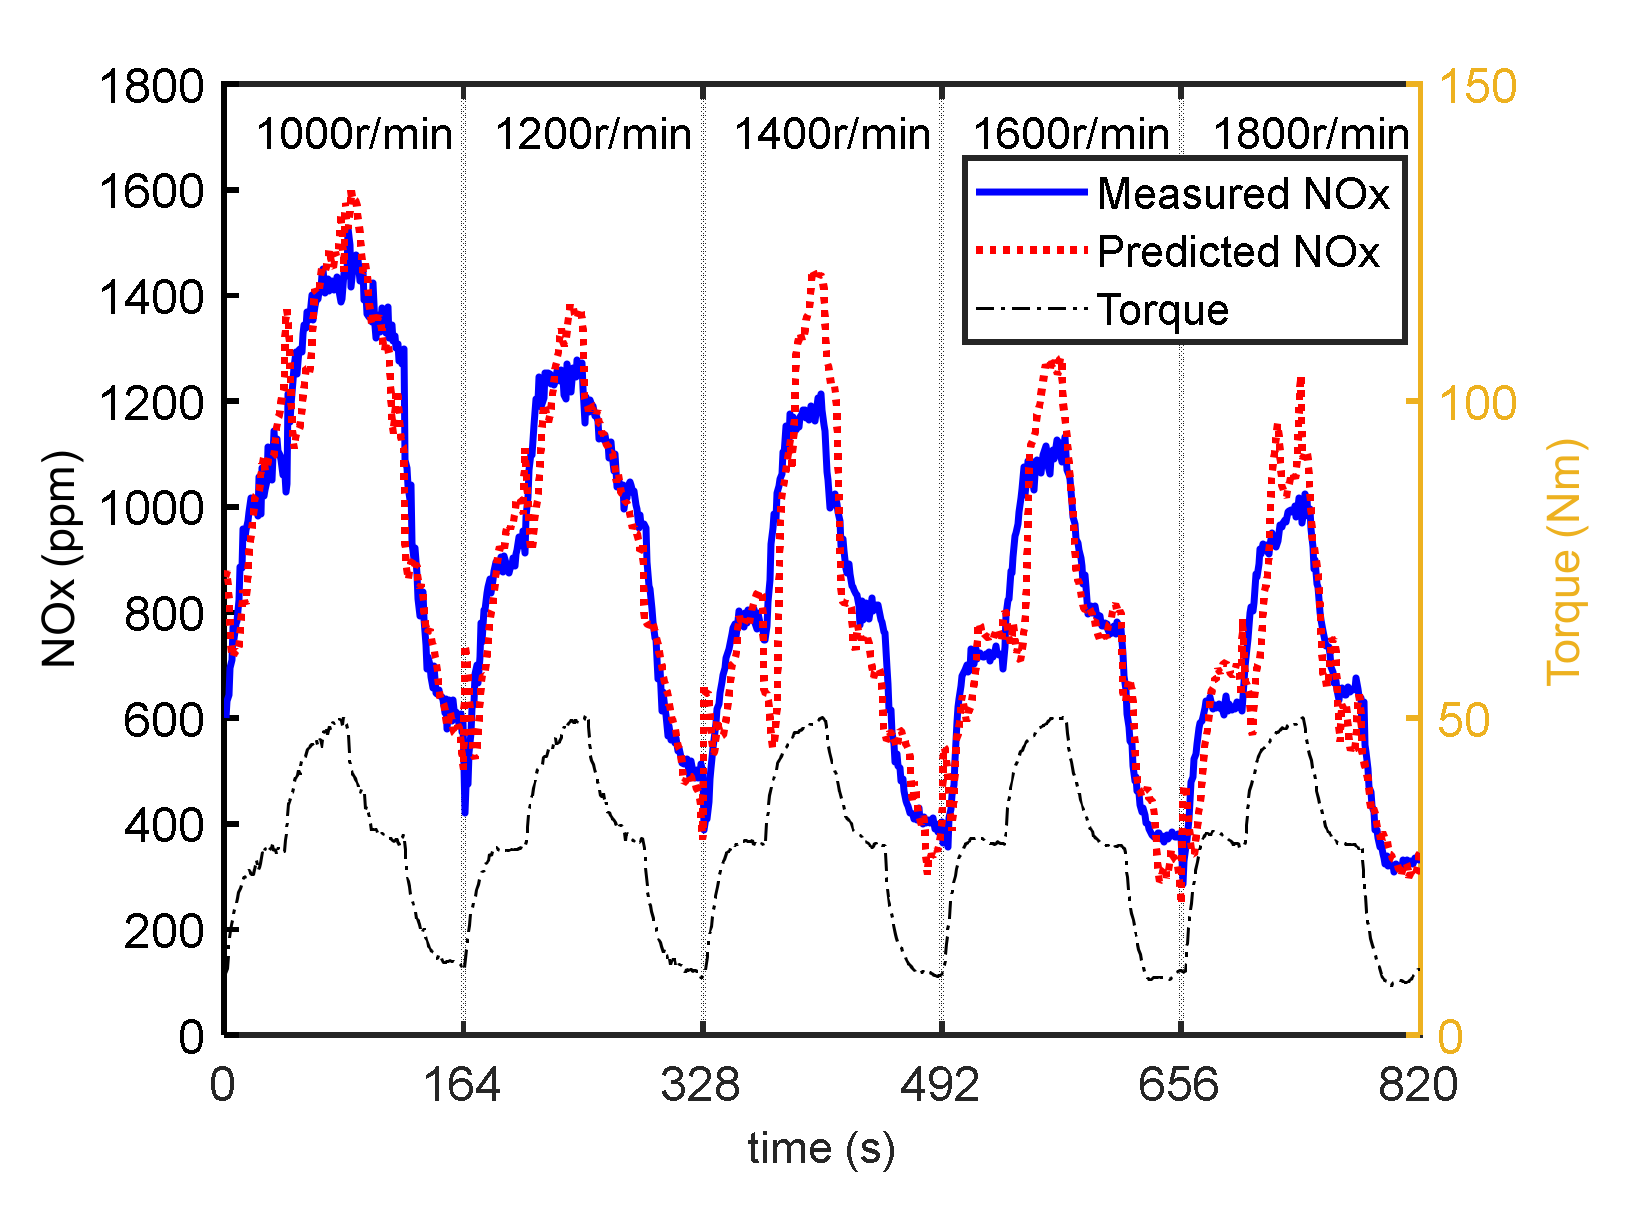
As shown in Figure 6, transient performance of the virtual NOx sensor is assessed based on two ramp tests: one is at constant engine load (10 Nm, 30 Nm, 50 Nm) with increasing (from 1000 r/min to 1800 r/min at 200 r/min intervals) and then decreasing (from 1800 r/min to 1000 r/min at 200 r/min intervals) running speed. The other is to maintain a steady speed (1000 r/min, 1200r/min, 1400 r/min, 1600 r/min, and 1800 r/min) with increasing (from 10 Nm to 50 Nm at 20 Nm intervals) and then decreasing (from 50 Nm to 10 Nm at 20 Nm intervals) engine load. In the start, the speed step and torque response indicate a certain deviation from the control logic of the bench control system.

4. Installation of Virtual NOx Sensor

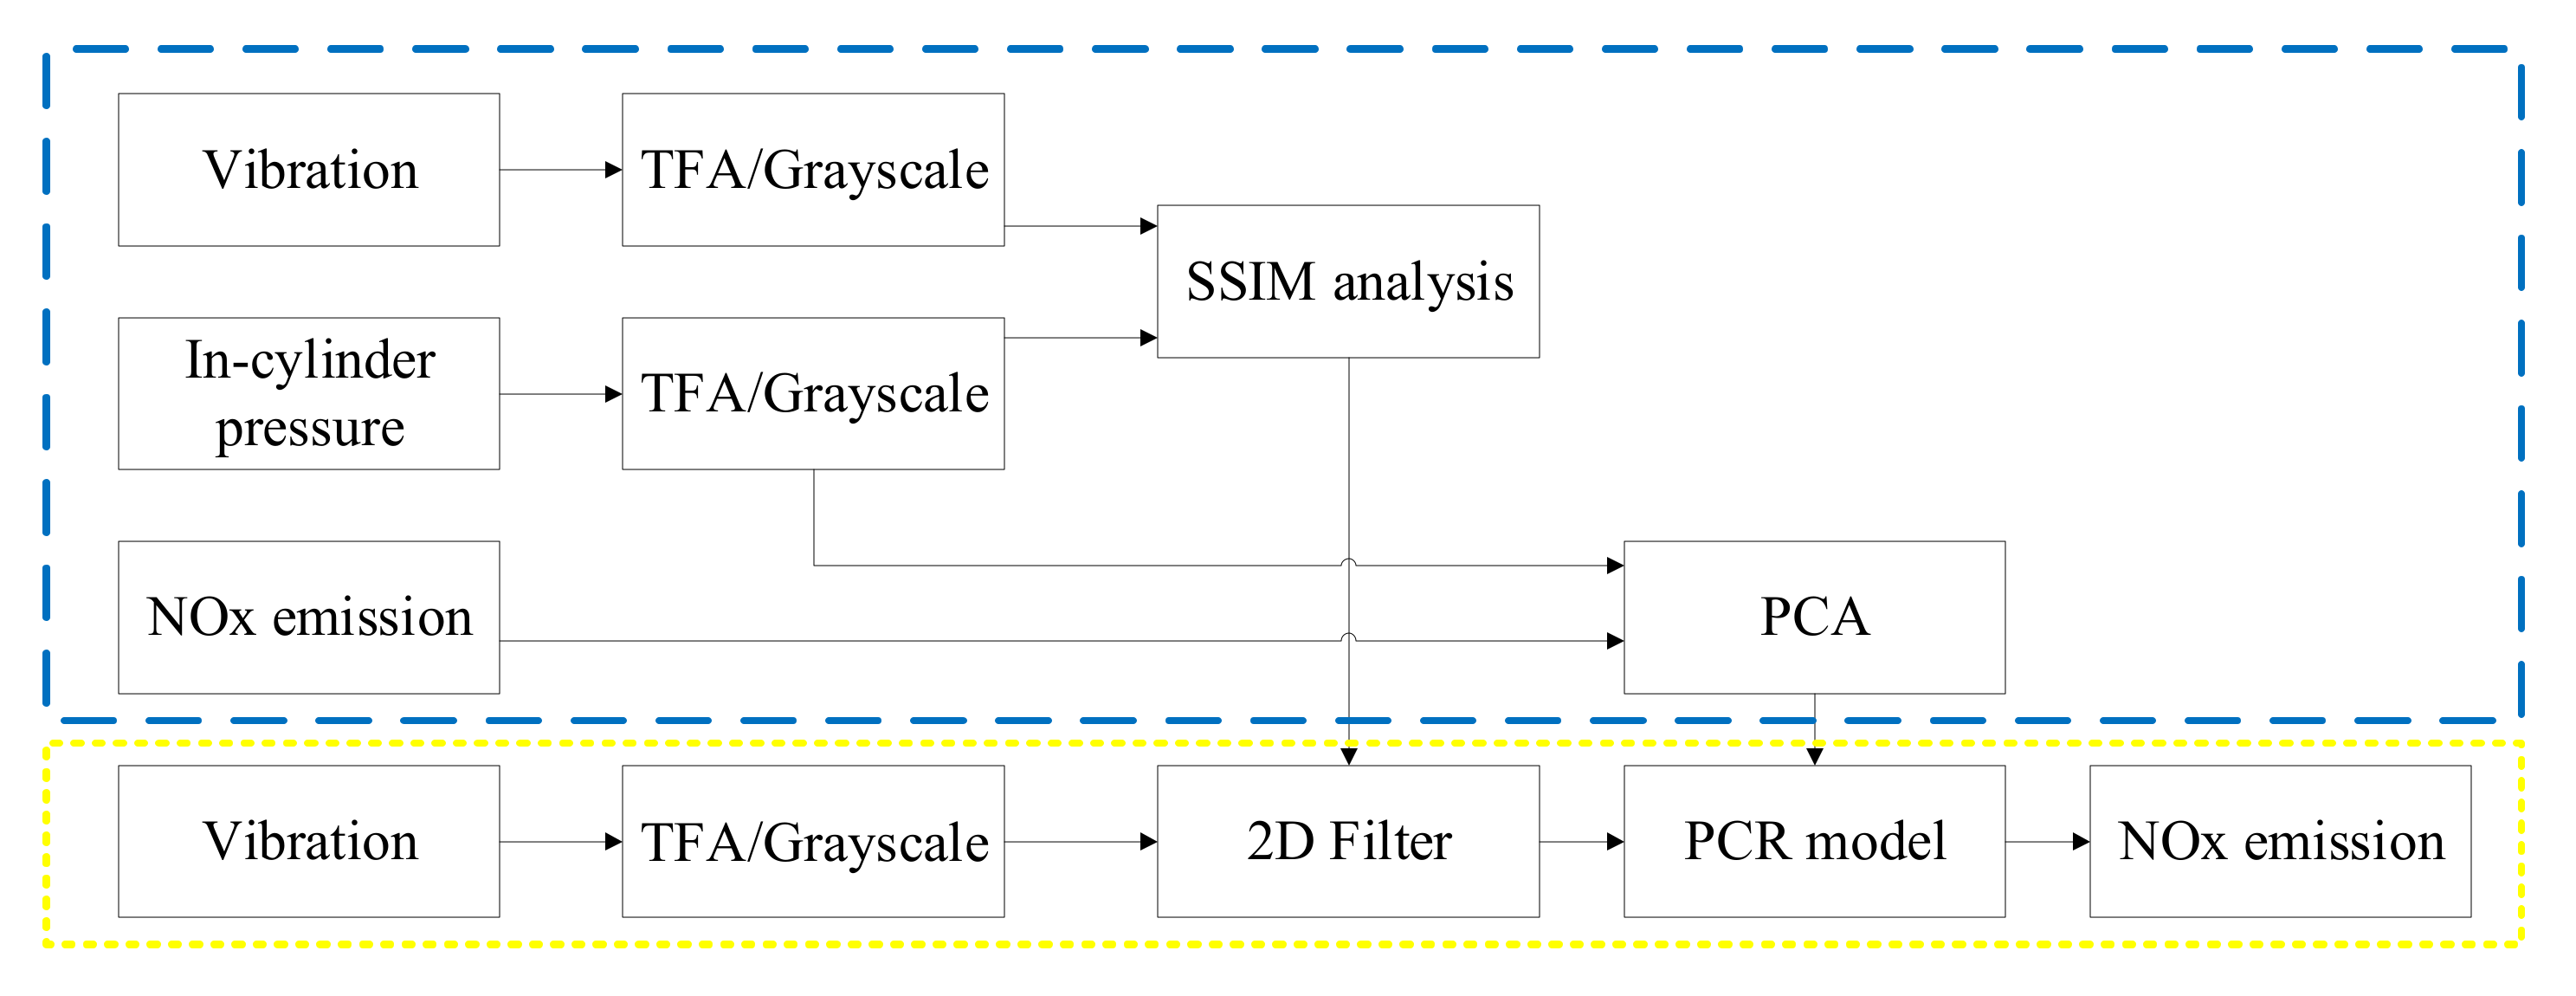
The first step to construct a virtual NOx sensor based on vibration signal is to extract in-cylinder pressure-related information from the measured vibration signal accurately. First, it is necessary to quantify the correspondence between vibration and in-cylinder pressure signals and to construct a two-dimensional filter. Then, the second derivative of in-cylinder pressure can be reconstructed by performing an inverse time-frequency transform on the filtered vibration signal. Finally, PCA analysis was performed on the predicted variables extracted from the reconstructed curve and the measured NOx emissions for the subsequent construction of the PCR prediction model.

4.1. Source Data Selection

The internal combustion engine has a combustion chamber that consists of the inner wall of the cylinder liner, the upper piston area, and the bottom of the cylinder head. When combustion gas starts to combust in the combustion chamber, it directly impacts each combustion chamber wall. It is very difficult to extract combustion-related information from liner vibrations because it is excited by both piston knocks and gas shocks. Therefore, selecting the most suitable signal from the vibration signals measured at different measuring points for pressure reconstruction is necessary.
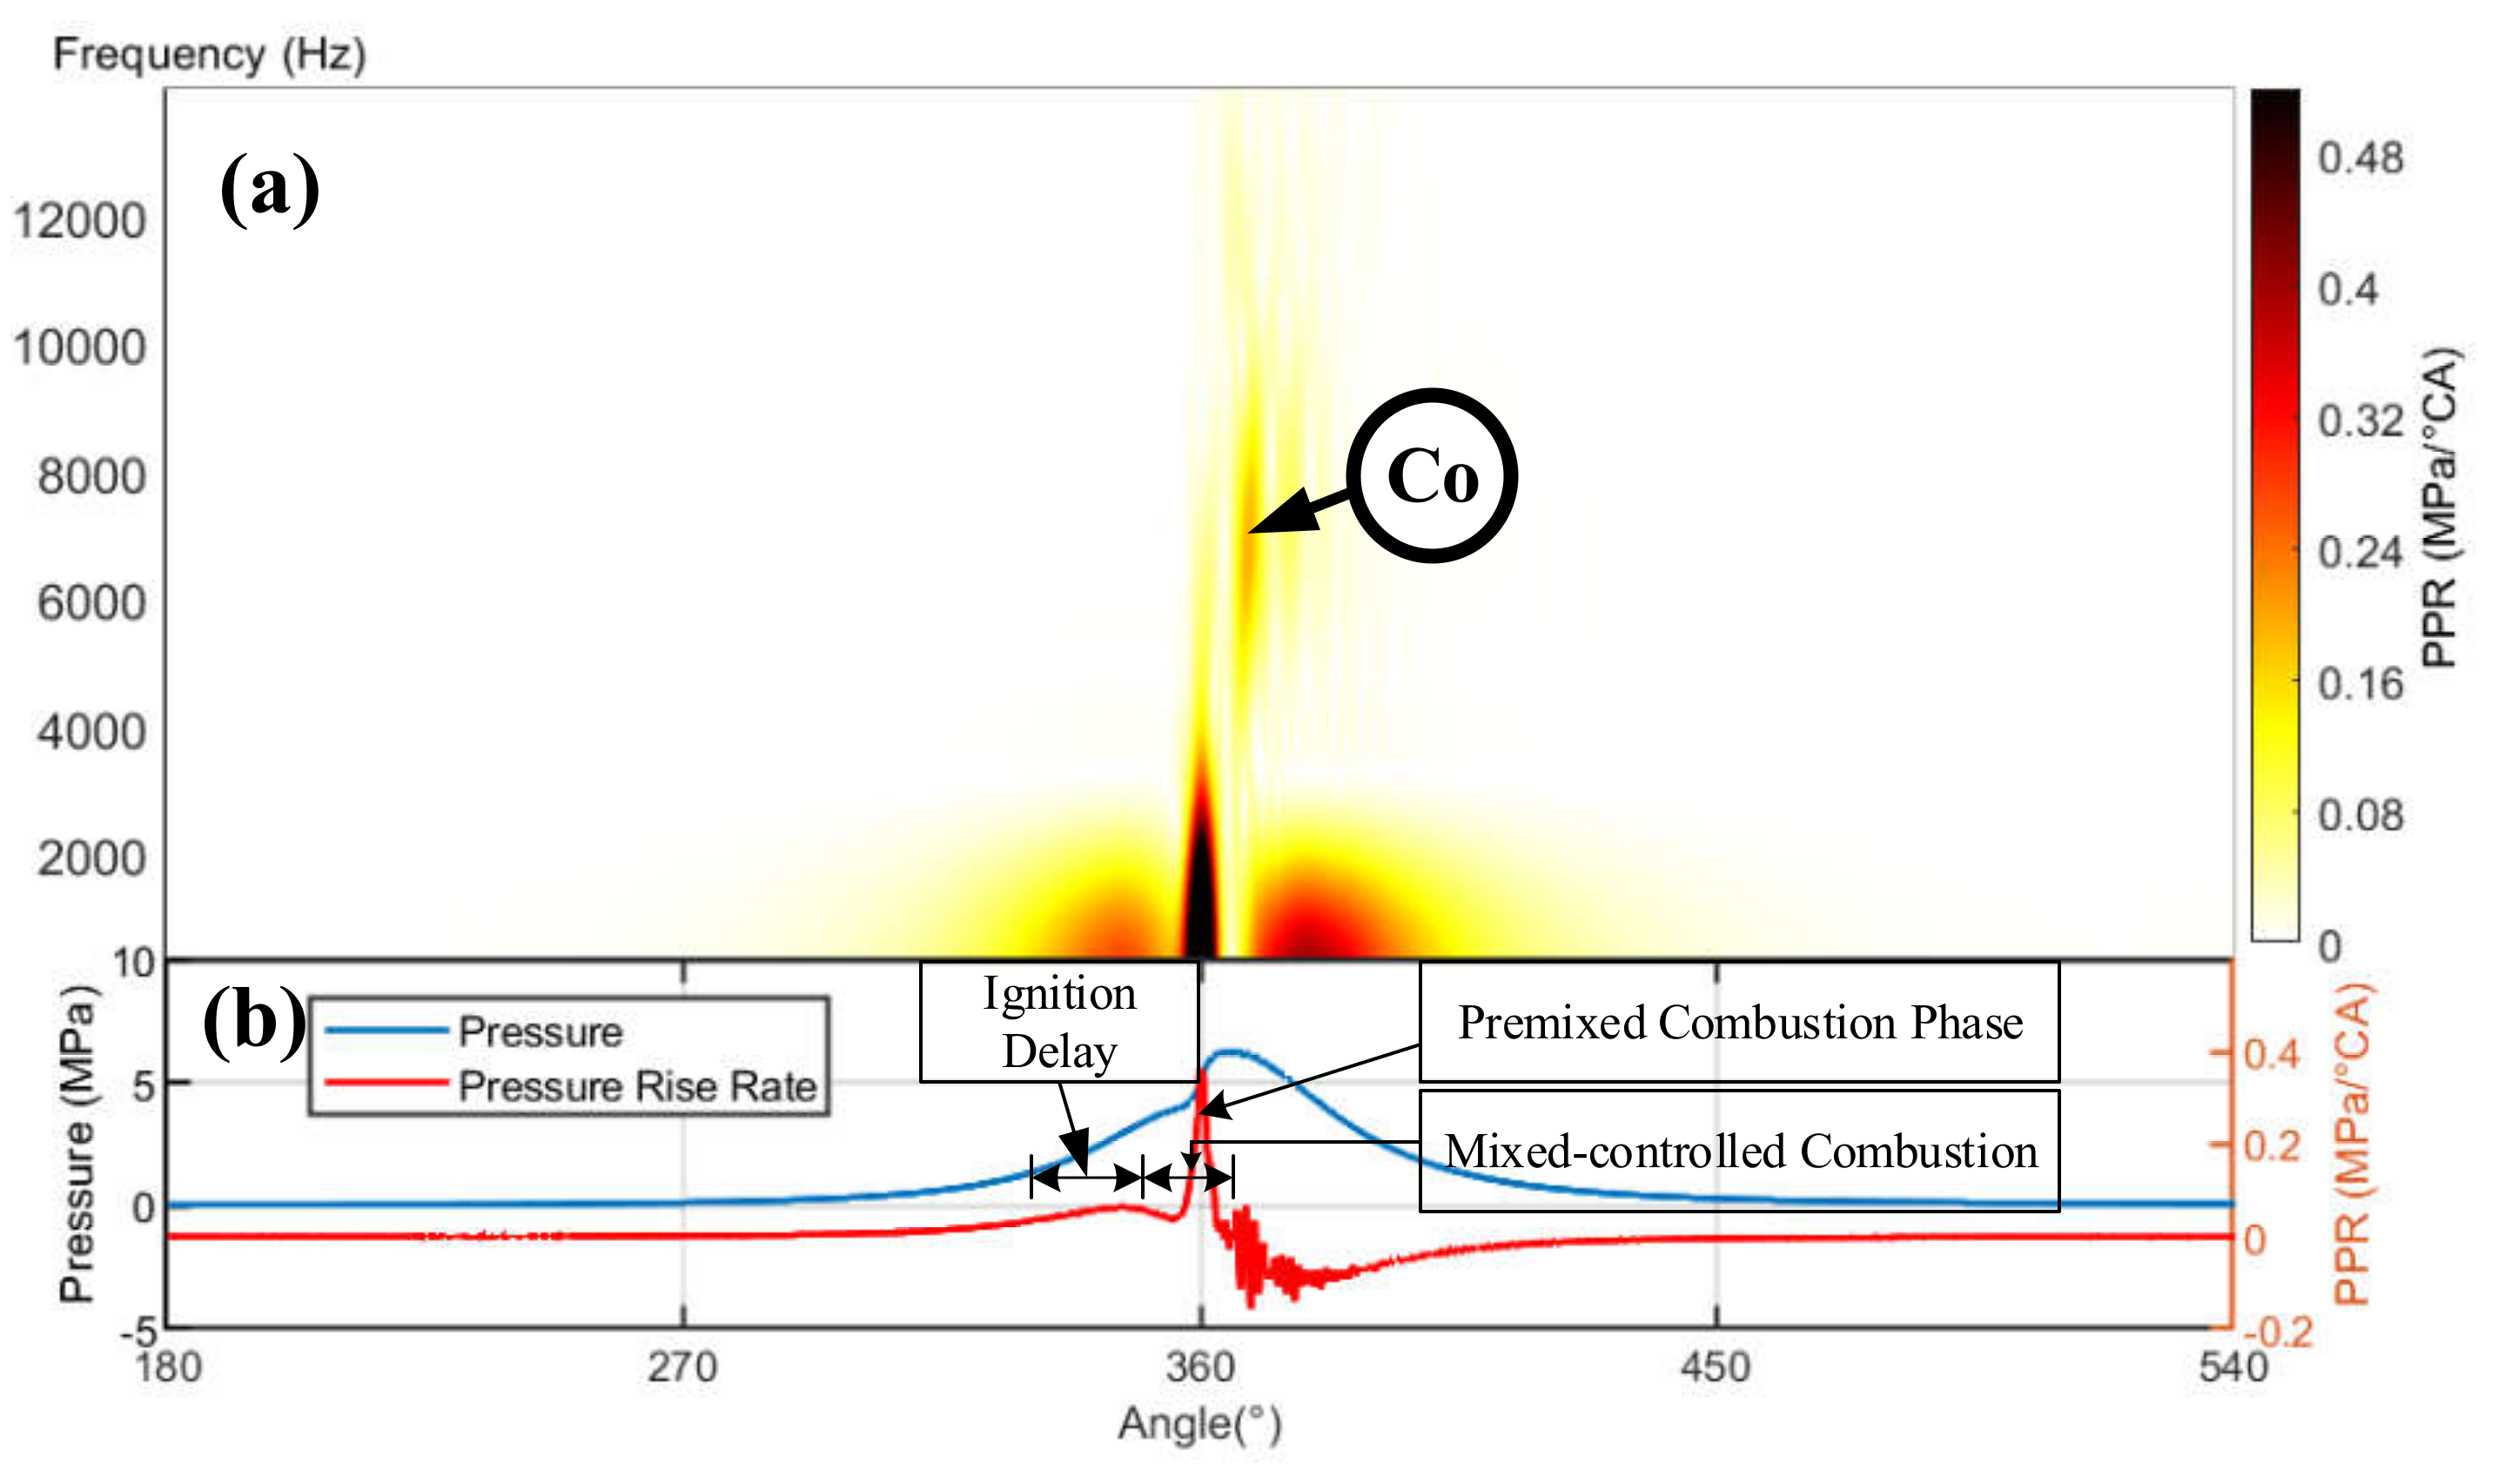
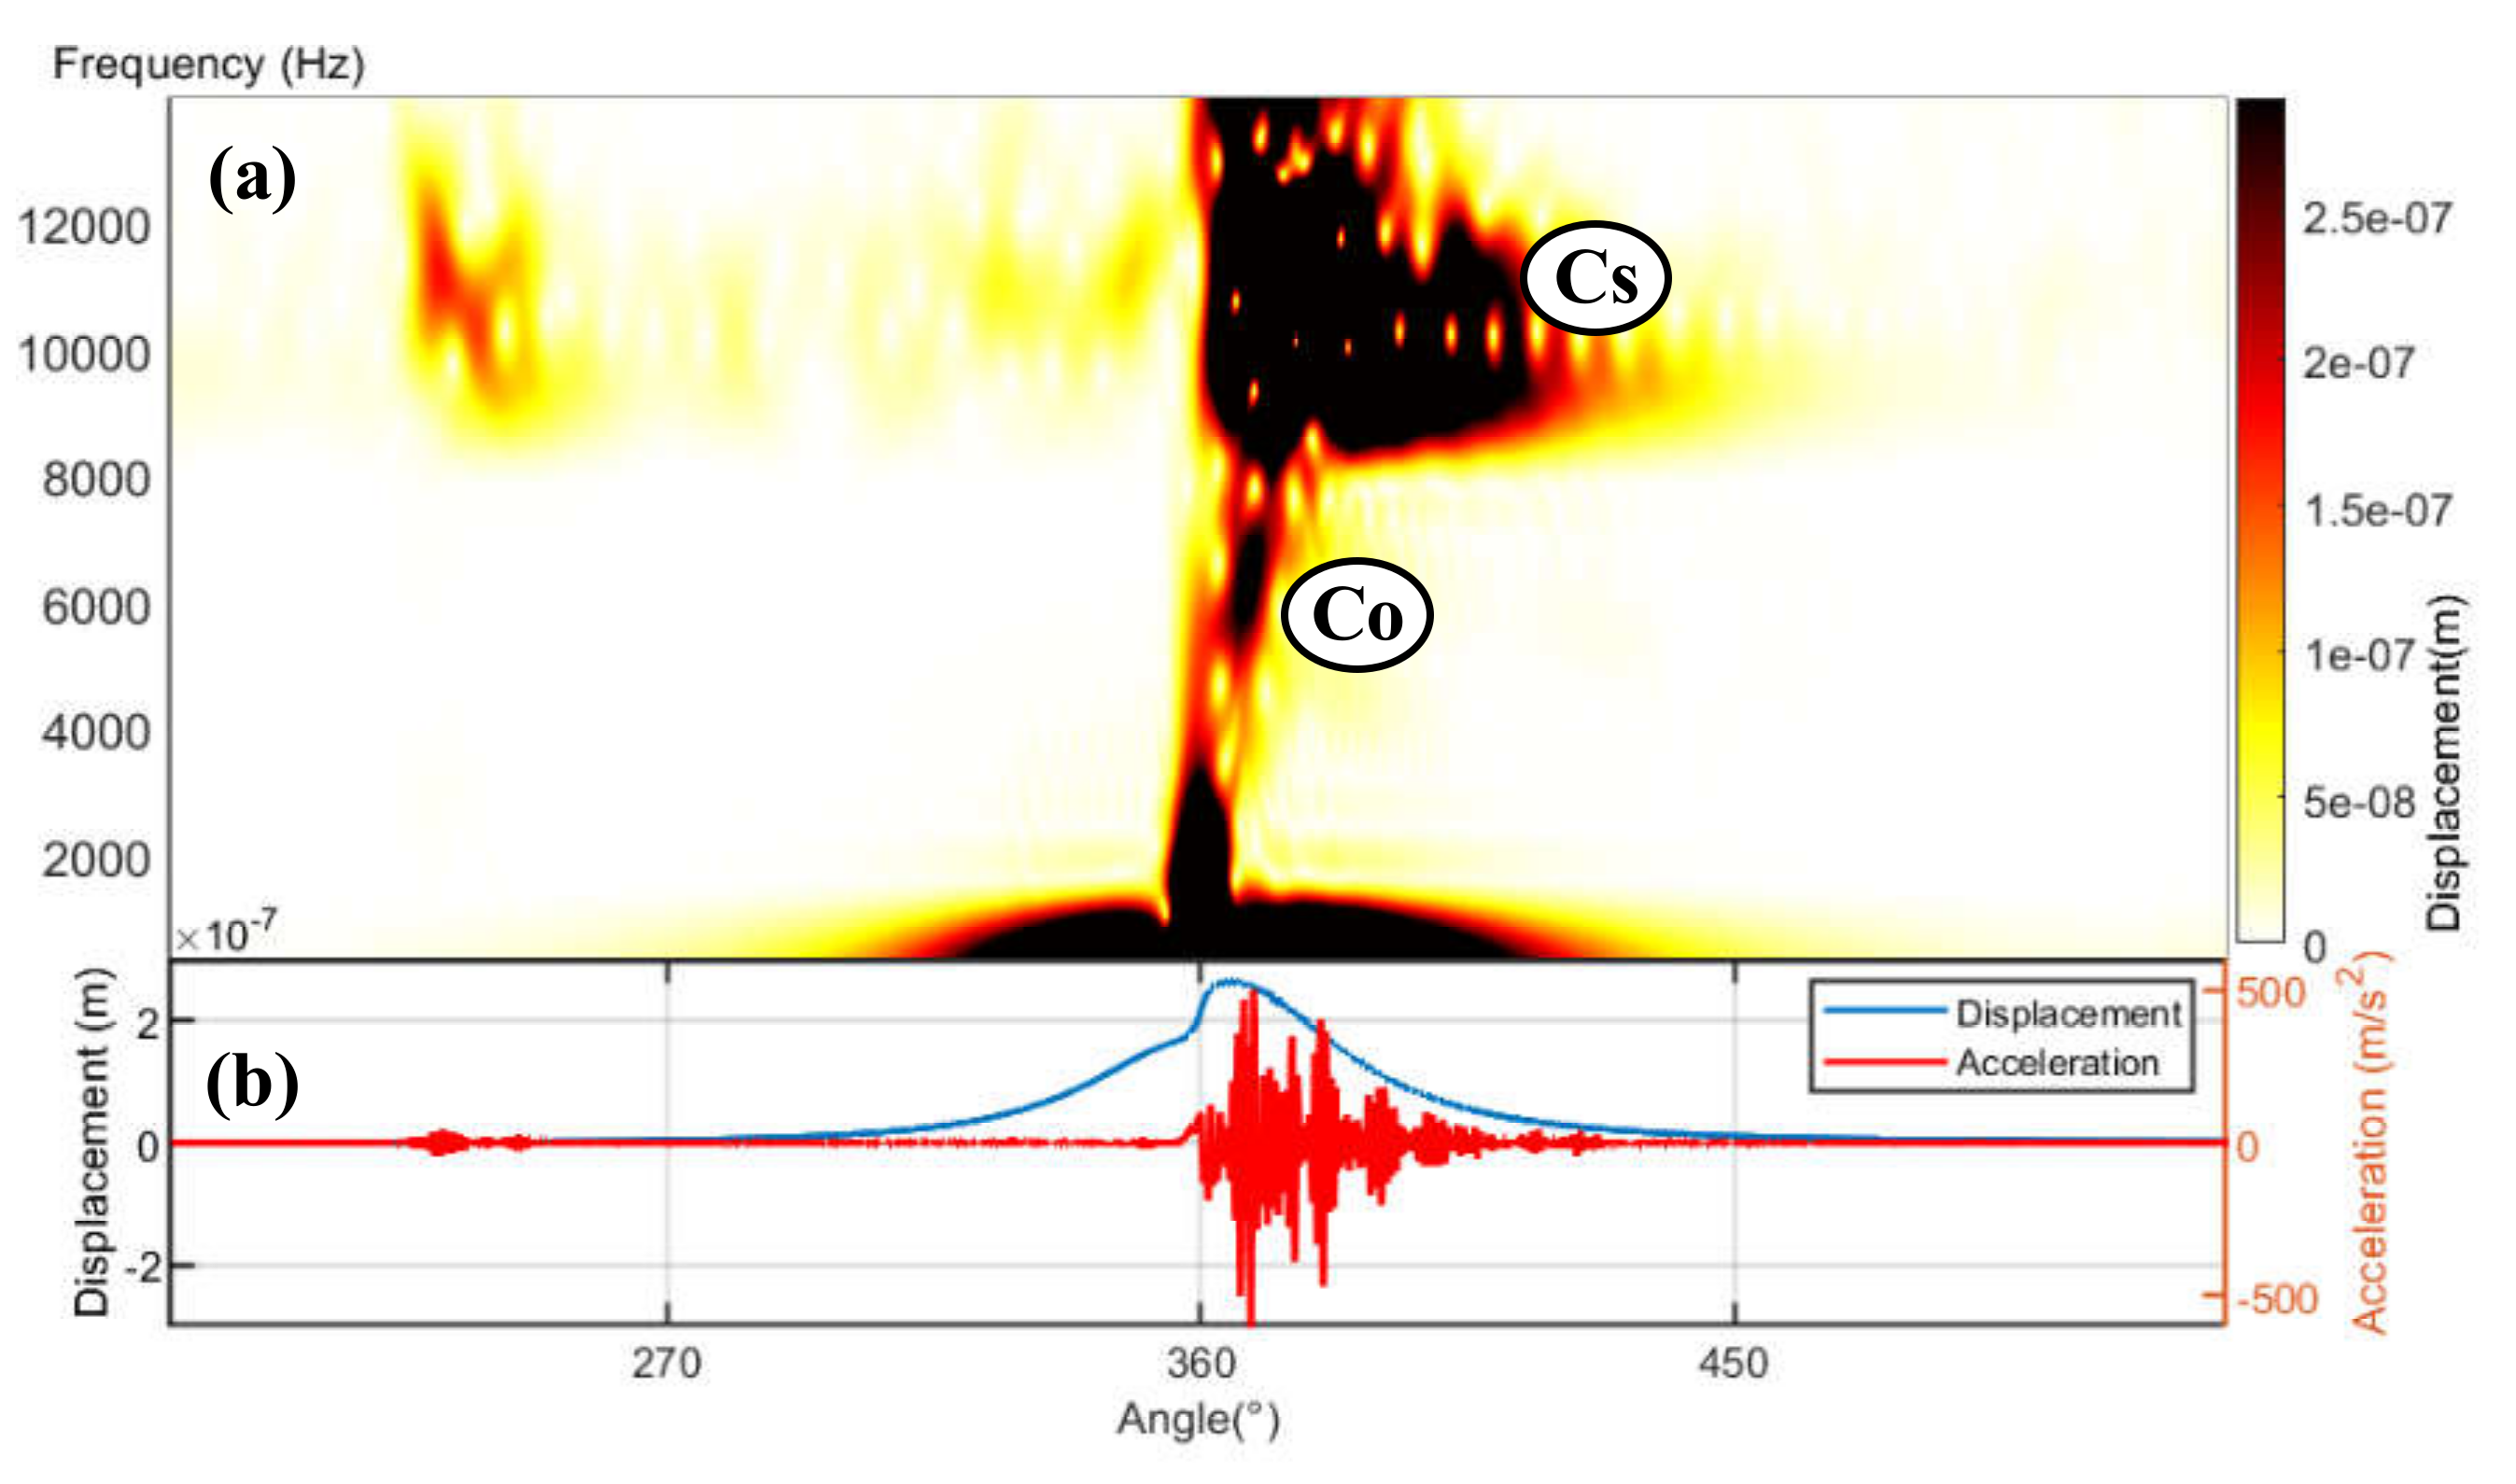
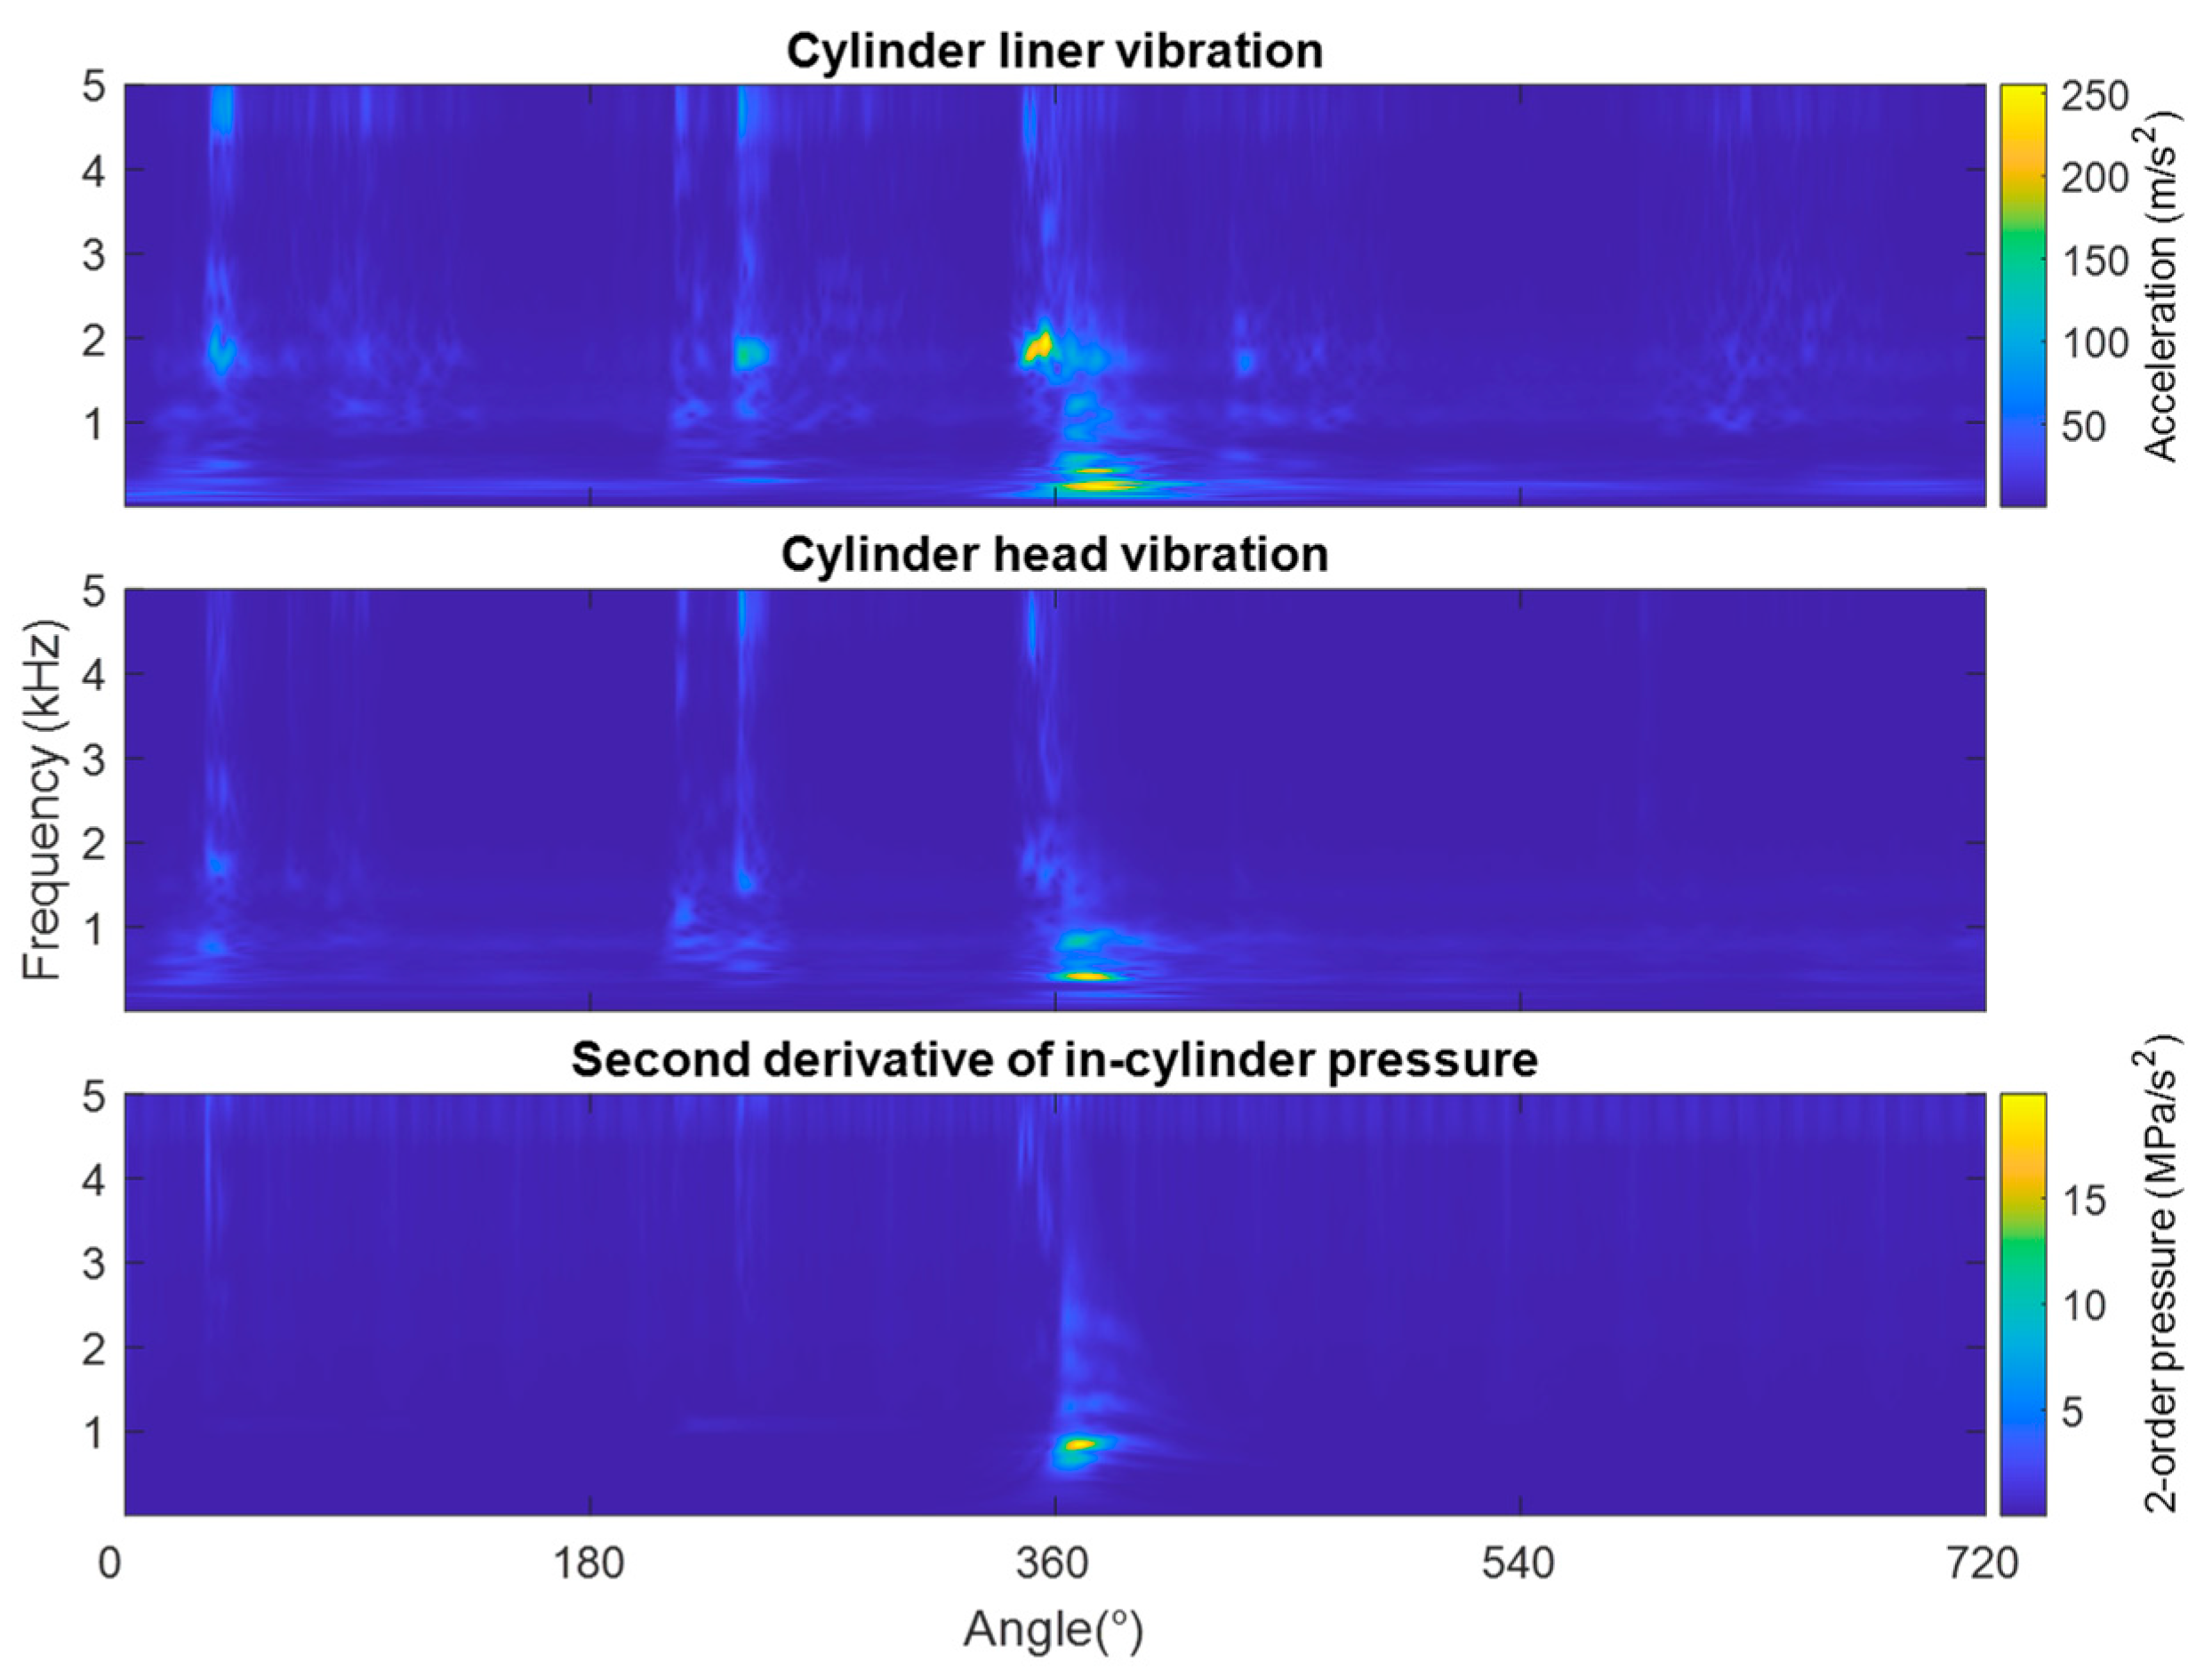
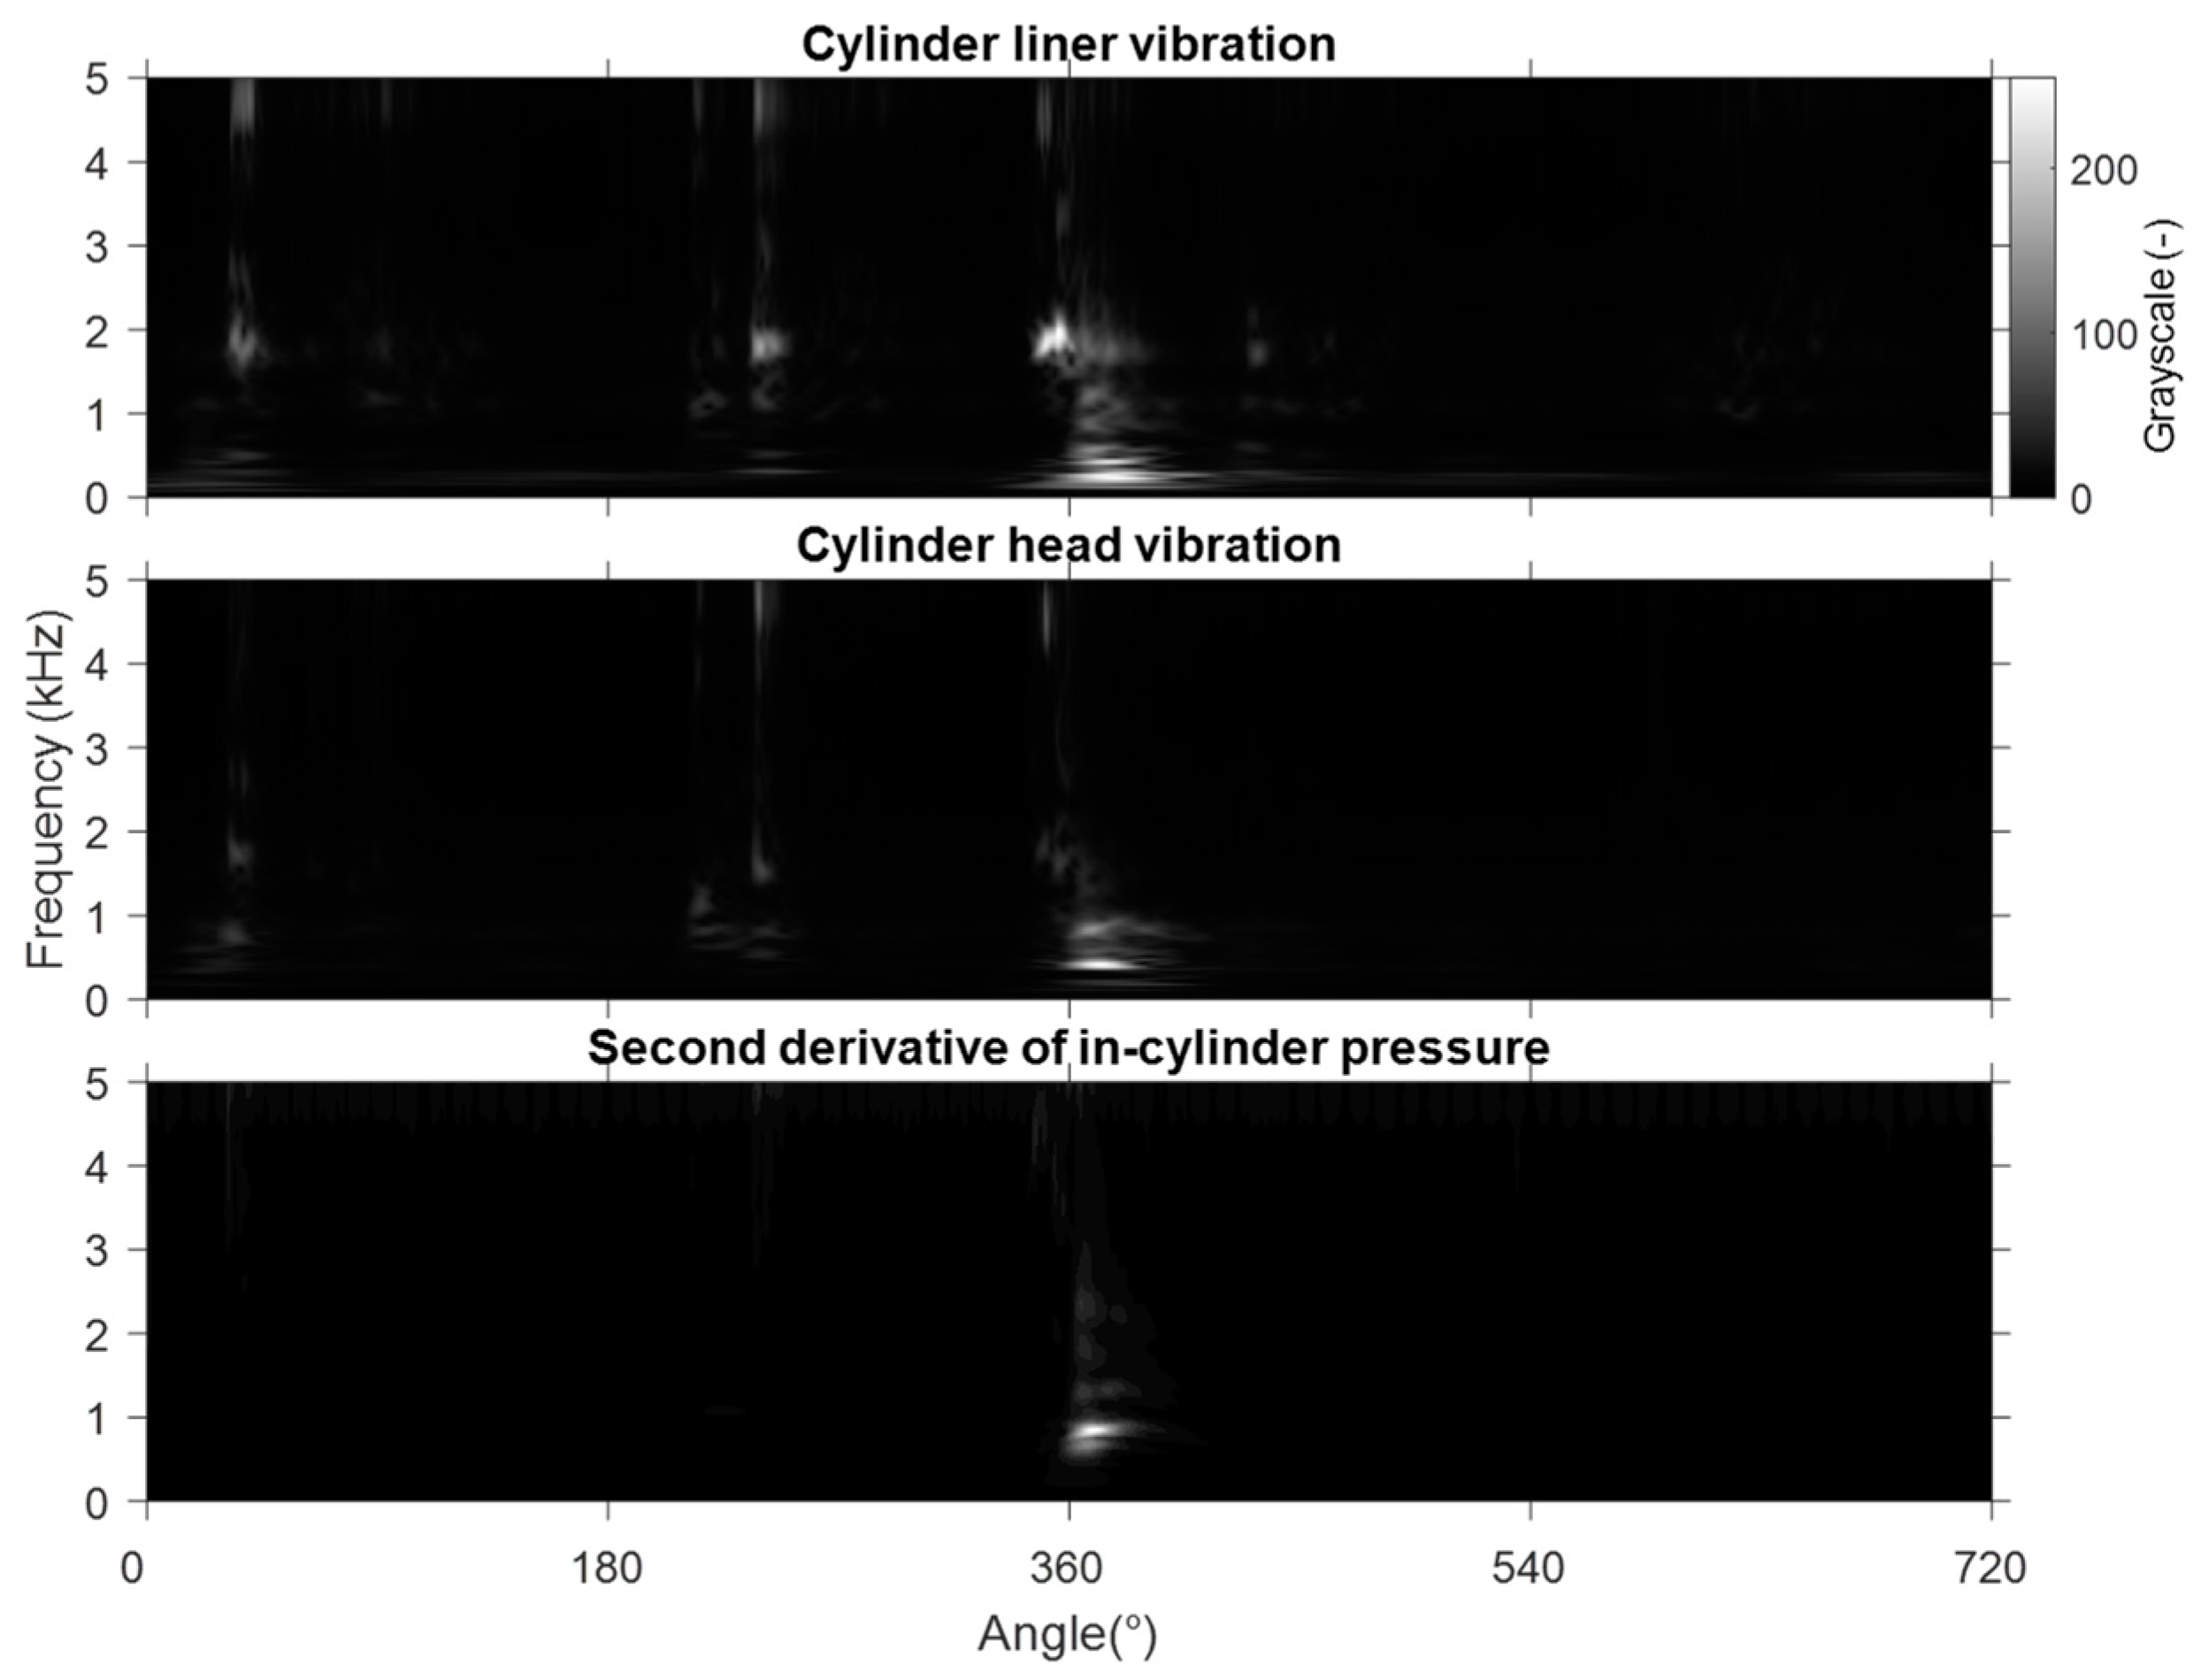
The continuous wavelet transform (CWT) can highlight the local vibration response in the time and frequency domain of the measured vibration containing random noise and exhibiting high non-stationarity. Measured vibration contains random sound and indicates high-frequency continuous wavelet transform (CWT) to highlight localized responses in both time and frequency domains. Figure 7 shows the effects of CWT measured cylinder head vibration, second derivative in-cylinder pressure output, and liner vibration at operating conditions of 1600 r/min and 30 Nm.
The response pattern in the CWT of cylinder head vibration is closer to the second derivative of in-cylinder pressure than that of the liner vibration. Notably, the pattern of local features in cylinder head vibration near combustion TDC is highly consistent with that in the second derivative of pressure. Therefore, it is appropriate to choose cylinder head vibration as the data source for reconstructing in-cylinder pressure.

4.2. Similarity Analysis of Time-Frequency Signals

The structural similarity index measure (SSIM) algorithm was employed to evaluate the time-frequency similarity between vibration and in-cylinder pressure to suppress interference of various transient noises. SSIM is a method to measure similarity between two types of images. The SSIM index can be noticed as a quality measure of the image. The difference with other methods, such as mean squared error (MSE) or peak signal to noise ratio (PSNR), is that they measure absolute errors. The pixels have strong inter-dependencies of structural information when they are spatially close. These dependences carry important statistics about the structural relevance of local features in the image matrices [24].
Accordingly, the SSIM method can be extended to evaluate the two-dimensional similarity of different signals in time-frequency spectra, which provides a technical basis for reconstructing in-cylinder pressure based on vibration signals.

4.2.1. Image Graying

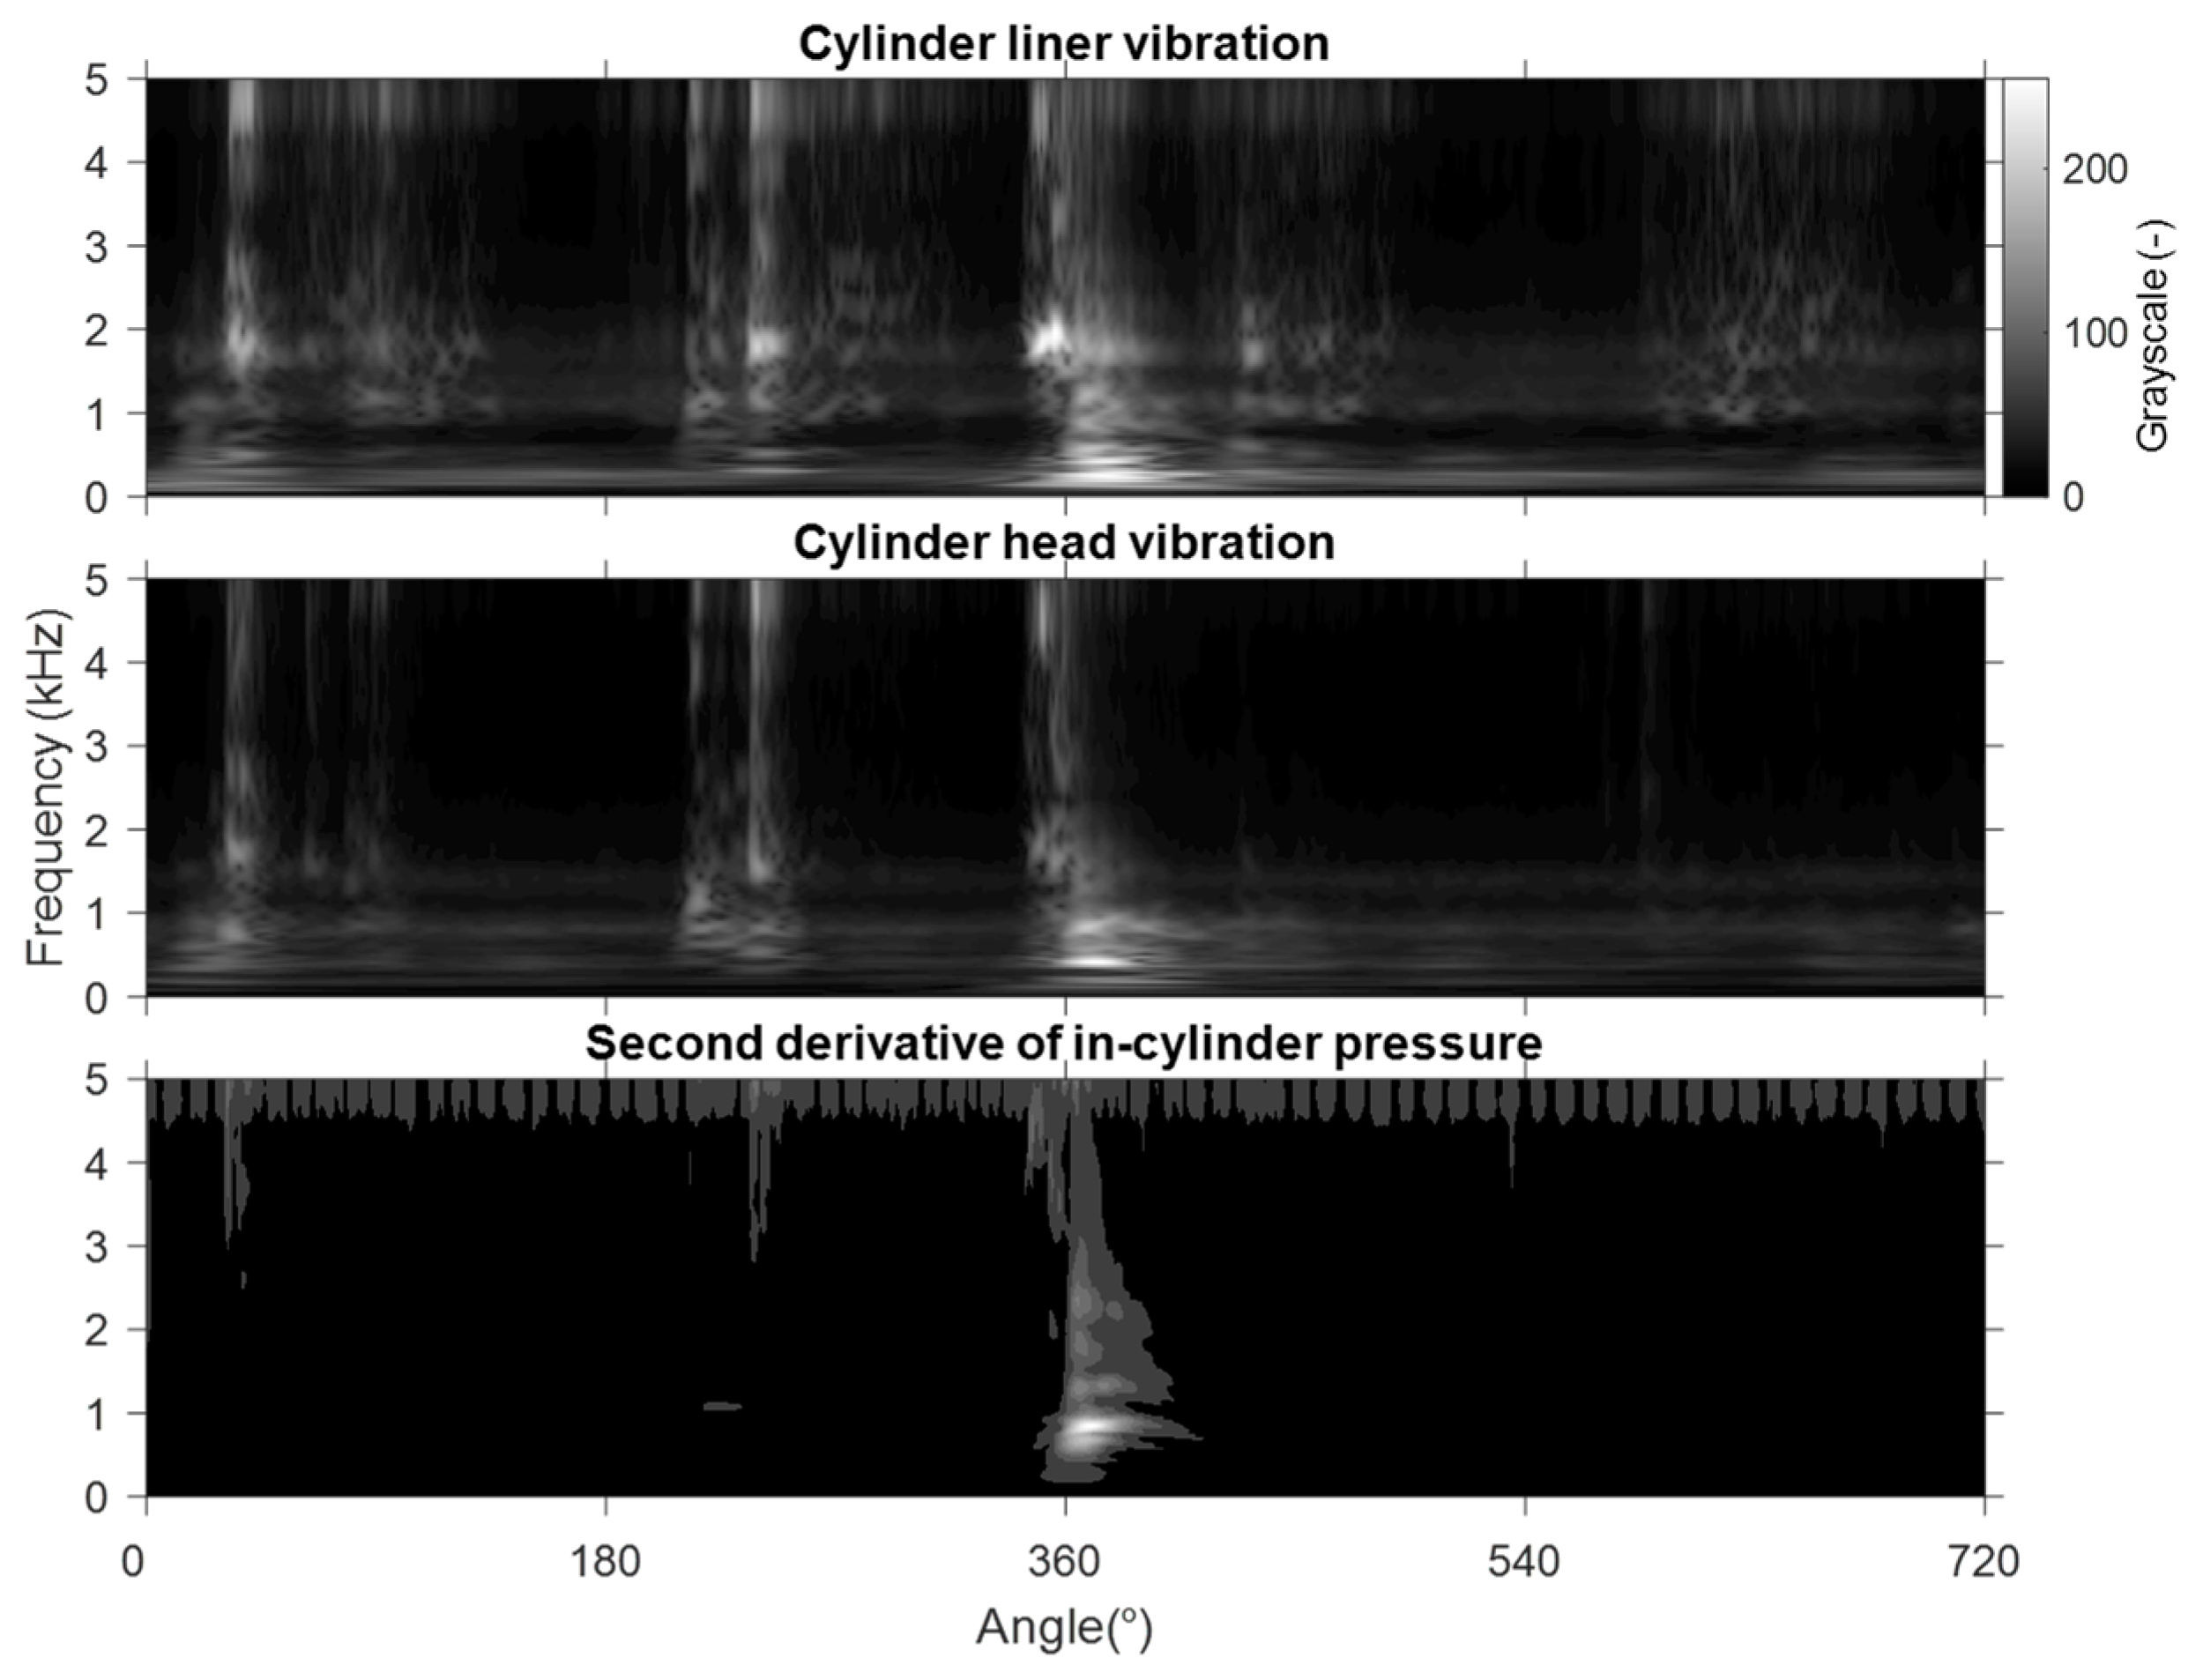
Before SSIM analysis, it is first necessary to convert the time-frequency spectra of signals into grayscale images. The saturation data were removed from RGB of time-frequency spectrum images to obtain grayscale images, as shown in Figure 8. After greying processing, the time-frequency spectrum shows less information than the original spectrum, as shown in Figure 8. This is because the display scale of grayscale images is inconsistent with original spectra. A gamma correction technique was performed to highlight more detailed information on linear RGB images of the time-frequency spectrum to enhance image contrast, as shown in Figure 9. This further confirmed that the similarity between head vibration and the second derivative of in-cylinder pressure is better than that between liner vibration and pressure, as proposed in Section 4.1.

4.2.2. SSIM Analysis

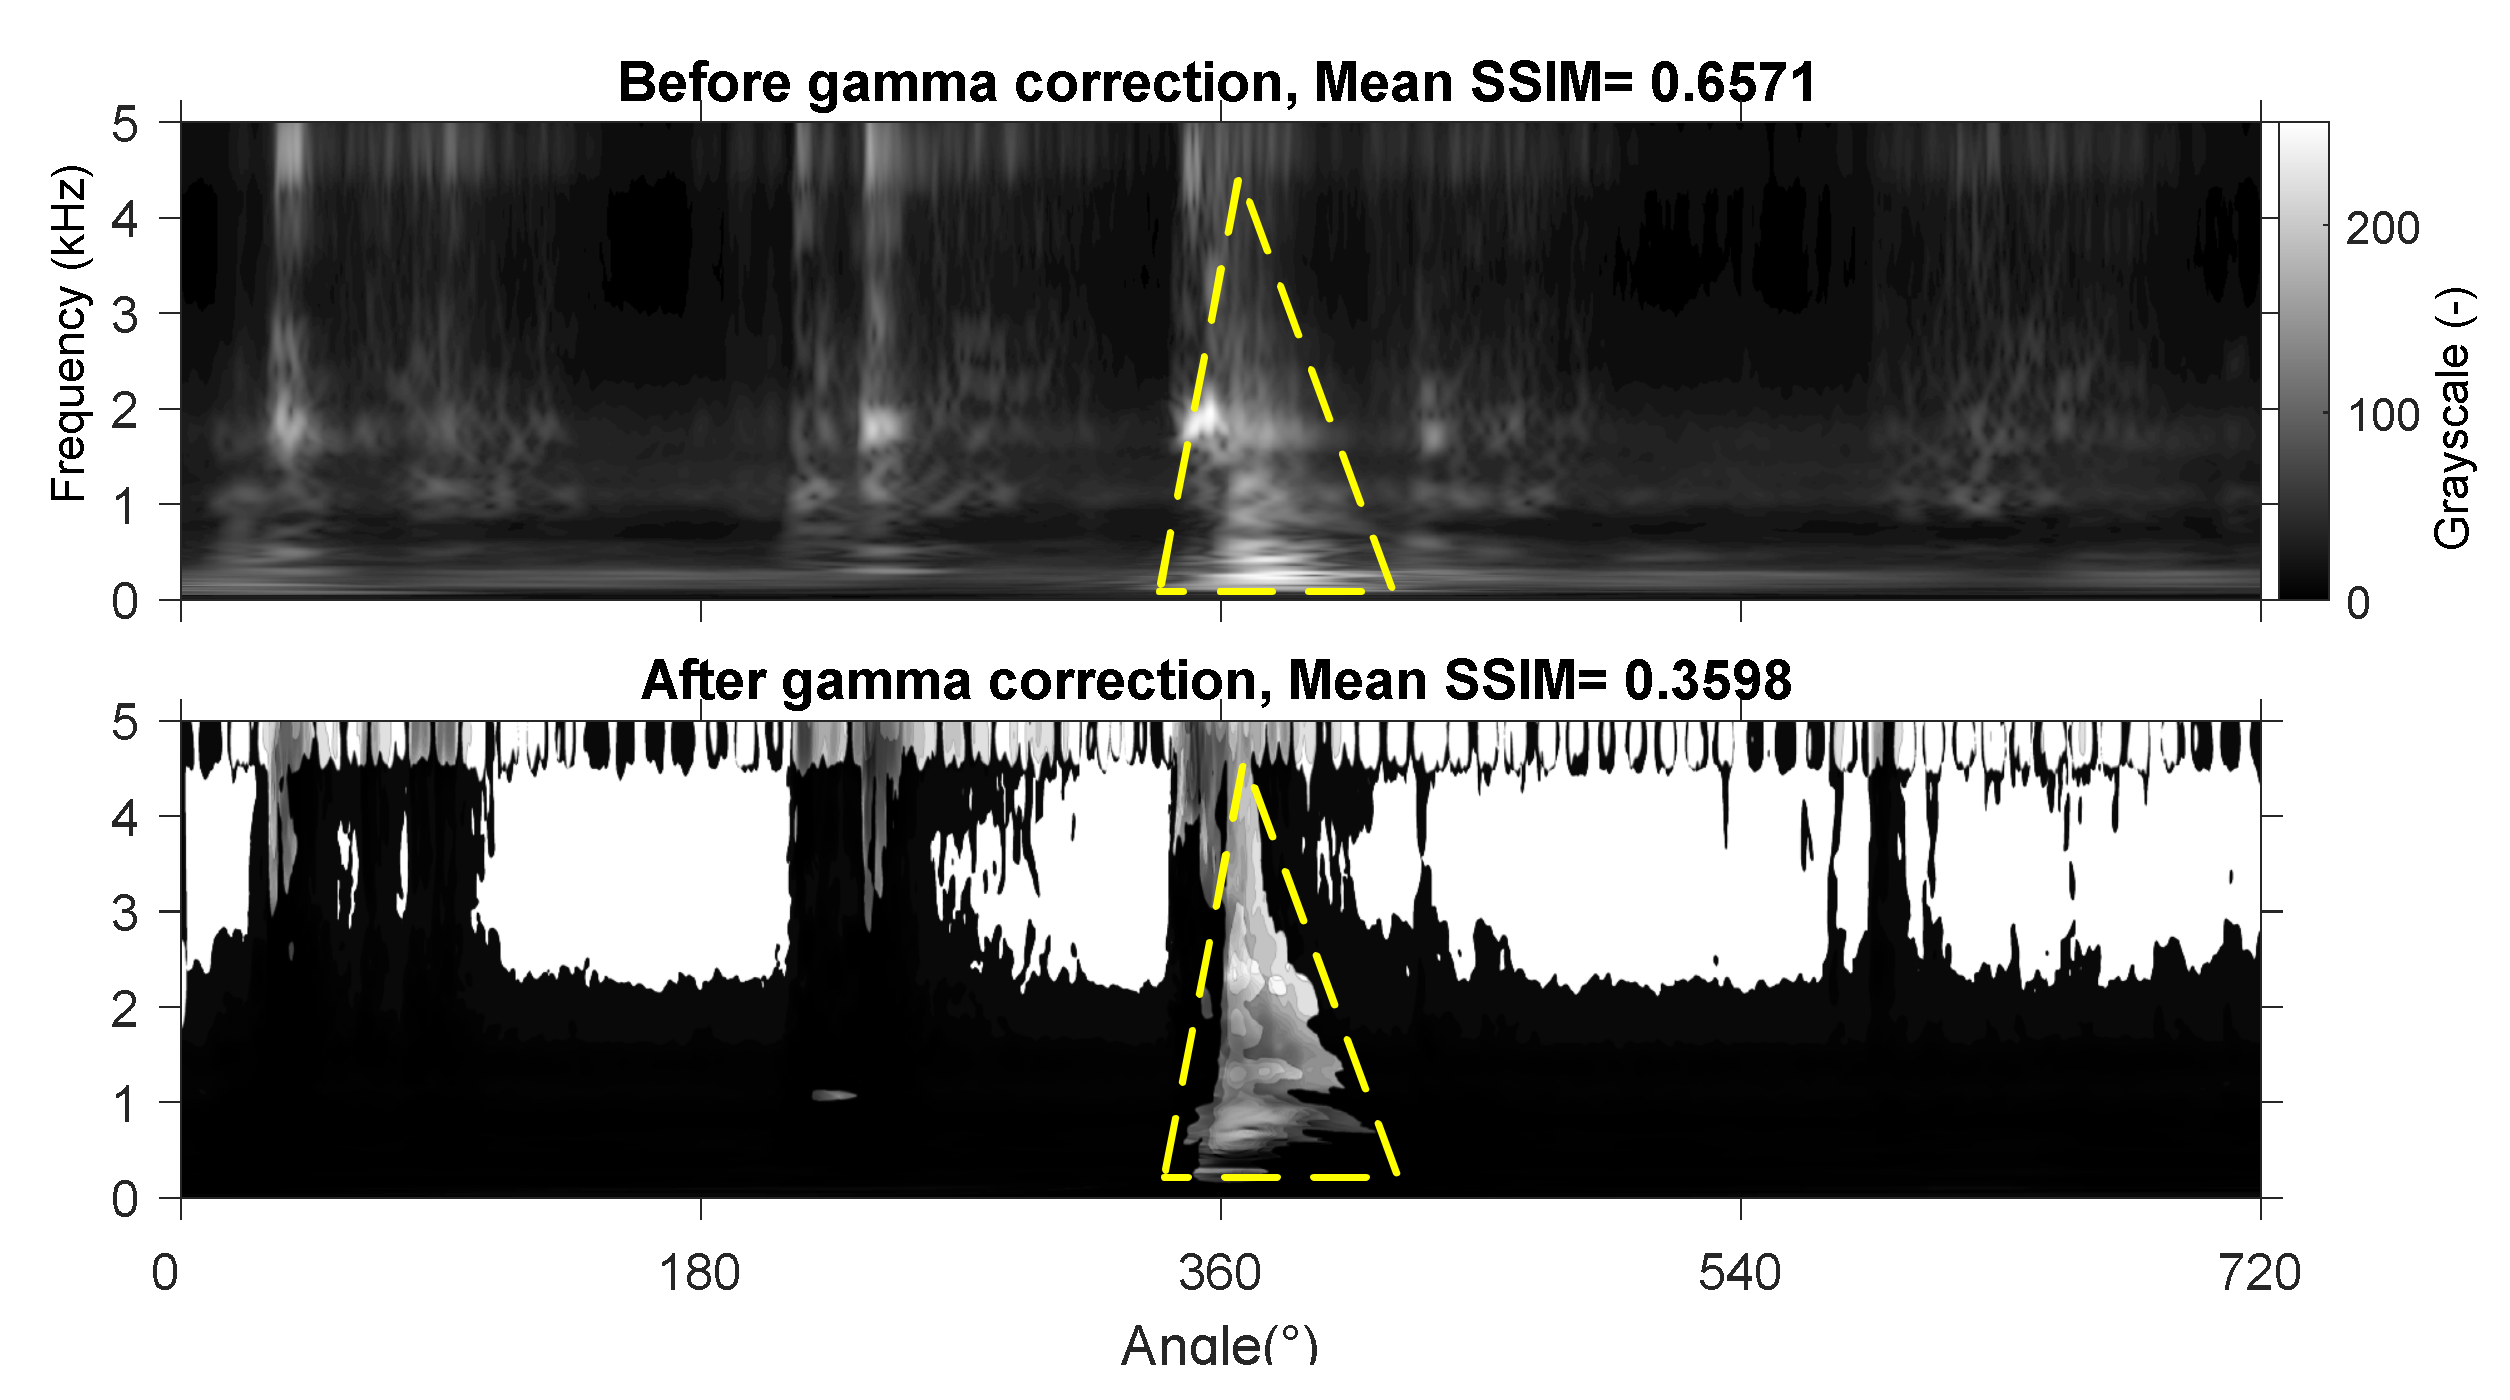
Structural similarity matrices, i.e., SSIM results of cylinder head vibration and second derivative of in-cylinder pressure, are presented in Figure 10. To facilitate comparison, the SSIM maps calculated based on grayscale images before and after the gamma correction are placed in the upper and lower half of the figure, respectively.
Figure 10 shows that the mean SSIM value without gamma correction (0.6571) is higher than the mean SSIM value with gamma correction (0.3598). Because of this, the gamma correction processing makes many nonstationary responses unrelated to the combustion event in the cylinder head vibration. It impairs the overall difference between 2nd-order in-cylinder pressure and the vibration signal, thus effectively overpowering the great false similarity affected by the strong background noise. In fact, near the combustion TDC, the SSIM map after gamma correction shows the most obvious resemblance pattern associated with the combustion event, as marked with a triangular dotted frame. Therefore, the vibration signal will be filtered based on the gamma-corrected SSIM map in the subsequent pressure reconstruction process.

4.2.3. Reconstruction of the Second Derivative of In-Cylinder Pressure Based on 2D Vibration Filtering

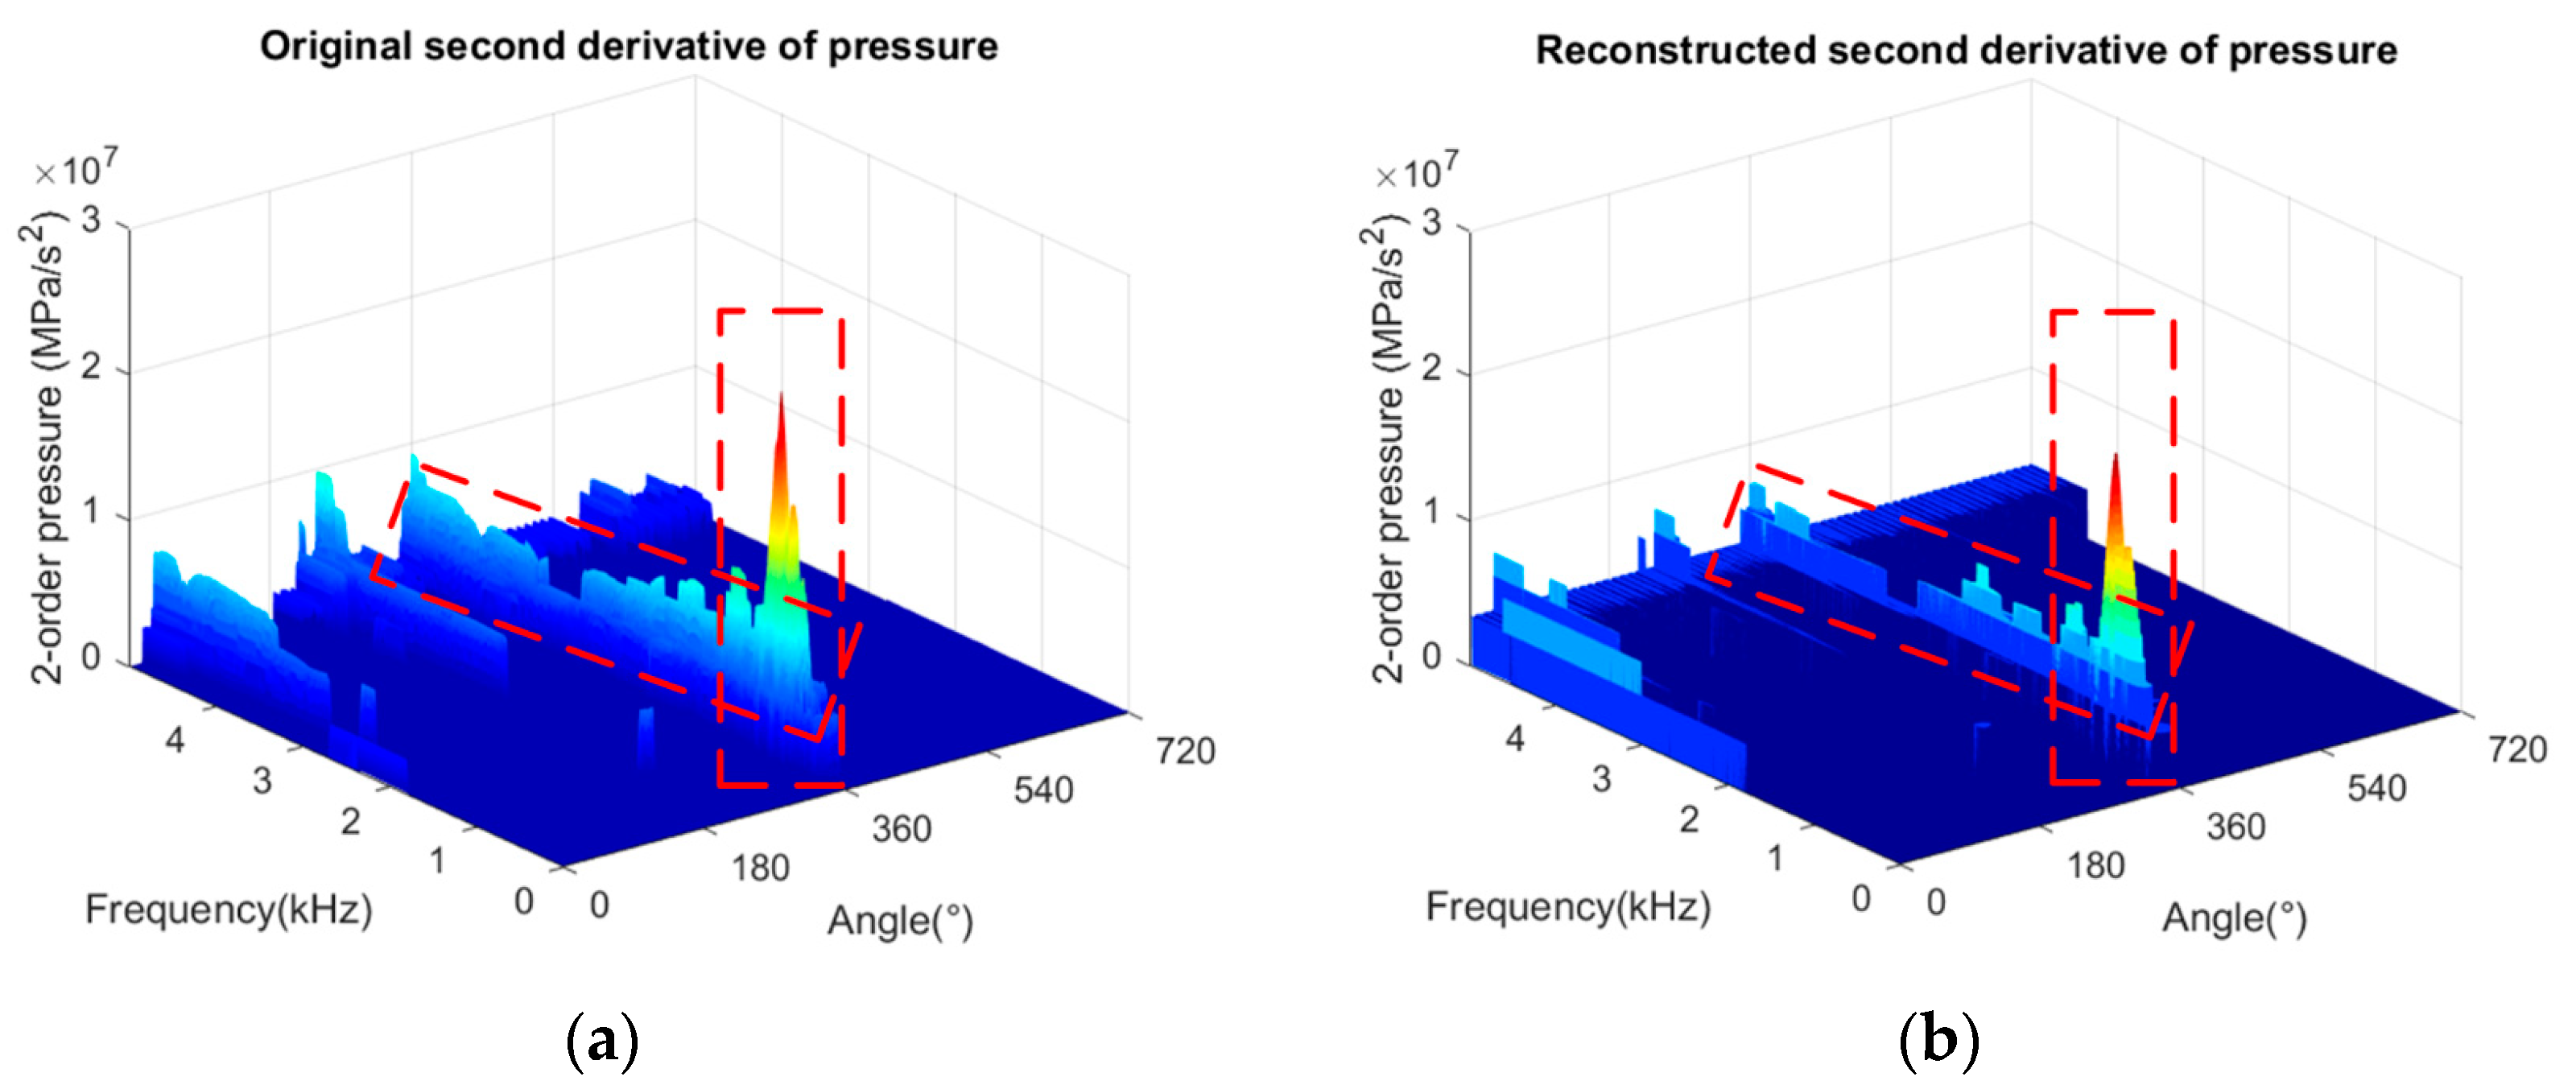
The SSIM similarity map, as a two-dimensional filter, can obtain reconstructed spectra containing information about the 2nd derivative of in-cylinder pressure. Figure 11a,b show that the reconstructed second derivative of pressure precisely maintains oscillation information related to the in-cylinder combustion event. The contour of the time-frequency spectrum of the reconstructed signal is smoother than that of the original second derivative of pressure, which is due to the calculation error introduced by the filtering process. Due to the loss of phase information during the reconstruction process, there is a slight deviation between the reconstructed and the measured curves around the combustion top dead center (TDC).
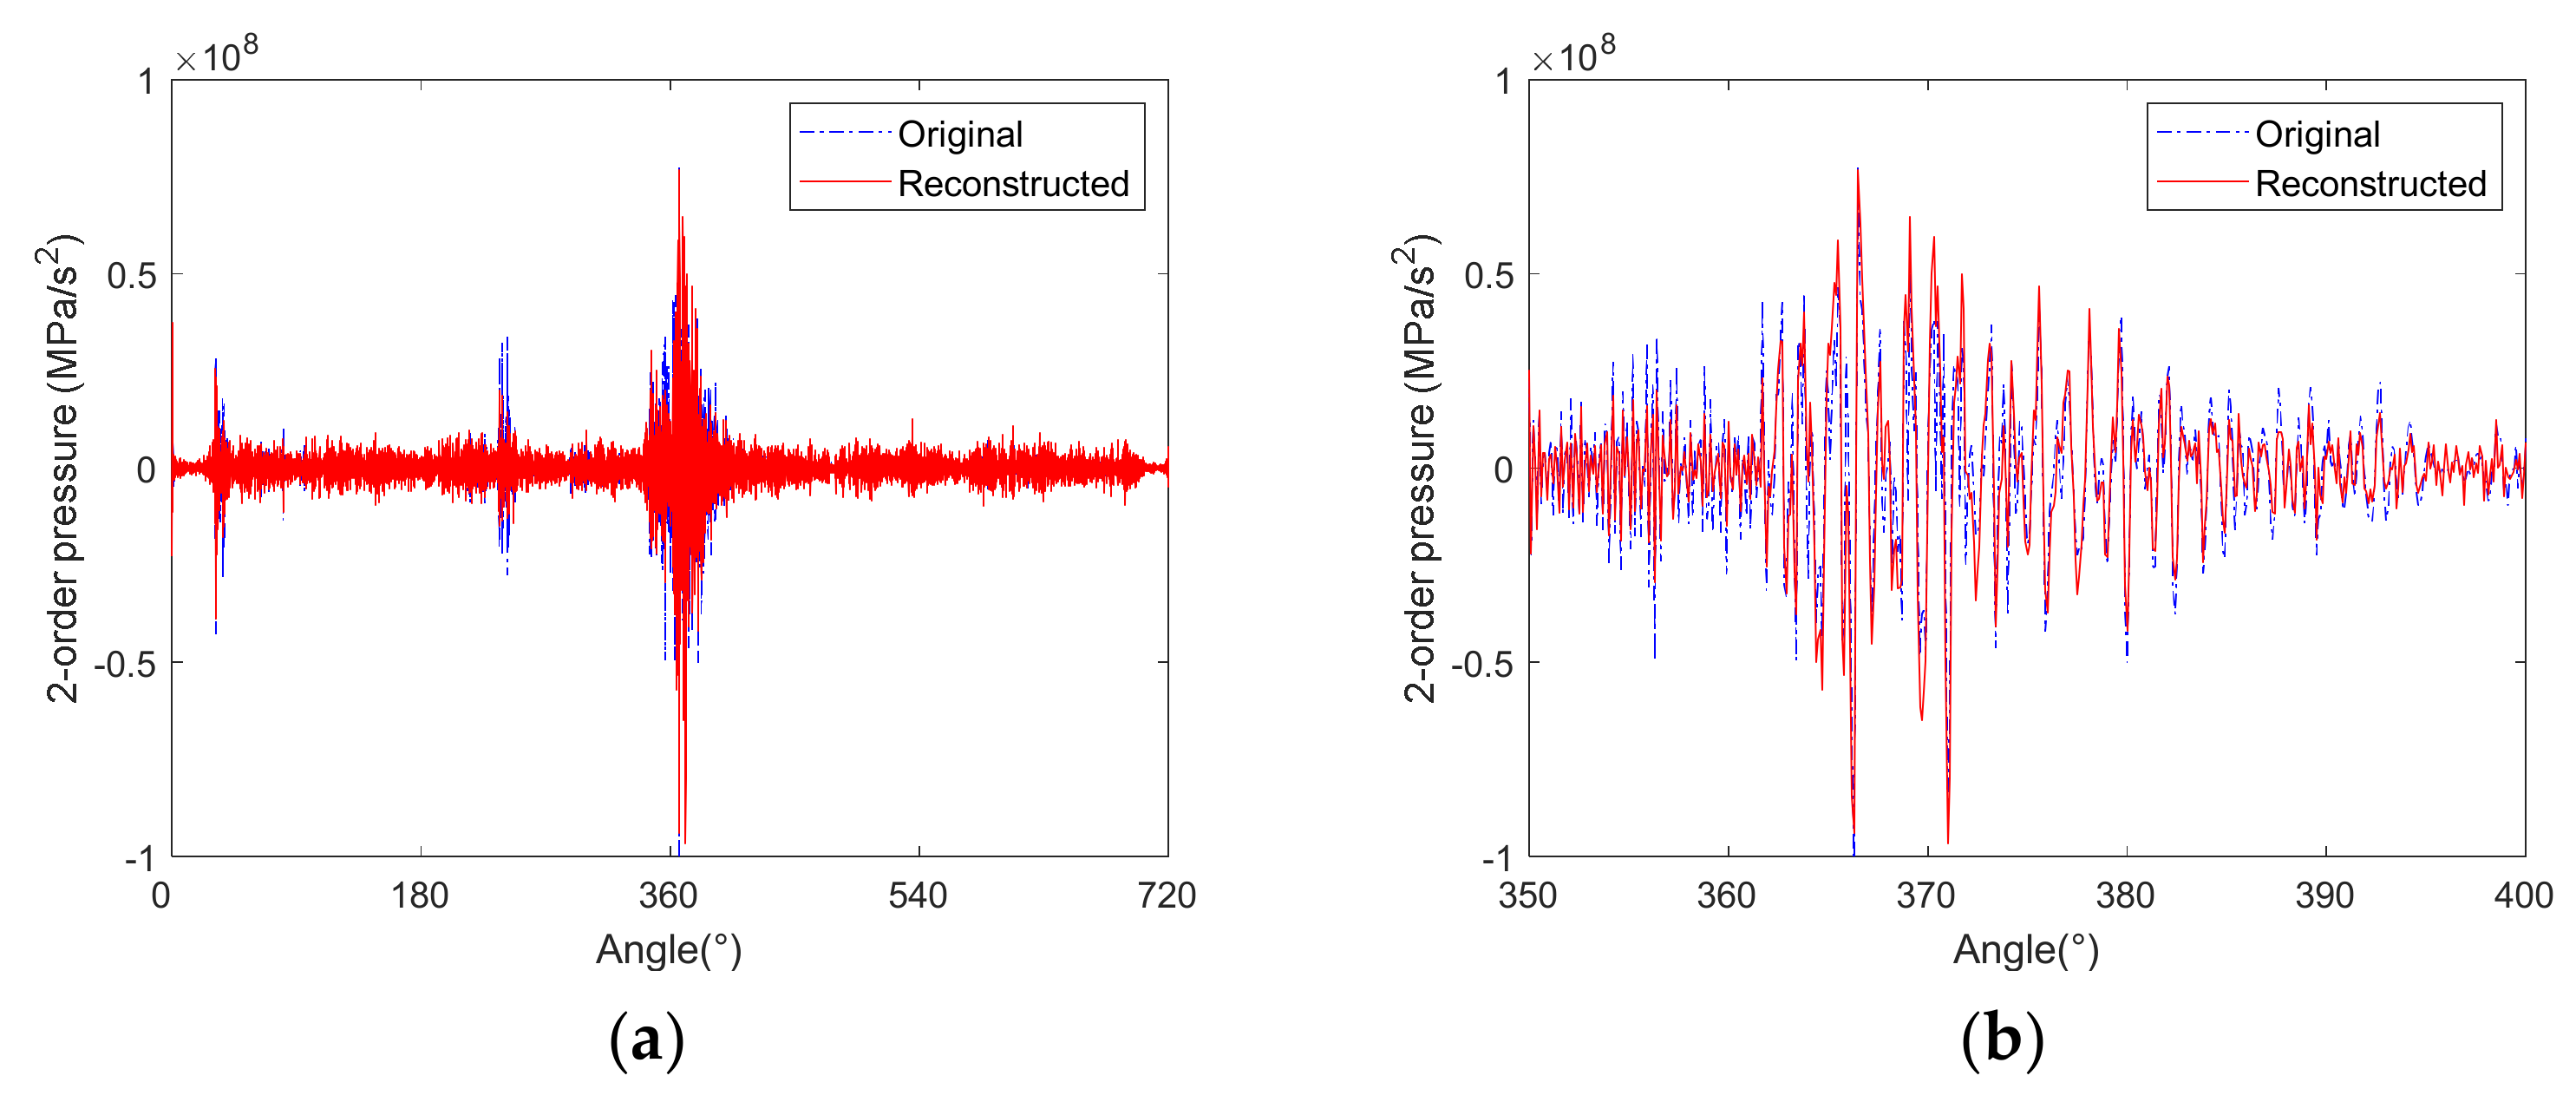
Then, the time-domain curves of the 2nd-order derivatives can be calculated by performing inverse time-frequency transform on the wavelet matrices. As shown in Figure 12, the reconstructed signal agreed well with the original one. It can be seen from the enlarged view in Figure 12b that the reconstructed curve contains most vibration characteristics in the original signal. This indicates that the reconstructed curve based on the vibration signal retains combustion-related information and is suitable as an input for the construction of a virtual NOx sensor.

4.3. Construction of NOx Prediction Model

This paper proposes a principal components regression (PCR) model to connect the selected features to the target NOx value. In previous studies, this well-established method evaluated the NOx emission based on measured in-cylinder pressure. It maintains accuracy while using a small number of modeling parameters [3,21]. PCR is a method of modeling a response variable when many predictor variables are highly correlated or even collinear. The linear combinations of the original predictor variables create new predictor variables known as principal components. In the meantime, the latest AI models can also be used for modeling. Unfortunately, it could not achieve such a performance and often has issues that need balanced labeled data samples.
To build a prediction model, it needs to extract suitable predictor variables from reconstructed pressure trace to connect to the target variables. It is hardly efficient to perform PCA analysis for compress predictor variables using the in-cylinder pressure curve of a complete operating cycle. Most existing research divided the pressure curve into multiple segments according to the engine working process and compressed predictor variables by describing the contour of segments. However, the lack of low-frequency or quasi-static response information in the reconstructed curve makes it inefficient and inaccurate to perform contour description-oriented PCA information compression on signal segments.
Based on the analysis as mentioned above, predictive variables are constructed from the 2nd-order derivatives proposed. Instead of drawing the segmented contour, it only extracts statistical information of signal segments, including the root-mean-square (RMS) value, peak value, and kurtosis. The whole pressure profile is divided into 6 segments according to different mechanical events or combustion states. 
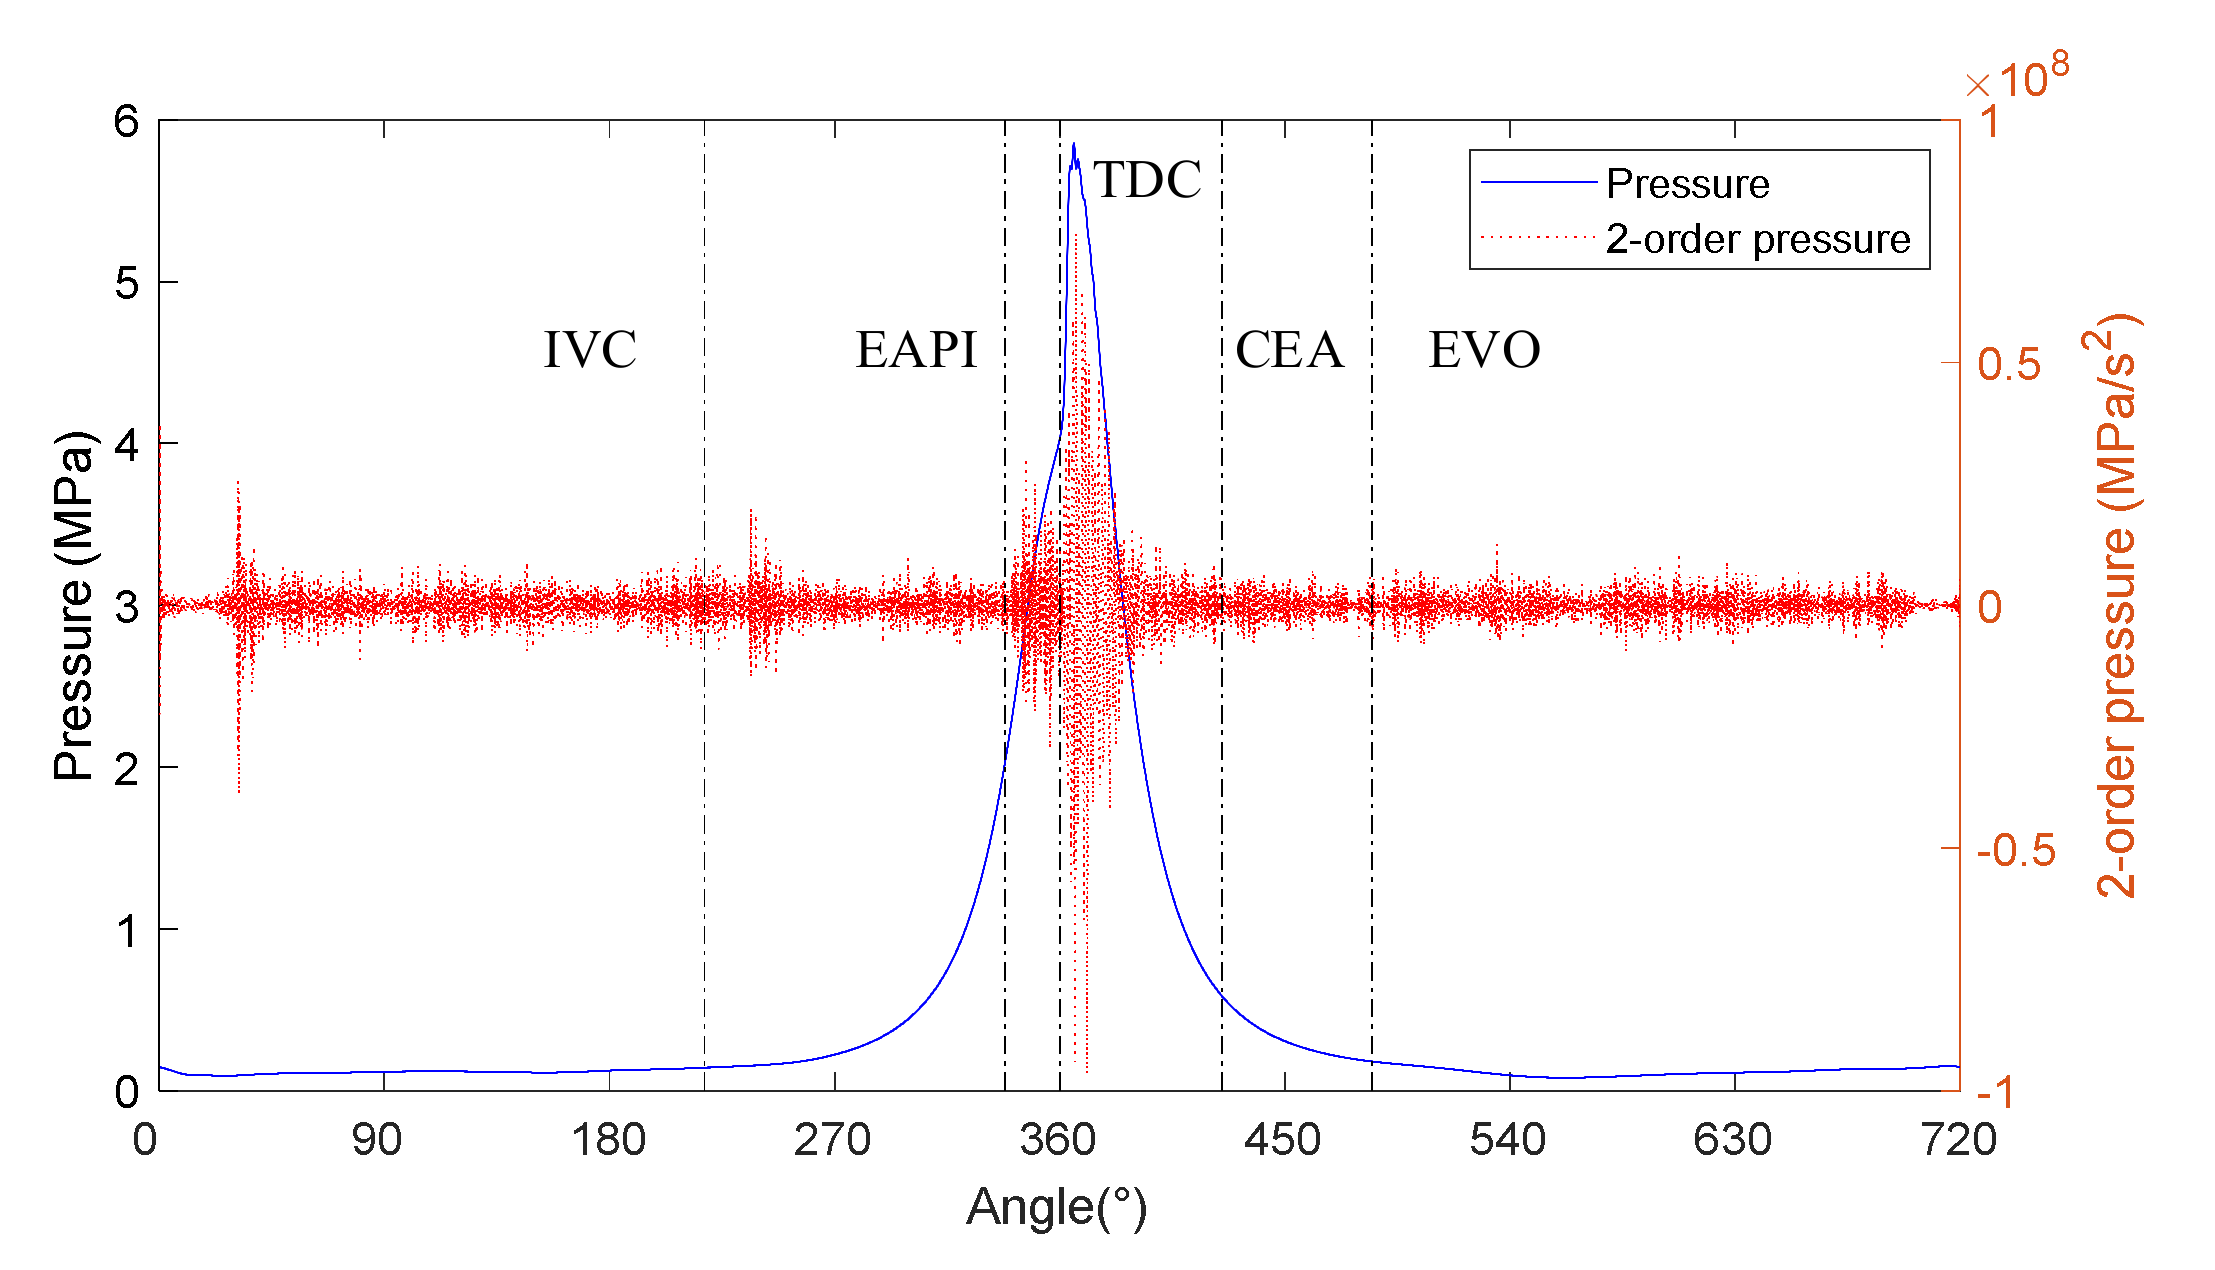
Figure 13 shows a typical second derivative curve of in-cylinder pressure and 5 division points.
The segment of in-cylinder pressure between intake valve close angle (IVC) and exhaust valve open angle (EVO), the segment with drastic changes, is selected as the selection interval for predictor variables. These division points, respectively, are intake valve close angle (IVC), the injection starting angle (ISA), top dead center (TDC), the end of combustion (EOC), and exhaust valve open-angle (EVO). The EOC is at the crank angle, where the apparent heat release rate attains a flat slope prior to the engine’s exhaust stroke. The first twelve predictor variables are defined as RMS, peak, and kurtosis of the 2-order pressure segments in four intervals at crank angles of 218–338° CA, 338–360° CA, 360–445° CA, and 445–485° CA. The RMS and time integral of the complete pressure curve are selected as the 13th to 14th predictor variables.
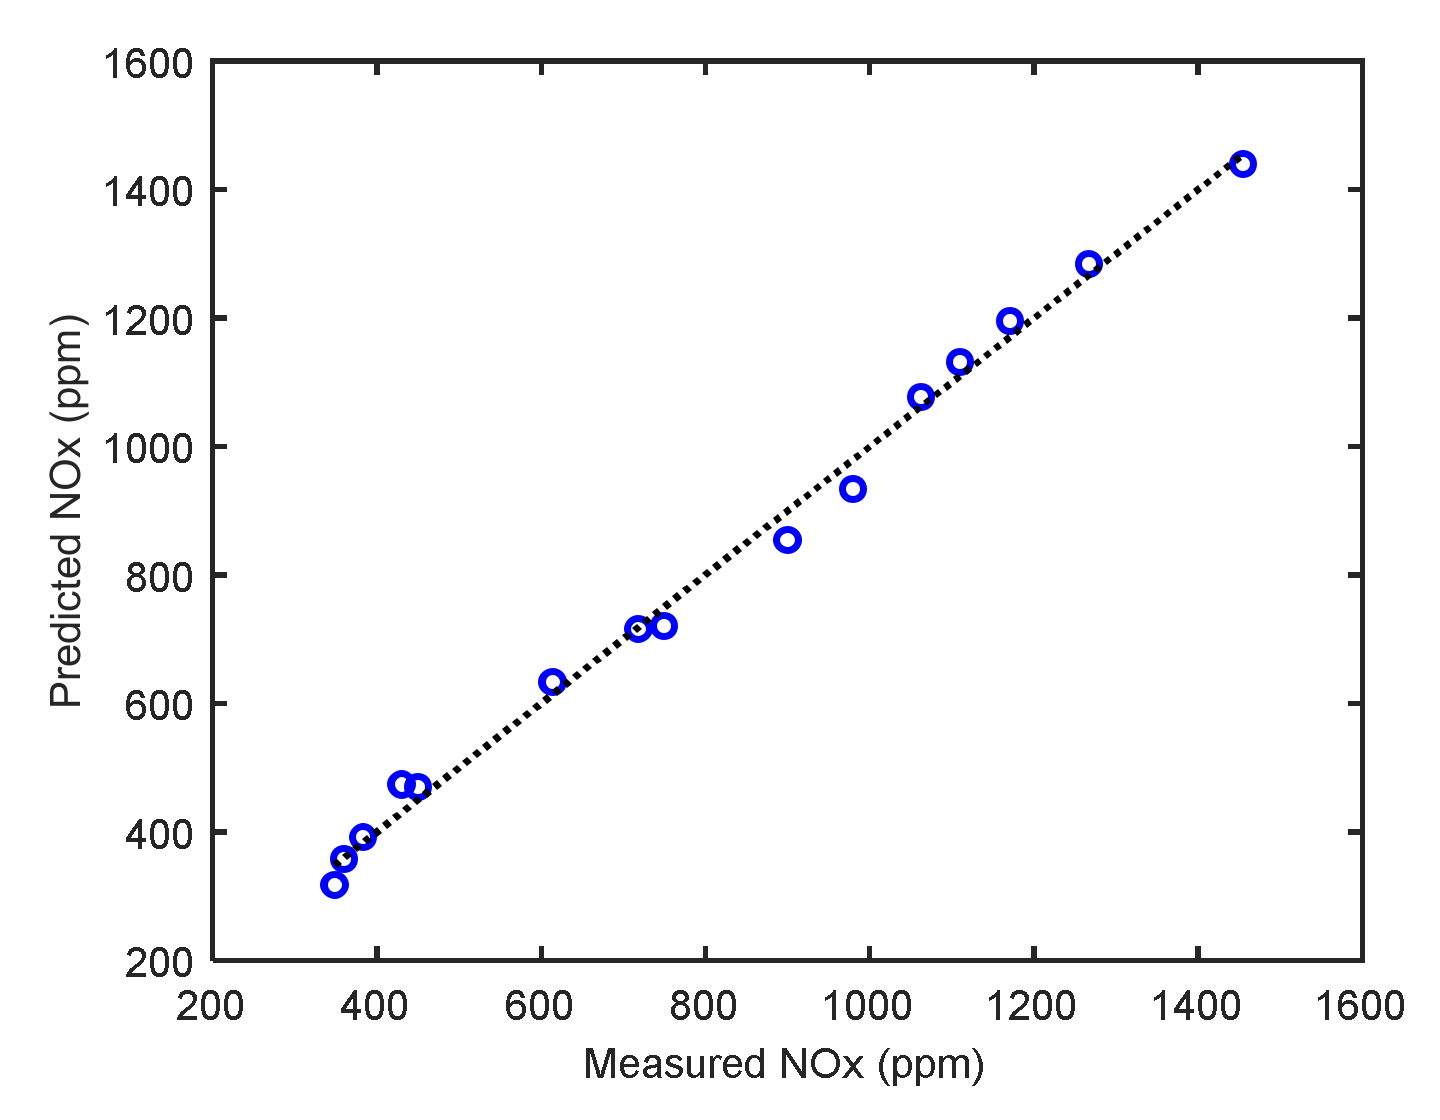
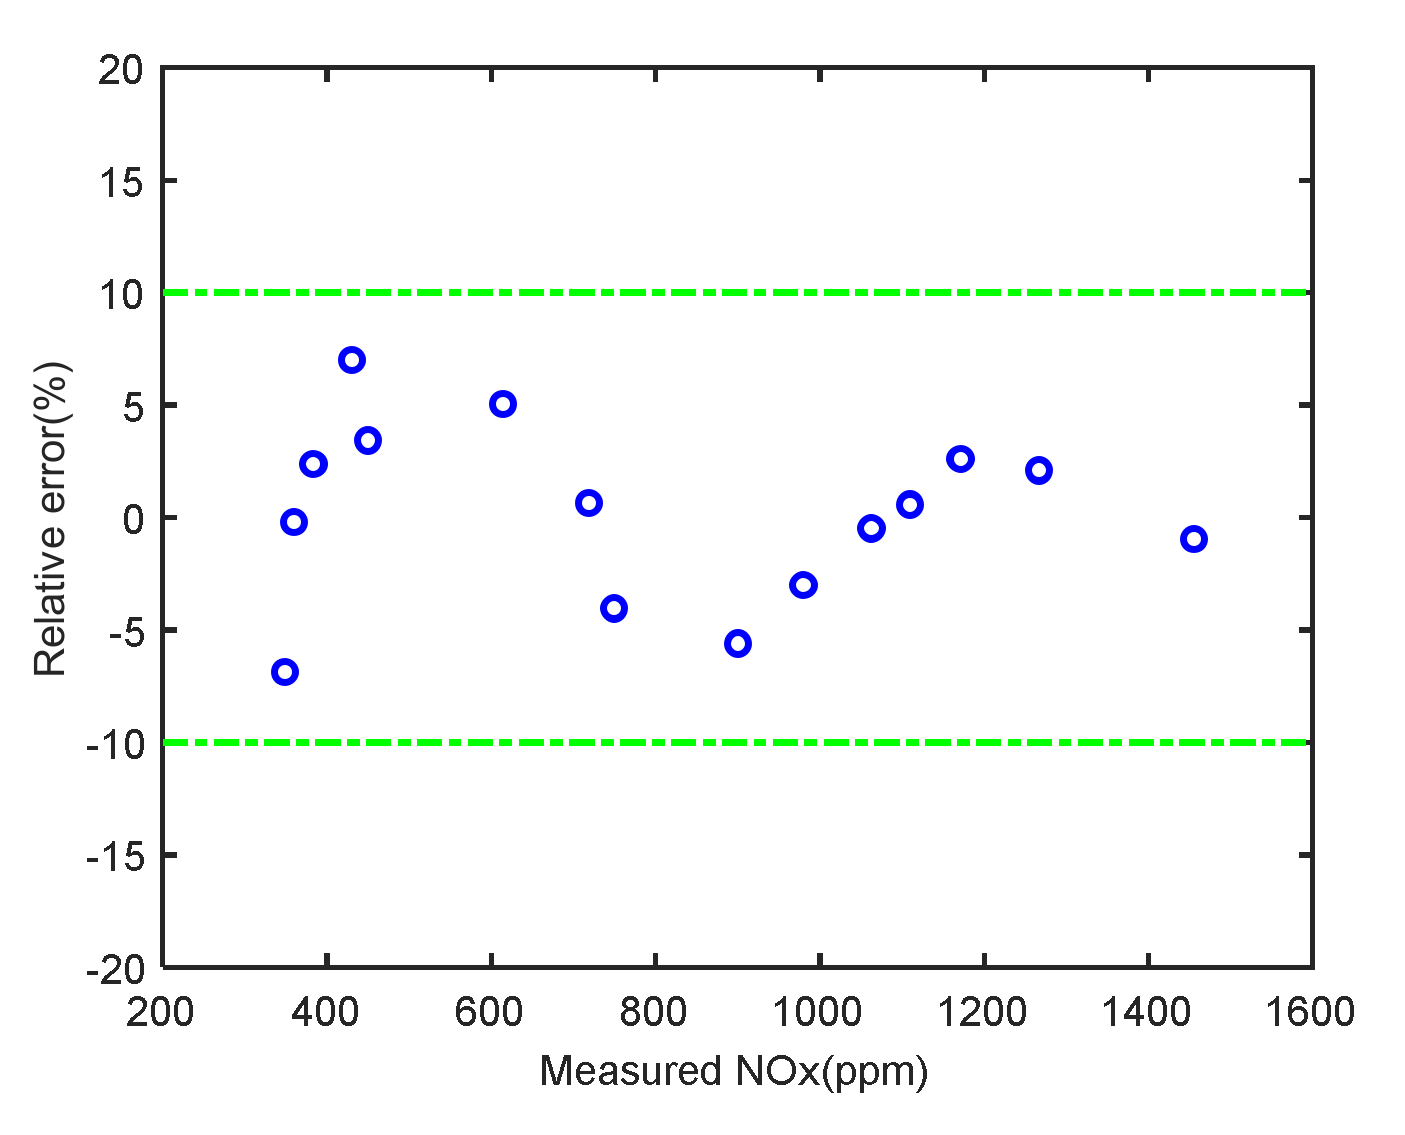
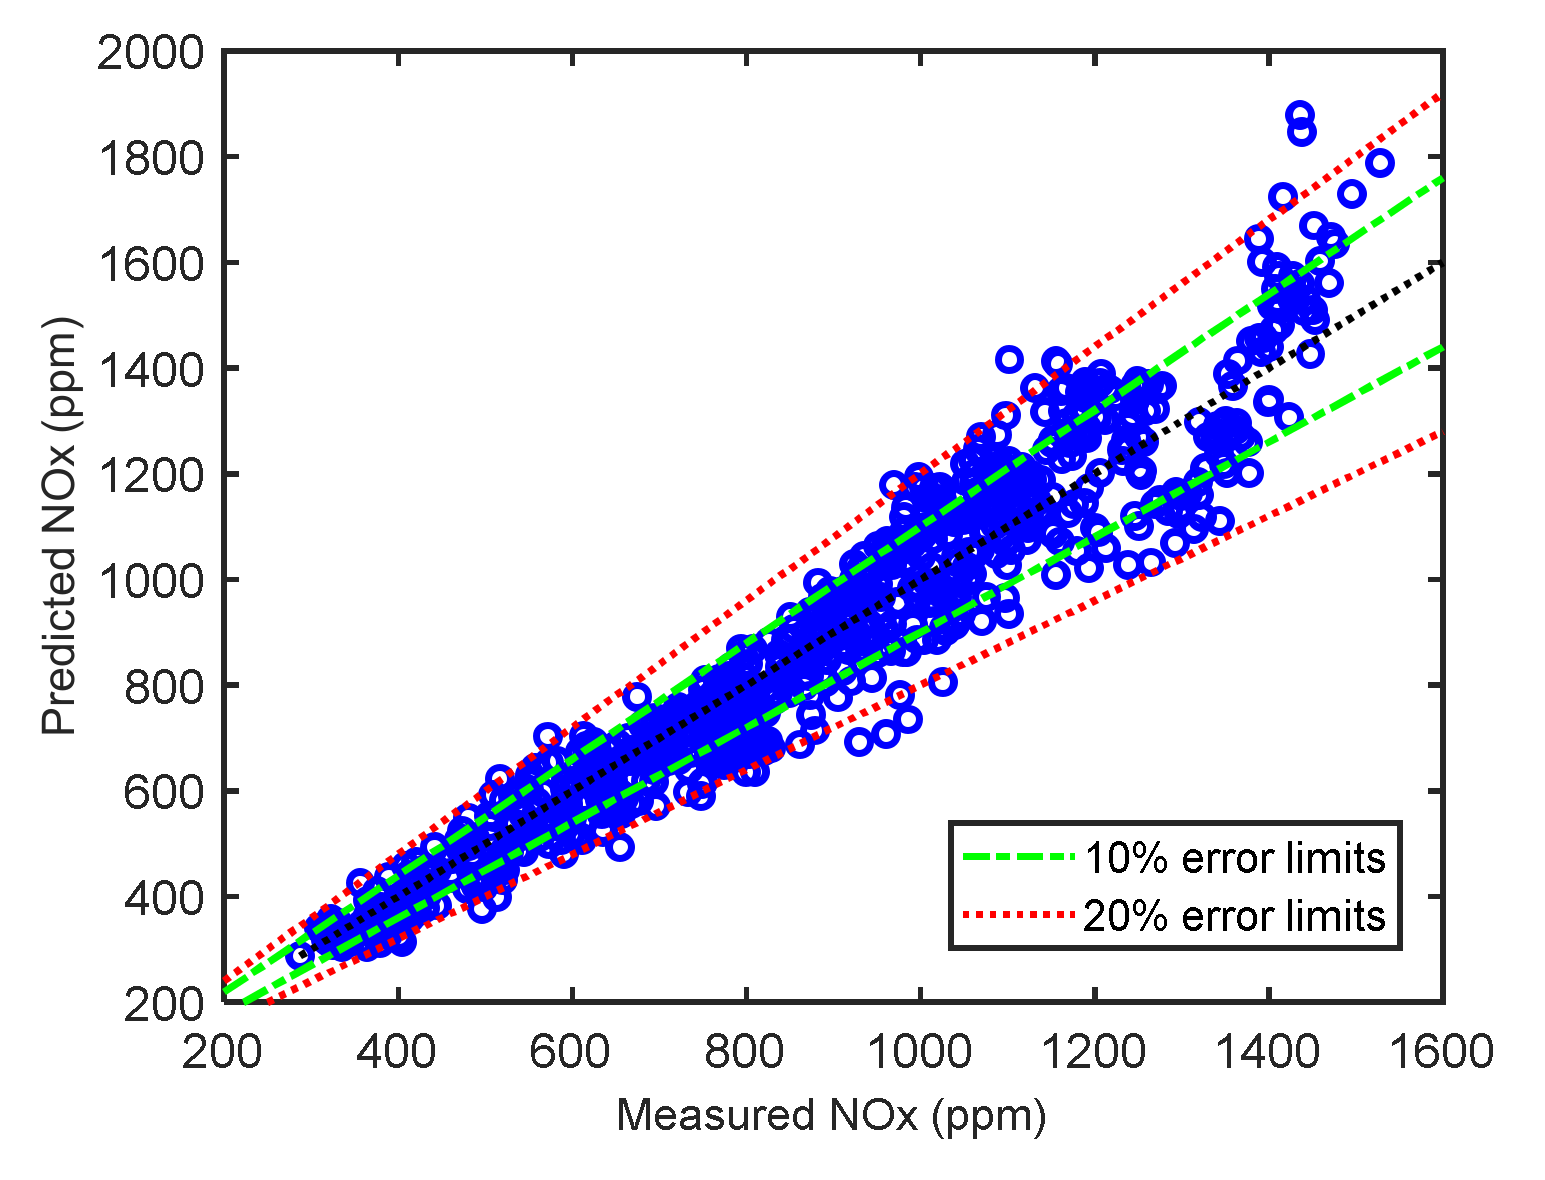
Then, principal component analysis was executed on the 14 predictor variables and measured emission result. Several principal components regression prediction models with different numbers of principal components for NOx emissions were established to estimate emission levels. A PCR model constructed based on 7 principal components was selected as the virtual NOx sensor to balance prediction accuracy and calculation efficiency. This model is constructed with the fewest components and satisfies the condition that the coefficient of determination is greater than 0.95.

5. Results and Discussion

The established virtual NOx sensor is validated for steady-state and transient measurement data.

5.1. Steady-State Operating Conditions

The virtual NOx sensor is verified based on repeated experiments of 15 steady-state operating points, consistent with the operating conditions used for model construction. The predicted NOx agrees well with the experimental data, indicating that the developed virtual sensor’s predictive ability for NOx was commendable. The coefficient of determination (R2) between the predicted NOx and experimental NOx was found to be 0.959, as evident from Figure 14. The relative error between virtual sensor and measured NOx is given in Figure 15. All operating points show inaccuracy well below ±10%.

5.2. Transient Operating Conditions

The virtual sensor updates the prediction of NOx emission state in each engine cycle. As engine speed increases from 1000 r/min to 1800 r/min, the response time of the virtual NOx sensor is gradually shortened from 120 ms to 67 ms, which is always much faster than the response time of the physical NOx sensor. The minimum sampling interval of the emission meter is 1s, limiting the transient validation of the virtual NOx sensor. Therefore, the prediction results within a fixed sampling period (1 s) are averaged to enhance the comparability between predicted and measured data. Transient performance of the virtual NOx sensor is assessed based on two ramp tests, as detailed in Section 3.
Figure 16 and Figure 17 show the comparison between the virtual NOx sensor and the physical NOx sensor for different ramp tests. It can be observed from Figure 16 that, for the transient test with constant load and variable speed, with the step changes of engine speed (black dotted line), the measured NOx emission presents drastic changes, and the virtual NOx sensor is capable of following the emission measurement. Under high load conditions of 50 Nm, the predicted NOx shows more peak deviations compared to measured data. This is due to the fast response capability of the virtual NOx sensor, which enables it to more accurately describe the dramatic fluctuations in emission levels caused by transient operation. By contrast, the response delay of the physical NOx sensor is equivalent to a filtering operation applied to the transient emission curve, which introduces error in predicting transient emission to a certain extent.
As shown in Figure 17, under the operating conditions of constant speed and variable torque, the measured NOx fluctuates greatly with the torque change. In most transient conditions, the predicted value of the virtual NOx sensor is well agreed with the measured result. At high load conditions, the predicted NOx also showed obvious peak deviation, similar to the aforementioned constant load and variable speed test.
As shown in Figure 18, the relative error between the predicted NOx and the measured NOx is less than 20% (the 20% error limit is marked as a red dotted line) at most transient operating points, and the prediction error for high-concentration NOx above 700 ppm is less than 10% (the 10% error limit is marked with a green dashed line), which indicates that the built virtual NOx sensor has better accuracy in predicting transient NOx under the premise of acceptable precision. The dynamic frequency responses of both virtual sensor and emission measurements are shown in Figure 19. For the speed input, the response of the NOx sensor is close to that of the emission measurement.
The comparison of predicted and measured NOx under variable torque conditions is shown in Figure 20 and Figure 21. In most transients, the relative error between forecast NOx and measured NOx is less than ±20%. The prediction accuracy of the virtual NOx sensor for the transient torque is worse than that for the speed. At a higher frequency, 0.2 Hz torque input response of the virtual NOx sensor starts dropping off (−3 dB) as compared to the physical sensor frequency at around 0.09 Hz. This indicates that the virtual sensor’s system response is significantly faster (around 122%) than the physical sensor.

6. Conclusions

For developing a virtual sensor for real-time monitoring of NOx emissions, a physics-informed model was developed to establish the interdisciplinary connections between vibration and NOx emissions. A time-frequency two-dimensional filter was developed to extract combustion-related information from raw vibration signals. The information from the second derivative of in-cylinder pressure is represented by 7 principal components. Consequently, a principal components regression (PCR) model can be developed to predict NOx values for different engine operating conditions.
The experimental validation of virtual sensors at steady-state conditions shows that the predicted NOx is in good agreement with the measured NOx, with an error less than ±10%. The virtual NOx sensor is proven to meet the accuracy requirement of vehicle emission monitoring for both steady-state and transient conditions and has a better frequency response compared to the emission measurement system. In the quasi-transient operating condition, the response time of the virtual NOx sensor is gradually shortened from 120 ms to 67 ms, which is always much faster than the response time of the physical NOx sensor. The quasi-transient test shows that the virtual sensor responds faster than the emission measurement, under the premise that the prediction is consistent with the measured NOx trace. The experiments results indicate that the virtual sensor’s system response is significantly faster (around 122%) than the physical sensor. The virtual NOx sensor is verified based on repeated experiments of 15 steady-state operating points, consistent with the operating conditions used for model construction that indicates the developed virtual sensor’s predictive ability for NOx was magnificent. The prediction results regarding transient operating conditions within a fixed sampling period (1 s) are averaged to enhance the comparability between predicted and measured data.

7. Future Research

Future research should consider the potential effects of the development and validation of a vibration-based virtual sensor for real-time monitoring NOx emissions of an RCCI engine. Many different adaptations, tests, and experiments have been left for the future. Future work concerns the deeper analysis of particular mechanisms, new proposals to try different methods, or simply curiosity about RCCI engine NOx emission. In the future, more detailed correlation between vibration and NOx emission will be characterized in-depth. We will improve the technique of constructing two-dimensional filters for vibration signals and extract from combustion-related information.

Author Contributions

Conceptualization, M.Y.I., T.W. and G.L.; methodology, S.L.; software, G.H. and T.Y.; validation, M.Y.I. and G.L.; formal analysis, T.W. and F.G.; investigation, M.Y.I., T.W. and G.L.; resources, M.Y.I., T.W. and G.L.; data curation, M.Y.I., T.W.,G.L. and M.A.-N.; writing—original draft preparation, M.Y.I., T.W. and G.L.; writing—review and editing, M.Y.I. and G.L.; visualization, G.L.; supervision, T.W.; project administration, M.Y.I. and G.L.; funding acquisition, T.W. All authors have read and agreed to the published version of the manuscript.

Funding

This research was supported by the Natural and Scientific foundation of China NO. 51805353, and Shanxi Scholarship Council of China NO. HGKY2019041.

Institutional Review Board Statement

Not applicable.

Informed Consent Statement

Not applicable.

Data Availability Statement

The data are not publicly available due to privacy considerations.

Acknowledgments

Thank Tie Wang, Guoxing Li, Chaoliang He, Chong Wang and Junhui Fan from Taiyuan University of Technology for their help in modelling and testing.

Conflicts of Interest

The authors declare no conflict of interest.

References

  1. Mentink, P.; Escobar-Valdivieso, D.; Forrai, A.; Seykens, X.; Willems, F. Experimental validation of a virtual engine-out NOx sensor for diesel emission control. Int. J. Engine Res. 2019, 20, 1037–1046. [Google Scholar] [CrossRef]
  2. Guardiola, C.; López, J.J.; Martín, J.; García-Sarmiento, D. Semiempirical in-cylinder pressure based model for NOx prediction oriented to control applications. Appl. Therm. Eng. 2011, 31, 3275–3286. [Google Scholar] [CrossRef]
  3. Formentin, S.; Corno, M.; Waschl, H.; Alberer, D.; Savaresi, S.M. NOx Estimation in Diesel Engines via In-Cylinder Pressure Measurement. IEEE Trans. Control. Syst. Technol. 2014, 22, 396–403. [Google Scholar] [CrossRef]
  4. Seykens, X.L.J.; Baert, R.S.G.; Somers, L.M.T.; Willems, F.P.T. Experimental validation of extended NO and soot model for advanced HD diesel engine combustion. SAE Int. J. Engines 2009, 2, 606–619. [Google Scholar] [CrossRef] [Green Version]
  5. Mentink, P.; Seykens, X.; Valdivieso, D. Development and Application of a Virtual NOx Sensor for Robust Heavy Duty Diesel Engine Emission Control. SAE Int. J. Engines 2017, 10, 1297–1304. [Google Scholar] [CrossRef]
  6. Benatzky, C.; Stadlbauer, S.; Formentin, S.; Schilling, A.; Alberer, D. Indicated pressure-based data-driven diesel engine NOx modeling. Int. J. Engine Res. 2014, 15, 934–943. [Google Scholar] [CrossRef]
  7. Roy, S.; Banerjee, R.; Das, A.K.; Bose, P.K. Development of an ANN based system identification tool to estimate the performance-emission characteristics of a CRDI assisted CNG dual fuel diesel engine. J. Nat. Gas Sci. Eng. 2014, 21, 147–158. [Google Scholar] [CrossRef]
  8. Kakati, D.; Roy, S.; Banerjee, R. Development of an artificial neural network based virtual sensing platform for the simultaneous prediction of emission-performance-stability parameters of a diesel engine operating in dual fuel mode with port injected methanol. Energy Convers. Manag. 2019, 184, 488–509. [Google Scholar] [CrossRef]
  9. Tang, J.; Cheng, Y.; Liu, Y.; Ma, Z. Recognition of Combustion Start Point of Diesel Engine Based on Cylinder Head Vibration Acceleration. Trans. Chin. Soc. Agric. Mach. 2011, 42, 6–10. [Google Scholar]
  10. Cheng, Y.; Tang, J.; Ji, S.; Huang, M. Combustion timing determination based on vibration velocity in HCCI engines. Mech. Mach. Theory 2012, 58, 20–28. [Google Scholar] [CrossRef]
  11. Zhao, X.; Cheng, Y.; Ji, S. Combustion parameters identification and correction in diesel engine via vibration acceleration signal. Appl. Acoust. 2017, 116, 205–215. [Google Scholar] [CrossRef]
  12. Chiatti, G.; Chiavola, O.; Recco, E. Combustion diagnosis via block vibration signal in common rail diesel engine. Int. J. Engine Res. 2014, 15, 654–663. [Google Scholar] [CrossRef]
  13. Polonowski, C.J.; Mathur, V.K.; Naber, J.D.; Blough, J.R. Accelerometer based sensing of combustion in a high speed HPCR diesel engine. In Proceedings of the 2007 SAE International World Congress, Detroit, MI, USA, 16–19 April 2007. [Google Scholar]
  14. Chiavola, O.; Chiatti, G.; Arnone, L.; Manelli, S. Combustion Characterization in Diesel Engine via Block Vibration Analysis; SAE International: Warrendale, PA, USA, 2010. [Google Scholar]
  15. Ghamry, M.; Steel, J.A.; Reuben, R.L.; Fog, T.L. Indirect measurement of cylinder pressure from diesel engines using acoustic emission. Mech. Syst. Signal Process. 2005, 19, 751–765. [Google Scholar] [CrossRef]
  16. Jing, X.; Ma, S.; Tu, J. Dynamic Cavitation Image Processing Based on SSIM Algorithm. Mod. Electron. Technol. 2016, 39, 23–25. [Google Scholar]
  17. Yang, T. Research on Monitoring of Combustion Status in Diesel Engine Cylinder Based on Time-Frequency Analysis of Vibration Signals; School of Mechanical and Vehicle Engineering, Taiyuan University of Technology: Taiyuan, China, 2019. [Google Scholar]
  18. Arsie, I.; Cricchio, A.; De Cesare, M.; Pianese, C.; Sorrentino, M. Least Square Adaptation of a Fast Diesel Engine NOx Emissions Model. IFAC PapersOnLine 2017, 50, 2405–8963. [Google Scholar] [CrossRef]
  19. Zeldvich, Y.B. The oxidation of nitrogen in combustion and explosions. J. Acta Physicochim. 1946, 21, 577. [Google Scholar]
  20. Al-Shemmeri, T.T.; Oberweis, S. Correlation of the NOx emission and exhaust gas temperature for biodiesel. Appl. Therm. Eng. 2011, 31, 1682–1688. [Google Scholar] [CrossRef]
  21. Stadlbauer, S.; Alberer, D.; Hirsch, M.; Formentin, S.; Benatzky, C.; del Re, L. Evaluation of Virtual NOx Sensor Models for Off Road Heavy Duty Diesel Engines. SAE Int. J. Commer. Veh. 2012, 5, 128–140. [Google Scholar] [CrossRef]
  22. Li, G.; Gu, F.; Wang, T.; You, J.; Ball, A. Investigation into the vibrational responses of cylinder liners in an IC engine fueled with biodiesel. Appl. Sci. 2017, 7, 717. [Google Scholar] [CrossRef] [Green Version]
  23. Wei, H.; Wei, J.; Shu, G. Calculation on Cylinder Pressure Fluctuation by Using the Wave Equation in KIVA Program. Chin. J. Mech. Eng. 2012, 25, 362–369. [Google Scholar] [CrossRef]
  24. Li, G.; Sahal, A.E.; Gu, F.; Wang, T.; Zhang, W.; Hu, T.; Yang, T. Vibration Based Virtual Sensing of Nitrogen Oxide Emission in CI Engines. In Proceedings of the International Conference on Maintenance Engineering 2020, Zhuhai, China, 15–17 April 2020; Springer: Cham, Switzerland, 2021; pp. 596–606. [Google Scholar]
Figure 1. The relationship between vibration, combustion, and NOx emissions.
Machines 10 00594 g001
Figure 2. STFT of measured in-cylinder pressure. (a) STFT of measured in-cylinder pressure (b) PRR and measured pressure by the STFT.
Machines 10 00594 g002
Figure 3. Short-Time Fourier Transform predicted displacement response to combustion under 40 Nm and 1800 r/min. (a) STFT predicted displacement response to combustion under 40 Nm and 1800 r/min (b) Predicted displacement curve near the combustion top dead center (TDC).
Machines 10 00594 g003
Figure 4. Schematic diagram of the construction and application of virtual NOx sensor.
Machines 10 00594 g004
Figure 5. (a) Schematic diagram of test bench. (b) Sensor arrangement scheme.
Machines 10 00594 g005
Figure 6. Speed and torque trajectories for the grid measurement tests: (a) Speed lifting conditions; (b) Torque lifting conditions.
Machines 10 00594 g006aMachines 10 00594 g006b
Figure 7. Second derivative of in-cylinder pressure and cylinder liner vibration CWTs at operating conditions of 1600 r/min and 30 Nm and cylinder head vibration.
Machines 10 00594 g007
Figure 8. Grayscale images of time-frequency spectra.
Machines 10 00594 g008
Figure 9. Grayscale images of time-frequency spectra after gamma correction.
Machines 10 00594 g009
Figure 10. Cylinder head vibrations before and after gamma correction and SSIM maps of 2-order pressure.
Machines 10 00594 g010
Figure 11. Time-frequency illustration of (a) original and (b) reconstructed second derivative of pressure.
Machines 10 00594 g011
Figure 12. Inventive and remodeled second derivative of pressure time-domain curves. (a) global view, (b) enlarged view.
Machines 10 00594 g012
Figure 13. 6 segments divided in a typical in-cylinder pressure profile.
Machines 10 00594 g013
Figure 14. Predicted and measured NOx under steady-state conditions. Blue dots show the intensity and predictions of the measured NOx.
Machines 10 00594 g014
Figure 15. Prediction accuracy of virtual NOx sensor. The blue dots show the intensity of predicted NOx.
Machines 10 00594 g015
Figure 16. Comparison of predicted and measured NOx under variable speed conditions.
Machines 10 00594 g016
Figure 17. Comparison of predicted and measured NOx under variable torque conditions.
Machines 10 00594 g017
Figure 18. Comparison of predicted with measured NOx under variable speed conditions. The blue dots show the intensity of predicted NOx around the error limits. The error limits range has been discussed in the above section.
Machines 10 00594 g018
Figure 19. Emissions measurement frequency response and virtual NOx sensor for speed input.
Machines 10 00594 g019
Figure 20. Comparison of predicted with measured NOx under variable torque conditions. The blue dots show the intensity of predicted NOx around the error limits. The error limits range has been discussed in the above section.
Machines 10 00594 g020
Figure 21. Frequency response of emissions measurement and virtual NOx sensor for torque input. The circle on the red line shows the predicted NOx peak at near the TDC at different frequency and the circle on the blue line shows measured NOx.
Machines 10 00594 g021
Table 1. Test engine specification.
Manufacturer/ModelDELUX Diesel Engine Co., Ltd. (Guangdong, China)
Engine typeDLH1122
Number of cylindersSingle
Combustion systemDirect injection
Bore/stroke122/120 mm
Compression ratio17.5:1
Cylinder linersCast iron replaceable wet liner
Rated power18/2300 kW/r/min
Publisher’s Note: MDPI stays neutral with regard to jurisdictional claims in published maps and institutional affiliations.

