
Design and Optimization of the Surface Texture at the Hydrostatic Bearing and the Spindle for High Precision Machining


1
School of Mechatronics Engineering, Harbin Institute of Technology, Harbin 150001, China
2
Department of Mechanical and Aerospace Engineering, Brunel University London, Uxbridge UB8 3PH, UK
*
Author to whom correspondence should be addressed.
Machines 2022, 10(9), 806; https://doi.org/10.3390/machines10090806
Submission received: 9 August 2022
/
Revised: 5 September 2022
/
Accepted: 7 September 2022
/
Published: 13 September 2022
(This article belongs to the Special Issue High Precision Abrasive Machining: Machines, Processes and Systems)
Abstract
:Hydrostatic bearing spindles are widely applied in high precision grinding and turning machines due to their good dynamic stability and rotational accuracy. However, under the condition of high-speed rotations, the heat generated by the friction of the oil film will cause the shear thinning effect. It not only reduces the rotation accuracy of the spindle but also reduces the service life of the spindle. The surface texture structure and configuration between the planes play the role of homogenizing oil film temperature and preventing the bearing surface wear caused by excessive concentration of temperature, which can change the relative motion from the inside of the oil film and thus improve the performance of the hydrostatic spindle more effectively. In this paper, the influence of the surface texture shape and height on the thrust bearing performance of the hydrostatic spindle is systematically investigated by comparative analysis. The CFD simulations are developed to analyze the computational results based on the theory of viscosity-temperature characteristics. The results show that when the height of the surface structure is 1 ~ 2 times the oil film thickness, the spindle bearing performance is the best. The average temperature in the bearing region is the lowest and the accuracy of the simulations was verified by experimental results.
1. Introduction
Nowadays, with the continuous improvement of the machining industry, the requirement for rotary precision is gradually improved. Especially, application in the precision CNC lathe or grinder hydrostatic spindle. Under the conditions of high-precision rotation and reduced temperature rise, the obtained higher film stiffness property becomes more and more important in hydrostatic bearings.
Many researchers have realized that surface structures have an influence on the surface contacts, in 1996 Etsion’s group began to study the surface microtexture configuration [1,2,3], and they used mathematical methods to investigate the hemispherical dimples property on the surface. They concluded that a proper texture size can increase the load capacity and local cavitation phenomenon was found in their many experiments and analyses. De Kraker et al. described the micro–macro multiscale method to explain the relationship between a surface pocket and a thrust face [4]. Saravi and Cheng reviewed various analysis methods for textured surfaces and particularly analyzed the surface microtexture modifying the Reynolds and Navier–Stokes equations. It is found that when the surfaces were in contact, the cavitation and pressure fluctuation were caused by the flow effect and extrusion effect in the microtexture [5]. Pei and Ma et al. [6,7] proposed the finite cell method to improve the computational efficiency and accuracy between the different scales of the bearing surface and surface texture. Brizmer et al. [8] based on cavitation and inertia influence, studied the micro-dimples with full bearing and a portion of the bearing; they found that the micro-dimples can improve the bearing capacity parallel thrust surface, and the height of the dimple is the same with an oil film. Tønder et al. [9,10] thought that the textured area has a larger average film thickness than the non-textured area, approximating a step or pocket can effectively improve the local carrying capacity. The textured areas have other advantages; they act as small reservoirs to reduce local wear. Brunetière et al. [11] studied the surface texture with numerical analysis, they concluded that compared to a rough surface, texture surfaces have different performances due to cavitation. When the texture density value is higher than 0.1, and the aspect ratio is higher than 0.04 there is a reduction in friction.
Therefore, most studies have contributed to finding optimal values for those parameters [12]. Yu et al. [13] studied three different microtexture shapes (circular, triangular and ellipsoidal). In the same texture area Atex, density and depth, they simulated a single cell of texture by the non-mass-conserving Reynolds equation. Compared with each other they found that the elliptical shapes obtain more load capacity. Qiu et al. [14] considered six different texture shapes (spherical, ellipsoidal, circular, elliptical, triangular, and chevron-shaped). They concluded that the ellipsoidal shape results in the highest load-carrying capacity, but considering the difficulty of processing, the circle microtexture dimple is preferred. However optimal geometry and density are found to be almost independent of the operating conditions. Nanbu and Shen et al. [15,16] studied different texture bottom shapes by applying the elasto-hydrodynamic lubrication method; they found that the micro steps increase film thickness.
With computing ability and accuracy improved, more and more scholars used computational fluid dynamics (CFD) methods for research [17,18,19]. Thus, some parameter conditions should not be ignored, such as inertial force, surface texture, micro vortex and viscosity-temperature characteristics. Therefore, the problems existing in the actual working conditions can be explained. Shi et al. [20] investigated the effects of groove textures on fully lubricated sliding with a two-dimensional CFD model, they found that increasing the number of textured and reducing the groove size enhanced the overall load capacity but had little effect on the friction coefficient and temperature. Dobrica and Fillon et al. [21] found that it is necessary to consider the influence of inertia on the thrust bearing performance when calculating the relative motion of the two texture surfaces. Buscaglia et al. [22,23] studied the static characteristics effect of thrust bearing with periodic texture, the structural parameters of the thrust bearing were optimized and the influence of the surface texture on the bearing performance was discussed by using the CFD methods. However, most scholars only focus on the improvement of bearing capacity, but the influence of the viscosity and temperature distribution characteristics on the bearing performance is not considered.
In order to improve bearing performance and reduce deformation and wear caused by high local temperature, this paper systematically investigated the effects of surface texture on the performance of the hydrostatic thrust bearing and the corresponding hydrostatic spindle for an ultra-precision grinding machine. Considering the influence of the thermo-characteristics on the thrust bearing, the shape and size of the surface texture on thrust bearing surfaces are optimized by the simulation results, and further supported and evidenced by some experimental results and application trials.
2. Thrust Bearing of the Ultra-Precision Spindle and Its Geometry
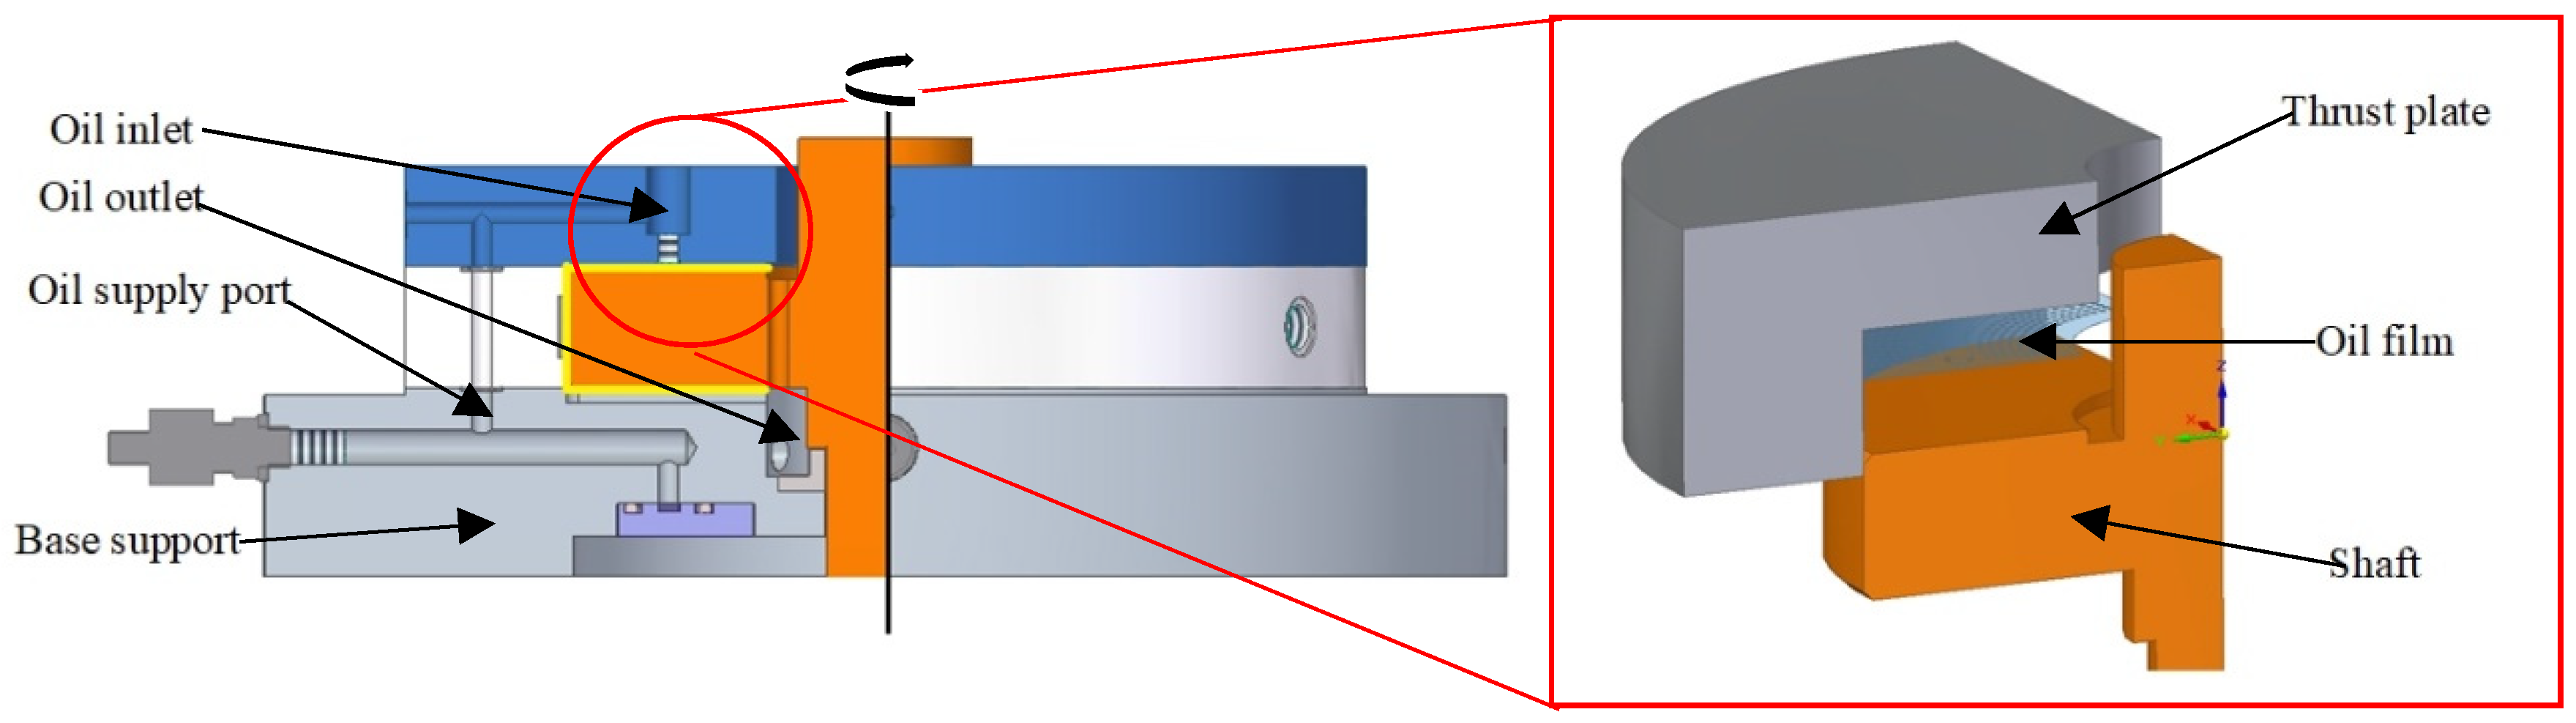
The subject of investigation is the thrust face of a hydrostatic bearing in an ultra-precision grinder spindle; the bearing of the present study is a four-pads thrust bearing, shown in Figure 1. The initial surfaces of the rotor and the pads are parallel, the upper and lower surfaces are relatively static; they can support the hydrostatic bearing. The 2 MPa oil is supplied to the pad through the oil supply port, and the oil film thickness is formed between the thrust pad and the spindle to play the role of lubrication and support.
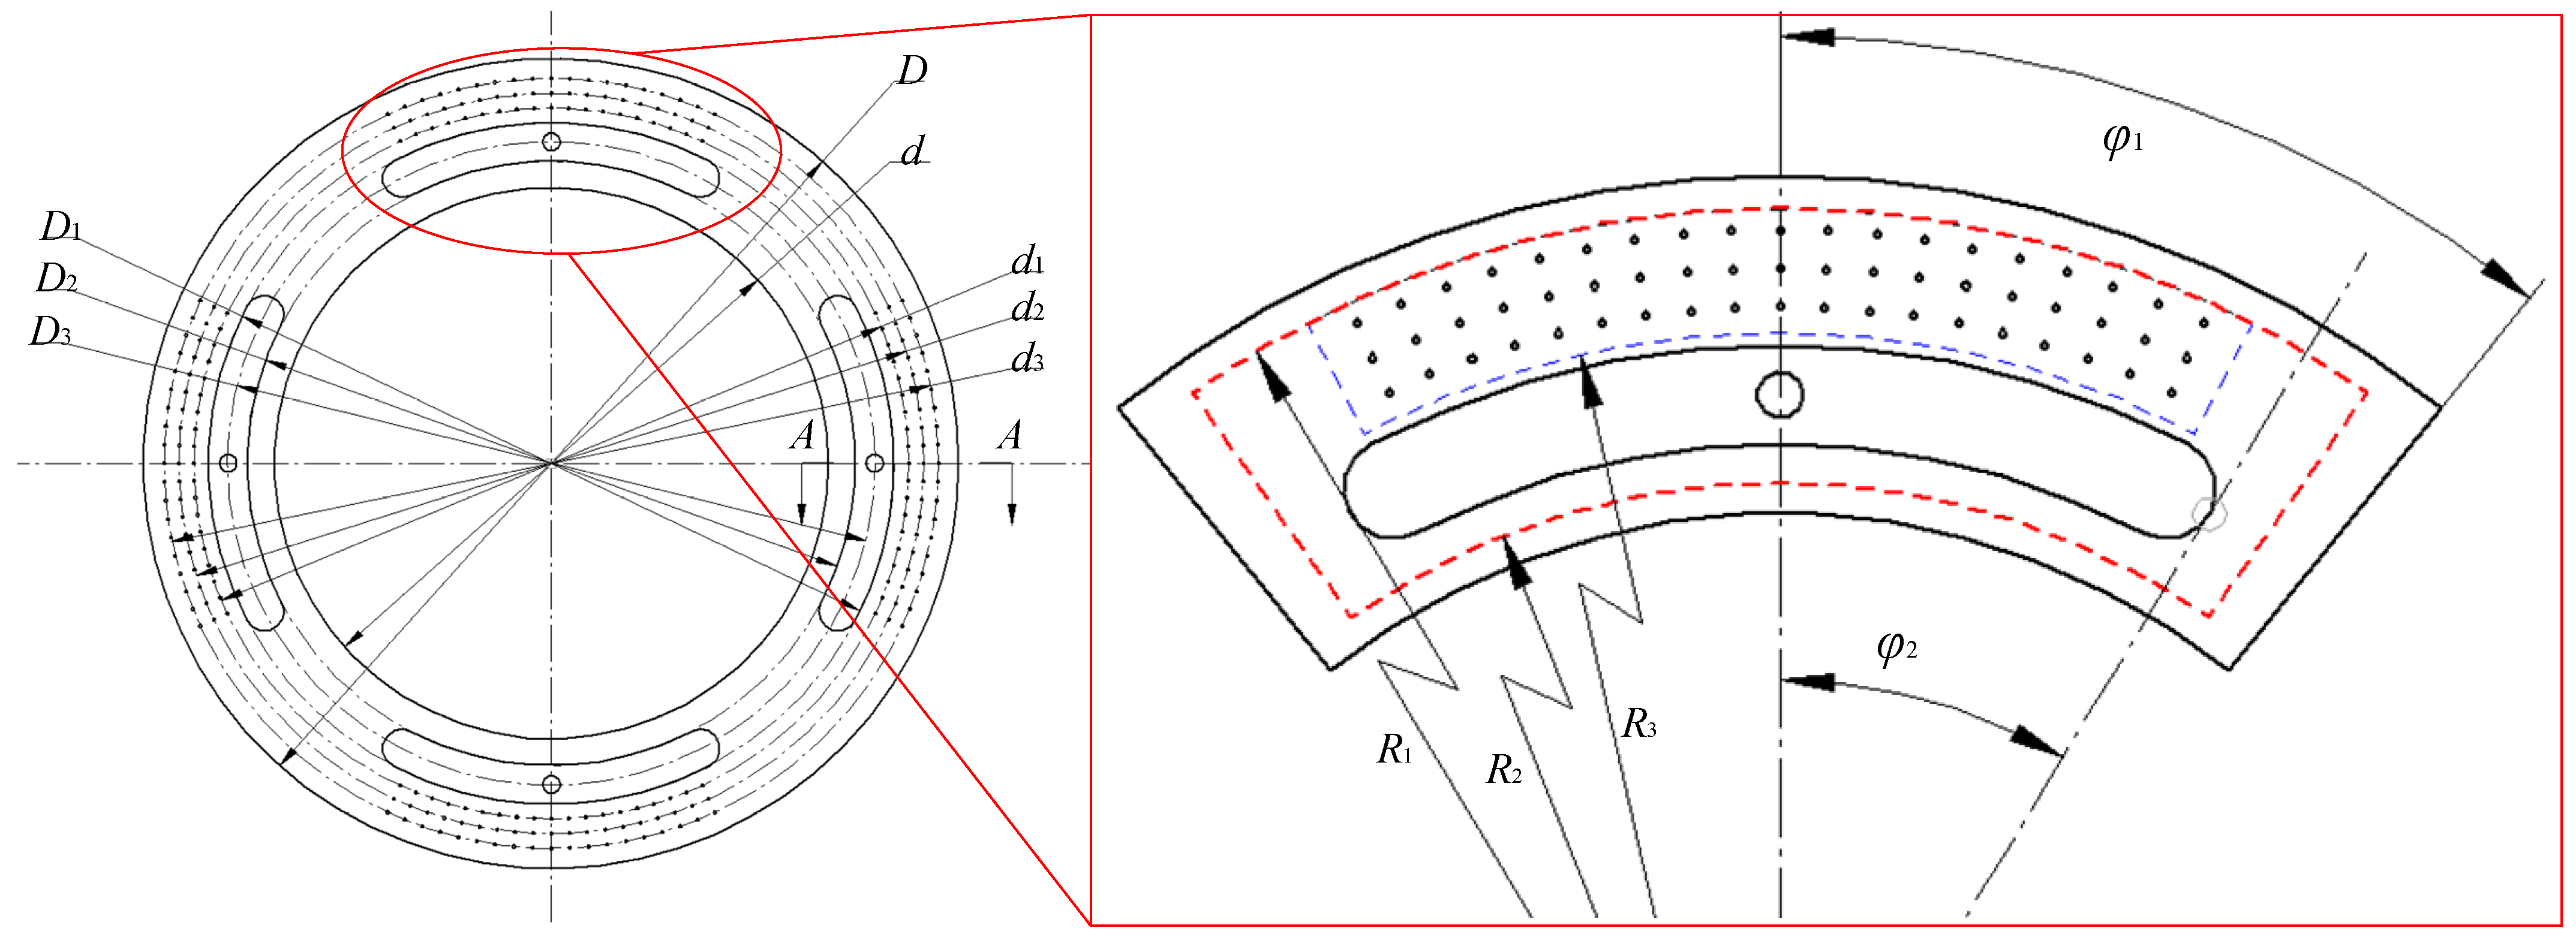
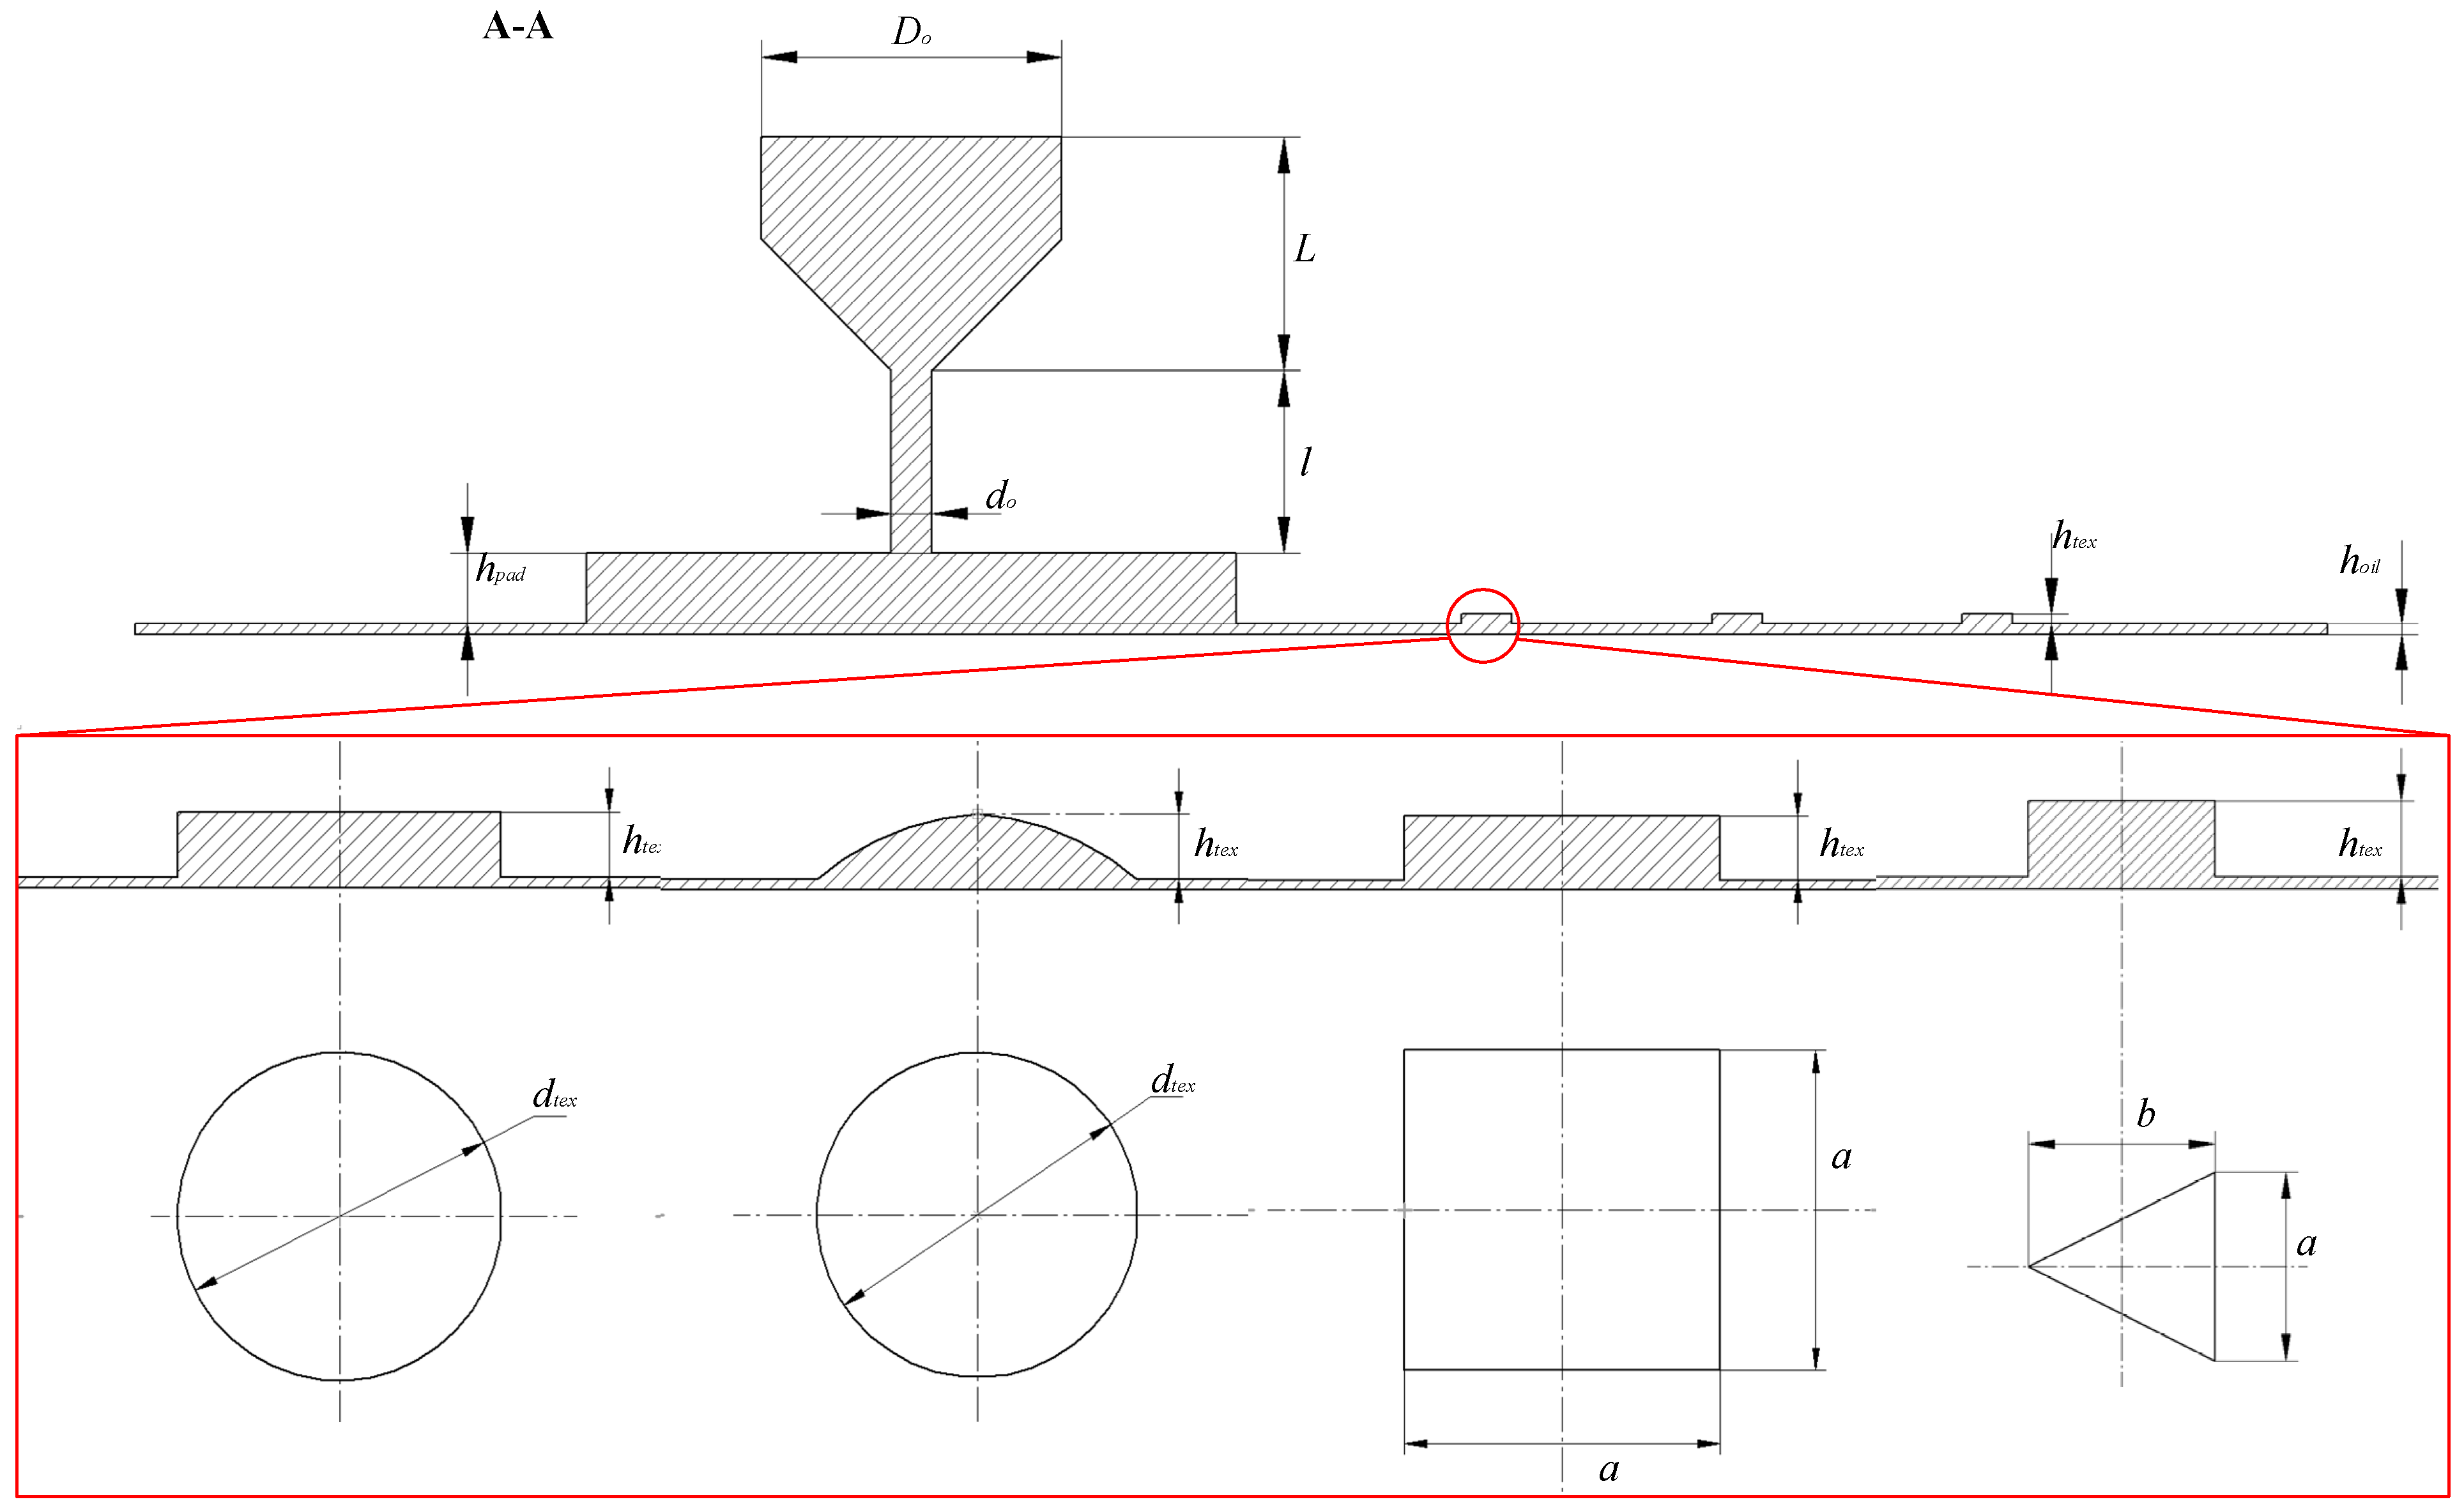
We study the influence of different configurations of the micro-texture of the thrust surface on the spindle performance, especially temperature. In this paper, four different structural forms (square, cylinder, dimple, and isosceles triangle) are used for thrust surfaces, as shown in Figure 2 and Figure 3. The thickness is mainly divided into three parts the oil pad thickness (hpad) is 0.7 mm the oil film thickness (hoil) is 0.02 mm, and the thickness of micro-texture (htex) is 0.02 to 0.1 mm. In this paper four different surface microstructures were discussed, the cylinder texture and the dimple texture diameter (dtex) are 1 mm, the square texture side length (a) is 1 mm, the isosceles triangle texture bottom side length (a) is 0.5 mm and height (b) is 1 mm.
The outer diameter of the thrust bearing (D) is 136.8 mm, the inner diameter of the thrust bearing (d) is 93 mm. As the spindle is rotating at high speed, the oil inlet and oil pad are biased 25% toward the center. the outer diameter of the annular recess (D1) is 115 mm, and the inner diameter of the annular recess (D2) is 102 mm. The oil inlet diameter (D0) is 3 mm, the oil inlet length (L) is 2.5 mm, orifice length (l) is 2 mm.
In the enlarged view of the texture area which is shown in Figure 2, the red area is the effective bearing area, and the blue area is the textured area. φ1 is the angle between the pressure inlet and the 1/4 oil film boundary, and φ2 is the angle between the pressure inlet and the oil pad boundary. R1 is the outer radius of the effective bearing area, R2 is the inner radius of the effective bearing area, and R3 is the inner radius of the textured area.
3. Surface Texture Modeling and Simulation Analysis
3.1. Governing Equations
The governing equation for the characteristics of fluid flow can be explained by the conservation form of the fluid flow, under gravity are [24]:
Mass conservation equation:
Momentum equation:
Energy equation:
where V is the fluid velocity vector, p is the oil pressure (MPa) and h is the oil film height. T is the oil temperature (K), c is the oil-specific heat capacity (J/kg∙K), and λ is the oil thermal conductivity of the pad.
The hydrostatic bearing capacity equation is:
Considering the variation in density and viscosity under viscosity-temperature characteristics, the density and viscosity of a fluid are affected when the pressure and temperature change. There is a linear variation as presented [25,26], the relation can be written as:
ρ is the density with pressure and temperature change, ρ0 = 869 kg/m3 is the initial density of oil. η is the oil viscosity at any time with the change of working conditions, η0 = m2/s is the viscosity of the oil at t = t0, k is the coefficient of viscosity (k = 0.6), t is the temperature under actual conditions, t0 is the initial temperature, in this simulation we take 296 K.
In order to study the influence of the surface microstructure on the bearing capacity and temperature of the bearing surface, the effective bearing area needs to be determined. However, due to the smaller area, the equivalent ring-bearing area is more appropriate. Because the thrust surface is in the form of four oil pads, the equivalent area of 1/4 oil film can be written as:
3.2. Microtexture Modelling Setup
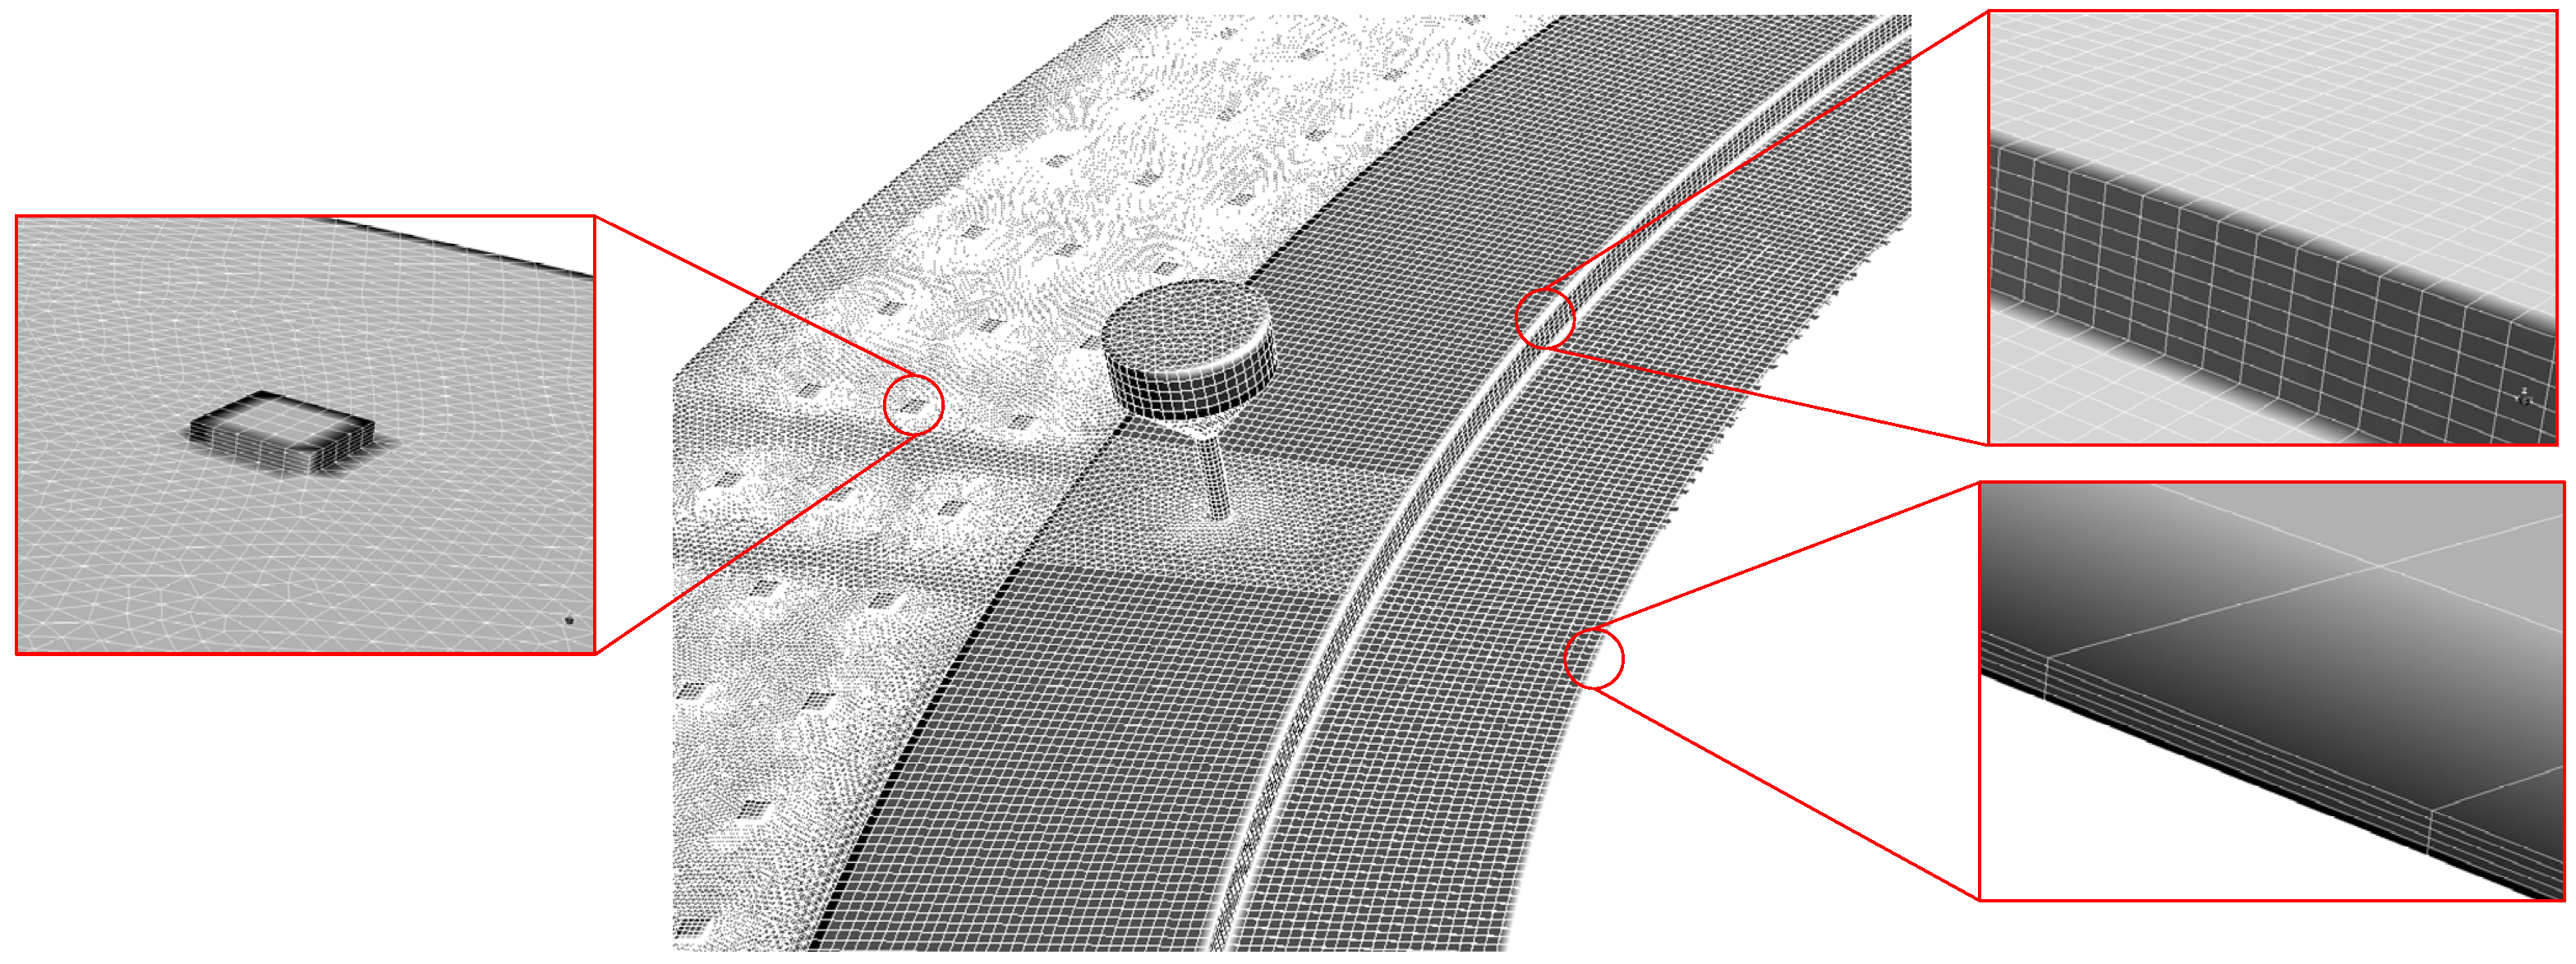
On a macro scale, the oil film is a continuous smooth parallel plane, The results of the experiment and simulation are in good agreement with the viscosity-temperature characteristic model with respect to the predicted load carrying capacity [27,28]. In order to further study the influence of surface microtexture on oil temperature, we set up the microtextures in the bearing oil film with the largest effective carrying area as shown in Figure 2 and Figure 3, which is also the greatest temperature change. The diameter of the microtexture array is d1, d2, and d3. Compared with the oil pad thickness, the oil film and surface microtexture can be identified as micro scale. In general, for the numerical methods, the homogenization model is used to simplify, it is not able to accurately calculate the surface microtexture [29]. In order to accurately calculate the properties of the thrust bearing, different mesh density is used in the oil pad, oil film and surface microtexture, as shown in Figure 4.
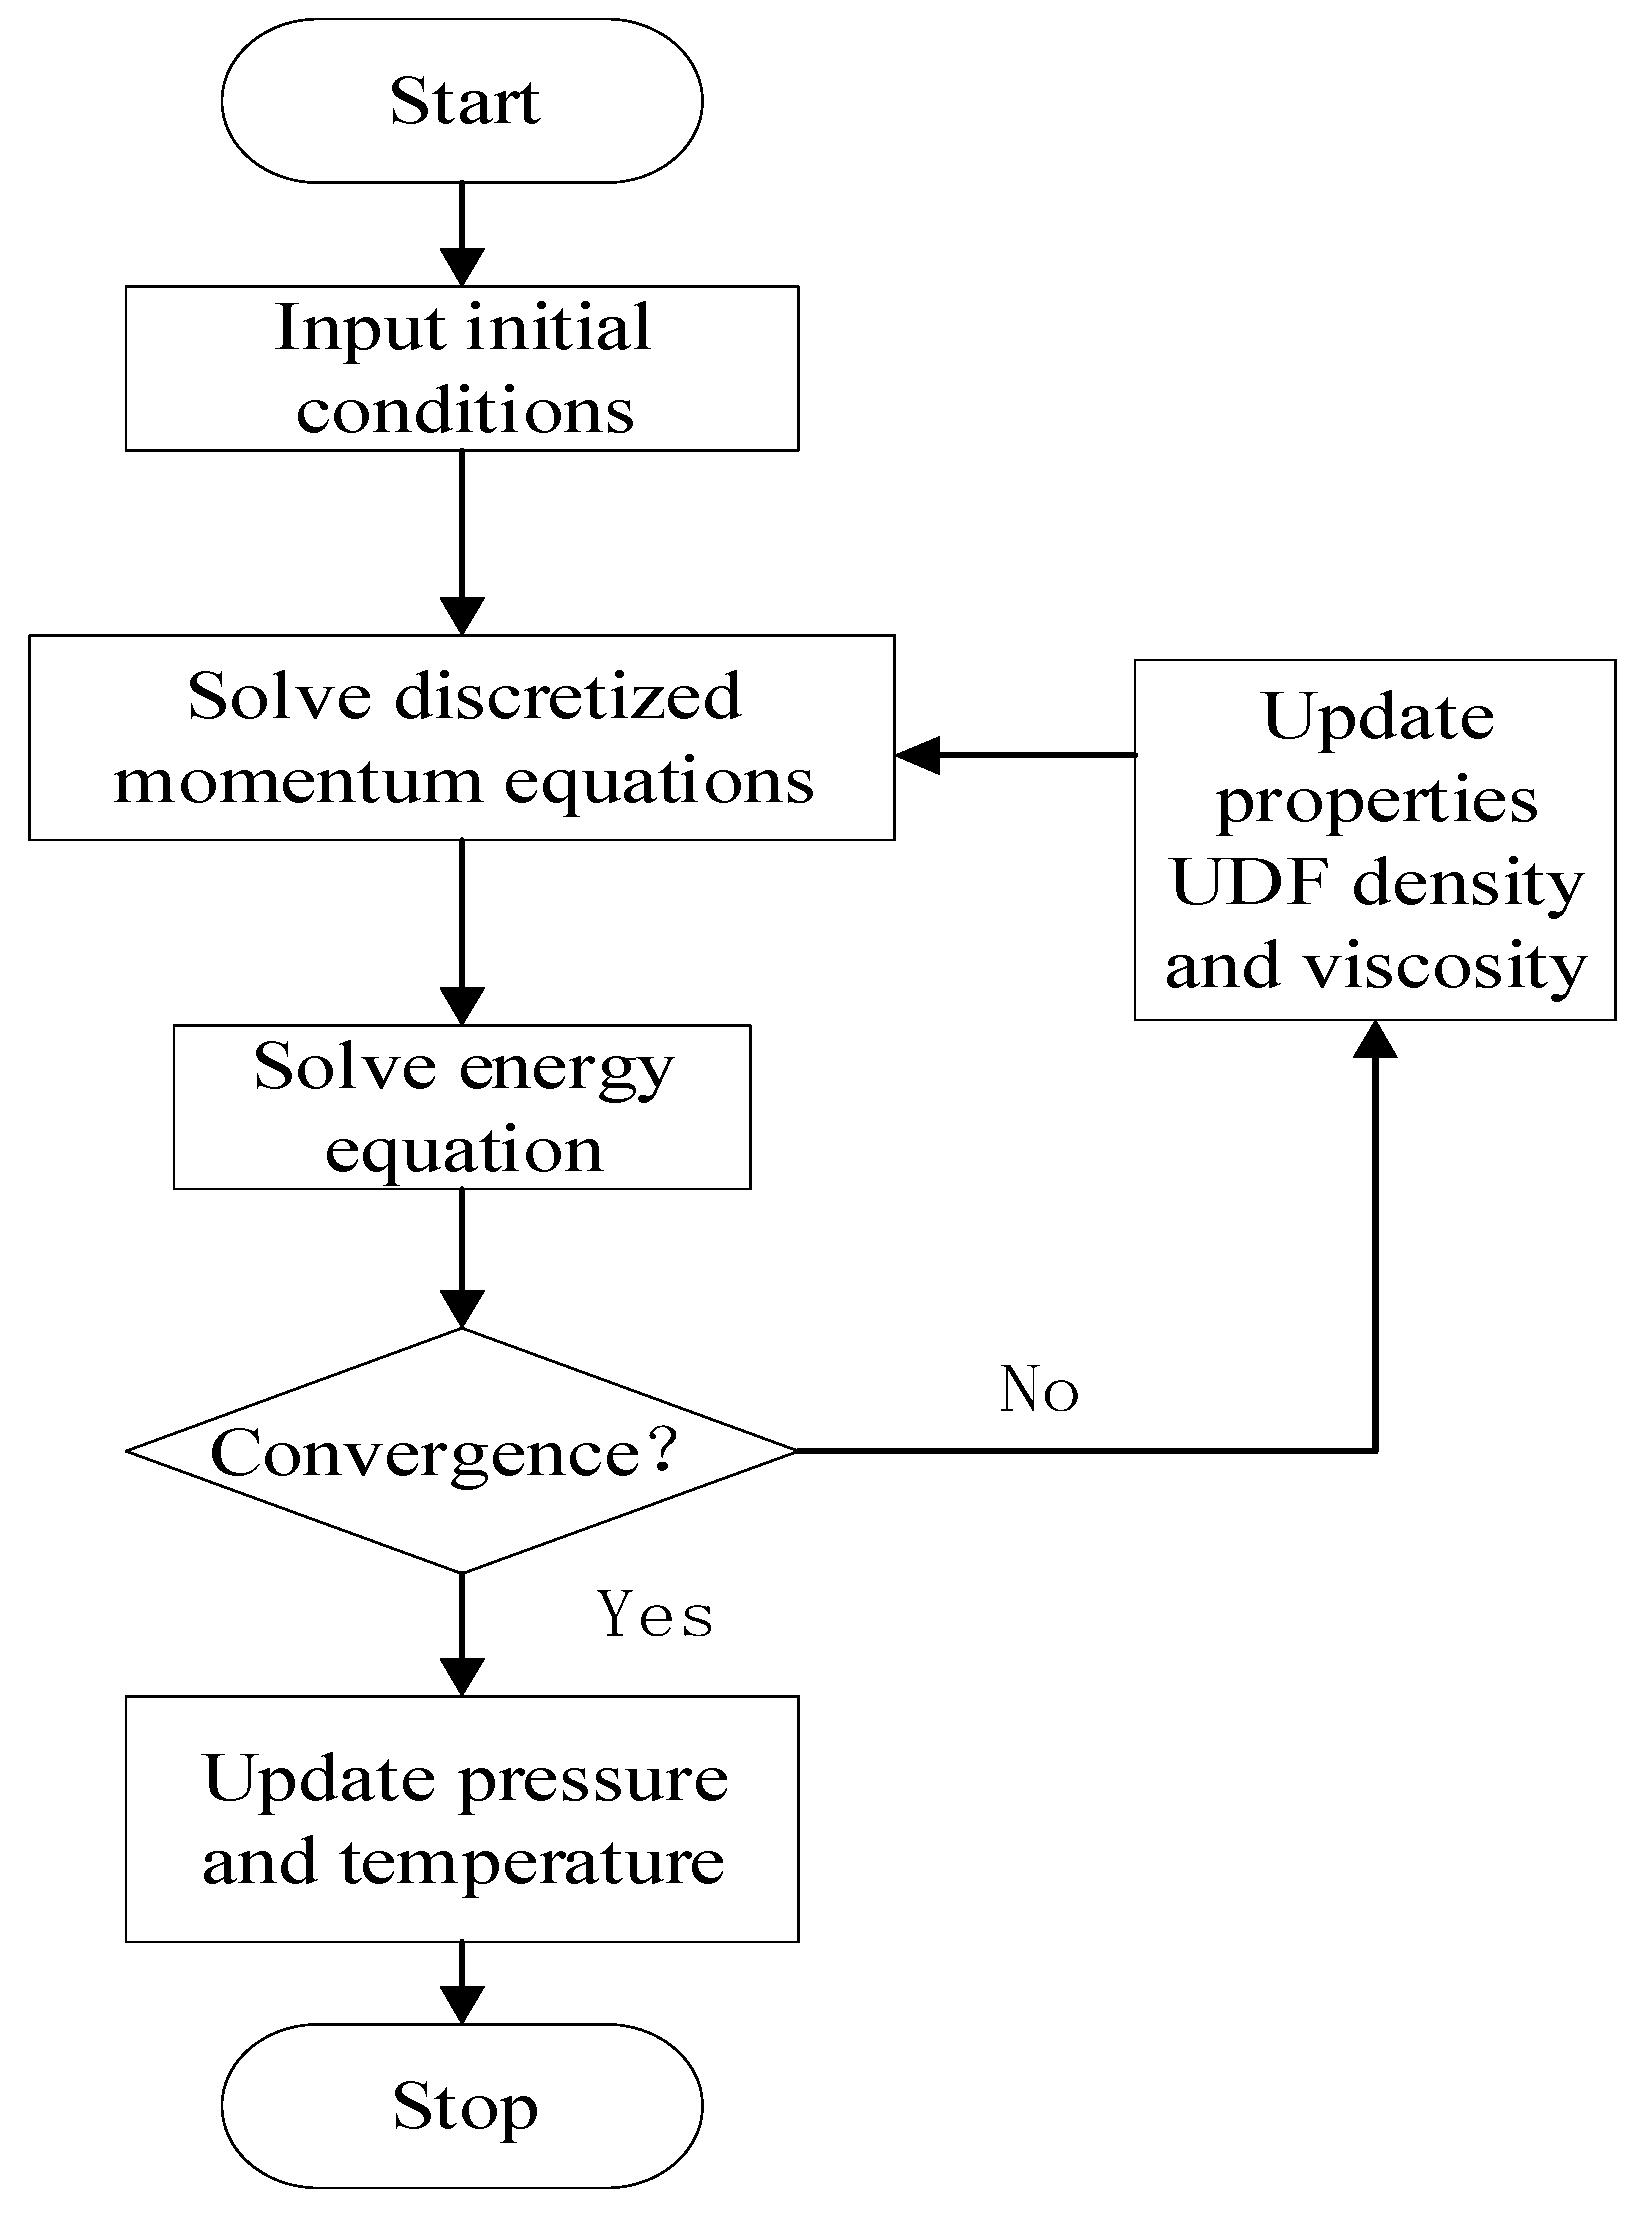
In order to calculate the effect of the microtexture on spindle performance more accurately, a CFD software FLUENT is used approach to achieve more precise results. The 3D Navier–Stokes equations can be solved numerically. the viscosity and density are modified by UDFs for temperature change and the calculation flow chart is shown in Figure 5. According to the concept of stiffness, when the oil film thickness is reduced by 1 μm, the bearing capacity calculated can be reduced by the existing calculated bearing capacity, and the overall oil film stiffness can be calculated.
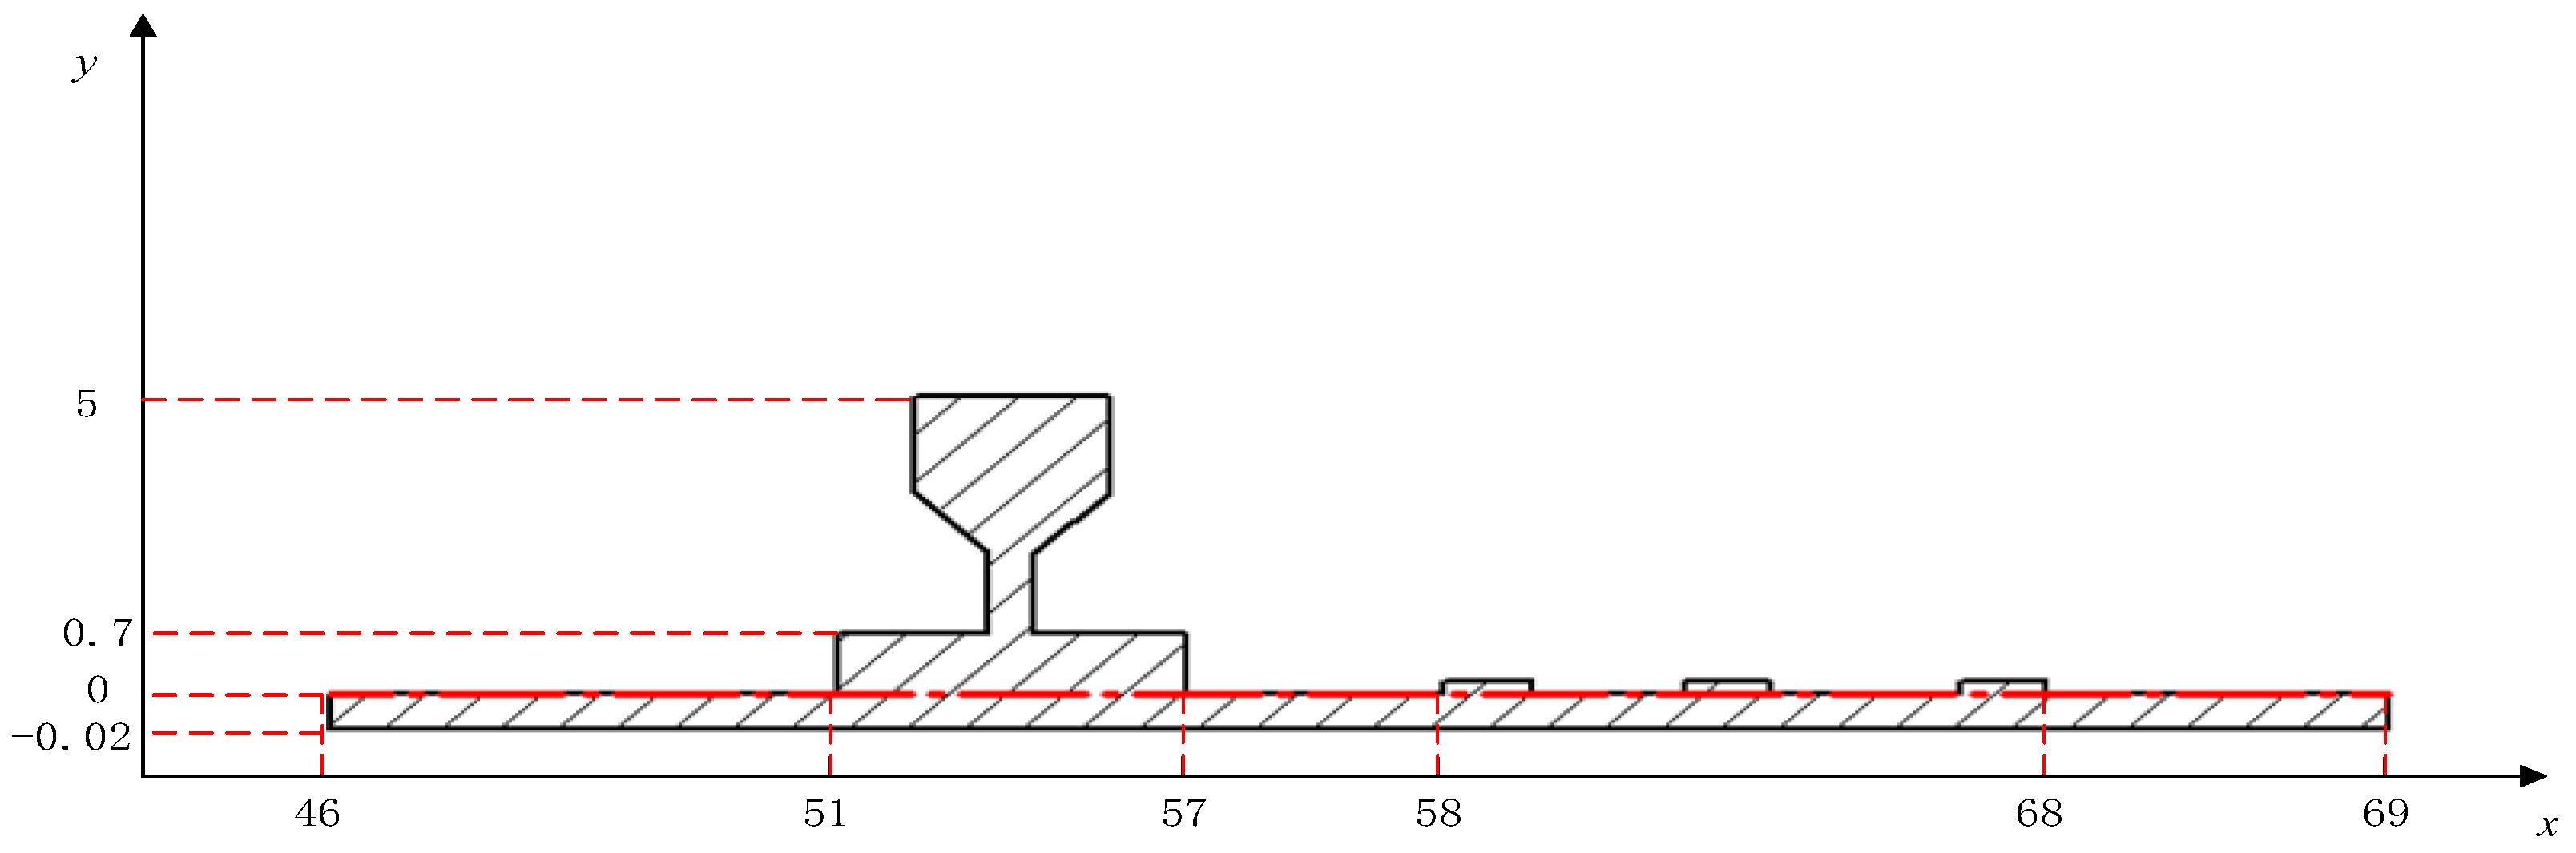
In order to accurately study the oil film performance in the effective bearing area, this paper takes a node on the abscissa of the A-A profile every 1 mm, as shown in Figure 6. Node 46–51 is the inner circular bearing area of the thrust oil film, node 51–57 is the oil pad position, node 59–65 is the microtextured area (effective bearing area), node 65–69 is the outer circular bearing area.
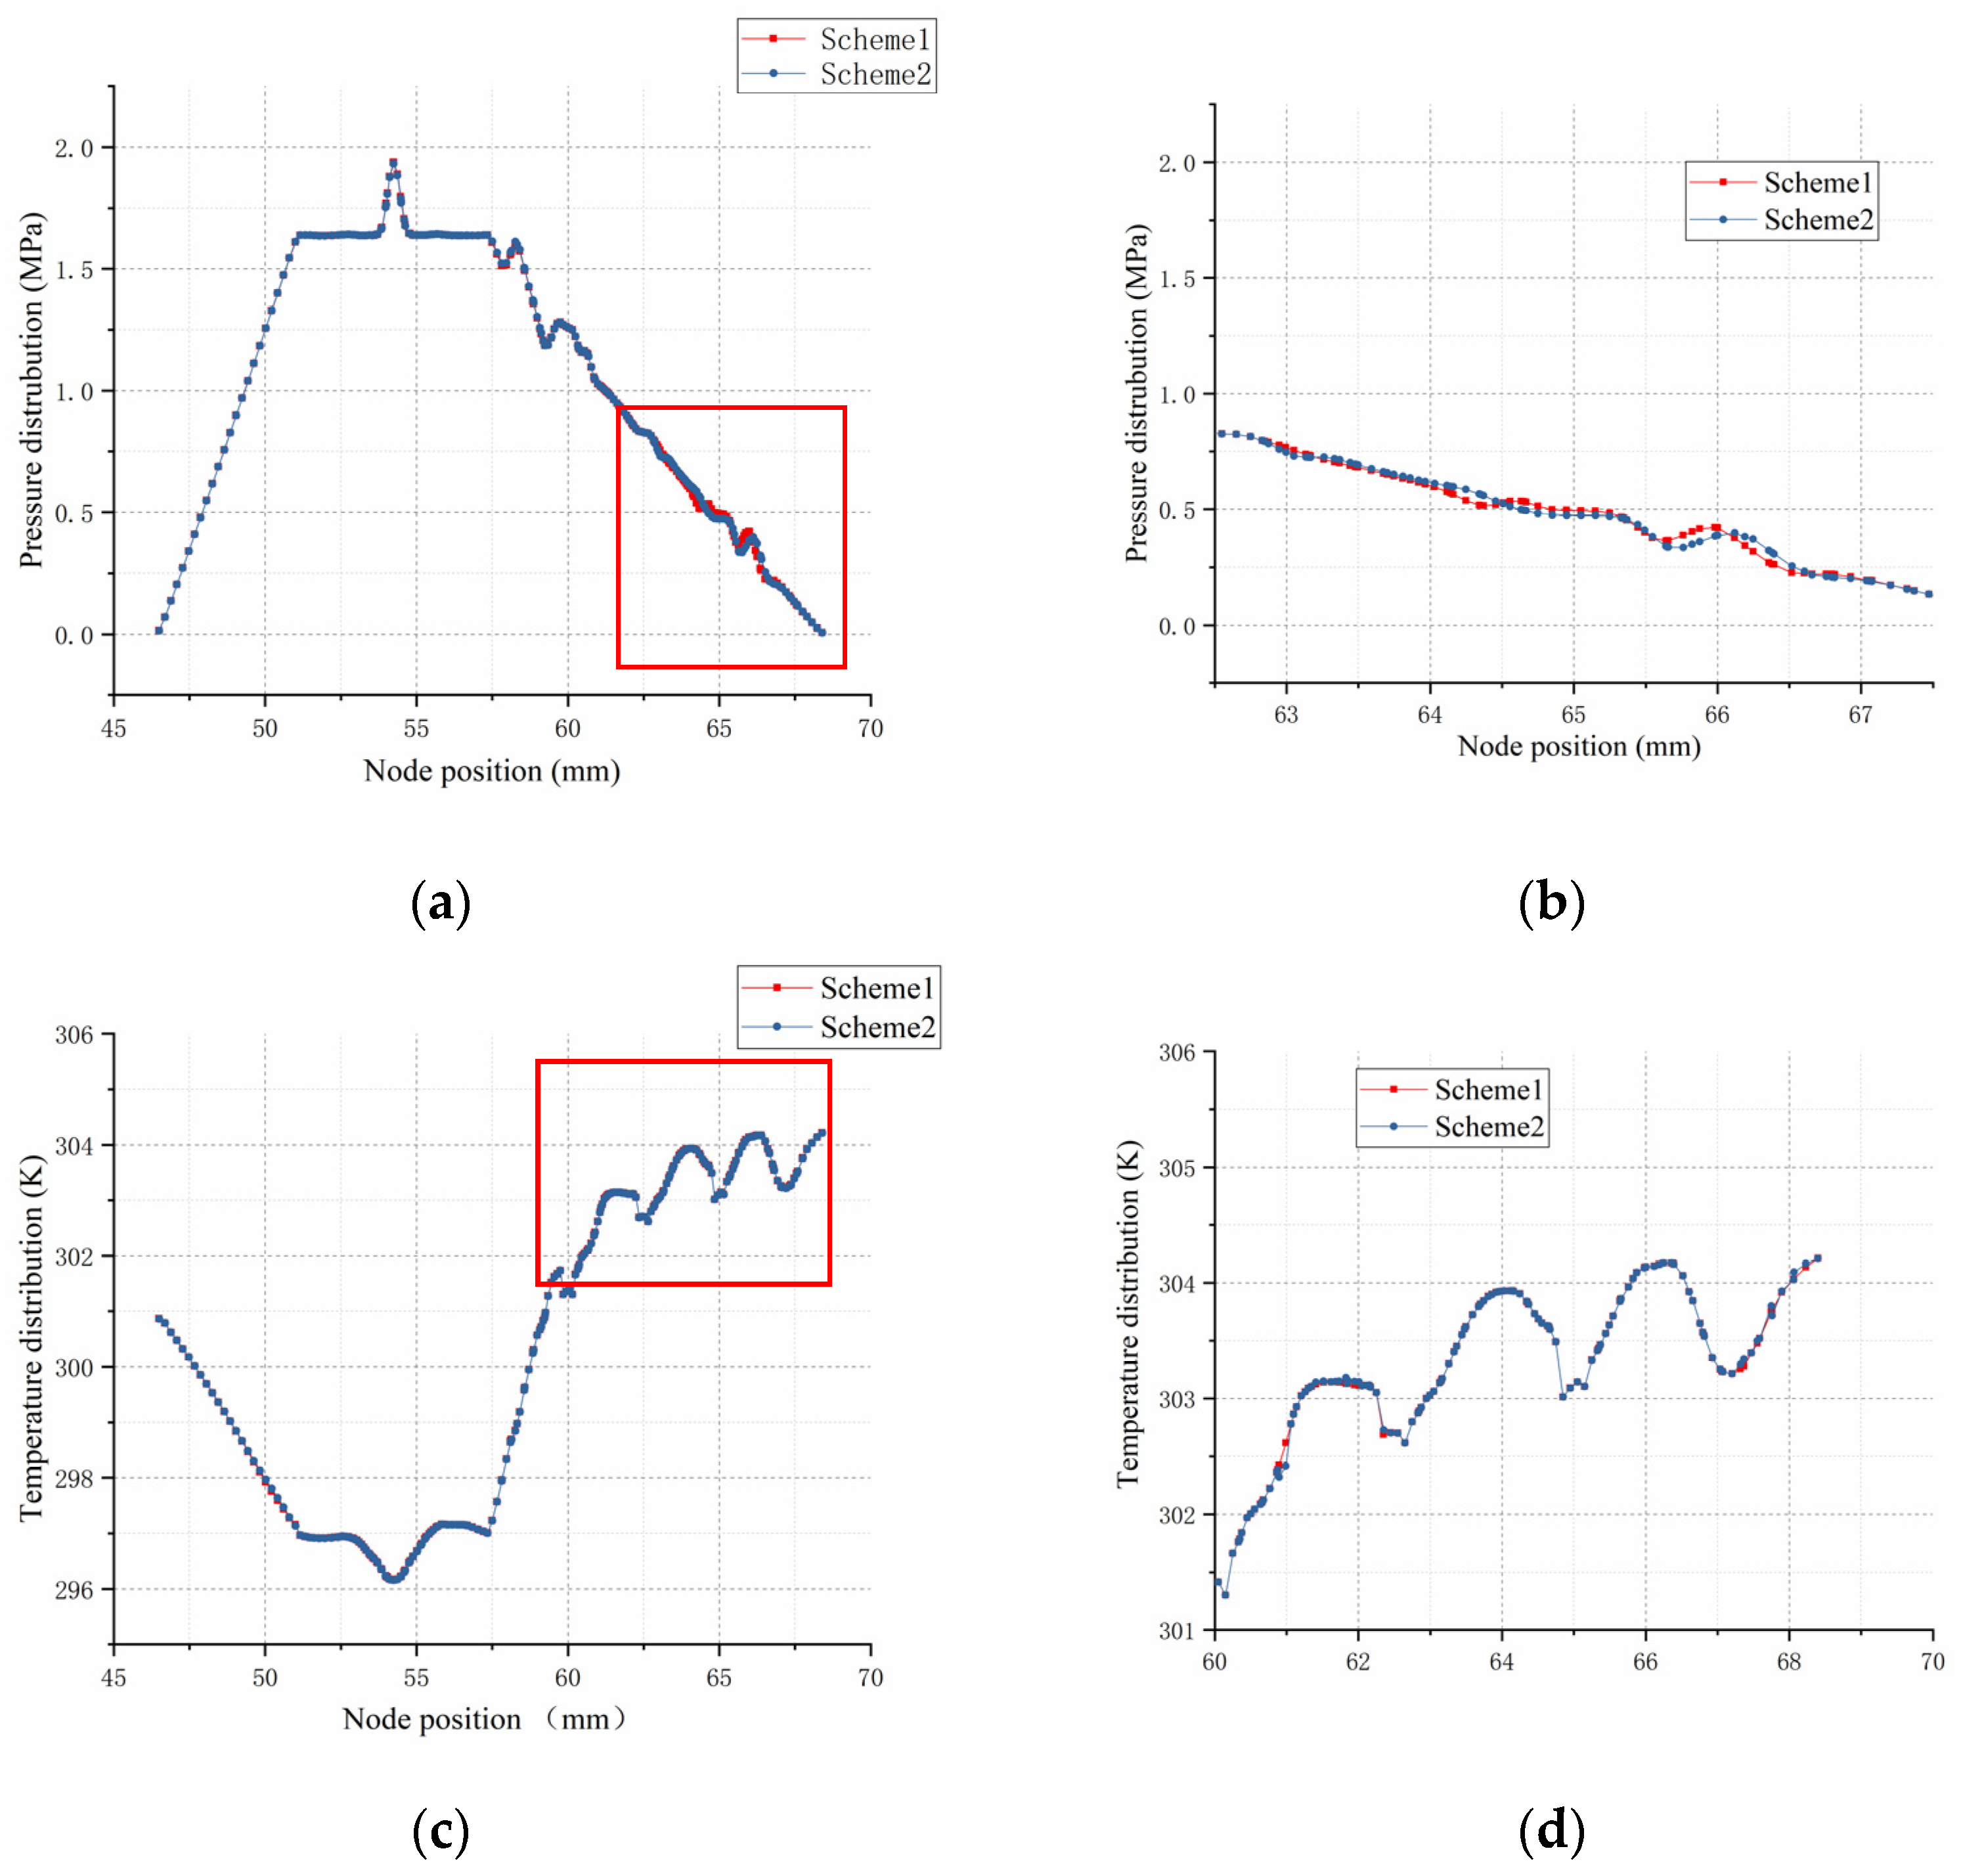
According to the microtexture dimensional parameters and the operating conditions of the hydrostatic thrust bearing. In order to verify the accuracy of calculation and grid independently, two different mesh numbers are used to compare the same CFD model; the htex = 0.02 mm and the rotational speed is 2000 rad/min. Scheme 1 has 1,561,862 cells and 1,171,396 nodes, and Scheme 2 has 3,132,840 cells and 2,217,748 nodes. The effect of the mesh numbers on the pressure and temperature along the line of the A-A slice face is illustrated in Figure 7 and the results are shown in Table 1.
Comparisons between the results of load capacity, temperature, mass flow rate and stiffness of the oil film with two different meshing schemes were made. It is not hard to see from the results that the differences in node pressure and other performance errors are not obvious by increasing the mesh number. It is indicated that the mesh numbers of Scheme 1 are enough, and consequently, the same meshing scheme of case 1 is used for all the CFD models in the current study.
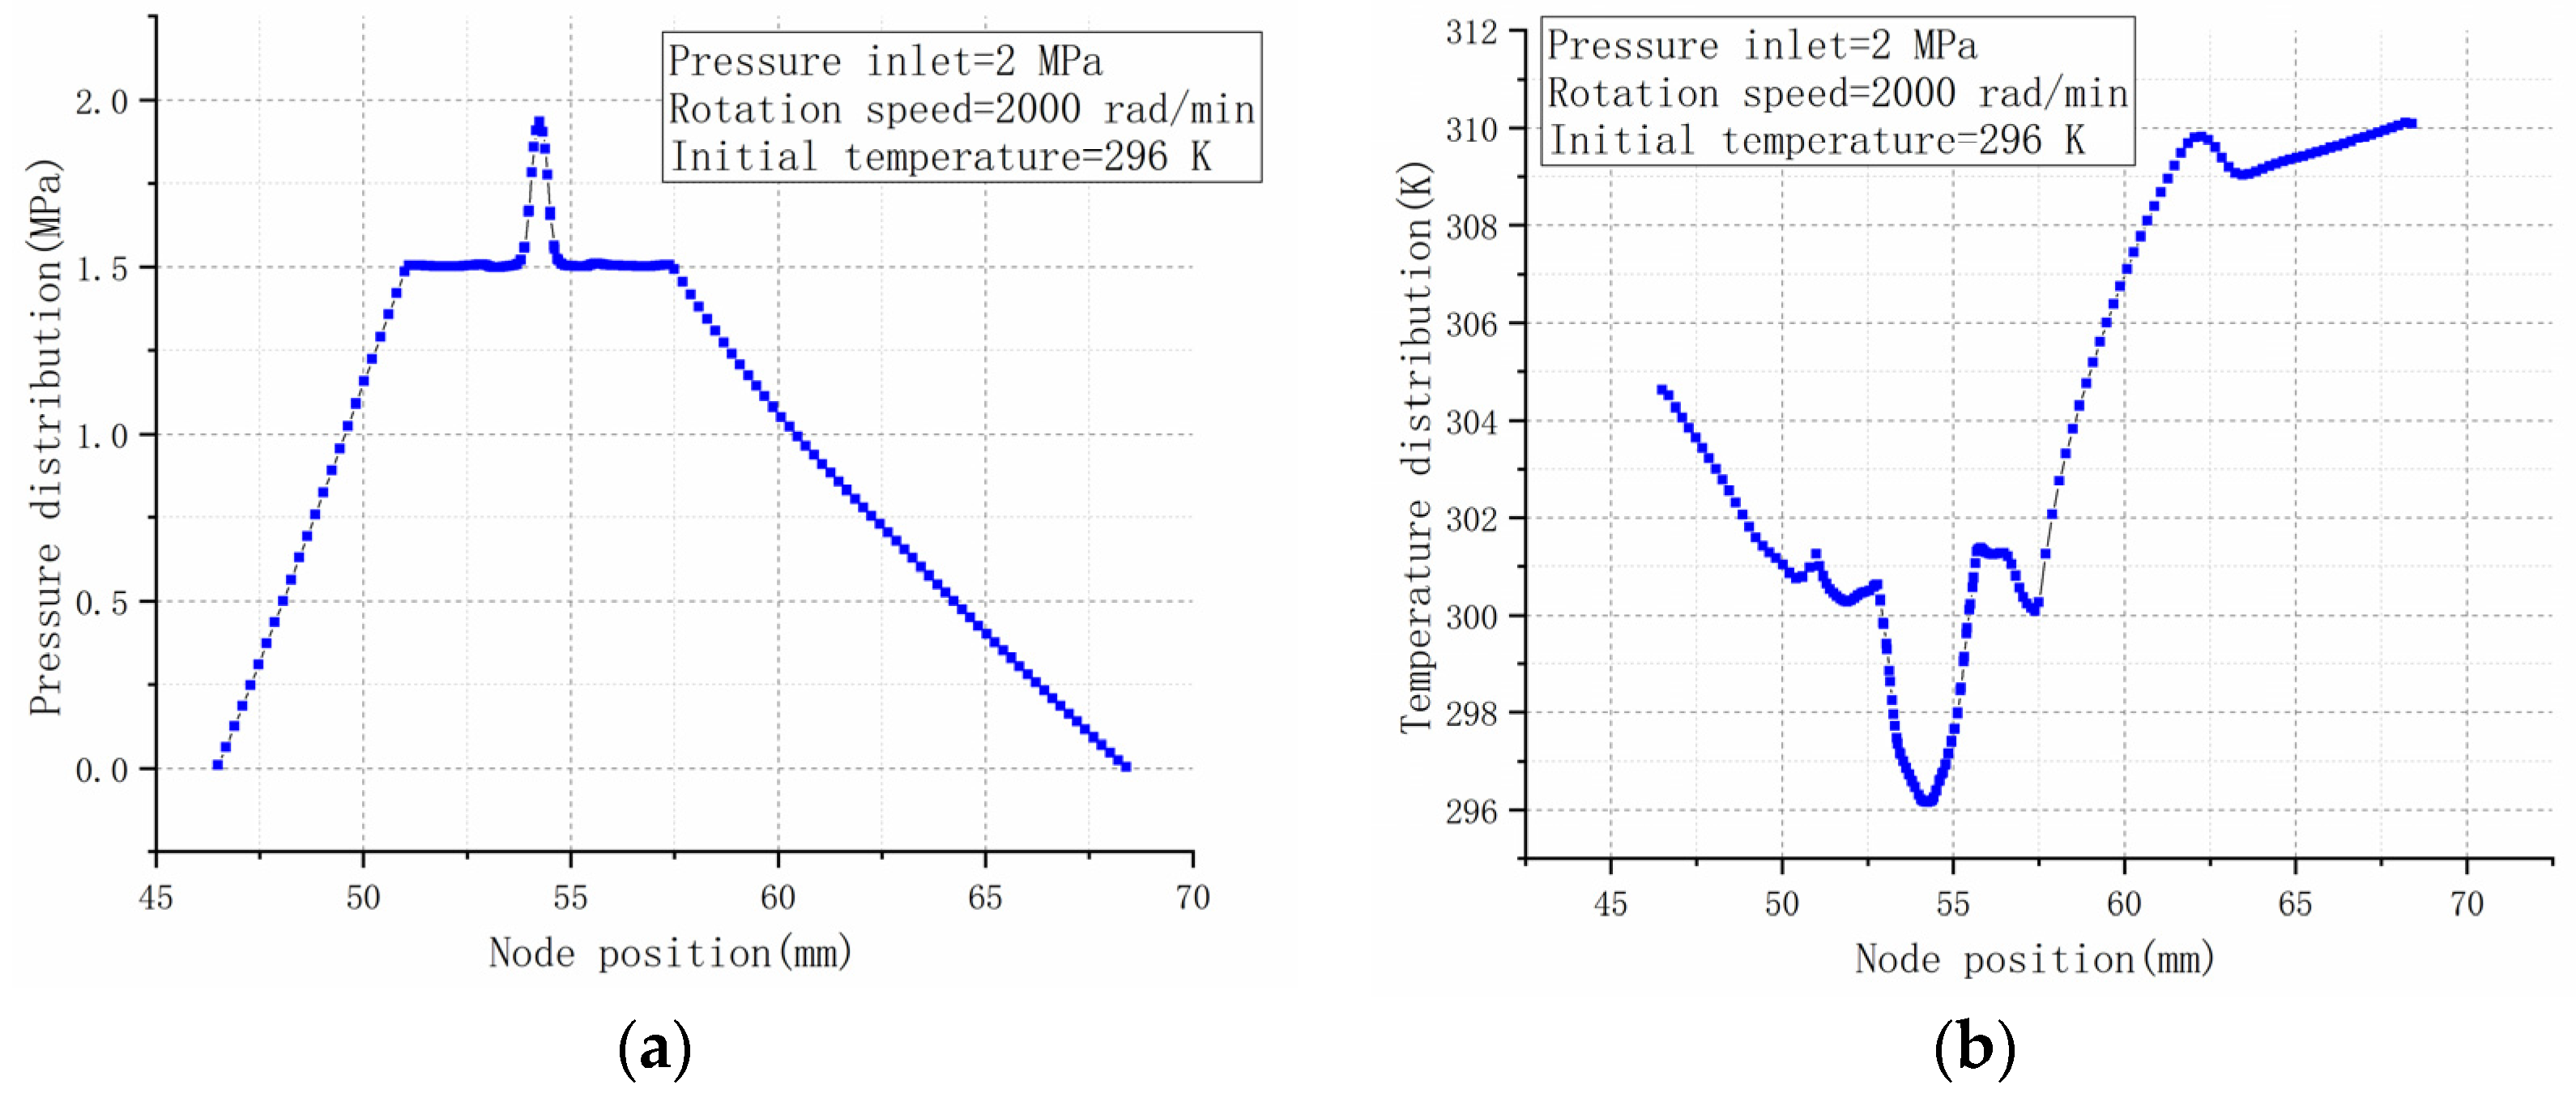
According to the results shown in Figure 8, the surface microtexture has a significant effect on the bearing capacity and temperature change of the hydrostatic spindle; it can make the oil film load area form a gradient fluctuation, thus reducing the continuous rise of the oil film temperature, and also improve the liquid static pressure spindle performance compared with the same operating condition, compared to previous calculations and experiments [27]. The average load capacity is 1419.32 N, 9.1% lower than with the microtexture bearing; the average temperature is 301.16 K, 2.1% higher than with the microtexture bearing. In this paper, the CFD software Fluent is employed for calculation; the microtexture shape and structure size of the surface are varied for analysis and studied under the same operating conditions. We discuss the CFD simulation results on the effects of the effective bearing area of various microtextures.
4. Results and Discussion
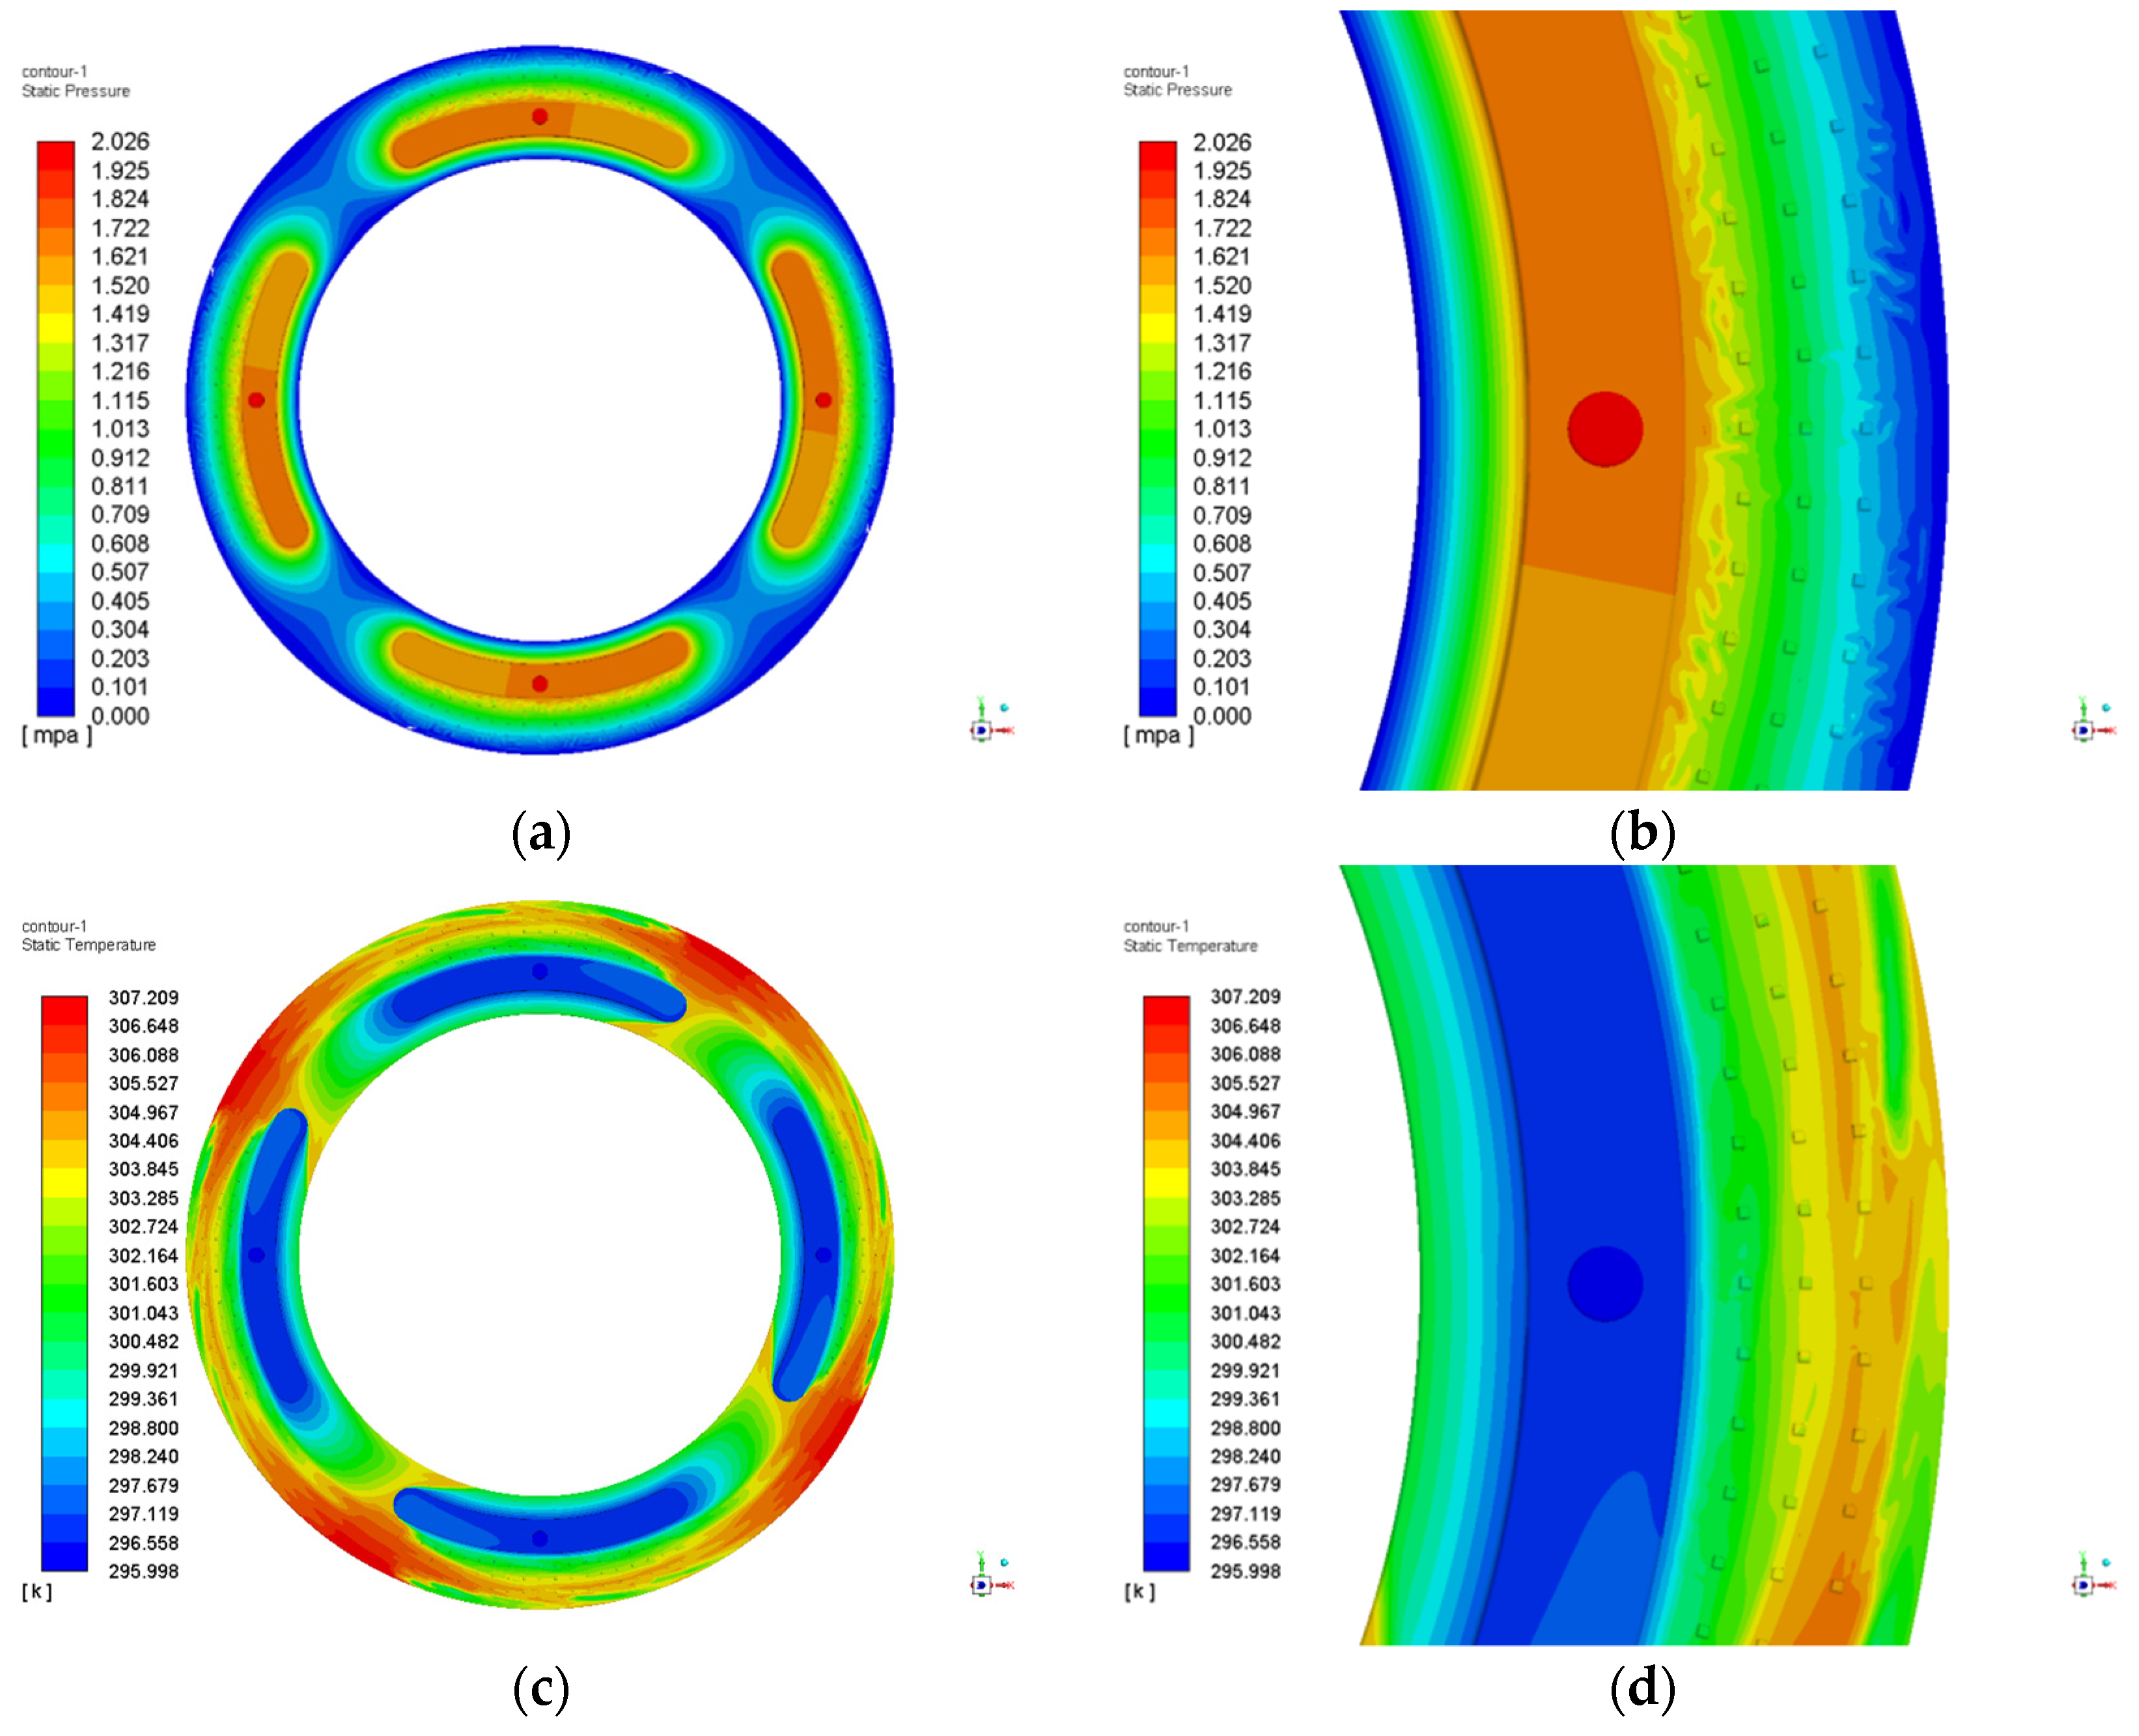
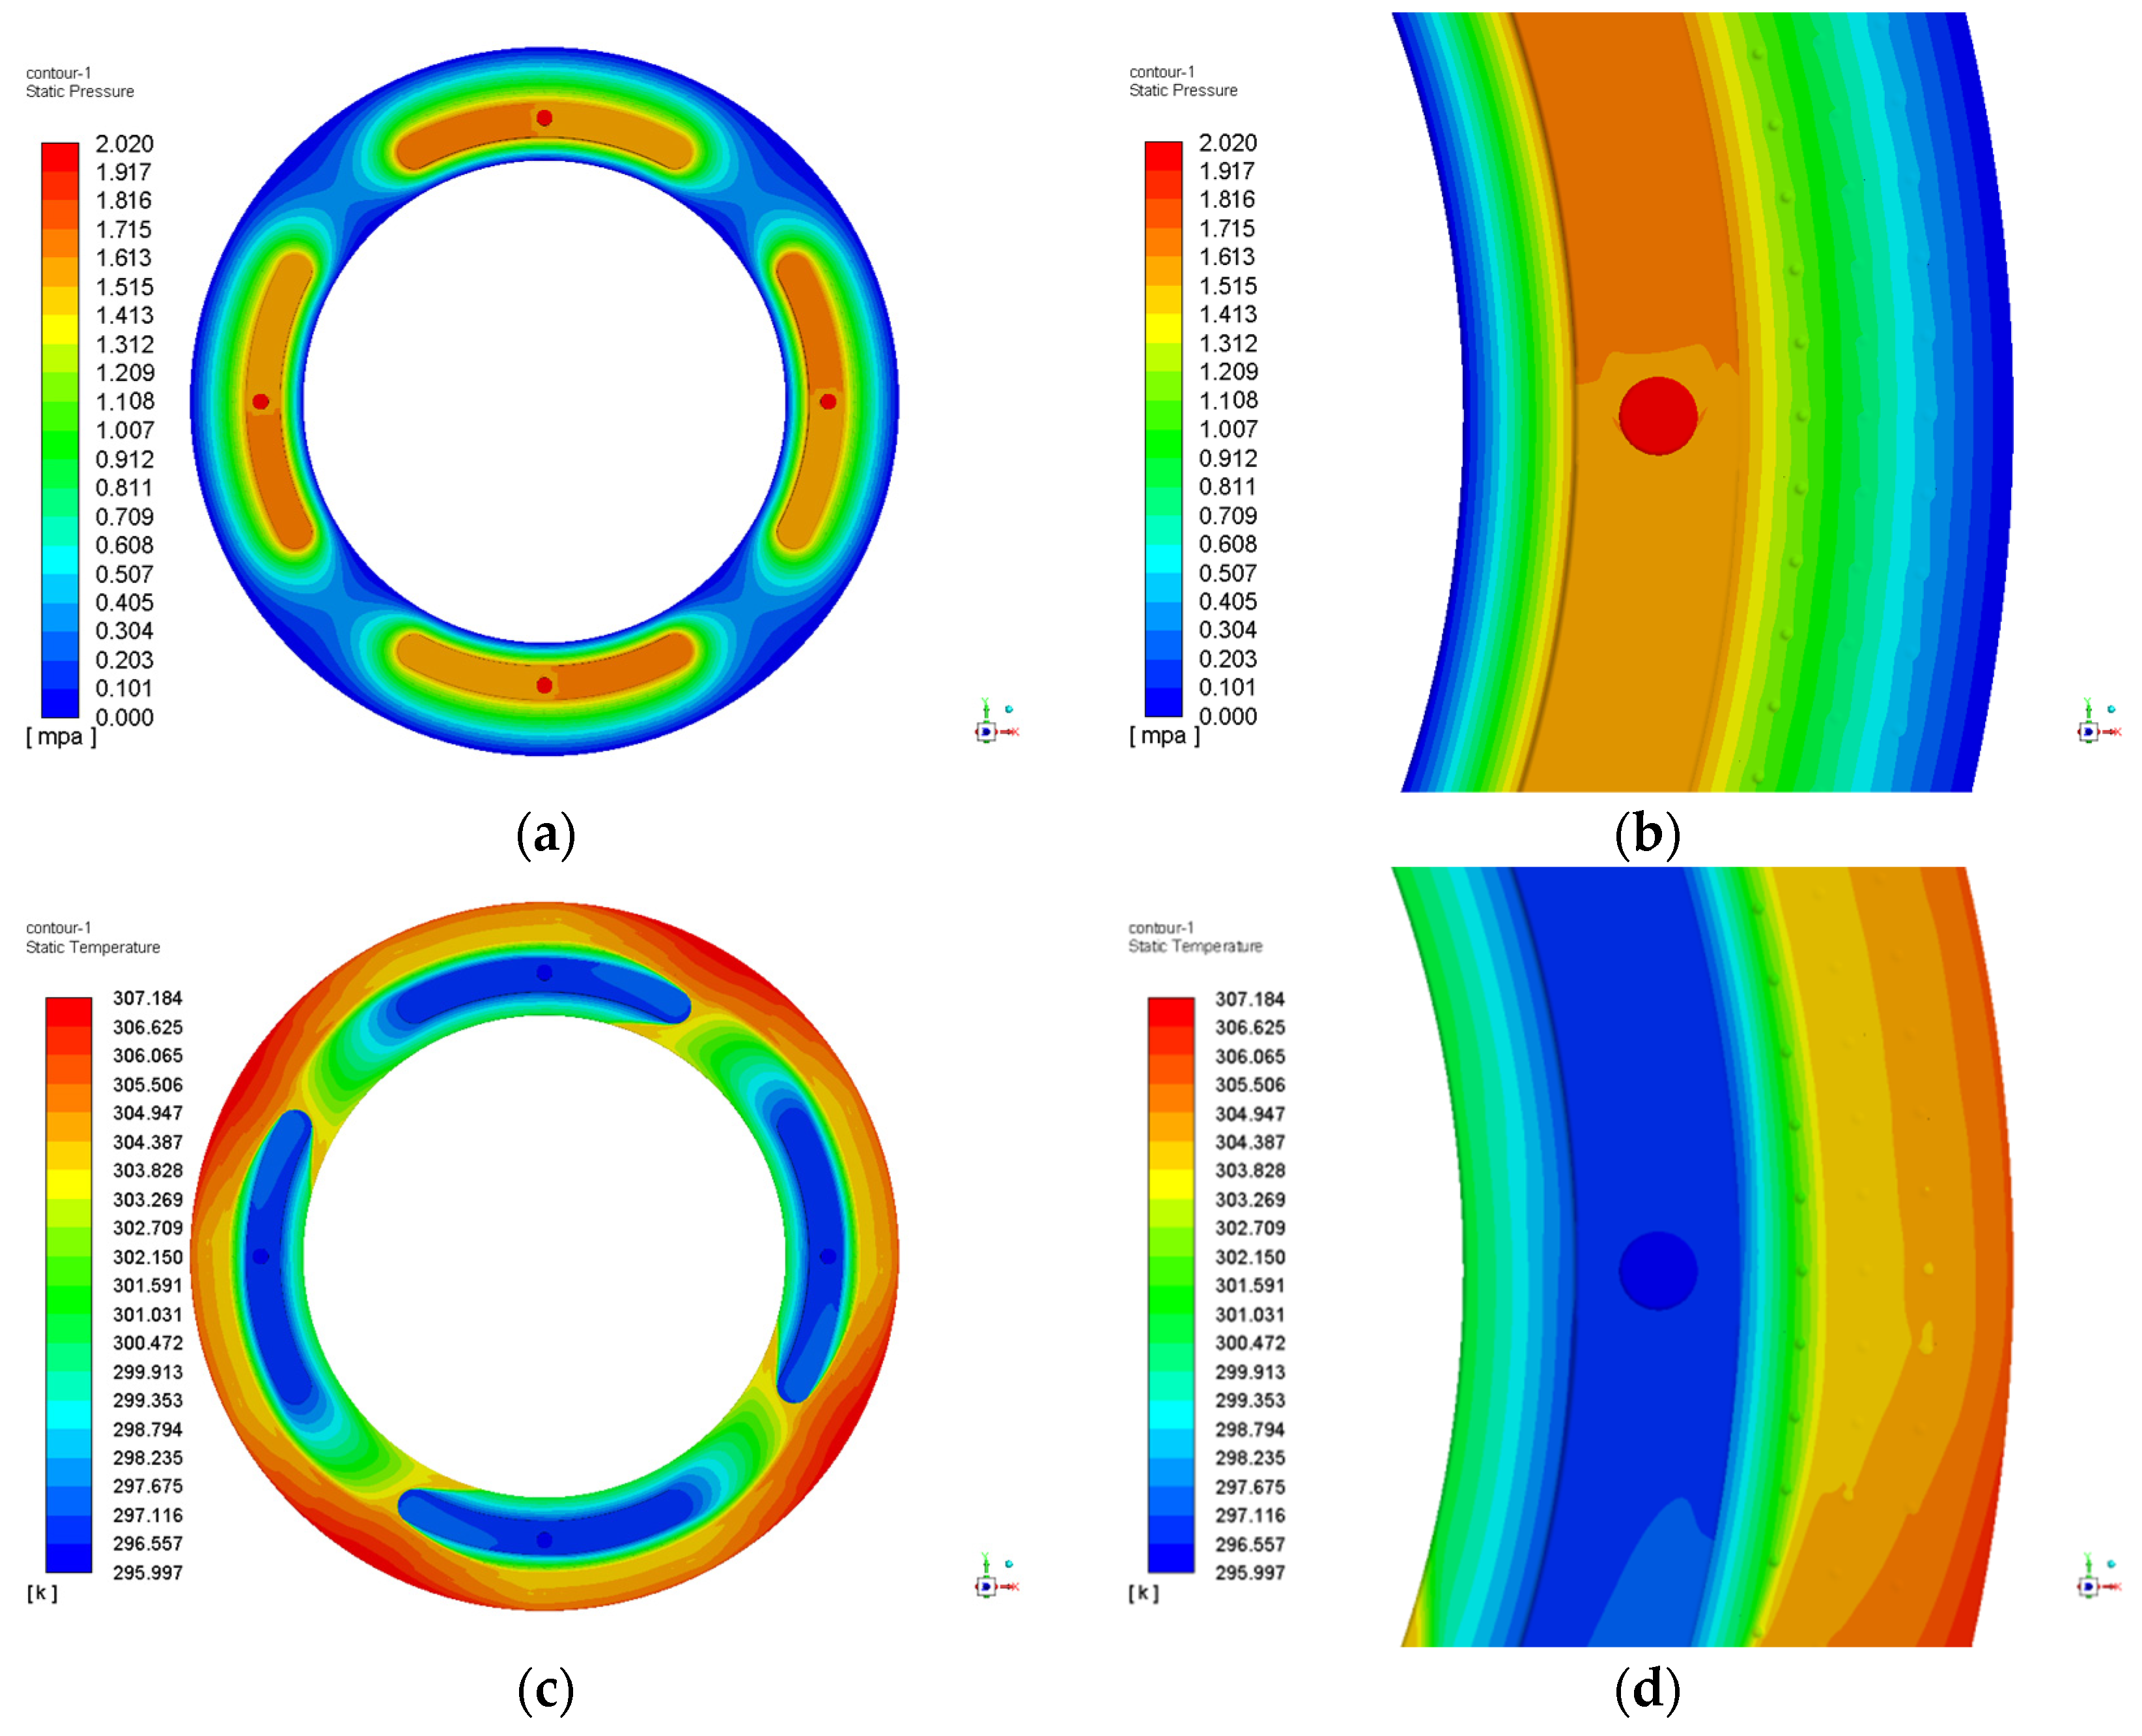
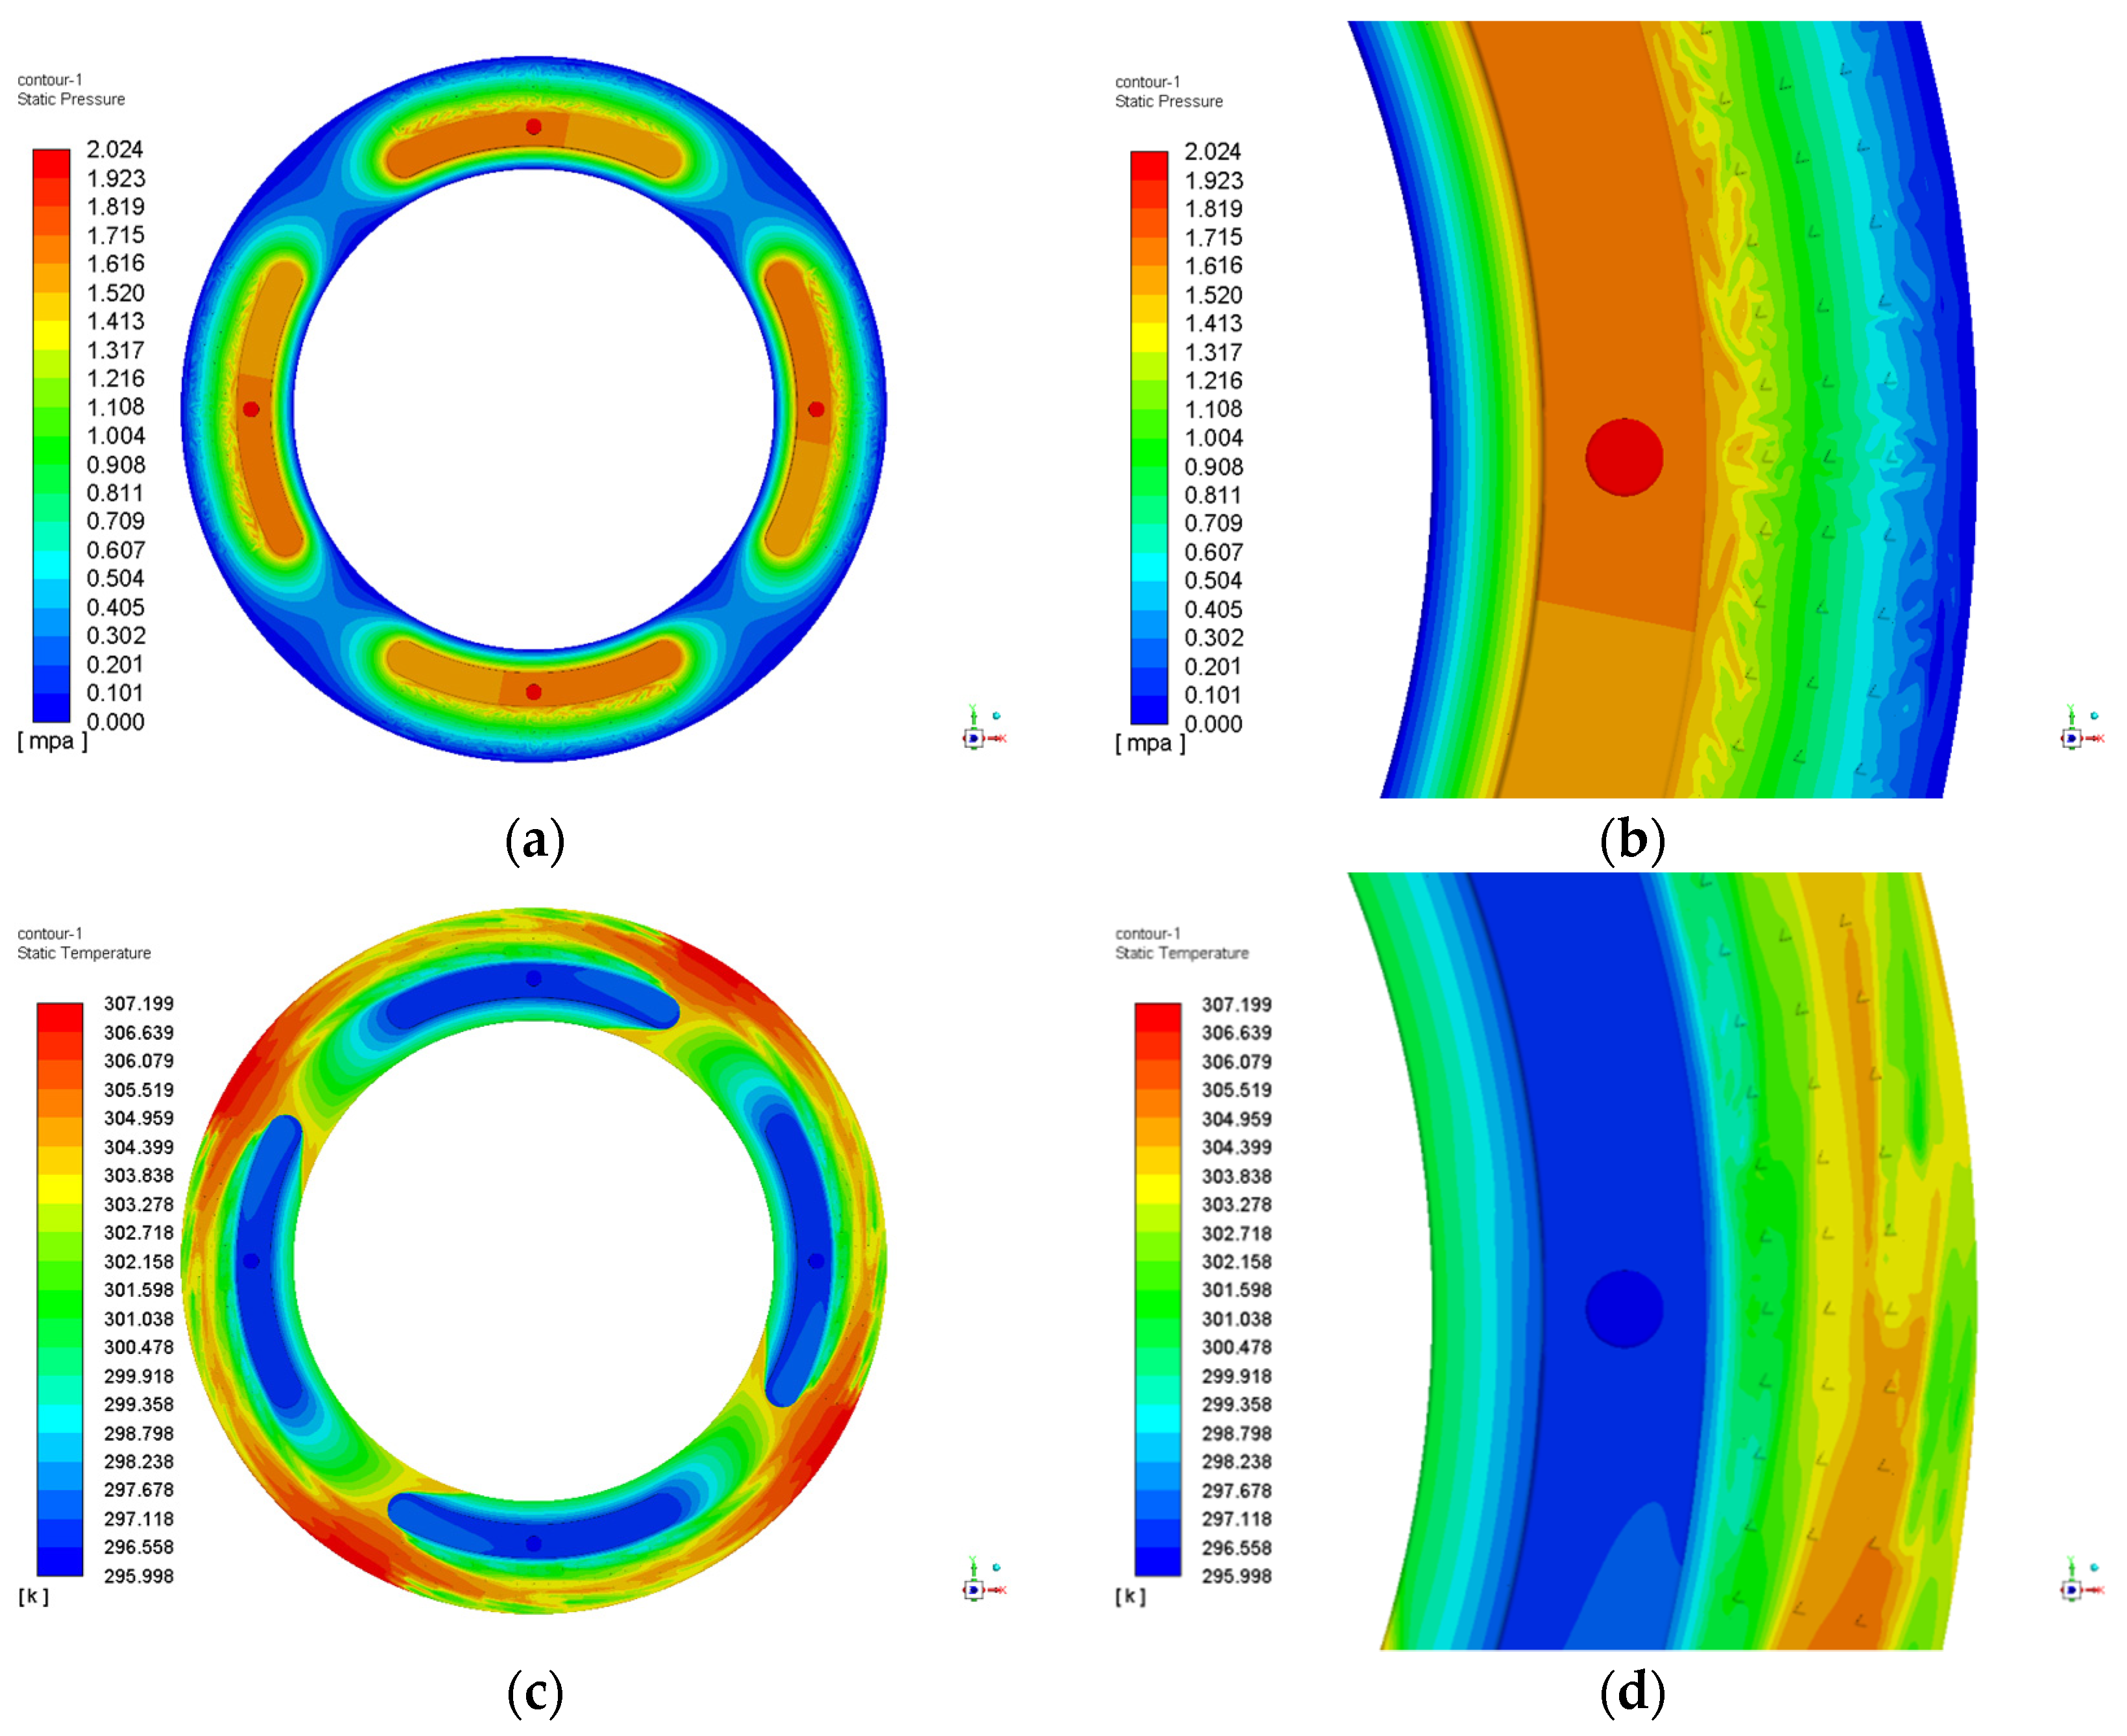
The square microtextured structures are usually made in contrast to other configurations because this shape facilitates the numerical calculation between the microtexture boundary and the oil film boundary. In this paper, the pressure and temperature distribution contours were calculated, with the pressure inlet being 2 MPa, the rotational speed being 2000 rad/min and the texture height being 0.02 mm, as shown in Figure 9a,b. The maximum pressure is distributed at the inlet position and spreads outward through the oil pad, the average pressure is 1.56 MPa, mainly concentrated in the oil pad position. In the textured area, it is found that a large number of pressure perturbation phenomena are produced around the microtexture and the pressure is diffusing into the outlet gradually, by calculating it, we obtain an average pressure of 1.69 MPa. The initial temperature is 296 K in the inlet position, and the maximum temperature is 307 K, which occurred in the outlet position. An enlarged view of the temperature of the textured area is shown in Figure 9d; the maximum temperature of the textured area is 298.12 K lower than the average temperature of the oil film.
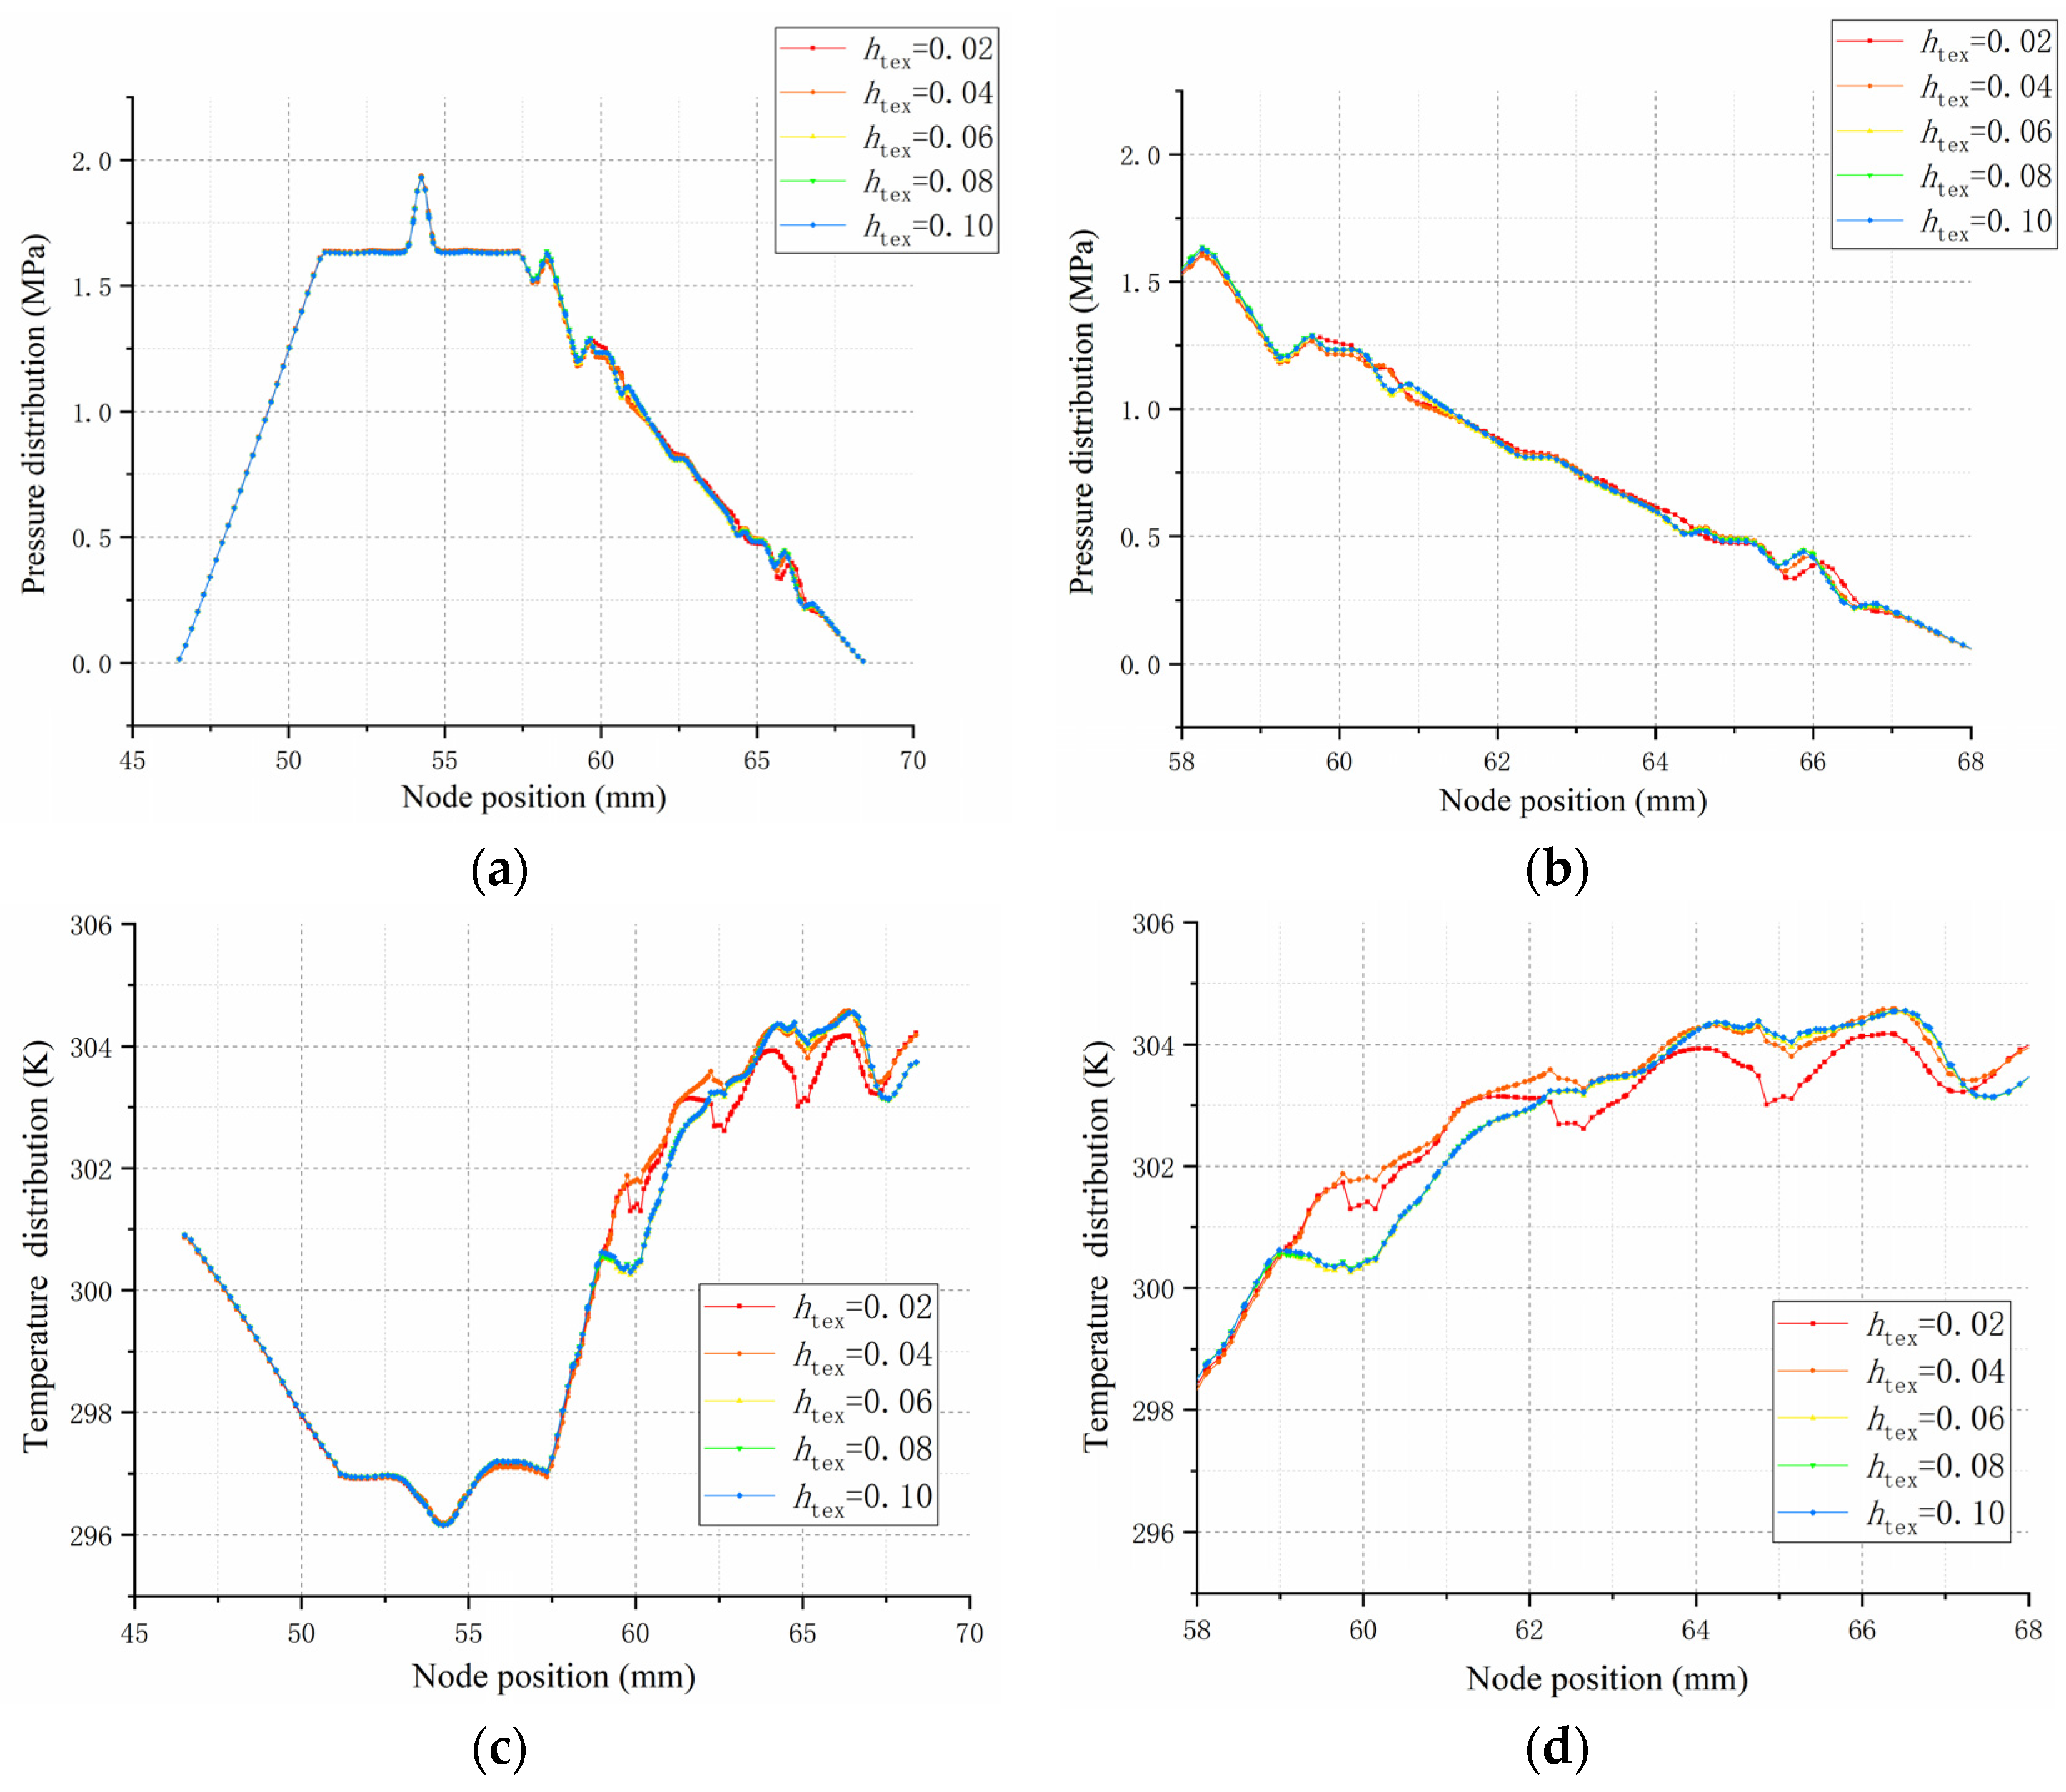
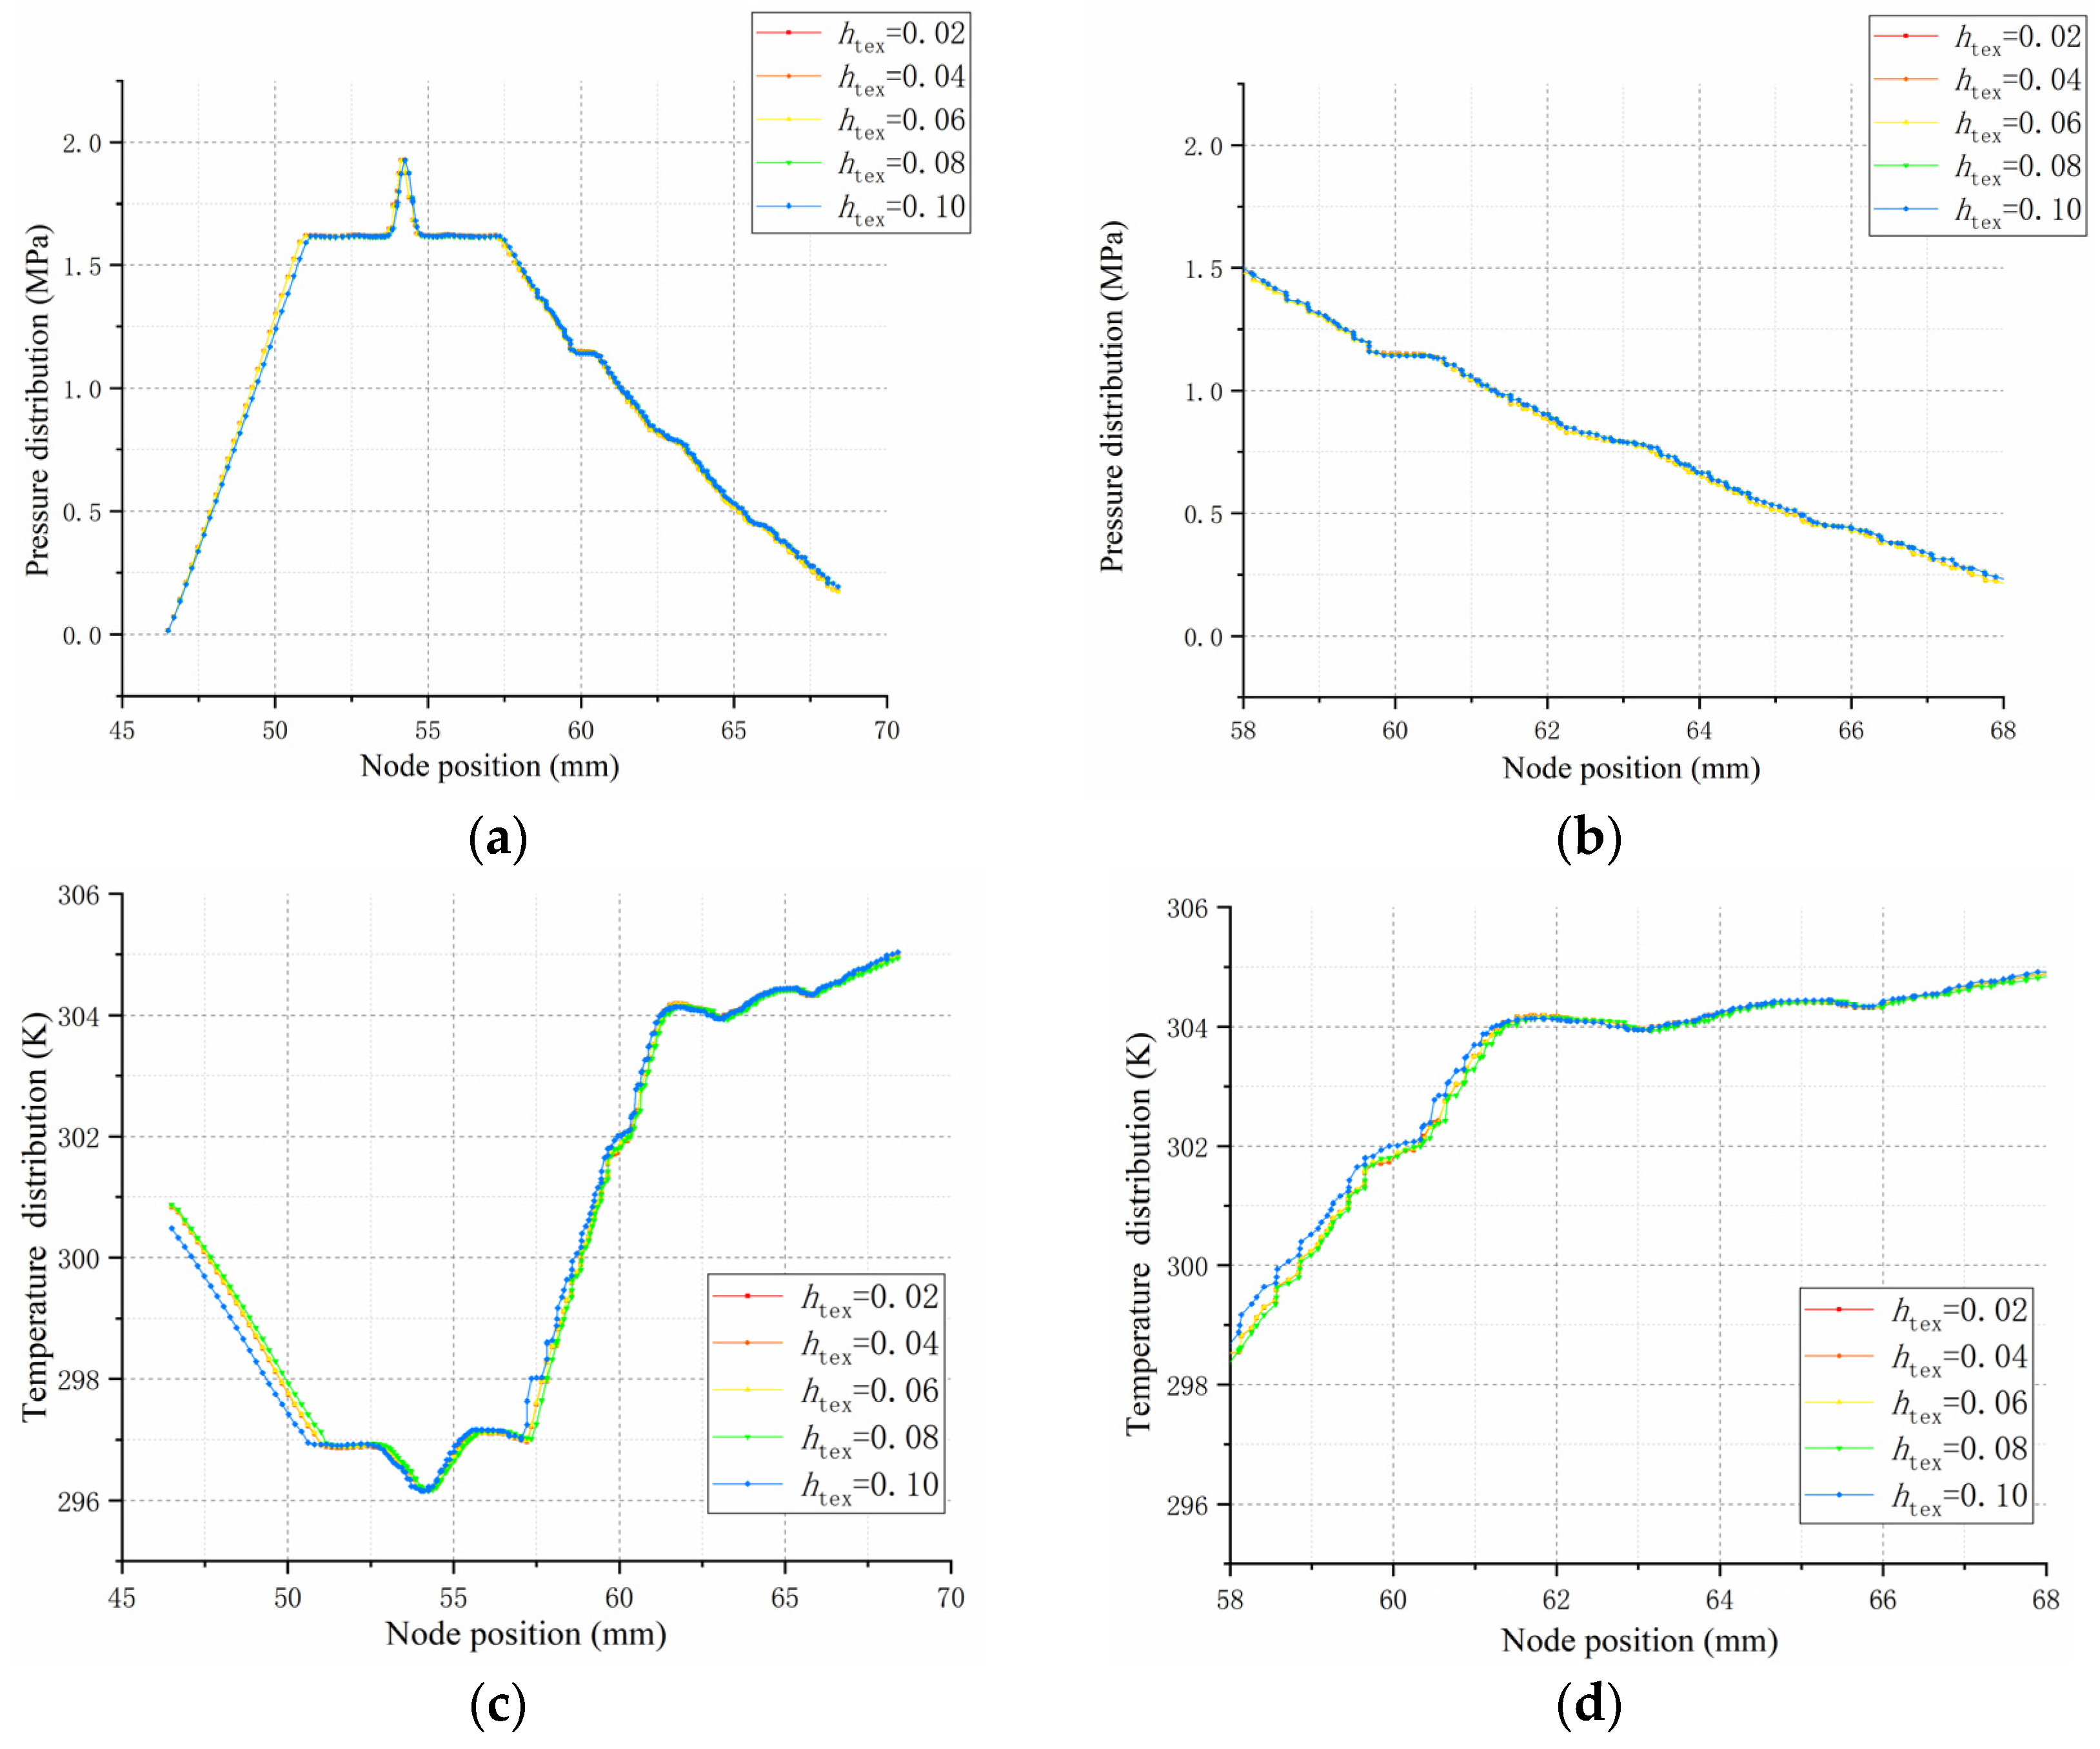
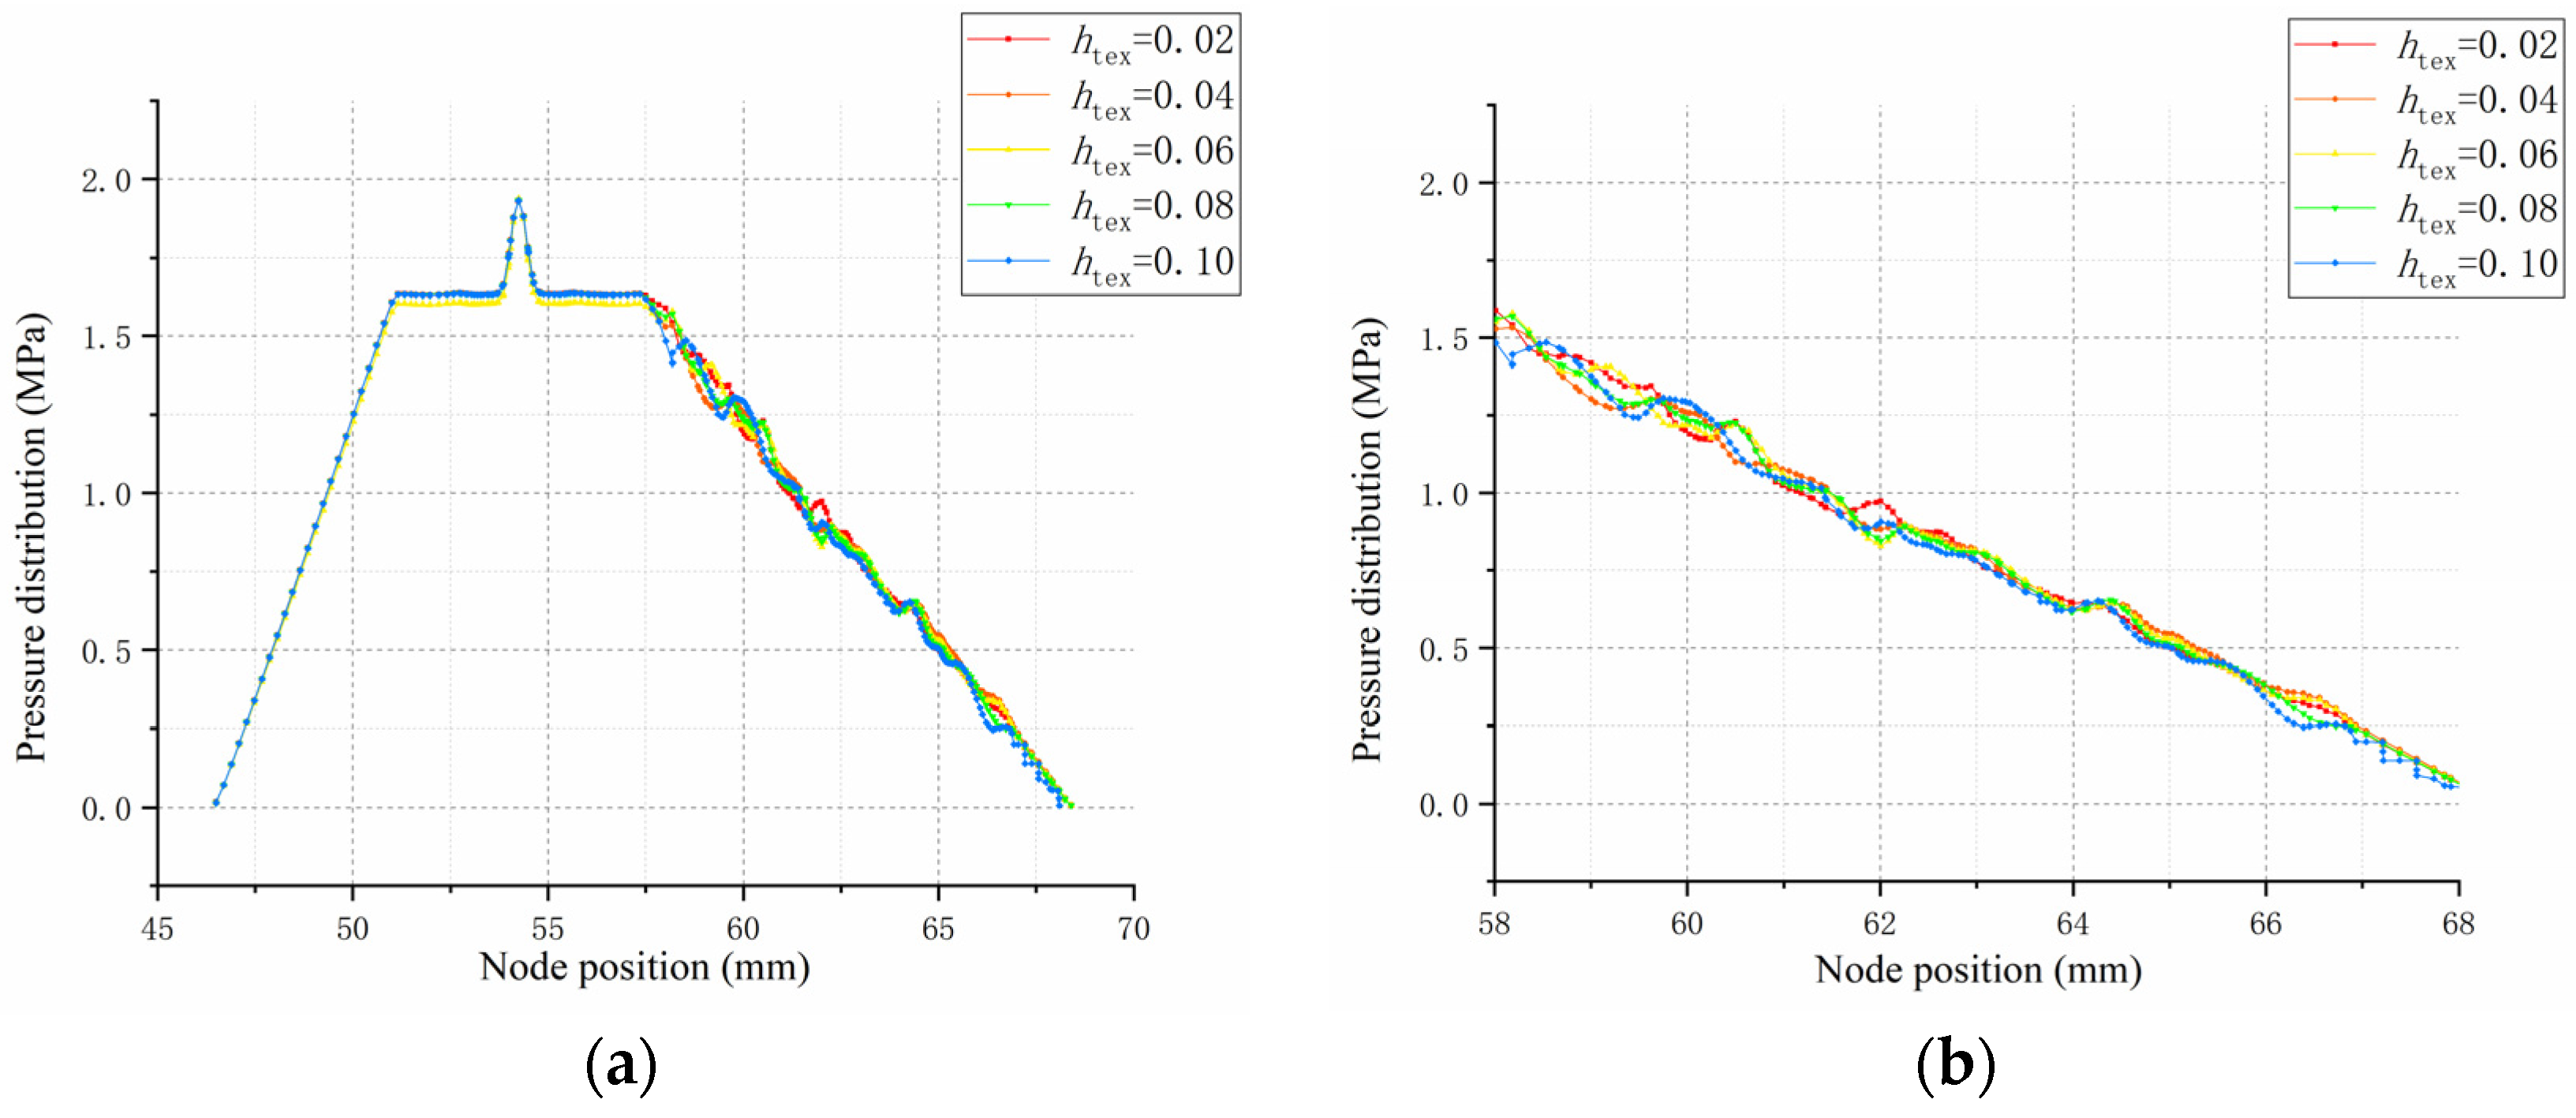
The node pressure and temperature along the bottom slice line of face A-A for different height square shape microtextures are depicted in Figure 10. The node position from 58 to 68 is the texture area, and it can be found that the oil supply pressure of 2 MPa gradually spreads from the oil inlet position to both outlet sides, the pressure distributions are almost equal on the orifice inner side; in the microtexture area, the different pressure distribution varies with height. Average pressure in textured area with various heights has the following relation: htex = 0.04 > htex = 0.02 > htex = 0.06 > htex = 0.08 > htex = 0.10. However, the effect on the oil film temperature is very obvious; the overall temperature curve shows an upward trend at node positions 58 to 68. From the texture height htex = 0.02 to 0.10 mm, the temperature curve fluctuates significantly. This is due to the micro-vortex phenomenon and local cavitation phenomenon of the micro-texture. Average temperature in the textured area with various height has the following relation: htex = 0.02 > htex = 0.08 > htex = 0.06 > htex = 0.10 > htex = 0.04.
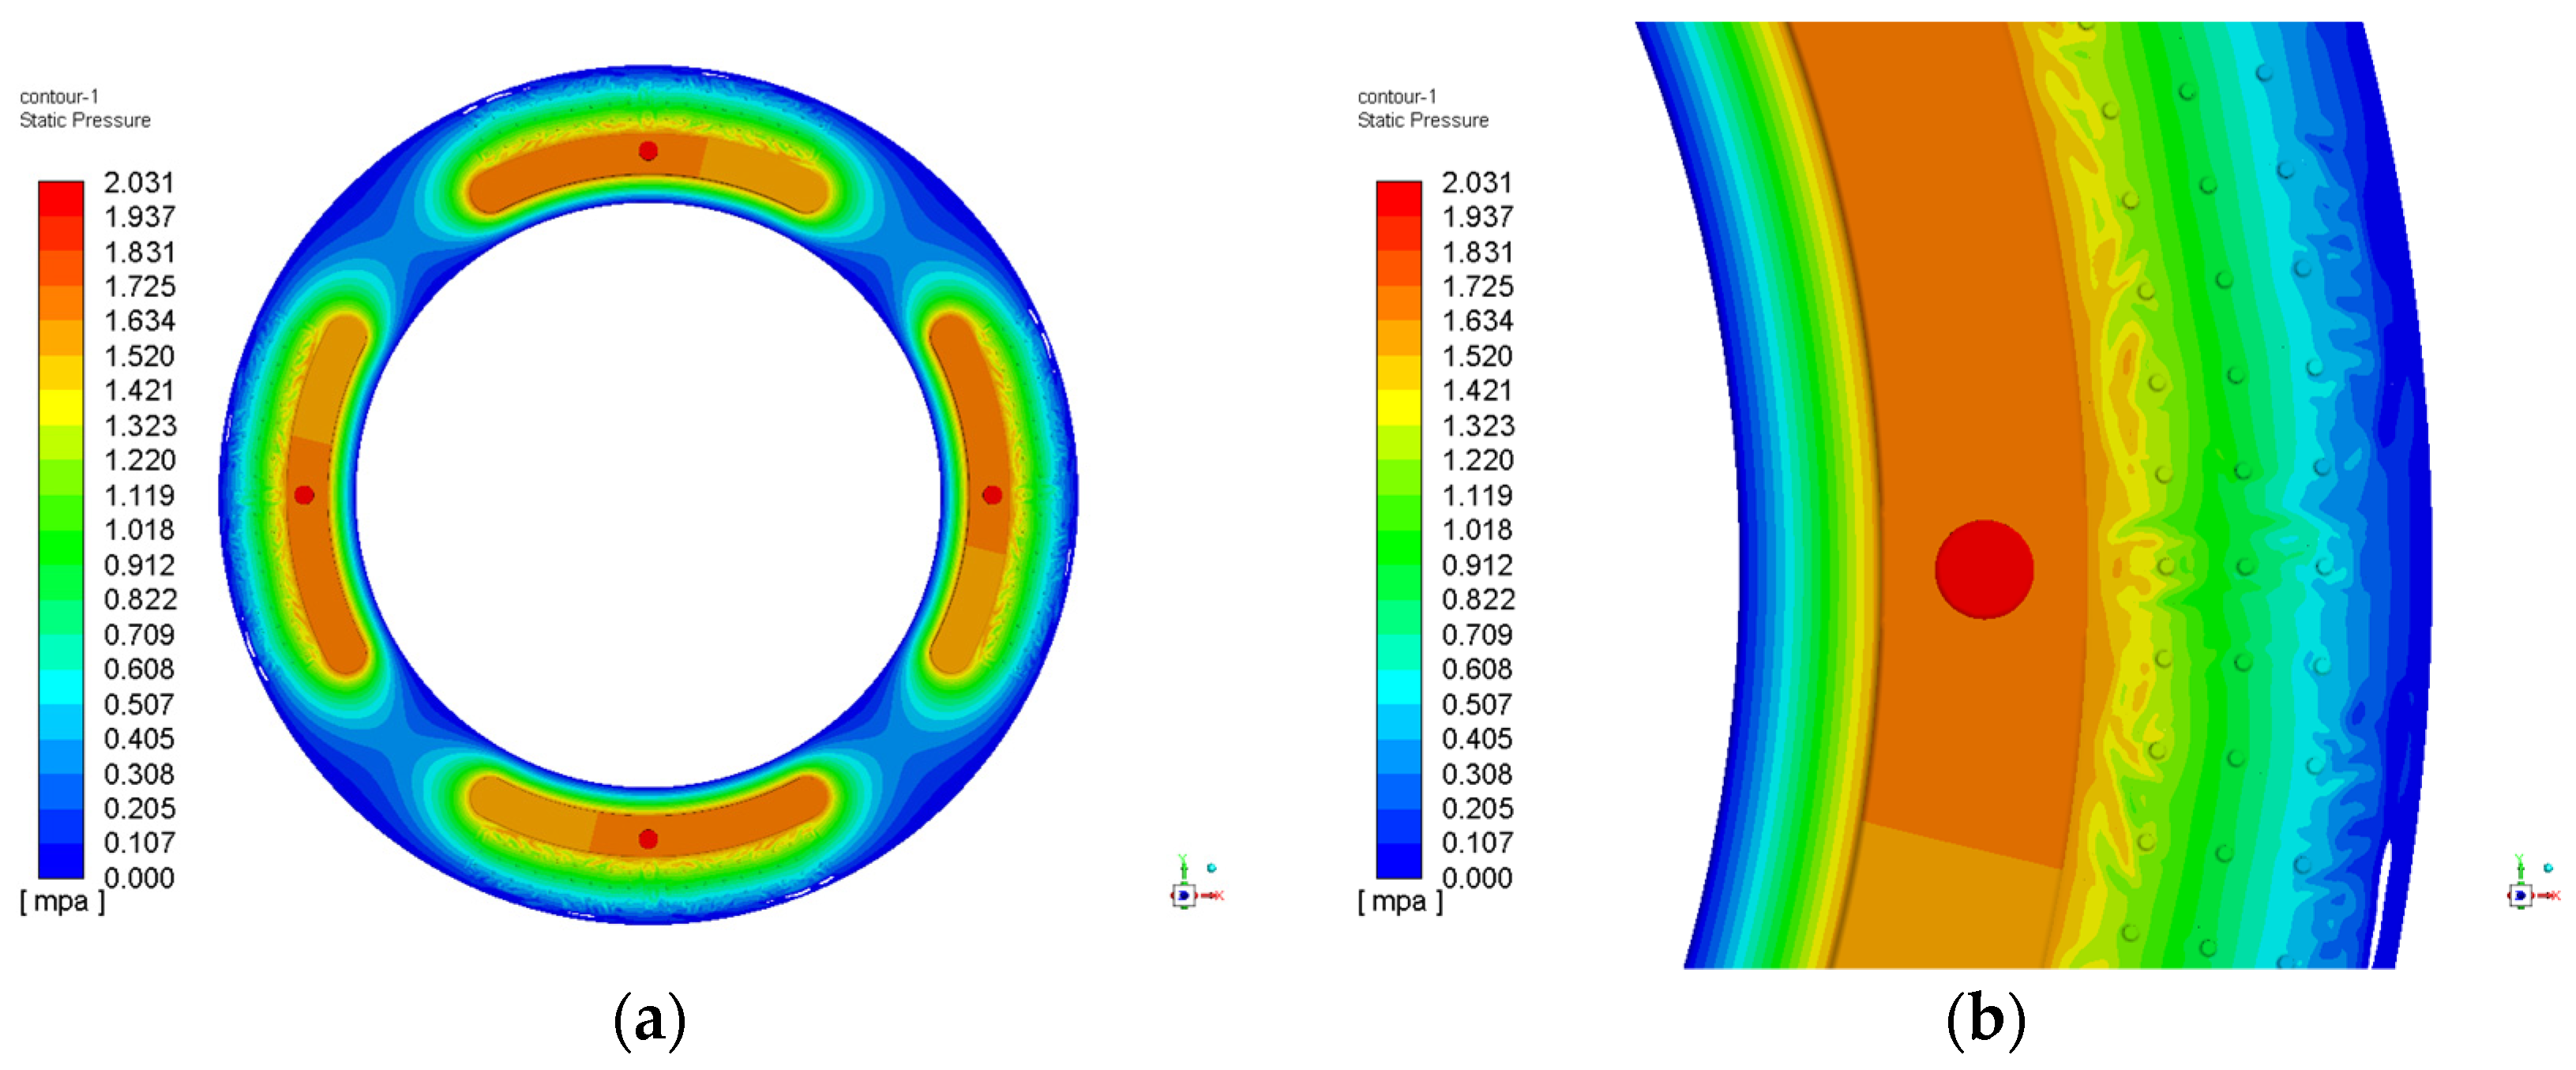
Cylindrical microtextures have been widely studied and reported by scholars, due to them being simple and easy to manufacture. Meanwhile, the high-speed motion in the rotation plane is not susceptible to shear resistance. The calculated results are shown in Figure 11, the cylindrical average pressure is 1.57 MPa, compared to the square microtexture higher 6.4%. The highest temperature of the oil film is 307 K, also concentrated at the outlet in the no microtexture area, but the average temperature is 297.45 K lower than the square type. In particular, the microtexture area has a temperature of 297.24 K, lower than the square microtexture. The calculation shows that the cylindrical microtexture outperforms the square microtexture structure from the pressure and oil temperature analysis.
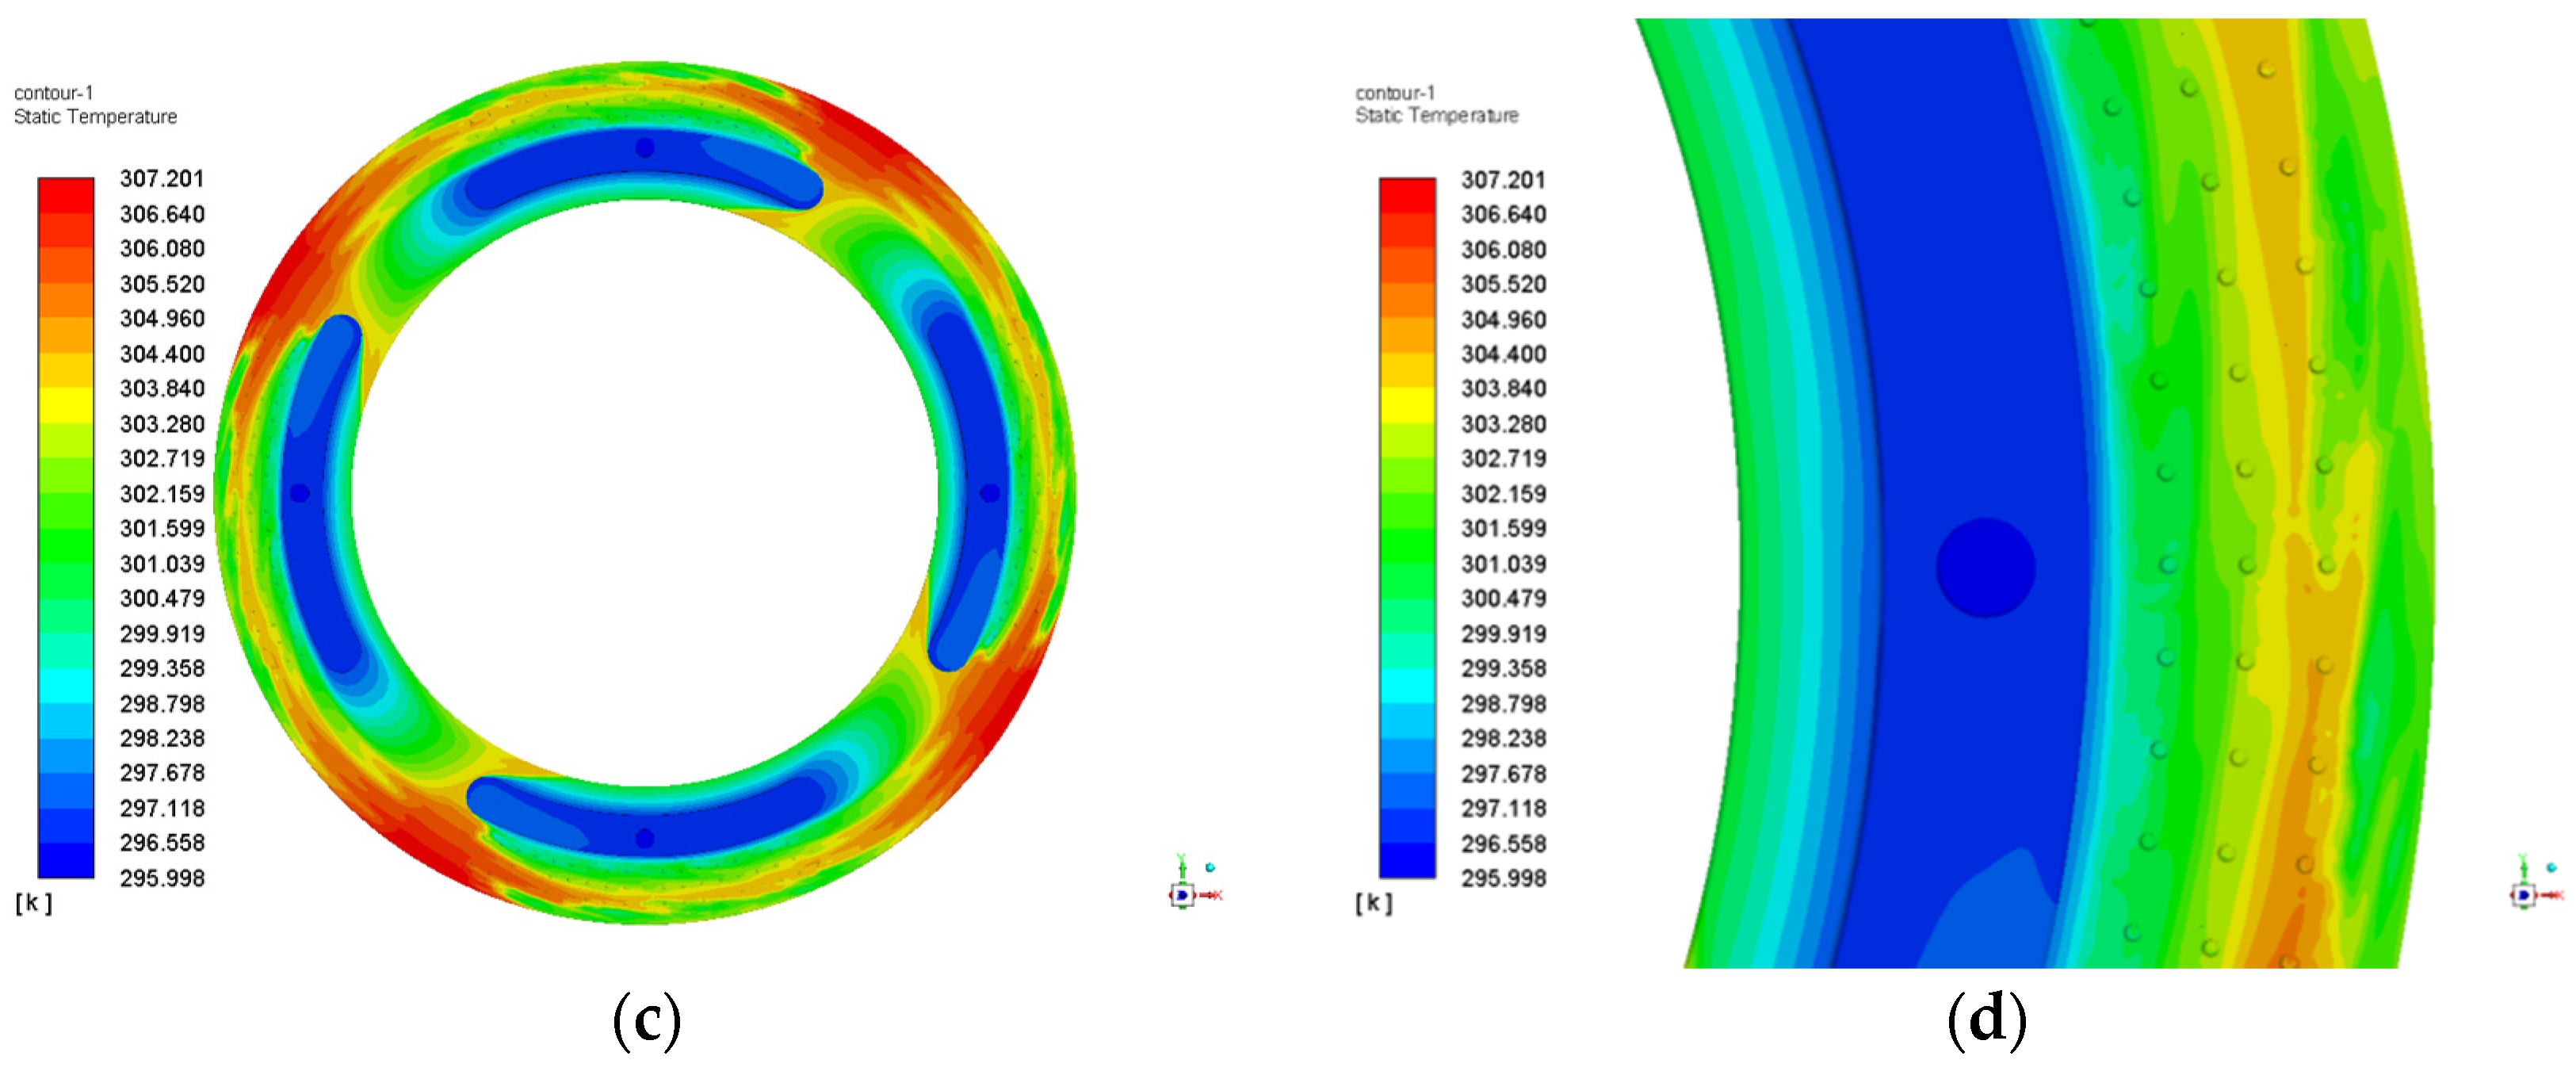
The node pressure and temperature along the bottom slice line of face A-A for different height cylindrical shape microtextures are depicted in Figure 12. The fluctuations in the pressure distribution within the microtexture region were more averaged compared to the square type, and fluctuations is small when entering the first microtexture region occurred. It can be found that in Figure 12b, the pressure of htex = 0.02 mm is different from other heights near the node positions 59 and 66, although the average node pressure is essentially the same. The average pressure in texture area with respect to various heights has the following relation: htex = 0.04 > htex = 0.02 > htex = 0.08 > htex = 0.10 > htex = 0.06. The temperature distribution is basically the same, but the temperature curve tends to rise first and then fall. This indicates that the microtexture structure changes the temperature distribution in the oil film in the textured area. Through the calculation, the maximum average temperature (298.52 K) is htex = 0.10 mm. It can be concluded that the pressure fluctuation range in the cylindrical microtexture regions is smaller than in the square type, with an average pressure of 1.57 MPa. The greater the microtexture height the more obvious the node pressure fluctuation situation. Changing the cylindrical microtexture height had little effect on temperature changes, but better compared to the square type, especially at nodes 58 to 68 average is 297.43 K. The average temperature in texture area with respect to various height has the following relation: htex = 0.02 > htex = 0.04 > htex = 0.06 = htex = 0.10 > htex = 0.08.
The microtexture of the dimple shape is widely used in high-speed spindle surfaces to reduce the friction coefficient and increase the lubrication effect. Similar to the cylinder shape, the oil film shear force is not easily received during the high-speed rotation process. The calculated results are shown in Figure 13. It can be found in Figure 13 that the average pressure is 1.54 MPa. It is lower than the above two types but close to the pressure without the microtexture. From the distribution contours, we can find that the pressure and temperature are closer to the initial model without the microtexture in the texture area. the average temperature is 297.47 K.
The node pressure and temperature along the bottom slice line of face A-A for different height dimple shape microtextures are depicted in Figure 14. It can be found that the dimple shape is the closest to the initial model. It is also not difficult to see from the pressure curve that the pressure gradient between the node positions 58 to 68 is slowly decreased, and is not affected by the microtexture. The average pressure in the texture area with respect to various height has the following relation: htex = 0.04 > htex = 0.06 > htex = 0.02 > htex = 0.08 > htex = 0.10. The height variation of the texture also had little effect on the overall pressure distribution. However, the higher the microtexture height, the more obvious the oil film temperature curve fluctuates. The average temperature in texture area with respect to various height has the following relation: htex = 0.10 > htex = 0.08 > htex = 0.06 > htex = 0.04 > htex = 0.02.
The isosceles triangle microtexture structure is usually used in ultra-high speed gas thrust bearings, The top Angle of the triangle is along the direction of rotation, thus minimizing axial resistance. However, it is rarely used in hydrostatic spindles because of its complex calculation and difficult processing. The calculated results are shown in Figure 15, it can be found in Figure 15 that the average pressure is 1.56 MPa. It is the largest of the four structures. Especially in the case of high-speed hydrostatic bearings, It is not difficult to see from the figure that triangular microtexture plays a great role in pressure diffusion. The average temperature inside the oil film is 297.45 K, which is the same as the cylinder type, but the average temperature in the microtextured region is 297.10 K, which is 0.47% less than the cylinder shape microtexture.
The node pressure and temperature along the bottom slice line of face A-A for different height isosceles triangle microtextures are depicted in Figure 16. It can be found that different microtexture heights have different pressure gradients along the section, compared with the square and cylinder, the overall pressure gradient fluctuation amplitude is small, htex = 0.08 and htex = 0.10 pressure distribution is better than others. The average pressure in texture area with respect to various height has the following relation: htex = 0.10 > htex = 0.08 > htex = 0.06 > htex = 0.02 > htex = 0.04. Between node 58 and 68, the average temperature showed a downward trend after mister, and the highest temperature was 304.58 K near node 64. The average temperature in texture area with respect to various height has the following relation: htex = 0.02 > htex = 0.04 > htex = 0.08 > htex = 0.10 > htex = 0.06.
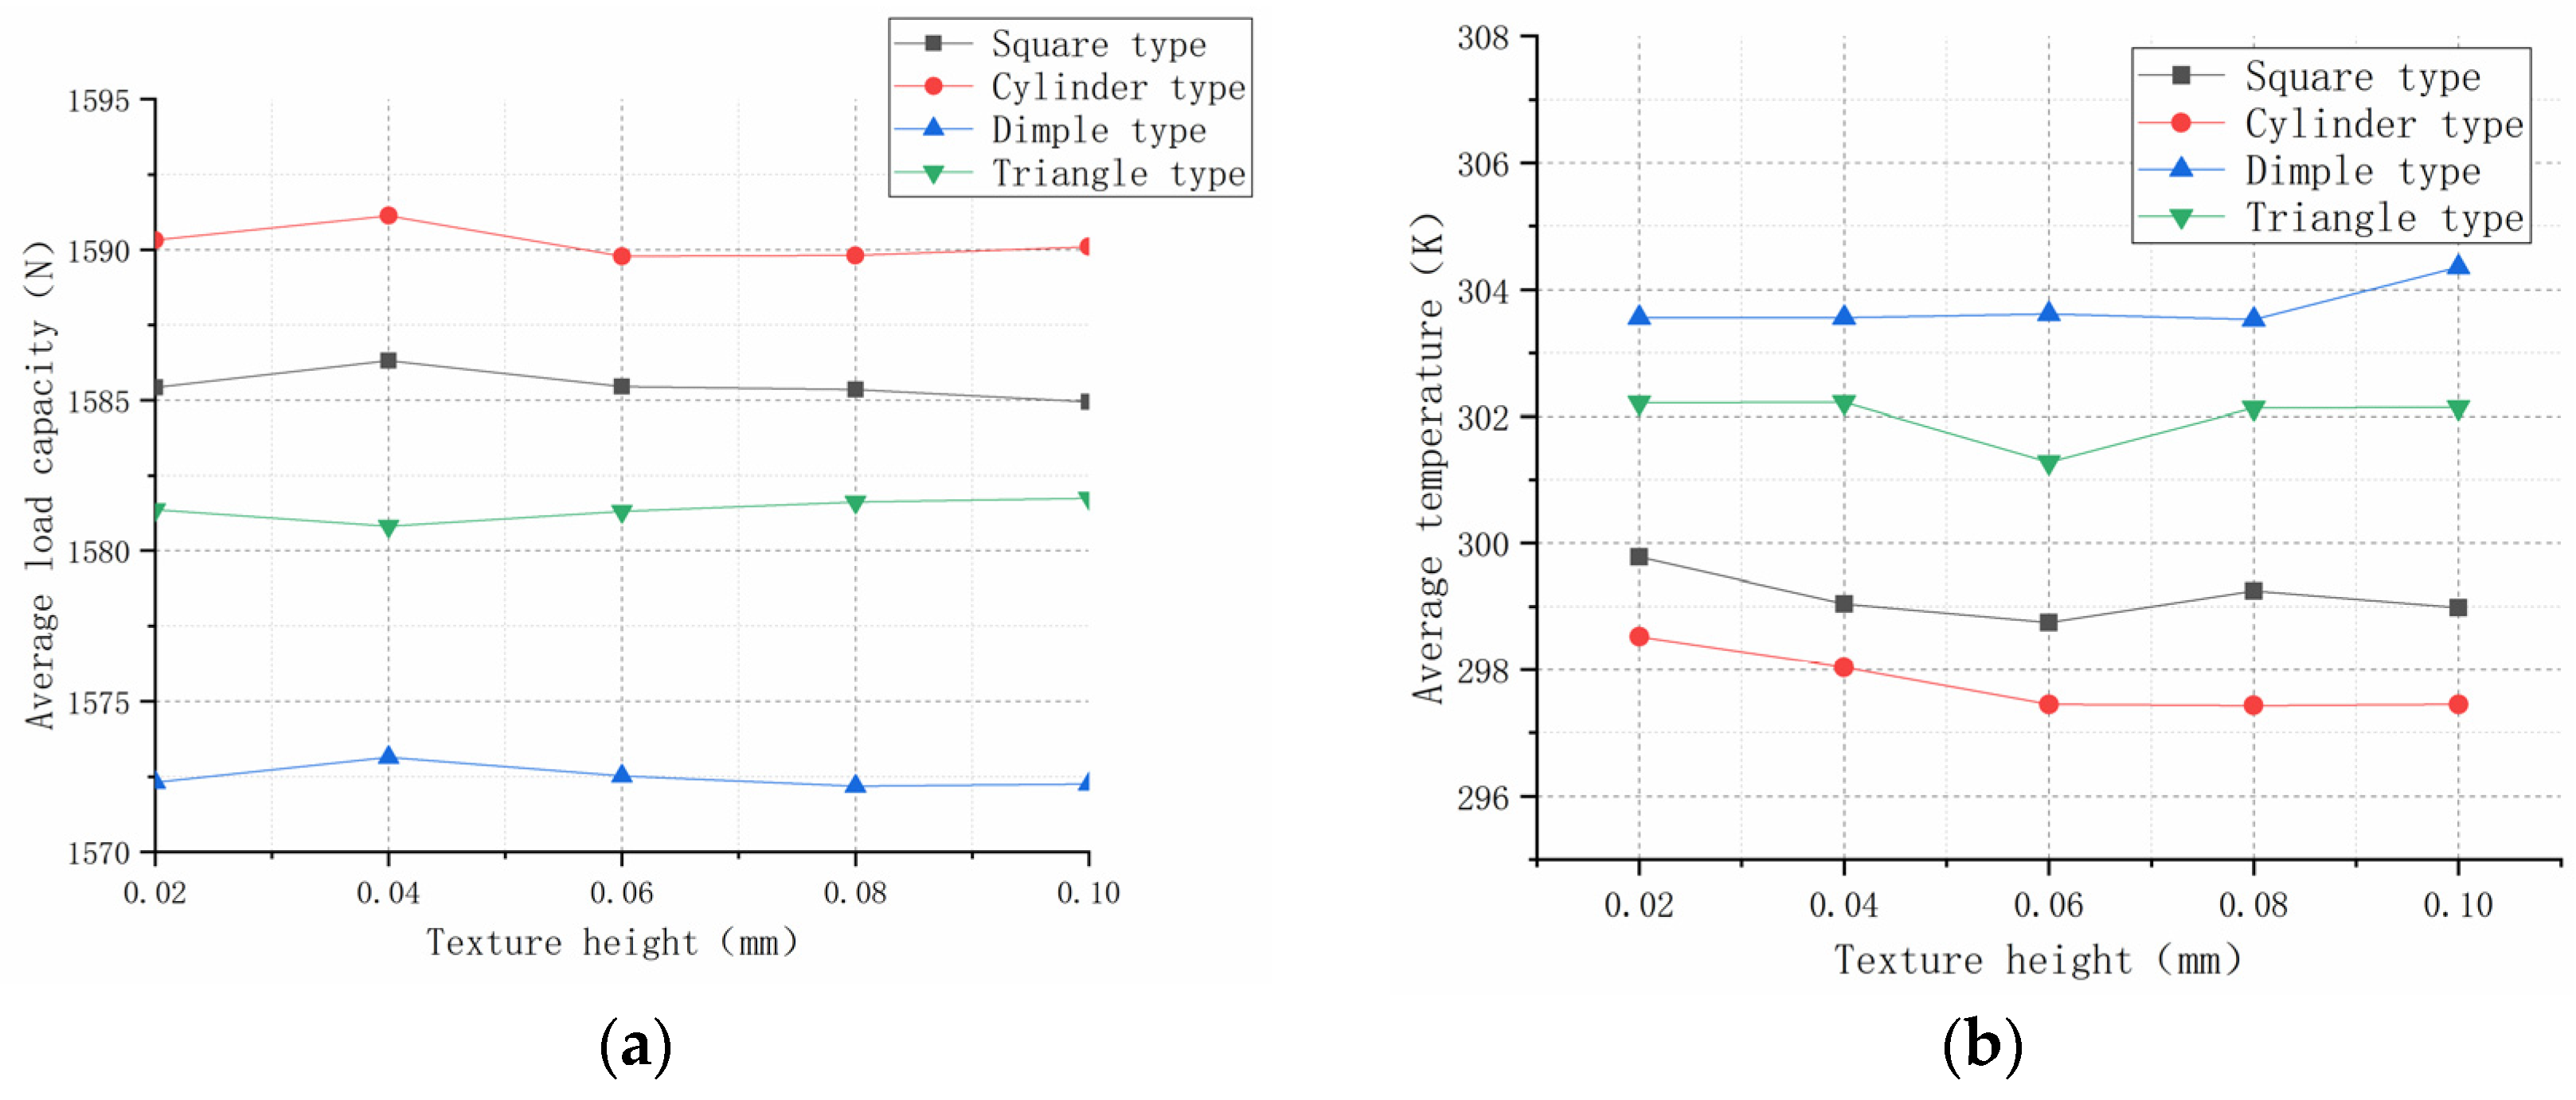
In order to reflect the influence of different heights on the four surface textures more intuitively, The relationship about average pressure and average temperature in the effective bearing area are shown in Figure 17. As discussed above, the best results are obtained when the surface texture height is between 0.02 and 0.04.
5. Experimental Evaluation and Validation
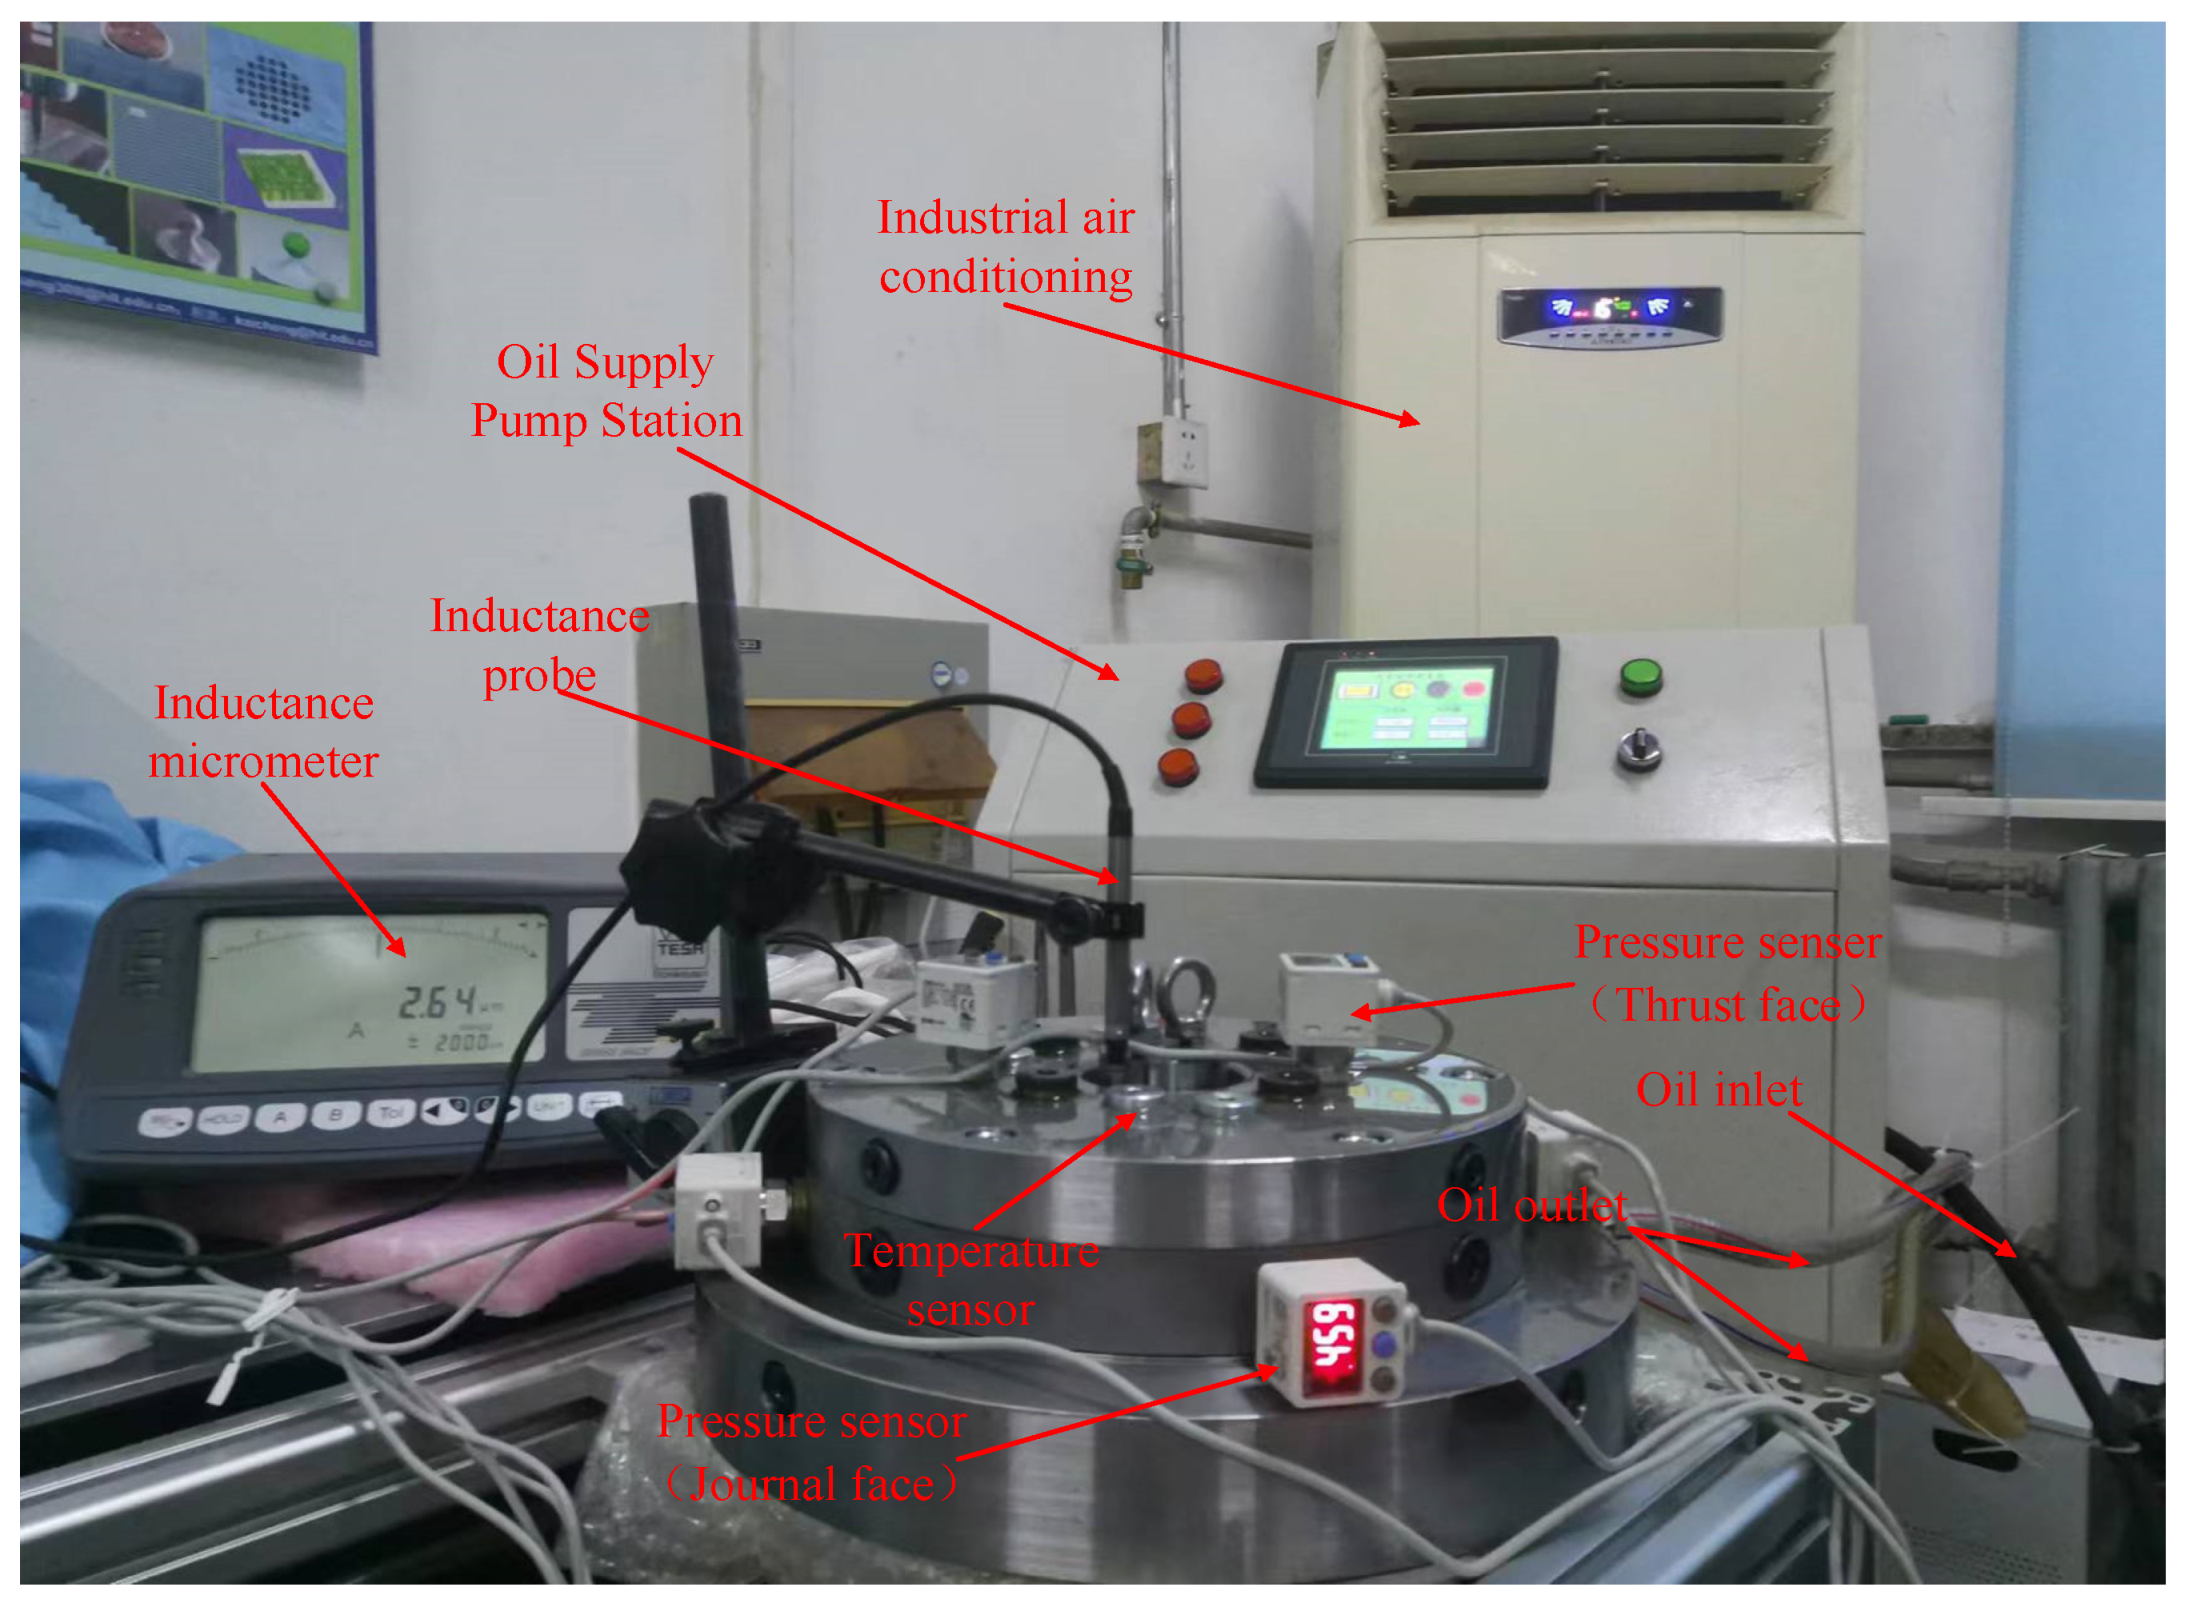
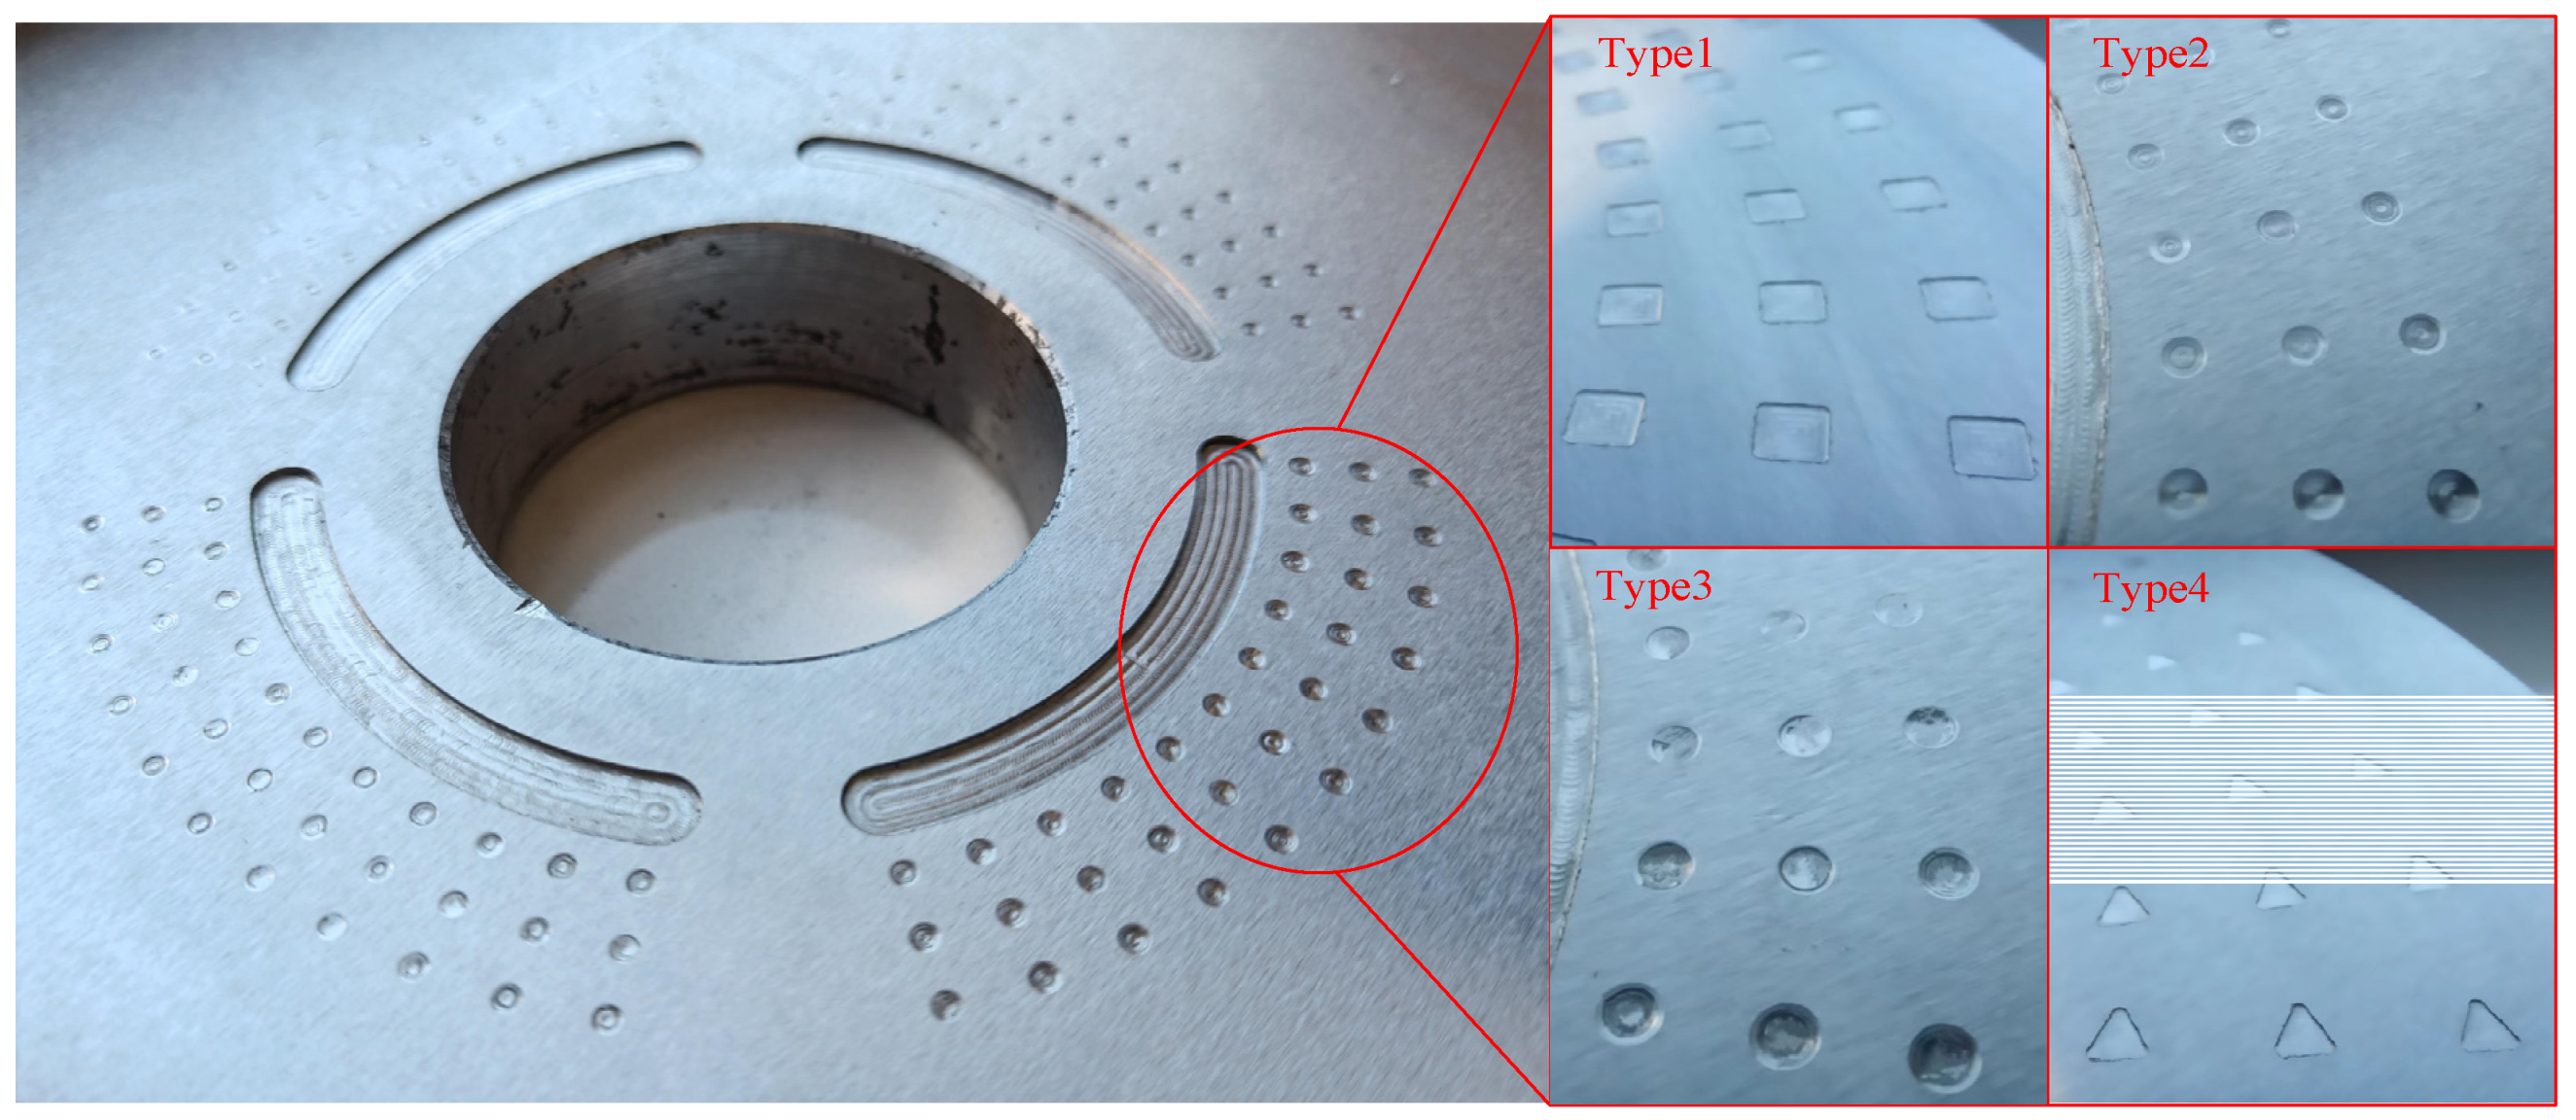
In order to verify the effectiveness of the CFD simulations, four surface microtextures with different configurations were measured under actual working conditions. A schematic diagram of the overall structure of the experimental bench is shown in Figure 1 and Figure 2. The Kollmorgen frameless motor in the base provides power for the spindle rotation, its maximum speed is 8000 r/min.
In this paper to study the effect of different surface microtextures on bearing performance more accurately, the surface microstructure of the thrust surface of the spindle on the experimental table was processed without considering the gravity and external load force of the spindle. In Figure 18 and Figure 19, the oil supply pressure is 2 MPa, and the rotational speed is 2000 rad/min. Due to the thickness of hydrostatic oil film being 20 μm, it is difficult to directly measure the shear stress, pressure distribution, velocity magnitude and flow characteristics of the oil film surface. The experimental bench is equipped with SMC temperature and pressure sensors on the end face of the oil film.
The oil film stiffness is measured by indirect measurement, By adjusting the oil film gap on the thrust surface to decrease by 1 μm and measuring the bearing capacity change of the oil film on the thrust surface, the oil film stiffness can be indirectly measured at a 1 μm change. In this experiment, the TESA-TT80 inductor micrometer is used to measure the change in the oil film displacement. The range of the inductor probe is ±2000 μm, and the resolution is 0.01 μm.
The comparison between the measurement results and the CFD simulation results in this paper is shown in Table 2. In order to achieve accurate measurement in the experiment and reduce measurement errors, each surface microtexture is sampled five times under the same working condition and the average value is taken. The experimental results are lower than the CFD simulation results, this is because of the error caused by the loss of uncontrollable factors. It can be found from Table 2, that the errors between the CFD simulation results and the experimental data are very small, validating that the CFD simulation results of this paper are acceptable, and the error is within 5%, and therefore, statistically significant.
It is not difficult to see from the experimental results that the cylindrical microstructure is more suitable for the actual working conditions given in this paper. It can improve the bearing capacity, and effectively reduce the impact of temperature on the oil film.
6. Conclusions
In this paper, the parameters of micro-texture on the thrust bearing surfaces of the high-speed hydrostatic spindle are systematically investigated and analyzed by considering viscosity-temperature characteristics. The CFD simulations are developed to calculate the average surface pressure and temperature distribution in the effective bearing area. The results show that the surface microtexture can effectively homogenize the pressure and temperature distribution in the bearing area and prevent high pressure and temperature concentration.
The surface texture height is set up at 0.02 mm, 0.04 mm, 0.06 mm, 0.08 mm and 0.10 mm, respectively, which are one to five times the oil film thickness in the comparative investigation. By changing the microtexture height, the variation trends of the pressure and temperature distributions at four texture configurations are further evaluated and assessed, and the following conclusions are thus drawn up:
- (1)
- The meshes in the microtextured area are processed by increasing the local meshes, which can help quickly and effectively compute the performance of the hydrostatic bearing oil film combined with the viscosity-temperature characteristics. Compared with the numerical method, it is more flexible in dealing with boundary conditions, especially the division and calculation of oil film boundaries with surface textures.
- (2)
- Compared to the ‘perfectly’ smooth surface, it is found that the surface microtexture has the effect of improving the pressure and temperature distributions at the bearing interfacial surfaces. Microtexture can make the oil film average pressure of the high-speed hydrostatic spindle increase by almost 10% and the temperature decrease by 2~3%. It is evidenced that the surface microstructure can change the temperature distribution in the bearing area and further improve the average pressure in the area.
- (3)
- Four different configurations (or shapes) of surface microtextures contribute to the bearing performance, the square shape and isosceles triangle shape microtextures have a good effect on reducing the oil film temperature. However, from the stability of the spindle motions, the fluctuation in the pressure helps to reduce the temperature, but it affects the error motions of the ultra-precision spindle and causes vibrations in the thrust surface. Therefore, it is less satisfactory to use the cylindrical shape and the dimple shape.
- (4)
- The variations in the microtexture height under the same shape have an effect on the spindle performance. However, it does not obtain better performance when increasing the microtexture height, while it depends on the fluctuation of the oil film at the node position. By comparing the different heights of the four shapes, it is found that in order to reduce the temperature and improve the bearing loading capacity, the height of the microtexture should be one to two times the thickness of the oil film (htex = 0.02 mm or htex = 0.04 mm).
Author Contributions
Conceptualization, Y.S.; Methodology, K.C.; Software, Y.S. and S.C.; Validation, Y.S. and H.D.; Data curation, Y.S.; Resources, Y.S. and S.C.; Writing—original draft, Y.S.; Writing—review and editing, Y.S. and K.C. All authors have read and agreed to the published version of the manuscript.
Funding
This research received no external funding.
Institutional Review Board Statement
Not applicable.
Informed Consent Statement
Not applicable.
Acknowledgments
The authors thank for the technical and experimental support on this research from engineers at JITRI UpTech Ltd.
Conflicts of Interest
The authors declare no conflict of interest.
References
- Etsion, I.; Burstein, L. A Model for Mechanical Seals with Regular Microsurface Structure. Tribol. Trans. 1996, 39, 677–683. [Google Scholar] [CrossRef]
- Etsion, I. State of the Art in Laser Surface Texturing. J. Tribol. 2005, 127, 248–253. [Google Scholar] [CrossRef]
- Etsion, I.; Halperin, G.; Brizmer, V.; Kligerman, Y. Experimental investigation of laser surface textured parallel thrust bearings. Tribol. Lett. 2004, 17, 295–300. [Google Scholar] [CrossRef]
- de Kraker, A.; van Ostayen, R.A.J.; van Beek, A.; Rixen, D.J. A Multiscale Method Modeling Surface Texture Effects. J. Tribol. 2007, 129, 221. [Google Scholar] [CrossRef]
- Saravi, S.S.; Cheng, K. A review of drag reduction by riblets and micro-textures in the turbulent boundary layers. Eur. Sci. J. 2013, 9, 62–81. [Google Scholar]
- Pei, S.; Xu, H.; Shi, F. A deterministic multiscale computation method for rough surface lubrication. Tribol. Int. 2016, 94, 502–508. [Google Scholar] [CrossRef]
- Pei, S.; Ma, S.; Xu, H.; Wang, F.; Zhang, Y. A multiscale method of modeling surface texture in hydrodynamic regime. Tribol. Int. 2011, 44, 1810–1818. [Google Scholar] [CrossRef]
- Brizmer, V.; Kligerman, Y.; Etsion, I. A Laser Surface Textured Parallel Thrust Bearing. Tribol. Trans. 2003, 46, 397–403. [Google Scholar] [CrossRef]
- Tønder, K. Dynamics of rough slider bearings: Effects of one-sided roughness/waviness. Tribol. Int. 1996, 29, 117–122. [Google Scholar] [CrossRef]
- Tønder, K. Hydrodynamic effects of tailored inlet roughnesses: Extended theory. Tribol. Int. 2004, 37, 137–142. [Google Scholar] [CrossRef]
- Brunetière, N.; Tournerie, B. Numerical analysis of a surface-textured mechanical seal operating in mixed lubrication regime. Tribol. Int. 2012, 49, 80–89. [Google Scholar] [CrossRef]
- Gropper, D.; Wang, L.; Harvey, T.J. Hydrodynamic lubrication of textured surfaces: A review of modeling techniques and key findings. Tribol. Int. 2016, 94, 509–529. [Google Scholar] [CrossRef]
- Yu, H.; Wang, X.; Zhou, F. Geometric shape effects of surface texture on the generation of hydrodynamic pressure between conformal contacting surfaces. Tribol. Lett. 2010, 37, 123–130. [Google Scholar] [CrossRef]
- Qiu, M.; Delic, A.; Raeymaekers, B. The effect of texture shape on the load-carrying capacity of gas-lubricated parallel slider bearings. Tribol. Lett. 2012, 48, 315–327. [Google Scholar]
- Nanbu, T.; Ren, N.; Yasuda, Y.; Zhu, D.; Wang, Q.J. Micro-textures in concentrated conformal-contact lubrication: Effects of texture bottom shape and surface relative motion. Tribol. Lett. 2008, 29, 241–252. [Google Scholar] [CrossRef]
- Shen, C.; Khonsari, M.M. Effect of dimple’s internal structure on hydrodynamic lubrication. Tribol. Lett. 2013, 52, 415–430. [Google Scholar] [CrossRef]
- Liang, X.; Liu, Z.; Wang, H.; Zhou, X.; Zhou, X. Hydrodynamic lubrication of partial textured sliding journal bearing based on three-dimensional CFD. Ind. Lubr. Tribol. 2016, 68, 106–115. [Google Scholar] [CrossRef]
- Tala-Ighil, N.; Fillon, M.; Maspeyrot, P. Effect of textured area on the performances of a hydrodynamic journal bearing. Tribol. Int. 2011, 44, 211–219. [Google Scholar] [CrossRef]
- Zhang, Y.; Chen, G.; Wand, L. Thermoelastohydrodynamic analysis of misaligned bearings with texture on journal surface under high-speed and heavy-load conditions. Chin. J. Aeronaut. 2019, 32, 1331–1342. [Google Scholar] [CrossRef]
- Shi, X.; Ni, T. Effects of groove textures on fully lubricated sliding with cavitation. Tribol. Int. 2011, 44, 2022–2028. [Google Scholar] [CrossRef]
- Dobrica, M.B.; Fillon, M. About the validity of Reynolds equation and inertia effects in textured sliders of infinite width. Proc. Inst. Mech. Eng. Part J J. Eng. Tribol. 2009, 223, 69–78. [Google Scholar] [CrossRef]
- Buscaglia, G.C.; Ciuperca, I.; Jai, M. The Effect of Periodic Textures on the Static Characteristics of Thrust Bearings. J. Tribol. 2005, 127, 899–902. [Google Scholar] [CrossRef]
- Buscaglia, G.C.; Ciuperca, I.; Jai, M. On the optimization of surface textures for lubricated contacts. J. Math. Anal. Appl. 2007, 335, 1309–1327. [Google Scholar] [CrossRef]
- Rom, M.; Müller, S. An effective Navier-Stokes model for the simulation of textured surface lubrication. Tribol. Int. 2018, 124, 247–258. [Google Scholar] [CrossRef]
- Wang, L.; Wang, W.; Wang, H.; Ma, T.; Hu, Y. Numerical Analysis on the Factors Affecting the Hydrodynamic Performance for the Parallel Surfaces With Microtextures. J. Tribol. 2014, 136, 21702. [Google Scholar] [CrossRef]
- Srirattayawong, S.; Gao, S. A computational fluid dynamics study of elastohydrodynamic lubrication line contact problem with consideration of surface roughness. Comput. Therm. Sci. Int. J. 2013, 5, 195–213. [Google Scholar] [CrossRef]
- Shang, Y.; Cheng, K.; Ding, H.; Chen, S. Design of a Hydrostatic Spindle and Its Simulation Analysis with the Application to a High Precision Internal Grinding Machine. Machines 2022, 10, 127. [Google Scholar] [CrossRef]
- Wang, Y.; Wu, J.; Wang, Y.; Xu, E.; Wang, S. Investigations on the applicability of hydrostatic bearing technology in a rotary energy recovery device through CFD simulation and validating experiment. Desalination Int. J. Sci. Technol. Desalt. Water Purif. 2016, 383, 60–67. [Google Scholar]
- Woloszynski, T.; Podsiadlo, P.; Stachowiak, G.W. Evaluation of inertia effect in finite hydrodynamic bearings with surface texturing using spectral element solver. Tribol. Int. 2015, 91, 170–176. [Google Scholar] [CrossRef]
Figure 1.
Schematic configuration of the grinder spindle hydrostatic thrust bearing.

Figure 2.
Schematic configuration of the hydrostatic thrust bearing and its oil film distribution.

Figure 3.
Schematic configuration of the different types of microtexture.

Figure 4.
Schematic configuration of oil film computational grid.

Figure 5.
Schematic diagram of calculation flow.

Figure 6.
Schematic diagram of Main nodes.

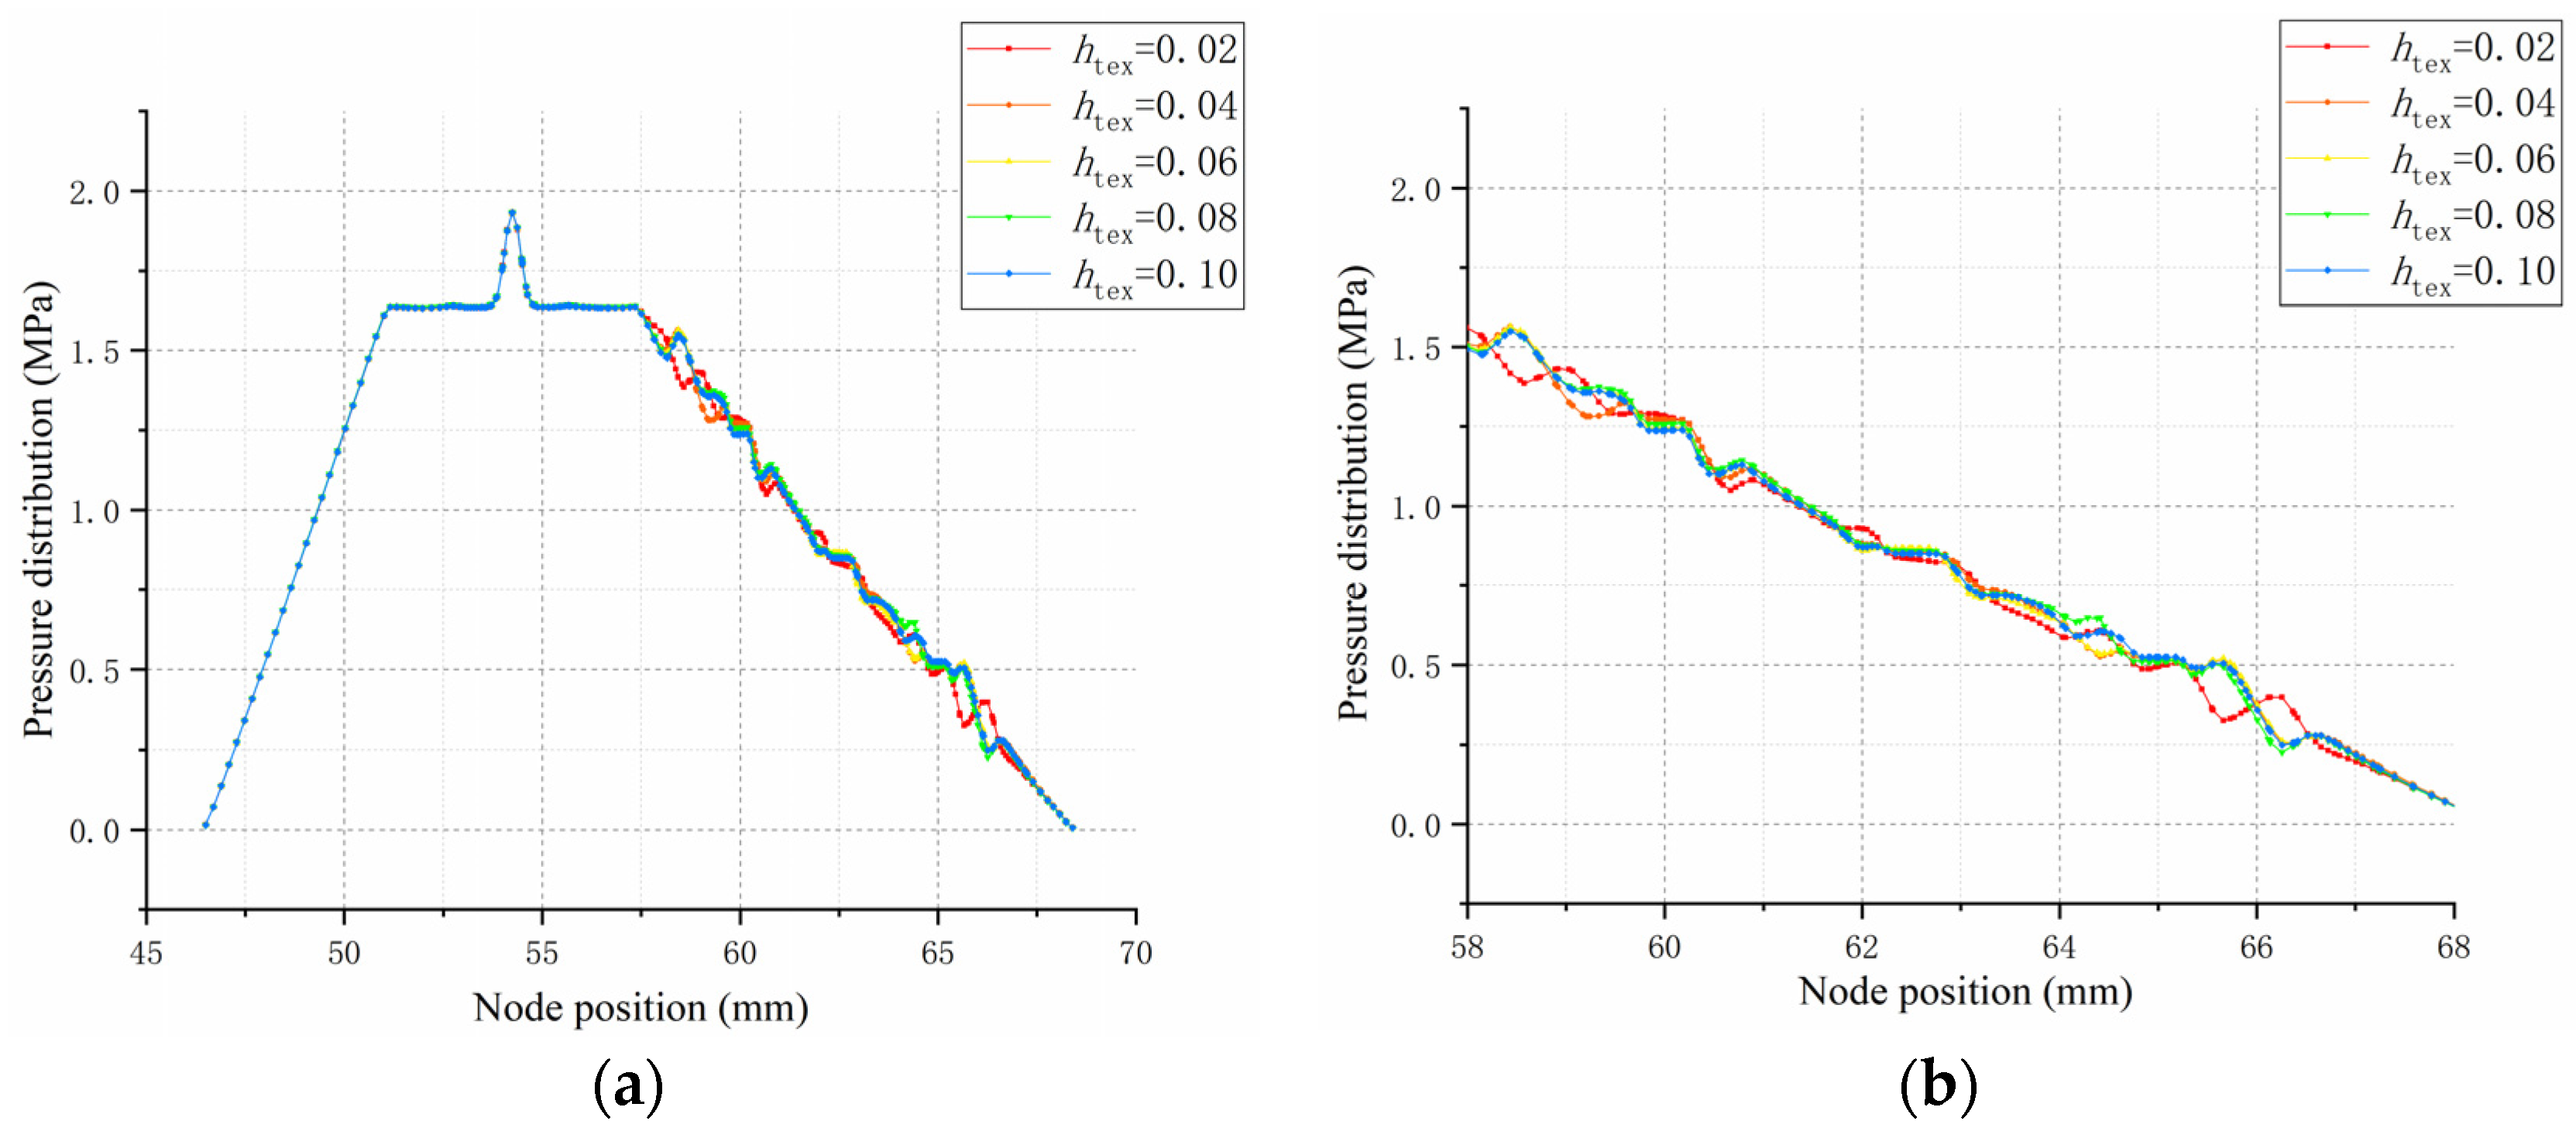
Figure 7.
Pressure and temperature comparison of two meshing schemes along the line of A-A (a) Pressure distribution; (b) the pressure enlarged view of different area; (c) temperature distribution; (d) the temperature enlarged view of different area.
Figure 7.
Pressure and temperature comparison of two meshing schemes along the line of A-A (a) Pressure distribution; (b) the pressure enlarged view of different area; (c) temperature distribution; (d) the temperature enlarged view of different area.

Figure 8.
Pressure and temperature of literature [27] along the line of A-A. (a) pressure distribution; (b) temperature distribution.
Figure 8.
Pressure and temperature of literature [27] along the line of A-A. (a) pressure distribution; (b) temperature distribution.

Figure 9.
Pressure and temperature distribution contours of the square type. (a) pressure countours; (b) the pressure enlarged view of microtexture area; (c) temperature counters; (d) the temperature enlarged view of microtexture area.
Figure 9.
Pressure and temperature distribution contours of the square type. (a) pressure countours; (b) the pressure enlarged view of microtexture area; (c) temperature counters; (d) the temperature enlarged view of microtexture area.

Figure 10.
Pressure and temperature distribution of square shape in different heights along the line of A-A. (a) pressure distribution; (b) the pressure enlarged view of microtexture area; (c) temperature distribution; (d) the temperature enlarged view of microtexture area.
Figure 10.
Pressure and temperature distribution of square shape in different heights along the line of A-A. (a) pressure distribution; (b) the pressure enlarged view of microtexture area; (c) temperature distribution; (d) the temperature enlarged view of microtexture area.

Figure 11.
Pressure and temperature distribution contours of the cylinder type. (a) pressure counters; (b) the pressure enlarged view of microtexture area; (c) temperature counters; (d) the temperature enlarged view of microtexture area.
Figure 11.
Pressure and temperature distribution contours of the cylinder type. (a) pressure counters; (b) the pressure enlarged view of microtexture area; (c) temperature counters; (d) the temperature enlarged view of microtexture area.


Figure 12.
Pressure and temperature distribution of cylindrical shape in different heights along the line of A-A. (a) pressure distribution; (b) the pressure enlarged view of microtexture area; (c) temperature distribution; (d) the temperature enlarged view of microtexture area.
Figure 12.
Pressure and temperature distribution of cylindrical shape in different heights along the line of A-A. (a) pressure distribution; (b) the pressure enlarged view of microtexture area; (c) temperature distribution; (d) the temperature enlarged view of microtexture area.


Figure 13.
Pressure and temperature distribution contours of the dimple type. (a) pressure counters; (b) the pressure enlarged view of microtexture area; (c) temperature counters; (d) the temperature enlarged view of microtexture area.
Figure 13.
Pressure and temperature distribution contours of the dimple type. (a) pressure counters; (b) the pressure enlarged view of microtexture area; (c) temperature counters; (d) the temperature enlarged view of microtexture area.

Figure 14.
Pressure and temperature distribution of dimple shape in different heights along the line of A-A. (a) pressure distribution; (b) the pressure enlarged view of microtexture area; (c) temperature distribution; (d) the temperature enlarged view of microtexture area.
Figure 14.
Pressure and temperature distribution of dimple shape in different heights along the line of A-A. (a) pressure distribution; (b) the pressure enlarged view of microtexture area; (c) temperature distribution; (d) the temperature enlarged view of microtexture area.

Figure 15.
Pressure and temperature distribution contours of the isosceles triangle type. (a) pressure counters; (b) the pressure enlarged view of microtexture area; (c) temperature counters; (d) the temperature enlarged view of microtexture area.
Figure 15.
Pressure and temperature distribution contours of the isosceles triangle type. (a) pressure counters; (b) the pressure enlarged view of microtexture area; (c) temperature counters; (d) the temperature enlarged view of microtexture area.

Figure 16.
Pressure and temperature distribution of isosceles triangle shape in different heights along the line of A-A. (a) pressure distribution; (b) the pressure enlarged view of microtexture area; (c) temperature distribution; (d) the temperature enlarged view of microtexture area.
Figure 16.
Pressure and temperature distribution of isosceles triangle shape in different heights along the line of A-A. (a) pressure distribution; (b) the pressure enlarged view of microtexture area; (c) temperature distribution; (d) the temperature enlarged view of microtexture area.


Figure 17.
Oil film performance curve in different heights of the effective bearing area. (a) Average load capacity; (b) Average temperature.
Figure 17.
Oil film performance curve in different heights of the effective bearing area. (a) Average load capacity; (b) Average temperature.

Figure 18.
Experimental bench of the hydrostatic thrust bearing with four type microtextures.

Figure 19.
Surface microtexture of the four different configurations.


Table 1.
Calculation results and errors of the two different mesh schemes.
| Mesh Scheme | Average Load Capacity (N) | Average Temperature (K) | Mass Flow Rate (L/min) | Stiffness N/μm |
|---|---|---|---|---|
| Scheme 1 | 1561.45 | 295.05 | 0.14 | 566.4 |
| Scheme 2 | 1580.41 | 297.43 | 0.15 | 566.8 |
| calculation error | 1.21% | 0.81% | 0.71% | 0.71% |
Table 2.
The experimental results are compared with the simulation results.
| Measured Parameters | Type 1 (Square Type) | Type 2 (Cylinder Type) | Type 3 (Dimple Type) | Type 4 (Triangle Type) | ||||||||
|---|---|---|---|---|---|---|---|---|---|---|---|---|
| Experimental Results | CFD Method Results | Error | Experimental Results | CFD Method Results | Error | Experimental Results | CFD Method Results | Error | Experimental Results | CFD Method Results | Error | |
| Average pressure (MPa) | 1.50 | 1.56 | 4% | 1.52 | 1.57 | 3.3% | 1.49 | 1.54 | 3.4% | 1.50 | 1.56 | 4% |
| Average temperature (K) | 296.2 | 299.75 | 1.2% | 295.7 | 298.06 | 0.8% | 301.2 | 303.62 | 0.8% | 300 | 302.18 | 0.7% |
Publisher’s Note: MDPI stays neutral with regard to jurisdictional claims in published maps and institutional affiliations. |
© 2022 by the authors. Licensee MDPI, Basel, Switzerland. This article is an open access article distributed under the terms and conditions of the Creative Commons Attribution (CC BY) license (https://creativecommons.org/licenses/by/4.0/).
Share and Cite
MDPI and ACS Style
Shang, Y.; Cheng, K.; Ding, H.; Chen, S. Design and Optimization of the Surface Texture at the Hydrostatic Bearing and the Spindle for High Precision Machining. Machines 2022, 10, 806. https://doi.org/10.3390/machines10090806
AMA Style
Shang Y, Cheng K, Ding H, Chen S. Design and Optimization of the Surface Texture at the Hydrostatic Bearing and the Spindle for High Precision Machining. Machines. 2022; 10(9):806. https://doi.org/10.3390/machines10090806
Chicago/Turabian StyleShang, Youyun, Kai Cheng, Hui Ding, and Shijin Chen. 2022. "Design and Optimization of the Surface Texture at the Hydrostatic Bearing and the Spindle for High Precision Machining" Machines 10, no. 9: 806. https://doi.org/10.3390/machines10090806
Note that from the first issue of 2016, this journal uses article numbers instead of page numbers. See further details here.