Definition of Damage Indices for Railway Axle Bearings: Results of Long-Lasting Tests †


Department of Mechanical Engineering, Politecnico di Milano, Via G. La Masa 1, 20156 Milan, Italy
*
Author to whom correspondence should be addressed.
†
This paper is an extended version of our conference: Pennacchi P., Chatterton S., Vania A. Diagnostics of Roller Bearings Faults During Long-Lasting Tests. In Processing of the International Conference of IFToMM ITALY. Naples, Italy, 9–11 September 2020.
Machines 2021, 9(1), 12; https://doi.org/10.3390/machines9010012
Submission received: 30 November 2020
/
Revised: 8 January 2021
/
Accepted: 11 January 2021
/
Published: 13 January 2021
(This article belongs to the Special Issue Italian Advances on MMS)
Abstract
:The European Rail Transport System has set goals of improving the reliability, availability, durability, high-speed capacity, and maintenance. In this context, the condition monitoring approach is of fundamental importance for all components of the “train” system. The authors have long been in the diagnostics of the railway traction system, with a focus on rolling element bearings. In this paper, signal processing techniques, already developed in the past and experimentally validated in the railway field, are applied to vibration data for the definition of damage indices for railway axle bearings. This allows to evaluate the “status” of the bearing and the monitoring of the evolution of any damage that may occur. The experimental data were obtained by means of a test-rig built according to EN 12082:2017 and following the test specifications of the same standard.
1. Introduction
Whereas considerable attention has been paid to the development of techniques and algorithms, which were able to identify malfunctioning in bearings, less importance has been devoted to the investigation of the bearing behavior in real railway applications. This paper, which is an extended version, with much more experimental results, of that presented during IFIT2020—The Third International Conference of IFToMM ITALY conference by the same authors, aims at filling this gap.
In particular, the condition monitoring of railway axle bearings (RWAB) is the topic of a recent review [1] published by a research group with a wide experience in this specific field, as proved also by their previous papers [2,3,4,5,6]. This review has highlighted, once again, the value of condition-based maintenance for RWAB, and, consequently, their diagnostics. Another important topic pointed out is that investigations and results of experimental campaigns on these components are still very limited, in the literature, with respect to the number of the papers dealing with diagnostics of rolling bearings for general applications. Despite the detailed references listed in [1] (about 100), it is interesting to analyze the state of the art, also for underlining that specific papers on this topic have appeared with a certain frequency in the literature only in the last few years. One of the few papers focusing on real damaged bearings taken from the railway service is [7], in which data related to about 47,000 failed bearings, installed on wheel axles of freight cars, were collected and classified in seven groups, depending on the operation time, in order to determine the failure distribution. Besides the discussion about the statistical approach proposed for the determination of the useful life of bearings, some interesting considerations about bearing failure mode are listed in that paper. The relevant number of considered bearings allows observing that the most frequent types of defect are caused by contact fatigue, which creates micro-cracks under the surfaces of the bearing parts. These micro-cracks propagate with the functioning cycles and finally reach the surface, creating a spall. Failures usually occur in the outer ring, in the inner ring and in the rolling elements. Considering all the bearings taken from railway service, independently from their installation date, the most recurrent failure mode is represented by fatigue in the outer ring (58%). Although fatigue in inner ring is the second failure mode in order of appearance, it affects only 13% of the damaged bearings. Only 5%, 4%, and 3% of railway bearings are affected by oxidation, micro-fatigue, and fatigue on rolling elements, respectively. Other damages are merged in one category, which represents the remaining 17% of the amount. Two cases of failures of bogie bearing for railway car wagons are presented in [8]. Both are related to wagons in service for about 30 years at the time of the failure. The wagons were inspected with intervals of 5 years, during which the wagons ran for 400,000 km. Thanks to the analysis of the damaged RWAB, the cause of the failure was identified. Due to their prolonged permanence in service, the inner rings of the bearings were fractured by fatigue. These fractures led to loosening of the inner rings of the bearings, the axle slid and obstructed the rollers during rotation. Friction was generated by the interaction between the axle and rolling element with the ring, causing the heating of the components. This increased the nucleation and the growth of cracks on the axle and speed up the melting of bearings cages. In these conditions, the components deteriorated quickly and led to catastrophic failure. One of the first papers on RWAB diagnostics in the literature is [9], in which an algorithm, based on ensemble empirical mode decomposition (EEMD) and Hilbert marginal spectrum, is presented. It is well known that all the methods based on empirical mode decomposition (EMD) require further data processing on the intrinsic mode functions (IMF) to extract fault features, as shown by one of the authors of this paper in [10]. In this case, Hilbert marginal spectrum to select the IMF containing the fault features. The data used to validate the proposed method are obtained by means of a full-scale test-rig employing the bearings and the axle of a high-speed train. A failure identification method, which merges signal processing to artificial intelligence, is proposed in [11] for RWABs. The algorithm employs local characteristic-scale decomposition multi-scale permutation entropy (LCD-MPE) and extreme learning machine AdaBoost (ELM-AdaBoost). The performances of this method are tested on a laboratory test-rig with artificially damaged RWABs. The general success story of the application of EMD for RWAB diagnostics is not limited to [9]. Some fault indices are presented in [12] for RWABs condition monitoring. The indices are based on ensemble empirical mode decomposition (EEMD) of vibration signals and on the subsequent analysis in three different domains: time, instantaneous frequency and “shape”, the latter defined considering that, under ideal conditions, the trajectory of a point motion will follow a certain rule, so it will have a fixed shape pattern. Once a steady departure occurs, the shape pattern will change accordingly. The effectiveness of the indices is verified by using the data obtained by means of the test-rig described in [9]. The same data are also used in [13] to test and the validate the effectiveness of another method, named “sparsity guided empirical wavelet transform”, and to compare it with the enhanced envelope spectrum obtained by the fast spectral correlation. A pretty sophisticated method, named “modified scale-space guiding variational mode decomposition”, is introduced in [14] on purpose for RWABs. Starting from the variational mode decomposition of a signal, a “scale” measure is introduced in order to define the bandwidth of the intrinsic mode functions, to which envelope analysis is finally applied. The performances of this method are tested on data measured on the test-rig described in [9]. Data of RWAB, measured on the test-rig described in [9], are employed in [15] for drafting a guideline to determine informative spectral frequency bands for generating enhanced/squared envelope spectra from spectral coherence for bearing fault diagnosis. The effectiveness of the proposed guideline is compared to the fast kurtogram algorithm [16], obtaining better results in the considered experimental cases. The modelling of wear in RWABs (of radially loaded spherical type) is the subject of the study presented in [17], by considering various loading and friction scenarios. The finite element analyses show a three zoned wear profile showing increasing bearing wear with increasing load and friction conditions. Sometimes, the vibrations measured on the RWAB are used also for other purposes, such as the condition-monitoring of the axle. An example is given in [18], where a real-time technique is proposed, by applying wavelet packet transformed energy to the vibrations measured along three mutually orthogonal direction on the two RWABs. The collected data are then processed by a support vector machine diagnosis model. Experimental results, obtained in a test-rig specifically designed and using a bogie for freight transport, are presented to prove the reliability of the proposed method.
The authors have dealt with diagnostics of bearing for rail applications in the past, first developing and testing special diagnostics techniques, for traction system bearings, which are robust with respect to heavy environmental noise (caused by wheel-track interaction or by electro-magnetic disturbance) [19,20,21,22]. Then, a condition monitoring system for motor, gearbox and axlebox has been designed and installed by the authors on a regional locomotive, which is still in commercial service [23,24]. The data collected during these years have boosted the development of reliable diagnostic [25,26] and even prognostic tools [27] for bearings employed in railway applications. The authors’ aim in this paper is at contributing to the diagnostics of RWABs and at defining some suitable indices, which can be used, in a condition monitoring approach, to evaluate the condition of the bearing, following on the research started in [28]. Indeed, the replacement of a defective bearing may not be immediately possible in industrial applications, unlike in laboratory tests, which are often aimed solely at the diagnostics of bearings. In the case of RWABs, the replacement implies a major maintenance, which in some cases cannot be carried out immediately, in compliance with the safety requirements for the railway vehicle and for the line. Therefore, it is of fundamental importance, once damage is discovered in a bearing, to have a “measure” of its severity, so that the maintenance and replacement of the damaged bearing can be scheduled safely, but economically.
For this purpose, the vibration data, obtained during a long-lasting test carried out on a test-rig built according to the standard EN 12082:2017, will be analyzed in this paper. This is an important difference from the data obtained by other test-rigs and used in the literature for the validation of diagnostic methods, since the test procedure is defined by a standard, which is one of those recently published to improve the reliability, availability, durability, high-speed capacity and maintenance of the European Rail Transport System. In this context, it has been recognized that it is necessary to ensure the quality, safety and efficiency required of axle boxes, by means of the set of standards: EN 12080, EN 12081 and EN 12082. In particular, the latter European standard has been drawn up with the aim of homogenizing the testing of axle boxes performance for all types of rolling stock to ensure the required suitability for service, i.e., the assembly of the box housing, bearings, seals and grease are suitable for service requirements. These tests are carried out in two phases, a “bench test” and a “field test”.
The paper is organized as follows: Section 2 describes the test rig employed for performing the experimental tests and provides characteristics of the data sets; Section 3 introduces the basics of improved envelope analysis and the damage indices; Section 4 details the results of the fault detection and localization and presents the trends of the damage indices; the conclusions are in the final Section 5.
2. Experimental Tests on Railway Axle Bearings
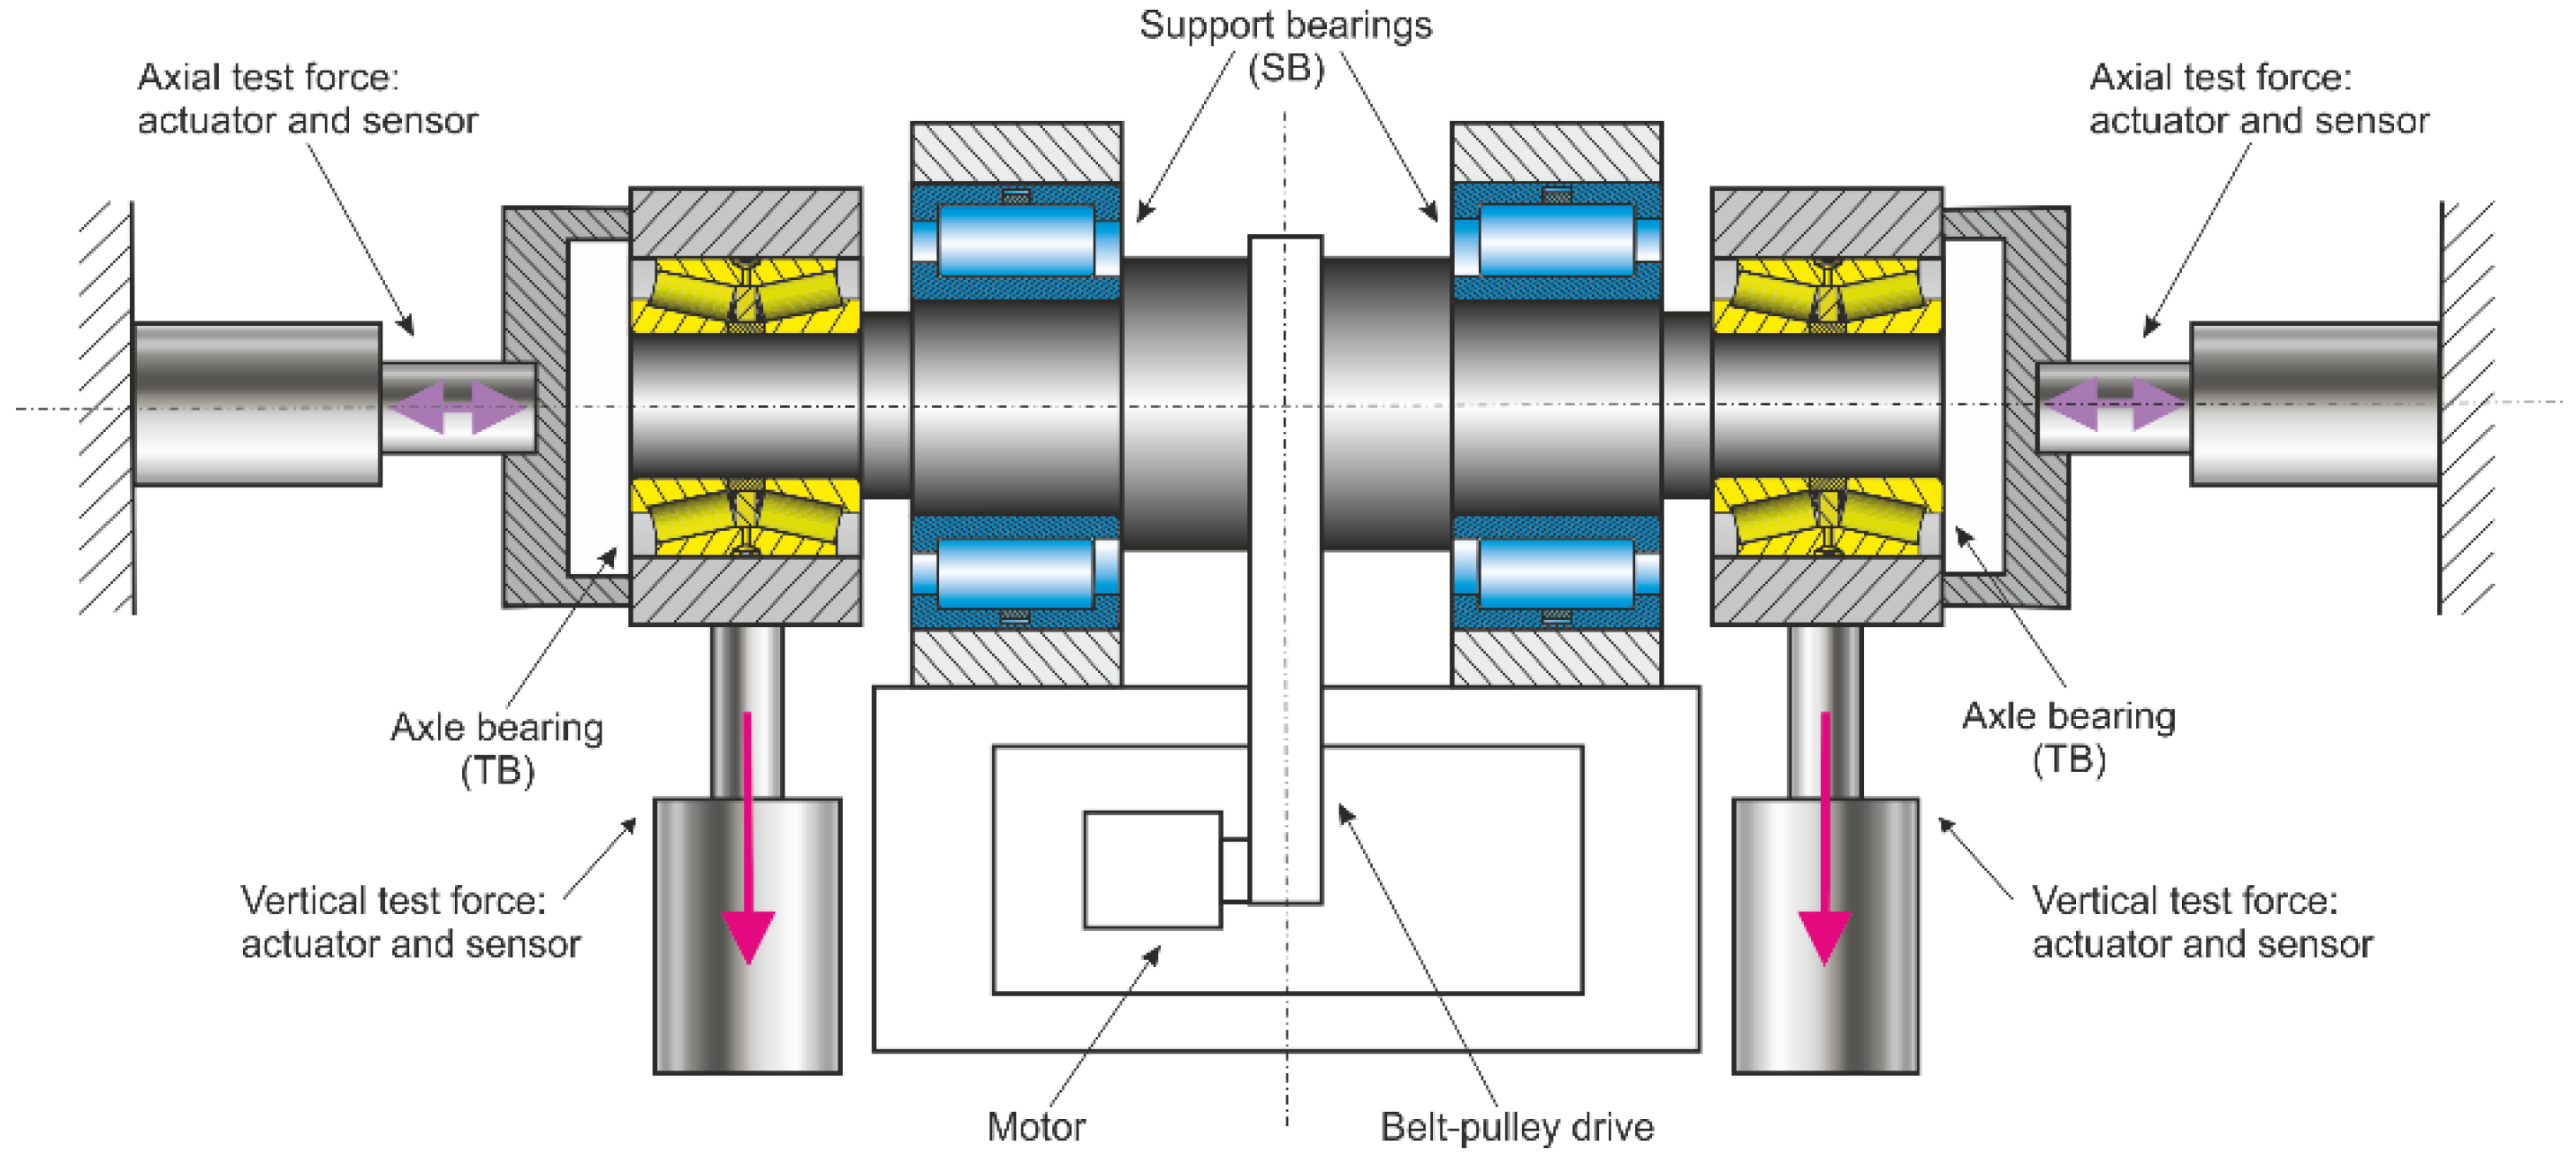
In this paper, the data considered are those of the first phase of the tests performed accordingly to the EN 12082:2017 standard, i.e., the “bench test”. An outline of the test-rig is shown in Figure 1, in which the two bearings under test (in this case, two tapered roller bearing units FAG TAROL 150/250-R-TVP, henceforth named as test bearings—TBs) are installed on the extremities of a stub dummy axle and are loaded by vertical constant and by axial variable forces. The dummy axle is also supported by a couple of low-friction cylindrical roller bearings (in this case, two FAG LSL 192332-BIR-A-C3, henceforth named as support bearings—SBs). Other systems complete the test-rig apparatus, namely, a suitable lubricating system, some environmental temperature sensors, and a cooling system.
2.1. Experimental Data Measurements
The results presented in this paper consider two vibration data sets, measured on the left and the right TBs of the test-rig. The overall duration of the test campaign was of two months and half. At the beginning of the tests, the bearings were in brand new conditions, while a very high number of test cycles, for both axial load and rotational speed, were performed owing to the EN 12082:2017 specification, as described hereafter.
The vibration signals were sampled at 12,800 Hz in a time window of acquisition of 0.64 s, thus the length of all the records of the sets was of 8192 samples. The sampling frequency and the time window/length of the records are less than those usually employed in laboratory tests, but they have been kept “as they are”, because in actual field applications, data acquisition systems are generally much less performing. During the tests, the rated rotational speed was set to 1371 rpm, which corresponds to the frequency of 22.85 Hz, and only the vibration records measured at that speed have been used for the following analyses.
Table 1 summarizes the frequencies of the faults of the different bearing elements, for both the TBs and the SBs. The acronyms are those generally used for bearing diagnostics, i.e., BPFI—ball or rolling element passing frequency on inner race; BPFO—ball or rolling element passing frequency on outer race; BSF—ball or rolling element spin frequency; FTF—fundamental train frequency. Table 1 warns about the possible overlapping of the fault frequencies between the 1xBPFO of the TBs and the 2xBPFI of the SBs.
2.2. Test Cycles and Operating Conditions
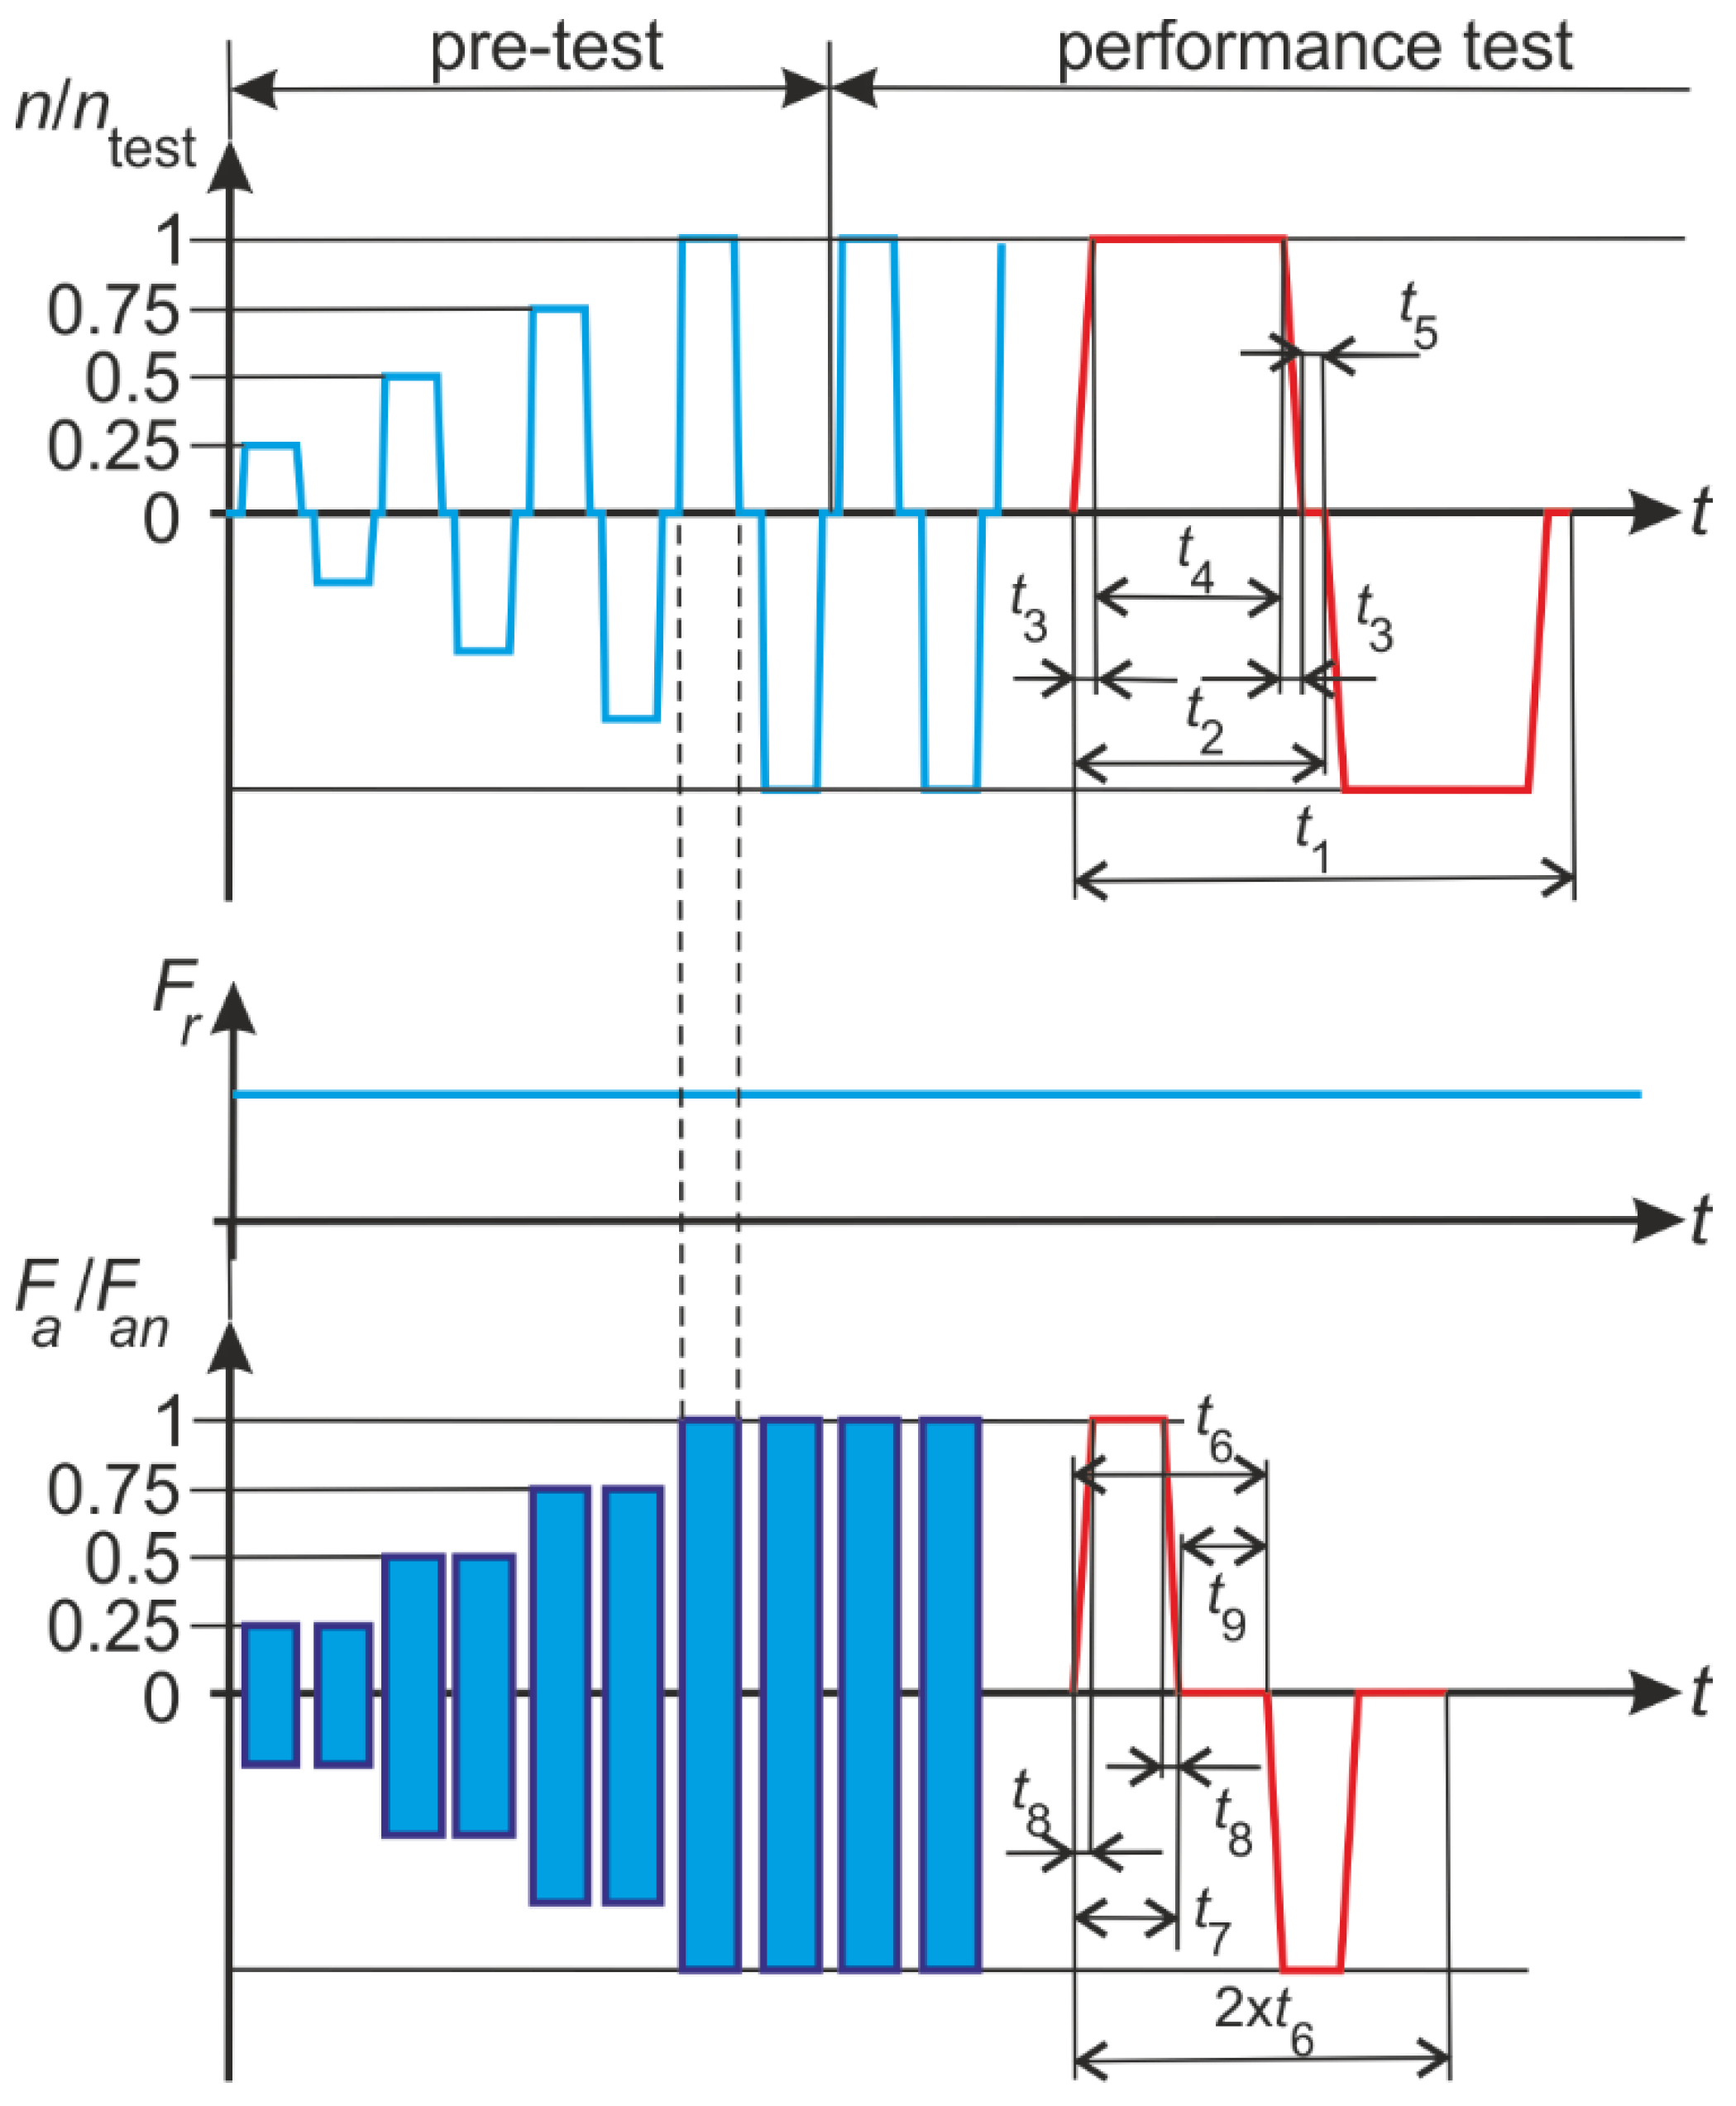
Considering that the rated rotational speed was set to 1371 rpm, EN 12082:2017 test specifications are summarized in Figure 2, while the corresponding symbols are listed in Table 2. While the radial load is kept as constant during each test run, the rotational speed and the axial test force are increased step-by-step, during the first six test cycles, up to the rated values. Actual values of the loads have been determined by using the radial and axial load, which were compliant with EN 12082:2017 specifications, but cannot be reported for confidential issues.
Moreover, to perform a blind test, no correlation between the actual axial force (hence it is not reported anywhere in the paper) and the records has been considered. Only the absolute value of the rotational speed has been used. Because of this, the set of the data have not the same number of records for the left and right TBs, resulting equal to 1571 and 1760, respectively.
The actual operating conditions of a train are reproduced by the two previous assumptions: the axial loads on the wheel axle during the operation are generally unknown and can be considered as random variables, while the information about the rotational speed direction is generally not available to the condition monitoring system—especially for freight trains—unless it is connected to the train communication network (TCN).
However, the diagnosis of the fault can be influenced by the rotational speed direction and the amplitude of the axial load. It has been already shown by the authors [29,30] that the variation of the amplitude of the axial load may cause skidding, leading to deviation of the actual value of the fault frequencies. Despite this, the methods introduced in the paper have proved to be robust considering a random axial load.
3. Application of Improved Envelope-Based Algorithms for Bearing Diagnostics and for the Definition of Fault Indices
A brief explanation of the terms and symbols used in the following is introduced in this section, along with the description of the algorithm for fault diagnostics, which has been developed starting from those already presented in [29,31].
3.1. Basics of Envelope Analysis and of Squared Envelope Spectrum
It is well recognized in the literature [32,33] that the so-called “envelope analysis” is one of the most powerful signal processing tools for extracting the modulating signal, related to a damage, from a record of vibration data. Several steps are required, among these the application of the Hilbert transform to obtain the “envelope signal”, which provides the instantaneous amplitude, i.e., the power, of the signal. The steps are here briefly summarized:
- 1.
- The residual signal is filtered by means of a band-pass filter. Actually, this is the most critical part of the “envelope analysis” algorithm, because, generally, the signal is influenced by many modulations, caused by other components of the mechanical system and by environmental or mechanical noise, at low and medium frequencies. Thus, the signal has to filtered in the neighborhood of the frequency of the carrier , which is nearby on of the resonance frequency of the system:
- 2.
- Then, the “analytic signal” of the filtered signal is calculated. The analytic signal is defined as a complex-valued function with no negative frequency components. The real part of the analytic signal is given by the filtered signal , while the imaginary part is the Hilbert transform of the filtered signal:
- 3.
- The “envelope” of the filtered signal is defined as the absolute value of the analytic signal:
For practical reasons, the “square of the envelope” is employed in place of the envelope:
- 4.
- The “envelope spectrum” (ES) is obtained by applying the Fourier transform to the square of the envelope:
Like the envelope, also for the envelope spectrum, the use of its square is preferred and named the “squared envelope spectrum” (SES):
Even in presence of heavy noise in the original signal, the SES shows clear spectral lines in the neighborhood of the theoretical fault frequencies for damaged bearings. However, while the calculation of the SES allows the identification of the typical frequencies of defects in rolling element bearings, the numerous steps and transformation operations, during signal processing algorithm, determines that the simple amplitude of the SES component at the frequency of the defect does not constitute a reliable estimate of the damage severity.
3.2. Definition of the Indices for the Selection of the Optimal Frequency Band for Signal Filtering and for the Monitoring of the Fault Severity
In the following, some indices are briefly introduced and are used for both selecting the optimal frequency in which the signal has to be filtered (see Equation (1)) and provide a metrics for the severity of the damage. The rationale of the last ones is to “normalize” as much as possible the amplitude of the SES (in correspondence of a developing fault or not) or to introduce other measures of the “local” intensity in the frequency domain. Obviously, the best trend index is not possible to be defined a priori and, actually, the long-lasting test presented here are intended for providing and empirical evaluation of the proposed indices.
- 5.
- Root mean square:where n is the record length.
- 6.
- Kurtosis:
- 7.
- Band kurtosis:where the indexes l and h represent the boundaries of the filtering band.
- 8.
- Kurtosis of the SES:representing the kurtosis of the SES evaluated only in a portion of SES across the defect frequency, where, the range p,q is assumed to be equal to three times the rotational speed.
- 9.
- Ratio of Content Component (RCC), associated to the cyclic band :
- 10.
- The range l,h is assumed equal to 10% of the fault frequency. SES peak at the damaged frequency:
- 11.
- Normalized SES peak at the damaged frequency:
- 12.
- STR index (SES to Threshold Ratio):
The statistical threshold [34] is defined in the domain of the cyclic frequencies and represents the frequency distribution of colored noise signal of healthy bearing with the probability p:
where is the 2-degrees of freedom Chi-square distribution.
- 13.
- Continuous phase status (CPS):
- 14.
- Spectral entropy (SE):
4. Results of the Long-Lasting Tests
4.1. Definition of the Optimal Frequency Band of the Filter for the Left Bearing
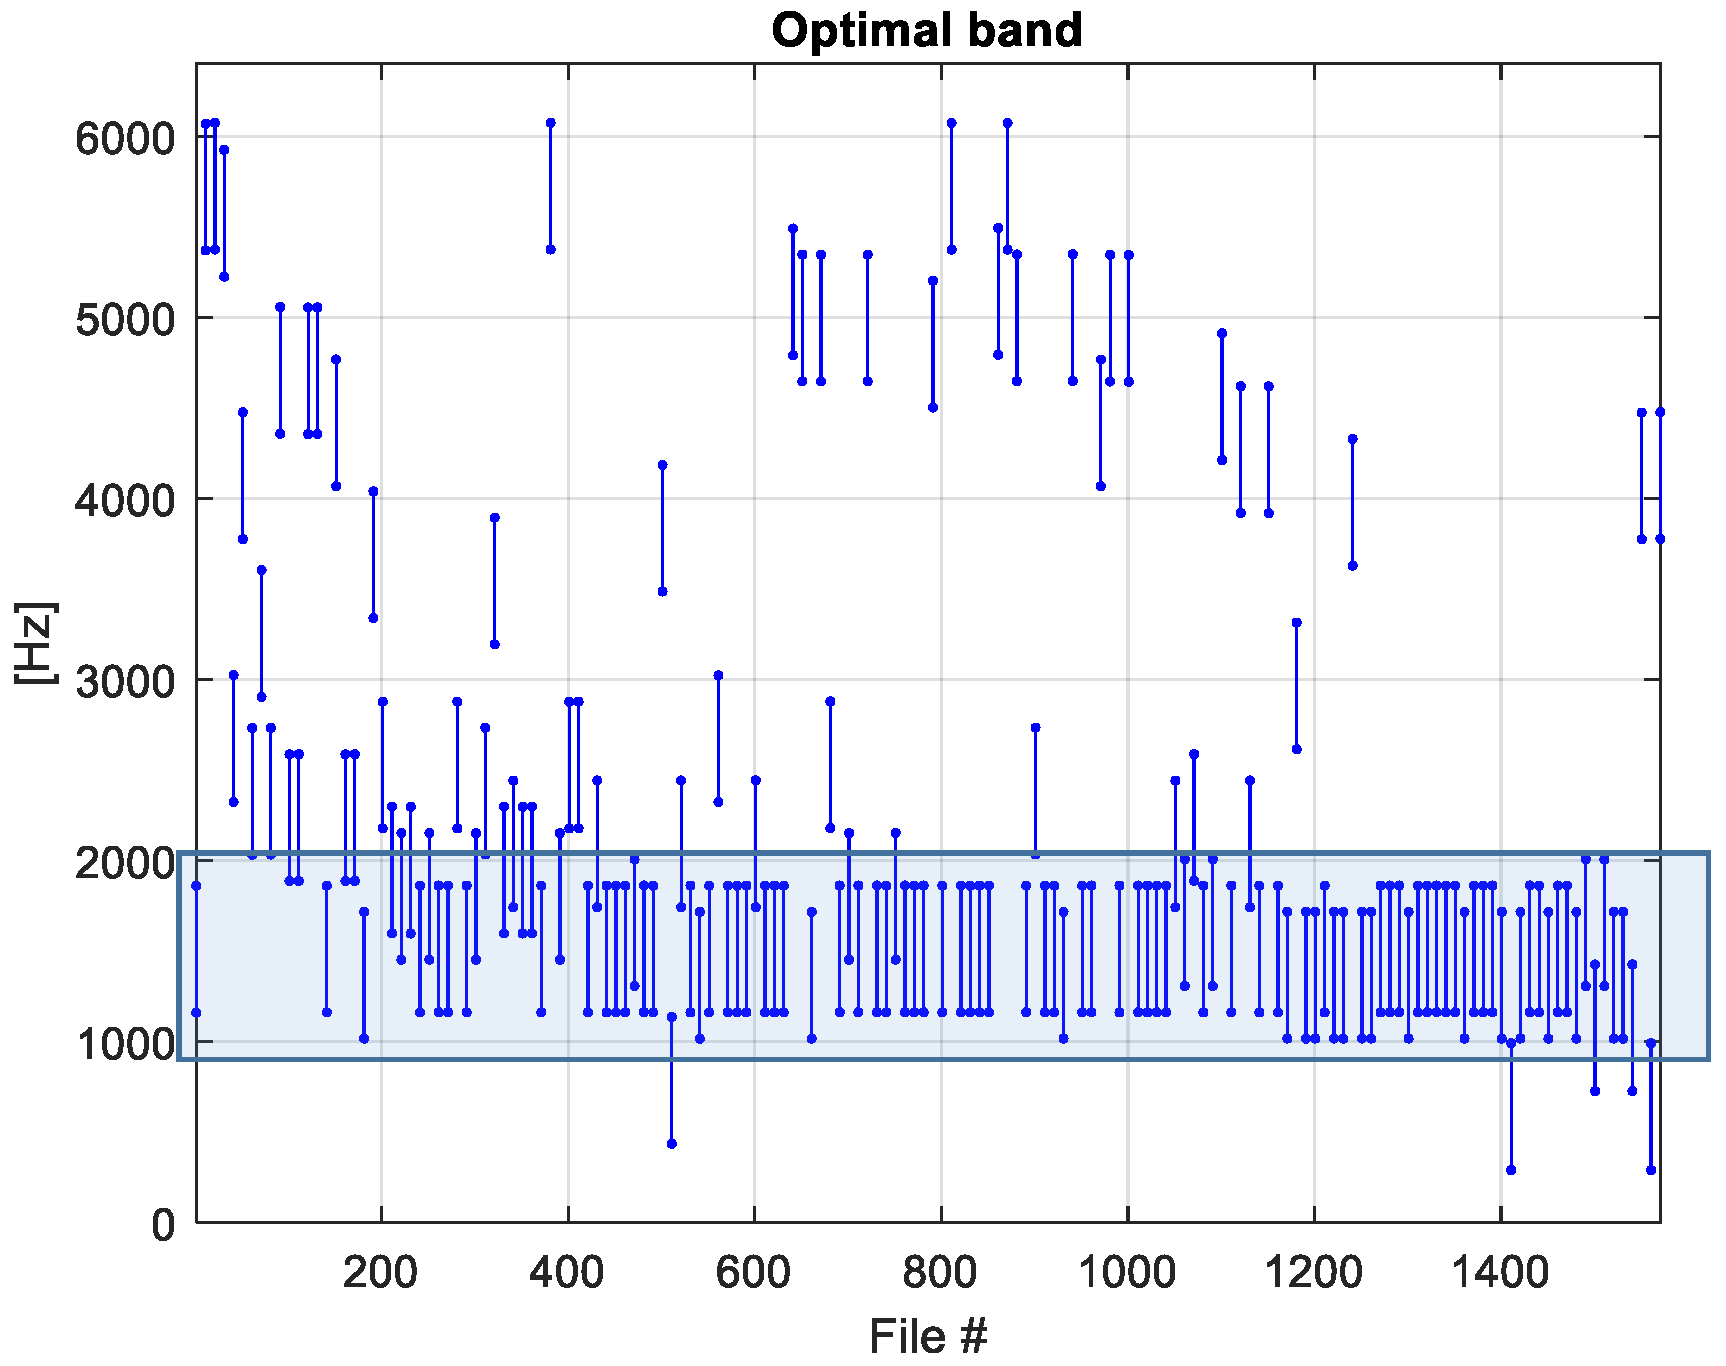
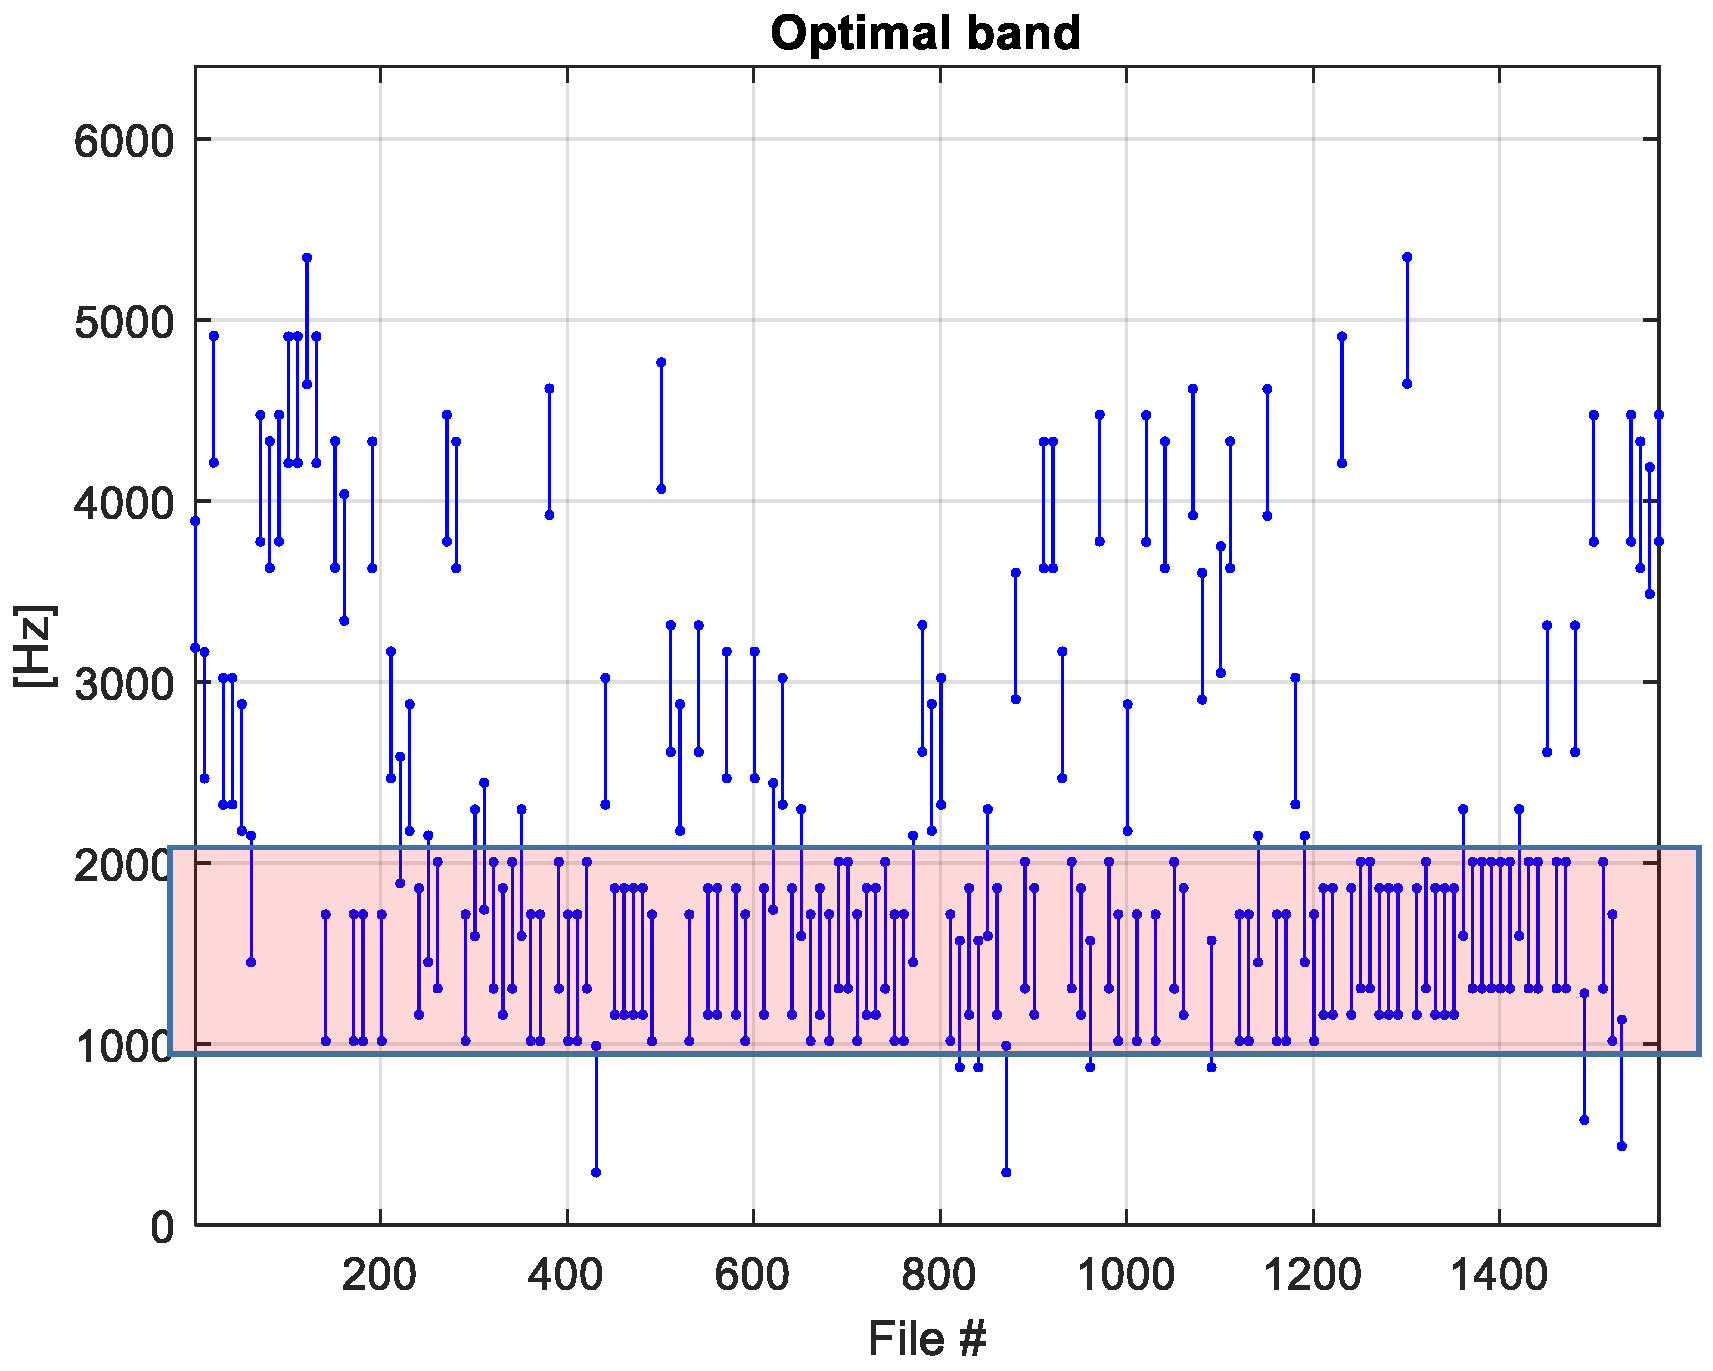
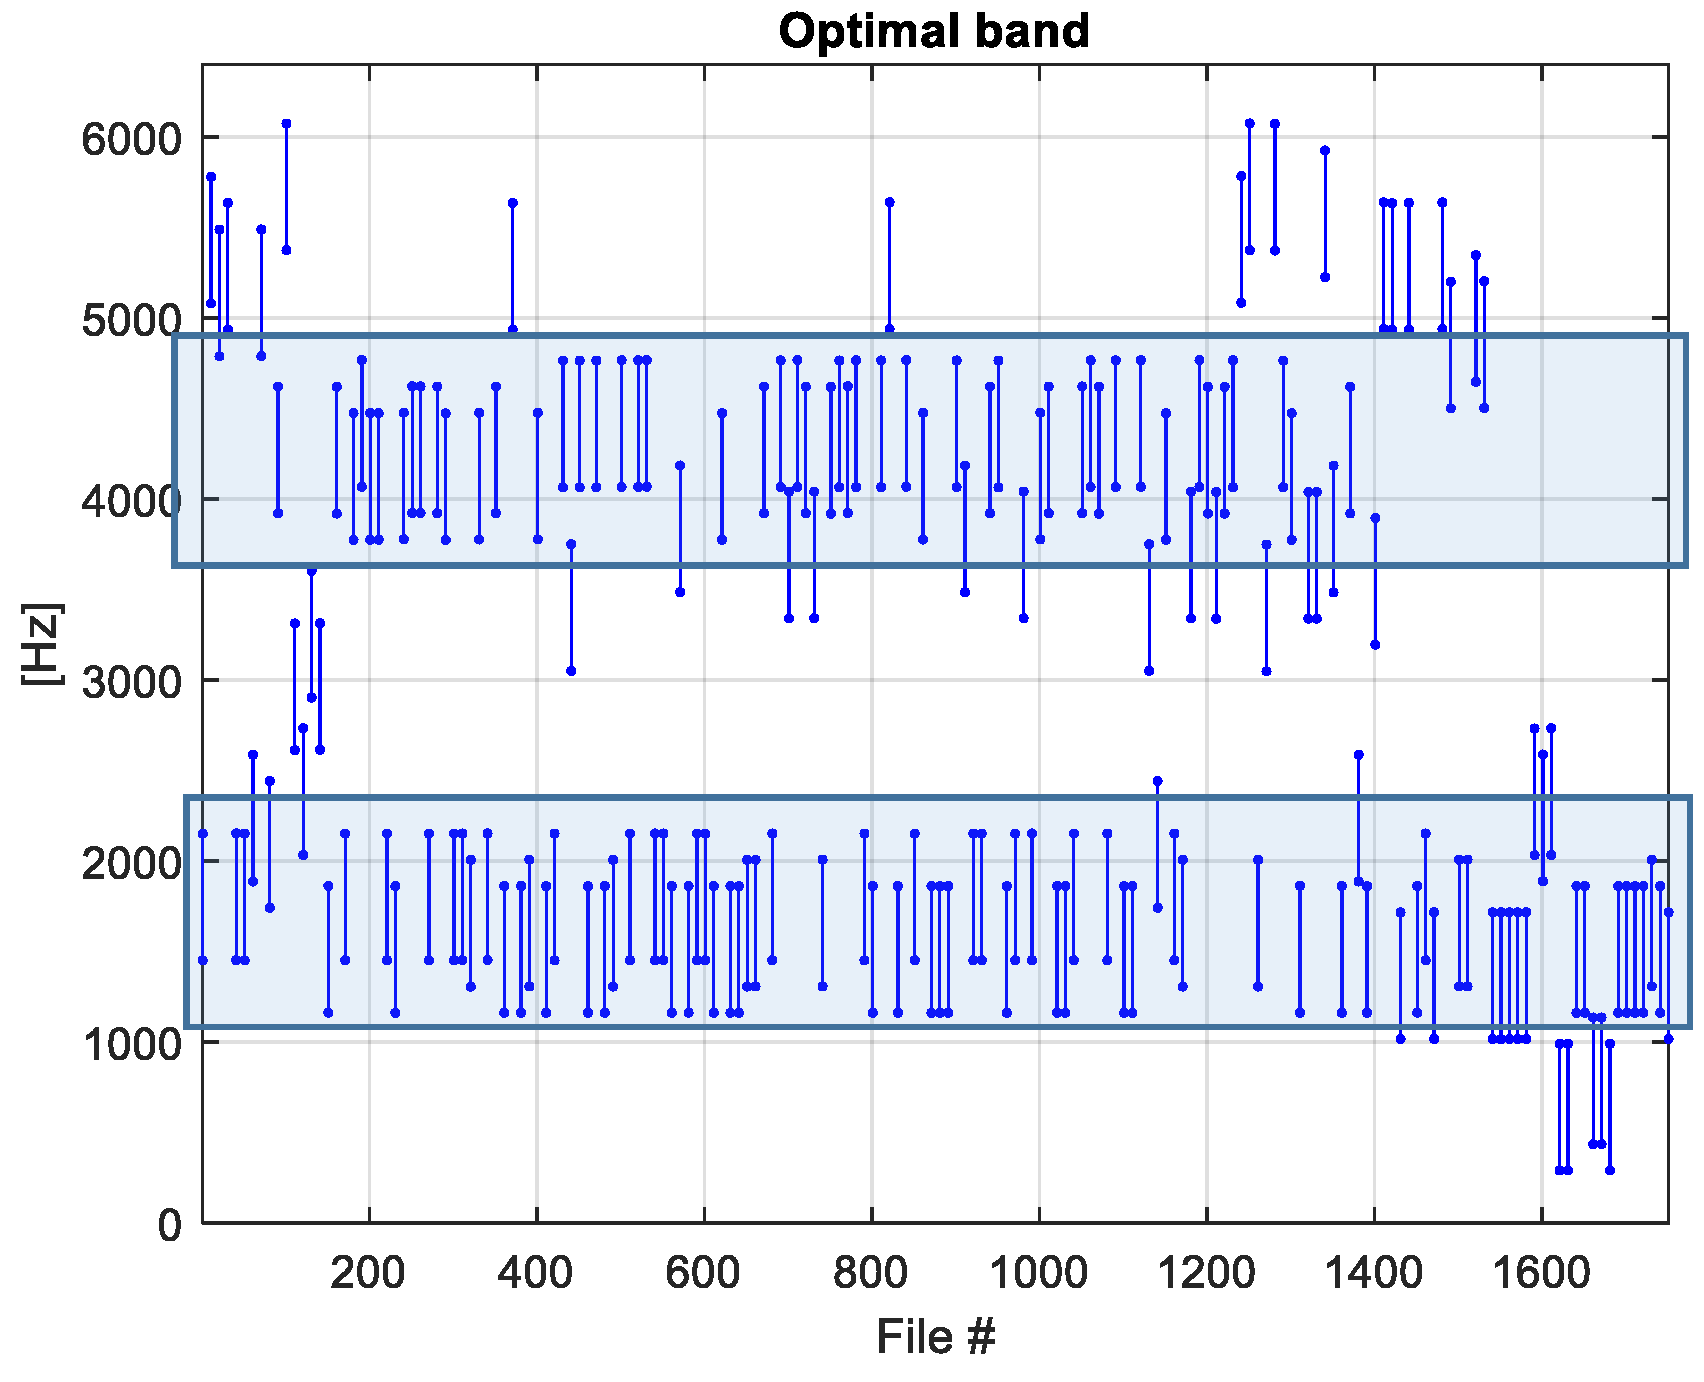
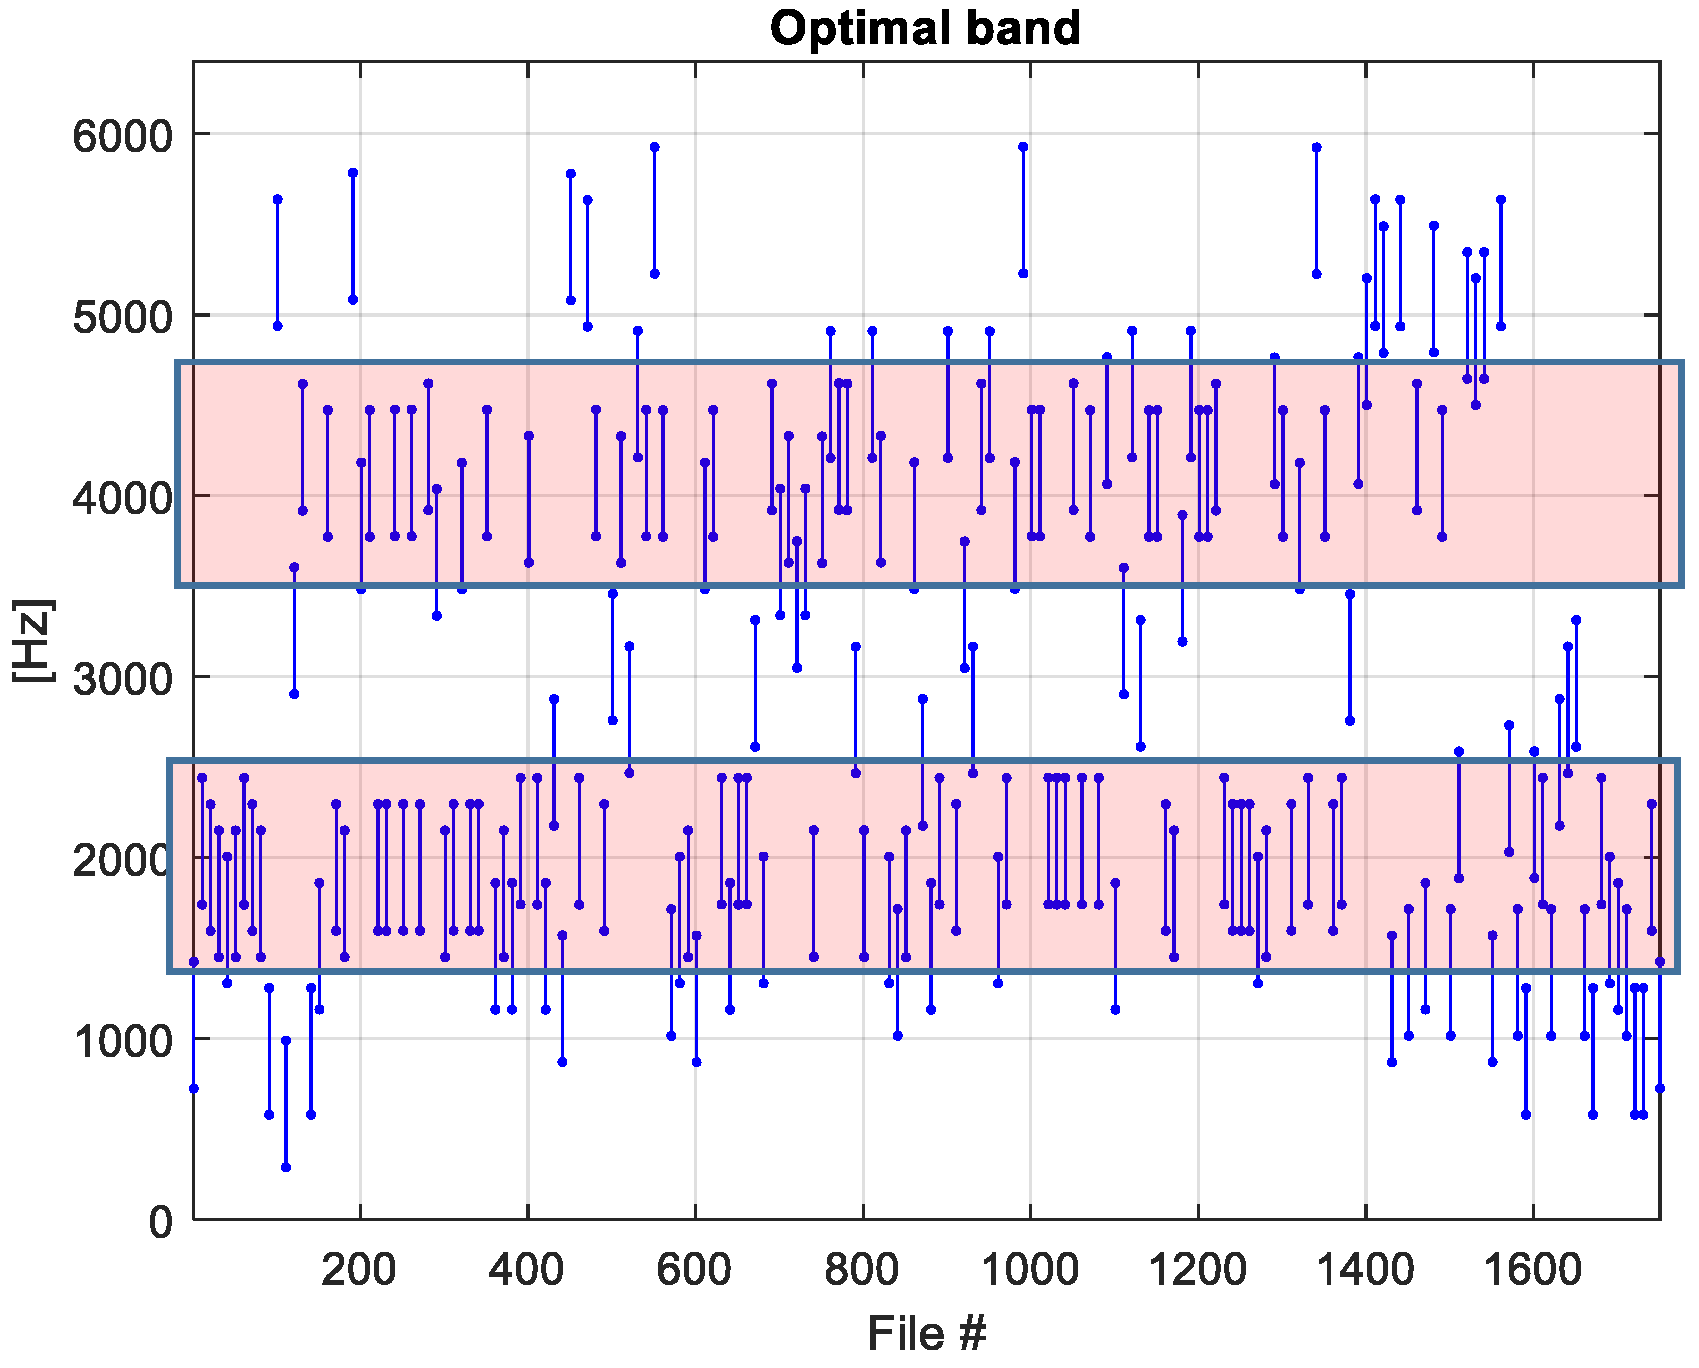
The selection of the frequency band of the filter used for the envelope-based method is defined by the bandwidth (BW) and the central frequency (). The bandwidth has been fixed to be equal to 2.5 times the maximum fault frequency (BPFI). At the rated rotational speed of 22.85 Hz, the selected bandwidth is equal to 700 Hz. The central frequency has been selected by maximizing two indices, the RCC and the kurtosis of the SES, see [21] for full details and for the advantages of using these last indices for the selection of the center frequency. Both of two indices (see Figure 3 and Figure 4) return an optimal central frequency at approximately 1500 Hz.
4.2. Fault Detection and Localization for the Left Bearing
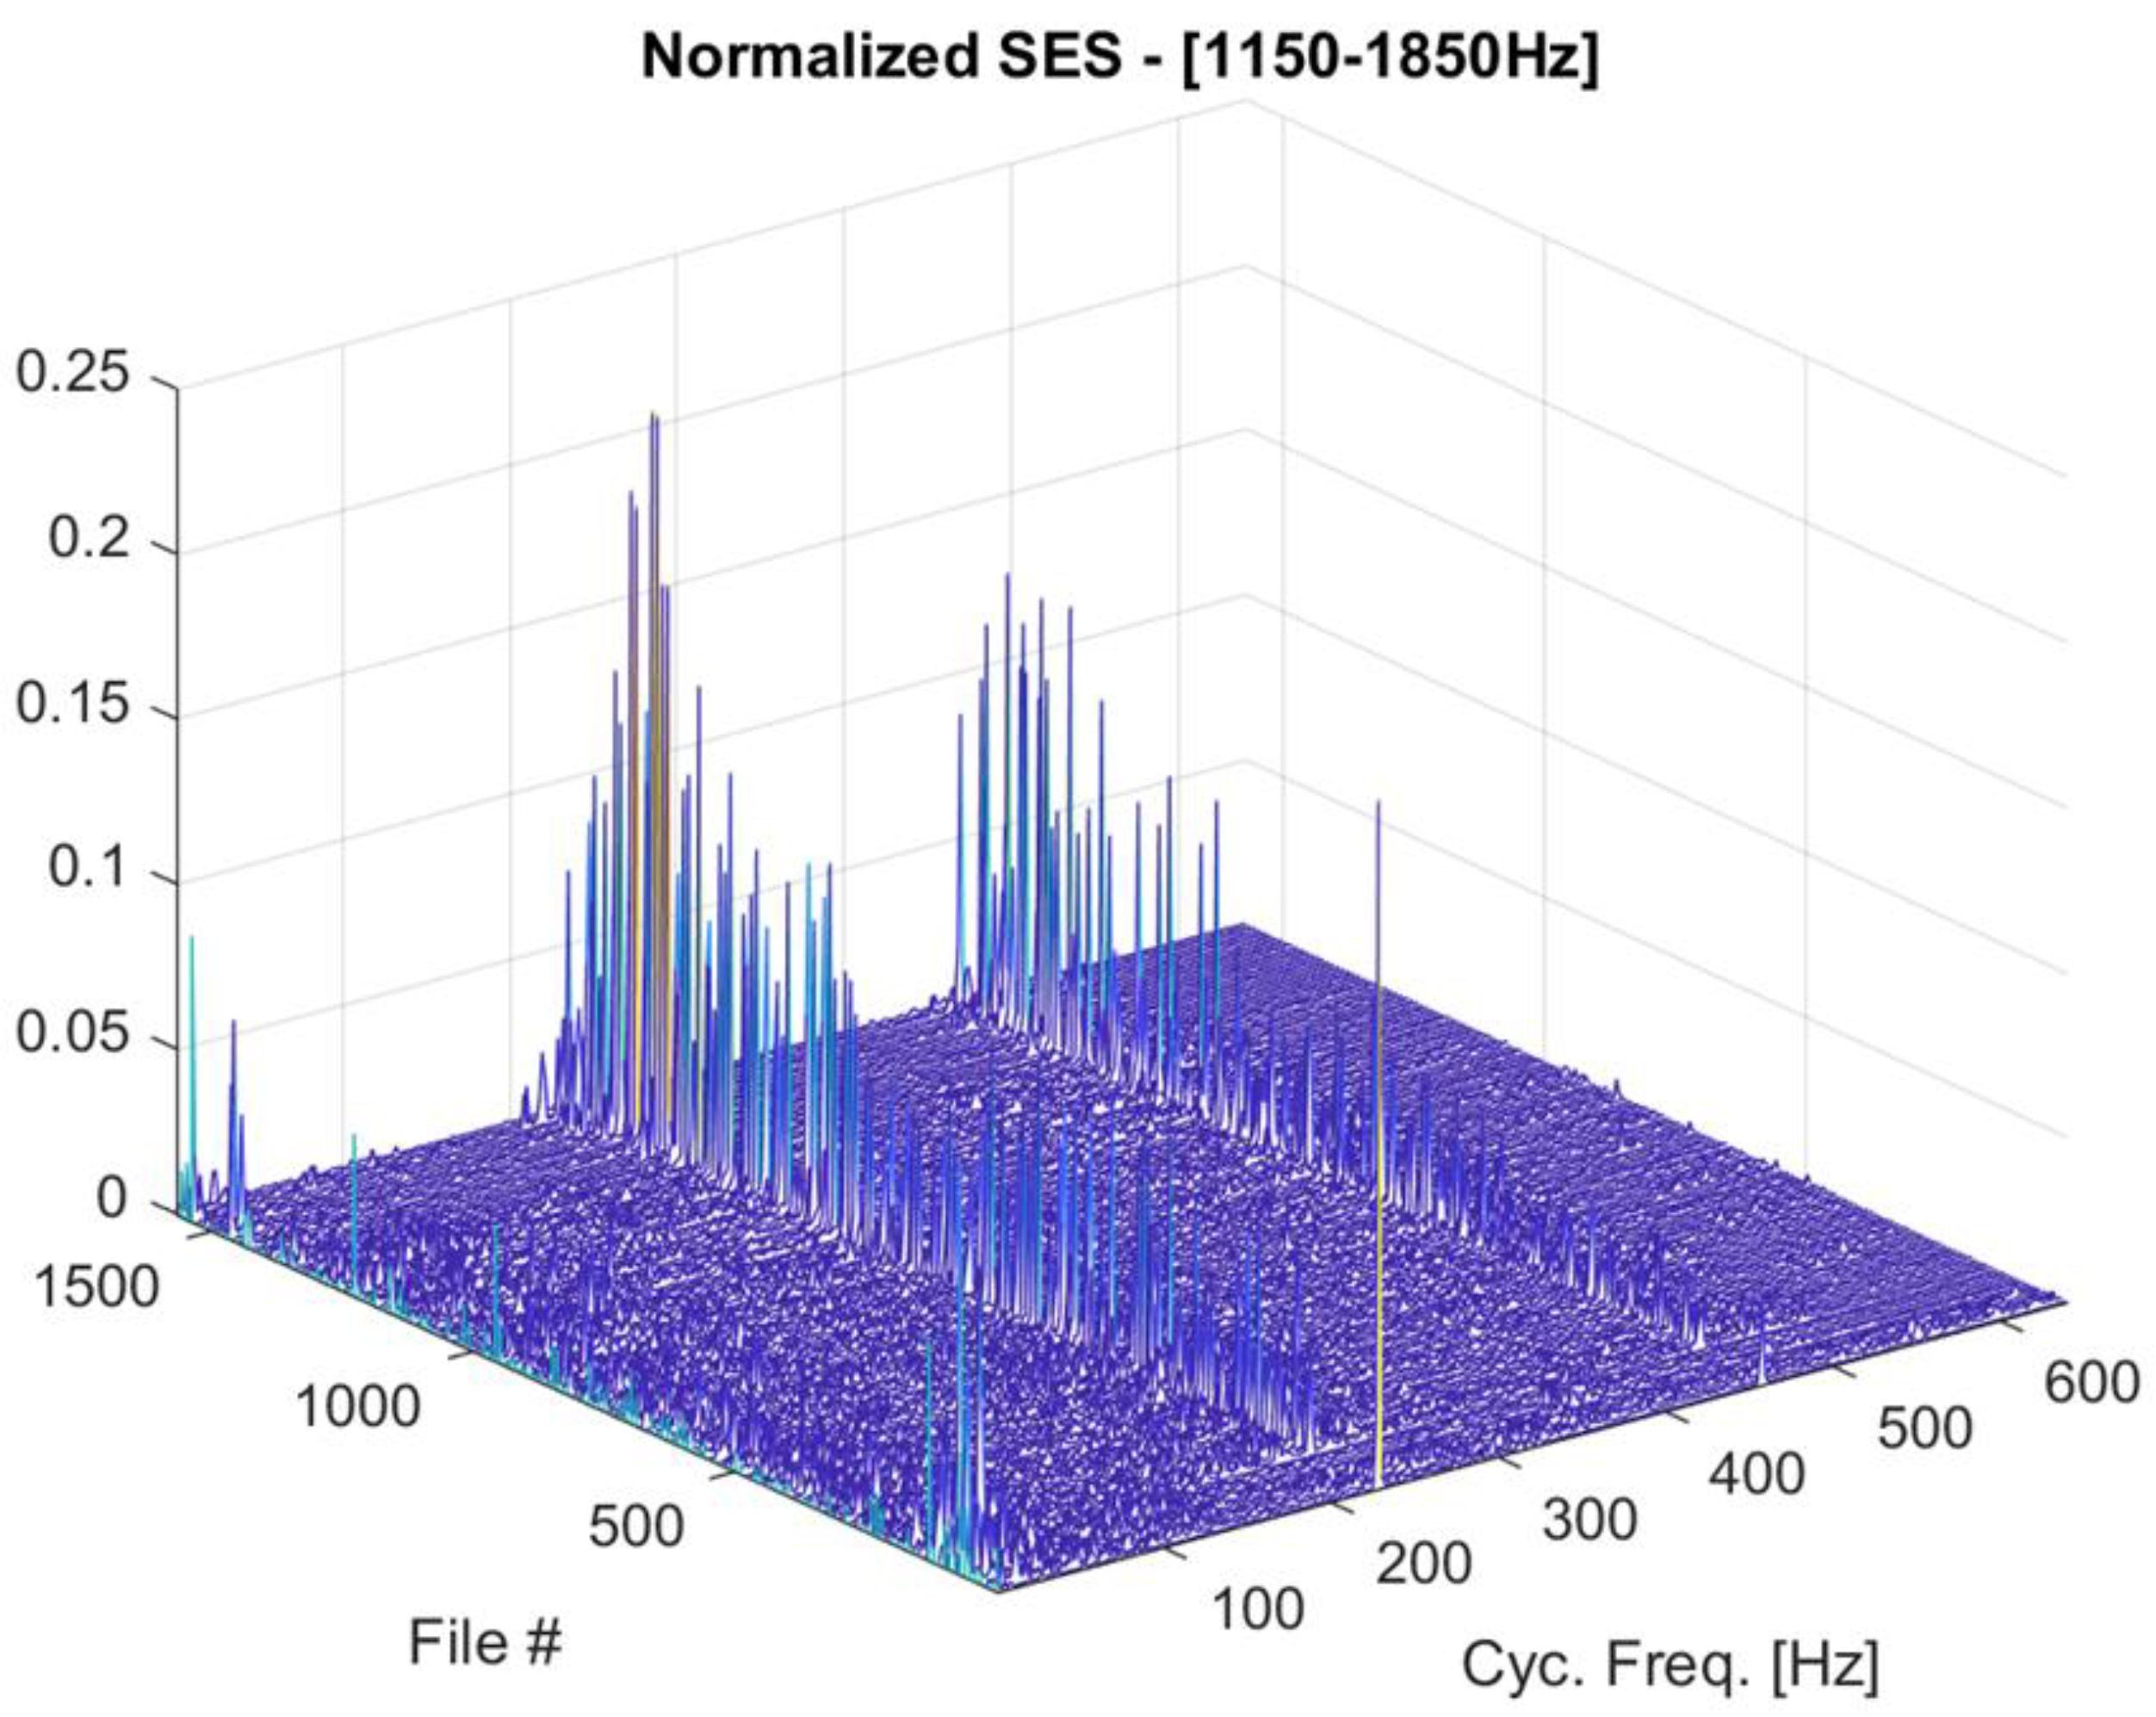
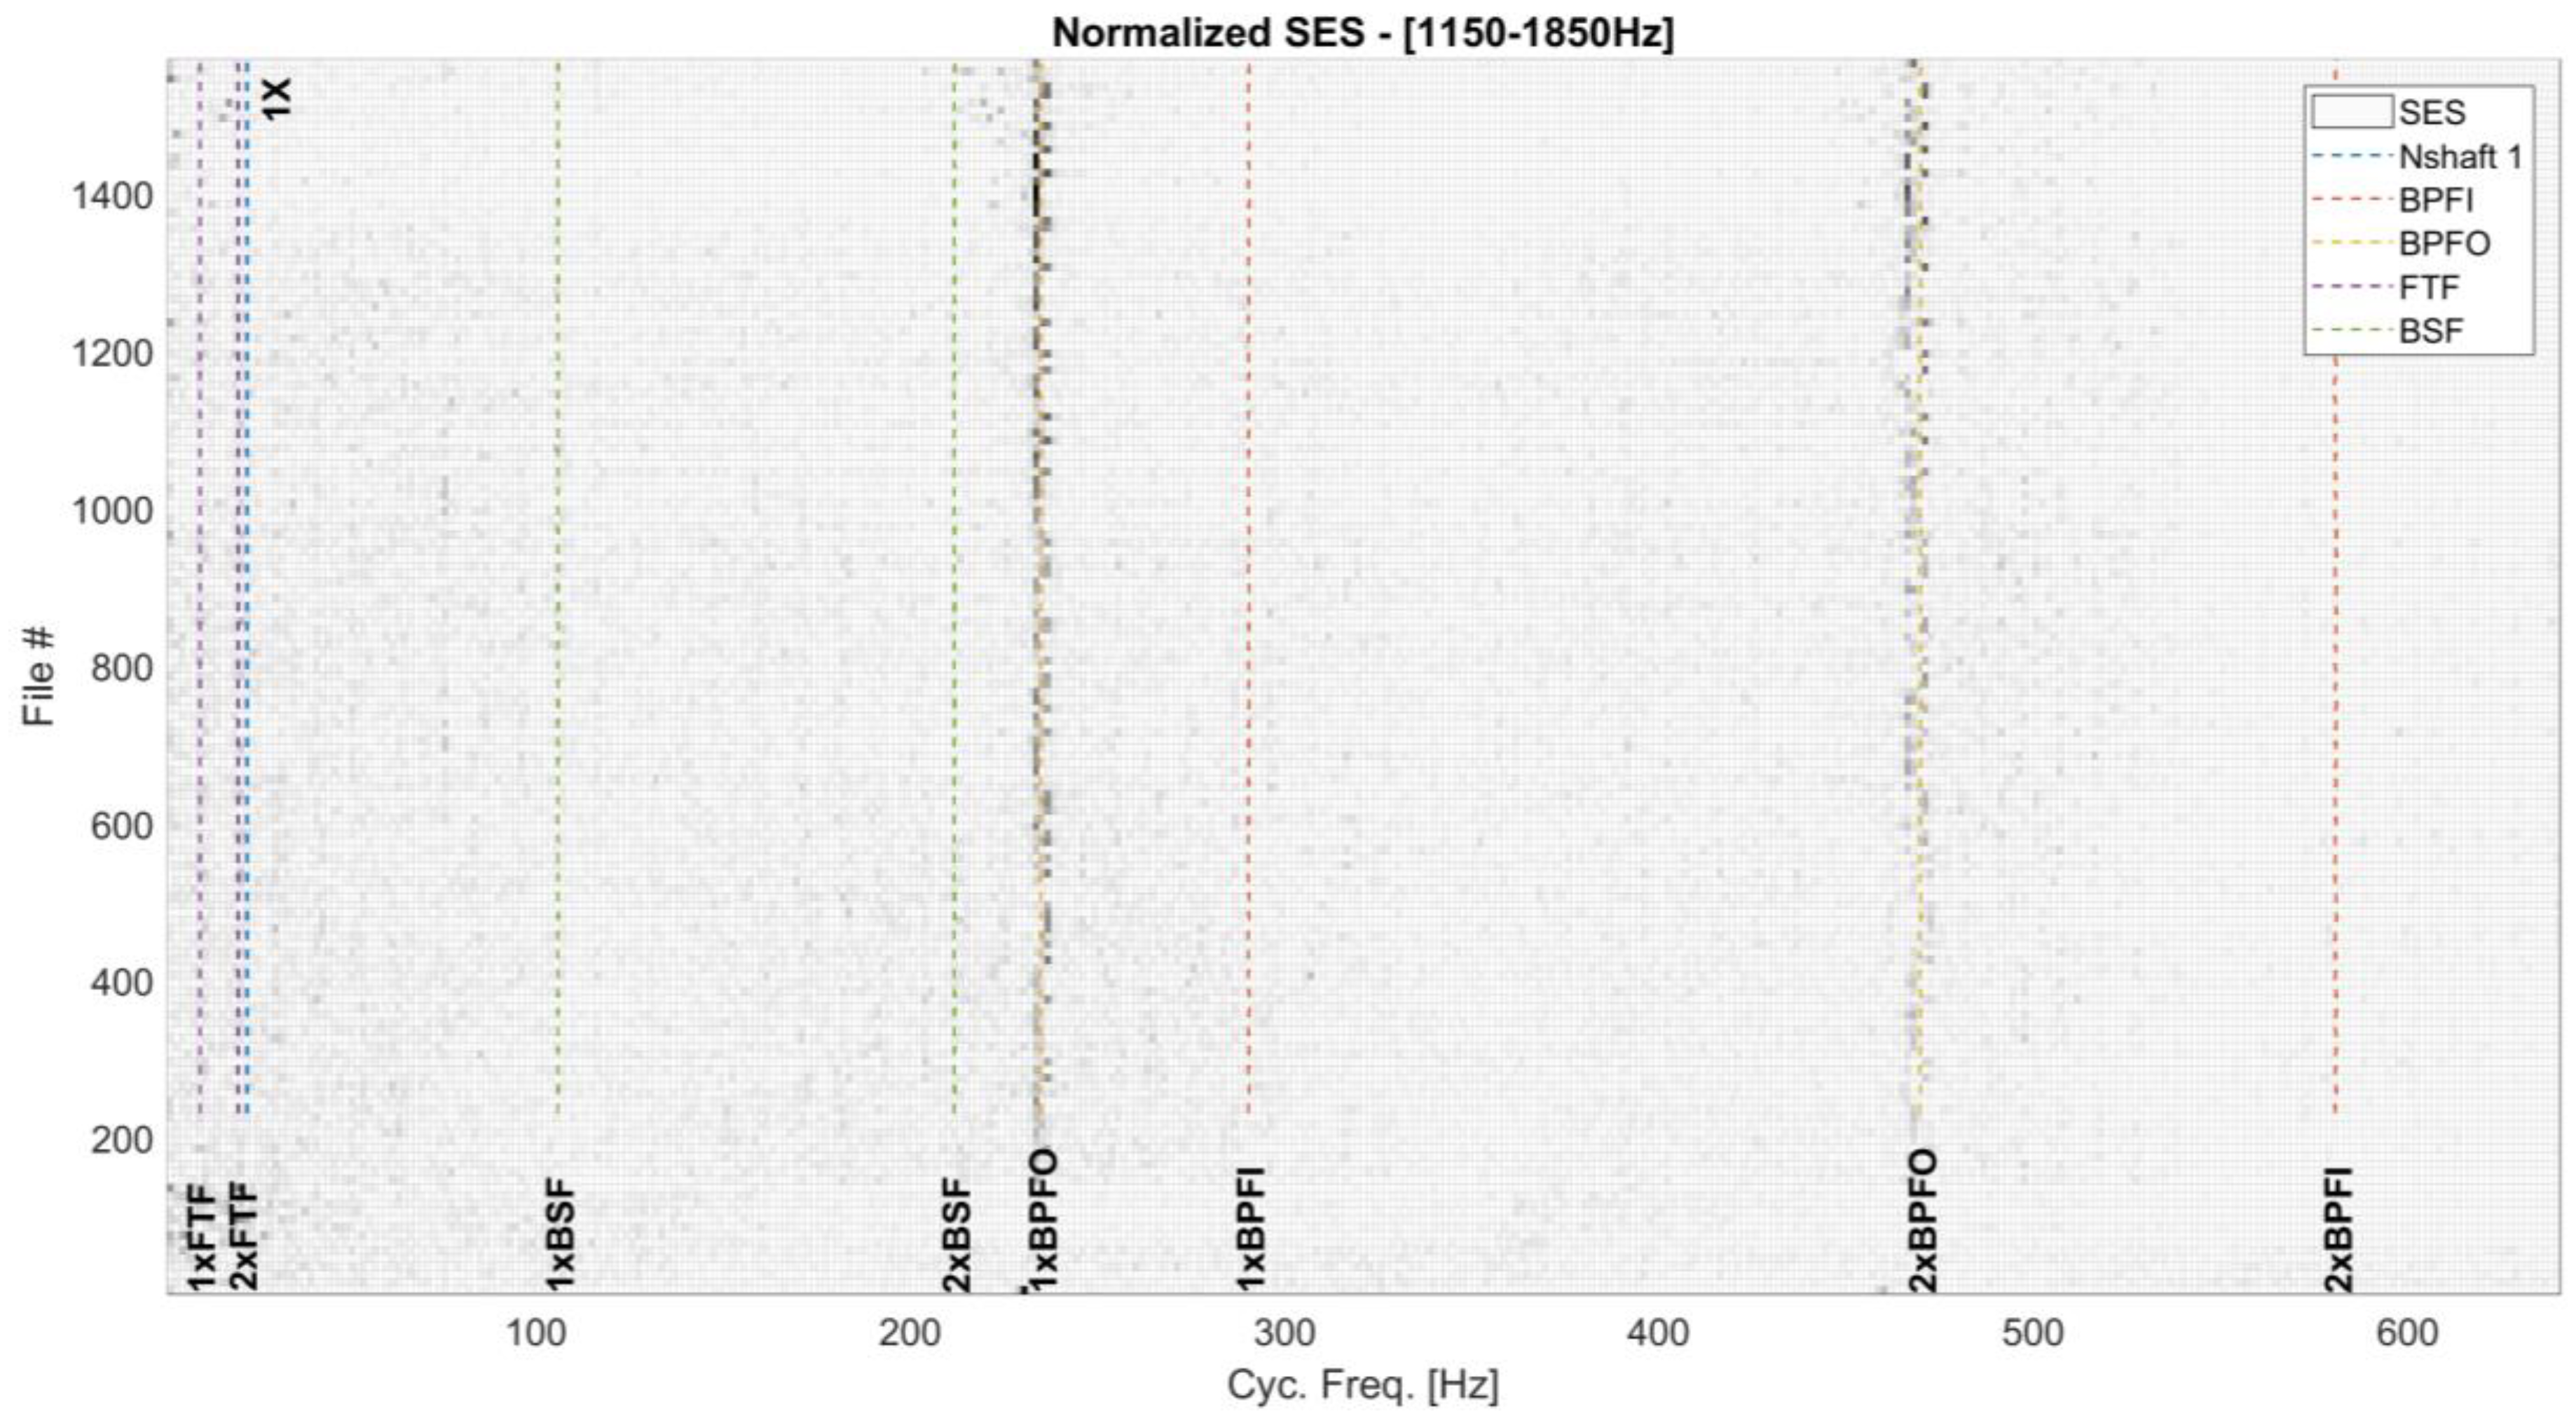
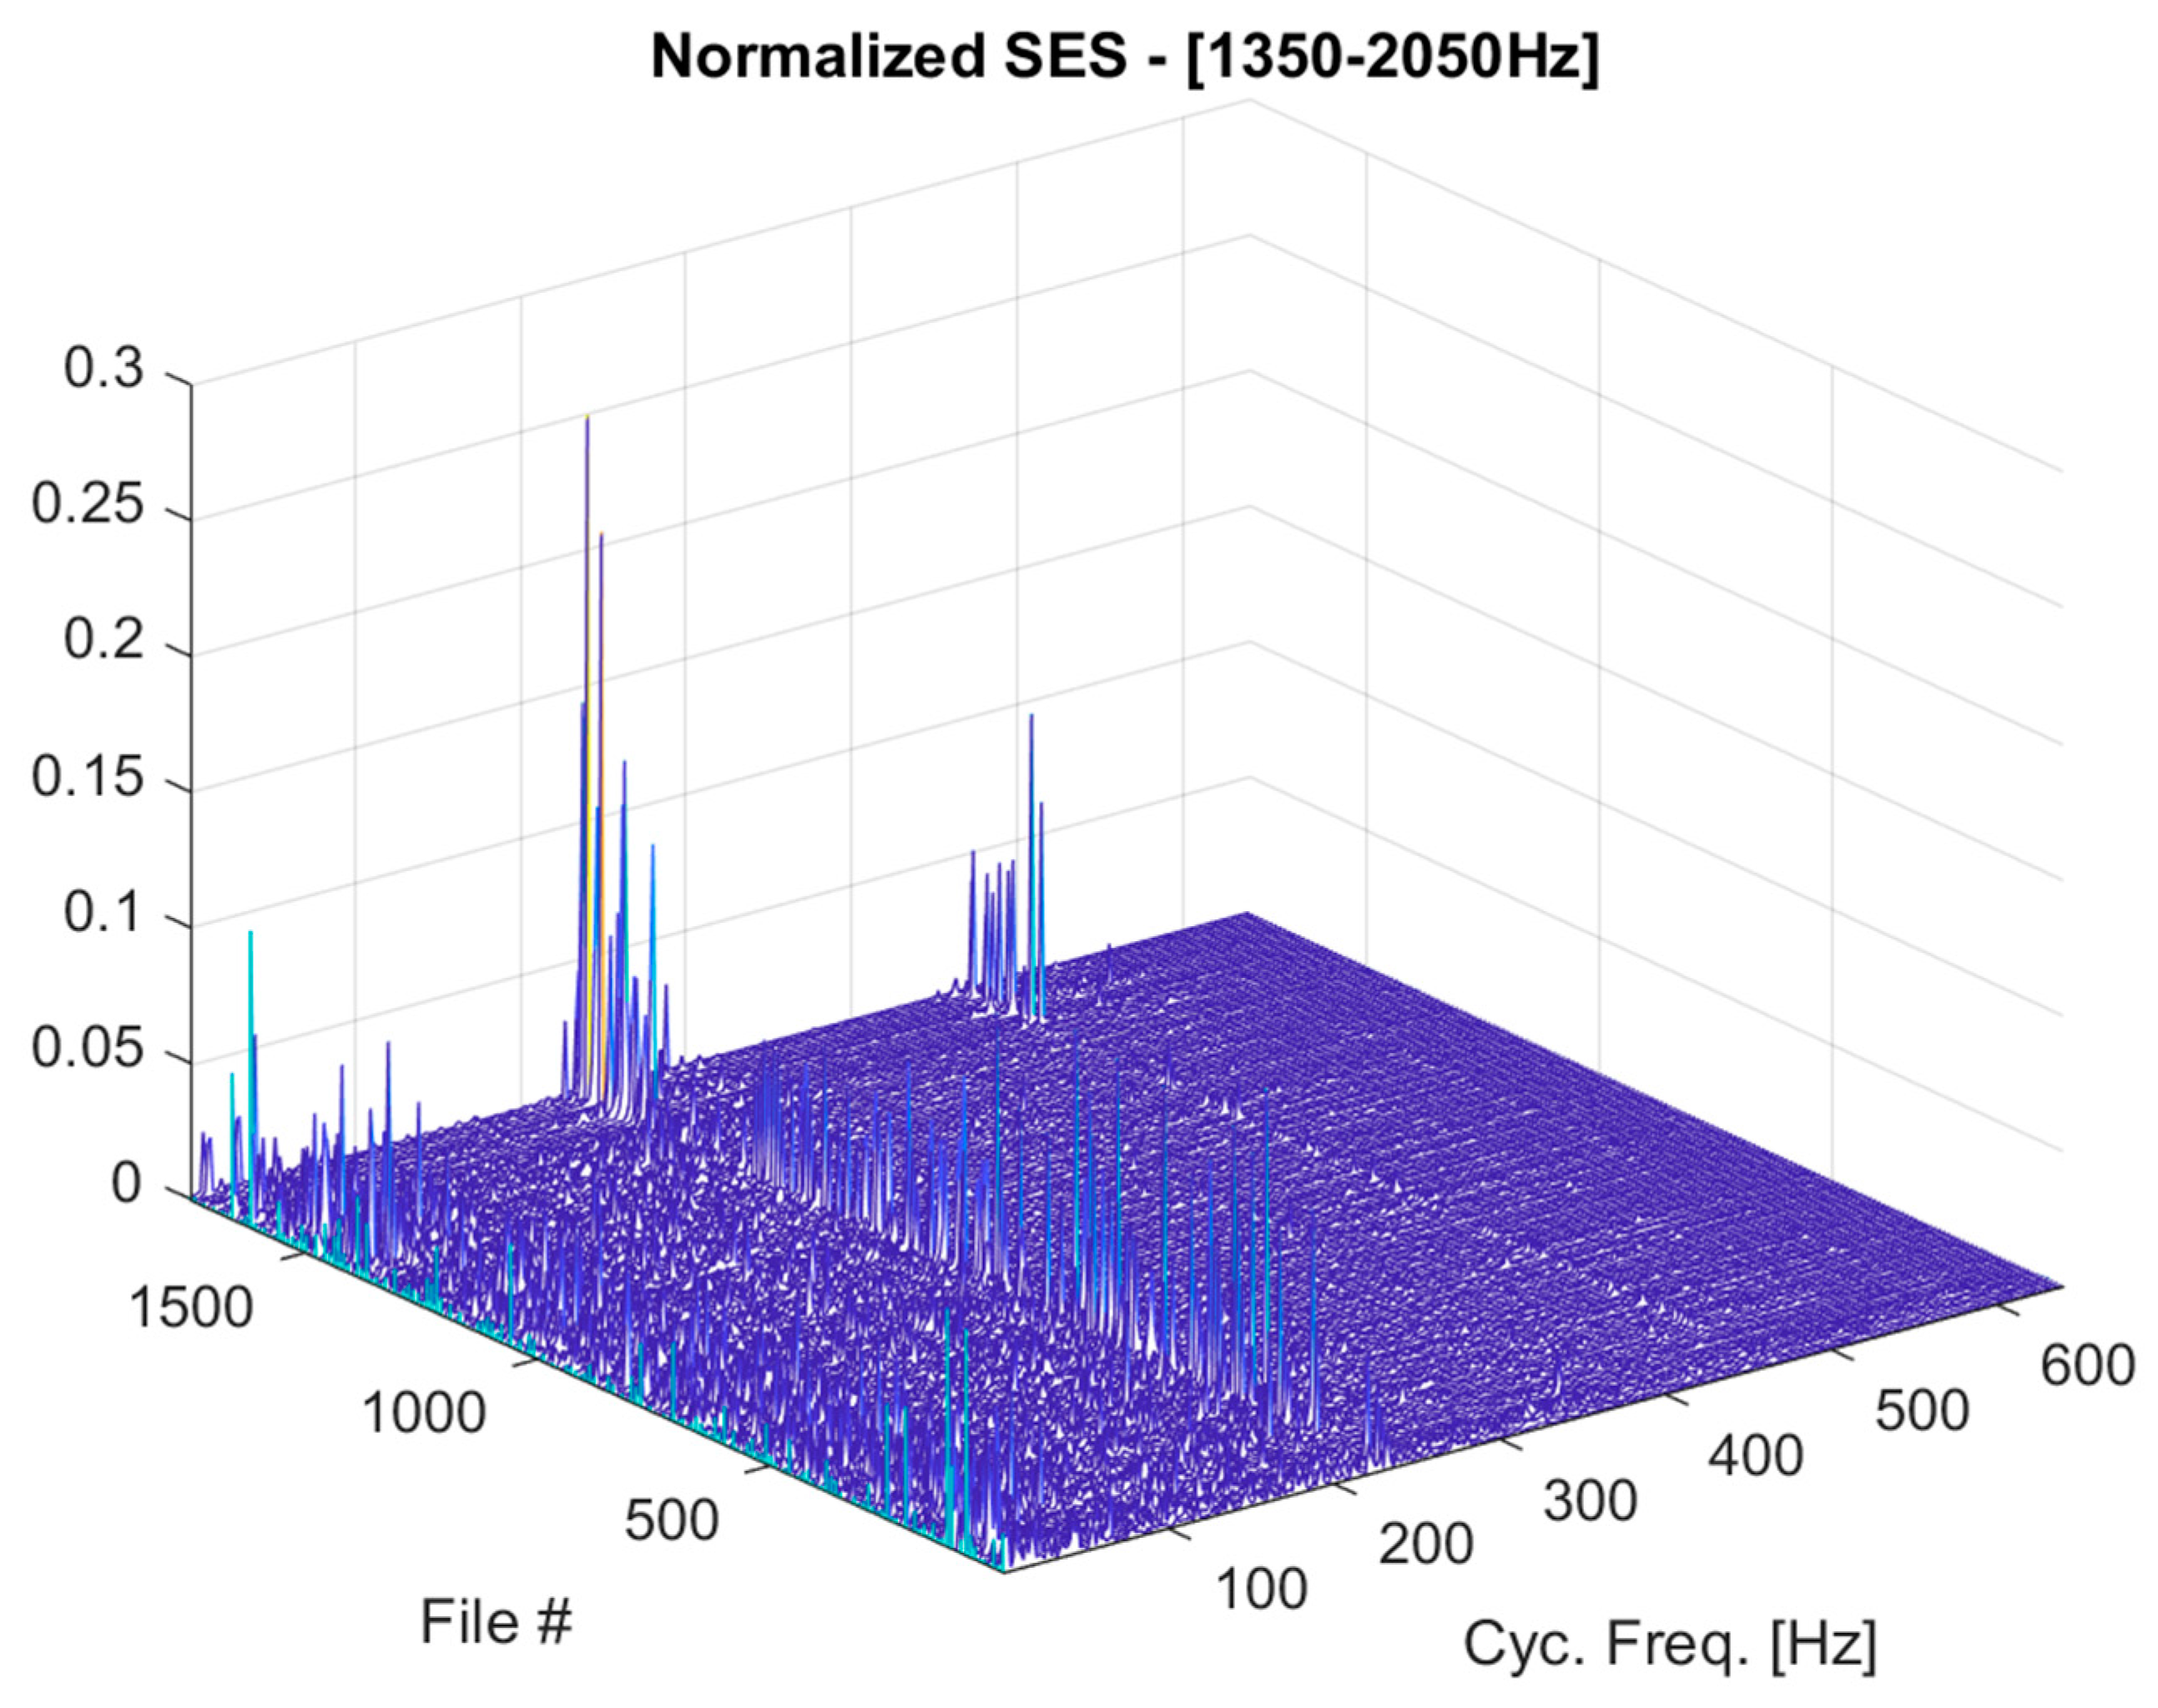
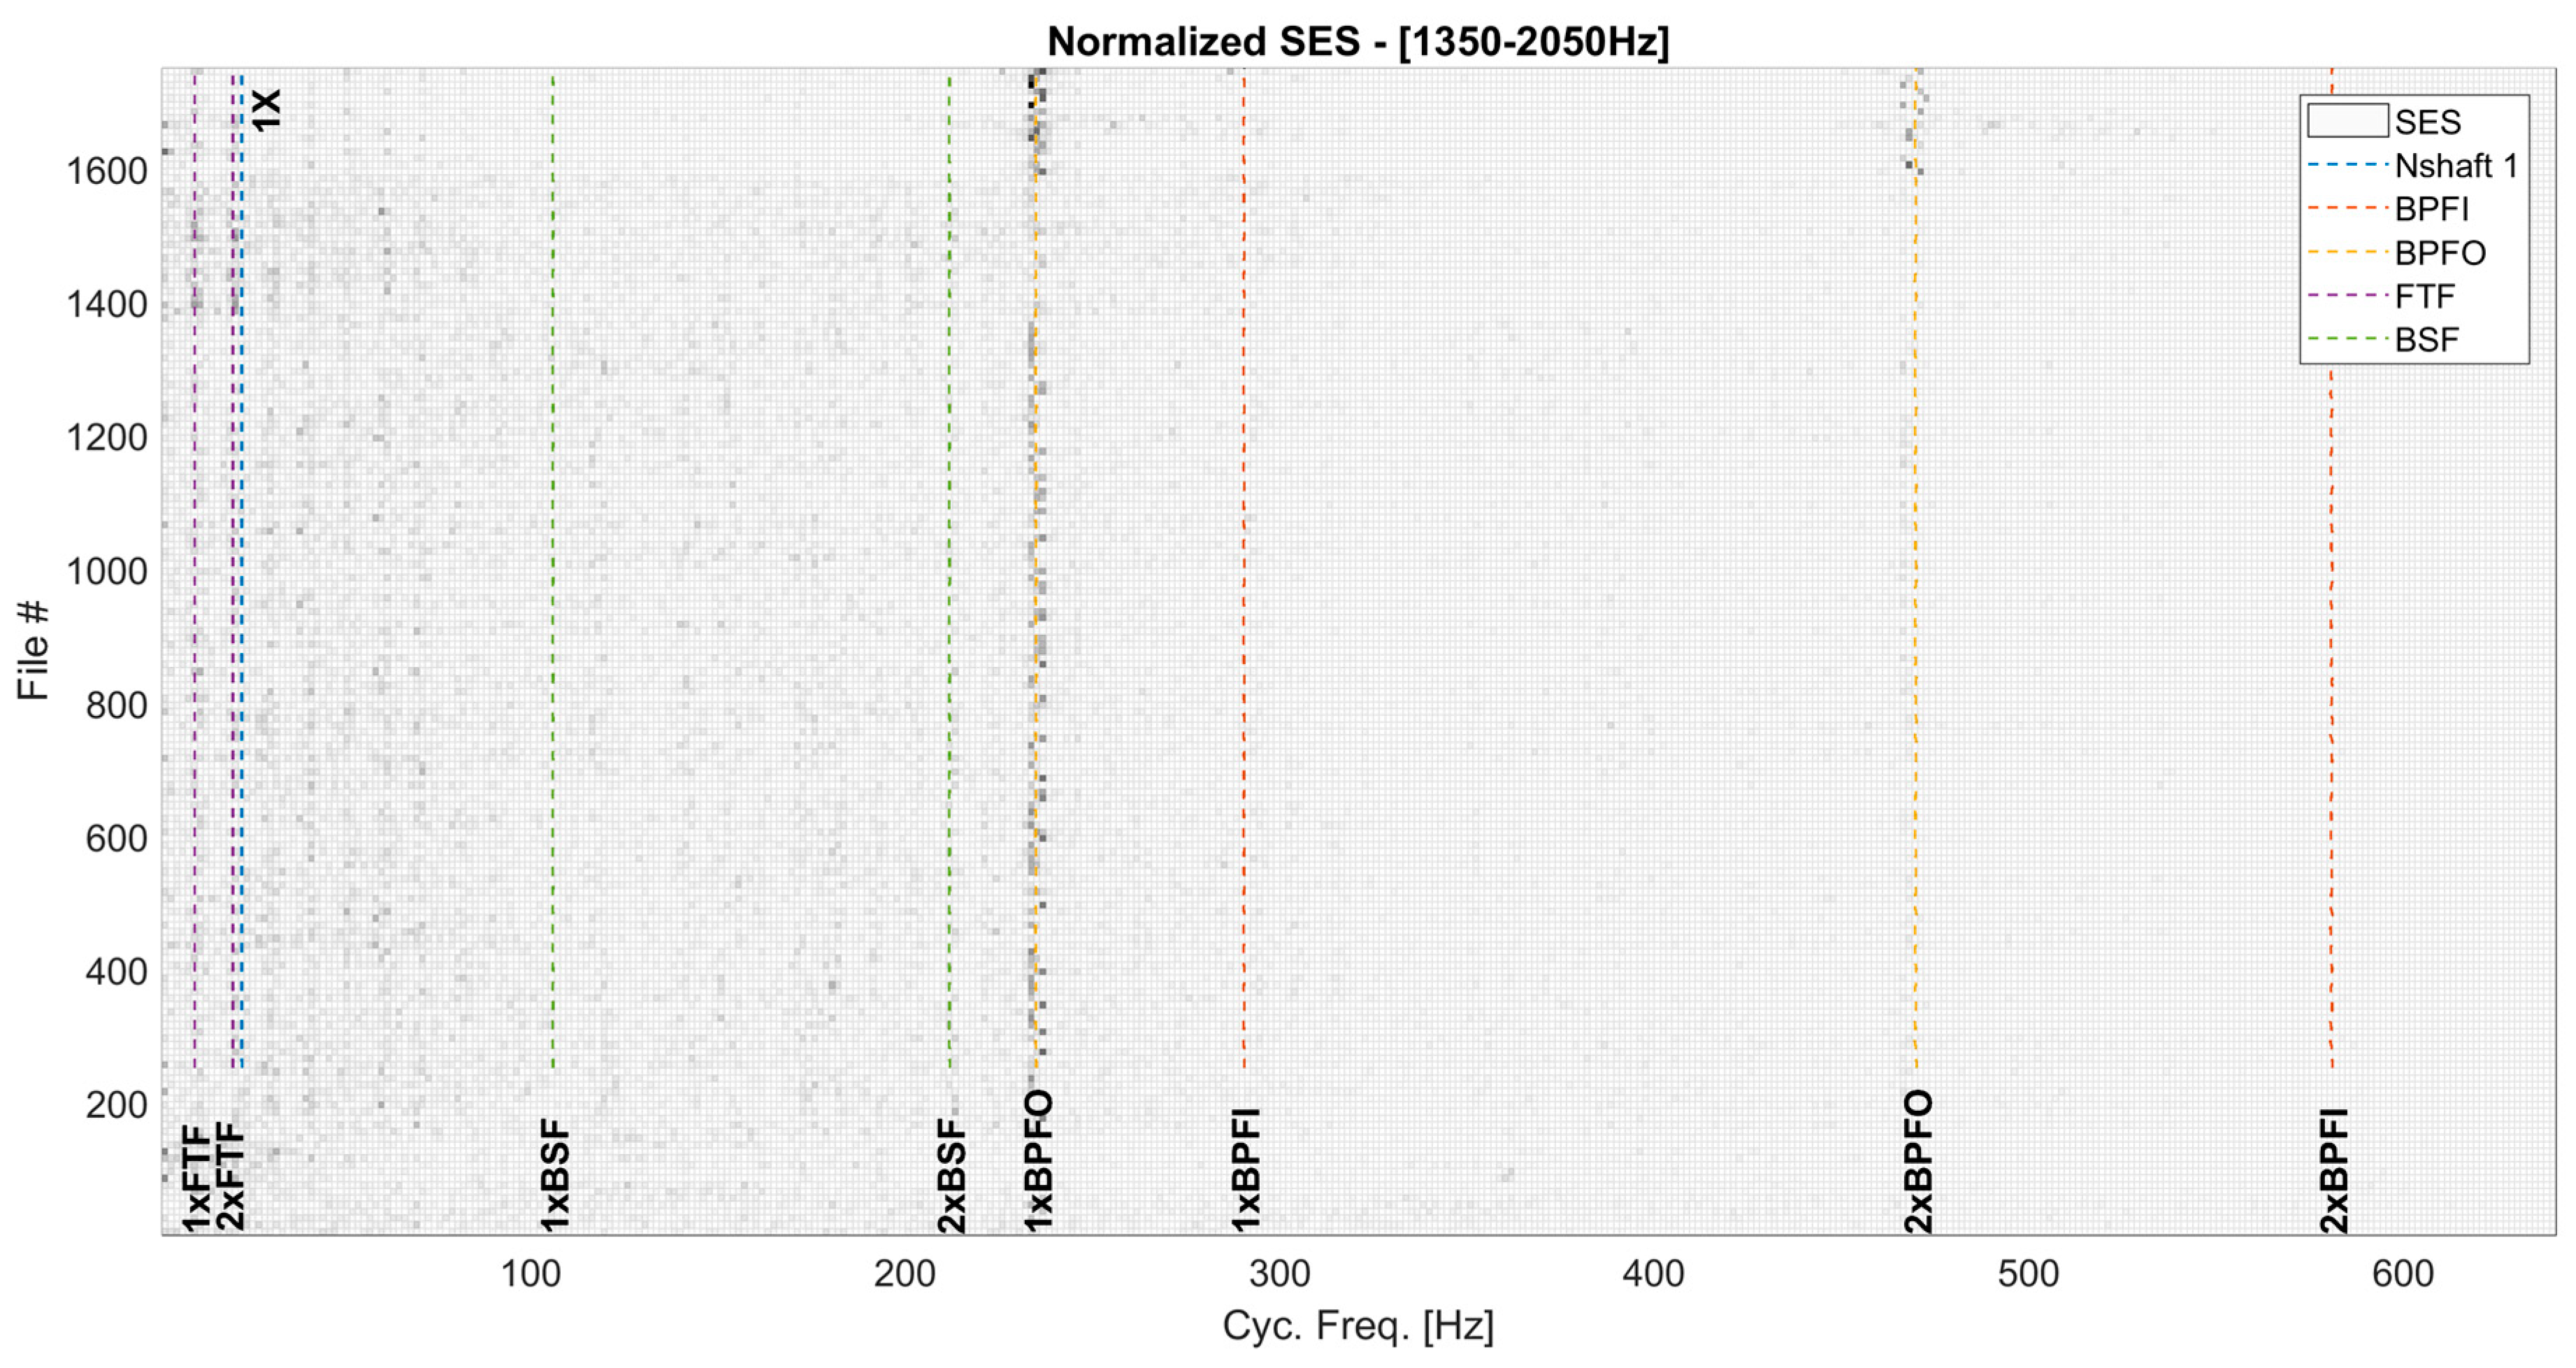
Figure 5 and Figure 6 show, respectively, the normalized SES and its map for all the analyzed records. The presence of a fault in the outer race of the left TB (1xBPFO and 2xBPFO) is clear in Figure 6, and it develops after a certain period of time (i.e., the first records do not show this damage). It is also possible to observe the deviation of the fault frequency in Figure 6, probably due to the alternating axial load.
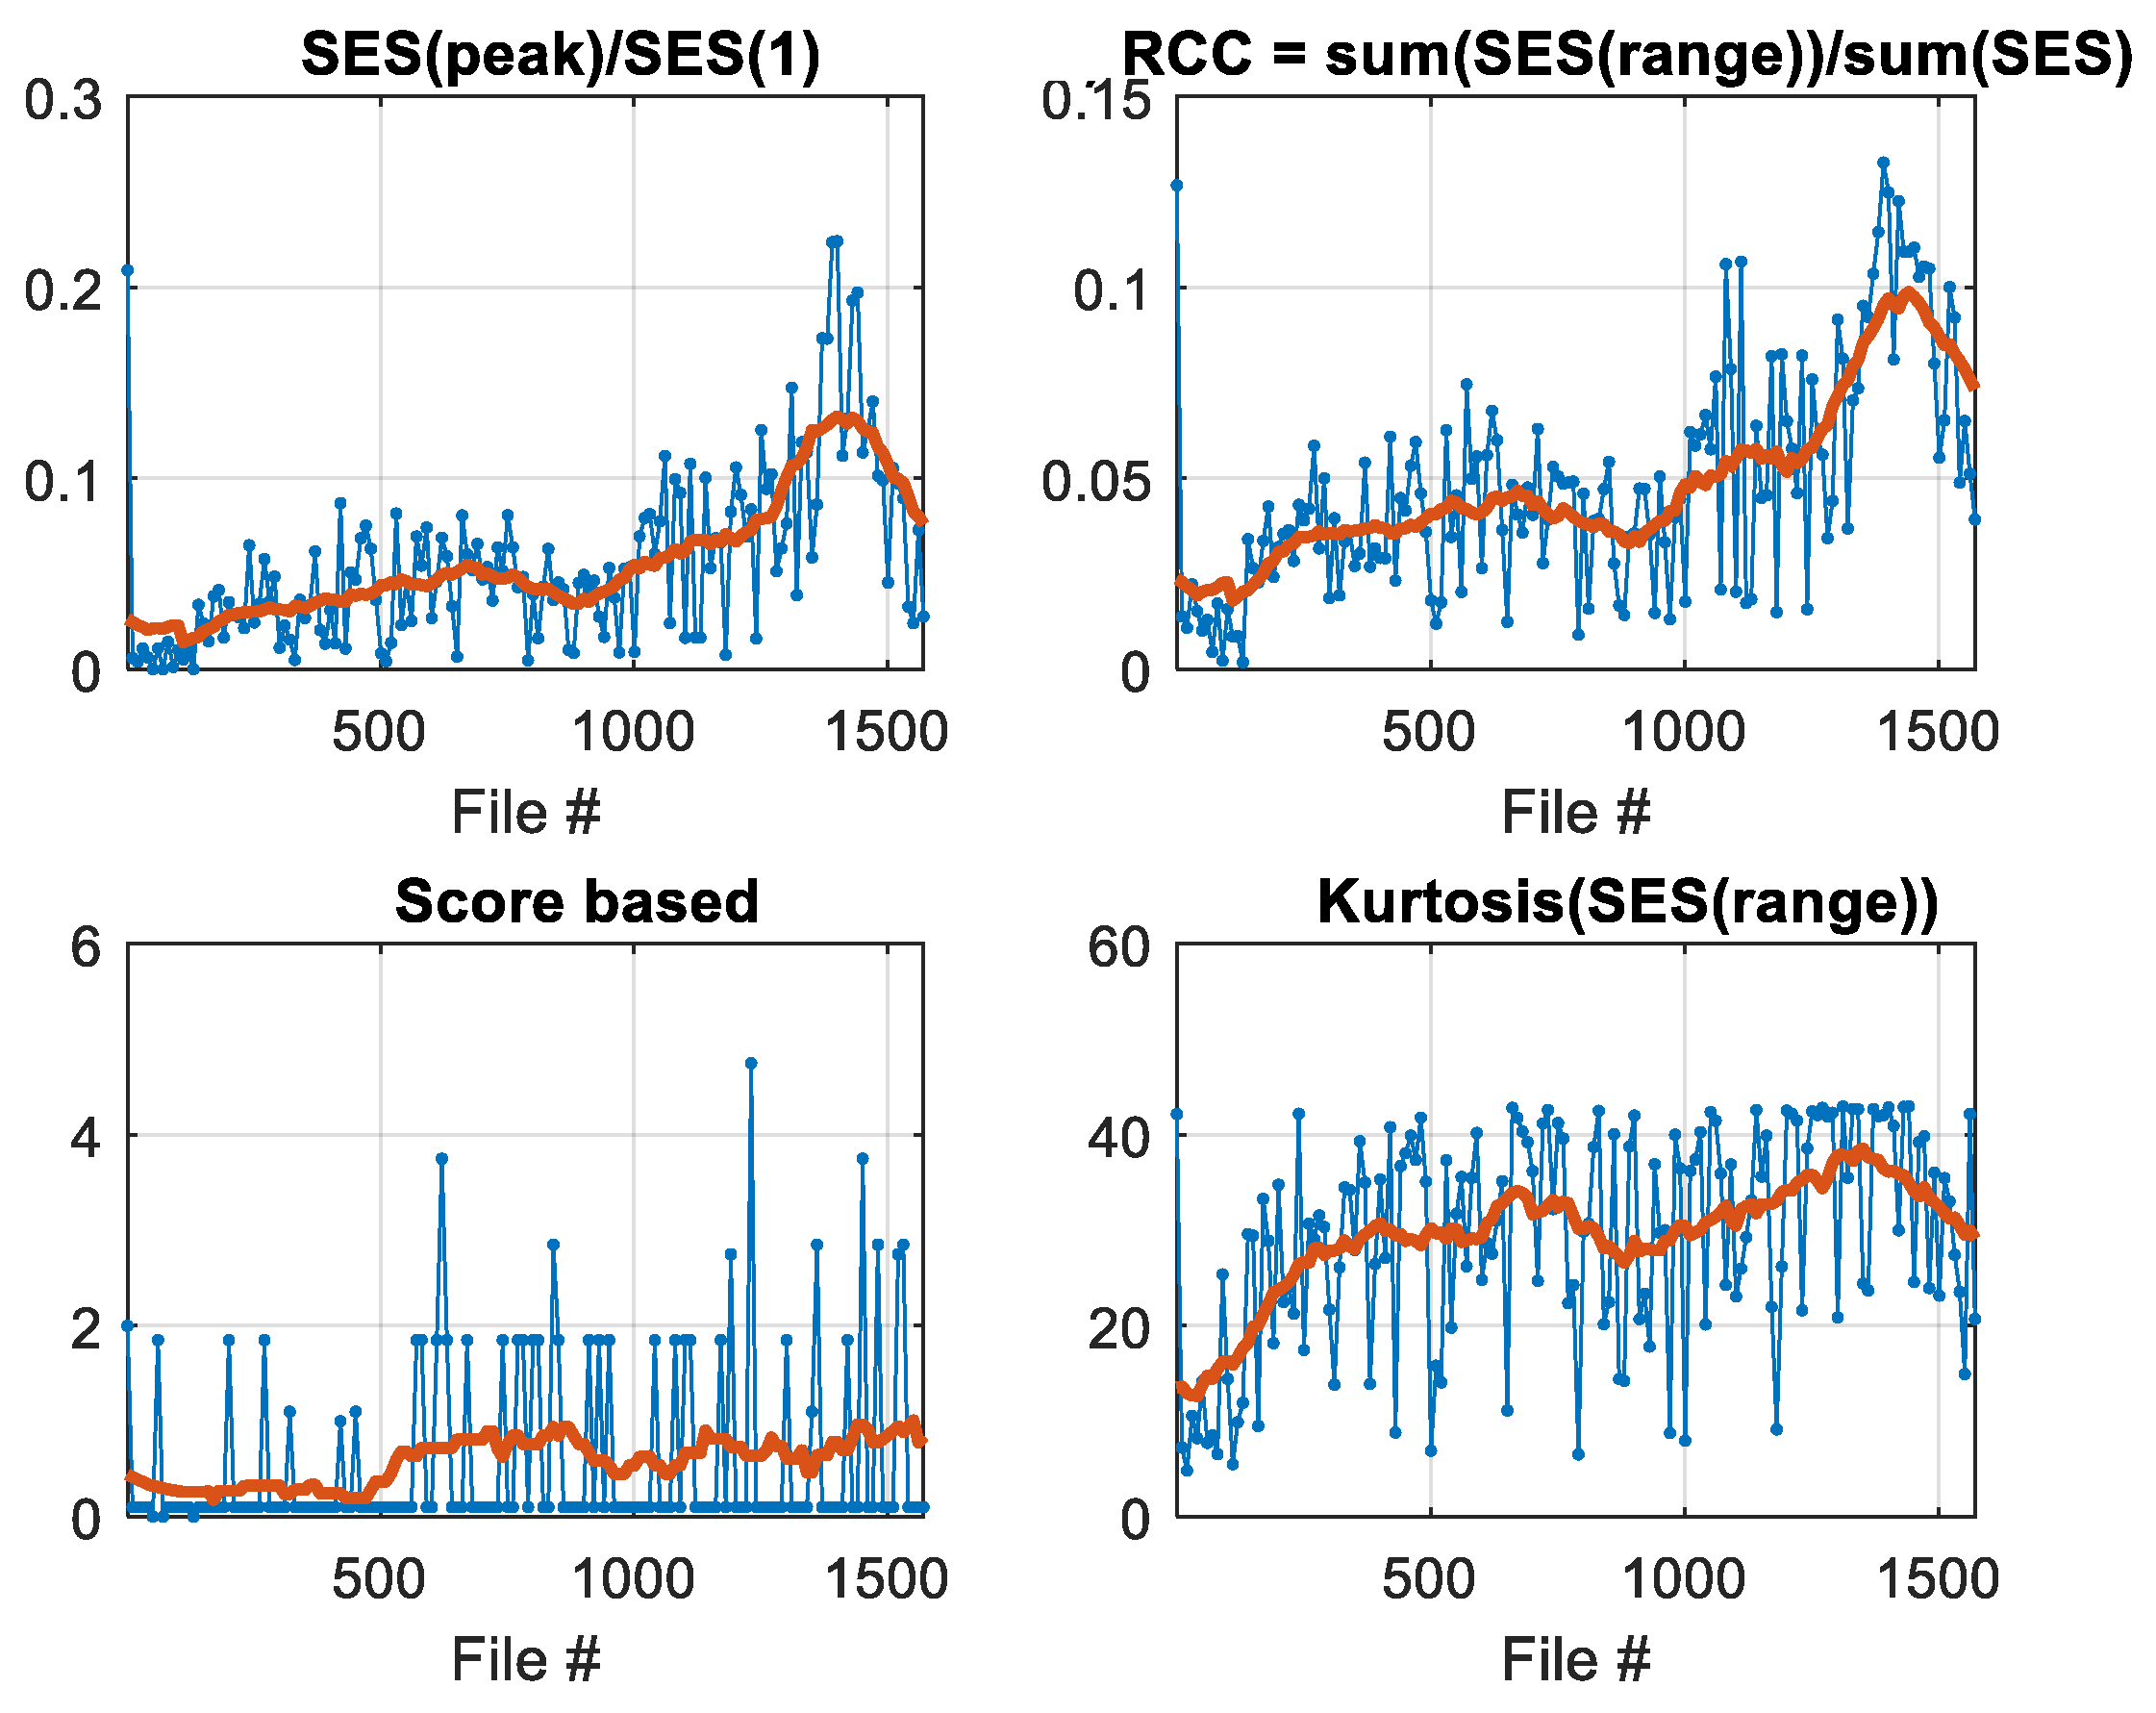
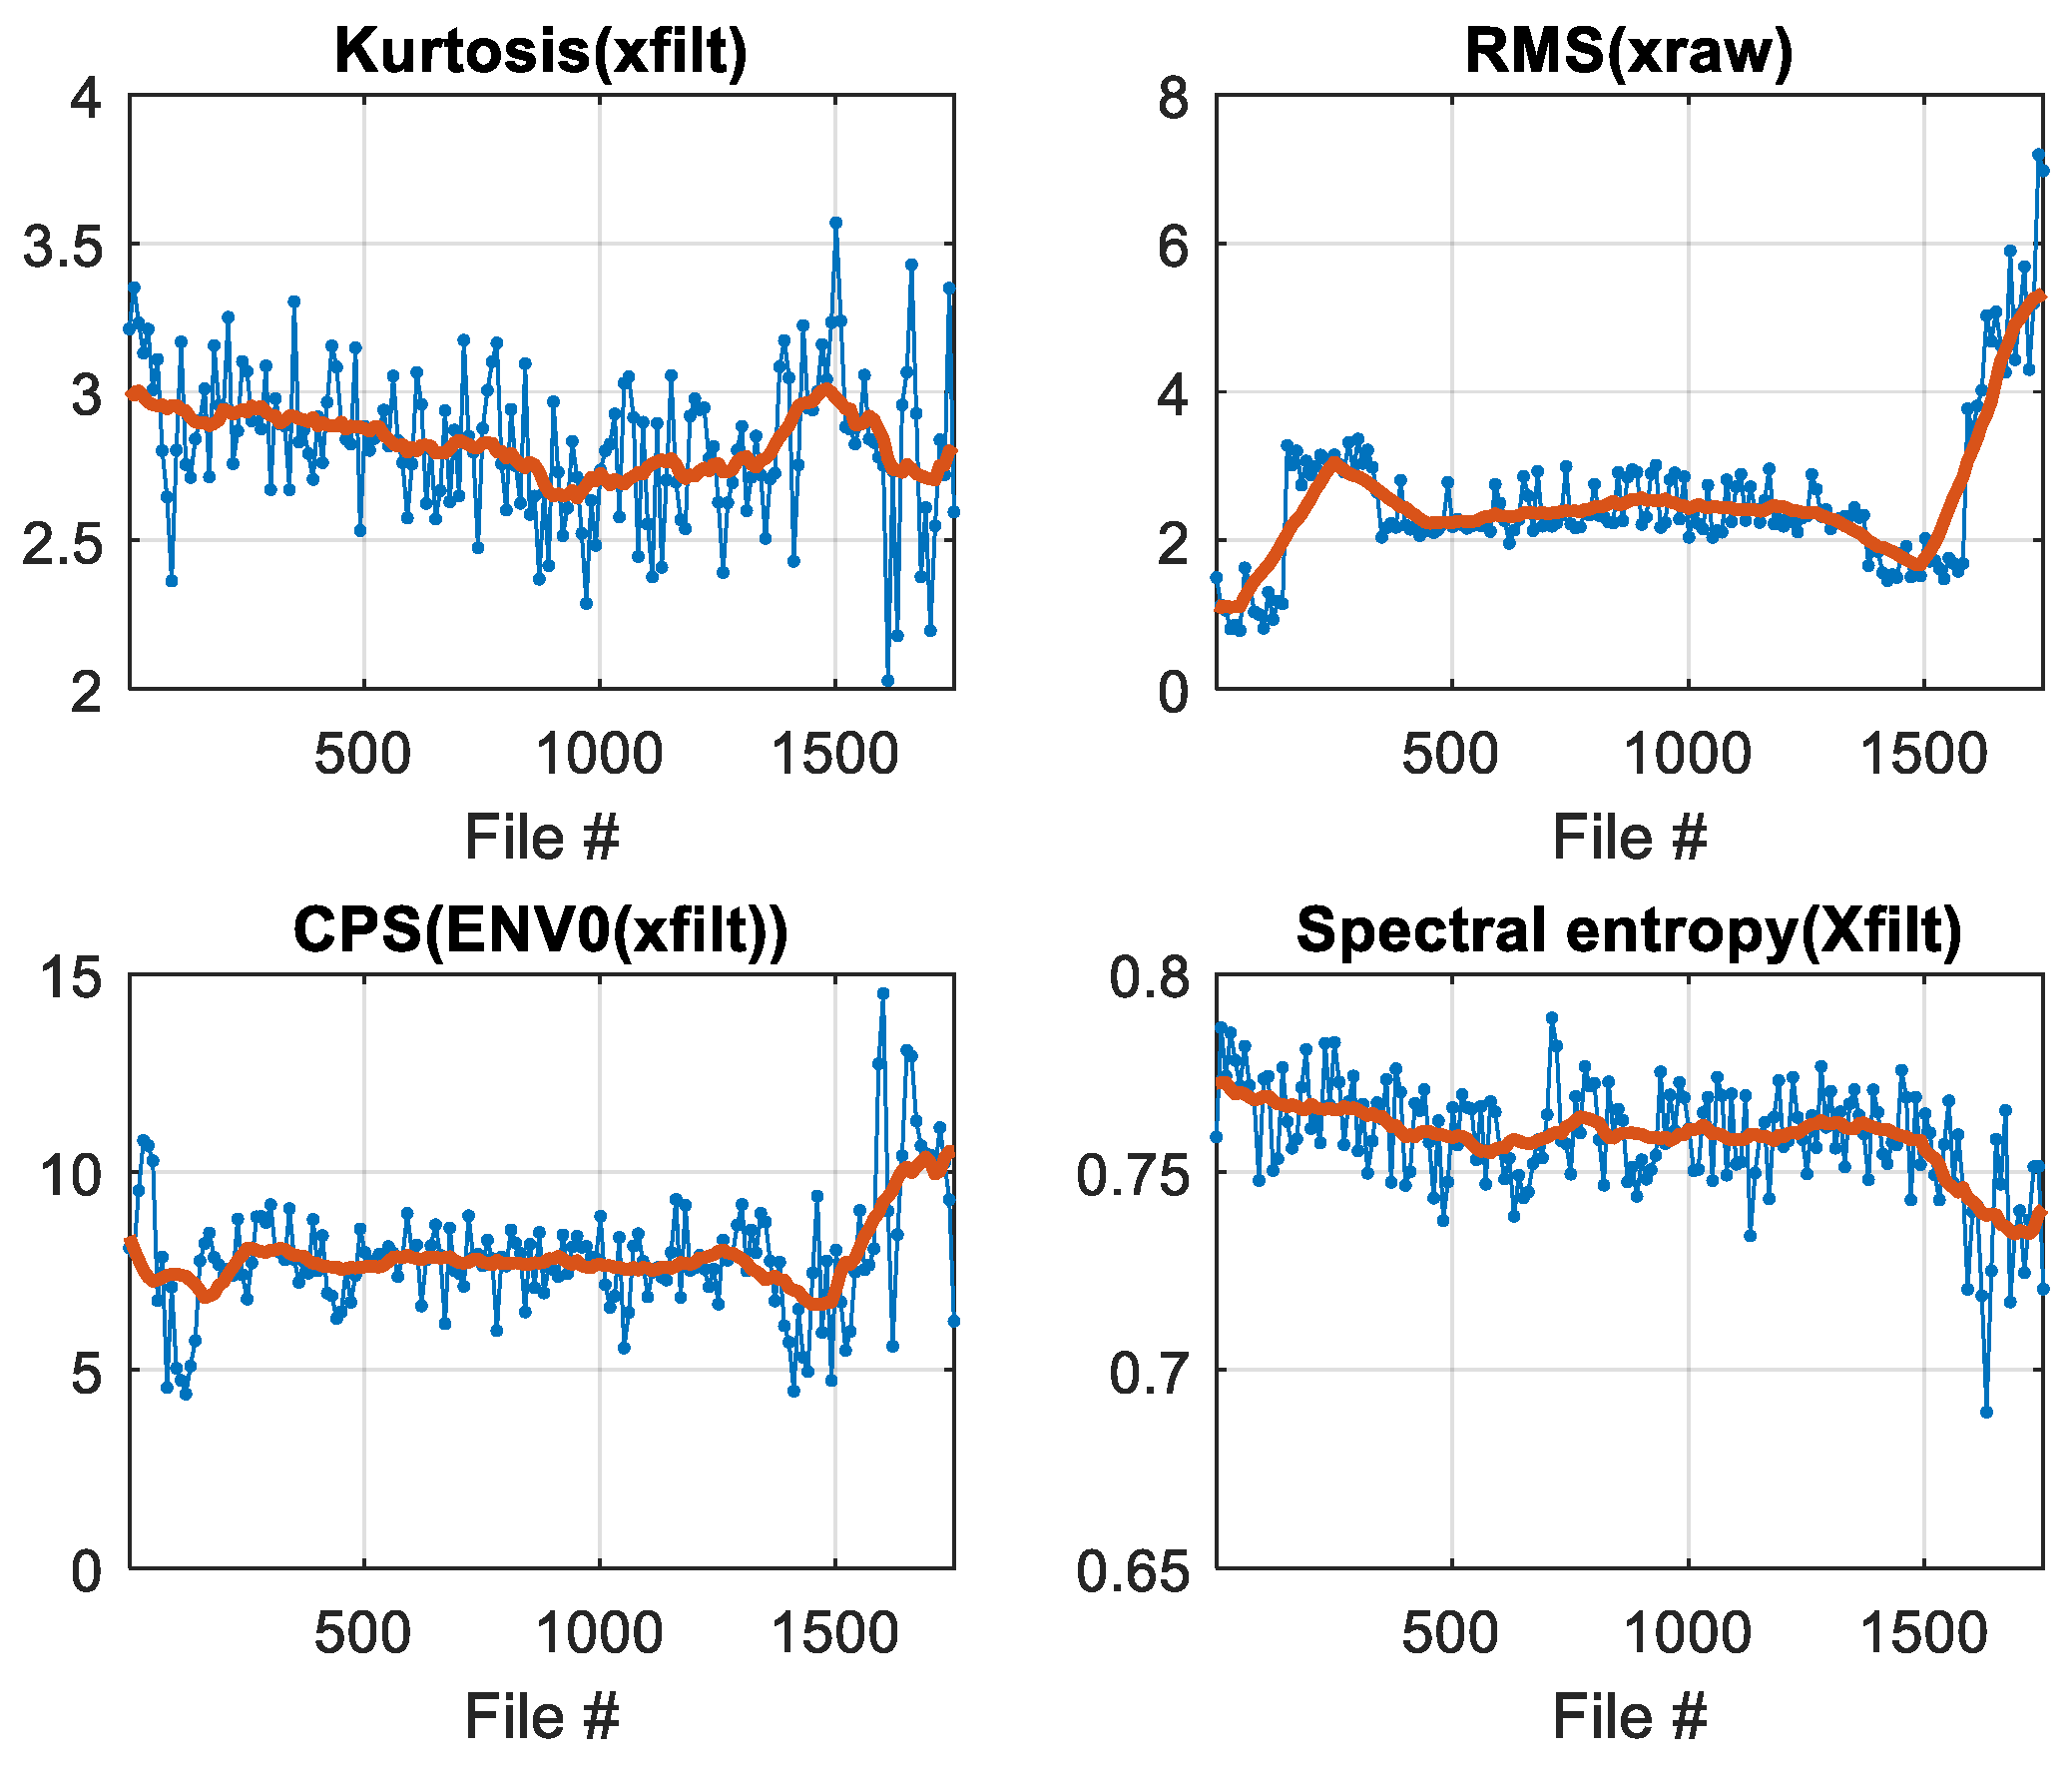
The trends of the fault severity indices are shown in Figure 7 and Figure 8, in which the red line represents the moving averaged value:
- the RMS of the raw signal shows a drop after about 1/8 of the total bearing cycles, then it is almost constant for the main bearing life and increases at the end of acquisitions;
- the increase of RMS at the end of acquisition is also highlighted by the decrease of the kurtosis;
- the spectral entropy SE continuously decreases with time, indicating that the energy is more concentrated at only a few frequencies (fault frequencies) as happens for a damaged bearing;
- the continuous phase status CPS continuously increases with time;
- all the indices that depend on the fault frequency (BPFO) increase in Figure 8.
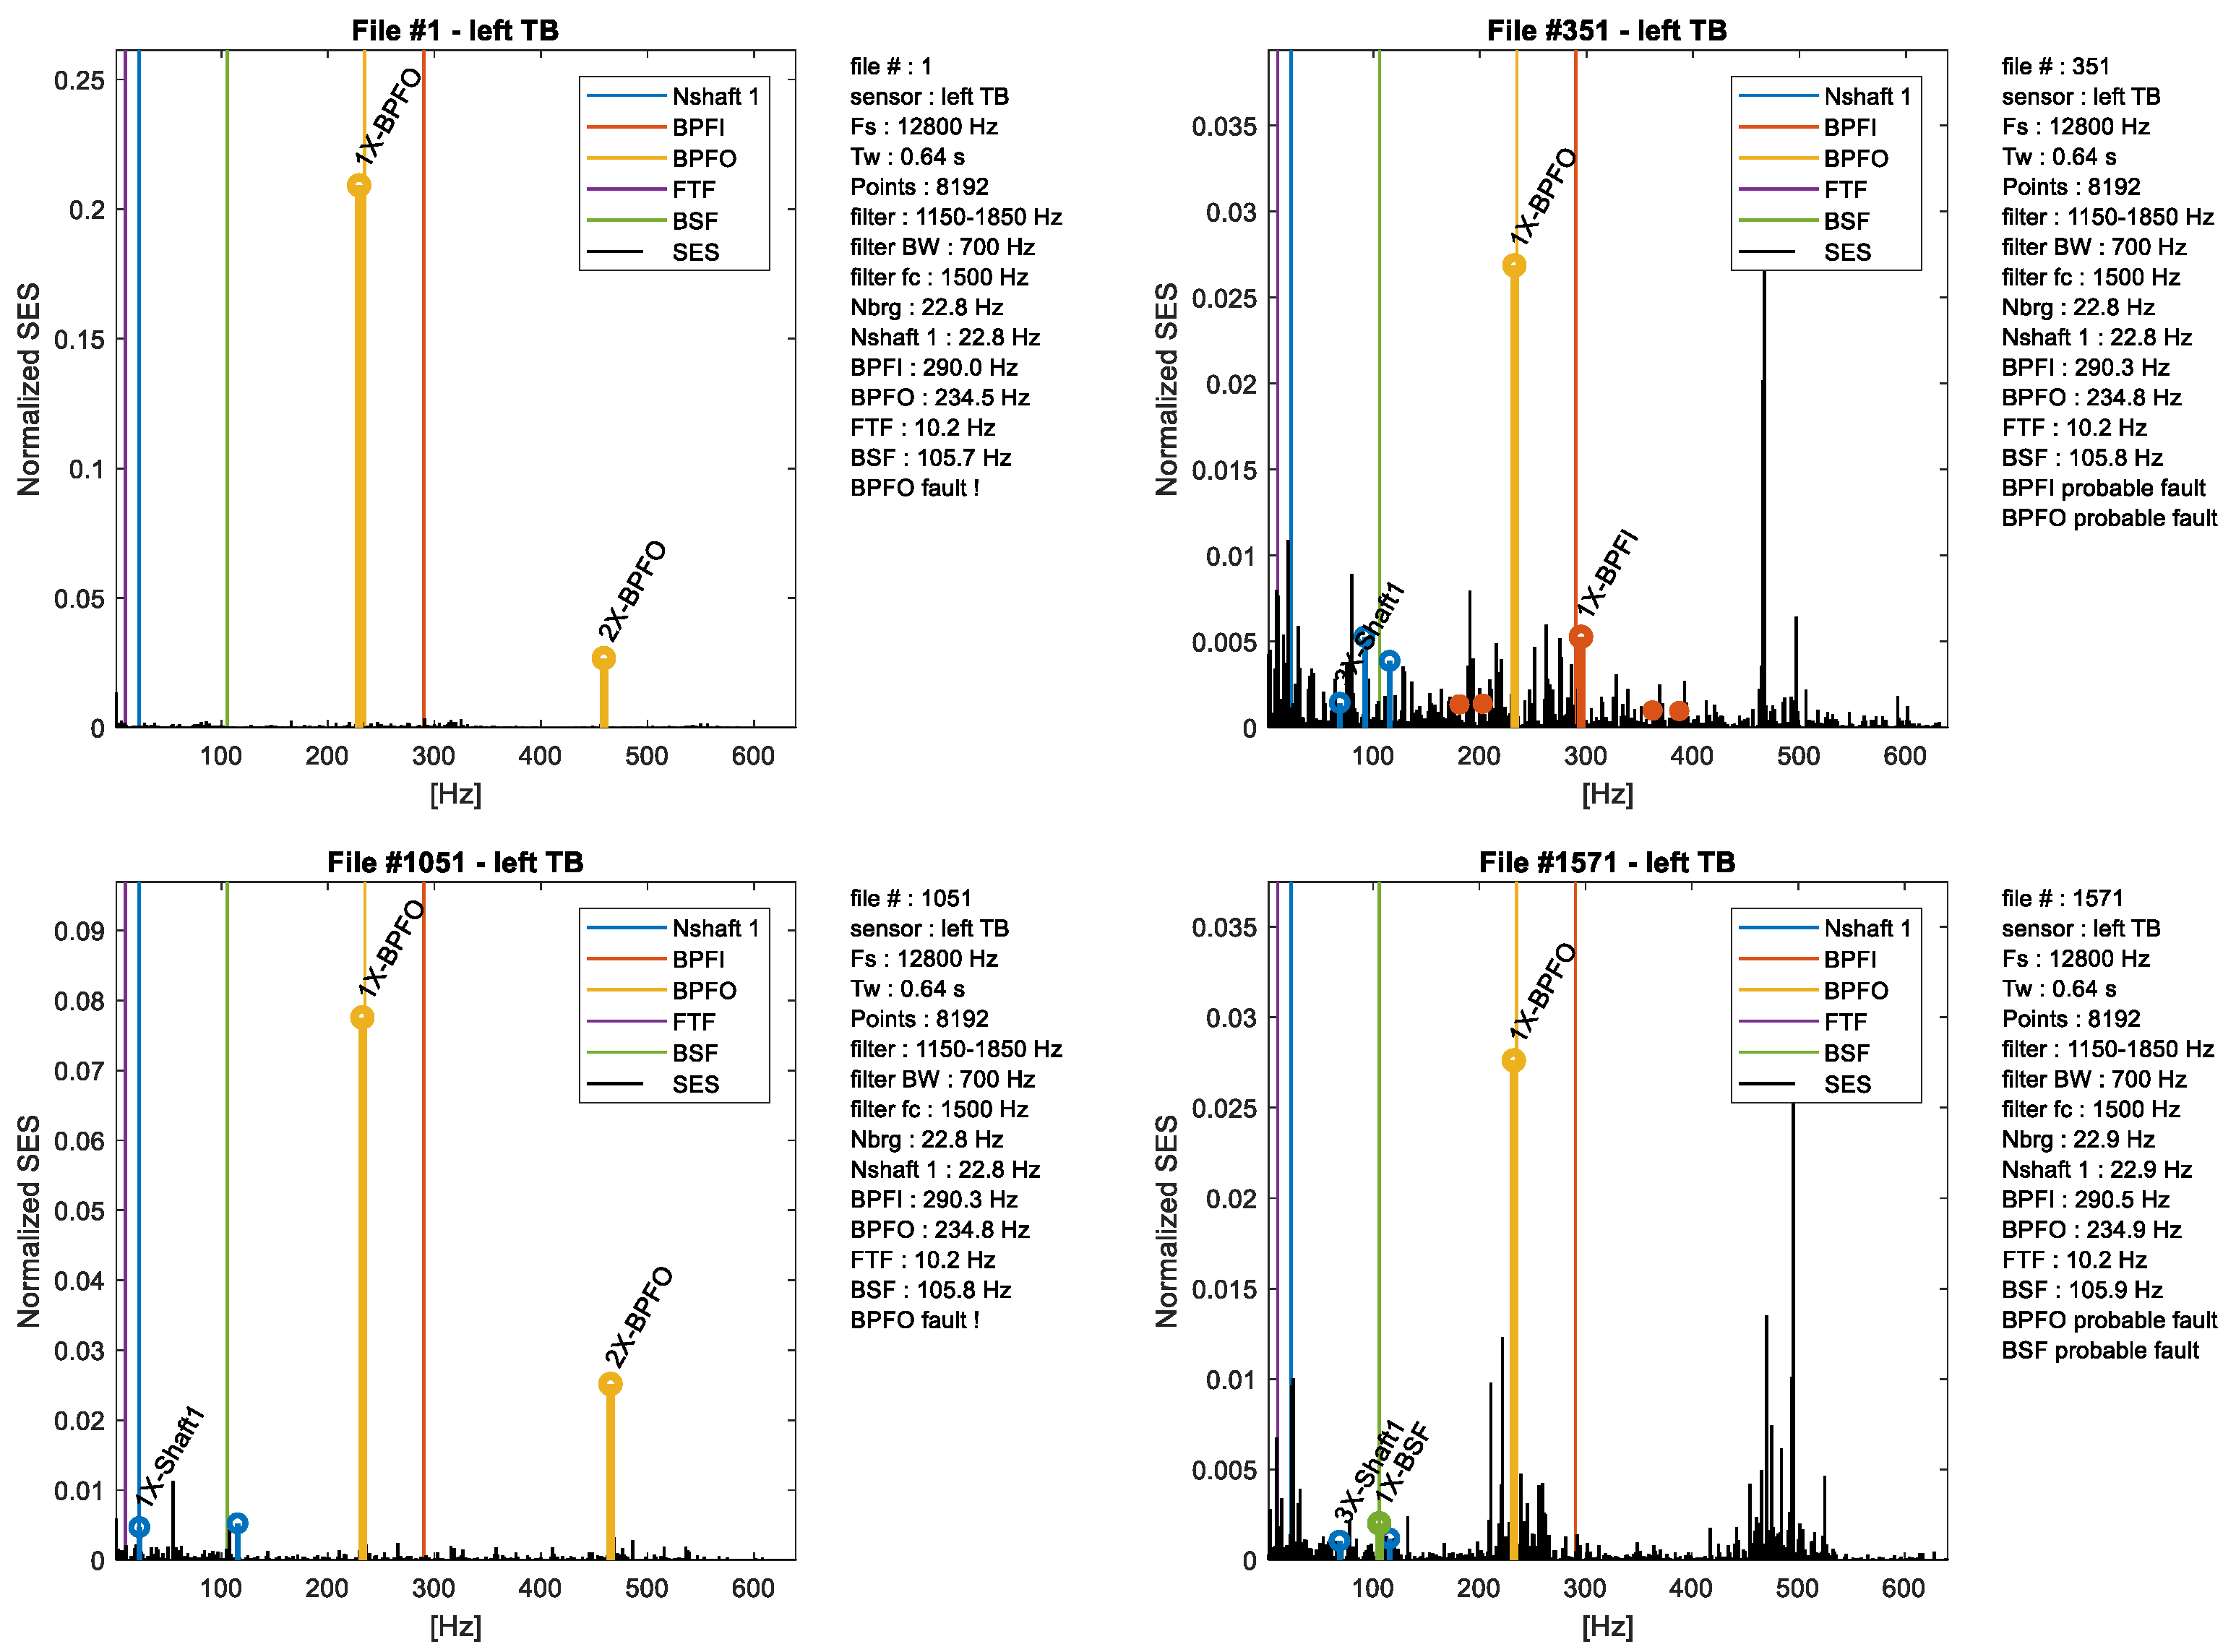
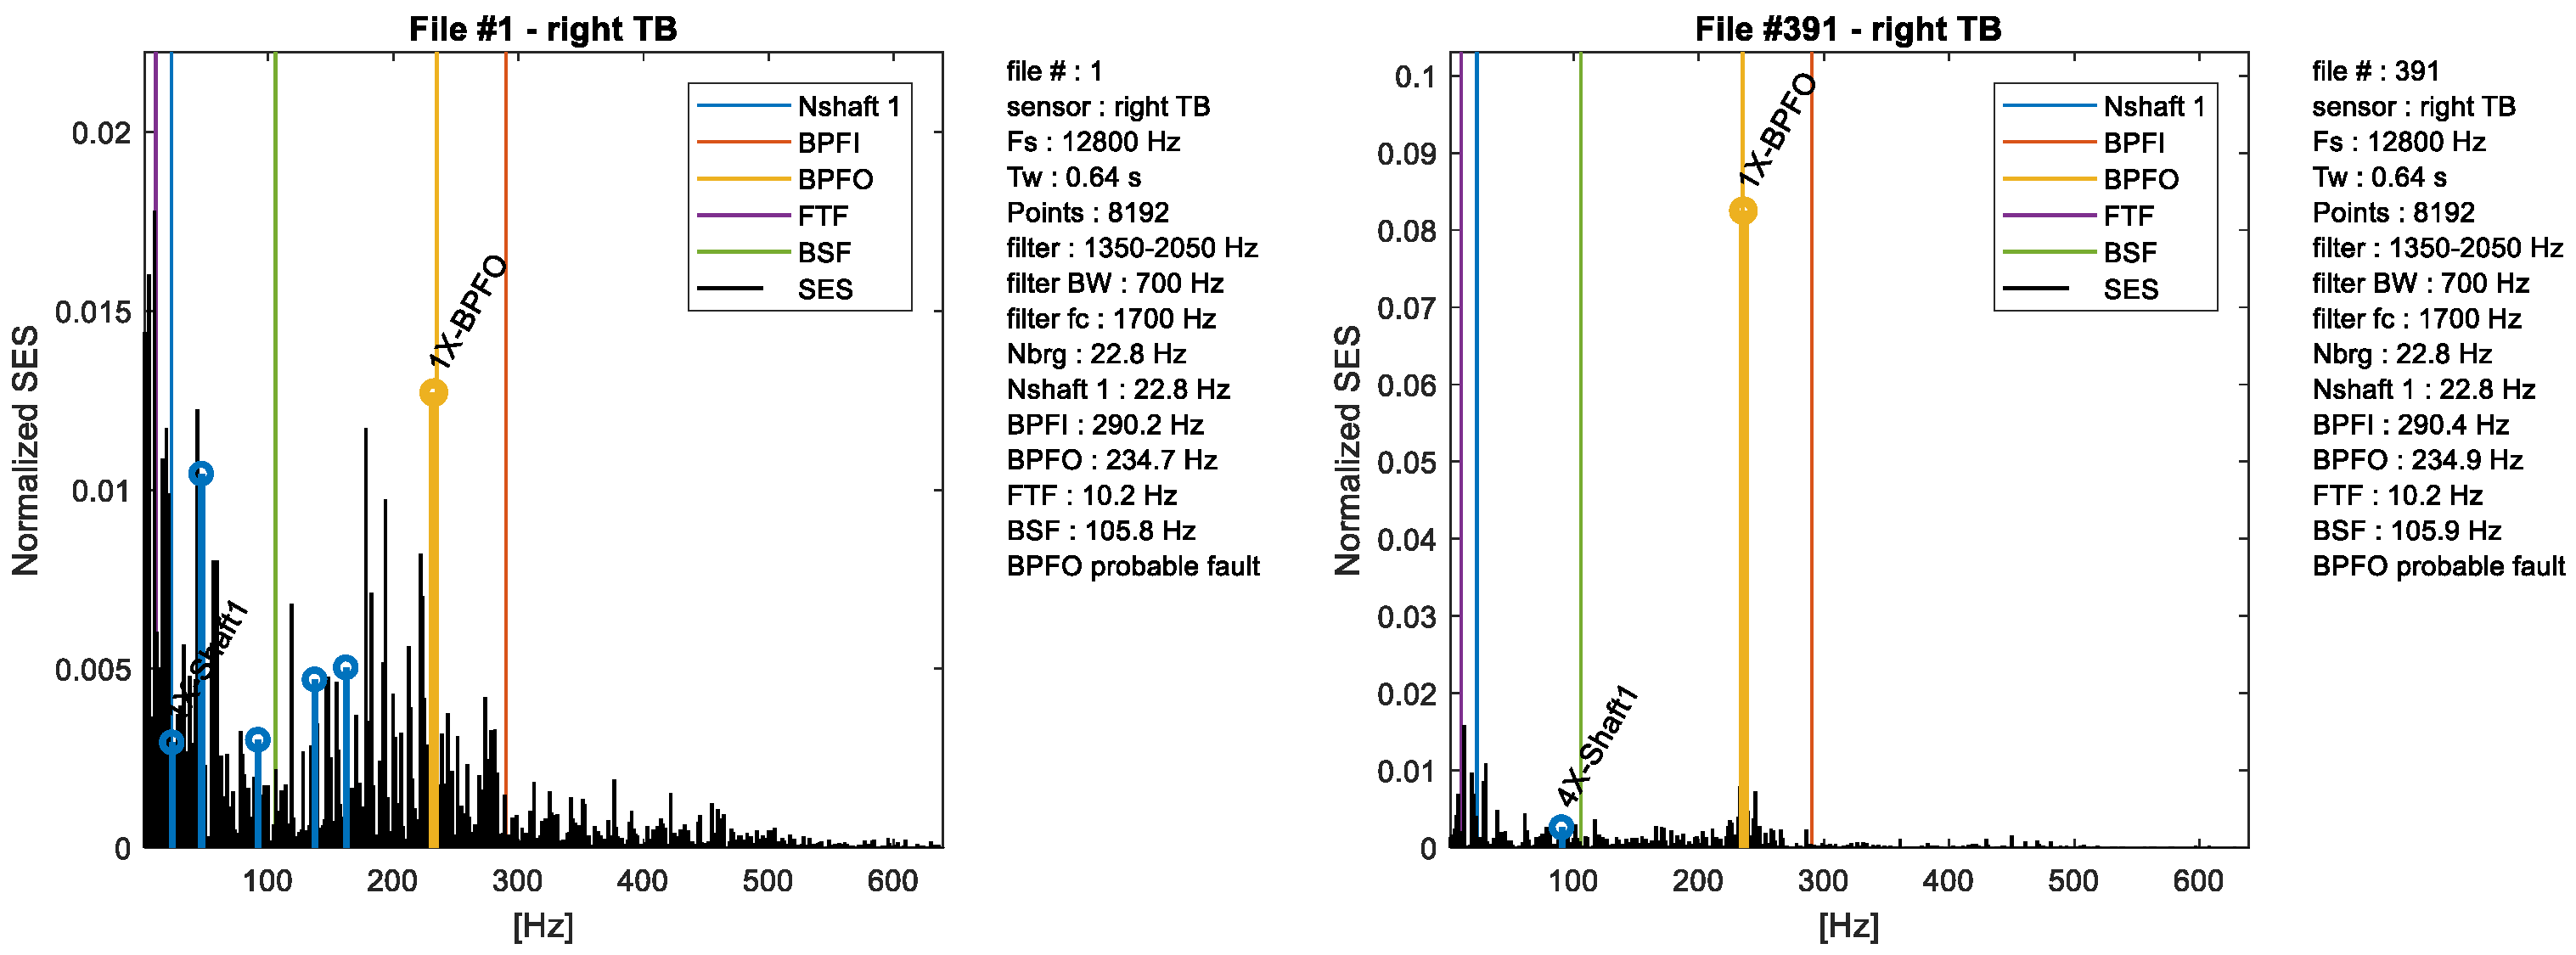
The normalized SESs for some single vibration data records are shown in Figure 9, the diagnostics of the fault is automatically made by means of an AI (Artificial Intelligence) algorithm, which searches for the maxima in spectrum lines and compares them with the fault frequencies.
The identification process starts from the search local maxima in the SES. Each identified component is removed from the SES in the following order: multiples of rotational speed, gear mesh frequencies, if present, and damaged frequencies (BPFI, BPFO, FTF, BSF). The multiples of rotational speed are identified, starting from the synchronous component (1X) by using an estimation of the rotational speed obtained by the tachometer or tacholess techniques. When a multiple of rotational speed is identified, the value of rotational speed is updated. The damaged frequencies are identified by searching a peak in the SES in correspondence of their theoretical values. Furthermore, sidebands of BPFI and multiples of damaged frequencies are also investigated. Each component is identified with certainty when its corresponding peak in the SES shows a high value of the STR ratio defined in Equation (14).
The normalized SESs correspond to records ordered in the time.
It is interesting to observe in Figure 8 that SES based indices present a non-monotonic trend close to the end of the test campaign. The change of the trend of these kind of indices has been already observed and described in detail in other papers by the same authors [27] and by other authors [35,36] and is typically related to the wear evolution in rolling element bearings. In this paper, for the sake of brevity, a full discussion is not presented, but the trend change occurs in the phases of “defect initiation” and “defect propagation” during the lifetime of the bearing.
4.3. Definition of the Optimal Frequency Band of the Filter for the Right Bearing
As can be expected, the results that were obtained for the other TB installed on the right side of the test-rig axle are not very different from those of the left side. Nevertheless, it also interesting to show them in order to prove that the results obtained using the methods introduced in this paper are repeatable. For the right TB, the same presentation sequence of the results of the previous case is followed and few comments are given.
4.4. Fault Detection and Localization for the Right Bearing
First, we consider the results corresponding to the first frequency band only, shown in Figure 12 and Figure 13, respectively, for the normalized SES and for its map. It is easy to observe, in both figures, the clear existence of a damage in the outer race of the bearing, because the 1xBPFO and 2xBPFO are evident.
Then, the damage indices are considered, whose trends are displayed in Figure 14 and Figure 15, which have similar trends to those of the TB on the left side of the axle. Similar to Figure 8, as well as in Figure 15, it is possible to observe that SES based indices show a change in the monotonic trend, due to the wear evolution. The normalized SESs for some single vibration data records are shown in Figure 16, in correspondence of the first frequency band, and the fault type is automatically selected by using the AI algorithm.
For the sake of brevity, for the second frequency band, only the results of map of the normalized SES are shown in Figure 17. In addition to this case, once and again, the evident 1xBPFO component indicates the presence of a damage in the outer race of the right TB.
5. Conclusions
In the past, the authors developed several methods for the diagnostics of bearings of railway applications in the presence of heavy environmental noise. In this paper, these methods have been applied on experimental data of a long-lasting test for a pair of bearings on a wheel axle, installed on a test-rig compliant with the standard EN 12082:2017, despite the tests having been performed using a relatively low sampling frequency and short time records. A damage on the outer race was detected, after a certain number of test runs, using squared envelope spectrum of the vibration signal.
Moreover, in the paper, some indices are introduced aiming at evaluating the trend of the severity of the damage and some of them reproduce the typical trend of the damage level, for both the bearings under test.
Regarding possible future work, keeping in mind the restrictions of practical applications, the fault identification can be improved by:
- increasing the sampling frequency up to 25 kHz in order to include higher frequency resonances;
- increasing the time window of acquisition in order to improve the frequency resolution of the spectra;
- including the axial load information (amplitude and direction), in order to pre-process and classify the data, to compare records acquired in similar conditions. In this way, it is expected to produce more clear trends of the indices of the damage.
Author Contributions
P.P. and S.C. wrote the draft and revised the manuscript. S.C. performed the analyses. A.V. and D.M. checked the logic described in the draft and the final version of the manuscript. All authors have read and agreed to the published version of the manuscript.
Funding
This research received no external funding.
Institutional Review Board Statement
Not applicable.
Informed Consent Statement
Not applicable.
Data Availability Statement
Not applicable.
Acknowledgments
The support of the Italian Ministry for Education, University and Research, by means of the project Department of Excellence LIS4.0 (Integrated Laboratory for Lightweight e Smart Structures), are gratefully acknowledged.
Conflicts of Interest
The authors declare no conflict of interest
References
- Entezami, M.; Roberts, C.; Weston, P.; Stewart, E.; Amini, A.; Papaelias, M. Perspectives on railway axle bearing condition monitoring. Proc. Inst. Mech. Eng. Part F J. Rail Rapid Transit. 2019, 234, 17–31. [Google Scholar] [CrossRef]
- Amini, A.; Huang, Z.; Entezami, M.; Papaelias, M. Evaluation of the effect of speed and defect size on high-frequency acoustic emission and vibration condition monitoring of railway axle bearings. Insight Non-Destr. Test. Cond. Monit. 2017, 59, 184–188. [Google Scholar] [CrossRef]
- Giannouli, E.; Huang, Z.; Amini, A.; Vallely, P.; Soua, S.; Marquez, F.P.G.; Papaelias, M. Remote condition monitoring of railway axle bearings based on data fusion from several sensors. In British Institute of Non-Destructive Testing, School of Metallurgy and Materials; University of Birmingham: Birmingham, UK, 2017; Available online: https://www.scopus.com/inward/record.uri?eid=2-s2.0-85029416505&partnerID=40&md5=3c80f17007a6ca8f76695e00b781373f (accessed on 12 January 2021).
- Amini, A.; Entezami, M.; Huang, Z.; Rowshandel, H.; Papaelias, M. Wayside detection of faults in railway axle bearings using time spectral kurtosis analysis on high-frequency acoustic emission signals. Adv. Mech. Eng. 2016, 8, 1–9. [Google Scholar] [CrossRef] [Green Version]
- Amini, A.; Entezami, M.; Papaelias, M. Onboard detection of railway axle bearing defects using envelope analysis of high frequency acoustic emission signals, Case Stud. Nondestruct. Test. Eval. 2016, 6, 8–16. [Google Scholar] [CrossRef] [Green Version]
- Huang, Z.; Amini, A.; Wang, L.; Kerkyras, S.; Papaelias, M. Online evaluation of railway axle bearing faults using acoustic emission and vibration Analysis. In British Institute of Non-Destructive Testing, School of Metallurgy and Materials; University of Birmingham B15 2TT: Birmingham, UK, 2014; Available online: https://www.scopus.com/inward/record.uri?eid=2-s2.0-84918514757&partnerID=40&md5=daf0f36987875971c8e268df777ea50f (accessed on 12 January 2021).
- Ferreira, J.L.A.; Balthazar, J.C.; Araujo, A.P.N. An investigation of rail bearing reliability under real conditions of use. Eng. Fail. Anal. 2003, 10, 745–758. [Google Scholar] [CrossRef]
- Gerdun, V.; Sedmak, T.; Šinkovec, V.; Kovše, I.; Cene, B. Failures of bearings and axles in railway freight wagons. Eng. Fail. Anal. 2007, 14, 884–894. [Google Scholar] [CrossRef]
- Yi, C.; Lin, J.; Zhang, W.; Ding, J. Faults diagnostics of railway axle bearings based on IMF’s confidence index algorithm for ensemble EMD. Sensors 2015, 15, 10991–11011. [Google Scholar] [CrossRef] [Green Version]
- Ricci, R.; Pennacchi, P. Diagnostics of gear faults based on EMD and automatic selection of intrinsic mode functions. Mech. Syst. Signal Process. 2011, 25, 821–838. [Google Scholar] [CrossRef] [Green Version]
- Yao, D.; Yang, J.; Pang, Z.; Nie, C.; Wen, F. Railway axle box bearing fault identification using LCD-MPE and ELM-Adaboost. J. Vibroeng. 2018, 20, 165–174. [Google Scholar] [CrossRef]
- Yi, C.; Wang, D.; Fan, W.; Tsui, K.-L.; Lin, J. Eemd-based steady-state indexes and their applications to condition monitoring and fault diagnosis of railway axle bearings. Sensors 2018, 18, 704. [Google Scholar] [CrossRef] [Green Version]
- Wang, D.; Zhao, Y.; Yi, C.; Tsui, K.-L.; Lin, J. Sparsity guided empirical wavelet transform for fault diagnosis of rolling element bearings. Mech. Syst. Signal Process. 2018, 101, 292–308. [Google Scholar] [CrossRef]
- Huang, Y.; Lin, J.; Liu, Z.; Wu, W. A modified scale-space guiding variational mode decomposition for high-speed railway bearing fault diagnosis. J. Sound Vib. 2019, 444, 216–234. [Google Scholar] [CrossRef]
- Wang, D.; Zhao, X.; Kou, L.-L.; Qin, Y.; Zhao, Y.; Tsui, K.-L. A simple and fast guideline for generating enhanced/squared envelope spectra from spectral coherence for bearing fault diagnosis. Mech. Syst. Signal Process. 2019, 122, 754–768. [Google Scholar] [CrossRef]
- Antoni, J. Fast computation of the kurtogram for the detection of transient faults. Mech. Syst. Signal Process. 2007, 21, 108–124. [Google Scholar] [CrossRef]
- Meehan, P.A.; Milne, C.D.; Liu, S. Investigation of wear degradation of railway spherical roller bearings. In CRC Press/Balkema, School of Mechanical and Mining Engineering; University of Queensland: Rockhampton, Australia, 2018; pp. 777–784. Available online: https://www.scopus.com/inward/record.uri?eid=2-s2.0-85061542232&partnerID=40&md5=3190608f48539ae20a790640d17549dd (accessed on 12 January 2021).
- Gómez, M.J.; Castejón, C.; Corral, E.; García-Prada, J.C. Railway axle condition monitoring technique based on wavelet packet transform features and support vector machines. Sensors 2020, 20, 3575. [Google Scholar] [CrossRef]
- Pennacchi, P.; Chatterton, S.; Vania, A.; Ricci, R.; Borghesani, P. Experimental evidences in bearing diagnostics for traction system of high speed trains. Chem. Eng. Trans. 2013, 33, 739–744. [Google Scholar] [CrossRef]
- Chatterton, S.; Pennacchi, P.; Ricci, R.; Borghesani, P. Diagnostics of rolling element bearings for the traction system of high speed trains: Experimental evidences. In Proceedings of the International Design Engineering Technical Conferences and Computers and Information in Engineering Conference, Portland, OR, USA, 4–7 August 2013; American Society of Mechanical Engineers: New York, NY, USA, 2013. [Google Scholar] [CrossRef]
- Borghesani, P.; Pennacchi, P.; Chatterton, S. The relationship between kurtosis- and envelope-based indexes for the diagnostic of rolling element bearings. Mech. Syst. Signal Process. 2014, 43, 25–43. [Google Scholar] [CrossRef]
- Pennacchi, P.; Chatterton, S.; Marinis, D.; Didonato, A. Diagnostics of traction system of very high-speed trains: Experimental results and selection of the most suitable signal processing techniques. In Proceedings of the 1th World Congress on Railway Research WCRR2016, Milan, Italy, 29 May–2 June 2016; WCRR Organizing Secretariat: Rome, Italy, 2016; pp. 1–7. [Google Scholar]
- Chatterton, S.; Pennacchi, P.; Vania, A.; Borghesani, P. Architecture of the monitoring system for the traction system bearings of a regional locomotive. In Proceedings of the 9th IFToMM International Conference on Rotor Dynamics, Milan, Italy, 22–25 September 2014; Springer: Cham, Switzerland, 2015; pp. 455–464. [Google Scholar] [CrossRef]
- Pennacchi, P.; Chatterton, S.; Vania, A. Development and testing of health monitoring of the bearings of traction system of a regional train locomotive during commercial service. In Proceedings of the ISMA2018 International Conference on Noise and Vibration Engineering, Leuven, Belgium, 17–19 September 2018; KU Leuven-Departement Werktuigkunde: Leuven, Belgium, 2018; pp. 1–8. [Google Scholar]
- Xu, L.; Chatterton, S.; Pennacchi, P. A Novel Method of Frequency Band Selection for Squared Envelope Analysis for Fault Diagnosing of Rolling Element Bearings in a Locomotive Powertrain. Sensors 2018, 18, 4344. [Google Scholar] [CrossRef] [Green Version]
- Pennacchi, P.; Chatterton, S.; Vania, A.; Xu, L. Diagnostics of Bearings in Rolling Stocks: Results of Long Lasting Tests for a Regional Train Locomotive. In International Conference on Rotor Dynamics; Springer: Cham, Switzerland, 2019. [Google Scholar] [CrossRef]
- Xu, L.; Pennacchi, P.; Chatterton, S. A new method for the estimation of bearing health state and remaining useful life based on the moving average cross-correlation of power spectral density. Mech. Syst. Signal Process. 2020, 139. [Google Scholar] [CrossRef] [Green Version]
- Chatterton, S.; Pennacchi, P.; Vania, A.; Borghesani, P. Tracking the damage level in rolling element bearings. In Proceedings of the 9th IFToMM International Conference on Rotor Dynamics, Milan, Italy, 22–25 September 2014; Springer: Cham, Switzerland, 2015. [Google Scholar] [CrossRef]
- Borghesani, P.; Ricci, R.; Chatterton, S.; Pennacchi, P. A new procedure for using envelope analysis for rolling element bearing diagnostics in variable operating conditions. Mech. Syst. Signal Process. 2013, 38. [Google Scholar] [CrossRef]
- Gao, S.; Chatterton, S.; Naldi, L.; Pennacchi, P. Ball bearing skidding and over-skidding in large-scale angular contact ball bearings: Nonlinear dynamic model with thermal effects and experimental results. Mech. Syst. Signal Process. 2021, 147. [Google Scholar] [CrossRef]
- Chatterton, S.; Pennacchi, P.; Vania, A.; Borghesani, P. A novel procedure for the selection of the frequency band in the envelope analysis for rolling element bearing diagnostics. In Proceedings of the 9th IFToMM International Conference on Rotor Dynamics, Milan, Italy, 22–25 September 2014; Springer: Cham, Switzerland, 2015. [Google Scholar] [CrossRef]
- Randall, R.B.; Antoni, J. Rolling element bearing diagnostics-A tutorial. Mech. Syst. Signal Process. 2011, 25, 485–520. [Google Scholar] [CrossRef]
- Abboud, D.; Elbadaoui, M.; Smith, W.A.; Randall, R.B. Advanced bearing diagnostics: A comparative study of two powerful approaches. Mech. Syst. Signal Process. 2019, 114, 604–627. [Google Scholar] [CrossRef]
- Borghesani, P.; Pennacchi, P.; Ricci, R.; Chatterton, S. Testing second order cyclostationarity in the squared envelope spectrum of non-white vibration signals. Mech. Syst. Signal Process. 2013, 40. [Google Scholar] [CrossRef]
- El-Thalji, I.; Jantunen, E. Fault analysis of the wear fault development in rolling bearings. Eng. Fail. Anal. 2015, 57, 470–482. [Google Scholar] [CrossRef]
- El-Thalji, I.; Jantunen, E. A summary of fault modelling and predictive health monitoring of rolling element bearings. Mech. Syst. Signal Process. 2015, 60–61, 252–272. [Google Scholar] [CrossRef]
Figure 1.
Outline of the main components of a test-rig compliant with EN 12082:2017 standard. A couple of axle bearings are simultaneously tested (TB, in yellow) and are installed on the extremities of a stub shaft, under vertical and axial loading.
Figure 1.
Outline of the main components of a test-rig compliant with EN 12082:2017 standard. A couple of axle bearings are simultaneously tested (TB, in yellow) and are installed on the extremities of a stub shaft, under vertical and axial loading.

Figure 2.
Test cycles. From the top: rotational speed, radial load, and axial load (adapted from EN 12082:2017).
Figure 2.
Test cycles. From the top: rotational speed, radial load, and axial load (adapted from EN 12082:2017).

Figure 3.
Definition of the optimal frequency band for filtering the residual signal according to the RCC index—left TB.
Figure 3.
Definition of the optimal frequency band for filtering the residual signal according to the RCC index—left TB.

Figure 4.
Definition of the optimal frequency band for filtering the residual signal according to the SES index—left TB.
Figure 4.
Definition of the optimal frequency band for filtering the residual signal according to the SES index—left TB.

Figure 5.
Values of the normalized SES for the different data sets—left TB. The axis on the left of the base plane is relative to the vibration records sorted in chronological order.
Figure 5.
Values of the normalized SES for the different data sets—left TB. The axis on the left of the base plane is relative to the vibration records sorted in chronological order.

Figure 6.
Normalized SES map, i.e., top view of Figure 5—left TB.
Figure 6.
Normalized SES map, i.e., top view of Figure 5—left TB.

Figure 7.
Fault severity indices (part 1)—left TB.

Figure 8.
Fault severity indices (part 2)—left TB.

Figure 9.
Values of the normalized SES for some data records—left TB.

Figure 10.
Definition of the optimal frequency band for filtering the residual signal according to the RCC index—right TB.
Figure 10.
Definition of the optimal frequency band for filtering the residual signal according to the RCC index—right TB.

Figure 11.
Definition of the optimal frequency band for filtering the residual signal according to the SES index—right TB.
Figure 11.
Definition of the optimal frequency band for filtering the residual signal according to the SES index—right TB.

Figure 12.
Values of the normalized SES for the different data sets, first frequency band—right TB. The axis on the left of the base plane is relative to the vibration records sorted in chronological order.
Figure 12.
Values of the normalized SES for the different data sets, first frequency band—right TB. The axis on the left of the base plane is relative to the vibration records sorted in chronological order.

Figure 13.
Normalized SES map, i.e., top view of Figure 12, first frequency band—right TB.
Figure 13.
Normalized SES map, i.e., top view of Figure 12, first frequency band—right TB.

Figure 14.
Fault severity indices (part 1), first frequency band—right TB.

Figure 15.
Fault severity indices (part 2), first frequency band—right TB.

Figure 16.
Values of the normalized SES for some data records, first frequency band—right TB.


Figure 17.
Normalized SES map, second frequency band—right TB.


Table 1.
Fault characteristic frequencies of test and support bearings at 1371 rpm (rated rotational speed).
Table 1.
Fault characteristic frequencies of test and support bearings at 1371 rpm (rated rotational speed).
| Fault | Fault Type | Test Bearings—TB | Support Bearings—SB |
|---|---|---|---|
| BPFI | Fault on the inner race | 12.710 (Hz) | 5.0577 (Hz) |
| BPFO | Fault on the outer race | 10.280 (Hz) | 7.9423 (Hz) |
| BSF | Fault on the rolling element | 4.634 (Hz) | 2.1424 (Hz) |
| FTF | Fault on the cage | 0.4475 (Hz) | 0.3888 (Hz) |
Table 2.
List of symbols used in Figure 2 (adapted from EN 12082:2017).
Table 2.
List of symbols used in Figure 2 (adapted from EN 12082:2017).
| Symbol | Unit | Description |
|---|---|---|
| Fa | (N) | axial test force |
| Fan | (N) | nominal axial test force |
| Fr | (N) | radial test force |
| n | (rpm) | rotational test speed |
| ntest | (rpm) | nominal rotational test speed |
| t1 | (s) | time of one test cycle |
| t2 | (s) | time of one elementary trip |
| t3 | (s) | ramp up or ramp down time from n = 0 → n = ntest or n = ntest → n = 0 during one elementary trip |
| t4 | (s) | time at rotational speed ntest during one elementary trip |
| t5 | (s) | stop time (n = 0) |
| t6 | (s) | time of one half load cycle of the alternating axial test force |
| t7 | (s) | time during which axial test force is applied (including ramp up and ramp down) within the period t6 |
| t8 | (s) | ramp up or ramp down time from Fa = 0 → Fa = Fan or Fa = Fan → Fa = 0 during one half load cycle of the alternating axial test force |
| t9 | (s) | axial test force recovery time |
Publisher’s Note: MDPI stays neutral with regard to jurisdictional claims in published maps and institutional affiliations. |
© 2021 by the authors. Licensee MDPI, Basel, Switzerland. This article is an open access article distributed under the terms and conditions of the Creative Commons Attribution (CC BY) license (http://creativecommons.org/licenses/by/4.0/).
Share and Cite
MDPI and ACS Style
Pennacchi, P.; Chatterton, S.; Vania, A.; Massocchi, D. Definition of Damage Indices for Railway Axle Bearings: Results of Long-Lasting Tests. Machines 2021, 9, 12. https://doi.org/10.3390/machines9010012
AMA Style
Pennacchi P, Chatterton S, Vania A, Massocchi D. Definition of Damage Indices for Railway Axle Bearings: Results of Long-Lasting Tests. Machines. 2021; 9(1):12. https://doi.org/10.3390/machines9010012
Chicago/Turabian StylePennacchi, Paolo, Steven Chatterton, Andrea Vania, and Davide Massocchi. 2021. "Definition of Damage Indices for Railway Axle Bearings: Results of Long-Lasting Tests" Machines 9, no. 1: 12. https://doi.org/10.3390/machines9010012
Note that from the first issue of 2016, this journal uses article numbers instead of page numbers. See further details here.