
Role of Disordered Precursor in L10 Phase Formation in FePt-Based Nanocomposite Magnet

1
National Institute for Materials Physics, 077125 Magurele, Romania
2
R&D Consulting and Services S.R.L., 023761 Bucharest, Romania
*
Author to whom correspondence should be addressed.
Magnetochemistry 2021, 7(11), 149; https://doi.org/10.3390/magnetochemistry7110149
Submission received: 1 October 2021
/
Revised: 5 November 2021
/
Accepted: 9 November 2021
/
Published: 14 November 2021
(This article belongs to the Special Issue Magnetic Materials, Thin Films and Nanostructures)
Abstract
:In order to prove the usefulness of having a structurally disordered precursor to the formation of FePt L10 phase and to facilitate the co-existence of exchange coupled hard and soft magnetic phases with optimized magnetic properties in various conditions of annealing, a Fe-Pt-Zr-B melt spun alloy has been synthesized and detailed structural and magnetic investigations have been undertaken to probe its phase evolution during annealing. The dynamics of formation of the hard magnetic L10 phase during the gradual disorder–order phase transformation has been monitored by using a complex combination of X-ray diffraction methods and 57Fe Mössbauer spectroscopy methods, over a wide range of annealing temperatures. Multiple phases co-existing in the annealed sample microstructures, observed in XRD, have been reconfirmed by the Mössbauer spectra analysis and, moreover, accurate quantitative data have been acquired in what concerns the relative abundance of each of the observed crystalline phases in every stage of annealing. It is shown that the formation of the hard magnetic phase, emerging from the chemically disordered precursor, is gradual and occurs via complex mechanisms, involving the presence of a disordered Fe-Zr-B-rich intergranular region which contributes to an increase in the abundance of the L10 phase for higher annealing temperatures. Magnetic measurements have confirmed the good performances of these alloys in terms of coercivity and remanence. These results contribute to the development of these alloys as the next generation of rare earth, free permanent magnets.
1. Introduction
Nanocomposite FePt-based magnets have been under scrutiny as a new class of permanent magnets, due to their high corrosion resistance and their high working temperature. The interest in using FePt alloys is based on the disorder–order structural phase transition [1] that occurs in the alloy. FePt usually has a disordered face-centered-cubic fcc A1 structure. Upon annealing, for quasi-equiatomic stoichiometry, the structure undergoes a structural phase transformation, towards the formation of an L10 ordered face-centered-tetragonal fct phase that has a high coercivity and a very large magnetocrystalline anisotropy. Non-equilibrium synthesis methods are appropriate for achieving the formation of an L10 phase in melt-spun FePt-based ribbons without the need for post-synthesis annealing [2]. Another way to create magnetic alloys with good magnetic properties is to achieve a hard–soft magnetic structure, where the hard magnetic FePt phase is exchange-coupled to soft magnetic ones, and to take full advantage from the high magnetization of the soft phase and the high coercivity of the hard magnetic phase, in order to maximize the energy product (BH)max. To achieve such a phase structure, the initial composition [3] must be modulated by addition of elements, which can provide the necessary additional soft magnetic phase such as boron. This a well-known glass-forming element which introduced in FePt-based metallic alloys allows formation of a disordered intermetallic precursor. Following appropriate annealing, this precursor may transform in both hard and soft magnetic phases. The advantage of emerging form the same precursor is that the obtained nanocrystalline phases are crystallographically coherent and their exchange coupling is favored. In this way, suitable hard–soft arrangements of phases with well-dispersed nanometric-size grains upon annealing can be obtained. Arrangements of magnetically soft and hard phases for the improvement of hard magnetic properties has been already employed by other researchers. For instance, Chrobak et al. [4] obtained ultra-high coercivity of (Fe86−xNbxB14)0.88Tb0.12 bulk nanocrystalline magnets where such arrangements of different magnetic phases were achieved.
Recently, there have been reports on the preparation and characterization of such ternary Fe-Pt-B alloys, using a plethora of non-equilibrium synthesis methods, to obtain both layered structures, such as thin films and multilayers, and bulk alloys, such as melt spun ribbons [5,6,7]. Magnetic composites of the multilayer type, made of FeB pre-alloy co-doped within FePt deposited films, were studied by Tsai et al. [8] Such exchange-coupled hard–soft system have shown a perpendicular anisotropy with a single switching field. In sandwiched systems made of soft (CoFeB) and hard (FePtB) layers, it has been shown [9] that oxidation during annealing induces stresses through the capping layer, which facilitates greatly the formation of the L10 phase in the FePtB hard layer. FePtB melt-spun alloys of various compositions have also been studied in [10]. In this case, the precursor alloy is synthesized in an as-cast state and is then annealed in order to obtain the crystalline state. In this case, hard, tetragonally ordered L10 FePt and soft Fe2B phases were formed, but the composition modulation and Pt deficit strongly alters the magnetic performances. Co-sputtered FePt-B multilayers have also been studied [11] and it was found that rapid annealing induces ordering of L10 FePt via intermixing with B at the interfaces as well as by the introduction of 0.1 at% Ag. Other synthesis procedures, such as pulsed laser deposition, have also been used to construct exchange-coupled FePtB-based composites [12] and it was found that best magnetic performance has been found for very thick (1.7 microns) FePtB where both hard FePt and soft iron boride phases co-exist. Even lower ordering temperatures with higher thicknesses (3 microns) of co-sputtered FePtB are shown to also produce good magnetic results [13]. Optimizing the microstructure is a factor that strongly influences the overall magnetic behavior. For this, the performed annealing is of great importance. The effect of annealing time on the obtained magnetic properties in FePtB melt-spun alloys was investigated in [14]. The compositional effect of introducing boron on the exchange coupling effect in FePtB has also been investigated [15]. It was shown [16] that from application point of view, such exchange-coupled FePt-FePtB composites show good potential as magnetic recording media.
In our previous work [17], we have shown that in Fe-rich Fe-Pt-Nb-B alloys the microstructure is highly sensitive to the stoichiometry of the as-cast alloy [18]. Boron content of about 8–9% is proven to be not enough to ensure an amorphous-like as-cast state and the samples are obtained in their nanocrystalline A1 structure, while for B content of 18–20%, a disordered structure is obtained in the as-cast state, with large Bragg lines of the A1 structure, as seen in the X-ray diffraction. For samples with a lower Fe content, (Fe0.65Pt0.35)78+xNb2B20−x, we have proven that, upon appropriate annealing, very good exchange spring properties are obtained with an energy product (BH)max of 70 kJ/m3 [19].
In the case of systems exhibiting an L10 phase, the high ordering temperature hinders their potential as future nanocomposite RE-free exchange-coupled magnets. It is thought that the reduction of this value can be achieved by adding other elements to the composition, such as Au, Ag, Nb or Zr, with the aim of promoting earlier ordering by segregation to the FePt grain boundaries [20,21,22,23,24] or a glass-forming element (B) to allow the formation of a chemically disordered phase as a precursor for both hard and soft magnetic phases, exchange-coupled to optimize in this way the magnetic properties [25,26,27,28,29,30,31,32,33,34,35]. We have previously shown [2] that the Fe-Pt-Ag-B melt-spun alloy shows a direct formation of the L10 phase from the as-cast state without subsequent annealing. It seems quite clear that the different magnetic features in L10-based nanocomposite magnets are strongly influenced by their multiphase nanostructure features.
The present work is dedicated to the detailed structural and morphological study of the microstructure modifications and phase evolution during annealing, as well as the magnetic properties of a Fe-Pt-Zr-B melt-spun alloys, co-existence of exchange coupled hard and soft magnetic phases and the magnetic properties in various conditions of annealing.
2. Experimental
An alloy with nominal composition Fe65Pt15Zr3B17 has been synthesized by rapid solidification of the melt. The alloy was synthesized starting with elemental powders and flakes of high purity. They were melted together in an induction furnace with a controlled melting temperature (set at 1300 °C). The primary alloy re-melted 3 times to prevent element segregation and to improve its chemical homogeneity. A total amount of 5 g has been used for each sample. The rapid solidification of the melt is performed on a Buhler Melt Spinner SC with protective Ar atmosphere. The obtained melt is purged onto the surface of a Cu wheel. The wheel has 40 cm in diameter and rotates with 2000 rot/min. The melt is flown away from the quartz tube through a circular nozzle of 0.5 mm using Ar pressure of 40 kPa. The size of the nozzle dictates the width of the obtained ribbons. Since the total mass of the experiment was only 5 g, it was necessary to use such a small nozzle. The melt solidifies with a cooling rate of about 106 K/min. Away from the wheel, continuous and homogeneous ribbons are obtained. They are about 30 microns thick, 2–3 mm wide and several decimeters long.
In order to obtain the full crystallization and formation of the hard magnetic phase, the as-obtained ribbons were subjected to isothermal annealing. The procedure has been performed at various temperatures, and were chosen at 100 °C intervals. The chosen temperatures of annealing were: 500 °C, 600 °C, 700 °C and 800 °C. The heating rate was established at 5 K/min and annealing time (time spent at maximum temperature) was set to 30 min. The annealing was performed under a high vacuum (10−4 mbar) in order to avoid oxidation.
The detailed structural and morphological study of the microstructure modifications, phase evolution during annealing, and magnetic properties of the annealed alloys, was performed by X-ray diffraction (XRD), Mössbauer spectrometry (MS) and magnetic characterizations. For XRD, a Bruker D8 Advance (Bruker AXS GmbH, Karlsruhe, Germany) with Cu Kα radiation wavelength of 1.54 Å was used. The 57Fe Mössbauer spectrometry is performed at 300 K and 77 K using a conventional set-up in transmission geometry with a 57Co source in a Rh matrix. Magnetic characterization has been performed with a SQUID (Superconducting QUantum Interference Device) unit of an MPMS (Magnetic Properties Measurement System) from Quantum Design (Quantum Design Europe GmbH, Darmstadt, Germany), under an applied field of up to 5.5 Tesla, in parallel and perpendicular geometry and temperatures ranging from 4.2 K to 300 K.
3. Results and Discussion
3.1. As-Cast State
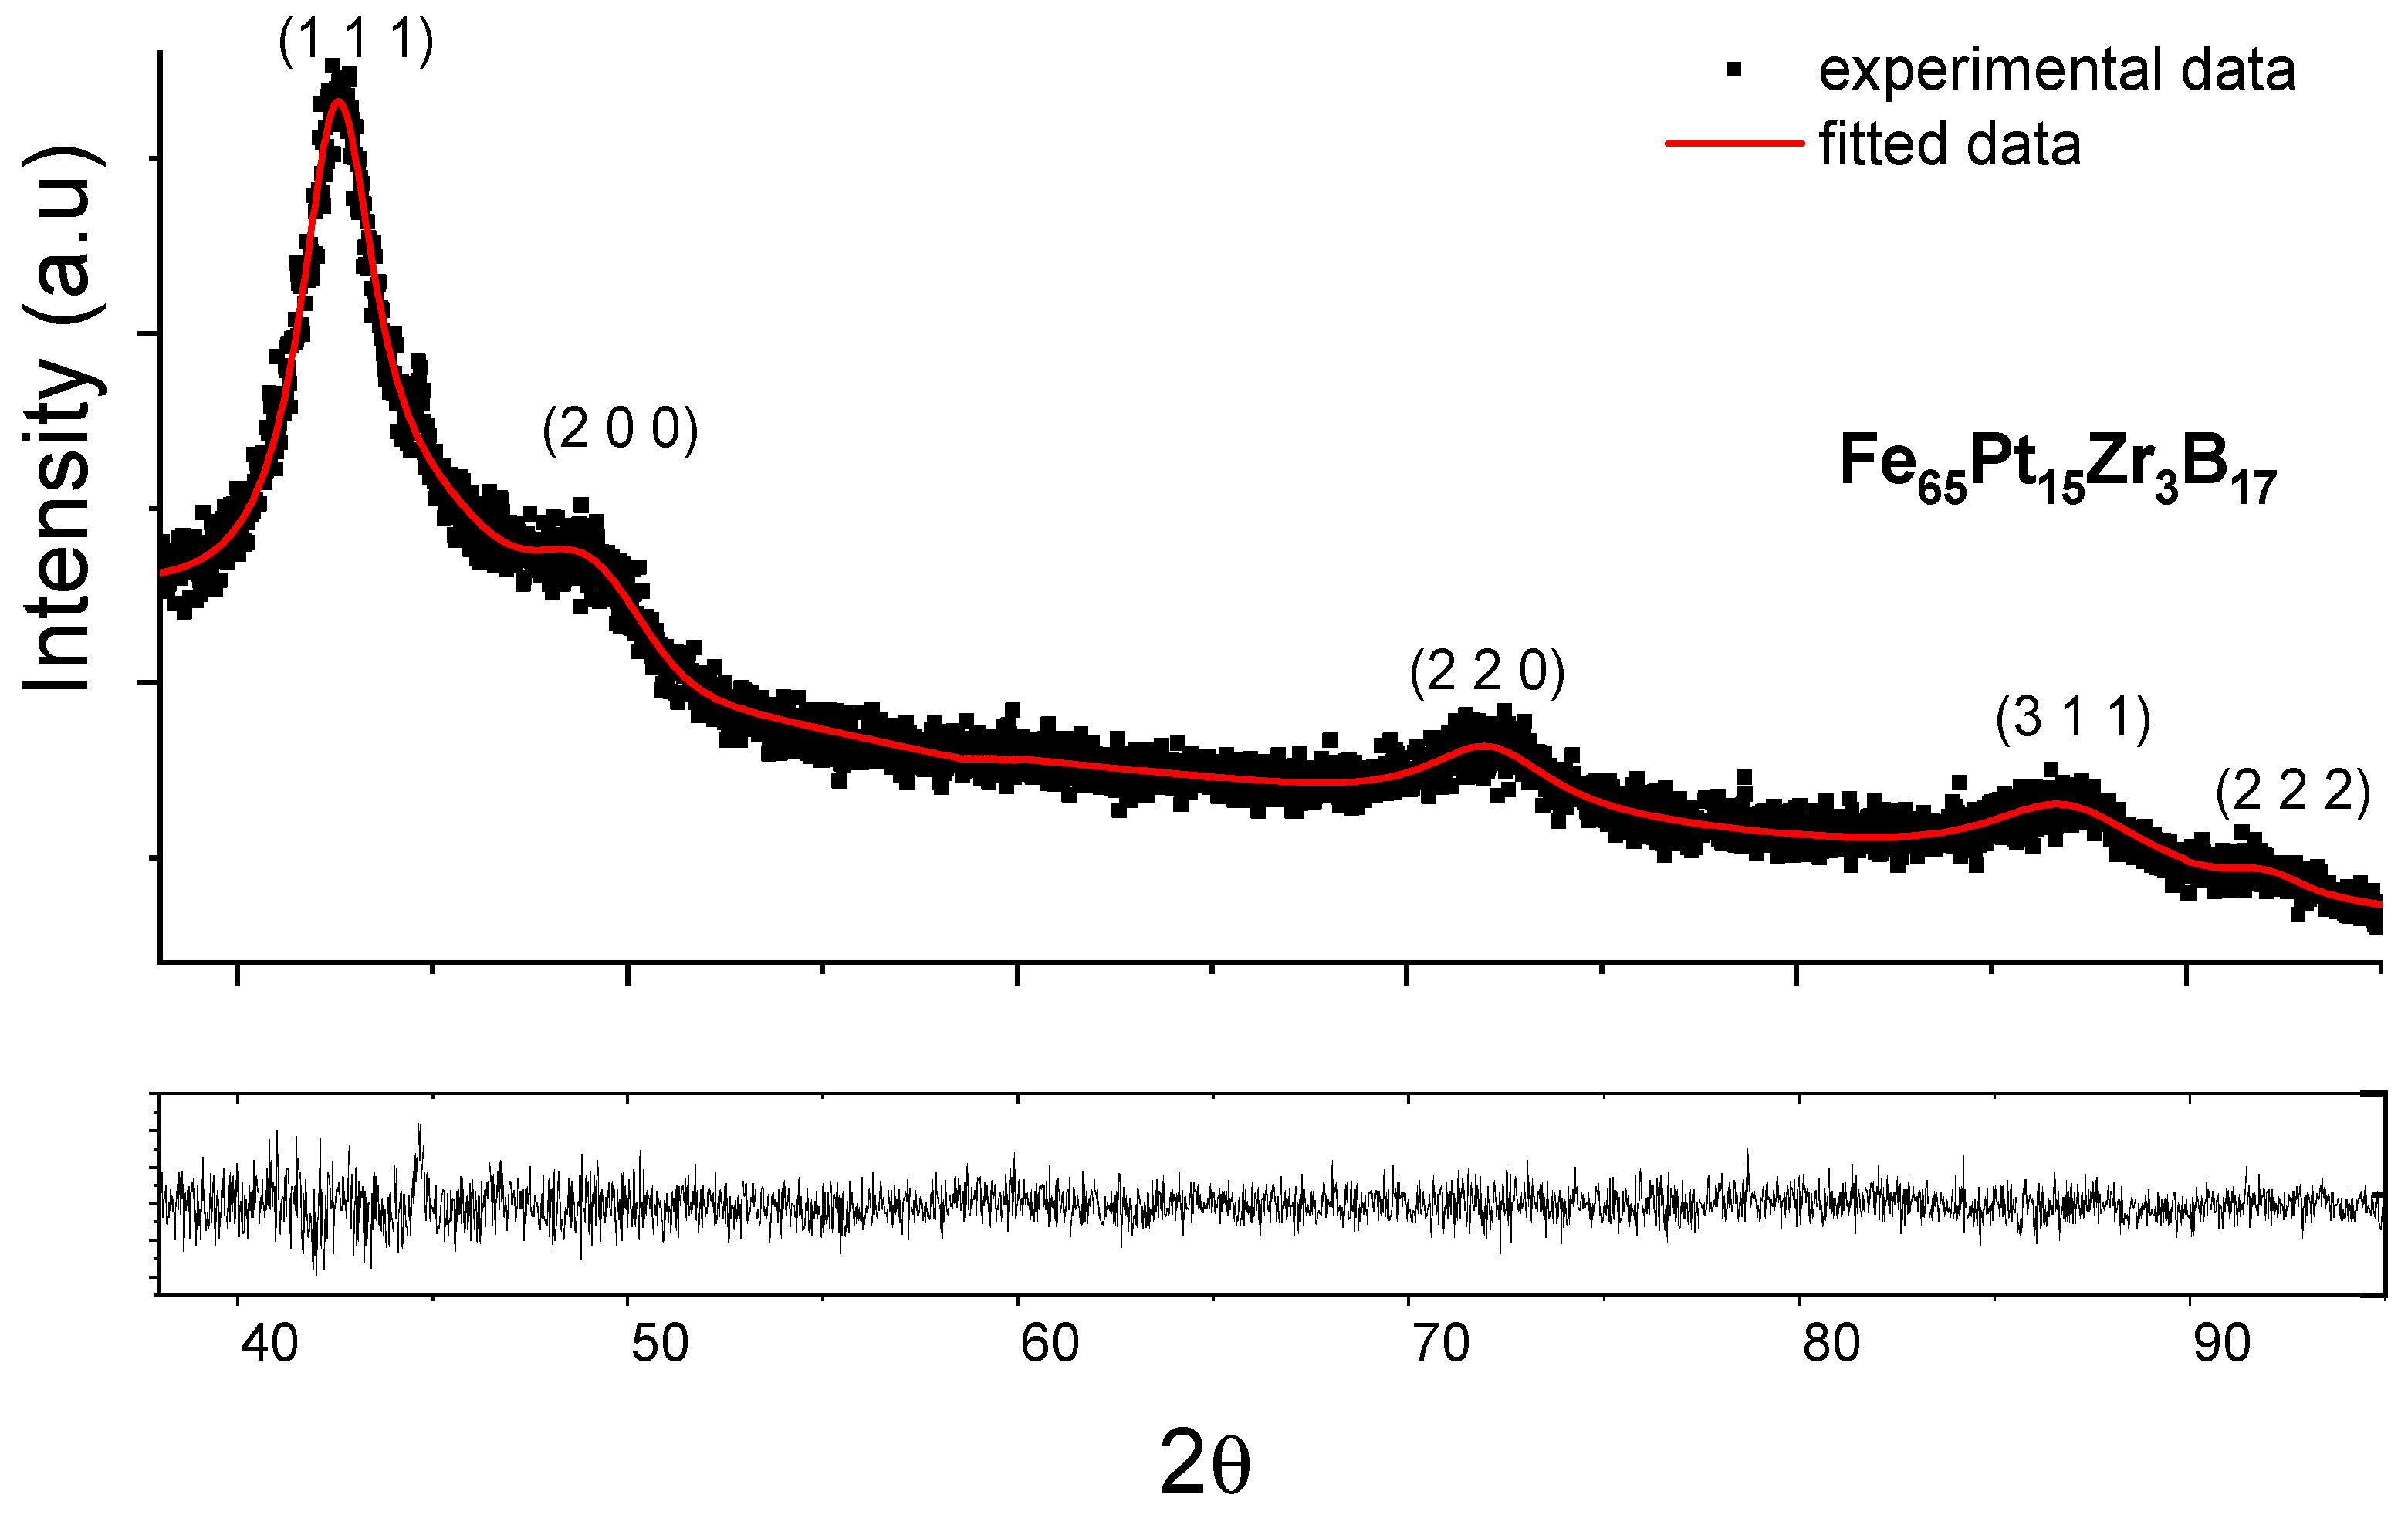
The ribbon as-cast state has been investigated using XRD and Mössbauer spectrometry. The X-ray diffractogram for the as-cast Fe65Pt15Zr3B17 sample exhibits very broad Bragg lines. They have been indexed as belonging to the fcc A1 phase. As proven by the lines wide broadening, there is chemical disorder within the A1 fcc structure. The full-profile analysis of the XRD patterns has been analyzed using MAUD (Materials Analysis Using Diffraction) software. The structure of the as-cast sample has disordered fcc A1 symmetry, as resulted from the fittings. Figure 1 shows the X-ray diffractogram fitted with MAUD. It is probable that this structure could be a precursor for the formation of FePt and iron boride phases after appropriate crystallization treatment. We have calculated, based on the integral breadth approach, the crystallite size for all the Bragg peaks indexed in the fcc A1 system. The mean grain size is found to be 3.8 ± 1.4 nm.
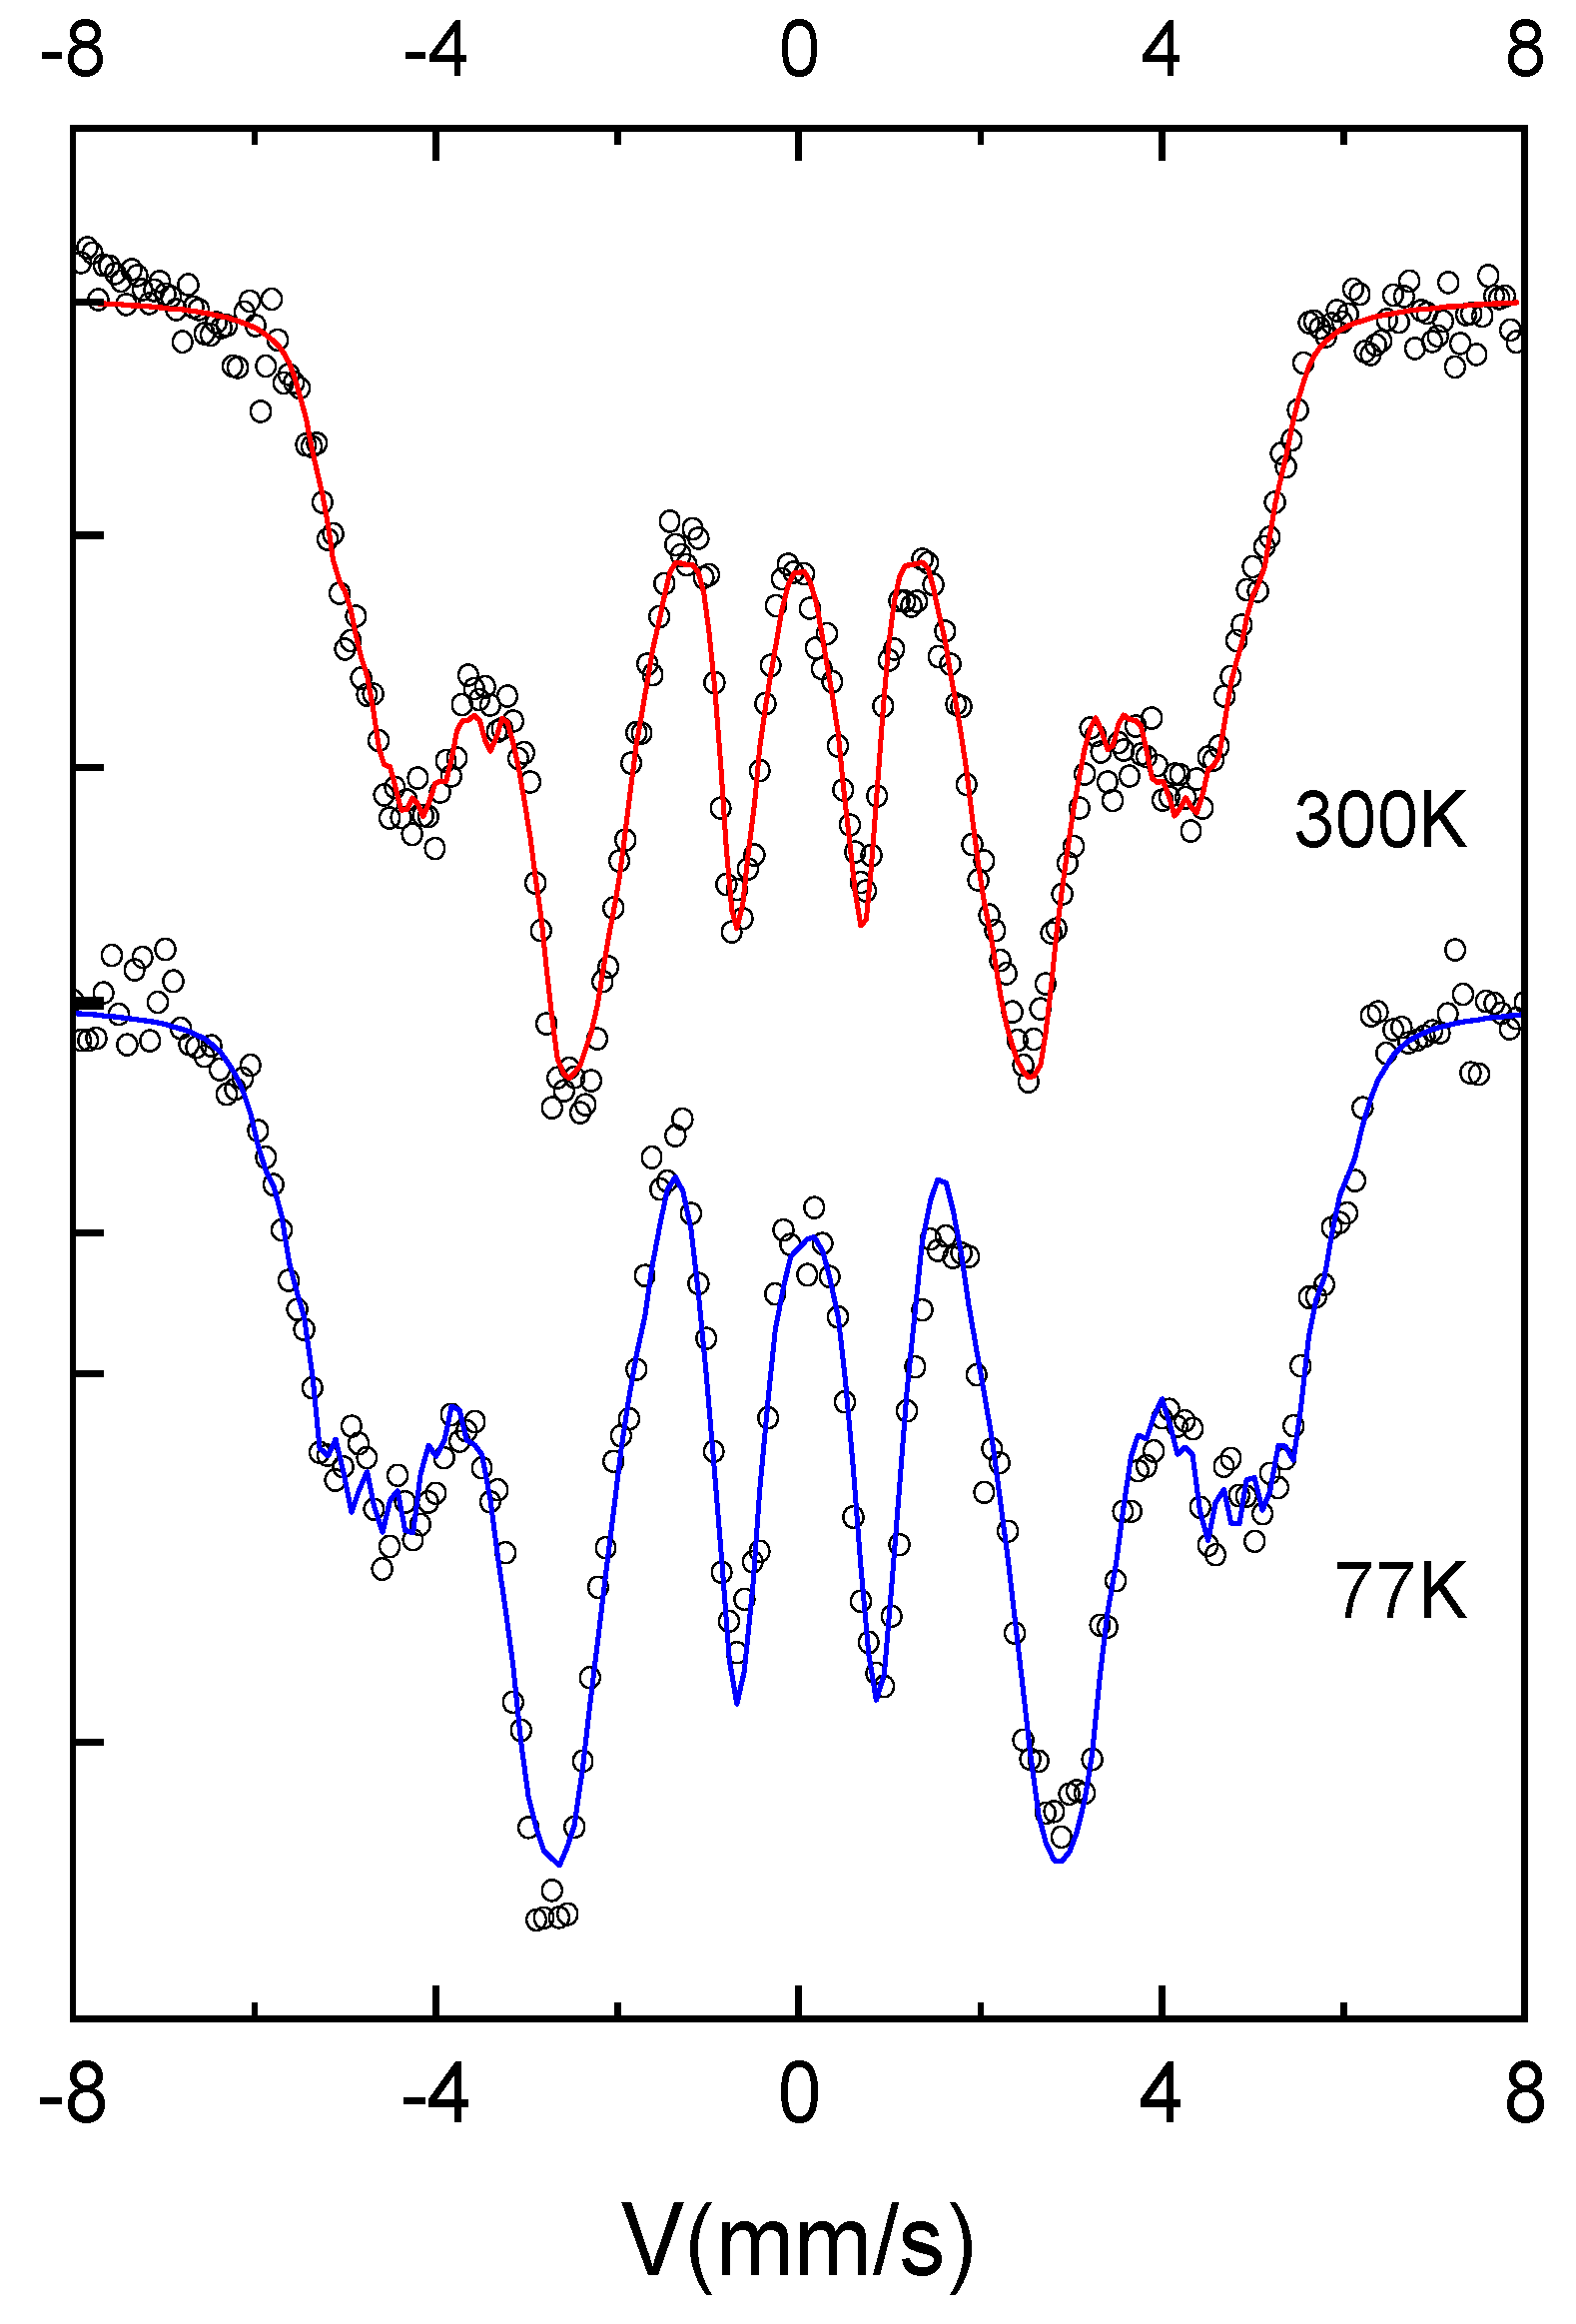
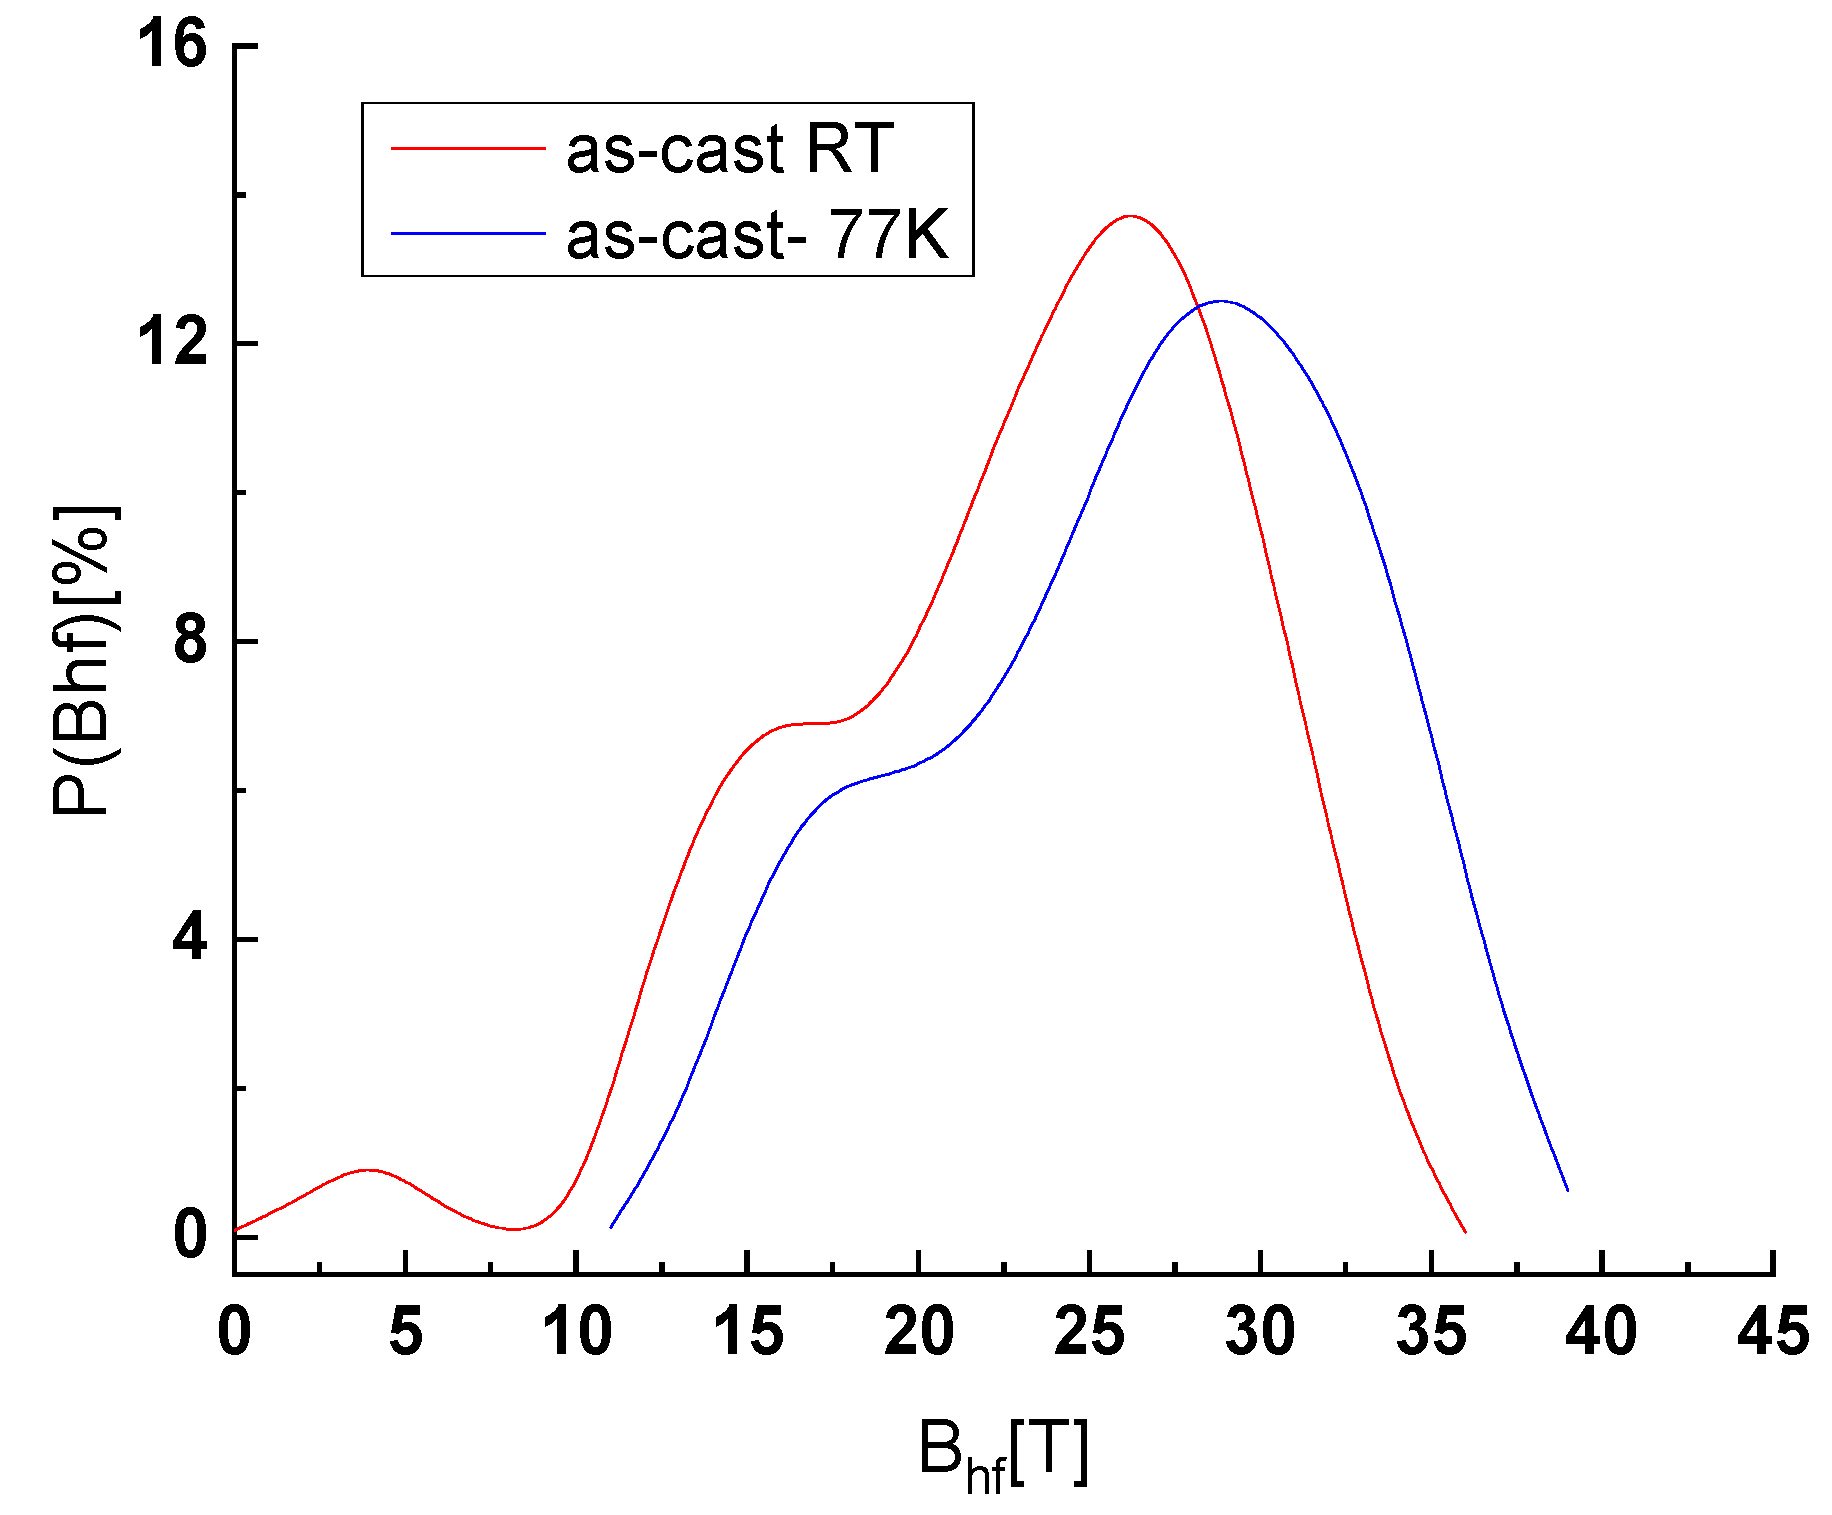
The 300 K and 77 K Mössbauer spectra of the as-cast sample (Figure 2) exhibit broad magnetic sextets, typical of distributed Fe environments encountered in Fe-rich amorphous ribbons. The shape of the spectra confirms the XRD results where a chemically disordered A1 phase has been identified. The hyperfine field (HF) distributions derived from the fitting of the Mössbauer spectra (Figure 3) show a bimodal-type large Gaussian profile distribution, which is characteristic of a disordered Fe environment, with two main environments for Fe. From the numerical fitting of the size distribution (Figure 3) with two Gaussian profiles, we have obtained for the low field mode an average HF of 16 T and 18 T for 300 K and 77 K respectively and for the high field mode average HF of 26 T and 29 T for 300 K and 77 K respectively. The relative proportion of the high-field to low-field relative contributions to the HF distributions is about 3:1. From the HF values we can presume that the low field mode corresponds to a disordered precursor that would give rise upon annealing to a boride (possibly Fe2B) phase, while the high field mode would give rise to an fcc FePt phase.
3.2. Isothermal Annealing
3.2.1. XRD Analysis
In order to obtain the full crystallization and formation of the hard magnetic phase, isothermal annealing has been performed at various temperatures, chosen at 100 °C intervals, for observing better the degree of formation of the crystalline phases as well as to monitor the evolution of the disorder–order phase transformation. The chosen temperatures of annealing were: 500 °C, 600 °C, 700 °C and 800 °C. The heating rate was established at 5 K/min and annealing time (time spent at maximum temperature) was set to 30 min. The annealing was performed under a high vacuum (10−4 mbar) in order to avoid oxidation.
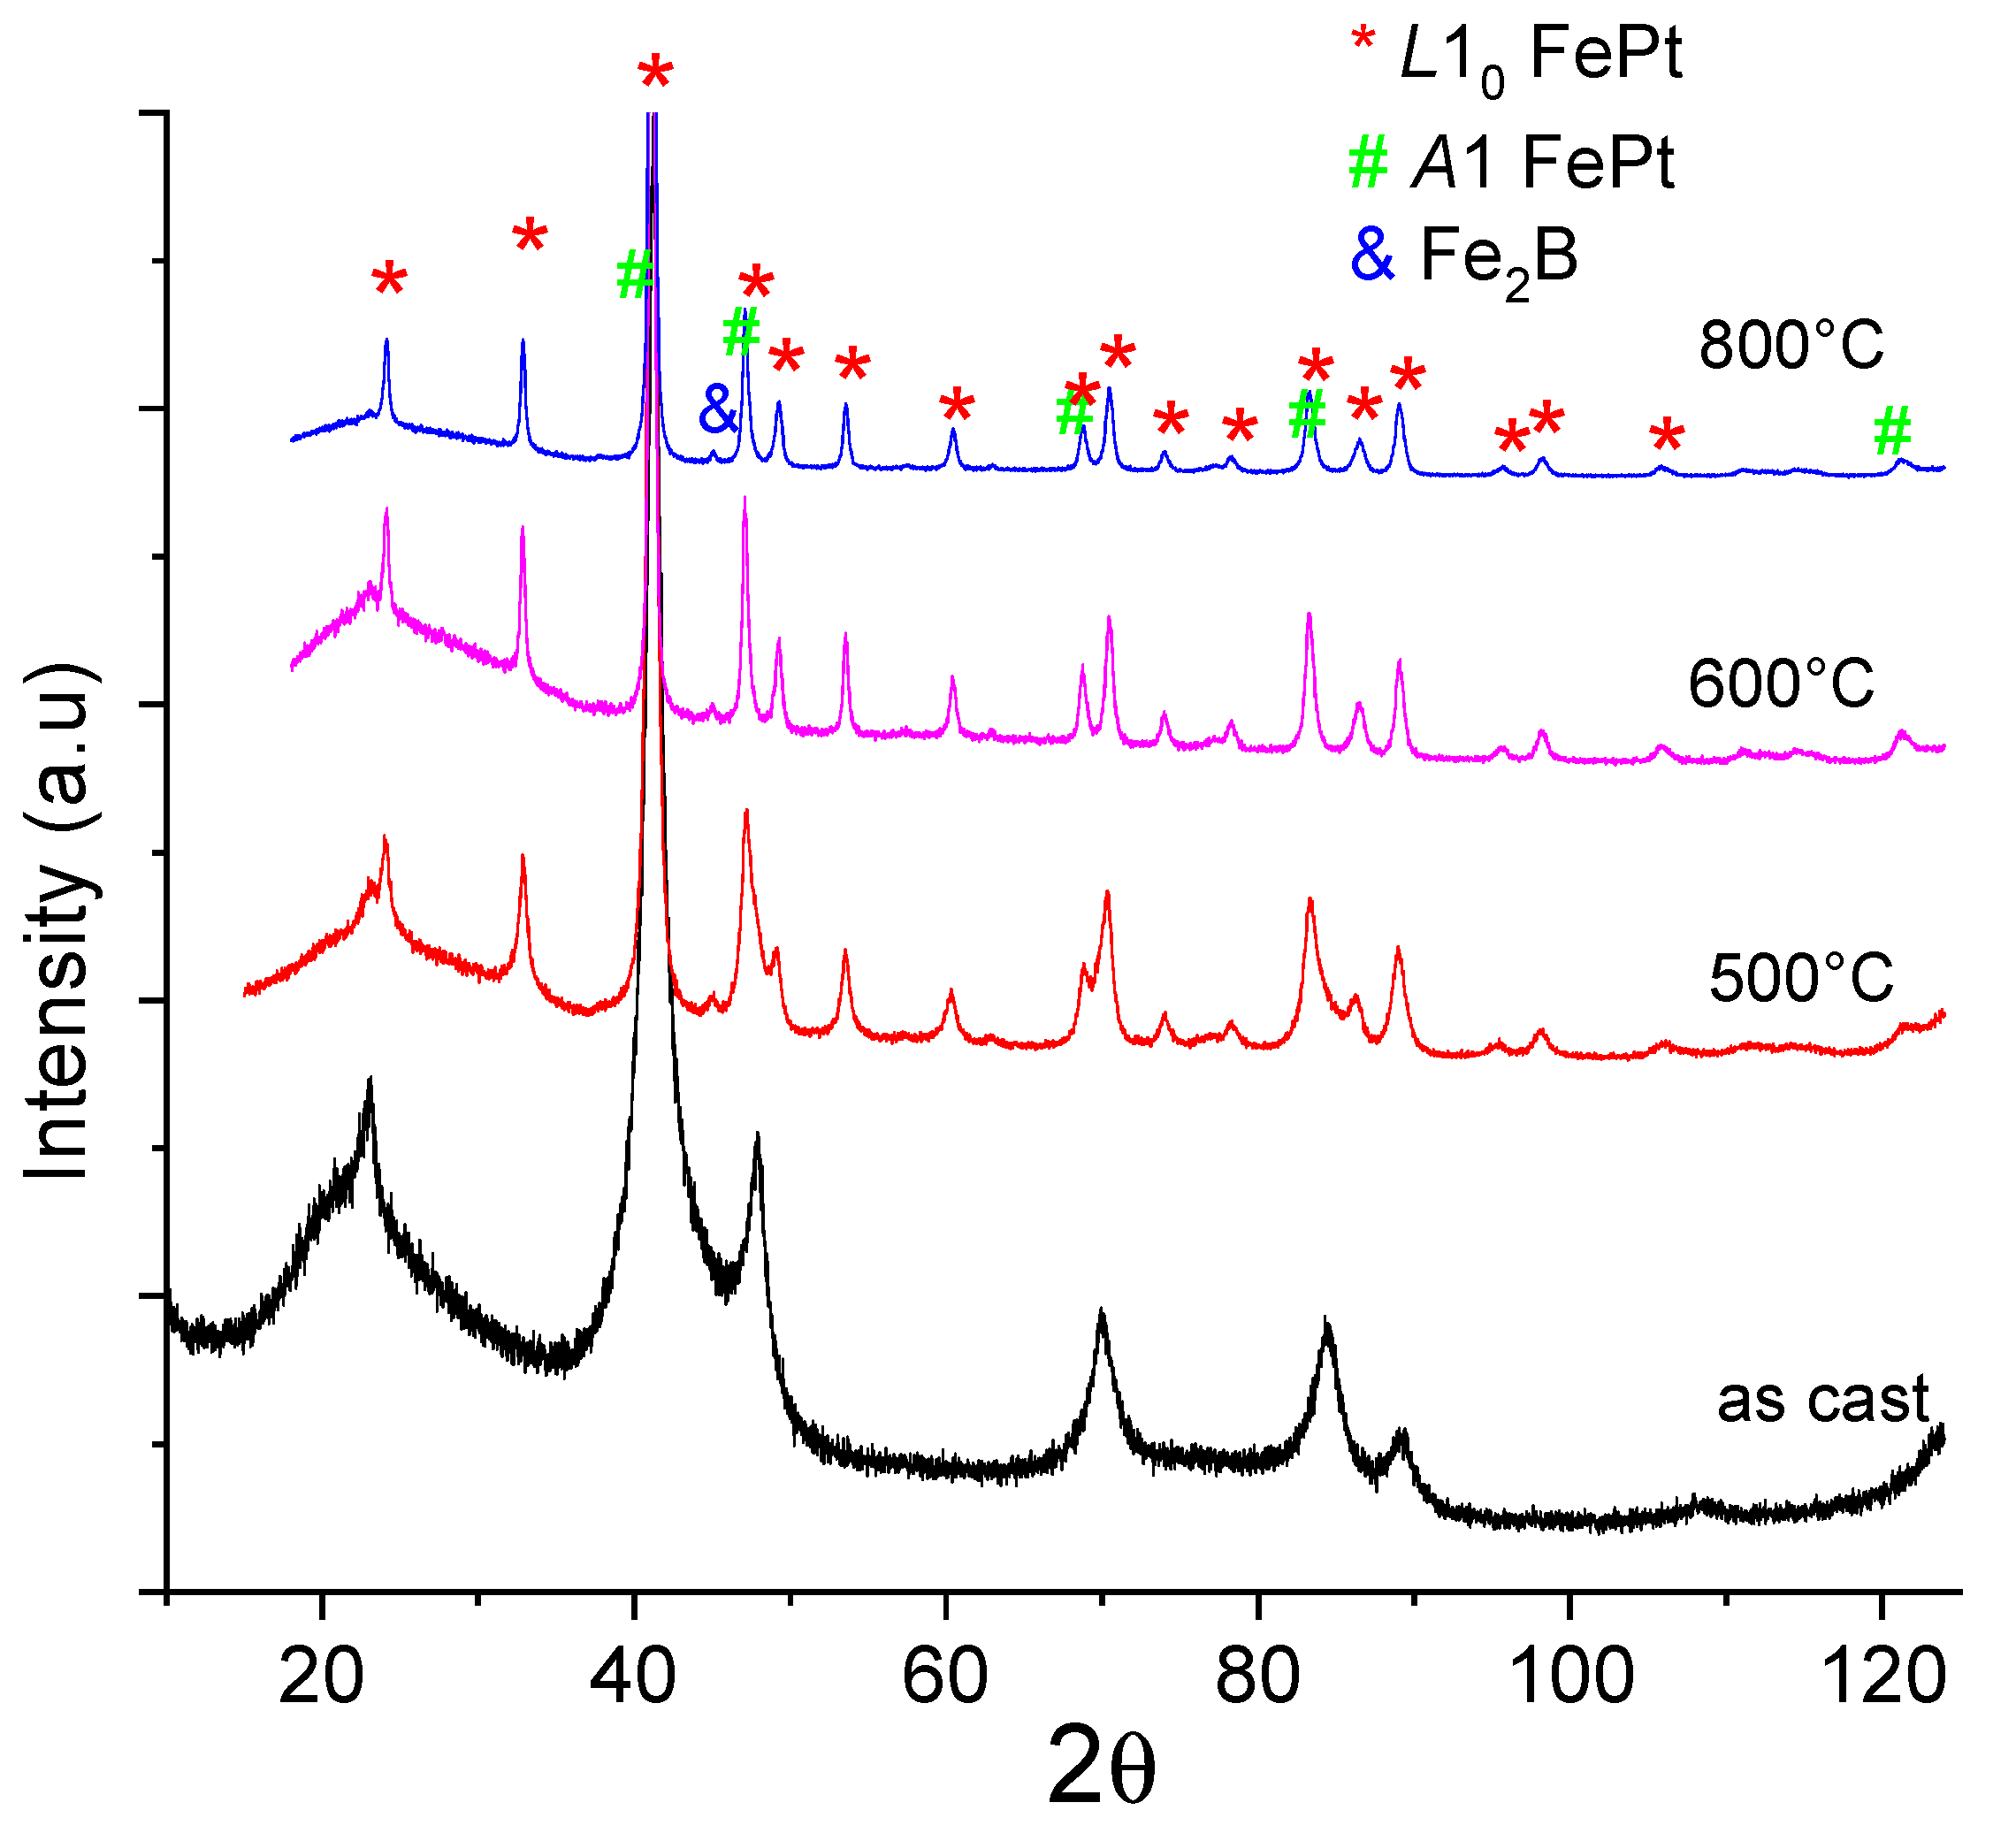
The structure of the resulting samples was characterized by XRD, Mössbauer spectrometry and their magnetic properties by vibrating sample magnetometry and SQUID. The X-ray diagrams of the annealed samples are plotted in Figure 4. For a better comparison, the as-cast X-ray diffractogram is also added. In the as-cast state, the broad Bragg peaks of the disordered A1 FePt-rich solid solution have been identified, as previously discussed. The broad line centered at around 25° is due to the sample holder and it can be seen that this broad feature is preserved at all annealing temperatures, until 800 °C, where the intensity of the main Bragg peak is very high and the broad feature appears strongly diminished due to scaling. At 500 °C, the A1 fcc pattern is better formed, with a smaller linewidth than in the as-cast state. Besides these lines, the main superlattice peaks of the tetragonal L10 phase appear already formed. At 600 °C the main superlattice peaks of the tetragonal L10 phase are more pronounced and the process of peak narrowing is furthermore continued, as expected. Starting with 600 °C a small Bragg peak, attributed to the main Bragg reflection of the Fe2B tetragonal phase, is observed.
Then at 800 °C the lines of the crystalline phases are even narrower, and the tetragonal L10 phase is the most predominant in the sample. The XRD diagram at 800 °C shows a completely crystallized pattern and besides the L10 phase, the Fe2B is also visible in the diagram.
It has to be mentioned that the two main superlattice peaks of tetragonal L10, the (0 0 1) and (1 1 0) reflections occurs for the Cu Kα radiation we used, at about 24° and 32° respectively. From the observation of the Bragg line linewidths, it can be seen that the main Bragg lines observed in the fcc FePt solid solution in the as-cast state undergo a refinement process as the annealing temperature is increased, from bottom to top. The main 5 Bragg lines of the fcc A1 FePt solid solution in the as-cast state, from lower to higher angles, are, in order, attributed to: (1 1 1), (2 0 0), (2 2 0), (3 1 1) and (2 2 2). Upon annealing, these main reflections become overlapped with the main Bragg reflections of the L10 FePt tetragonal phase. It is very interesting to observe that already, from the first annealed sample at 500 °C, the (2 0 0), (2 2 0) and (3 1 1) peaks split into two. It seems that the peaks from the fcc phase are now spectrally separated from those of the tetragonal phase.
For the other two annealing treatments, at 700 °C (Figure 5) and 800 °C, the separation continues and the peaks become more and more narrow and better separated between one and another (see for instance the fitting from Figure 5 for the sample annealed at 700 °C). The specific signatures of the tetragonal L10 phase, the superlattice peaks (0 0 1) and (1 1 0), are clearly observed for all the annealed samples at around 24° and 33° (in 2-theta), respectively.
The good separation of the spectral lines allowed us an accurate determination by numerical fitting of the peak positions and linewidths, a calculation of the lattice parameters, the tetragonality or ordering parameter c/a and of the mean grain sizes for each of the observed crystalline phases. The obtained results are schematized in Table 1.
It can be seen that the lattice parameters, as revealed from the fit of the experimental spectra, do not change drastically with the increase of the annealing temperature; however, a steady increase of the ordering parameter c/a, associated with the tetragonality or the degree of ordering of the L10 phase, is observed upon increasing the annealing temperature.
The grain size for both L10 and A1 FePt phases in the annealed samples increases continuously from the as-cast values 15 nm (17 nm respectively) as the annealing temperature increases. At 800 °C annealing, the grain size in the L10 FePt phase is about 54 nm, while for the same annealing in the A1 FePt phase the average grain size is estimated to be around 57 nm. In conclusion, in the annealed samples, using structural data, we have unambiguously proven the coexistence of the hard and soft magnetic phases with well-refined grain sizes. These observations may be made quantitative with the help of the Mössbauer spectroscopy, where the relative fraction of each of the phases present in the samples can be obtained.
3.2.2. Mössbauer Analysis
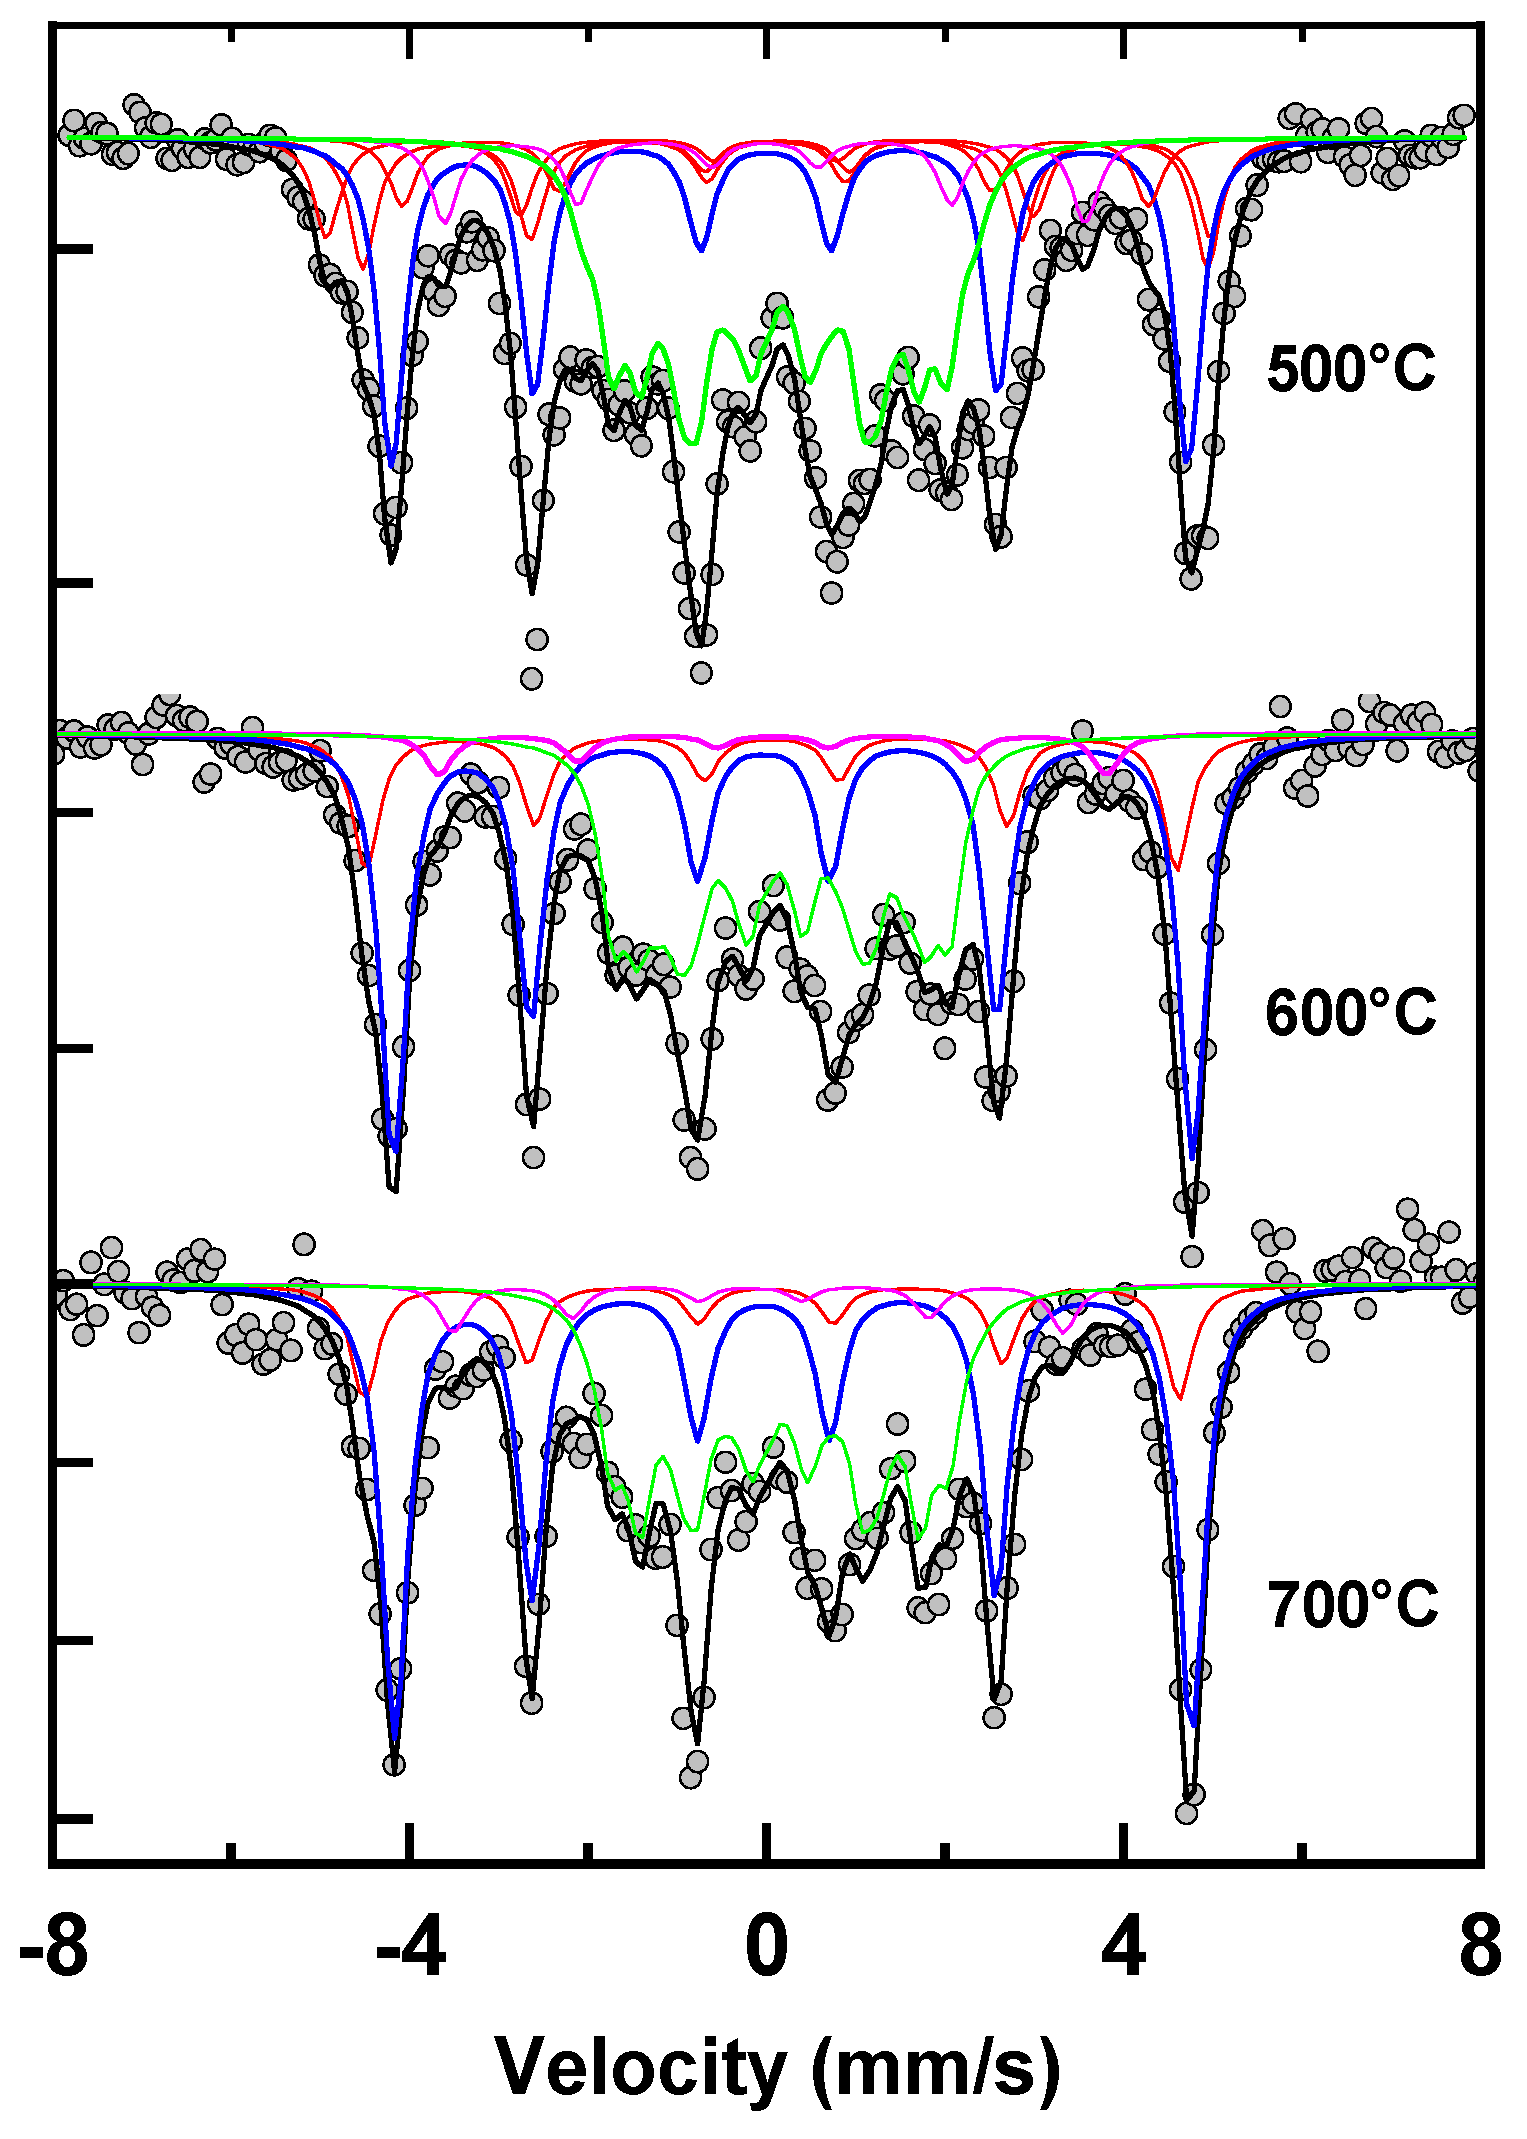
57Fe Mössbauer analysis on all the samples has been performed using a conventional setup in transmission geometry. The Mössbauer source we used was a 57Co source embedded in a Rh matrix. Measurements were carried out at an ambient temperature. The annealed Fe65Pt15Zr3B17 samples have been investigated and their Mössbauer spectra, recorded at −10 +10 mm/s velocity range, have been fitted, with a procedure involving several subspectra, magnetic sextets. All the hyperfine parameters, i.e, the hyperfine field (HF), quadrupole splitting (QS) and the isomer shift (IS), were kept as free parameters during the fitting. In Figure 6 the Mössbauer spectra of three of the annealed Fe65Pt15Zr3B17 samples are presented together with the subspectra, as identified from the fitting. All the hyperfine field parameters obtained from the fit are depicted in Table 2. The components used for the fitting are of the same color as their hyperfine parameters, for easier identification.
Mössbauer spectra of the annealed samples show different and more complex hyperfine features than the as-cast ones. Indeed, the Mössbauer patterns consist of sextets with much narrower lines, which indicate that the samples are crystallized. The fitting model chosen to adjust the spectra of annealed samples takes into account the XRD results where a microstructure consisting of multiple phases was proven. The spectra have been fitted with a number of subspectra that were indexed and assigned to the phases identified in the XRD.
The Mössbauer spectra of the sample annealed at 500 °C has been fitted with 5 subspectra, a fitting model that corresponds to the situation observed in the XRD data. The two subspectra designed by the red line in Figure 6 have been assigned to the A1 fcc FePt phase. The hyperfine parameters are depicted in Table 3. The quadrupole shift value suggests a cubic symmetry, while the hyperfine field of 30 T is typical for A1 FePt phase which is consistent with the results on the as-cast sample. The relative proportion of the fcc phase, as resulted from the fit, is 18%. The HF parameters obtained are consistent with the results reported in the literature [36] and with those obtained from the investigation on the as-cast sample. The subspectrum designed by the blue line in Figure 6 has been assigned to the L10 FePt phase. The quadrupole splitting of 0.27 mm/s suggests a tetragonal symmetry and the hyperfine field of 27.6 T corresponds to the value found for the L10 phase in the literature. For the annealing at 500 °C, this phase is the most abundant in the sample. Its relative proportion, as revealed from the fit, is 28%. This indicates that the disorder–order phase transition has started already at 500 °C and an important fraction of the initial fcc FePt solid solution is already transformed into tetragonal L10 FePt. The pink lines are the components of the boride phases. Compositionally, there is an Fe excess which does not crystallize in the FePt phases; therefore, in principle, during annealing there are conditions that Fe and B form borides, as there is a large affinity for these two elements to alloy. Fe2B has been already observed in the sample annealed at 500 °C and Fe3B is a metastable phase that may be formed in intermediate annealing temperatures. Their cumulate relative intensity amounts to 14%. The central part of the spectrum was fitted with an HF distribution between 3.5 and 18.5 T. These contributions are represented to be convoluted as one contribution (green) in Figure 6.
The average hyperfine field of these low-field contributions is 9.9 T and its relative intensity amounts to 40%. From the HF value we can assume that this low-field contribution to the Mössbauer spectrum may be attributed to the disordered Fe-Zr-B-rich phase. The quadrupole shift close to 0 sustains the argument of a cubic symmetry of this phase. The low hyperfine field of this contribution suggests that it is a Fe-poor phase. From all of the arguments we consider that the green contribution may be a disordered Fe-Zr-B phase with few Pt atoms interstitially inserted or randomly occupying the Fe sites. Most of this phase is probably located in interfacial regions between the nanocrystalline grains and the in-grain boundaries. We have to emphasize that the disordered phase, as fitted in the Mössbauer spectra, accounts for all Fe-distributed ionic chemical environments. For the sake of fitting consistency, every contribution that does not belong to the magnetic subspectra (sextets) is included in one disordered sublattice. In Mössbauer terms this is a hyperfine field distribution. Usually, a hyperfine field distribution is used to fit the Mössbauer spectra of Fe-disordered components or Fe-amorphous alloys. Therefore, the disordered part, illustrated by the green component, represents in fact the contribution of all of the chemically distributed Fe sites, each of them with different probabilities, as shown, for instance, in Figure 3. We have named it disordered Fe-Zr-B, to account in fact for all of the disordered Fe chemical environments. This is in agreement with other interpretations of Mössbauer spectra in Fe-Zr-B alloys [37].The Mössbauer spectra of the sample annealed at 600 °C and 700 °C have the same complex pattern as the previous one, but with better resolved lines. The spectra were fitted using the same fitting model. The parameters were consistent throughout the series of measurements. From Table 3 one can observe the phase evolution with the annealing conditions, as well as the relative abundance of the A1 and L10 FePt phases. The tetragonal phase increases slightly up to 44%, while Fe3B decomposes. It can be seen that Fe2B relative abundance does not increase, therefore we may assume that from the decomposition of Fe3B, the obtained Fe helps the formation of L10 FePt and B is incorporated into the Fe-Zr-B-rich residual phase. With an increasing annealing temperature, all the phases that decompose help the formation of the L10 phase, which is the most ordered one, in the ribbon microstructure.
3.2.3. Magnetic Properties
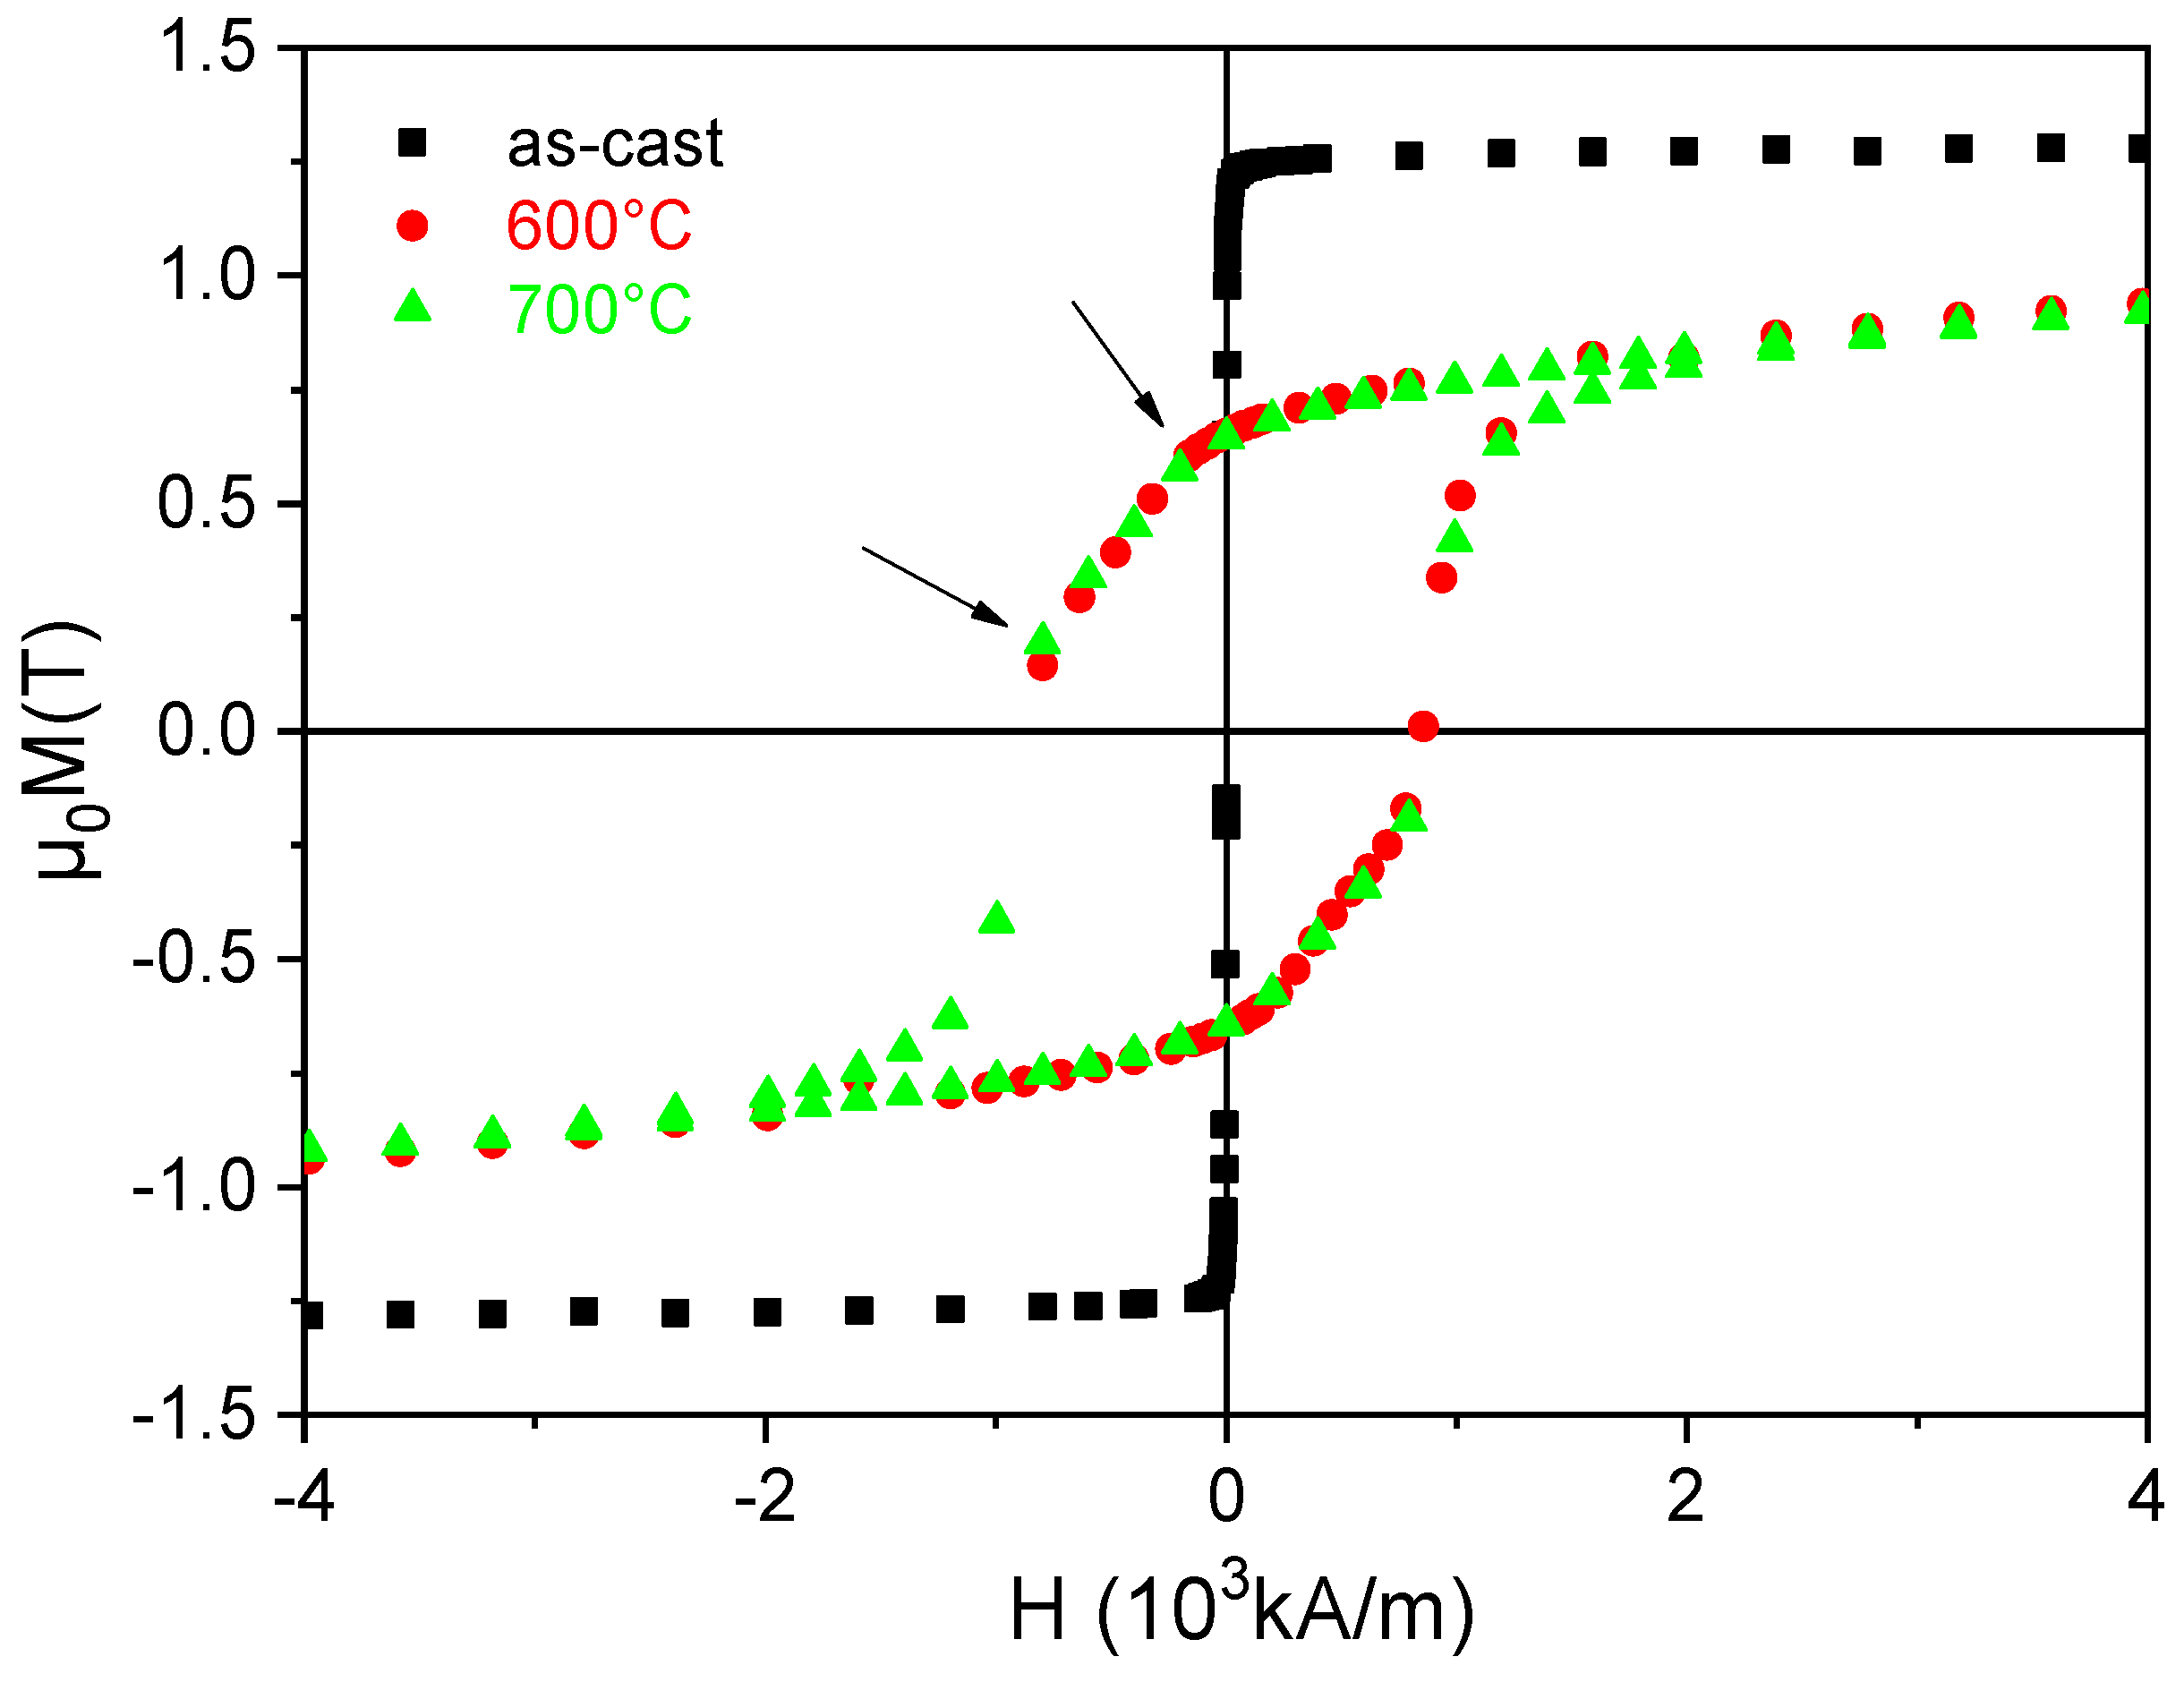
The hysteresis loops for the Fe65Pt15Zr3B17 samples, as-cast and annealed at 600 °C and 700 °C, have been recorded at 300 K with a magnetic field applied parallel to the ribbon plane, and are plotted in Figure 7. The hysteresis loop for the as-cast ribbons is typical for soft ferromagnets. The magnetization saturates almost immediately after applying a small magnetic field. The saturation reaches 1.3 T, while the loop shows a very low hysteresis (around 30 mT). The annealed samples show, however, a completely different behavior. The magnetization has a slower approach to saturation than in the as-cast state. This may be explained by the presence of a significant fraction of hard L10 grains. The value of the maximum magnetization is about 15% lower than that of the as-cast sample, reaching about 0.9 T. Upon decreasing the field, a very large value of remanent magnetization is noticed, as is the case for hard magnetic materials. The sample annealed at 600 °C shows a large openness of the loop.
The remanent magnetization is in this case 0.63 T, thus giving a remanence-to-saturation ratio of about 0.7. The shape of the hysteresis loop presents two vaguely observed inflection points (at around −190 and −840 kA/m applied field), typical for systems with both hard and soft magnetic phases in co-existence; however, here the hard magnetic phase is predominant and the exchange coupling between the hard and the soft magnetic phases is not complete. As a consequence, a quite strong coercive field is observed. The coercivity reaches in this case 847 kA/m, which is more than 3 times increased, compared with the annealing at 500 °C. The switching field of the soft magnetic phase is smaller than the coercive field, which indicates a better exchange coupling between the grains. The value of the switching field is 155 kA/m for the soft magnetic grains, increasing substantially compared with the annealing at 500 °C. The sample annealed at 700 °C presents an almost similar hysteresis loop as the sample annealed at 600 °C. While the coercivity is slightly higher than before (877 kA/m), the remanent and the maximum magnetization are almost identical to the previous annealing, with a remanent-to-saturation ratio of about 0.7. The energy product for all the samples was calculated using the B-H loops. The highest (BH)max values of 64 kJ/m3 are obtained for the sample annealed at 700 °C. All the magnetic parameters obtained for these samples at 300 K in the parallel field are depicted in Table 4.
4. Conclusions
We have synthesized a nanocomposite magnet based on the FePt-Zr-B alloy, by using the non-equilibrium melt spinning method. The stoichiometry was chosen in such a way as to obtain a chemically disordered as-cast state. From this state, by appropriate annealing, we have been able to obtain a mixture of hard L10-FePt and soft A1 FePt and boride magnetic phases. The dynamics of formation of the hard magnetic L10 phase during the gradual disorder–order phase transformation has been monitored by using a complex combination of X-ray diffraction methods and 57Fe Mössbauer spectroscopy methods over a large range of annealing temperatures. Multiple phases co-existing in the annealed sample microstructures, observed in XRD, have been reconfirmed by the Mössbauer spectra analysis and moreover, accurate quantitative data have been acquired in what concerns the relative abundance of each of the observed crystalline phases in every stage of annealing. It has been shown that the formation of the hard magnetic phase, emerging from the chemically disordered as-cast precursor, is gradual and occurs via complex mechanisms involving the presence of a disordered Fe-Zr-B-rich intergranular region, as well as the decomposition of iron borides, providing excess Fe, which contributes furthermore to the increase of the hard magnetic phase abundance, for higher annealing temperatures. Magnetic measurements have confirmed the good performances of these alloys in terms of coercivity and remanence, a maximum energy product of 64 kJ/m3 being obtained for annealing at 700 °C. These findings open good perspectives for a future class of permanent magnets made from these alloys.
Author Contributions
Conceptualization, O.C.; methodology, I.D.; writing—original draft preparation, A.D.C.; writing—review and editing, O.C. All authors have read and agreed to the published version of the manuscript.
Funding
This research was funded through POC Project: “Materiale multifuncționale inteligente pentru aplicații de înaltă tehnologie (MATI2IT)” (code MySMIS 105726) funded by the Romanian Ministry of European Funds.
Institutional Review Board Statement
Not applicable.
Informed Consent Statement
Not applicable.
Data Availability Statement
The data are not publicly available due to IPR protection measures.
Conflicts of Interest
The authors declare no conflict of interest. The funders had no role in the design of the study; in the collection, analyses, or interpretation of data; in the writing of the manuscript, or in the decision to publish the results.
References
- Lyubina, J.; Khlopkov, K.; Gutfleisch, O.; Müller, K.-H.; Schultz, L. Intergrain interactions in nanocomposite Fe–Pt powders. J. Appl. Phys. 2006, 99, 08E903. [Google Scholar] [CrossRef]
- Crisan, A.D.; Crisan, O. Direct formation of L10 FePt in as-cast FePt-based magnetic nanocomposite ribbons without post-synthesis annealing. J. Phys. D Appl. Phys. 2011, 44, 365002. [Google Scholar] [CrossRef]
- Von Haeften, K.; Binns, C.; Brewer, A.; Crisan, O.; Howes, P.B.; Lowe, M.P.; Sibbley-Allen, C.; Thornton, S.C. A novel approach towards the production of luminescent silicon nanoparticles: Sputtering, gas aggregation and co-deposition with H2O. Eur. Phys. J. D 2009, 52, 11–14. [Google Scholar] [CrossRef]
- Chrobak, A.; Ziółkowski, G.; Randrianantoandro, N.; Klimontko, J.; Chrobak, D.; Prusik, K.; Rak, J. Ultra-high coercivity of (Fe86−xNbxB14)0.88Tb0.12 bulk nanocrystalline magnets. Acta Mater. 2015, 98, 318. [Google Scholar] [CrossRef]
- Pietrusiewicz, P.; Nabialek, M.; Jez, B. Evolution of the structural and magnetic properties of bulk Fe61Co10B20W1Y8−XPtx alloys through the partial substitution of Pt for Y. Materials 2020, 13, 4962. [Google Scholar] [CrossRef]
- Ma, D.G.; Wang, Y.M.; Li, Y.H.; Umetsu, R.Y.; Ou, S.L.; Yubuta, K.; Zhang, W. Structure and properties of nanoporous FePt fabricated by dealloying a melt-spun Fe60Pt20B20 alloy and subsequent annealing. J. Mater. Sci. Technol. 2020, 36, 128–133. [Google Scholar] [CrossRef]
- Grabias, A.; Kopcewicz, M.; Latuch, J.; Oleszak, D.; Pekala, M.; Kowalczyk, M. Influence of cobalt content on the structure and hard magnetic properties of nanocomposite (Fe,Co)-Pt-B. alloys. J. Magn. Magn. Mater. 2017, 434, 126–134. [Google Scholar] [CrossRef]
- Tsai, J.L.; Huang, J.; Chen, L.H.; Lin, C.S. Magnetic properties and microstructure of exchange coupled FePt-FeB films. Surf. Coat. Technol. 2013, 231, 456–459. [Google Scholar] [CrossRef]
- Choi, G.M.; Min, B.C.; Shin, K.H. L10 ordering of FePtB layers by oxidation-induced stress of capping layer. Appl. Phys. A 2013, 111, 389–394. [Google Scholar] [CrossRef]
- Grabias, A.; Kopcewicz, M.; Oleszak, D.; Latuch, J.; Kowalczyk, M.; Pekala, M. Structural transformations and magnetic properties of Fe60Pt15B25 and Fe60Pt25B15 nanocomposite alloys. J. Magn. Magn. Mater. 2010, 322, 3137–3141. [Google Scholar] [CrossRef]
- Tsai, J.L.; Huang, J.C.; Tai, H.W.; Tsai, W.C.; Lin, Y.C. Magnetic properties and microstructure of FePtB, FePt(B-Ag) granular films. J. Magn. Magn. Mater. 2013, 329, 6–13. [Google Scholar] [CrossRef]
- Kaushik, N.; Sharma, P.; Nagar, S.; Rao, K.V.; Kimura, H.; Makino, A.; Inoue, A. Exchange-coupled FePtB nano-composite hard magnets produced by pulsed laser deposition. Mater. Sci. Eng. B 2010, 171, 62–68. [Google Scholar] [CrossRef]
- Sharma, P.; Waki, J.; Kaushik, N.; Louzguine-Luzgin, D.V.; Kimura, H.; Inoue, A. High coercivity characteristics of FePtB exchange-coupled nanocomposite thick film spring magnets produced by sputtering. Acta Mater. 2007, 55, 4203–4212. [Google Scholar] [CrossRef]
- Chang, C.W.; Chang, H.W.; Chiu, C.H.; Chen, C.H.; Chang, W.C.; Ouyang, H.; Chang, C.W.; Liu, C.C. The effect of annealing time on the magnetic properties and microstructure of (Fe0.675Pt0.325)84B16 ribbons. J. Magn. Magn. Mater. 2006, 310, 2593–2595. [Google Scholar] [CrossRef]
- Chang, C.W.; Chang, H.W.; Chiu, C.H.; Chang, W.C. Effect of boron on the magnetic properties and exchange-coupling effect of FePtB-type nanocomposite ribbons. J. Appl. Phys. 2005, 97, 10N117. [Google Scholar] [CrossRef]
- Li, N.; Lairson, B.M. Magnetic recording on FePt and FePtB intermetallic compound media. IEEE Trans. Magn. 1999, 35, 1077–1082. [Google Scholar]
- Crisan, A.D.; Nicula, R.; Crisan, O.; Burkel, E. Thermally and pressure activated phase evolution in Fe–Pt–Nb–B melt spun ribbons. Mater. Sci. Eng. C 2007, 27, 1280–1282. [Google Scholar] [CrossRef]
- Crisan, O.; Crisan, A.; Randrianantoandro, D.N.; Nicula, R.; Burkel, E. Crystallization processes and phase evolution in amorphous Fe–Pt–Nb–B alloys. J. Alloys Compd. 2007, 440, L3–L7. [Google Scholar] [CrossRef]
- Crisan, A.D.; Crisan, O.; Randrianantoandro, N.; Valeanu, M.; Morariu, M.; Burkel, E. Crystallization processes in Fe–Pt–Nb–B melt spun ribbons. Mater. Sci. Eng. C 2007, 27, 1283–1285. [Google Scholar] [CrossRef]
- Bruck, E.; Xiao, Q.F.; Thang, P.D.; Toonen, M.J.; de Boer, F.R.; Buschow, K.H.J. Influence of phase transformation on the permanent-magnetic properties of Fe–Pt based alloys. Physica B 2001, 300, 215–229. [Google Scholar] [CrossRef]
- Makino, A.; Bitoh, T. High coercivity of melt-spun (Fe0.55Pt0.45)78Zr2–4B18–20 nanocrystalline alloys with L10 structure. J. Appl. Phys. 2004, 95, 7498–7500. [Google Scholar] [CrossRef]
- Makino, A.; Bitoh, T.; Inoue, A.; Hirotu, Y. Magnetic properties and structure of Fe–Pt–M–B (M = Zr, Nb and Ti) alloys produced by quenching technique. J. Alloys Compd. 2007, 434, 614–617. [Google Scholar] [CrossRef]
- Randrianantoandro, N.; Crisan, A.D.; Crisan, O.; Marcin, J.; Kovac, J.; Hanko, J.; Greneche, J.M.; Svec, P.; Chrobak, A.; Skorvanek, I. The influence of microstructure on magnetic properties of nanocrystalline Fe–Pt–Nb–B permanent magnet ribbons. J. Appl. Phys. 2010, 108, 093910. [Google Scholar] [CrossRef]
- Wang, S.; Kang, S.S.; Nikles, D.E.; Harrell, J.W.; Wu, X.W. Magnetic properties of self-organized L10 FePtAg nanoparticle arrays. J. Magn. Magn. Mater. 2003, 266, 49–56. [Google Scholar] [CrossRef]
- Seqqat, M.; Nogues, M.; Crisan, O.; Kuncser, V.; Cristea, L.; Jianu, A.; Filoti, G.; Dormann, J.L.; Sayah, D.; Godinho, M. Magnetic properties of Fe100−xSmx thin films and Fe80−xSmxB20 thin films and ribbons. J. Magn. Magn. Mater. 1996, 157, 225. [Google Scholar] [CrossRef]
- Crisan, O.; Angelakeris, M.; Flevaris, N.K.; Filoti, G. Magnetism and Anisotropy in Core-Shell Nanoparticles. J. Optoelectron. Adv. Mater. 2003, 5, 959. [Google Scholar]
- Crisan, O.; Labaye, Y.; Berger, L.; Greneche, J.M.; Coey, M.D. Exchange coupling effects in nanocrystalline alloys studied by Monte Carlo simulation. J. Appl. Phys. 2002, 91, 8727. [Google Scholar] [CrossRef]
- Gonzalez, J.A.; Andres, J.P.; De Toro, J.A.; Muniz, P.; Munoz, T.; Crisan, O.; Binns, C.; Riveiro, J.M. Co–CoO nanoparticles prepared by reactive gas-phase aggregation. J. Nanopart. Res. 2009, 11, 2105–2111. [Google Scholar] [CrossRef]
- Reddy, V.R.; Crisan, O.; Gupta, A.; Kuncser, V. Tuning exchange spring effects in FePt/Fe(Co) magnetic bilayers. Thin Solid Film. 2012, 520, 2184. [Google Scholar] [CrossRef]
- Crisan, A.D. Compositional studies and thermal analysis in amorphous and nanocrystalline FePtNbB melt spun ribbons. J. Optoelectron. Adv. Mater. 2010, 12, 250–256. [Google Scholar]
- Rosenberg, M.; Kuncser, V.; Crisan, O.; Hernando, A.; Navarro, E.; Filoti, G. A Mössbauer spectroscopy and magnetic study of FeRh. J. Magn. Magn. Mater. 1998, 177, 135–136. [Google Scholar] [CrossRef]
- Iwata, S.; Yamashita, S.; Tsunashima, S. Perpendicular magnetic anisotropy and magneto-optical Kerr spectra of MBE-grown PtCo alloy films. IEEE Trans. Magn. 1997, 33, 3670. [Google Scholar] [CrossRef]
- Chang, C.W.; Chang, H.W.; Chiu, C.H.; Hsieh, C.C.; Fang, Y.K.; Chang, W.C. Magnetic property improvement of Pt-lean FePt/Fe–B-type nanocomposites by Co substitution. J. Appl. Phys. 2008, 103, 07E133. [Google Scholar] [CrossRef]
- Makino, A.; Bitoh, T.; Nakagawa, M. Direct synthesis of L10-(Fe,Co)Pt nanocrystallites from (Fe,Co)–Pt–Zr–B liquid phase by melt-spinning. J. Non-Cryst. Sol. 2007, 353, 3655–3660. [Google Scholar] [CrossRef]
- Inoue, A.; Zhang, W. Nanocrystalline Fe-Pt-B base hard magnets with high coercive force obtained from amorphous precursor. J. Appl. Phys. 2005, 97, 10H308. [Google Scholar] [CrossRef]
- Goto, T.; Utsugi, H.; Watanabe, K. Mössbauer study of permanent magnets Fe-Pt. Hyperfine Interact. 1990, 54, 539. [Google Scholar] [CrossRef]
- BBrzozka, K.; Slawska-Waniewska, A.; Jezuita, K. Mössbauer studies of FeZrB(Cu) amorphous alloys. J. Magn. Magn. Mater. 1996, 160, 255–256. [Google Scholar] [CrossRef]
Figure 1.
X-ray diffractogram of as-cast Fe65Pt15Zr3B17 sample fitted with the MAUD software. The indexed lines belong to fcc A1 FePt. Bottom graph is the difference between fitted and experimental data.
Figure 1.
X-ray diffractogram of as-cast Fe65Pt15Zr3B17 sample fitted with the MAUD software. The indexed lines belong to fcc A1 FePt. Bottom graph is the difference between fitted and experimental data.

Figure 2.
300K and 77K Mössbauer spectra of as-cast Fe65Pt15Zr3B17 sample.

Figure 3.
300K and 77K Mössbauer HF distribution of as-cast Fe65Pt15Zr3B17 sample.

Figure 4.
X-ray diffractograms of the Fe65Pt15Zr3B17 sample, in its as-cast state as well as annealed at various temperatures (500 °C, 600 °C and 800 °C).
Figure 4.
X-ray diffractograms of the Fe65Pt15Zr3B17 sample, in its as-cast state as well as annealed at various temperatures (500 °C, 600 °C and 800 °C).

Figure 5.
MAUD fitting of the XRD diagram of the sample annealed at 700 °C for 30 min.

Figure 6.
Mössbauer spectra of the Fe65Pt15Zr3B17 samples, annealed at 500 °C, 600 °C and 700 °C together with the fitted subspectra.
Figure 6.
Mössbauer spectra of the Fe65Pt15Zr3B17 samples, annealed at 500 °C, 600 °C and 700 °C together with the fitted subspectra.

Figure 7.
RT hysteresis loops for the as-cast and annealed samples.


Table 1.
Lattice parameters, ordering parameter and grain sizes for the as-cast and annealed Fe65Pt15Zr3B17 samples.
Table 1.
Lattice parameters, ordering parameter and grain sizes for the as-cast and annealed Fe65Pt15Zr3B17 samples.
| Sample | Anneal. | L10 FePt | A1 FePt | Grain Size L10 FePt (nm) | Grain Size A FePt (nm) | ||
|---|---|---|---|---|---|---|---|
| a (Å) | c (Å) | c/a | a (Å) | ||||
| Fe65Pt15Zr3B17 | As-cast | - | - | - | 3.8411 ± 0.02416 | - | 3.8 ± 1.4 |
| 500 °C | 3.8542 ± 0.0043 | 3.7127 ± 0.0067 | 0.9632 | 3.8315 ± 0.0308 | 15 ± 2 | 17 ± 3 | |
| 600 °C | 3.8537 ± 0.0027 | 3.7134 ± 0.0042 | 0.9636 | 3.8268 ± 0.0284 | 30 ± 3 | 36 ± 4 | |
| 700 °C | 3.8524 ± 0.0049 | 3.7147 ± 0.0071 | 0.9642 | 3.8379 ± 0.0247 | 46 ± 5 | 49 ± 5 | |
| 800 °C | 3.8516 ± 0.0052 | 3.7166 ± 0.0051 | 0.9649 | 3.8292 ± 0.0303 | 57 ± 3 | 54 ± 3 | |
Table 2.
The obtained R-factors, as resulted from the full-profile refinement XRD patterns of annealed samples. Profile Rp, weighted profile Rwp and goodness-of-fit χ2 are shown.
Table 2.
The obtained R-factors, as resulted from the full-profile refinement XRD patterns of annealed samples. Profile Rp, weighted profile Rwp and goodness-of-fit χ2 are shown.
| Annealing T | Profile R-Factor Rp | Weighted Profile Rwp | Goodness-of-Fit χ2 |
|---|---|---|---|
| 500 °C | 4.89 | 2.11 | 1.37 |
| 600 °C | 4.31 | 2.24 | 1.23 |
| 700 °C | 3.78 | 2.19 | 1.31 |
| 800 °C | 3.54 | 2.05 | 1.29 |
Table 3.
Hyperfine parameters as resulted from fitting of the Mössbauer spectra (Figure 6).
Table 3.
Hyperfine parameters as resulted from fitting of the Mössbauer spectra (Figure 6).
| Samples | IS (mm/s) | Γ/2 (mm/s) | QS (mm/s) | Bhf (T) | % | Phase |
|---|---|---|---|---|---|---|
| 500 °C | 0.21 | 0.18 | −0.1 | 30.5 | 8 | A1(FePt) |
| 0.30 | 0.18 | 0.1 | 29.2 | 10 | A1(FePt) | |
| 0.27 | 0.18 | 0.27 | 27.6 | 28 | L10(FePt) | |
| 0.23 | 0.18 | 0.1 | 25.8 | 7 | Fe3B | |
| 0.12 | 0.18 | 0 | 22.1 | 7 | Fe2B | |
| 0.26 | 0.18 | 0.03 | 9.9 | 40 | Disordered Fe-Zr-B | |
| 600 °C | 0.20 | 0.18 | 0 | 28 | 13 | A1(FePt) |
| 0.28 | 0.18 | 0.33 | 27.6 | 43 | L10(FePt) | |
| 0.12 | 0.18 | 0 | 22.8 | 5 | Fe2B | |
| 0.28 | 0.18 | 0.06 | 9.5 | 39 | Disordered Fe-Zr-B | |
| 700 °C | 0.17 | 0.18 | 0.06 | 28.1 | 12 | A1(FePt) |
| 0.28 | 0.18 | 0.33 | 27.5 | 44 | L10(FePt) | |
| 0.11 | 0.18 | 0 | 22 | 6 | Fe2B | |
| 0.29 | 0.18 | 0.1 | 9.5 | 38 | Disordered Fe-Zr-B |
The estimated errors are: ±0.02 mm/s for IS and QS/2ε, ±0.1 T for Bhf and ±1 for the relative proportion.
Table 4.
Magnetic parameters obtained for annealed samples at 300 K in parallel applied field.
| Annealing Conditions | Hc (kA/m) | μ0MS (T) | μ0Mr (T) | Mr/Ms | (BH)max (kJ/m3) |
|---|---|---|---|---|---|
| As-cast | 2.94 | 1.26 | 1.2 | 0.95 | - |
| 500 °C | 194 | 1.1 | 0.85 | 0.77 | 61 |
| 600 °C | 847 | 0.9 | 0.63 | 0.70 | 64 |
| 700 °C | 877 | 0.9 | 0.63 | 0.70 | 64 |
Publisher’s Note: MDPI stays neutral with regard to jurisdictional claims in published maps and institutional affiliations. |
© 2021 by the authors. Licensee MDPI, Basel, Switzerland. This article is an open access article distributed under the terms and conditions of the Creative Commons Attribution (CC BY) license (https://creativecommons.org/licenses/by/4.0/).
Share and Cite
MDPI and ACS Style
Crisan, A.D.; Dan, I.; Crisan, O. Role of Disordered Precursor in L10 Phase Formation in FePt-Based Nanocomposite Magnet. Magnetochemistry 2021, 7, 149. https://doi.org/10.3390/magnetochemistry7110149
AMA Style
Crisan AD, Dan I, Crisan O. Role of Disordered Precursor in L10 Phase Formation in FePt-Based Nanocomposite Magnet. Magnetochemistry. 2021; 7(11):149. https://doi.org/10.3390/magnetochemistry7110149
Chicago/Turabian StyleCrisan, Alina Daniela, Ioan Dan, and Ovidiu Crisan. 2021. "Role of Disordered Precursor in L10 Phase Formation in FePt-Based Nanocomposite Magnet" Magnetochemistry 7, no. 11: 149. https://doi.org/10.3390/magnetochemistry7110149
Note that from the first issue of 2016, this journal uses article numbers instead of page numbers. See further details here.