

The Generation Mechanism of Degree Distribution with Power Exponent >2 and the Growth of Edges in Temporal Social Networks

1
School of Electronics and Information Engineering, Taizhou University, No. 1139 Shifu Avenue, Taizhou 318000, China
2
Lingnan (University) College, Sun Yat-sen University, Guangzhou 510275, China
*
Authors to whom correspondence should be addressed.
†
These authors contributed equally to this work.
Mathematics 2023, 11(13), 2882; https://doi.org/10.3390/math11132882
Submission received: 31 May 2023
/
Revised: 24 June 2023
/
Accepted: 26 June 2023
/
Published: 27 June 2023
(This article belongs to the Special Issue Feature Papers in Complex Networks and Their Applications)
Abstract
:The structures of social networks with power laws have been widely investigated. People have a great interest in the scale-invariant generating mechanism. We address this problem by introducing a simple model, i.e., a heuristic probabilistic explanation for the occurrence of a power law. In particular, the proposed model can be used to explain the generative mechanism that leads to the scale-invariant of the degree distribution with a power exponent of . Furthermore, a stochastic model (the pure birth points process) is used to describe the cumulative growth trend of edges of a temporal social network. We applied our model to online temporal social networks and found that both the degree distribution scaling behaviors and the growth law of edges can be quantitatively reproduced. We gained further insight into the evolution nature of scale-invariant temporal social networks from the empirical observation that the power exponent gradually decreases and approaches 2 or less than 2 over evolutionary time.
1. Introduction
Most previous works on social networks are based on static indicators, such as closeness centrality, the clustering coefficient, and the degree distribution. However, in the real world, many of these are time-varying and dynamic, that is, the nodes and edges vary over time. With the rapid development of online social networks, such as Twitter and Weibo, the study of temporal networks has attracted increasing attention, since real-world social networks are temporal and the nodes and edges vary over time, which causes the network structure, such as the degree distribution, clustering, closeness centrality, and so forth, to change. Research on temporal network structure evolution and modeling engages in revealing the function regulation of real-world complex systems, aiming at predicting the future development of the system and setting up improvement measures in advance. Network evolutional modeling and studies on the degree distribution generating mechanism are the most important research domains for complex networks, since one of the most basic properties of a graph or network is its degree sequence.
If the degree of collective integration of a system does not depend on size, its level of robustness and adaptivity is typically increased; we refer to this as scale-invariant. A common signature of complex systems is the scale-invariant property. Scale-invariant emergent properties are identified as three main types: structures, topologies, and dynamics, or are classified as self-organized scale-invariant systems, scale-invariant spatial structures, scale-invariant topologies, and scale-invariant dynamics [1]. For example, random walks and fractals [2] are examples of systems with temporal and spatial structural scale-invariant properties; scale-free networks [3] are typical examples of systems with topological scale-invariant properties; the conventional critical phenomena, such as the forest fire model [4] and percolation [5], are the examples of scale-invariant dynamics. The generating mechanism of scale-invariant characteristics in complex systems is a fundamental question that remains active and is underexplored in the field of mathematics and physics. The random walk [6] is recognized as standard model to generate scale-invariant patterns. For example, the modified self-avoiding random walk model can be seen as a remarkable example of how simple individual interactions can lead to the emergence of scale invariance [7].
Scale-invariant interaction networks have also received a tremendous amount of attention over the past decades. People have great interest in the generating mechanism of the scale-invariant network structure. One well-known mechanism that generates topologies that go beyond ER random networks [8] and can often be scale-invariant is preferential attachment [3]. The other well-studied scale-invariant network growth model is the Watts and Strogatz model [9].
The scale-invariant structure of the network also refers to the power-law feature of the node degree distribution, i.e., the proportion of vertices with a degree k that is proportionally close to for some . Networks with a scale-invariant node degree are usually called scale-free (SF) networks. Various online social networks have been shown to have SF properties [10,11,12]. The burstiness or the interevent time distribution in temporal social networks is also observed to follow a power law [13]. Beyond internet ecology, power-law features are ubiquitous in physics, biology, geography, economics, insurance, lexicography, etc. Many endeavors have been dedicated to explaining the scaling behaviors [14,15,16,17], with some effort being based on network approaches [18,19,20,21] including notions of phase transition and the self-organized critical process [22]. In addition, a set of stochastic processes is proposed to explain the basic mathematical mechanisms for the emergence of the power-law feature. These stochastic processes include Yule, Simon, Geometric Brownian motion, discrete multiplicative, birth-and-death, Galton–Watson branching, and some recent models [23,24]. Although some effort has been dedicated to explaining the scaling behaviors, the mechanisms generating them from microdynamics are not yet completely understood. Because a scale-free pattern can be a consequence of different underlying processes, diverse systems might possess different generating paths. Recently, there is a growing interest in the question of network structure evolution [25]. In particular, the structural properties of online social networks have attracted much attention [26,27,28,29]. In addition, the exploration of the generation model of real-world social network structures remains an important question, for instance, the transmission mechanism of the network structure in information dissemination.
As a matter of fact, real-world networks such as the World-Wide Web and social networks grow in size as time proceeds. Therefore, it is reasonable to consider a graph with increasing nodes and edges. In this paper, the structure evolution of social networks is our main concern because the temporal social network is a typical model to investigate scale-invariant topologies and scale-invariant dynamics. In temporal networks, the degree of a node v within the time window is an important index to describe the network’s structure evolution and function, since the topological structure and dynamic behavior of complex networks are closely dependent on the degree distribution of the networks.
Considering that in a directed network, where is the number of edges of vertex v at timestamp t,the aggregate number of edges is a prerequisite for considering the scale behavior of the network structure, since the degree distribution of a network can be regarded as the clustering of a given number of edges on each given node.
The topological structure of a temporal network is achieved through nodes’ time-ordering links. To better understand the scaling properties of structure evolution in temporal networks, it is necessary to analyze their degree and the number of edges in a given timestamp t.
We address this problem by introducing a pure birth points process (PBP) to describe the cumulative growth trend of edges and a heuristic probabilistic explanation for the occurrence of a power law. We applied our model to online communities, two temporal networks, Bitcoin OTC, and Bitcoin Alpha, and found that the empirical observations, including the degree distribution scaling behaviors and the growth law of edges, can be quantitatively reproduced. The conclusion of this paper can be used to explain the generative mechanism that leads to the scale-invariant of the degree distribution with the power exponent , and the growth law of edges of empirical social networks.
2. Empirical Analysis
2.1. Dataset
Bitcoin is a cryptocurrency that is traded anonymously over the web. It is a decentralized semi-anonymous peer-to-peer payment system in which the transactions are verified by network nodes and recorded in a massively replicated public ledger called the blockchain. In this paper, we chose Bitcoin datasets, since they are fundamentally social and allow people to transact in a peer-to-peer manner to create and exchange value. As a temporal online social network, the Bitcoin transaction graph exhibits many universal dynamics typical of social networks [30].
In our empirical analysis for the proposed model, we used the Bitcoin OTC network [31]. The dataset is a temporal who-trusts-whom network where people can trade using Bitcoin on a platform called Bitcoin OTC. Each user can rate the other members with a number ranging from −10 to +10 (see https://bitcoin-otc.com/, accessed on 25 January 2023, for more details). The network consists of 5881 nodes and 35,592 edges. The period was from 8 November 2010 18:45:00 to 25 January 2016 01:12:04.
If an agent (node) i rates a target (node) j, an edge is generated between i and j. The time of the rating is measured as seconds since epoch. Here, we considered the Bitcoin OTC trust network as an undirected graph. We calculated the average time interval between any two generated edges as 3634.9 s. In order to create an aggregated temporal network and network snapshots, we divided the datasets into 13 timestamps, and constructed 12 dynamic networks with cumulative evolution times, as shown in the scheme in Figure 1. The additional dataset used in this paper is named Bitcoin Alpha network [31] with 3783 nodes and 24,186 edges. Bitcoin Alpha is also a who-trusts-whom network. We also divided the Bitcoin Alpha into 13 timestamps, and constructed 12 network snapshots. We use another dataset, Bitcon Alpha, to validate our proposed model and simulation algorithm. In the following, we will focus on the Bitcoin OTC network empirical analysis.
2.2. The Growth Law of Vertices and Edges of Empirical Social Networks (Bitcoin Otc)
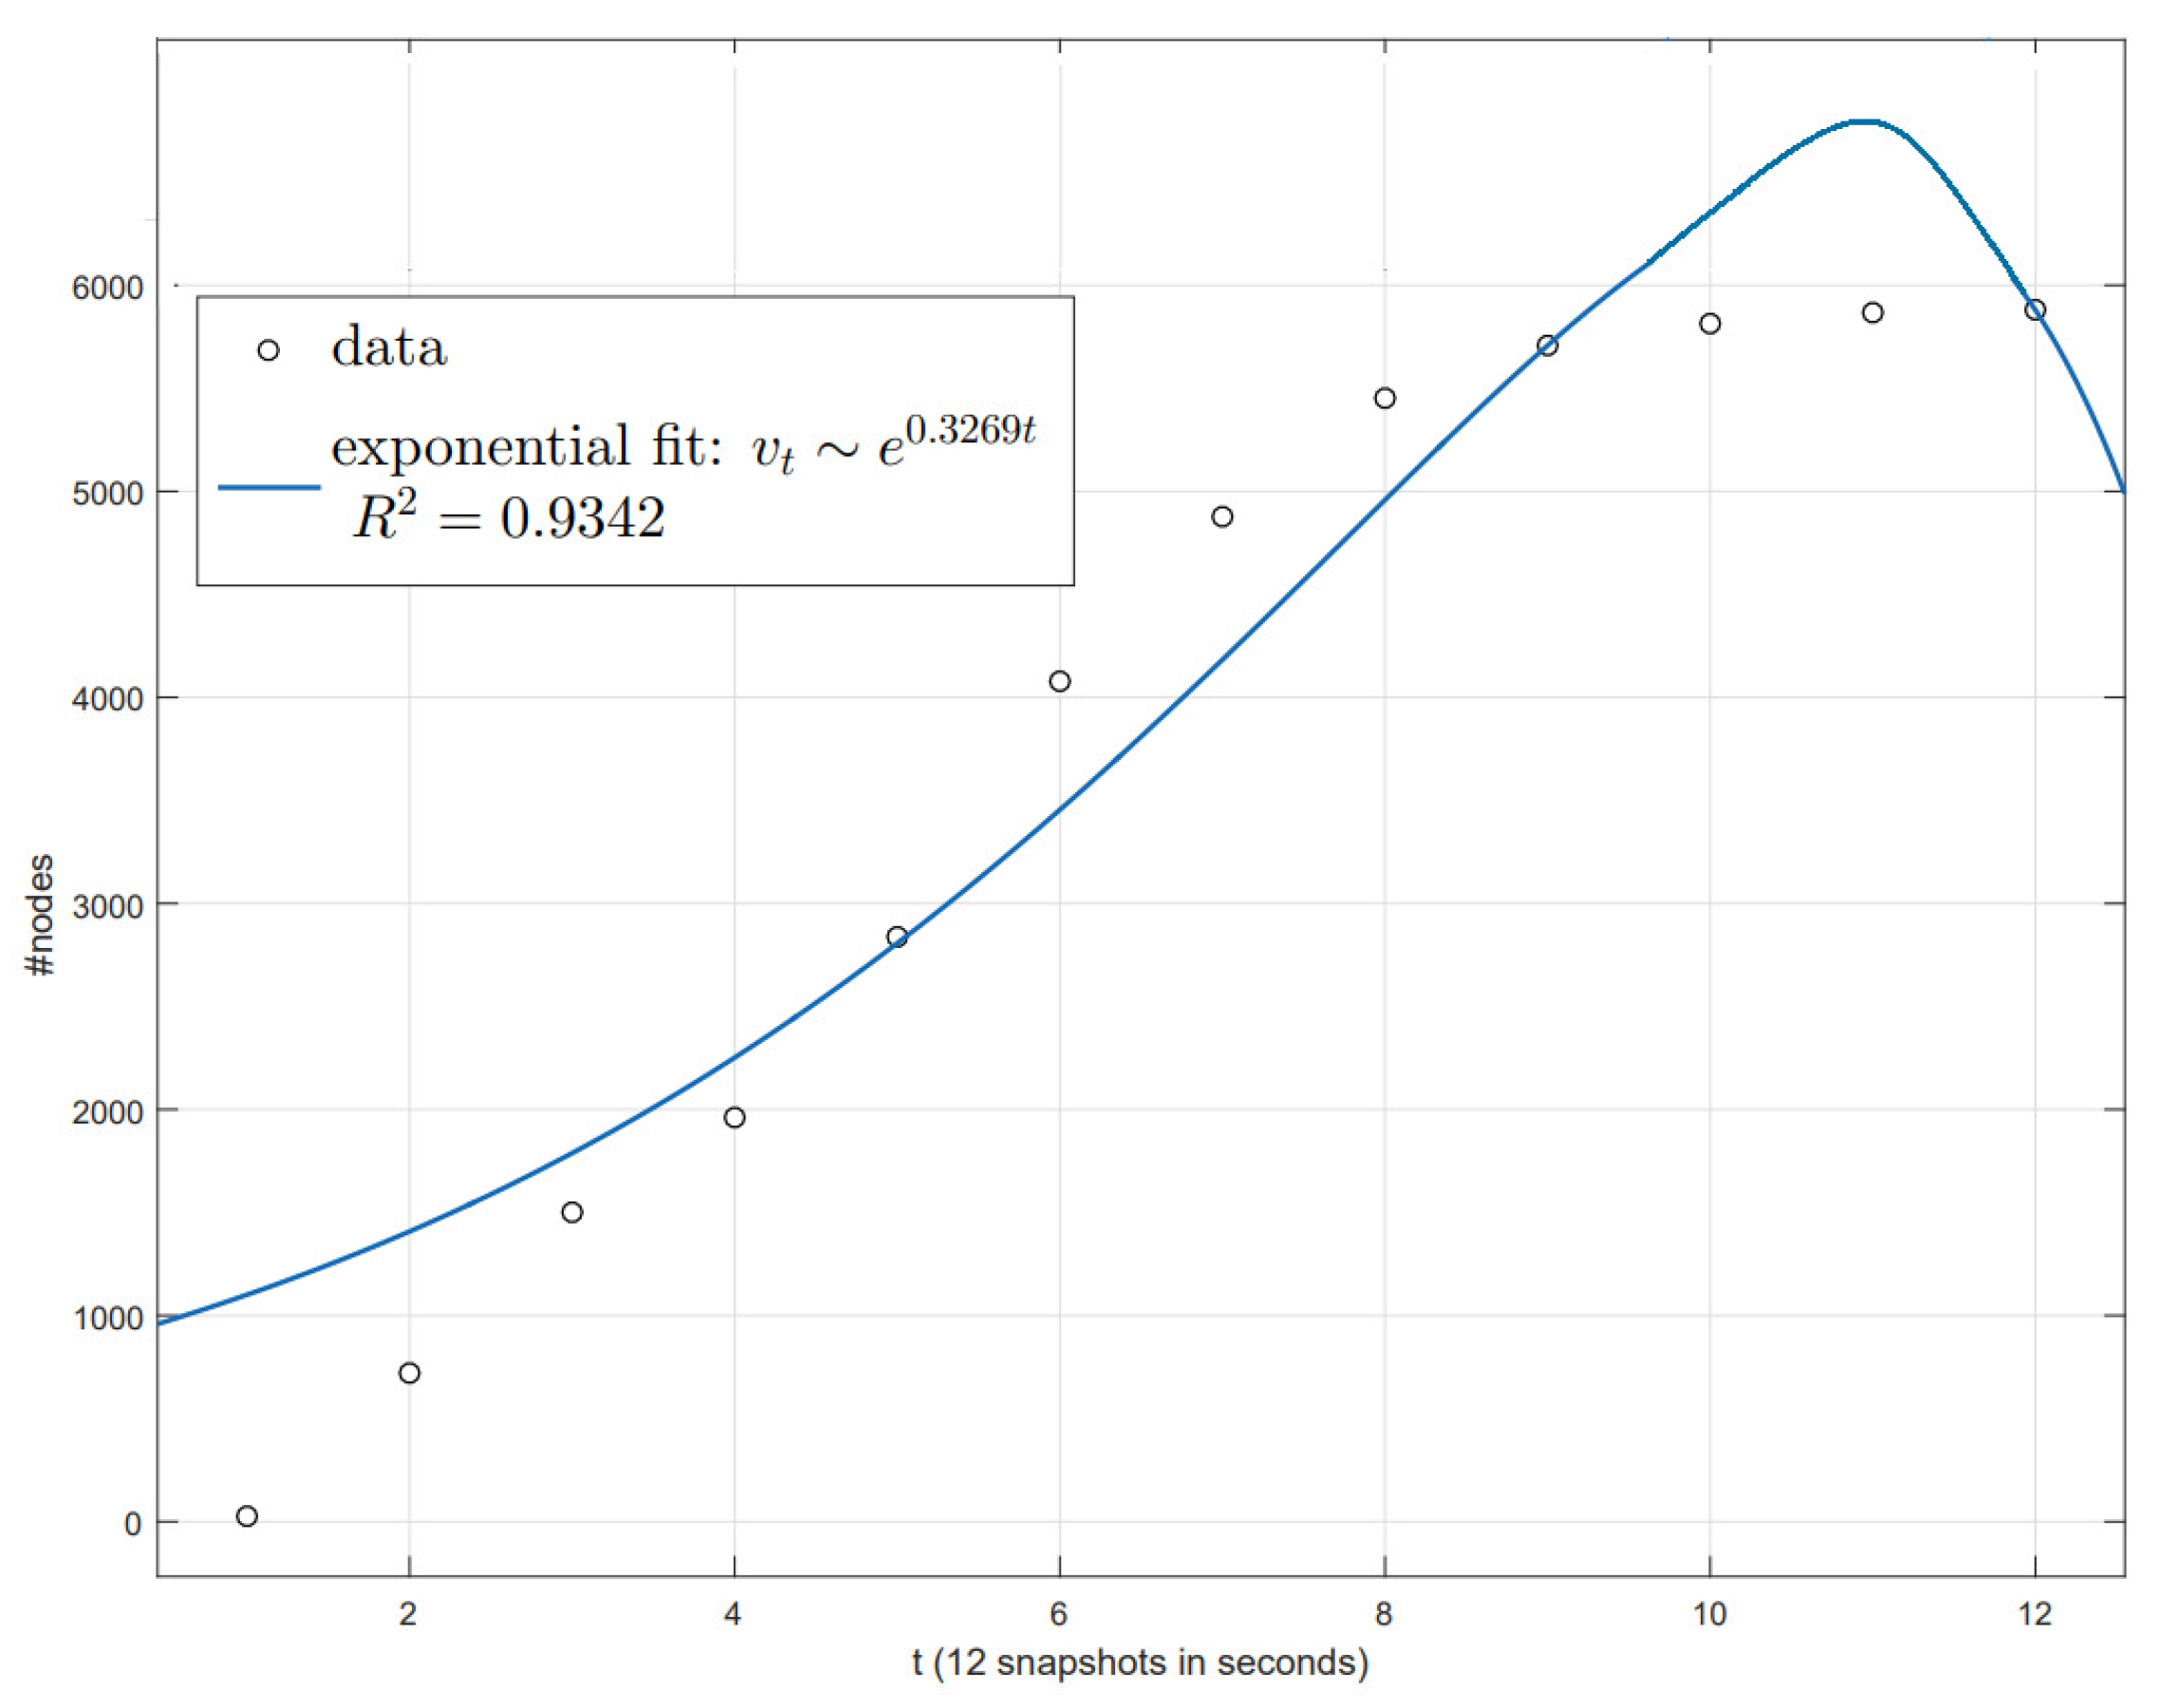
Using the robust LAR trust-region algorithm [32] (the estimation of , with 95% confidence bounds (0.3143, 0.3346), ), we obtained the empirical plot of the growth of vertices in Bitcoin OTC and the corresponding exponential fitting, as shown in Figure 2. We found that as the empirical temporal social networks evolve, they follow a version of the exponential growth law of vertices as follows
where . Figure 2 also reflects the fact that follows linear growth when t is small. The other important finding is that empirical social networks follow the relation of the densification power law as suggested by Leskovec et al. [26]. The densification power law, or the growth power law, describes the relation between and of an evolution graph as follows:
where and denote the number of edges and nodes of a graph at time t, and is an exponent that lies strictly between 1 and 2. Using the same algorithm, we obtained the estimation of the power exponent (with 95% confidence bounds) and the constant coefficient 1.389 (with 95% confidence bounds and , as shown in Figure 3.
2.3. Power-Law Distribution of Degree Sequences
There has been considerable interest in using random graphs to model complex real-world networks to gain an insight into their properties [3,8,9]. One of the most basic properties of a graph or network is its degree sequence. In the following, based on our empirical observation, we provide a heuristic probabilistic explanation for the occurrence of power-law degree sequences in real-world networks. Our heuristic explanation is based on the following conditions [33]:
(1) The number of vertices increases exponentially at some constant rate with survival time t, i.e., ;
(2) We assume that the degree of vertex v increases exponentially, i.e., . At time t, since the number of links in a vertex should be no more than the number of vertices, is always established.
Condition (1) is equal to the event that the survival time T of a node v is greater than t, since the node v should have the chance to create at least one node connected with it. In other words, is the condition to ensure the increase in the degree of node v, where . Therefore, approximately, the probability density function of the age of vertices at a large time is obtained as .
Considering the case in which we assume the degree of node v has also exponentially increased, i.e., , we arrive at the following conclusion: the probability density function of at a large time has the form , and is expressed as the following theorem:
Theorem 1.
At survival time t, for any vertex v, the probability that the degree is equal to i satisf
Proof.
It follows that
Therefore, we have the following equation based on the above heuristic probability analysis yields
Since , Equation (5) suggests a power law for the degrees of a network, with the power-law exponent , where . This heuristic model explains the emergence of power laws. In addition, the model confirms that the power exponent would approach 2 when (see the proof in detail). Peculiarly, the proposed heuristic model can explain the sparsity of real social networks. Since the density for an undirected graph is defined as , by substituting into density , we have Since and , this leads to . The result supports the conclusion of the sparsity of real social networks, i.e., as increasing exponentially with evolution time t. □
2.4. Empirical Evidence
Here, using the power-law fitting methods in Ref. [34], we chose four snapshots of the evolution network, demonstrating that the Bitcoin OTC network empirical degree distribution indeed follows a power-law distribution, as shown in Figure 4. Particularly, the heuristic probability model can explain the obvious real-world social network characteristics and degree exponent .
Actually, a lot of empirical studies of large scale social networks, such as the router level of the Internet, citations of the ISI database, the network of protein–protein interactions, and the collaboration network of Medline, have also shown that the degree distribution follows a power-law distribution, with a degree exponent [25].
The power exponent in these investigations coincides with Equation (5). Thus, the heuristic probabilistic model could be used to explain the generating mechanism of power-law emergence in real-world social networks, particularly in the case of the degree exponent .
Figure 4 shows that the power exponent gradually decreases and approaches 2 over evolutionary time. Therefore, a new question is naturally posed, i.e., why does the power exponent decrease as evolution time elapses? We gain further insights into the evolving nature of scale-invariant temporal social networks from the posed question.
As shown in Figure 4, for the Bitcoin OTC network snapshot, we observed that for a 1/4 evolution span, for a 1/2 evolution span, for a 3/4 evolution span, and for our obtained complete evolution span. Obviously, in the initial stage of network generation, the growth rate of nodes was significantly faster than that of edges, and then the growth rate of edges gradually approached the growth rate of the node, as shown in Figure 4. The power exponent of the Bitcoin OTC network decreased from 2.32 to 2.15 with increasing evolution time. In the case of , i.e., the growth rate of edges equals the growth rate of nodes, we have . According to network accelerated growth theory, the growth rate of edges will be greater than that of nodes [25], and the structural state () might appear for Bitcoin OTC. We also observed that the degree distribution in Bitcoin Alpha also demonstrates the same pattern as that in Bitcoin OTC.
The growth of network size usually manifests in two aspects: firstly, the increase in the number of nodes, and secondly, the increase in the number of edges. Accelerated growth theory argues that the growth rate of most network edges is faster than that of nodes. However, from the perspective of the complete period from the initial birth of the network to its aging, we suggest that the two parameters ratio can better characterize its structural evolution, since the theory of accelerated growth is a special case in our proposed model.
3. The Growth of Edges Follows Pure Birth Process
The degree distribution is closely related to the growth of edges. In this section, we propose a model to describe the growth of edges. In the model, we consider two evolutionary ingredients: the interarrival time of newly born edges follows an exponential distribution and the cumulative growth of edges follows the Poisson point process. Here, we provide both a rigorous mathematical analysis based on the pure birth process and a numerical simulation.
3.1. The Model
In this paper, we focus on the pure birth process (PBP), i.e., we only consider the connection (birth) of edges between nodes, without considering the disconnection (death) of edges between nodes.
To apply the PBP process to the evolution of edges, we interpreted the occurrence of edges as the births of new species without deaths, similar to the Yule Process [35]. Specifically, we are interested in the asymptotic behavior of the growth trend of edges in a temporal social network. In contrast to the conclusion that the power law of the Yule process can be interpreted using a combination of exponentials with a rough approximation [36], here, our proposed PBP model shows that the degree can also exhibit a power-law distribution, if we treat the edges growing as a pure birth process.
3.2. Pure Birth Process
Firstly, we introduce some notation. is used to denote the number of edges at time t, and represents the probability of the network with k edges at time t. We assume the birth probability per time unit is constant , the population size is initially 0, and all states are transient. The probability of having exactly k edges in a growing population at time is given by a set of ordinary differential equations as follows:
The following mathematical analysis confirms that the explicit solution to (6) is a Poisson process.
Proof.
Notice that and we obtain . In addition, we have . Therefore, we have . We derived that the number of born edges in interval follows a homogeneous Poisson counting process, i.e., , recursively. □
The proposed PBP is defined as follows: is a pure birth Markov process with a discrete state and a continuous time Markov process, such that
where is a homogeneous Poisson counting process with rate , which counts the number of edges that have occurred between 0 and t, as formulated in Equation (6). denotes the cumulative number of edges at time t, which is then given by the recursion as .
In fact, can be regarded as a cumulative counting point process for the number of new edges in a social network at the current time. Since is a homogeneous Poisson counting process, i.e., , the interarrival times of newly born edges should follow an exponential distribution with the expectation
We found that this is indeed the case. Figure 5 shows a histogram of the distribution of our measure of the edge growth of the Bitcoin OTC (KS-test accepts at the 0.05 confidence level with a p-value 0.61), where is the timestamp of the first born edge, and denotes time interval between the n-th newly generated edge and the -th newly generated edge.
Suppose the generation number of edges during the interval follows a homogeneous Poisson process with rate , and the average interarrival times , then we have the expected number of edges during the interval , such as
Equation (8) suggests that the cumulative growth trend of edges as a function of timestamps should follow a linear pattern.
3.3. Simulation Algorithm Implementation
In this section, as a function of time t, we investigate the cumulative increase in the number of edges based on the pure birth process (PBP) model. The implementation of this model is based on the following Algorithm 1. This model includes two evolutionary ingredients: the interarrival time of newly born edges follows an exponential distribution and the cumulative growth of edges follows the Poisson point process. According to the empirical analysis of the Bitcoin OTC social network, we obtained the average interarrival times s for any two newly born edges, i.e., the interarrival times of newly born edges should follow an exponential distribution with parameter s. The proposed simulation algorithm was implemented as follows. By setting the maximum evolution time (s), our simulation algorithm was realized 50 times. In Figure 6, each plot shows the growth process of as a function of t. Indeed, the PBP-based model simulation shows that the cumulative growth trend of edges as a function of timestamps follows a linear pattern (the inset in Figure 6 shows the growth trend of at a smaller time scale). The simulation result is well-matched with the theoretic analysis.
| Algorithm 1: PBP-based simulation algorithm |
 |
In contrast, the plot in Figure 7 shows that the cumulative number of edges on the empirical temporal networks displays a linear increasing trend. Indeed, both the degree distribution and the growth law of edges on Bitcoin Alpha and Bitcoin OTC demonstrate the same evolution trend. Therefore, we can affirm that the behavior is typical of this type of network.
4. Conclusions
In this paper, we propose a mathematical model to describe the generating mechanism of the power law in temporal social networks. The exponent of the power law is derived from the heuristic probabilistic model. Moreover, we present a pure birth points process and a stochastic growth dynamic model to describe the cumulative growth of edges. The proposed model simulation well-matched with the structure evolution of real-world temporal social networks such as Bitcoin OTC and Bitcoin Alpha.
The process of the power exponent decreasing from large to small contains rich network dynamics characteristics. From the initial birth of a network to its aging, we suggest that the parameters ratio can better characterize its structural evolution than the theory of network accelerated growth. We believe that may offer alternative interpretations of the entire life-cycle of network dynamics in a variety of extended nonequilibrium systems.
Author Contributions
Conceptualization, Z.L. and L.L.; methodology, Z.L.; software, Z.L.; writing—original draft preparation, L.L.; writing—review and editing, L.L.; funding acquisition, Z.L. All authors have read and agreed to the published version of the manuscript.
Funding
This research was funded by the Natural Science Foundation of China under the grant No 71661001.
Data Availability Statement
The network data that support the findings of this study is available through the corresponding reference [31].
Conflicts of Interest
The authors declare no conflict of interest.
References
- Khaluf, Y.; Ferrante, E.; Simoens, P.; Huepe, C. Scale invariance in natural and artificial collective systems: A review. J. R. Soc. Interface 2017, 14, 1–20. [Google Scholar] [CrossRef] [PubMed] [Green Version]
- Feder, J. Fractals: Physics of Solids and Liquids; Plenum Press: New York, NY, USA, 1988; pp. 163–183. [Google Scholar]
- Barabasi, A.L.; Albert, R. Emergence of Scaling in Random Networks. Science 1999, 286, 509–512. [Google Scholar] [CrossRef] [PubMed] [Green Version]
- Bak, P.; Kan, C.; Tang, C. A forest-fire model and some thoughts on turbulence. Phys. Lett. A 1990, 147, 5–6. [Google Scholar] [CrossRef]
- Aizenman, M.; Barsky, D.J. Sharpness of the phase transition in percolation models. Commun. Math. Phys. 1987, 108, 489–526. [Google Scholar] [CrossRef]
- Cattuto, C.; Barrat, A.; Baldassarri, A.; Schehr, G.; Loreto, V. Collective dynamics of social annotation. Proc. Natl. Acad. Sci. USA 2009, 106, 10511–10515. [Google Scholar] [CrossRef] [PubMed] [Green Version]
- Edwards, S.F. The statistical mechanics of polymers with excluded volume. Proc. Phys. Soc. 1965, 85, 613–624. [Google Scholar] [CrossRef]
- Erdos, P.; Rényi, A. On the evolution of random graphs. Publ. Math. Inst. Hung. Acad. Sci. 1960, 5, 17–61. [Google Scholar]
- Watts, D.J.; Strogatz, S.H. Collective dynamics of small-world networks. Nature 1998, 393, 440–442. [Google Scholar] [CrossRef]
- Faloutsos, M.; Faloutsos, P.; Faloutsos, C. On power-law relationships of the internet topology. Comput. Commun. Rev. 1999, 29, 251–262. [Google Scholar] [CrossRef]
- Adamic, L.A.; Huberman, B.A.; Barabási, A.; Albert, R.; Jeong, H.; Bianconi, G. Power-law Distribution of the World Wide Web. Science 2000, 287, 2115. [Google Scholar] [CrossRef] [Green Version]
- Wang, H.; Fang, Y.; Jiang, S.; Chen, X.; Peng, X.; Wang, W. Unveiling Qzone: A measurement study of a large-scale online social network. Inform. Sci. 2023, 623, 146–163. [Google Scholar] [CrossRef]
- Barabasi, A.L. The origin of bursts and heavy tails in human dynamics. Nature 2005, 435, 207–211. [Google Scholar] [CrossRef] [Green Version]
- Sethna, J.P. Power laws in physics. Nat. Rev. Phys. 2022, 4, 501–503. [Google Scholar] [CrossRef]
- Newman, M. Power laws, pareto distributions and Zipf’s law. Contemp. Phys. 2005, 46, 323–351. [Google Scholar] [CrossRef] [Green Version]
- Sethna, J.P.; Dahmen, K.A.; Myers, C.R. Crackling noise. Nature 2001, 410, 242–250. [Google Scholar] [CrossRef] [Green Version]
- Mitzenmacher, M. A Brief history of generative models for power law and lognormal distributions. Internet Math. 2004, 1, 226–251. [Google Scholar] [CrossRef] [Green Version]
- West, G.B.; Brown, J.H.; Enquist, B.J. A General Model for the Origin of Allometric Scaling Laws in Biology. Science 1997, 276, 122–126. [Google Scholar] [CrossRef]
- Arbesman, S.; Kleinberg, J.M.; Strogatz, S.H. Superlinear scaling for innovation in cities. Phys. Rev. E 2009, 79, 016115. [Google Scholar] [CrossRef] [PubMed] [Green Version]
- Banavar, J.R.; Maritan, A.; Rinaldo, A. Size and form in efficient transportation networks. Nature 1999, 399, 130–132. [Google Scholar] [CrossRef] [PubMed]
- Leskovec, J.; Chakrabarti, D.; Kleinberg, J.; Faloutsos, C.; Ghahramani, Z. Kronecker graphs: An approach to modeling networks. J. Mach. Learn. Res. 2010, 11, 985–1042. [Google Scholar]
- Bak, P.; Tang, C.; Wiesenfeld, K. Self-organized criticality: An explanation of the 1/f noise. Phys. Rev. Lett. 1987, 59, 381–384. [Google Scholar] [CrossRef]
- Shin-Ichiro, K.; Takashi, K. Power Laws in Stochastic Processes for Social Phenomena: An Introductory Review. Front. Phys. 2018, 6, 20. [Google Scholar] [CrossRef] [Green Version]
- Reed, W.J.; Hughes, B.D. From gene families and genera to incomes and internet file sizes: Why power laws are so common in nature. Phys. Rev. E 2002, 66, 6. [Google Scholar] [CrossRef] [Green Version]
- Dorogovtsev, S.N.; Mendes, J.F.F. Evolution of networks. Adv. Phys. 2002, 51, 4. [Google Scholar] [CrossRef] [Green Version]
- Leskovec, J.; Kleinberg, J.; Faloutsos, C. Graphs over time: Densification laws, shrinking diameters and possible explanations. In Proceedings of the Eleventh ACM SIGKDD International Conference on Knowledge Discovery in Data Mining, New York, NY, USA, 21 August 2005. [Google Scholar]
- Papadopoulos, F.; Kitsak, M.; Serrano, M.Á.; Boguna, M.; Krioukov, D. Popularity versus similarity in growing networks. Nature 2012, 489, 537–540. [Google Scholar] [CrossRef] [Green Version]
- Zhang, J.; Li, X.; Wang, X.; Wang, W.X.; Wu, L. Scaling behaviours in the growth of networked systems and their geometric origins. Sci. Rep. 2015, 5, 9767. [Google Scholar] [CrossRef] [Green Version]
- Liu, H.; Qu, C.Q.; Niu, Y.W.; Wang, G.H. The evolution of structural balance in time-varying signed networks. Future Gener. Comp. Sys. 2020, 102, 403–408. [Google Scholar] [CrossRef]
- Alqassem, I.; Rahwan, I.; Svetinovic, D. The Anti-Social System Properties: Bitcoin Network Data Analysis. IEEE Trans. Syst. Man Cybern. Syst. 2020, 50, 21–31. [Google Scholar] [CrossRef]
- Kumar, S.; Spezzano, F.; Subrahmanian, V.S.; Faloutsos, C. Edge Weight Prediction in Weighted Signed Networks. In Proceedings of the IEEE 16th International Conference on Data Mining (ICDM), Barcelona, Spain, 12 December 2016. [Google Scholar]
- Liu, X.; Yuan, Y.X. A robust trust region algorithm for solving general nonlinear programming. J. Comput. Math. 2001, 19, 3. [Google Scholar]
- Remco, V.D.H. Random Graphs and Complex Networks; Cambridge University Press: Cambridge, UK, 2016; pp. 18–19. [Google Scholar]
- Clauset, A.; Shalizi, C.R.; Newman, M. Power-law distributions in empirical data. SIAM Rev. 2009, 51, 4. [Google Scholar] [CrossRef] [Green Version]
- Yule, G.U. A mathematical theory of evolution, based on the conclusions of Dr. JC Willis. Philos. Trans. R. Soc. London Ser. B 1925, 213, 21–87. [Google Scholar]
- Simkin, M.V.; Roychowdhury, V.P. Re-inventing Willis. Phys. Rep. 2011, 502, 1–35. [Google Scholar] [CrossRef] [Green Version]
Figure 1.
Construction of the aggregated temporal dynamic networks .

Figure 2.
The number of vertices in Bitcoin OTC increases exponentially at some constant rate with evolutional time t.
Figure 2.
The number of vertices in Bitcoin OTC increases exponentially at some constant rate with evolutional time t.

Figure 3.
The number of edges versus the number of nodes for the Bitcoin OTC network. We found that the Bitcoin OTC network obeys the densification power law, with a consistently good fit .
Figure 3.
The number of edges versus the number of nodes for the Bitcoin OTC network. We found that the Bitcoin OTC network obeys the densification power law, with a consistently good fit .

Figure 4.
The four snapshots of Bitcoin OTC empirical degree distribution displays a power-law pattern. (a) the slope of power law . (b) the slope of power law . (c) the slope of power law . (d) the slope of power law .
Figure 4.
The four snapshots of Bitcoin OTC empirical degree distribution displays a power-law pattern. (a) the slope of power law . (b) the slope of power law . (c) the slope of power law . (d) the slope of power law .

Figure 5.
The interarrival times (in seconds) of newly born edges.

Figure 6.
The cumulative number of edges for our proposed PBP model.

Figure 7.
The cumulative number of edges in Bitcon OTC and Bitcon Alpha.

Disclaimer/Publisher’s Note: The statements, opinions and data contained in all publications are solely those of the individual author(s) and contributor(s) and not of MDPI and/or the editor(s). MDPI and/or the editor(s) disclaim responsibility for any injury to people or property resulting from any ideas, methods, instructions or products referred to in the content. |
© 2023 by the authors. Licensee MDPI, Basel, Switzerland. This article is an open access article distributed under the terms and conditions of the Creative Commons Attribution (CC BY) license (https://creativecommons.org/licenses/by/4.0/).
Share and Cite
MDPI and ACS Style
Li, Z.; Li, L. The Generation Mechanism of Degree Distribution with Power Exponent >2 and the Growth of Edges in Temporal Social Networks. Mathematics 2023, 11, 2882. https://doi.org/10.3390/math11132882
AMA Style
Li Z, Li L. The Generation Mechanism of Degree Distribution with Power Exponent >2 and the Growth of Edges in Temporal Social Networks. Mathematics. 2023; 11(13):2882. https://doi.org/10.3390/math11132882
Chicago/Turabian StyleLi, Zhenpeng, and Luo Li. 2023. "The Generation Mechanism of Degree Distribution with Power Exponent >2 and the Growth of Edges in Temporal Social Networks" Mathematics 11, no. 13: 2882. https://doi.org/10.3390/math11132882
Note that from the first issue of 2016, this journal uses article numbers instead of page numbers. See further details here.