A Computational Model for Cardiomyocytes Mechano-Electric Stimulation to Enhance Cardiac Tissue Regeneration


1
Mechanical Engineering Department, School of Engineering and Architecture (EINA), University of Zaragoza, 50018 Zaragoza, Spain
2
Aragon Institute of Engineering Research (I3A), University of Zaragoza, 50018 Zaragoza, Spain
3
Biomedical Research Networking Center in Bioengineering, Biomaterials and Nanomedicine (CIBER-BBN), 50018 Zaragoza, Spain
*
Author to whom correspondence should be addressed.
Mathematics 2020, 8(11), 1875; https://doi.org/10.3390/math8111875
Submission received: 28 September 2020
/
Revised: 21 October 2020
/
Accepted: 22 October 2020
/
Published: 29 October 2020
(This article belongs to the Special Issue Numerical Simulation in Biomechanics and Biomedical Engineering)
Abstract
:Electrical and mechanical stimulations play a key role in cell biological processes, being essential in processes such as cardiac cell maturation, proliferation, migration, alignment, attachment, and organization of the contractile machinery. However, the mechanisms that trigger these processes are still elusive. The coupling of mechanical and electrical stimuli makes it difficult to abstract conclusions. In this sense, computational models can establish parametric assays with a low economic and time cost to determine the optimal conditions of in-vitro experiments. Here, a computational model has been developed, using the finite element method, to study cardiac cell maturation, proliferation, migration, alignment, and organization in 3D matrices, under mechano-electric stimulation. Different types of electric fields (continuous, pulsating, and alternating) in an intensity range of 50–350 , and extracellular matrix with stiffnesses in the range of 10–40 kPa, are studied. In these experiments, the group’s morphology and cell orientation are compared to define the best conditions for cell culture. The obtained results are qualitatively consistent with the bibliography. The electric field orientates the cells and stimulates the formation of elongated groups. Group lengthening is observed when applying higher electric fields in lower stiffness extracellular matrix. Groups with higher aspect ratios can be obtained by electrical stimulation, with better results for alternating electric fields.
1. Introduction
Electrical stimulation (ES) is an essential part of the human body physiology, which has relevant regulatory effects on cell motility, nutrient transport, and disease signaling, among others [1]. The effects due to the presence of electric fields and electric currents, generated by electric potentials, at both the cellular and tissue levels, play a key role in processes such as embryogenesis [2], tissue regeneration [3], and cancer development [4]. In the past decades, the application of cell ES has been applied to study various effects, including, among others, the development and regeneration of tissues [5,6], embryonic development [7], and tissue engineering [8]. Furthermore, ES has been shown to play a key role in maintaining a differentiated phenotype of certain cell lineages, such as neuroblasts and myocytes, keeping a close relationship between electrical activity and functionality [4,9,10]. Thus, the application of electric fields during cell maturation can influence maturation, architecture, and functionality of the developed tissues in-vitro. Different studies have shown the advantages of applying electrical stimulation in the muscle cell culture, observing benefits in cell differentiation [11,12], maturation [13,14], alignment [15,16], sarcomeric organization [17], and functional assembly [11,17]. In general, there is an improvement in the ultrastructural organization, an increase in the synchronization and amplitude of tissue contractions, in electrically stimulated tissues in comparison with non-stimulated ones.
Despite its observable effects [11], the mechanisms that regulate the cell response to electrical stimulus are still, in part, unknown, especially when it is combined with other stimuli such as mechanical cues. Cells, guided by electrotaxis, are able to detect the presence of endogenous electric fields through the extracellular matrix (ECM), polarizing and migrating in the direction of the electric field [4,6]. In the anodic zone, the cell is hyperpolarized tending to release , and acquiring a locally more negative membrane potential. On the opposite side, in the cathodic side, the cell is depolarized, tending to absorb Ca from the environment and becoming locally more positive [4]. These two effects cause migratory effects in opposite directions, being the effective direction of migration as a result of this balance. In fact, it depends, among other factors, on the cell phenotype, where both cathodic and anodic migration tendencies can be observed. For instance, Cardiac Progenitor Cells (CPC), Cardiac Fibroblasts (CF) [18] and Breast Cancer Cells [4] tend to migrate towards the cathodic direction, while Fibroblasts (FB) [18] and Keratinocytes [19] tend to migrate towards the anodic direction. However, this migratory tendency can be altered by changing ECM conditions. In fact, Frederich et al., studied the effect of the soluble Vascular Adhesion Molecules (sVCAM) on the migration of CPD and CF [18]. They observed that, in absence of sVCAM, the directionality effects produced by the electrotaxis disappeared for the CPC, while the direction was reversed for the CF. Thus, the complexity of cellular environments, which coupling several stimuli simultaneously (mechanical, electrical, and chemical), makes it difficult to study and obtain conclusions. For instance, T. A. Banks et al. have observed differences in the direction of cell migration and alignment, between Mesenchymal Stem Cells (MSCs) from different donors [20] as well as from previously published studies [21]. These differences might be due to the coupling of different stimuli [18]. Besides, H.Heidi Au et al. have compared the effect of the electric stimulation coupled with mechanical cues. They conclude that cell orientation was strongly determined by the topographical stimuli, while the electric stimuli had less relevance in cell orientation [16].
Generally, when damage is generated in cardiac tissues, the regenerative capacity is limited. This shortage is associated, among other factors, with the lack of cells proliferative capacity [18,22,23]. Stimulating and improving this capacity implies the need to know and control all the parameters that influence this process. Establishing the optimal conditions necessary to stimulate and accelerate regenerative processes implies the development of a large number of in-vitro experiments. From an experimental point of view, performing multiple tests to regulate and optimize different parameters entails a high time and economic cost, in addition to considerable technological complexity [11,23]. In this way, theoretical and computational models can offer support to study cell response in complex environments, letting us study the effect of multiple parameters on cell behavior. Thus, multiple experiments can be designed and evaluated, with reasonable economical and temporary costs, to obtain suitable conditions for a given objective, such as the stimulation of cell proliferation and tissue regeneration. Through these models, it is possible to purpose different hypotheses, breaking down and studying simple cases whose effects are known. After adequate calibration, it is possible to consider the coupling of different stimuli to analyze their effects in more complex cases. These models can be especially useful to study the formation of cellular architecture in complex tissues, where the architecture is closely related to the functionality [24,25]. Despite the advantages that these models could offer, as far as we know, up to date, there are few published models related to this topic. N. Ogawa et al. 2006 presented a computational model for cell reorientation in paramecium cells due to the galvanotaxis stimulus [26]. They considered the electrical effect on ciliary beating to be the main cue of cell reorientation. Despite their interesting point of view, cell-cell interactions as well as mechanical effects of the cellular environment were not considered in their model. In previous works, our group presented a new approach for cell galvanotaxis considering coupled effects of mechanical, electrical, thermal, and chemical stimuli in cell migration [27,28,29] and cell morphology [30] in 3D ECMs. However complex cell-cell interactions as cell junctions and collective cell behavior for Cardiomyocytes (CMs) were not considered. In the current work, we present a 3D mechano-electric model for the study of cell architecture based on the orientation and cellular migration of cardiac cells. This model allows to study the processes of migration, maturation, and proliferation as well as the formation of stable cell chains of Cardiomyocytes (CMs), depending on the applied electrical and mechanical stimuli.
2. Methods
In order to study the cellular response to the ES as well as the mechanical stimulus, a 3D computational model has been developed. The present model includes cell processes such as migration, maturation, and proliferation, as well as cell interaction and adhesion. The model has been developed based on the Finite Element Method (FEM) and depending on the cell internal deformations.
2.1. Cell Migration
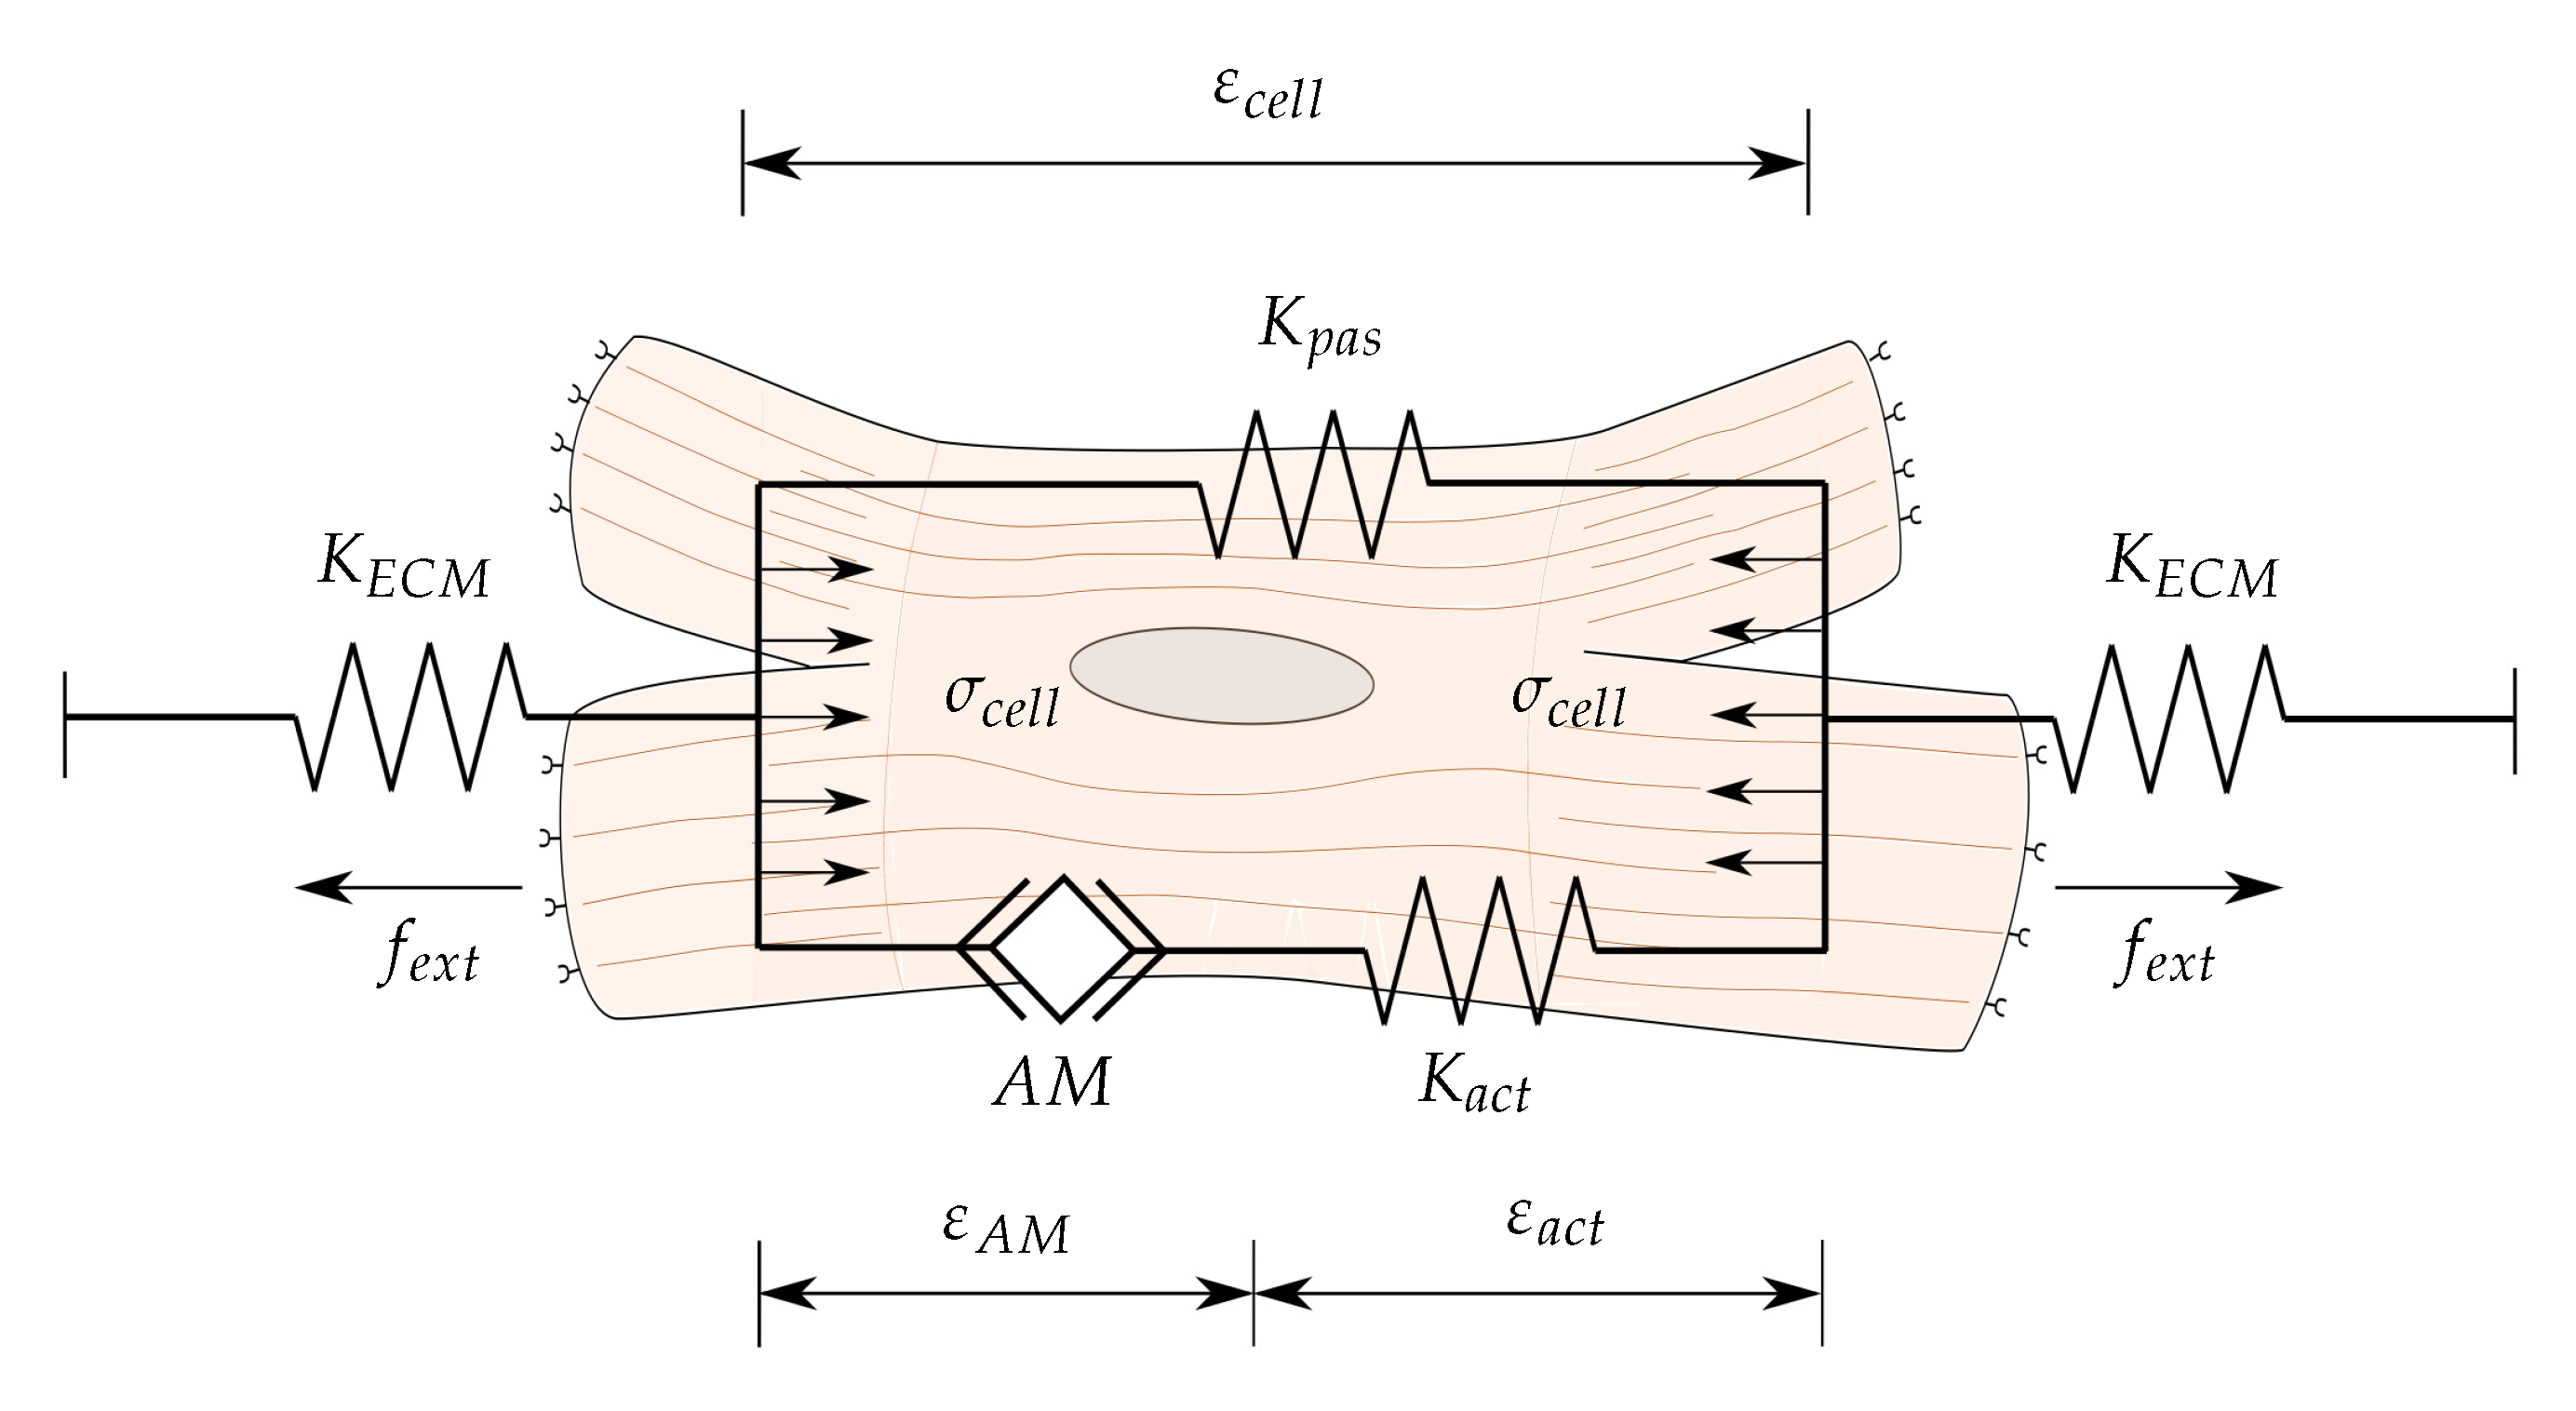
Cell migration described in this section is based on the contractile effect of the actin-myosin () machinery [31,32,33]. During cell migration, the cell, which is anchored to ECM through the focal adhesions, is contracted by the effect of the assembly. This contraction has two effects, to evaluate the mechanical environment of the cell (stiffness) and to impulse the cell. After evaluating the conditions of the ECM, the front part of the cell (preferential migration direction) generates new adhesions, while the rear part releases them [34,35]. This effect, together with the cellular contraction, drives the cell towards a new location. The direction in which the cell migrates is defined by a set of events that include actin random [36] or guided [37,38] polymerization [34,39]. Thus, the relationship between the cell internal stresses generated by the contraction of the and the produced deformation in the ECM (Figure 1) has been established by the following equation [40,41]:
where is the internal stresses generated by a cellular deformation at each evaluated FE point of the cell membrane. and , correspond to the stiffness of the passive and active elements of the cell, respectively. , , and , correspond to the maximum stress generated by the contraction of the motor, the maximum and minimum deformation, respectively, for which the generates active stresses. Finally, , is the cellular strain for which maximum effort is generated, and is defined by .
During the migration process, the internal stresses are transmitted to the ECM through the multiple focal adhesions as traction forces, . The magnitude of these forces depends, in addition to the internal stresses, , on the ligands concentration, , and the number of the available receptors, , on the cell membrane as [27,30]:
where S is the membrane surface, k is the binding constant, and is a unit vector that points from the evaluated membrane point towards the cell centroid. Then, the resultant traction force, , is obtained through the contribution of the n forces of the cell as [42,43]:
In addition to the traction forces, the model considers the effect of the forces generated by the electric field, , the forces due to protrusions generation, , and the drag forces, , due to the viscosity of the ECM.
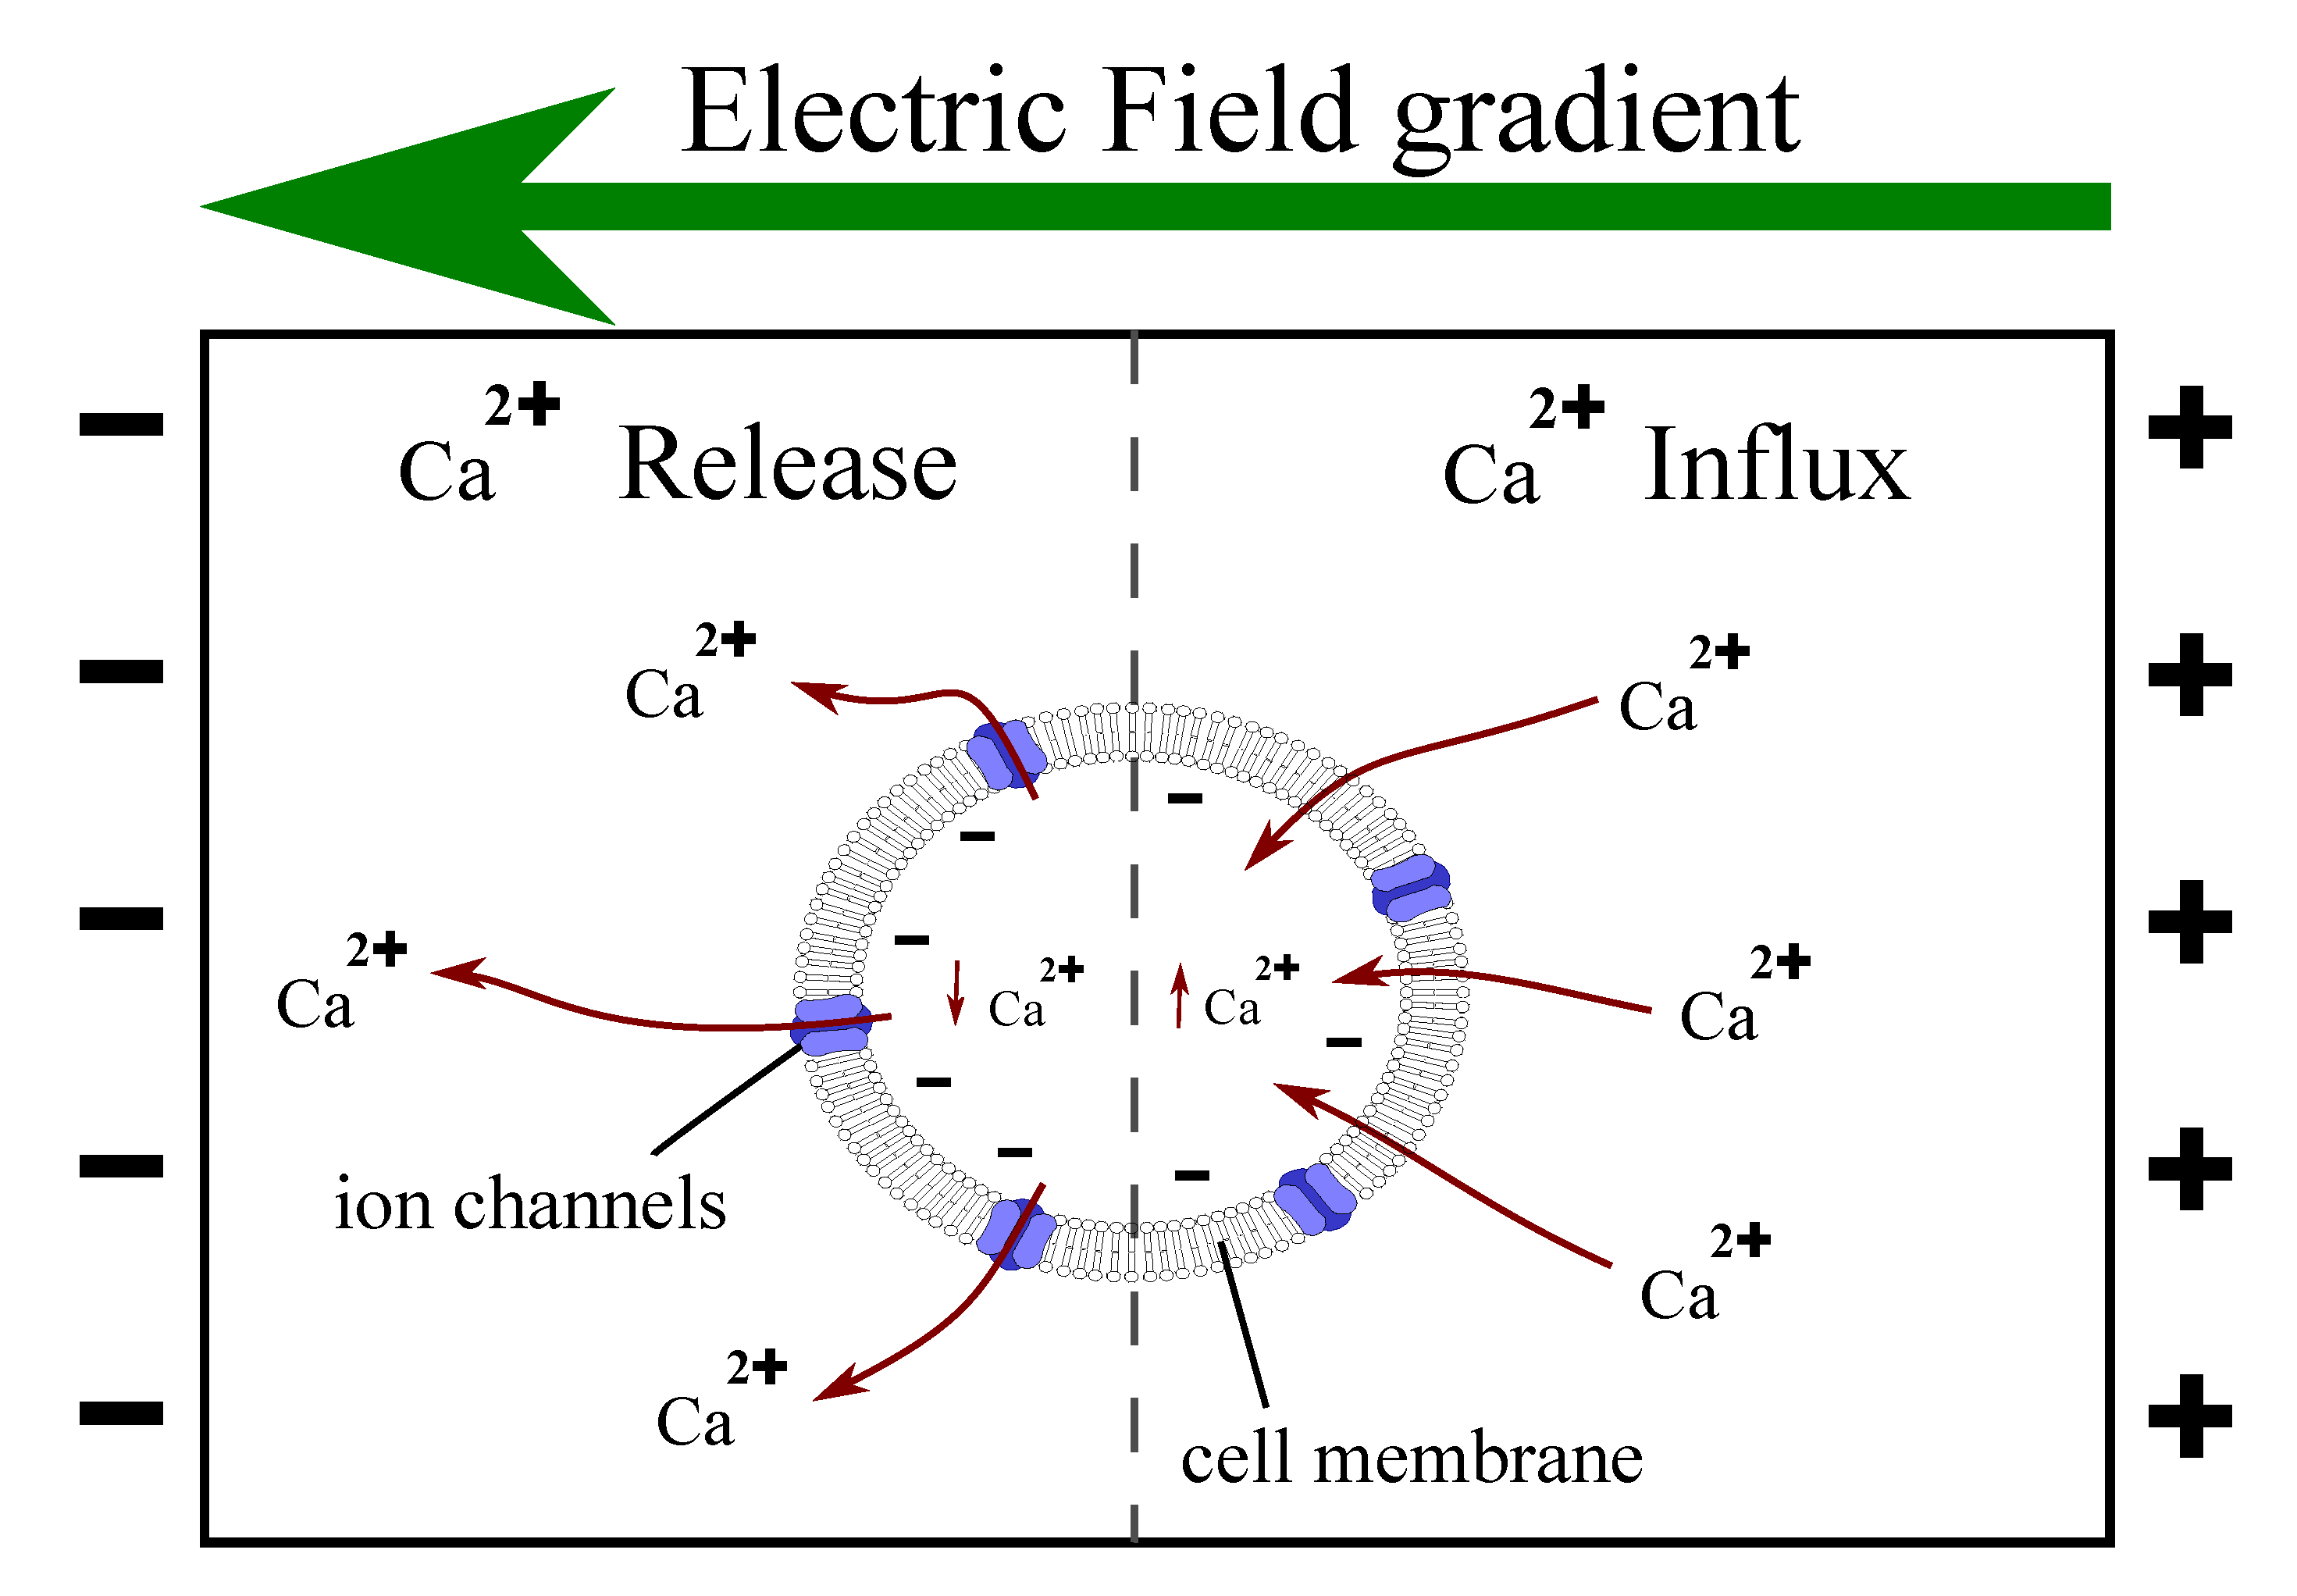
Different studies have observed a linear relationship in the migratory cell behavior with respect to the electric field [17,20,44]. For instance, B. Frederich et al. studied different cardiac cells under direct current electric fields of different intensity concluding that the effect of the ES is proportional to the magnitude of the electric field [18]. Besides, C. Chen et al. showed in their review that ES stimulates cell migration and the average displacement is increased as the intensity of the ES increases, being a useful tool for regulating cell behavior [44]. This performance is attributed to the influence of Ca, which generates a hyperpolarization of the cell in the direction of the electric field (Figure 2). Therefore, the force, , with which the cell is dragged by the electric field, E, can be defined as:
where is the cell surface charge density, S is the surface of the cell membrane, and is the direction of the electric field. The surface charge density can be obtained using the Gouy-Chapman membrane charge equations as a function of the resting potential of the membrane [45].
Different experiments conclude that, although there is a linear relationship between the intensity of the electric field and the velocity of the cell migration, cells also exhibit a threshold for which this velocity does not increase anymore. This value of EF for which saturation of the electric forces appears, , seems to be dependent on the analyzed cell type [18,19,21,44]. This saturation effect has been defined in the calculation of the electrical charge density of the cell as:
where is the saturation charge of the cell surface, and is the electric field for which the electric cell forces show a saturation.
The present model also considers the local repulsion force produced by the individual charge of the cells. The repulsion electric force, , experienced by the cells i and j, is proportional to the electric charge of the cells, and , and inversely proportional to the distance between them, . It can be calculated by [27,28]:
where is the coulomb constant, is the relative permittivity of the ECM, and is the direction from the jth cell towards the ith cell. With the generated forces by each jth neighbor cell and the forces due to the electric field, the total force on the ith cell, , can be obtained by:
Protrusion forces, due to the extension and retraction of protrusions of the cell, generate extensions of the cell which increase cell penetration. In general, it is considered as a random process. Thus, the magnitude and direction of the protrusion forces, , have been calculated as [40,43]:
where is a random value between , and is a random unit vector.
Finally, the drag force effect, , has been considered as a force that opposes the movement of the cell due to the medium viscosity, . It has been defined by the Strokes law as the resistance force to a cell of radius r, which is moving at velocity , as:
Proposing a balance of forces on the cell, and neglecting inertial effects due to the scale of the problem, we obtain:
through which the direction and velocity of cell migration are obtained.
2.2. Cell Interaction
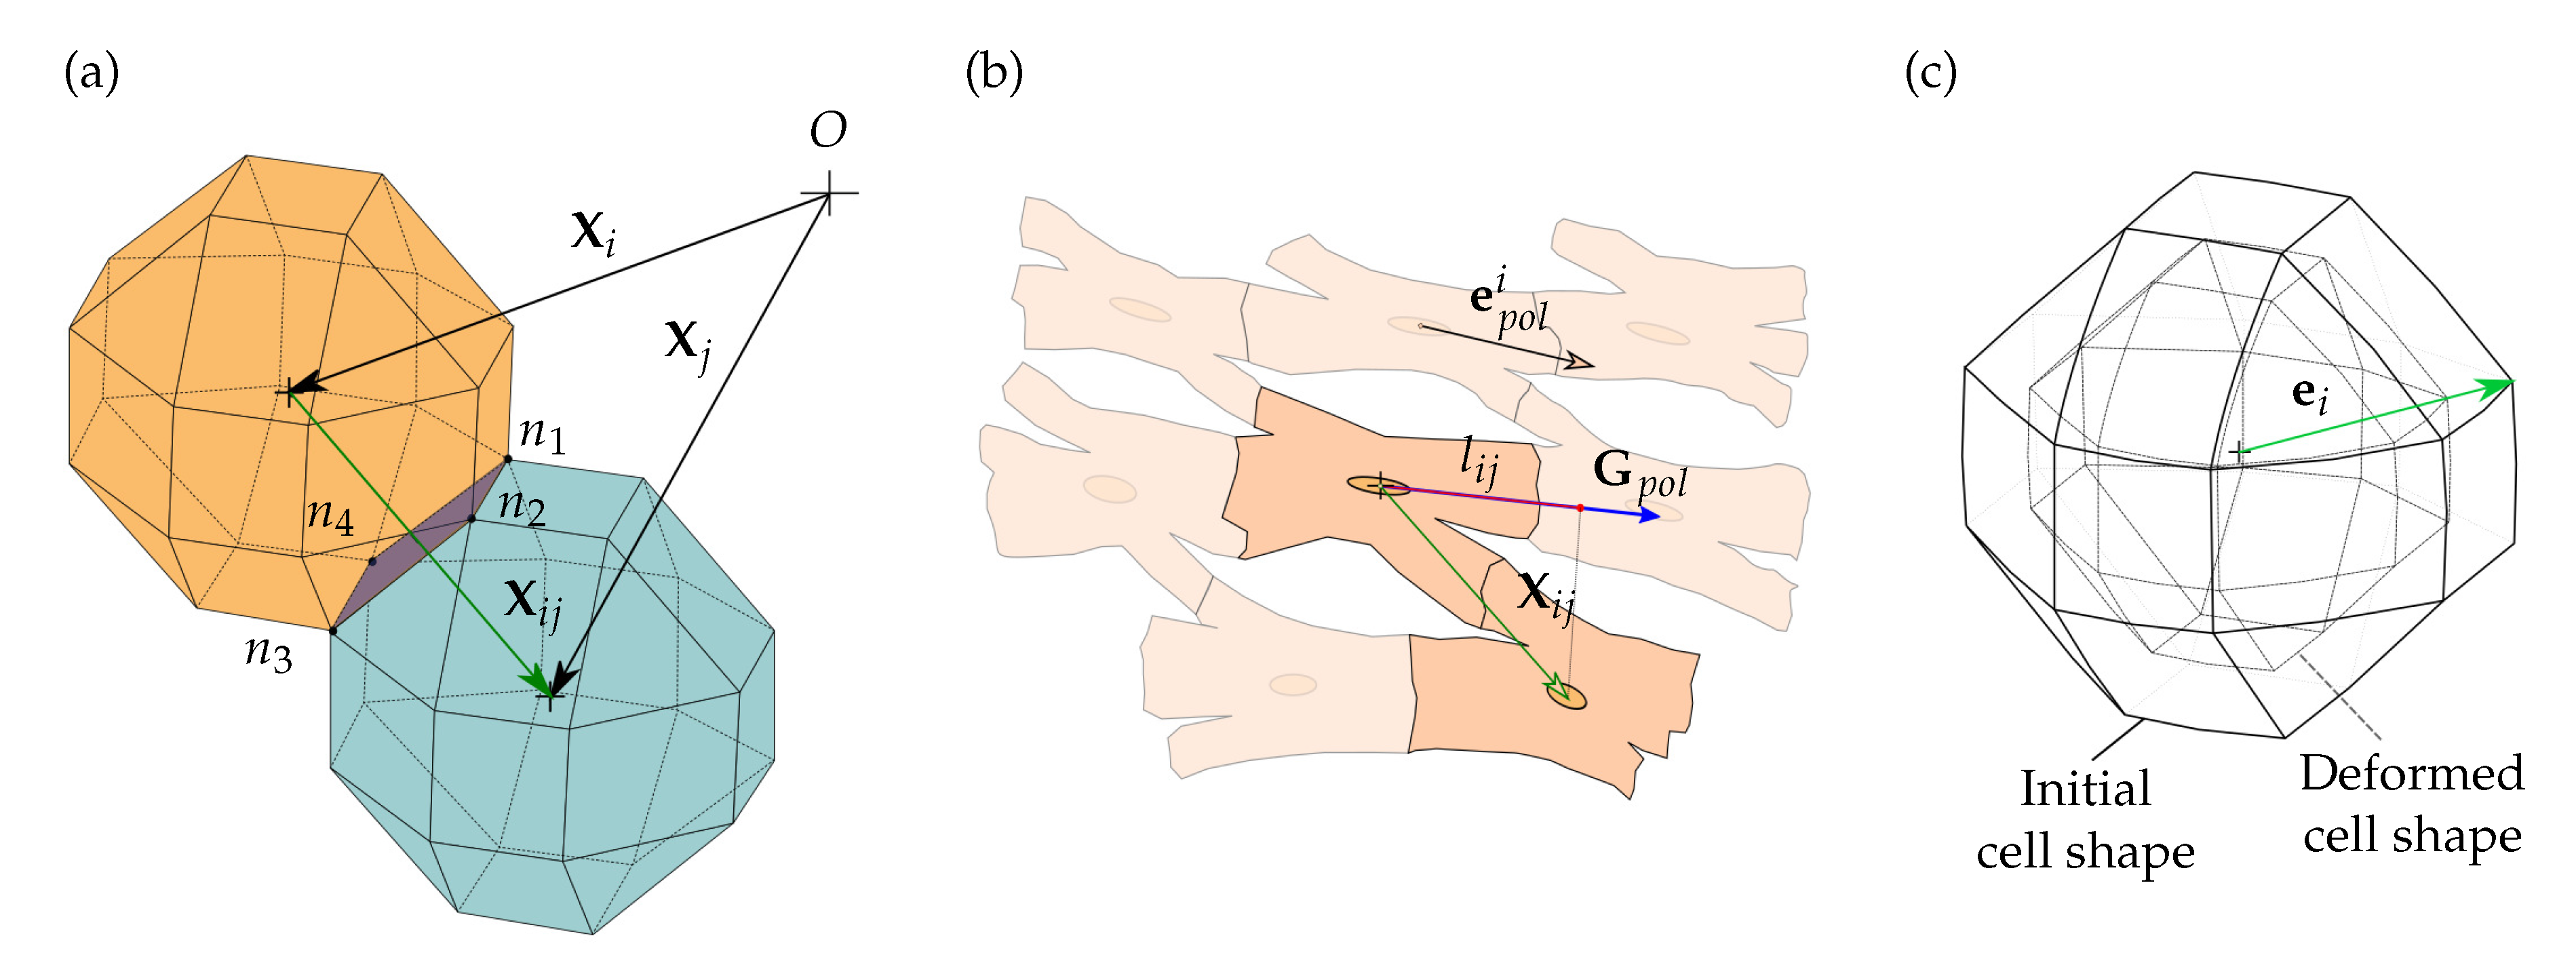
Cells show a collective response different from their individual behavior. Cell-cell interaction has a high impact on processes such as cell proliferation [46,47] and migration [48,49]. Through cell-cell interactions, cells establish intercellular connections by binding, for example, their cytoskeleton through desmosomes, or communicating electronically through gap junctions [50,51,52]. By counterpoint, the cells lose some of the ability to interact with the ECM along the contact surface between two cells. In muscle cells, cell-cell interaction is particularly important, where the final functionality of the tissue depends drastically on the union quality between the cells [24,50]. So, to develop in-vitro muscle tissues, a correct cell guidance to appropriate architectures is desired. Thus, the cell contact vector is defined, for any pair of cells, through the position vectors of these cells (Figure 3a), as [41,43]:
where and are the position vectors of the ith and jth cells, respectively. To avoid cells overlapping, must fulfill .
The direction of cell contact can be defined as:
while the direction of cell polarization can be determined by the mechanical, , and electrical, , stimuli to which the cell is subjected, as:
where and are the direction of the mechanical and electrical stimuli, respectively, calculated as:
and
Cardiac tissues are composed of highly ordered myofibrils, which increase in size, number and complexity during tissue development [3,23,53]. Thus, cells guided by different stimuli in the ECM, polarize and join other cells forming myotubule-like structures. For instance, V. Planat-Bénard et al. studied cardiomyocyte differentiation, observing how cardiac cells differentiate and form myotubule structures after 14 days of cell culture [54]. Besides, as exposed by N. Tahara et al., cardiac precursor migration showed that CM become connected to form coherent epithelia in bilateral cardiac precursor populations [55]. This behavior can be observed in different in-vitro studies [3,15,56,57]. In this context, we define the global polarization direction, , is an indicator of the degree of alignment of the cells, which indicates the major direction on which the cells are structured (Figure 3b). This direction is obtained by evaluating the polarization direction of all cells as:
where
This direction is compared to the cell-cell contact direction to determine the quality of the cell adhesions. Thus, to compare the direction of cell contact, , with the direction of global polarization, , the projection parameter, , has been defined as:
where its value is limited within the range , being 1 if the cell contact vector, , and the global polarization direction, , have the same orientation, and 0 if they are in perpendicular directions.
In addition, let us define the cell junction (CJ) as a parameter that represents the union of appropriately oriented two, or more cells. Thus, when two cells are in contact () and the direction of cell polarization is consistent with the polarization direction of the whole cells (), CJ represents a strong cell contact. represents the minimum bound of the projection parameter to consider cell adhesion which is proposed based on the ultrastructure of cardiac tissues [24,43,50,58].
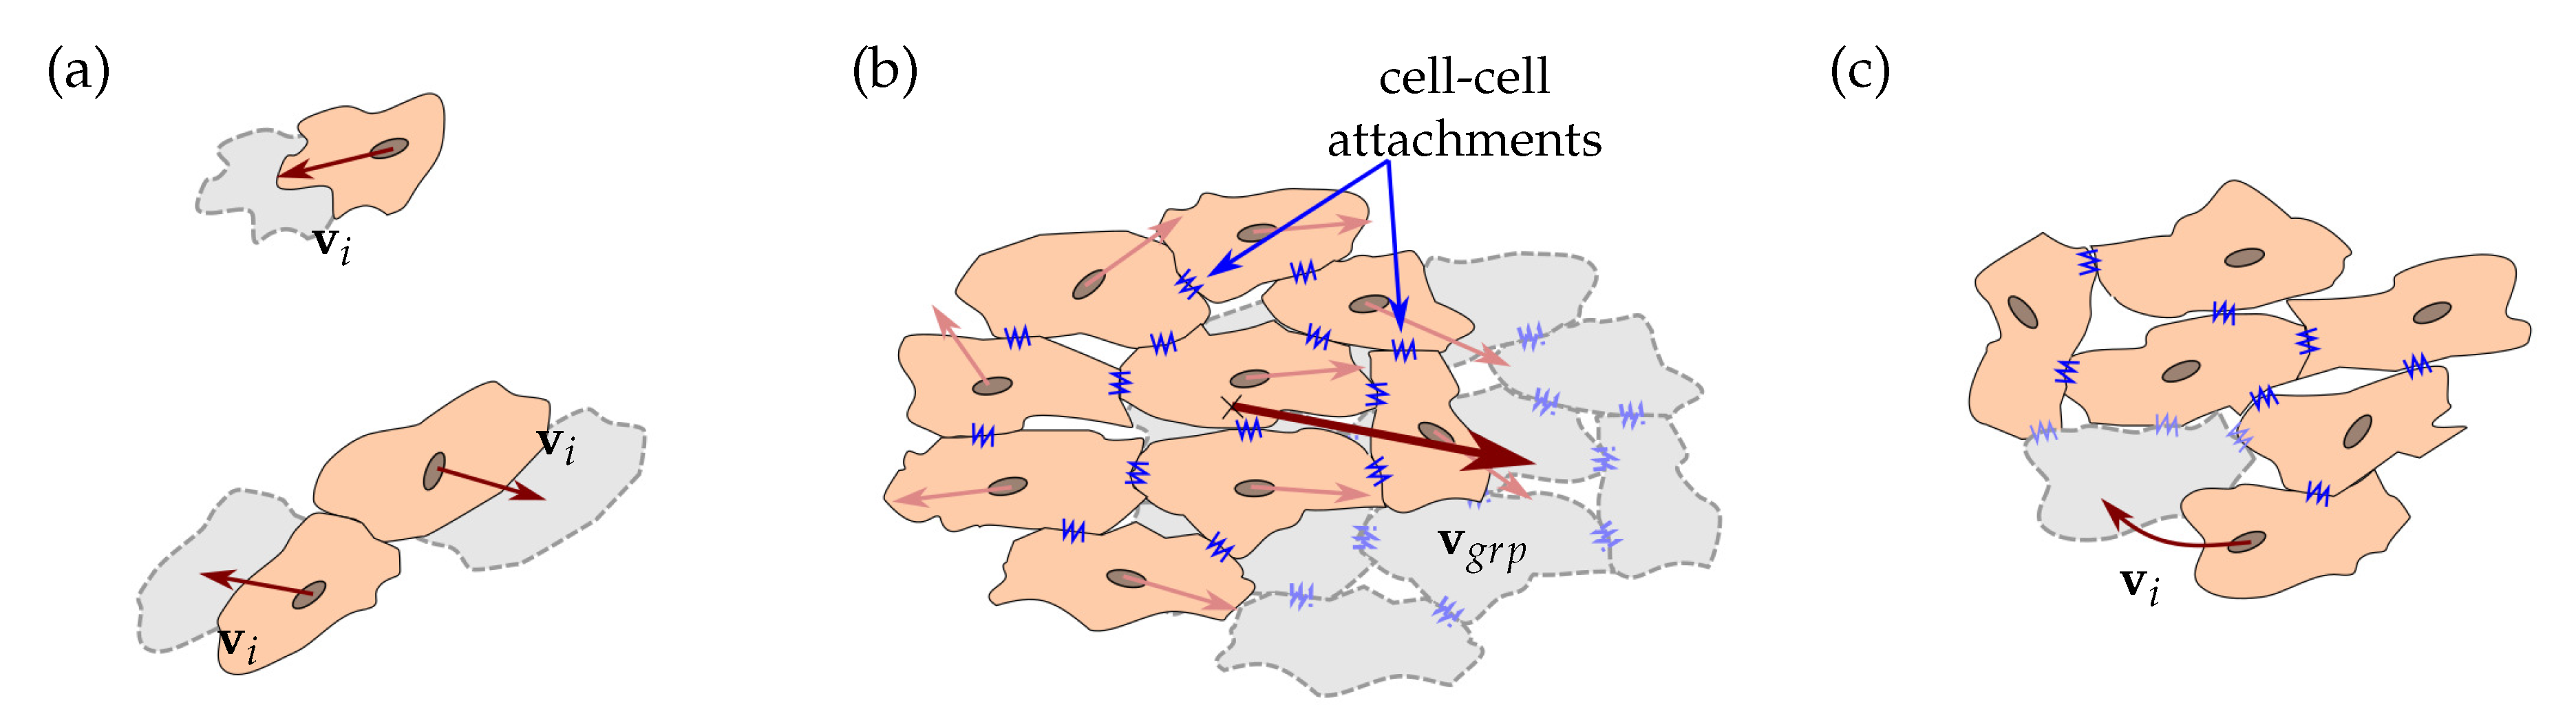
Each cell, through the previously described mechanosensing process, tends to move into a new location (Figure 4a). Nevertheless, cells attached with strong CJ, form groups that tend to remain attached during migration [22,59]. Each cell tends to drag the cells to which it is attached. This effect generated by each cell in the group causes a collective migration behavior (Figure 4b). In this case, a new equilibrium is established by [43]:
where , , are corresponding to the contributions of the mechanical, electrical, and protrusion forces, respectively, of each ith cell in the group. corresponds to the drag force of the group, which can be calculated by [43]:
where and are the equivalent radius and the velocity of the group, respectively. is a shape factor, due to the irregular shape of the group, calculated as [30,43,60]:
where , , and , correspond to the maximum, medium, and minimum dimensions of the group, respectively, which is defined in an orthogonal coordinate system.
Furthermore, cells can also be relocated to new positions, more favorable, within the same group. After evaluating the translocation of the group, if the group does not move, the individual migration of the cells of this group is evaluated, . In this case, if a cell has the capacity to migrate to a new, and available, position within the group, then, it is relocated into that new position (Figure 4c). Thus, the cells belonging to a group can migrate with the group, or relocate within it [22,43,61].
2.3. Cell Fate
The mechanical properties of the ECM not only affect cell migration but also are important for processes such as cell maturation, proliferation, and apoptosis. In the case of cardiac cells, the mechano-electric conditions to which they are subjected during their maturation are key in the development of functional tissues [11]. For instance, under different mechanical stimuli, cells mature at different rates, showing faster maturation in stiffer ECMs [62,63,64]. To include the effect of the mechanical stimulus, , to which a cell is subjected at each instant of time, t, based on its internal deformation, , the mechanical stimulus can be defined as (see Figure 3c) [28,65]:
where and are the cell internal deformation and the position vector, respectively, of the ith node of the cell, and n is the number of nodes in which the cell has been discretized.
The cell maturation time, , which is the time necessary for a cell to reach the necessary level of maturity to proliferate, is obtained for each cell at each time step, considering the mechanical stimulus, , as:
where is the minimum time needed to maturate. is a time proportionality factor, which depends on the mechanical stimulus.
To define the status of maturation of each cell, we have defined a Maturation Index (MI) as:
When maturity is reached, , the cell has the possibility of proliferating. However, the proliferation capacity of cardiac cells is limited [66,67], and closely related to the cell-cycle arrest and cell junctions [23,68]. In this model, an adaptive cell phenotype is considered. In this way, cardiac cells, initially considered as CM in the early stages of maturation (early CM), and upon reaching the maturity state, , can advance in the maturity of their cardiac phenotype, and reach the state of adult CM (late CM). This phenotype change is associated with the ability of cells to form stable cell-cell adhesions [23,54,68]. In fact, adult CM are highly ordered in stable myofibrils, which prevents cell division [23]. Thus, CM proliferation is closely related to cell maturation and cell-cell adhesions [23]. In this way, early CM retains the capability of proliferating where an adult CM is considered post-mitotic and do not proliferate [23,67,69].
Thus, cell proliferation has been defined as a function of the number of CJ, which defines the formation of cell-cell stable adhesions, and the MI, which defines the cell-cycle status. Whereas, a cell fully incorporated into a chain undergoes cell-cycle arrest, which blocked cell proliferation. In contrast, free cells, or partially attached to a chain, maintain their proliferation capacity due to its consideration as early CM phenotype. This process is defined by the following equation:
where is the number of cell junctions of the ith cell, and is the number of cell junctions that promotes cell-cycle arrest [70]. Thus, if the cell is partially surrounded, means attached to at least 4 other cells (), which corresponds to the 50% of the maximum possible CJ due to the model discretization, cardiac cell phenotype is considered to achieve an adult phenotype and cell proliferation is inhibited [43].
Once a cell proliferates, it generates two daughter cells. The locations of these new cells have been defined as:
where , , and , are the coordinates vectors of the mother cell, the first and the second daughters, respectively. is a randomly generated unit vector.
2.4. Computational Model
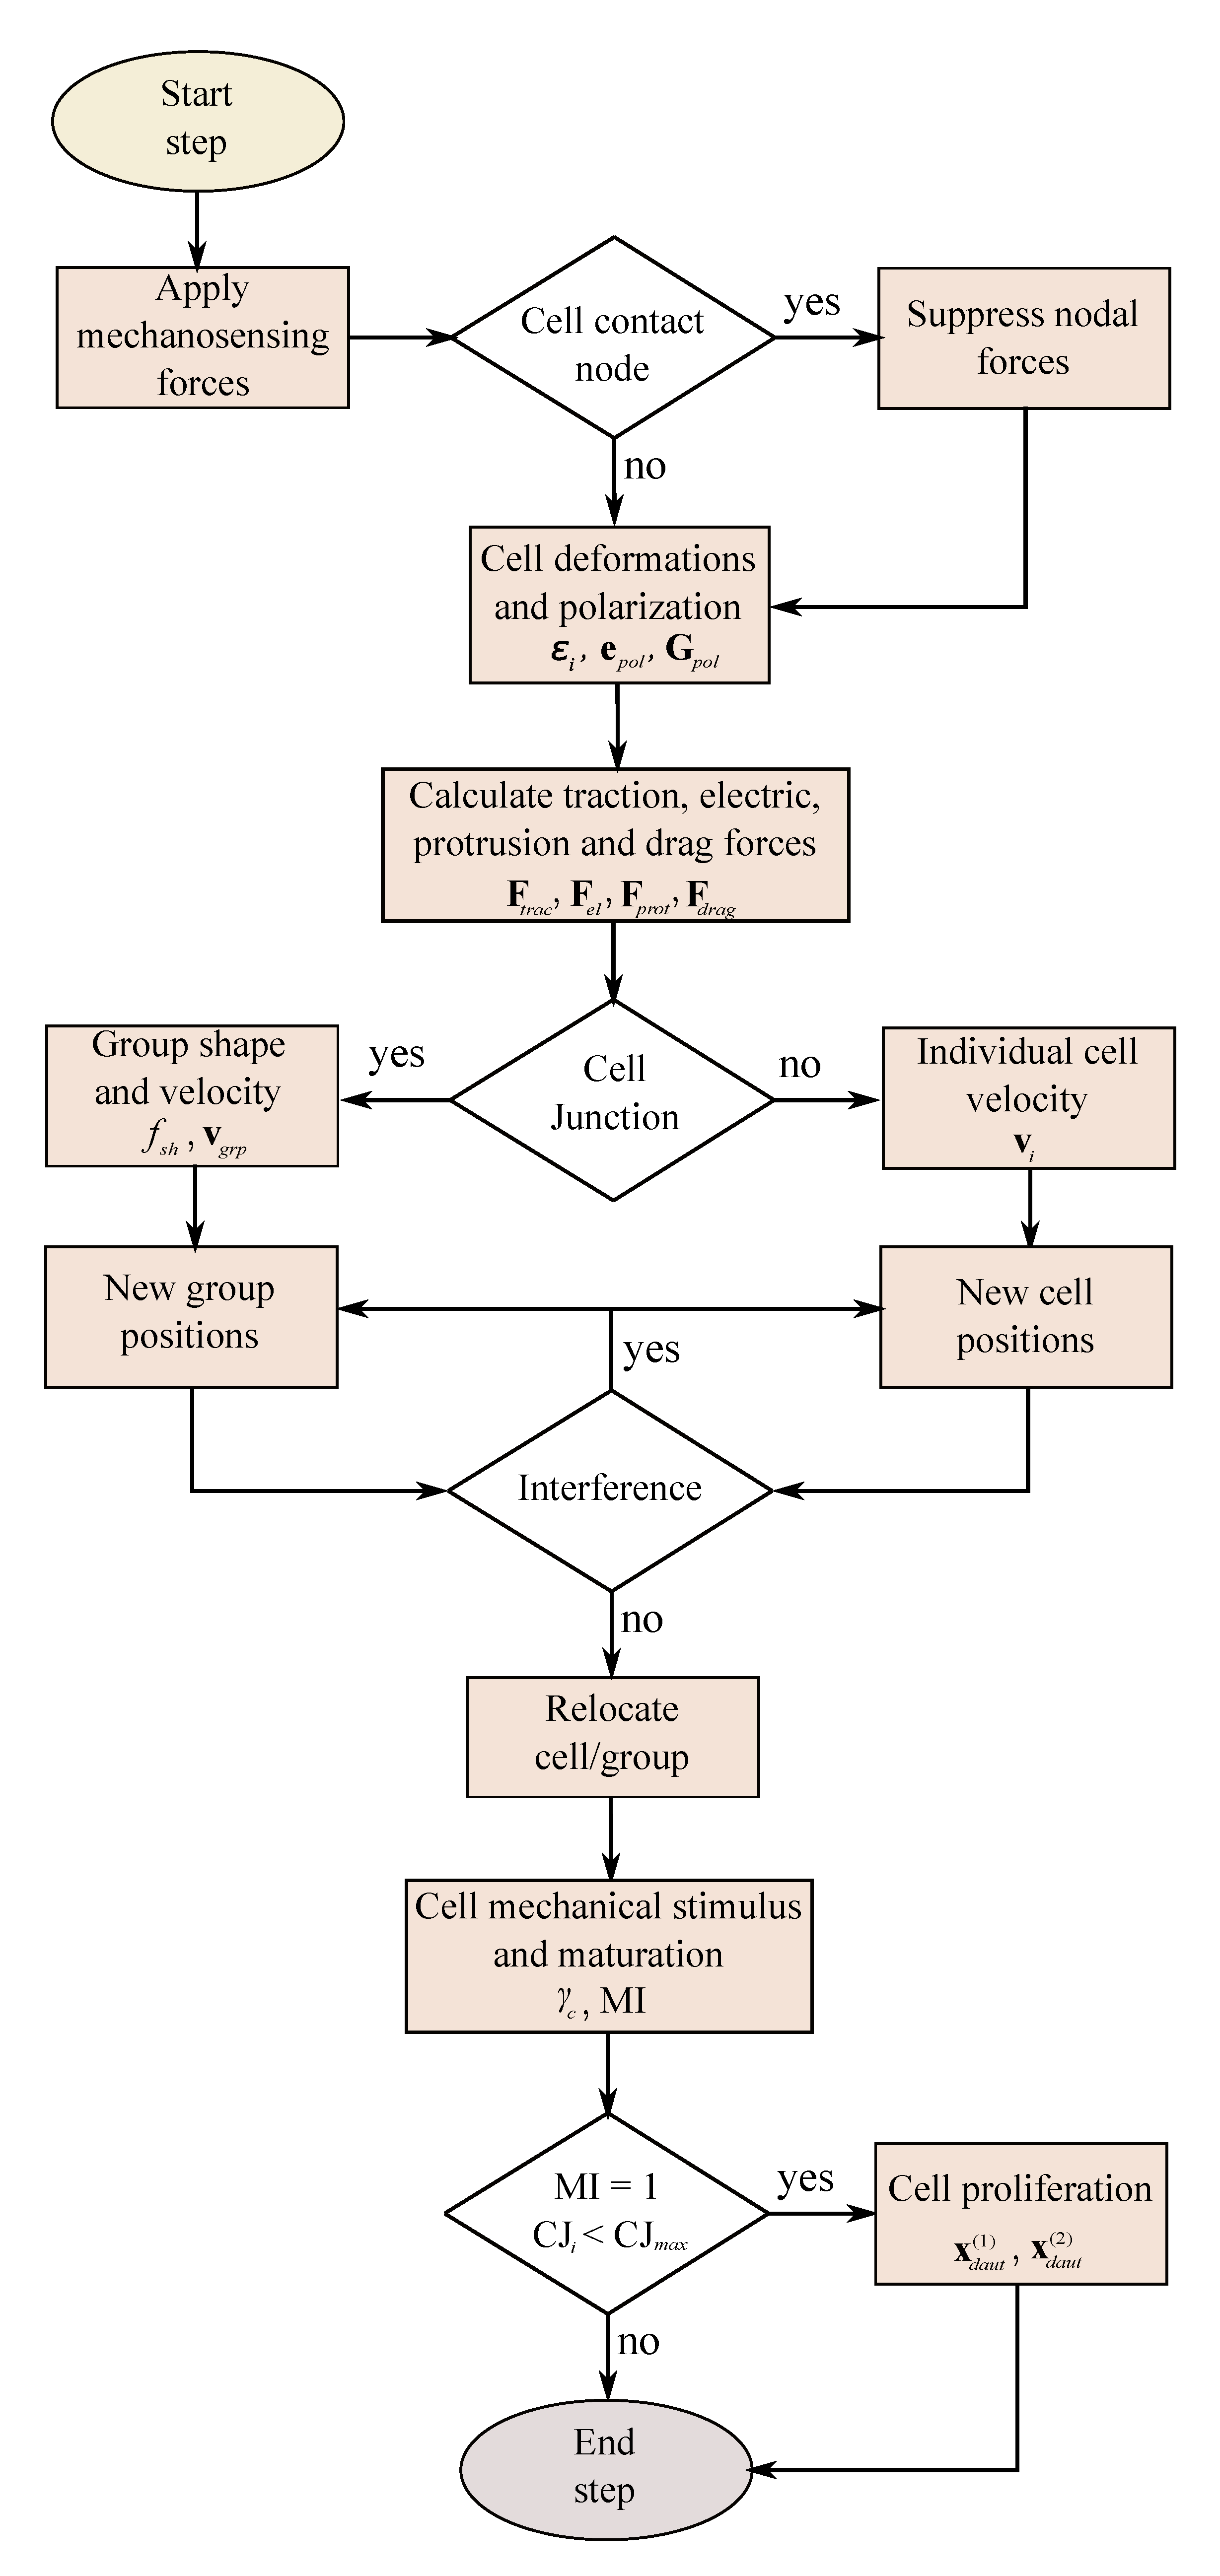
The model has been implemented via a user-defined subroutine within the commercial Finite Element software Abaqus Dassault Systems (UELMAT) [71]. Within this subroutine, the cell has been defined as a discretized quasi-spherical element with 24 nodes located in the cell membrane (see Figure 3a). The ECM, with which the cell interacts, is defined through trilinear hexahedral elements, with dimensions of . The model has 128,000 elements and 136,161 nodes. Each calculation step is equivalent to 0.8 h of cell-ECM interaction, analyzing a total of 160 h in each experiment. The ECM has been considered as a linear elastic material. The model algorithm is described in Figure 5, and the employed parameters have been detailed in Table 1.
3. Results
A series of experiments have been developed to calibrate and compare the model results with those obtained from the bibliography. For this aim, a rigidity range equivalent to that is used in the bibliography for cardiac cell culture (10–40 ) [11,50,78,83] has been considered. Additionally, a determined range of electric field (50–350 ) has been chosen based on the data available in the bibliography, avoiding intensities that could cause cell damage [18,84,85]. In all the cases, the electric field is applied in the longitudinal direction.
To study the variability of the results, for each case, 10 repetitions with different initial random cell distributions have been generated. For representations issue, the average value of the results of these 10 repetitions has been calculated.
3.1. Continuous Mechano-Electric Stimulation
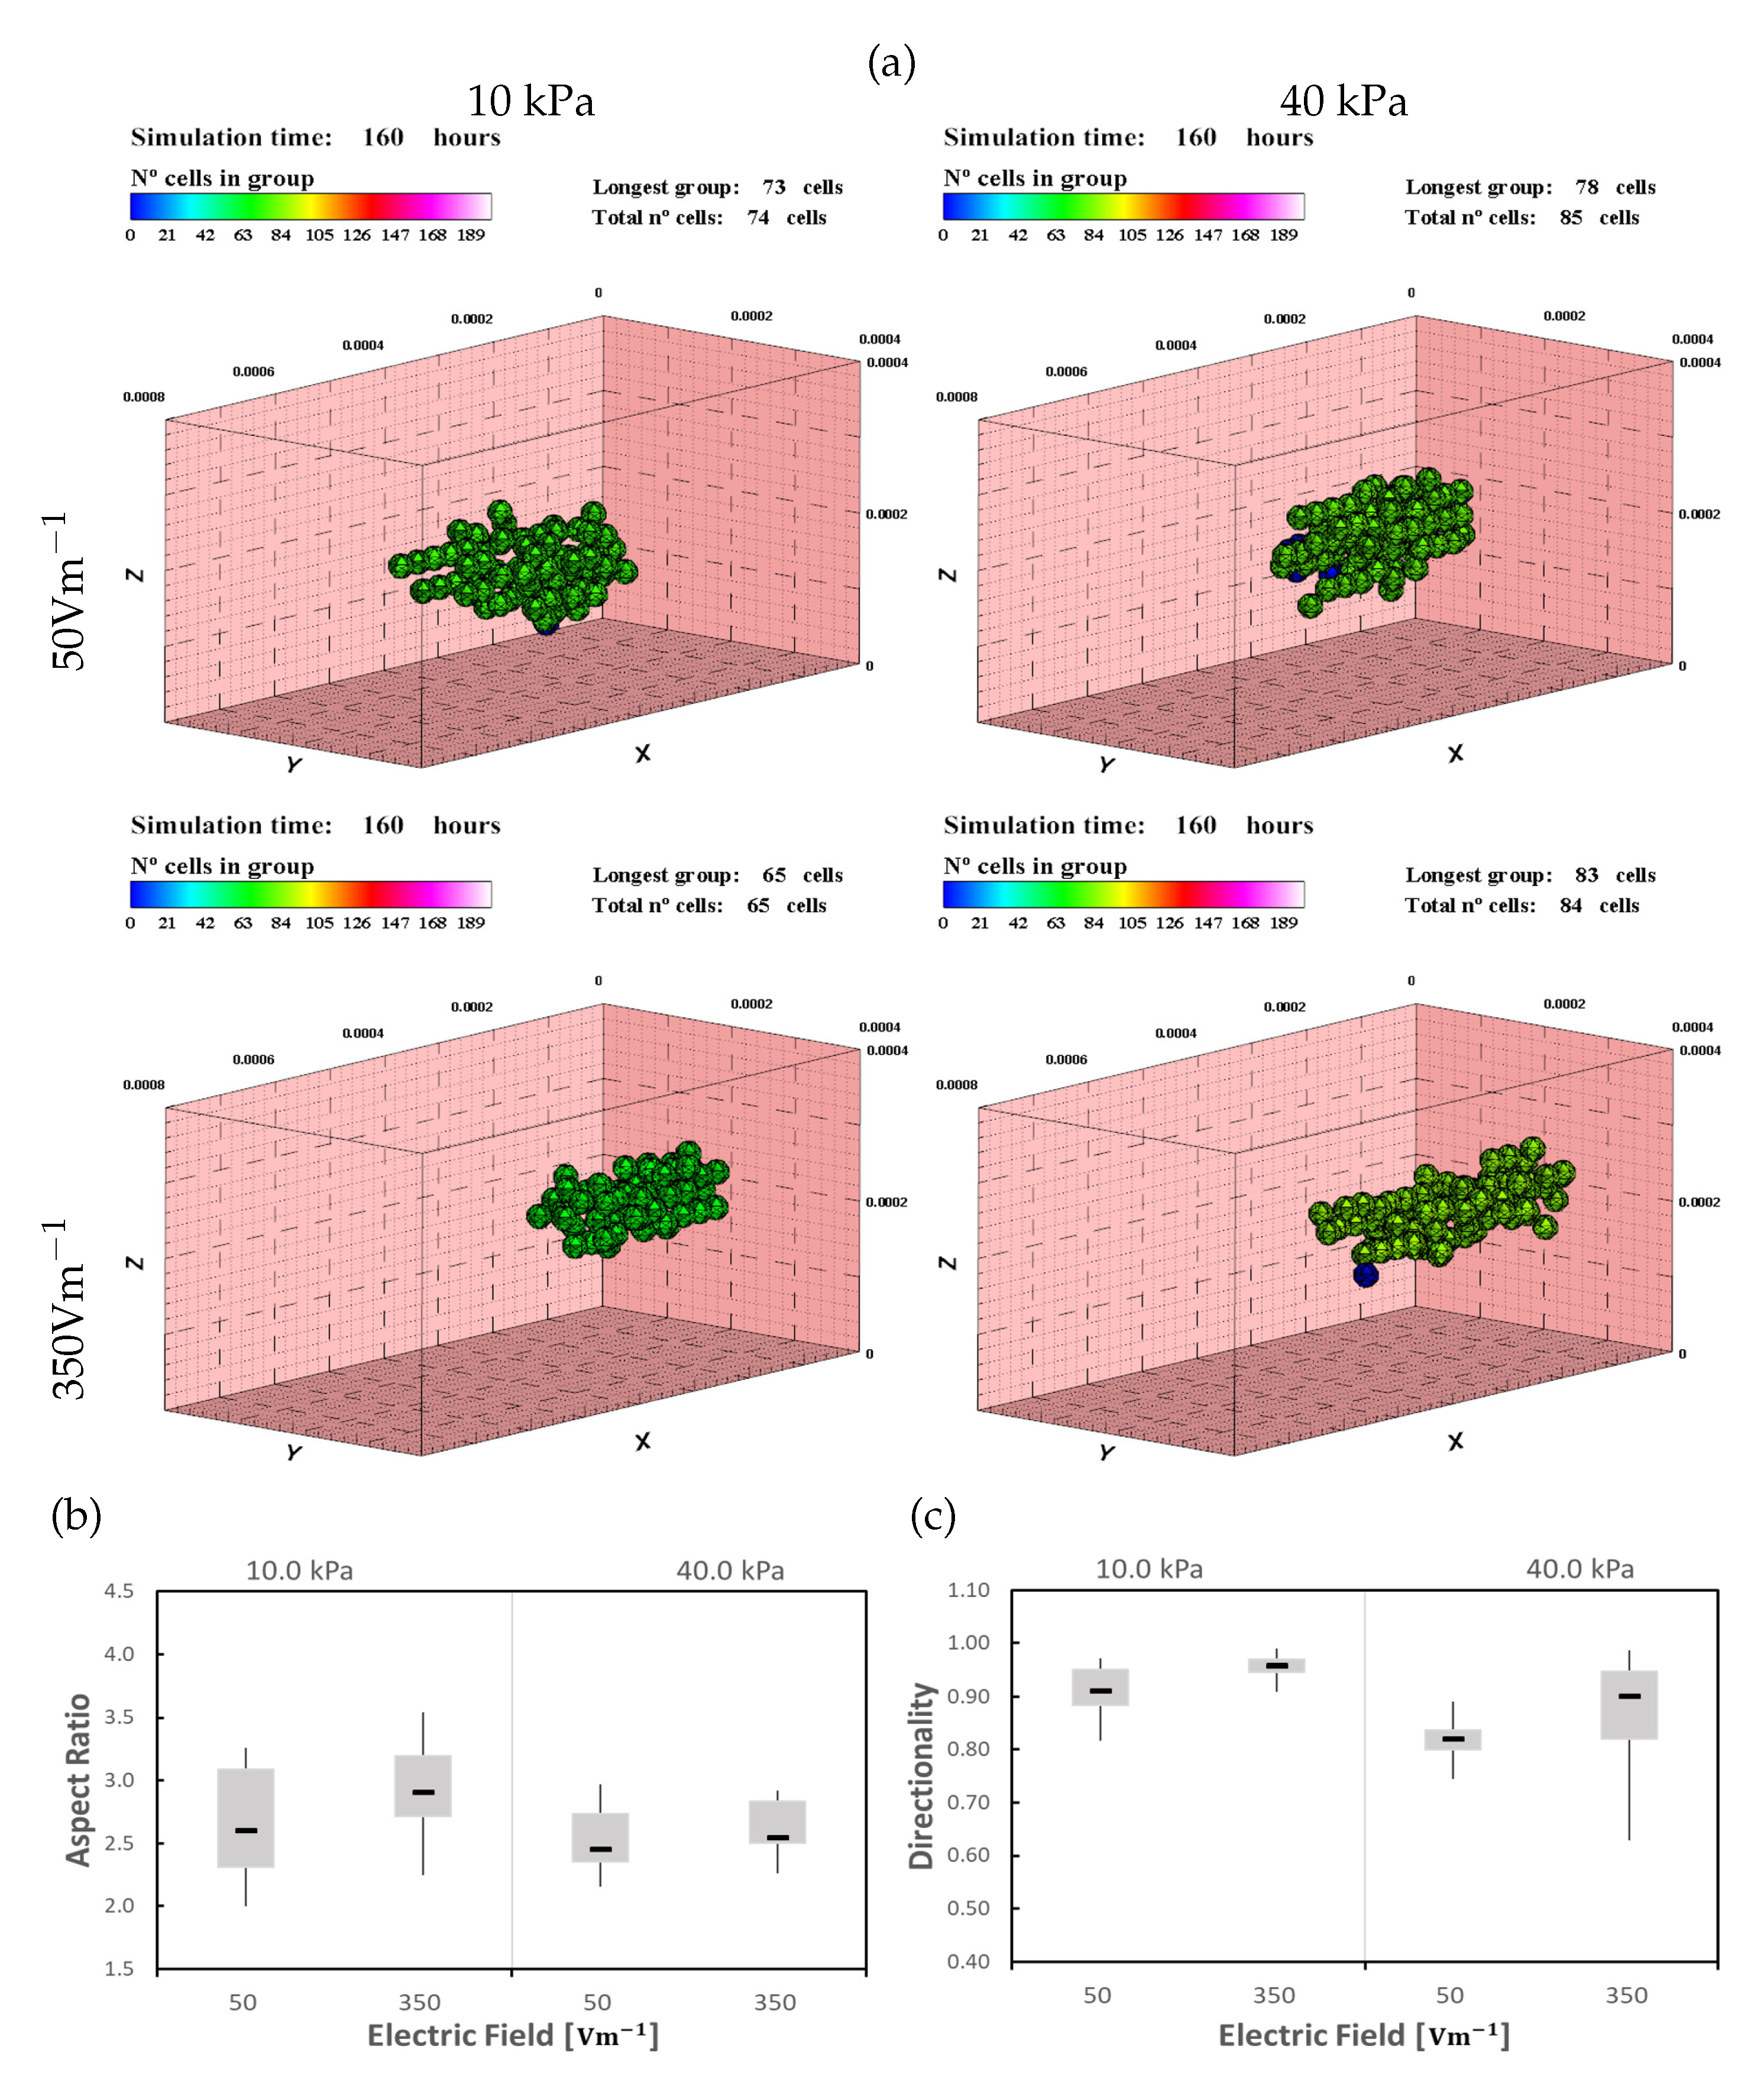
In the first experiment, the effect induced by a constant electric field on cells is studied. Initially, 40 cells have been randomly distributed in the ECM. Their behavior has been monitored for 160 h. Different experiments with stiffnesses of 10, 20, 30, and 40 kPa combined with electric field strengths of 50, 150, 250, and 350 , with a total of 16 different configurations have been prepared. In this case, the interaction of two effects on the cell and its variation is observed by changing the stiffness and the intensity of the electric field. As observed in previous works of our group [40,43], cells tend to occupy the center of the ECM guided by mechanical stimulation, being the area where the cells undergo less internal deformations. The presence of a unidirectional ES guides the cells in the direction of the electric field, while the different stiffness generate a wide range of possible results. For high stiffness, the effects related to the mechanotaxis tend to be high, with a greater tendency of the cells to migrate towards the center of the substrate. In the same way, for high ES cases, a high drag effect of the cells is generated by the galvanotaxis. The final location of the cells depends on the intensity of both stimuli.
A differentiated effect is observed for different stiffnesses, with a higher impact of the ES in lower rigidity ECMs. As the ES increases, cells show an increase in the alignment in the longitudinal direction as well as a high migration tendency in the direction of the electric field. For the maximum ES, cells are rapidly dragged by the ES, hindering cell-cell interaction (Figure 6).
As the stiffness increases, the impact of the ES seems to decrease slightly, but general behavior is maintained. For the ECM, cells only remain in the center of the substrate for the minimum ES (). In ECM, where the mechanical stimulus is higher, the cells remain in the center of the ECM for higher electric field strengths (above ). Thus, as stiffness increases the ES and the mechanical stimuli seem to be better balanced, obtaining, in general, better results (Figure 6). In all the cases, the increase in the ES generates a higher cells attraction in the direction of the electric field. Thus the electric field increases the directionality of the cell migration toward the direction of the ES, which is consistent with the bibliography [18,84]. The speed with which the cells are attracted to the electric field also depends on the stiffness of the ECM, being the lower the stiffness the higher the ES attraction. Besides, directionality is dependent on the ES strength as was reported by B. Frederich et al. [18]. At the same time, the effect of mechanical stimulation on maturation increases the number of cells at the end of the simulation as the stiffness increases. The coupled of these two effects generate groups with a higher number of cells, maintaining a good degree of cell alignment.
To evaluate the alignment effects in group’s morphology, we define an Aspect Ratio (AR) parameter by comparing the geometry of the groups. Thus, AR is defined, considering the main group’s geometry in each simulation, as:
where , , and are the longitudinal group length, in X direction, and the transversal group length, in Y and Z directions, respectively. In addition, the directionality of the cells is controlled by the global polarization vector, .
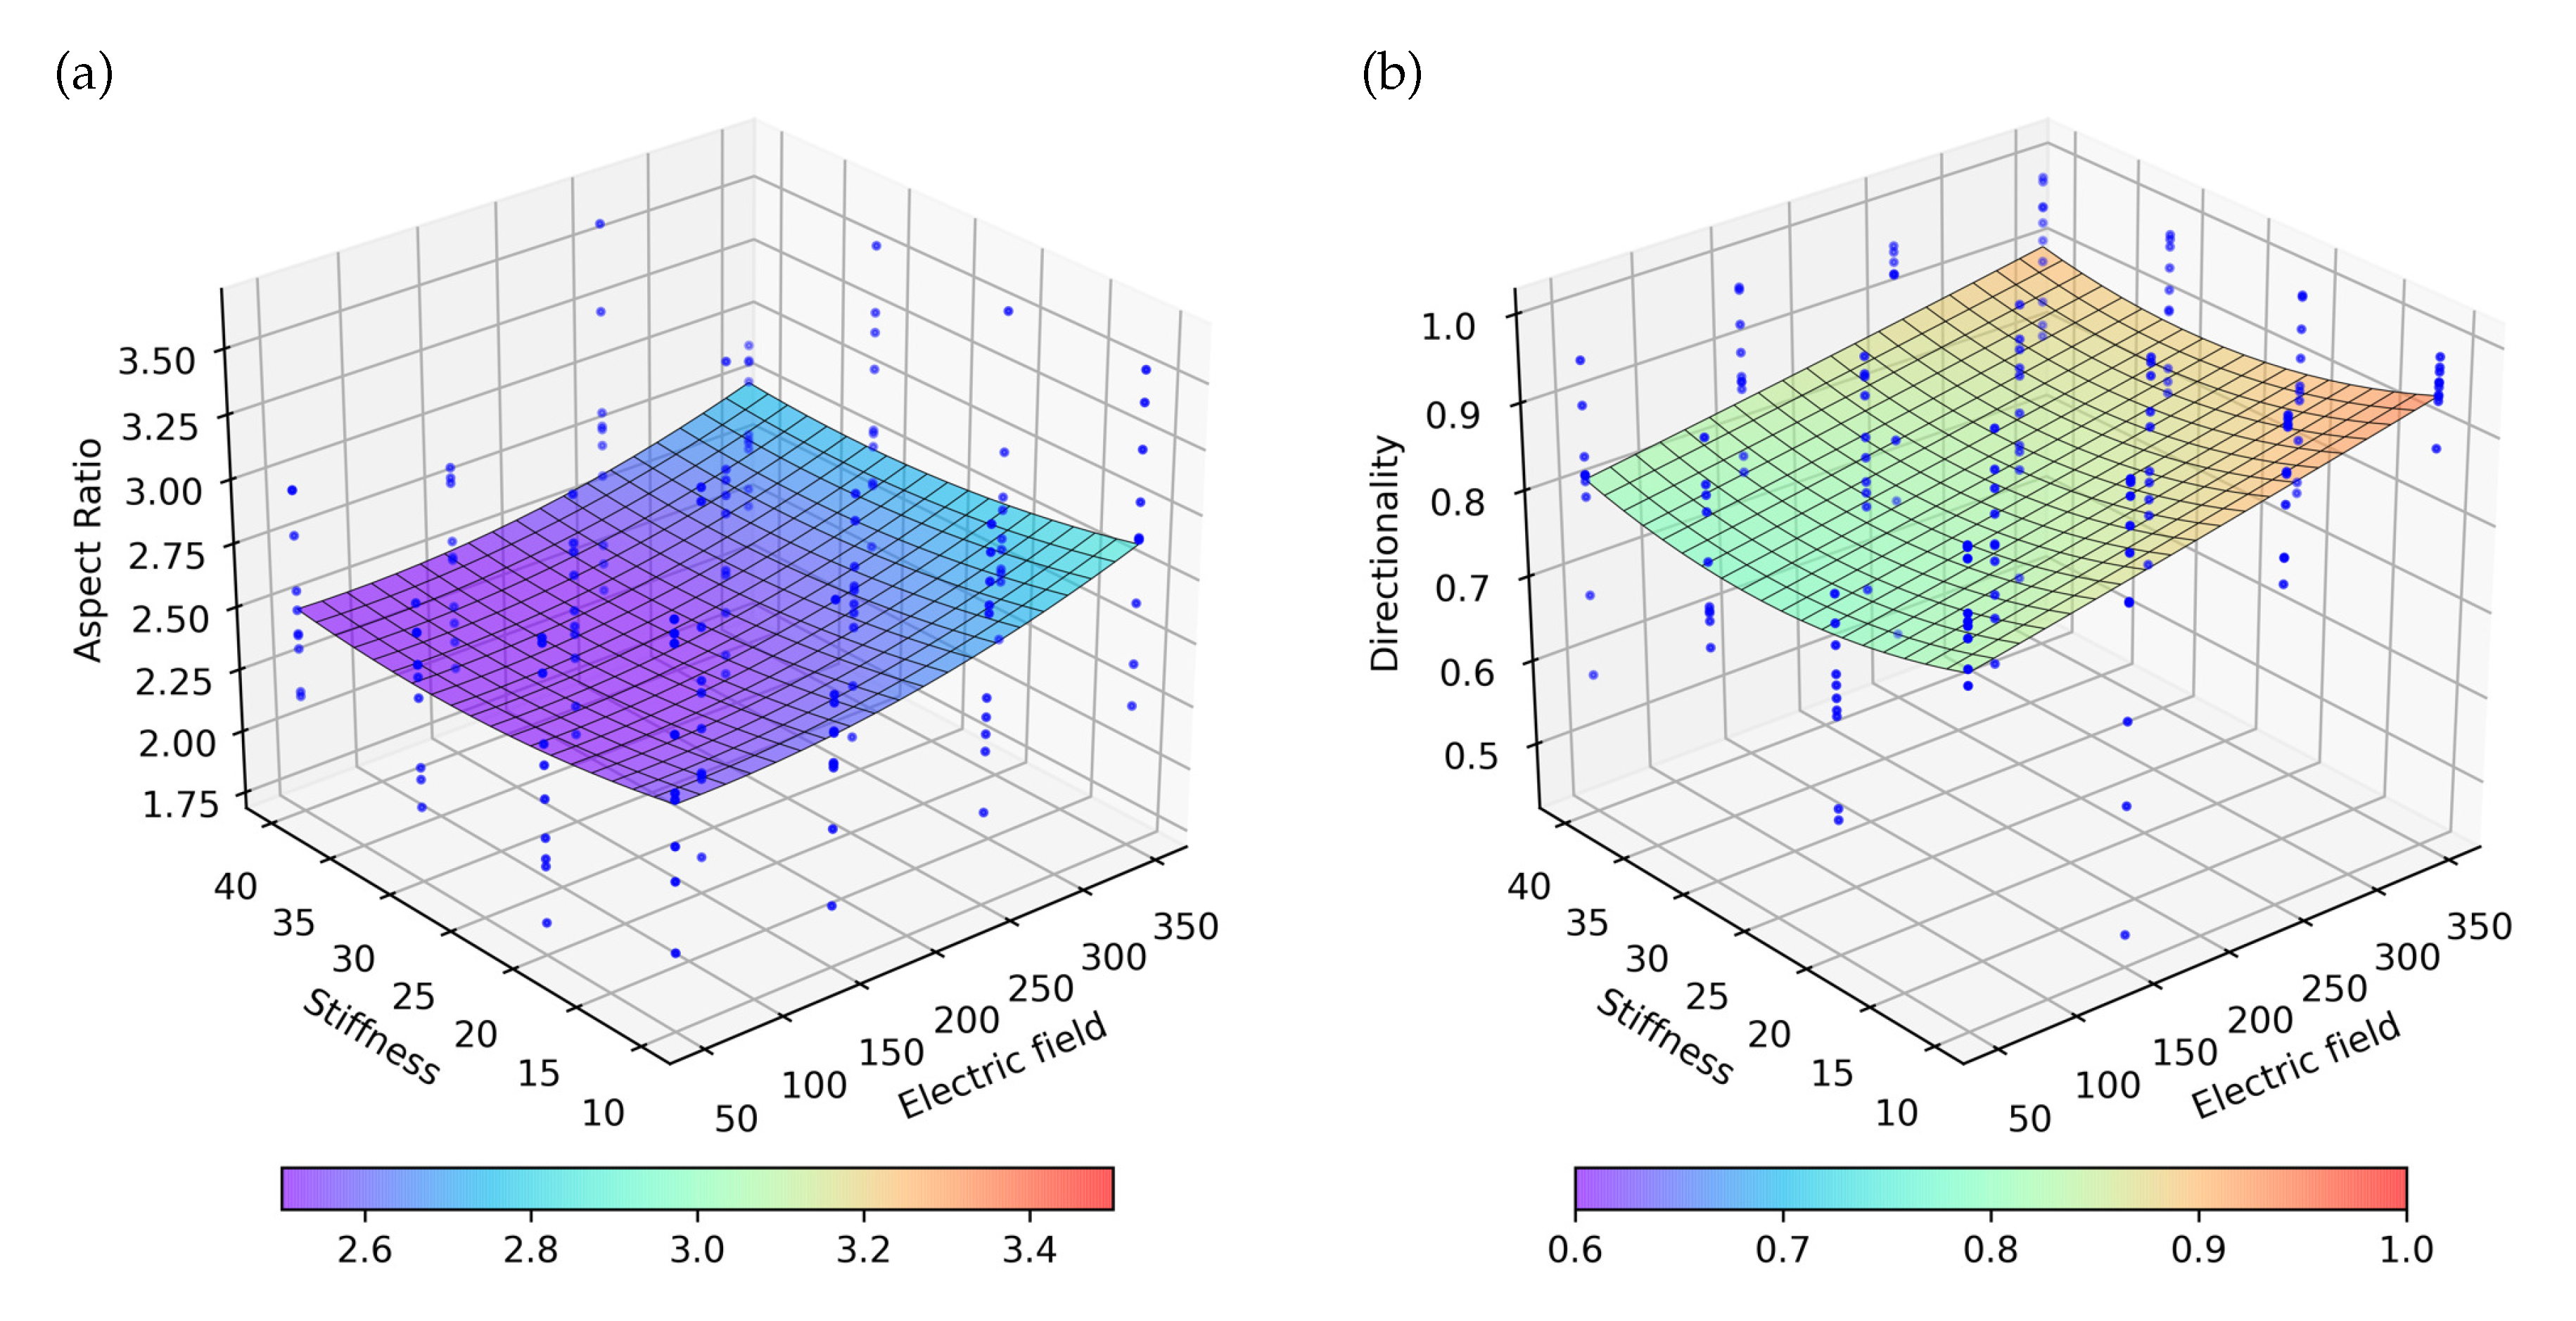
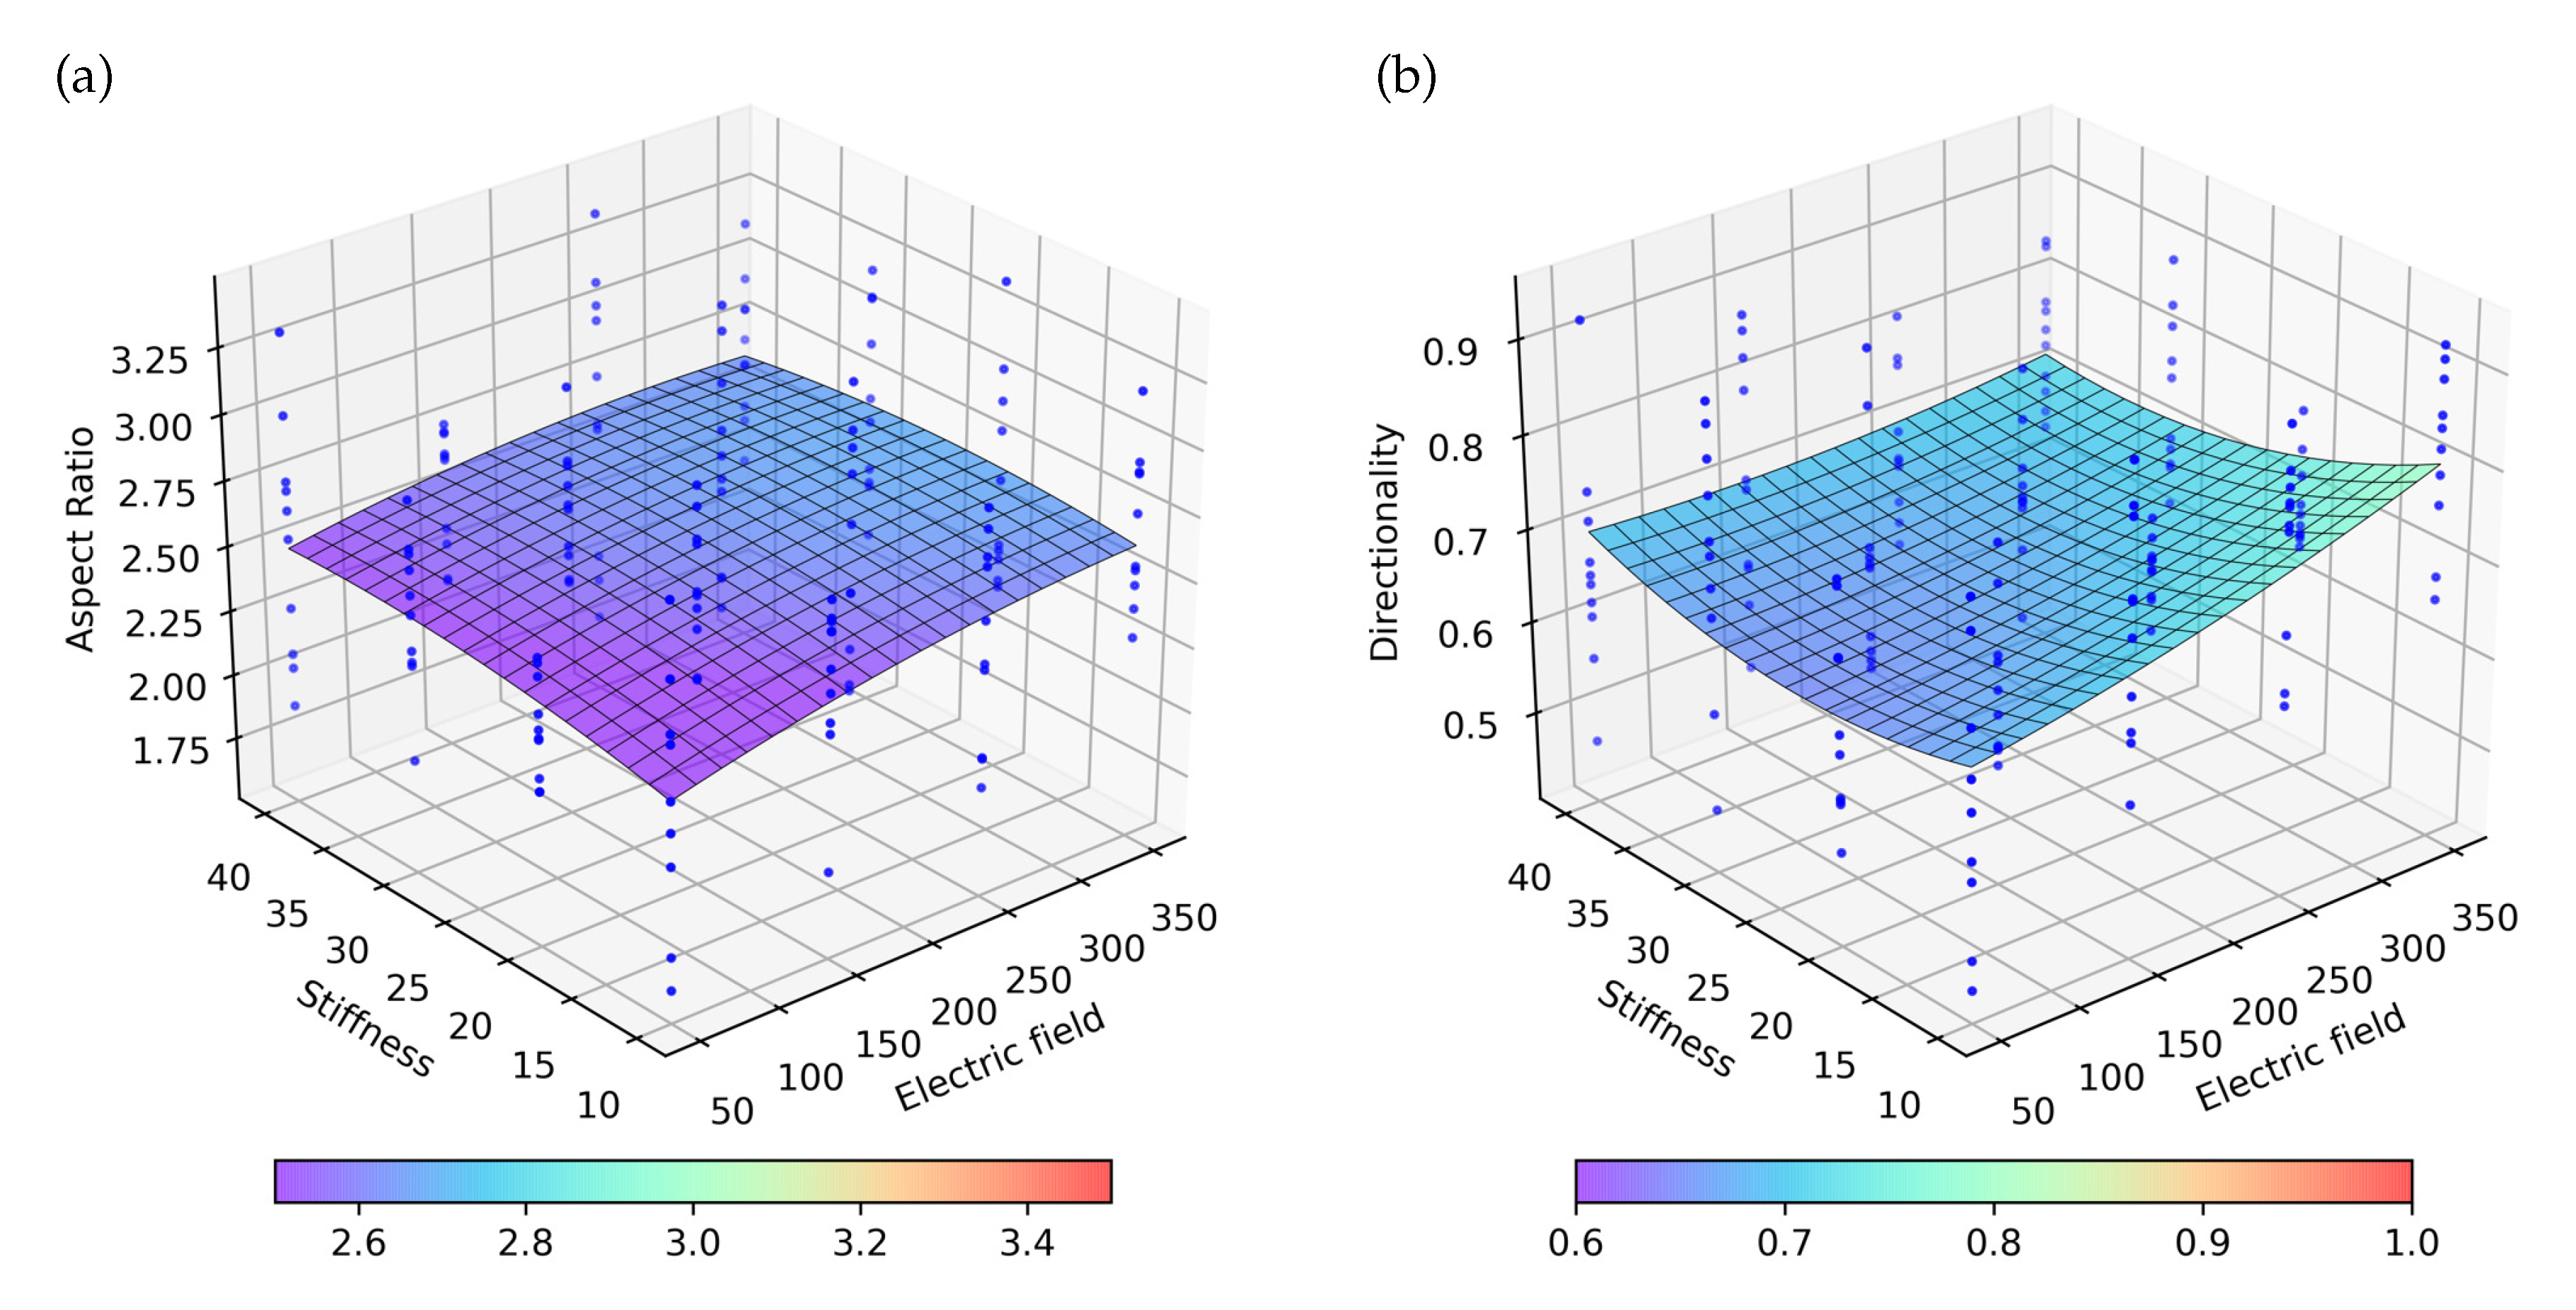
Analyzing the effect of the stiffness and ES on the AR, it is observed that the electrical effects are much higher than the stiffness. Likewise, the variation of AR seems to have a linear dependence with the electric field intensity (Figure 7a). The effects of the stiffness on the AR are comparatively low, with higher AR being observed for low stiffness. Similarly, in the directionality analysis, a greater effect of the ES is observed in comparison with the effect of stiffness (Figure 7b). As with the AR, the directionality is shown to be higher for cases of less rigidity and a higher electric field.
3.2. Pulsatory Mechano-Electric Stimulation
In in-vitro experiments, the ES can be applied to mimic the physiological electrical currents of the heart [17,84,85]. This is a primarily intended to activate and coordinate the spontaneous contraction of the AM apparatus. These currents are of a pulsating type and low frequency. For instance, S. Pietronave et al. observed an increase in the cell alignment and the expression of specific cardiac markers while stimulating CPCs with monophasic and biphasic electric fields [84]. This is also supported by M. Radisic et al. work, where cardiac myocytes were stimulated with monophasic electric fields, showing an increase of the cell alignment, with myofibers aligned in the direction of the electric field application, and ultrastructural improvement with formed GAP junctions and contractile activity within the cells after five days [17]. In this way, we also tried to study the stimulation of the cells with monophasic electric fields. So, an electric pulsatory field is applied during the simulation to study and compare the effect of different ways of stimulation on cell behavior and group’s morphologies.
In this case, the electric field is applied discontinuously with the same configurations of stiffnesses (10, 20, 30, and 40 kPa), electric fields (50, 150, 250, and 350 ), and initially random distributed 40 cells. The electric field is initially active and then it alternates its activation at each step (on/off).
The general behavior of the cells, observed in the previous experiment, is maintained (Figure 8). During the steps in which the electric field is active, the cells tend to migrate in the direction of the electric field, which is consistent with the bibliography [17,18,84]. In the steps in which the electric field is disabled, the cells, due to mechanical stimulation, tend to migrate toward the center of the ECM as it was seen in a previous work of our group [43]. These two effects slow down the migration to the outer surface of the ECM. Thus, compared with the previous experiment, the effects of the electric field are less pronounced.
As in the previous case, the ES is more intensive in low stiffness ECM, showing higher values of the directionality (Figure 8c and Figure 9b). On the contrary, the results for the AR seems to be balanced for all ECM stiffness (Figure 9a). In this second experiment, the dependence of the AR with the ES seems to follow a linear tendency (Figure 9a). The maximum values of the AR, obtained with the maximum ES, seem to be reduced compared with the previous experiment. However, in the visual comparison of the results, a good level of cell alignment is observed for high levels of ES, avoiding excessive drag of the cells towards the surface of the ECM (Figure 8).
3.3. Alternating Mechano-Electric Stimulation
The cells not only can be stimulated by a discontinuous electric field, as mentioned in the previous case, but also by alternating electric field [11]. Thus, in the third experiment, the application of an alternating electric field is considered. For this purpose, the direction of the electric field has been reversed at each step. As in the previous cases, stiffnesses of 10, 20, 30, and 40 kPa, and electric fields of 50, 150, 250, and 350 are applied on 40 cells initially randomly distributed. Having in account that prolonged exposure to high-intensity electric fields can trigger cell apoptosis [18,20], cell-cell and cell-ECM interactions are studied during 160 h of simulation.
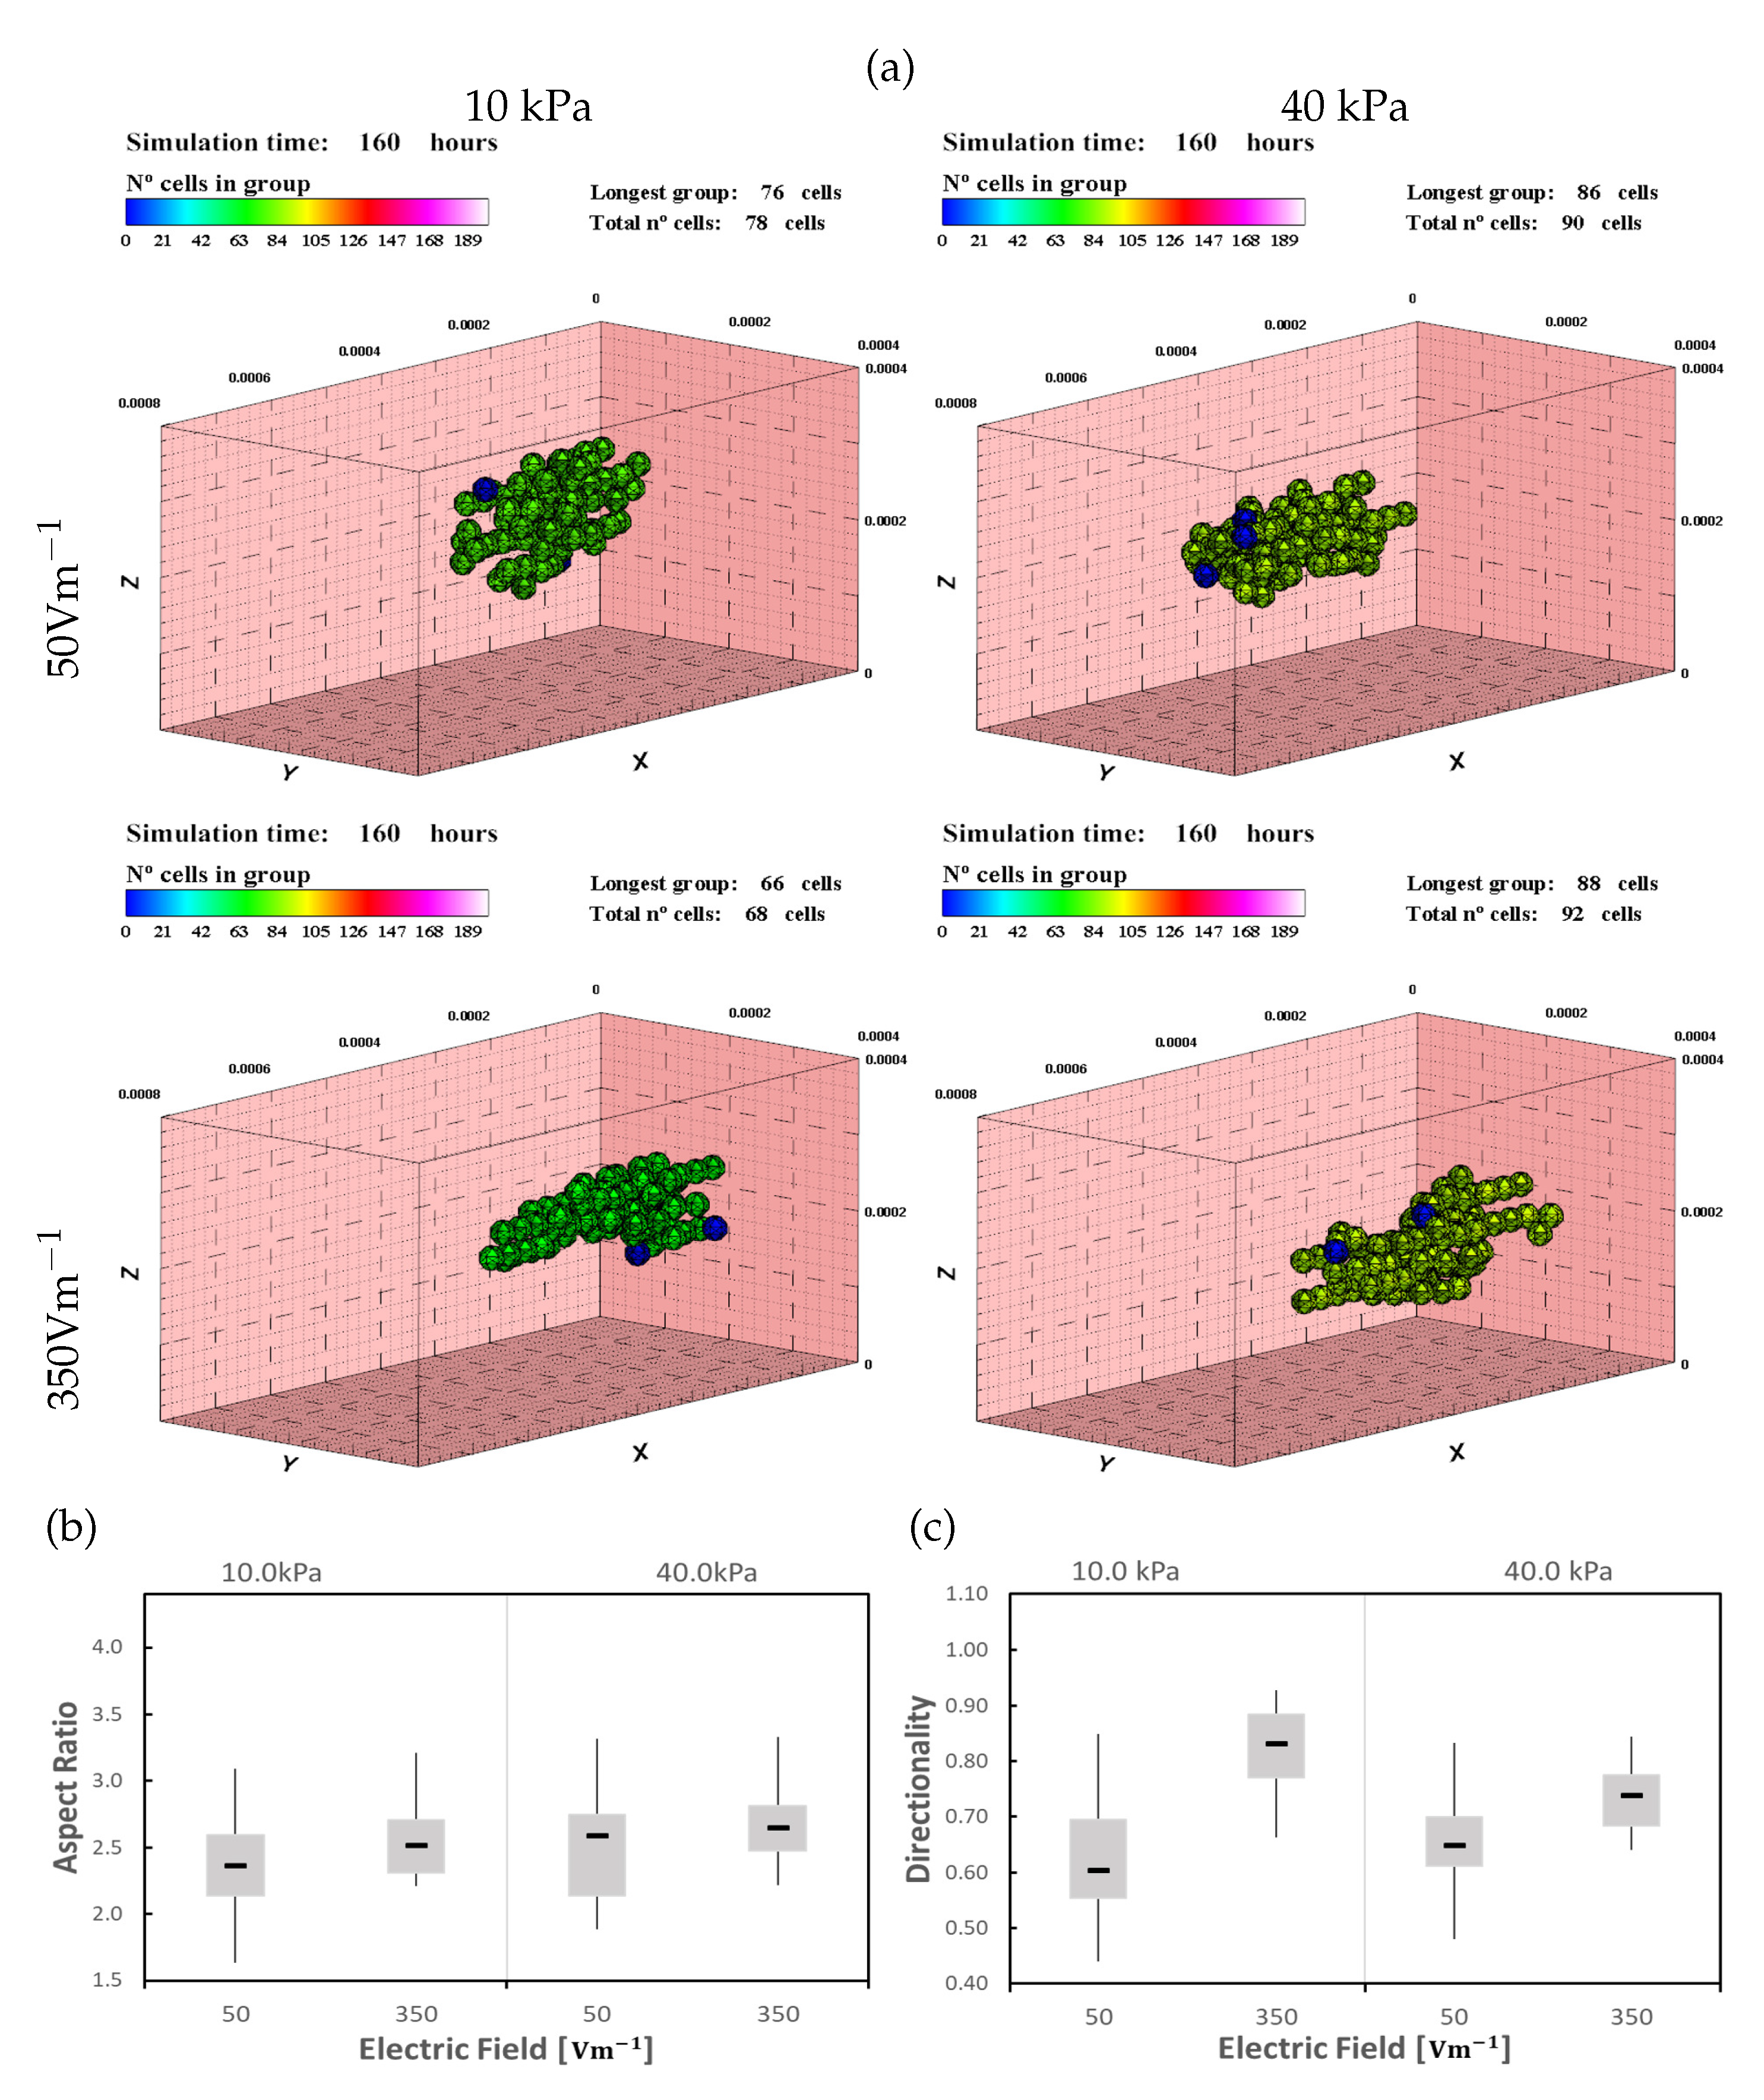
In this case, the electric field guides cells to move alternately in the longitudinal direction while the mechanical stimulation guides cells toward the center of the ECM. Although the cells are moving in the longitudinal direction, the migration direction is reversed as the electric field reverses. This is consistent with experimentally studied cases in the bibliography, where the direction of cell migration was evaluated when the electric field was reversed [18,21]. This process reduces the effective migration (total translocation) of the cells in the longitudinal direction. In low ES cases (), the cells migrate easily to the center of the ECM, which shows that the electric stimulus effect is lower than the mechanical stimuli. On the contrary, in high ES (), cells approach the center of the ECM moving slightly in the longitudinal direction. Initially, cells’ effective movement is almost perpendicular to the electric field direction, toward the center of the ECM with slight movement in the direction of X axis. As the cells reach the central position of the ECM, the presence of other cells increases the mechanical stimuli, guiding the cells to migrate towards the other cells. The combination of both stimuli introduce an improvement in the length of the formed groups.
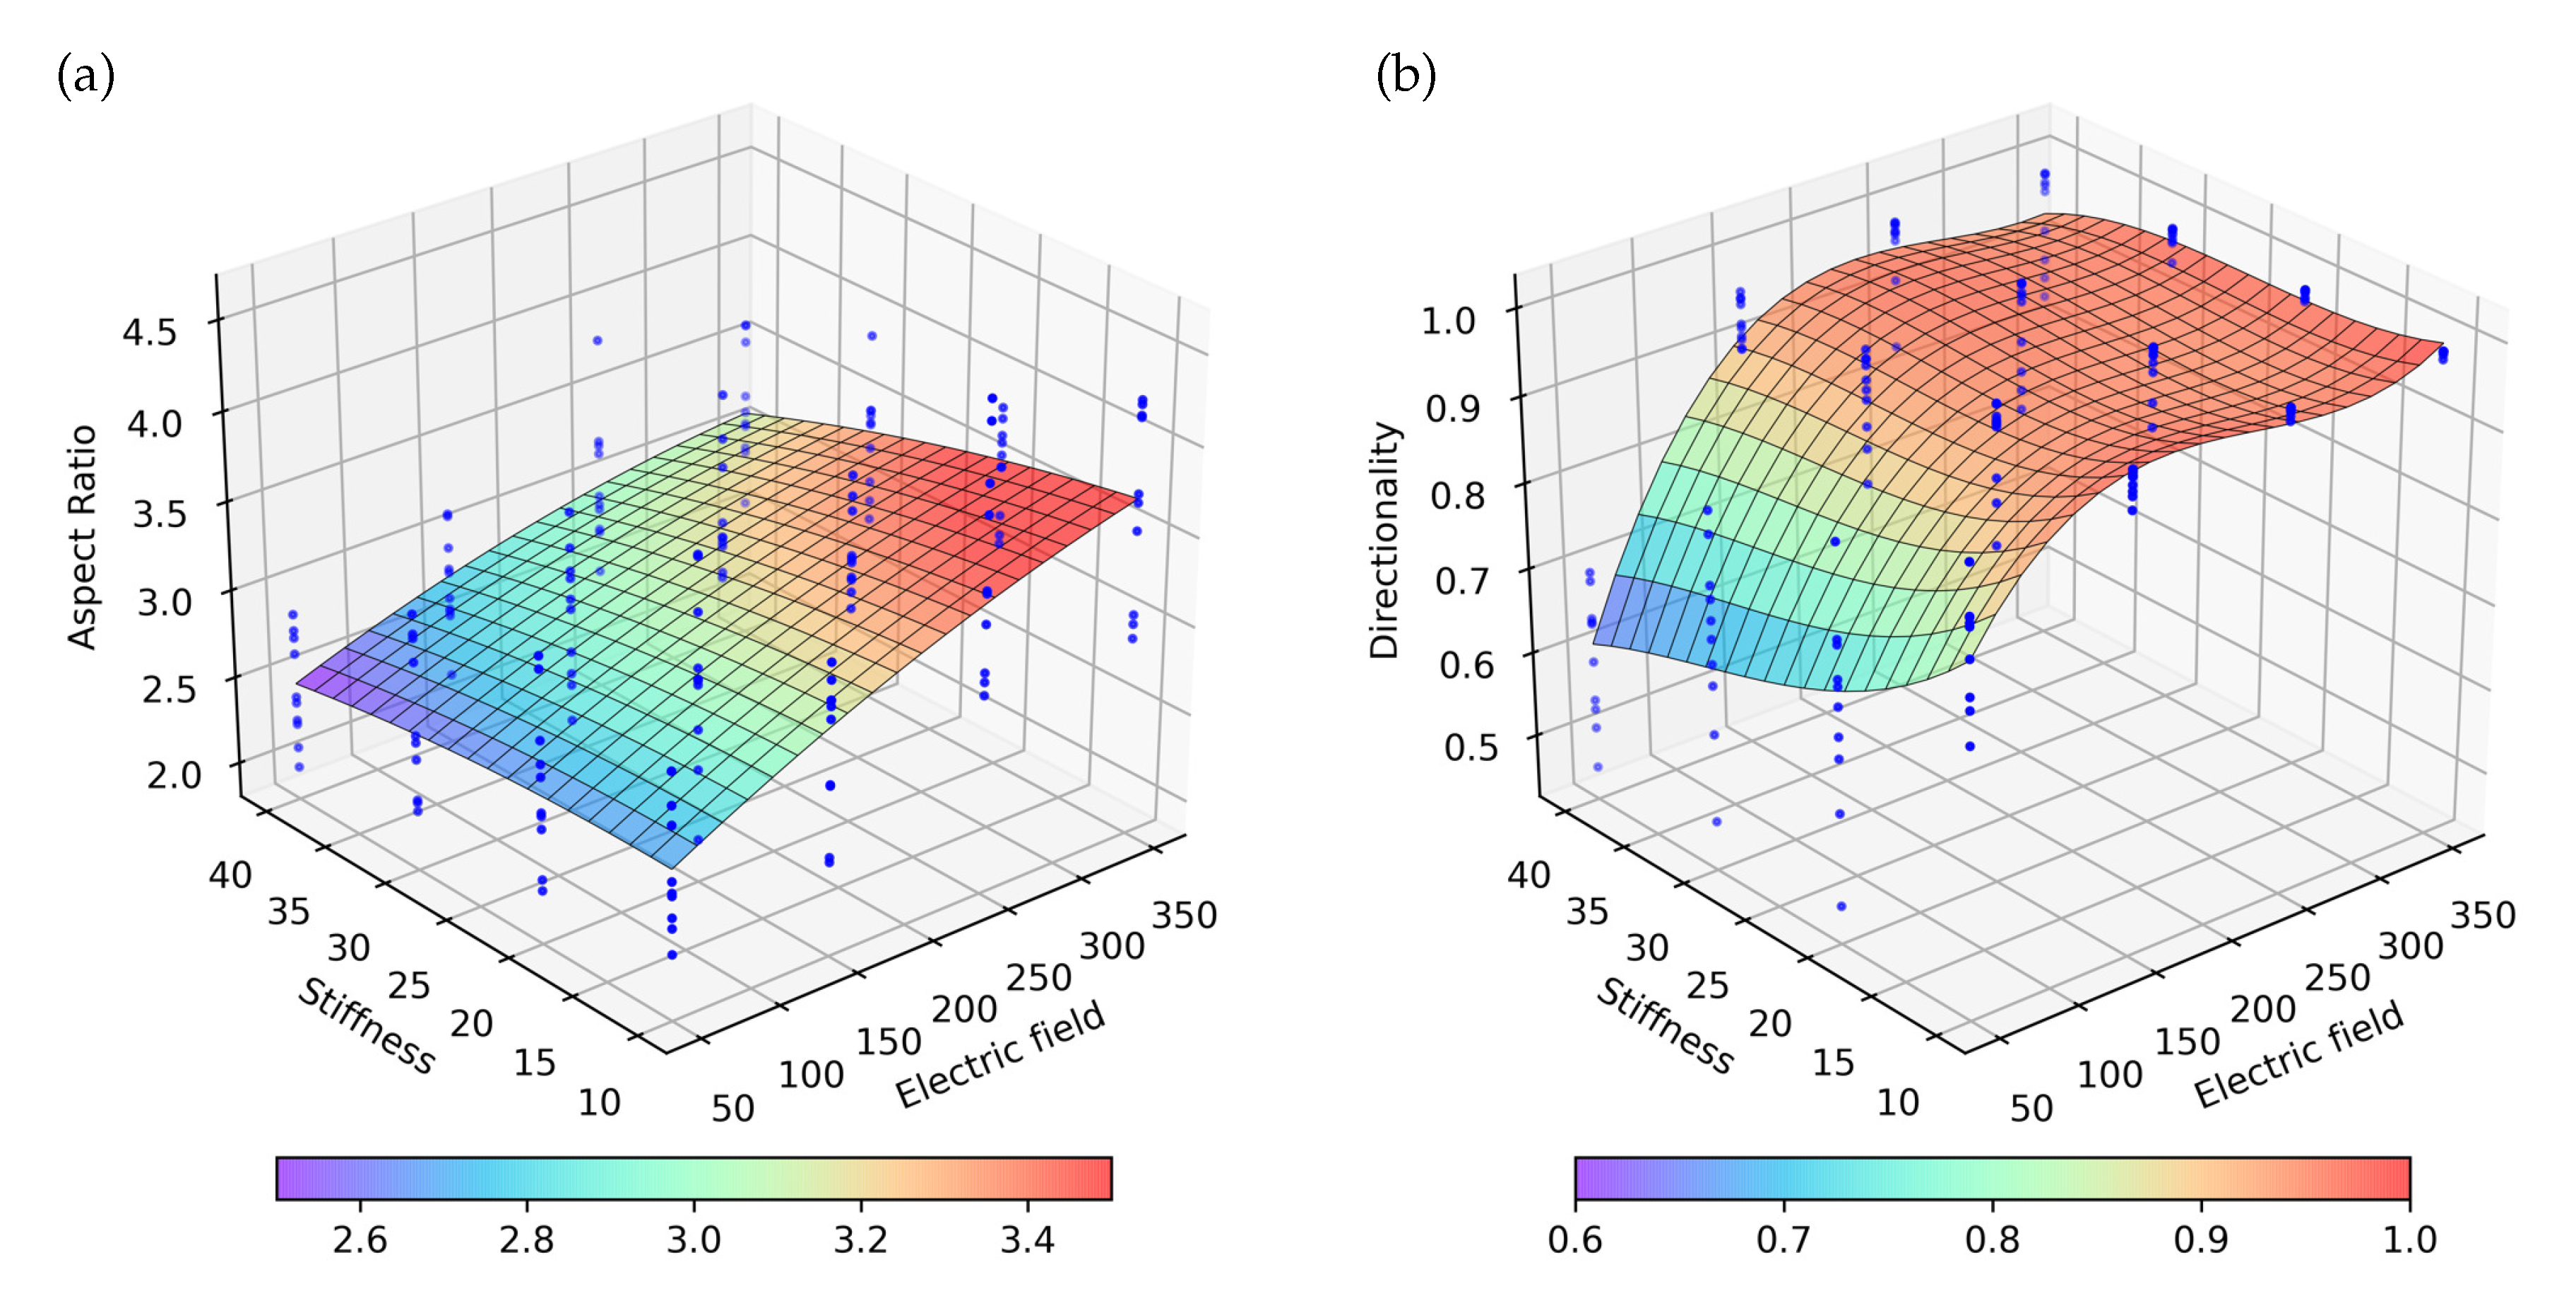
Compared with the previous cases, the groups are bigger and more elongated (Figure 10). As the cells remain in the center of the ECM, the region of higher rigidity, the cell proliferation increases. When the cells join a group, cell proliferation is considered to be inhibited. Unlike the previous cases, as the cells have a combination of two different directions stimuli, groups are formed later, which gives de cells extra time to proliferate. As in the previous experiments, the effects of ES are more pronounced in ECM of less stiffness, where the mechanical stimulus is lower. Besides, better results of AR and directionality are obtained (Figure 11). In this third case, it is observed that the AR tendency follows a behavior that can be considered linear, both for the mechanical and electrical stimulus, individually and/or combined effects (Figure 11a). On the contrary, the directionality follows a clearly non-linear tendency. For values greater than and for all stiffness, saturation in the directionality of the cells is observed (Figure 11b).
4. Discussion
ES is essential for the development of engineered heart tissues, which preserving cells’ mature phenotype and improving the contractile properties [11,15,17,18]. Likewise, its intensity, frequency, and duration of application can be key for the development of highly functional tissues [15]. The coupling effects of electrical and mechanical stimuli have been shown to be relevant in cardiac tissue development [11]. This strongly encourages us to study these effects in computational models where such stimuli can be studied, modeled, and balanced, saving time, costs, and pain in experimental studies. Furthermore, through the parametrization of cell behavior, it is possible to evaluate different cell and ECM conditions, including those associated with different pathologies [10,11,58].
In the proposed model, the cells initially align and migrate in the direction of the electric field which is consistent with the bibliography [11,18,21,44,85]. It has seen that different electric field strengths, as well as different stiffnesses of the ECM, generate differences in the direction and speed of cell migration as was observed in experimental models [18,85]. In general, as observed in the present model, high values of ES increase the degree of cell alignment and the groups elongated morphology. Likewise, the greater the stiffness, the faster the cell maturation, which increases cell proliferation until the cells join in groups where cell proliferation is inhibited. Their coupling effect is also extended to cell-cell interaction. If the electric stimulus is higher than the mechanical stimulus, cells can be dragged by the electric field which can delay or impede cell-cell contact and group formation. As it has been observed in the obtained results, the formation of correctly organized groups depends on the correct balance between the electrical and the mechanical stimulus.
As observed in the present model, cell response varies depending not only on the intensity but also on the type of the applied electric field. Comparing the results of the applied different modes of ES, significant differences are observed in cell response. For instance, in the cases of continuous and pulsative electric fields, cells are dragged in the direction of the electric field and tend to migrate towards the external face of the ECM (cathodic zone) [18,20,44]. On the other hand, in the case of the alternating electric field, cell migration direction is reversed as the electric field changes its direction, as can be observed in different experimental models [18,21,44].
Better results are observed when applying a continuous electric field (Figure 6). When applying ES discontinuously (Figure 8), the results are worse. This can be attributed to the decrease in the effective electric stimulus which is only active half of the time. Furthermore, by disabling the electric field, the cells only get stimulated by the mechanical cue. So, they lose some of the directionality induced by the electric field. On the other hand, when an alternating field is applied, cells maintain the directionality induced by the electric field. Due to the changing of the electric field polarity, the cell drag towards the electric field is reduced, keeping the cells in the center of the ECM. Cells alternate the direction of the migration which reduces the effective cell motility in the longitudinal direction. Thus, cells migrate towards the center of the ECM, due to the existence of strong mechanical stimulus and the presence of other cells, which stimulate the cells to form more elongated groups and improve the cell-cell interaction.
In the first and second experiments, when stiffness increases, slight differences are observed, in both AR and directionality. On the contrary, higher differences can be observed in the third experiment. A significant change in the tendency of cell directionality is observed, where a saturation point is detected when the applied electric field is greater than (Figure 11b). These differences in the results obtained for the different modes of application of the electric field, which highlights the relevance of properly understanding the processes that trigger the electrical stimulation of the cells. In this way, the hypothesis of the use of computational models is reinforced, to support the experimental work, which allows advancing in the understanding of these processes.
For more rigid ECMs, larger groups can be observed. This can be attributed to, as mentioned before, the increase in stiffness, which leads to faster maturation of the cells. Besides, as the cells are considered initially at the stage of early CM, an increase in cell proliferation has been noted. As the number of cells increases, the AR ratio may be decreased due to the thickening effect of the groups. This justifies that, although visually the groups are larger in stiffer ECMs, the graphs show a slight improvement in the results. This effect of stiffness can also be seen when comparing the number of cells observed in the third experiment with the previous ones. As the cells are kept in the center of the ECM, which is the stiffest zone, the maturation of the cells is faster, and the total number of cells after 160 h of simulation is higher than in other cases.
5. Conclusions
We have developed a computational model to study cardiac cell behavior in 3D matrices, with different stiffnesses, under the effects of different external electric fields. The model has been applied to study cell migration, polarization, organization, and formation of groups through cell junctions. With this model, we studied the effect of the electric field, with different modes of application which include continuous, pulsative, and alternating electric fields. Furthermore, different combinations of ECM stiffness and electric field intensity were simulated to study the effect of the coupling of the mechanical and electric stimuli. The obtained results are qualitatively consistent with the bibliography [2,17,18,44,84,85]. Thus, cells tend to migrate, in the direction of the electric field, proportionally to the intensity of the electric stimulus [18,44]. Besides, cells polarize towards the electric field direction and tend to form aligned groups in the direction of the electric field which depends on its intensity [17,18,44,85].
The stimulation of the cells through the application of an external electric field improves the directionality of the cells in the longitudinal direction, which corresponds to the electric field direction. As the electric field increases, cells tend to form elongated groups with higher AR. These effects are more pronounced in less ECM’s stiffness, revealing the effects of the coupling of electrical and mechanical stimuli. While the ES induce the cells to migrate in the longitudinal direction, the mechanical stimulation guides cells to the center of the ECM. As a result, an improvement of the AR and directionality is observed by decreasing stiffness and thereby mechanical stimulation. Similarly, by increasing stiffness, the effects of ES decrease. In case of lower electric field (), cells tend to remain at the center of the ECM, indicating that the mechanical stimulus dominates the electric stimulus. Thus, the best directionality and AR results are obtained by applying the maximum electric field combined with the minimum stiffness. On the other hand, cell maturation is faster in more rigid ECMs, which increases the maturation speed as well as increasing the proliferation rate of the early CM. The effect of stiffness on the proliferation can also be observed in the third experiment. In this case, cells keep at the center of the ECM, which corresponds to the stiffest zone of the ECM, increasing cell maturation and showing higher proliferation.
The mode of application of the electric field changed the response of the cells. Thus, a considerable increase in directionality and AR has been observed when applying an alternating electric field. In this case, a saturation point of the directionality is observed for ES above , where this is not observed in the other modes of the electric field. Significant differences can be observed due to the coupling of electrical and mechanical stimuli, with substantial variations in the results. Cells are guided by stimuli with different effects and the cellular response depends on the incidence of each stimulus. Thus, when a high mechanical stimulus is observed, the effect produced by the electrical stimulus tends to decrease. In the same way, for high electrical stimuli, the effect of the mechanical stimulus loses relevance.
In conclusion, groups with higher AR can be obtained by applying higher ES. The increase in AR seems to increase linearly by increasing the intensity of the electric field. Different electric field applications (continuous, pulsating, or alternating) show a different influence in AR and directionality, with better results when the alternating electric field is applied. Likewise, an increase in stiffness is favorable to promote cell proliferation.
The presented model has been elaborated establishing a series of simplifications that must be considered with the aim of simplifying and providing stability to the calculations. Among them, cell morphology, which is considered spherical along with the simulation. Likewise, cellular interaction with certain growth factors, which can modify or inhibit certain cellular behaviors, has been simplified by considering neutral cell culture. Despite the model limitations, it is capable of evaluating the coupling of different stimuli, electrical and mechanical, which is relevant in the case of cardiac cells. Furthermore, the results indicate that the mode of application of the electric field can significantly change the cell behavior. This strengthens the idea of using computational models to study the appropriate conditions for cell culture, giving support to the in-vitro and in-vivo assays. Likewise, computational models can reproduce a large number of culture conditions with reduced time and economic cost, thus being able to establish preliminary studies that reduce dramatically the number of experiments. In this case, it has been seen that the coupling of the electrical and mechanical stimulation notably increases and accelerates the cell proliferation process. Consequently, it can be considered a highly recommended combination for the in-vitro and in-vivo experiments.
Supplementary Materials
Supplementary Materials (video 1, video 2, video 3) can be downloaded at https://www.mdpi.com/2227-7390/8/11/1875/s1.
Author Contributions
Conceptualization, P.U., M.H.D.; methodology, P.U., M.H.D.; software, P.U., M.H.D.; validation, P.U., M.H.D.; formal analysis, P.U., M.H.D.; investigation, P.U., M.H.D.; resources, M.H.D.; data curation, P.U., M.H.D.; writing—original draft preparation, P.U.; writing—review and editing, M.H.D.; visualization, P.U.; supervision, M.H.D.; project administration, M.H.D.; funding acquisition, M.H.D. All authors have read and agreed to the published version of the manuscript.
Funding
This research was funded by the Spanish Ministry of Science and Innovation (PID2019-106099RB-C44/ AEI/10.13039/501100011033), the Government of Aragon (DGA-T24_20R) and the Biomedical Research Networking Center in Bioengineering, Biomaterials and Nanomedicine (CIBER-BBN).
Acknowledgments
The authors gratefully acknowledge the financial support from the Spanish Ministry of Science and Innovation (PID2019-106099RB-C44/AEI/10.13039/501100011033), the Government of Aragon (DGA-T24_20R) and the Biomedical Research Networking Center in Bioengineering, Biomaterials and Nanomedicine (CIBER-BBN). CIBER-BBN is financed by the Instituto de Salud Carlos III with assistance from the European Regional Development Fund.
Conflicts of Interest
The authors declare no conflict of interest.
References
- Hart, F.X.; Palisano, J.R. The Application of Electric Fields in Biology and Medicine. In Electric Field; InTech: Vienna, Austria, 2018. [Google Scholar] [CrossRef] [Green Version]
- Sauer, H.; Rahimi, G.; Hescheler, J.; Wartenberg, M. Effects of electrical fields on cardiomyocyte differentiation of embryonic stem cells. J. Cell. Biochem. 1999, 75, 710–723. [Google Scholar] [CrossRef]
- Ghafar-Zadeh, E.; Waldeisen, J.R.; Lee, L.P. Engineered approaches to the stem cell microenvironment for cardiac tissue regeneration. Lab Chip 2011, 11, 3031. [Google Scholar] [CrossRef] [PubMed] [Green Version]
- Mycielska, M.E.; Djamgoz, M.B.A. Cellular mechanisms of direct-current electric field effects: Galvanotaxis and metastatic disease. J. Cell Sci. 2004, 117, 1631–1639. [Google Scholar] [CrossRef] [PubMed] [Green Version]
- Pullar, C.E. The Physiology of Bioelectricity in Development, Tissue Regeneration and Cancer; CRC Press: Boca Raton, FL, USA, 2016; p. 308. [Google Scholar] [CrossRef]
- Robinson, K.R.; Messerli, M.A. Left/right, up/down: The role of endogenous electrical fields as directional signals in development, repair and invasion. BioEssays 2003, 25, 759–766. [Google Scholar] [CrossRef] [PubMed]
- Levin, M. Molecular bioelectricity: How endogenous voltage potentials control cell behavior and instruct pattern regulation in vivo. Mol. Biol. Cell 2014, 25, 3835–3850. [Google Scholar] [CrossRef]
- Meng, S.; Rouabhia, M.; Zhang, Z. Electrical stimulation modulates osteoblast proliferation and bone protein production through heparin-bioactivated conductive scaffolds. Bioelectromagnetics 2013, 34, 189–199. [Google Scholar] [CrossRef]
- Walker, C.A.; Spinale, F.G. The structure and function of the cardiac myocyte: A review of fundamental concepts. J. Thorac. Cardiovasc. Surg. 1999, 118, 375–382. [Google Scholar] [CrossRef] [Green Version]
- Ferrari, R. Healthy versus sick myocytes: Metabolism, structure and function. Eur. Heart J. Suppl. 2002, 4, G1–G12. [Google Scholar] [CrossRef]
- Stoppel, W.L.; Kaplan, D.L.; Black, L.D. Electrical and mechanical stimulation of cardiac cells and tissue constructs. Adv. Drug Deliv. Rev. 2016, 96, 135–155. [Google Scholar] [CrossRef] [Green Version]
- Llucià-Valldeperas, A.; Sanchez, B.; Soler-Botija, C.; Gálvez-Montón, C.; Prat-Vidal, C.; Roura, S.; Rosell-Ferrer, J.; Bragos, R.; Bayes-Genis, A. Electrical stimulation of cardiac adipose tissue-derived progenitor cells modulates cell phenotype and genetic machinery. J. Tissue Eng. Regen. Med. 2015, 9, E76–E83. [Google Scholar] [CrossRef] [Green Version]
- Sun, Y.; Wang, H.; Liu, M.; Lin, F.; Hua, J. Resveratrol abrogates the effects of hypoxia on cell proliferation, invasion and EMT in osteosarcoma cellsthrough downregulation of the HIF-1α protein. Mol. Med. Rep. 2015, 11, 1975–1981. [Google Scholar] [CrossRef] [Green Version]
- Tandon, N.; Cannizzaro, C.; Chao, P.P.H.G.H.G.; Maidhof, R.; Marsano, A.; Au, H.T.H.; Radisic, M.; Vunjak-Novakovic, G. Electrical stimulation systems for cardiac tissue engineering. Nat. Protoc. 2009, 4, 155–173. [Google Scholar] [CrossRef] [PubMed] [Green Version]
- Hirt, M.N.; Boeddinghaus, J.; Mitchell, A.; Schaaf, S.; Börnchen, C.; Müller, C.; Schulz, H.; Hubner, N.; Stenzig, J.; Stoehr, A.; et al. Functional improvement and maturation of rat and human engineered heart tissue by chronic electrical stimulation. J. Mol. Cell. Cardiol. 2014, 74, 151–161. [Google Scholar] [CrossRef] [PubMed] [Green Version]
- Heidi Au, H.T.; Cui, B.; Chu, Z.E.; Veres, T.; Radisic, M. Cell culture chips for simultaneous application of topographical and electrical cues enhance phenotype of cardiomyocytes. Lab Chip 2009, 9, 564–575. [Google Scholar] [CrossRef] [PubMed]
- Radisic, M.; Park, H.; Shing, H.; Consi, T.; Schoen, F.J.; Langer, R.; Freed, L.E.; Vunjak-Novakovic, G. Functional assembly of engineered myocardium by electrical stimulation of cardiac myocytes cultured on scaffolds. Proc. Natl. Acad. Sci. USA 2004, 101, 18129–18134. [Google Scholar] [CrossRef] [PubMed] [Green Version]
- Frederich, B.J.; Timofeyev, V.; Thai, P.N.; Haddad, M.J.; Poe, A.J.; Lau, V.C.; Moshref, M.; Knowlton, A.A.; Sirish, P.; Chiamvimonvat, N. Electrotaxis of cardiac progenitor cells, cardiac fibroblasts, and induced pluripotent stem cell-derived cardiac progenitor cells requires serum and is directed via PI3K pathways. Heart Rhythm 2017, 14, 1685–1692. [Google Scholar] [CrossRef] [PubMed]
- Nishimura, K.Y.; Isseroff, R.R.; Nucciteili, R. Human keratinocytes migrate to the negative pole in direct current electric fields comparable to those measured in mammalian wounds. J. Cell Sci. 1996, 109, 199–207. [Google Scholar]
- Banks, T.A.; Luckman, P.S.B.; Frith, J.E.; Cooper-White, J.J. Effects of electric fields on human mesenchymal stem cell behaviour and morphology using a novel multichannel device. Integr. Biol. 2015, 7, 693–712. [Google Scholar] [CrossRef]
- Zhao, Z.; Watt, C.; Karystinou, A.; Roelofs, A.; McCaig, C.; Gibson, I.; De Bari, C. Directed migration of human bone marrow mesenchymal stem cells in a physiological direct current electric field. Eur. Cells Mater. 2011, 22, 344–358. [Google Scholar] [CrossRef]
- Sassoli, C.; Pini, A.; Mazzanti, B.; Quercioli, F.; Nistri, S.; Saccardi, R.; Orlandini, S.Z.; Bani, D.; Formigli, L. Mesenchymal stromal cells affect cardiomyocyte growth through juxtacrine Notch-1/Jagged-1 signaling and paracrine mechanisms: Clues for cardiac regeneration. J. Mol. Cell. Cardiol. 2011, 51, 399–408. [Google Scholar] [CrossRef] [PubMed]
- Ahuja, P.; Sdek, P.; MacLellan, W.R. Cardiac Myocyte Cell Cycle Control in Development, Disease, and Regeneration. Physiol. Rev. 2007, 87, 521–544. [Google Scholar] [CrossRef] [PubMed] [Green Version]
- Costa, K.D.; Lee, E.J.; Holmes, J.W. Creating Alignment and Anisotropy in Engineered Heart Tissue: Role of Boundary Conditions in a Model Three-Dimensional Culture System. Tissue Eng. 2003, 9, 567–577. [Google Scholar] [CrossRef] [PubMed]
- Gumbiner, B.M. Cell Adhesion: The Molecular Basis of Tissue Architecture and Morphogenesis. Cell 1996, 84, 345–357. [Google Scholar] [CrossRef] [Green Version]
- Ogawa, N.; Oku, H.; Hashimoto, K.; Ishikawa, M. A physical model for galvanotaxis of Paramecium cell. J. Theor. Biol. 2006, 242, 314–328. [Google Scholar] [CrossRef] [PubMed]
- Mousavi, S.J.; Doblaré, M.; Doweidar, M.H. Computational modelling of multi-cell migration in a multi-signalling substrate. Phys. Biol. 2014, 11, 026002. [Google Scholar] [CrossRef]
- Mousavi, S.J.; Doweidar, M.H. Encapsulated piezoelectric nanoparticle–hydrogel smart material to remotely regulate cell differentiation and proliferation: A finite element model. Comput. Mech. 2019, 63, 471–489. [Google Scholar] [CrossRef]
- Urdeitx, P.; Farzaneh, S.; Mousavi, S.J.; Doweidar, M.H. Role of oxygen concentration in the osteoblasts behavior: A finite element model. J. Mech. Med. Biol. 2020, 20, 1950064. [Google Scholar] [CrossRef]
- Mousavi, S.J.; Doweidar, M.H. Three-Dimensional Numerical Model of Cell Morphology during Migration in Multi-Signaling Substrates. PLoS ONE 2015, 10, e0122094. [Google Scholar] [CrossRef] [Green Version]
- Bernheim-Groswasser, A.; Prost, J.; Sykes, C. Mechanism of Actin-Based Motility: A Dynamic State Diagram. Biophys. J. 2005, 89, 1411–1419. [Google Scholar] [CrossRef] [Green Version]
- Mogilner, A. Mathematics of cell motility: Have we got its number? J. Math. Biol. 2009, 58, 105–134. [Google Scholar] [CrossRef] [Green Version]
- Selmeczi, D.; Mosler, S.; Hagedorn, P.H.; Larsen, N.B.; Flyvbjerg, H. Cell Motility as Persistent Random Motion: Theories from Experiments. Biophys. J. 2005, 89, 912–931. [Google Scholar] [CrossRef] [PubMed] [Green Version]
- Reig, G.; Pulgar, E.; Concha, M.L. Cell migration: From tissue culture to embryos. Development 2014, 141, 1999–2013. [Google Scholar] [CrossRef] [PubMed] [Green Version]
- Ridley, A.J.; Schwartz, M.A.; Burridge, K.; Firtel, R.A.; Ginsberg, M.H.; Borisy, G.; Parsons, J.T.; Horwitz, A.R. Cell Migration: Integrating Signals from Front to Back. Science 2003, 302, 1704–1709. [Google Scholar] [CrossRef] [PubMed] [Green Version]
- Mogilner, A.; Rubinstein, B. The Physics of Filopodial Protrusion. Biophys. J. 2005, 89, 782–795. [Google Scholar] [CrossRef] [PubMed] [Green Version]
- Neilson, M.P.; Veltman, D.M.; van Haastert, P.J.; Webb, S.D.; Mackenzie, J.A.; Insall, R.H. Chemotaxis: A feedback-based computational model robustly predicts multiple aspects of real cell behaviour. PLoS Biol. 2011, 9, e1000618. [Google Scholar] [CrossRef] [Green Version]
- Bosgraaf, L.; van Haastert, P.J. Navigation of chemotactic cells by parallel signaling to pseudopod persistence and orientation. PLoS ONE 2009, 4, e6842. [Google Scholar] [CrossRef] [Green Version]
- Lange, J.R.; Fabry, B. Cell and tissue mechanics in cell migration. Exp. Cell Res. 2013, 319, 2418–2423. [Google Scholar] [CrossRef] [Green Version]
- Mousavi, S.J.; Doweidar, M.H.; Doblaré, M. 3D computational modelling of cell migration: A mechano-chemo-thermo-electrotaxis approach. J. Theor. Biol. 2013, 329, 64–73. [Google Scholar] [CrossRef]
- Mousavi, S.J.; Doweidar, M.H.; Doblaré, M. Computational modelling and analysis of mechanical conditions on cell locomotion and cell–cell interaction. Comput. Methods Biomech. Biomed. Eng. 2014, 17, 678–693. [Google Scholar] [CrossRef]
- Mousavi, S.J.; Doweidar, M.H. Role of mechanical cues in cell differentiation and proliferation: A 3D numerical model. PLoS ONE 2015, 10, e0124529. [Google Scholar] [CrossRef] [Green Version]
- Urdeitx, P.; Doweidar, M.H. Mechanical stimulation of cell microenvironment for cardiac muscle tissue regeneration: A 3D in-silico model. Comput. Mech. 2020, 66, 1003–1023. [Google Scholar] [CrossRef]
- Chen, C.; Bai, X.; Ding, Y.; Lee, I.S. Electrical stimulation as a novel tool for regulating cell behavior in tissue engineering. Biomater. Res. 2019, 23, 25. [Google Scholar] [CrossRef] [Green Version]
- Huang, Y.X.; Zheng, X.J.; Kang, L.L.; Chen, X.Y.; Liu, W.J.; Huang, B.T.; Wu, Z.J. Quantum dots as a sensor for quantitative visualization of surface charges on single living cells with nano-scale resolution. Biosens. Bioelectron. 2011, 26, 2114–2118. [Google Scholar] [CrossRef] [PubMed]
- Aragona, M.; Panciera, T.; Manfrin, A.; Giulitti, S.; Michielin, F.; Elvassore, N.; Dupont, S.; Piccolo, S. A mechanical checkpoint controls multicellular growth through YAP/TAZ regulation by actin-processing factors. Cell 2013, 154, 1047–1059. [Google Scholar] [CrossRef] [PubMed] [Green Version]
- Low, B.C.; Pan, C.Q.; Shivashankar, G.V.; Bershadsky, A.; Sudol, M.; Sheetz, M. YAP/TAZ as mechanosensors and mechanotransducers in regulating organ size and tumor growth. FEBS Lett. 2014, 588, 2663–2670. [Google Scholar] [CrossRef] [Green Version]
- Zhao, M. Electrical fields in wound healing—An overriding signal that directs cell migration. Semin. Cell Dev. Biol. 2009, 20, 674–682. [Google Scholar] [CrossRef] [PubMed]
- Abercrombie, M. Contact inhibition and malignancy. Nature 1979, 281, 259–262. [Google Scholar] [CrossRef]
- Chen, Q.Z.; Harding, S.E.; Ali, N.N.; Lyon, A.R.; Boccaccini, A.R. Biomaterials in cardiac tissue engineering: Ten years of research survey. Mater. Sci. Eng. R Rep. 2008, 59, 1–37. [Google Scholar] [CrossRef]
- Zimmermann, W.H.; Schneiderbanger, K.; Schubert, P.; Didié, M.; Münzel, F.; Heubach, J.F.; Kostin, S.; Neuhuber, W.L.; Eschenhagen, T. Tissue engineering of a differentiated cardiac muscle construct. Circ. Res. 2002, 90, 223–230. [Google Scholar] [CrossRef] [PubMed] [Green Version]
- Kresh, J.Y.; Chopra, A. Intercellular and extracellular mechanotransduction in cardiac myocytes. Pflüg. Arch. Eur. J. Physiol. 2011, 462, 75–87. [Google Scholar] [CrossRef]
- Lee, E.J.; Holmes, J.W.; Costa, K.D. Remodeling of engineered tissue anisotropy in response to altered loading conditions. Ann. Biomed. Eng. 2008, 36, 1322–1334. [Google Scholar] [CrossRef] [Green Version]
- Planat-Bénard, V.; Menard, C.; André, M.; Puceat, M.; Perez, A.; Garcia-Verdugo, J.M.; Pénicaud, L.; Casteilla, L. Spontaneous Cardiomyocyte Differentiation from Adipose Tissue Stroma Cells. Circ. Res. 2004, 94, 223–229. [Google Scholar] [CrossRef] [Green Version]
- Tahara, N.; Brush, M.; Kawakami, Y. Cell migration during heart regeneration in zebrafish. Dev. Dyn. 2016, 245, 774–787. [Google Scholar] [CrossRef] [Green Version]
- Nunes, S.S.; Miklas, J.W.; Liu, J.; Aschar-Sobbi, R.; Xiao, Y.; Zhang, B.; Jiang, J.; Massé, S.; Gagliardi, M.; Hsieh, A.; et al. Biowire: A platform for maturation of human pluripotent stem cell–derived cardiomyocytes. Nat. Methods 2013, 10, 781–787. [Google Scholar] [CrossRef] [PubMed] [Green Version]
- Schmelter, M.; Ateghang, B.; Helmig, S.; Wartenberg, M.; Sauer, H. Embryonic stem cells utilize reactive oxygen species as transducers of mechanical strain-induced cardiovascular differentiation. FASEB J. 2006, 20, 1182–1184. [Google Scholar] [CrossRef] [PubMed]
- Camelliti, P.; McCulloch, A.D.; Kohl, P. Microstructured Cocultures of Cardiac Myocytes and Fibroblasts: A Two-Dimensional In Vitro Model of Cardiac Tissue. Microsc. Microanal. 2005, 11, 249–259. [Google Scholar] [CrossRef]
- Holtzman, N.G.; Schoenebeck, J.J.; Tsai, H.J.; Yelon, D. Endocardium is necessary for cardiomyocyte movement during heart tube assembly. Development 2007, 134, 2379–2386. [Google Scholar] [CrossRef] [PubMed] [Green Version]
- Mousavi, S.J.; Doweidar, M.H. A novel mechanotactic 3D modeling of cell morphology. Phys. Biol. 2014, 11, 046005. [Google Scholar] [CrossRef] [PubMed]
- Ye, J.; Boyle, A.J.; Shih, H.; Sievers, R.E.; Wang, Z.E.; Gormley, M.; Yeghiazarians, Y. CD45-positive cells are not an essential component in cardiosphere formation. Cell Tissue Res. 2013, 351, 201–205. [Google Scholar] [CrossRef] [PubMed]
- Wu, Q.Q.; Chen, Q. Mechanoregulation of chondrocyte proliferation, maturation, and hypertrophy: Ion-channel dependent transduction of matrix deformation signals. Exp. Cell Res. 2000, 256, 383–391. [Google Scholar] [CrossRef]
- Delaine-Smith, R.M.; Reilly, G.C. Mesenchymal stem cell responses to mechanical stimuli. Muscles Ligaments Tendons J. 2012, 2, 169–180. [Google Scholar] [PubMed]
- Ulrich, T.A.; De Juan Pardo, E.M.; Kumar, S. The mechanical rigidity of the extracellular matrix regulates the structure, motility, and proliferation of glioma cells. Cancer Res. 2009, 69, 4167–4174. [Google Scholar] [CrossRef] [Green Version]
- Mousavi, S.J.; Doweidar, M.H. Numerical modeling of cell differentiation and proliferation in force-induced substrates via encapsulated magnetic nanoparticles. Comput. Methods Programs Biomed. 2016, 130, 106–117. [Google Scholar] [CrossRef] [PubMed] [Green Version]
- Foglia, M.J.; Poss, K.D. Building and re-building the heart by cardiomyocyte proliferation. Development 2016, 143, 729–740. [Google Scholar] [CrossRef] [Green Version]
- Yutzey, K.E. Cardiomyocyte Proliferation. Circ. Res. 2017, 120, 627–629. [Google Scholar] [CrossRef]
- Asumda, F.Z.; Asumda, F.Z. Towards the development of a reliable protocol for mesenchymal stem cell cardiomyogenesis. Stem Cell Discov. 2013, 3, 13–21. [Google Scholar] [CrossRef] [Green Version]
- Zhang, R.; Han, P.; Yang, H.; Ouyang, K.; Lee, D.; Lin, Y.F.; Ocorr, K.; Kang, G.; Chen, J.; Stainier, D.Y.R.; et al. In vivo cardiac reprogramming contributes to zebrafish heart regeneration. Nature 2013, 498, 497–501. [Google Scholar] [CrossRef] [PubMed]
- McClatchey, A.I.; Yap, A.S. Contact inhibition (of proliferation) redux. Curr. Opin. Cell Biol. 2012, 24, 685–694. [Google Scholar] [CrossRef]
- Dassault Systemes. Abaqus 6.14. 2014. Available online: https://www.3ds.com/products-services/simulia/services-support/support/documentation/ (accessed on 15 September 2020).
- Schäfer, A.; Radmacher, M. Influence of myosin II activity on stiffness of fibroblast cells. Acta Biomater. 2005, 1, 273–280. [Google Scholar] [CrossRef]
- Darling, E.M.; Topel, M.; Zauscher, S.; Vail, T.P.; Guilak, F. Viscoelastic properties of human mesenchymally-derived stem cells and primary osteoblasts, chondrocytes, and adipocytes. J. Biomech. 2008, 41, 454–464. [Google Scholar] [CrossRef] [PubMed] [Green Version]
- Discher, D.E. Tissue Cells Feel and Respon to the Stiffness of Their Substrate. Science 2005, 310, 1139–1143. [Google Scholar] [CrossRef] [PubMed] [Green Version]
- Ramtani, S. Mechanical modelling of cell/ECM and cell/cell interactions during the contraction of a fibroblast-populated collagen microsphere: Theory and model simulation. J. Biomech. 2004, 37, 1709–1718. [Google Scholar] [CrossRef] [PubMed]
- Rodriguez, M.L.; Graham, B.T.; Pabon, L.M.; Han, S.J.; Murry, C.E.; Sniadecki, N.J.; Pabon, L.M.; Murry, C.E.; Graham, B.T.; Han, S.J.; et al. Measuring the Contractile Forces of Human Induced Pluripotent Stem Cell-Derived Cardiomyocytes With Arrays of Microposts. J. Biomech. Eng. 2014, 136, 051005. [Google Scholar] [CrossRef] [PubMed] [Green Version]
- Gardel, M.L.; Sabass, B.; Ji, L.; Danuser, G.; Schwarz, U.S.; Waterman, C.M. Traction stress in focal adhesions correlates biphasically with actin retrograde flow speed. J. Cell Biol. 2008, 183, 999–1005. [Google Scholar] [CrossRef]
- Bhana, B.; Iyer, R.K.; Chen, W.L.K.; Zhao, R.; Sider, K.L.; Likhitpanichkul, M.; Simmons, C.A.; Radisic, M. Influence of substrate stiffness on the phenotype of heart cells. Biotechnol. Bioeng. 2010, 105, 1148–1160. [Google Scholar] [CrossRef]
- Mathur, A.B.; Collinsworth, A.M.; Reichert, W.M.; Kraus, W.E.; Truskey, G.A. Endothelial, cardiac muscle and skeletal muscle exhibit different viscous and elastic properties as determined by atomic force microscopy. J. Biomech. 2001, 34, 1545–1553. [Google Scholar] [CrossRef]
- Zaman, M.H.; Kamm, R.D.; Matsudaira, P.; Lauffenburger, D.A. Computational Model for Cell Migration in Three-Dimensional Matrices. Biophys. J. 2005, 89, 1389–1397. [Google Scholar] [CrossRef] [Green Version]
- Fearnley, C.J.; Roderick, H.L.; Bootman, M.D. Calcium Signaling in Cardiac Myocytes. Cold Spring Harb. Perspect. Biol. 2011, 3, a004242. [Google Scholar] [CrossRef] [PubMed] [Green Version]
- Kang, K.T.; Park, J.H.; Kim, H.J.; Lee, H.Y.H.M.; Lee, K.I.; Jung, H.H.; Lee, H.Y.H.M.; Jang, J.W. Study of Tissue Differentiation of Mesenchymal Stem Cells by Mechanical Stimuli and an Algorithm for Bone Fracture Healing. Tissue Eng. Regen. Med. 2011, 8, 359–370. [Google Scholar]
- Li, Z.; Guo, X.; Palmer, A.F.; Das, H.; Guan, J. High-efficiency matrix modulus-induced cardiac differentiation of human mesenchymal stem cells inside a thermosensitive hydrogel. Acta Biomater. 2012, 8, 3586–3595. [Google Scholar] [CrossRef]
- Pietronave, S.; Zamperone, A.; Oltolina, F.; Colangelo, D.; Follenzi, A.; Novelli, E.; Diena, M.; Pavesi, A.; Consolo, F.; Fiore, G.B.; et al. Monophasic and biphasic electrical stimulation induces a precardiac differentiation in progenitor cells isolated from human heart. Stem Cells Dev. 2014, 23, 888–898. [Google Scholar] [CrossRef] [PubMed] [Green Version]
- Baumgartner, S.; Halbach, M.; Krausgrill, B.; Maass, M.; Srinivasan, S.P.; Sahito, R.G.A.; Peinkofer, G.; Nguemo, F.; Müller-Ehmsen, J.; Hescheler, J. Electrophysiological and morphological maturation of murine fetal cardiomyocytes during electrical stimulation in vitro. J. Cardiovasc. Pharmacol. Ther. 2015, 20, 104–112. [Google Scholar] [CrossRef]
Figure 1.
Mechanical model of the cell. The Actin-Myosin (AM) filaments generate cell internal contraction, , which is transmitted through the active, , and passive, , elements, generating cell internal deformations, , and the resulting stresses, . Likewise, corresponds to the extracellular matrix (ECM) stresses generated by the deformation of the ECM with a stiffness .

Figure 2.
Cell electrotaxis. Cell membrane towards the anode is hyperpolarized allowing the influx of Ca by passive electromechanical diffusion. In the cathodic side, the cell is depolarized, and its ion channels open releasing Ca. The net electrotactic force depends on the balance of the two opposing attraction forces.

Figure 3.
Cell interaction. (a) and are the coordinate vectors of the ith and jth cells, respectively, and is the contact vector, which satisfies . The contact face, defined by the nodes () loses the capacity to interact with the ECM. (b) The global polarization direction , is defined through the cell polarization . The projection of the cell contact, , is defined by the projection of the contact vector, , in the direction. Being the cell junction possible when , and . (c) The direction of the internal cell deformation, , is considered to establish the direction of the cell mechanical stimulus.

Figure 4.
Cell migration. (a) Individual cell migration is considered when cells are separated or for cells which are not attached to another cell by CJ. is the individual cell velocity. (b) Collective cell migration is considered for each group of cells attached by cell junctions. Group velocity, , is defined from the migratory tendency of the cells in the group. (c) Cell relocation is considered when group velocity is insufficient to consider the movement. A cell can migrate to a new position, with its individual velocity, , without leaving the group.

Figure 5.
Algorithm of the model implemented for each time step.

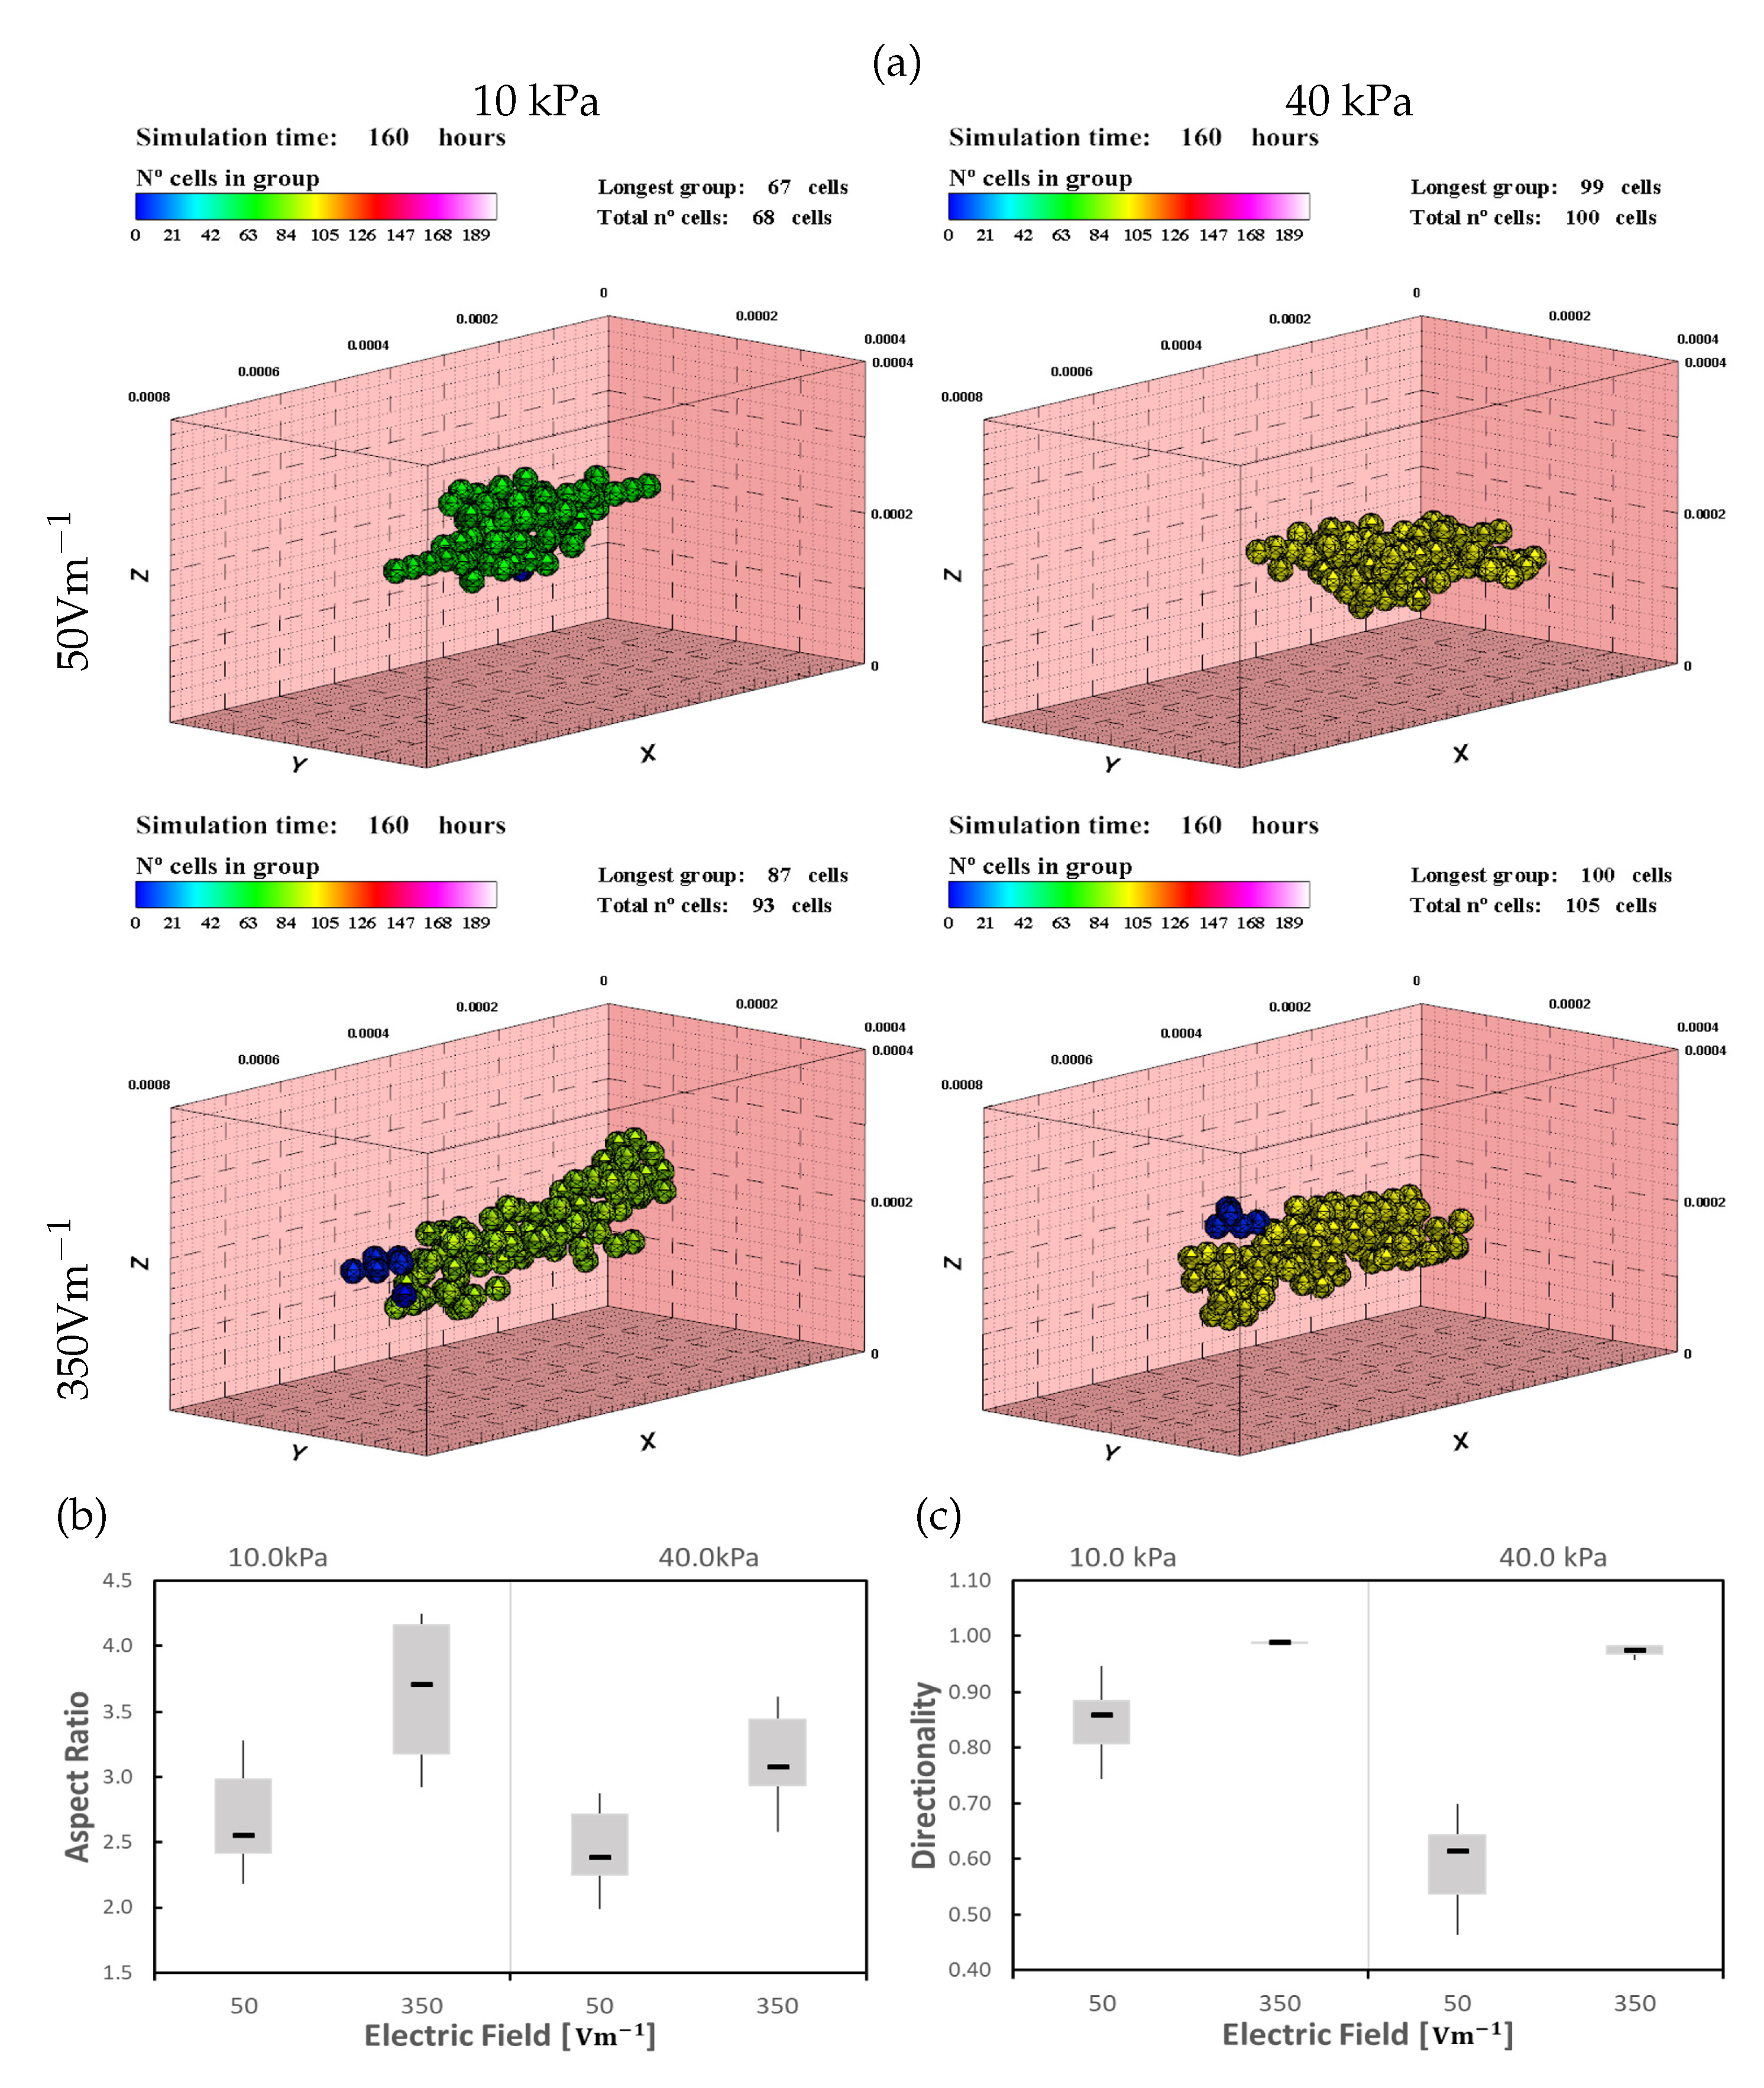
Figure 6.
Cardiomyocytes (CMs) in 10 and 40 kPa ECMs, under ES of 50 and , after 160 h of simulation (see also Supplementary Materials video 1). (a) Cells tend to form a longer group in the longitudinal direction as the electric field increases. Under low electrical stimulus (), cells remain at the center of the ECM (top). As the stimulus increases, cells tend to move to the outer surface of the ECM (bottom). Numerical results for Aspect Ratio (AR) (b) and directionality (c).

Figure 7.
Representation of the obtained numerical results applying a continuous electric field with different intensities in ECM with different stiffnesses. Blue dots represent 10 experiment repetitions, on which the surface with the best fit to the results is represented. (a) Aspect ratio for the different combination of stiffness and electric stimulus. (b) Directionality for the different combination of stiffness and electric stimulus.

Figure 8.
CMs in 10 and 40 kPa ECMs, under electrical pulsatory stimulation of 50 and , after 160 h of simulation (see also Supplementary Materials video 2). (a) Less effect of the electric field is observed with a greater tendency of the cells to remain close to the center of the ECM. AR (b) and directionality (c) increase as the Electrical stimulation (ES) increases.

Figure 9.
Representation of the obtained numerical results applying a pulsatory electric field with different intensities in ECM with different stiffnesses. Blue dots represent 10 experiment repetitions, on which the surface with the best fit to the results is represented. (a) Aspect ratio for the different combination of stiffness and electric stimulus. (b) Directionality for the different combination of stiffness and electric stimulus.

Figure 10.
CMs in 10 and 40 kPa ECMs, under an alternating electric field of 50 and , after 160 h of simulation (see also Supplementary Materials video 3). (a) Higher tendency to form a group in the longitudinal direction is observed. Cells remain close to the center of the ECM where the cells maturate faster and the proliferation rate increases. Larger and better-oriented groups are formed by applying an alternating electric field, with better results for AR (b) and directionality (c).

Figure 11.
Representation of the obtained numerical results by applying an alternating electric field with different intensities in ECM with different stiffnesses. Blue dots represent 10 experiment repetitions, on which the surface with the best fit to the results is represented. (a) Aspect ratio for the different combination of stiffness and electric stimulus. (b) Directionality for the different combination of stiffness and electric stimulus.


Table 1.
Mechanical parameters considered in the model.
| Parameter | Description | Value | Refs. |
|---|---|---|---|
| Stiffness of the cell passive elements | 2.8 kPa | [72,73] | |
| Stiffness of the actin-myosin machinery | 7.0 kPa | [72,74] | |
| Maximum strain of the cell | 0.09 | [30,75] | |
| Minimum strain of the cell | −0.09 | [30,75] | |
| Maximum contractile stress exerted by the actin-myosin machinery | 0.25 kPa | [76,77] | |
| ECM Poisson ratio | 0.4 | [78,79] | |
| ECM viscosity | 1000 Pa·s | [64,80] | |
| k | Binding constant of the cell | mol | [28,80] |
| Number of available receptors of the cell | [28,80] | ||
| Saturation value of electric field | 1200 | [18] | |
| Saturation value of cell charge density | [45,81] | ||
| Concentration of the ligands at the of the cell | mol | [28,80] | |
| Minimum bound of projection to consider cell adhesion | 0.50 | [24] | |
| Minimum time needed for maturation | 6 days | [54,68] | |
| Time proportionality | 200 days | [72,82] | |
| Minimum level of mechanical stimuli for cardiac cell differentiation | −0.04 | [11,83] | |
| Maximum level of mechanical stimuli for cardiac cell differentiation | −0.01 | [11,83] | |
| Maximum mechanical stimuli which trigger apoptosis | 0.6 | [50,82] |
Publisher’s Note: MDPI stays neutral with regard to jurisdictional claims in published maps and institutional affiliations. |
© 2020 by the authors. Licensee MDPI, Basel, Switzerland. This article is an open access article distributed under the terms and conditions of the Creative Commons Attribution (CC BY) license (http://creativecommons.org/licenses/by/4.0/).
Share and Cite
MDPI and ACS Style
Urdeitx, P.; Doweidar, M.H. A Computational Model for Cardiomyocytes Mechano-Electric Stimulation to Enhance Cardiac Tissue Regeneration. Mathematics 2020, 8, 1875. https://doi.org/10.3390/math8111875
AMA Style
Urdeitx P, Doweidar MH. A Computational Model for Cardiomyocytes Mechano-Electric Stimulation to Enhance Cardiac Tissue Regeneration. Mathematics. 2020; 8(11):1875. https://doi.org/10.3390/math8111875
Chicago/Turabian StyleUrdeitx, Pau, and Mohamed H. Doweidar. 2020. "A Computational Model for Cardiomyocytes Mechano-Electric Stimulation to Enhance Cardiac Tissue Regeneration" Mathematics 8, no. 11: 1875. https://doi.org/10.3390/math8111875
Note that from the first issue of 2016, this journal uses article numbers instead of page numbers. See further details here.