Article

Sensitivity Analysis of In Silico Fluid Simulations to Predict Thrombus Formation after Left Atrial Appendage Occlusion

1
BCN-MedTech, Department of Information and Communication Technologies, Universitat Pompeu Fabra, 08018 Barcelona, Spain
2
Department of Cardiology, Hospital de la Santa Creu i Sant Pau, 08025 Barcelona, Spain
3
Instituto de Investigación e Innovación Biomédica de Cádiz (INiBICA), Grupo GADICOR, Hospital Universitario Puerta del Mar, Universidad de Cádiz, 11009 Cádiz, Spain
4
Electrophysiology and Heart Modeling Institute (IHU Liryc), 33600 Pessac, France
5
Centre de Recherche Cardio-Thoracique de Bordeaux, U1045, Université de Bordeaux, 33076 Bordeaux, France
6
Department of Cardiology, Hospital Clínic, 08036 Barcelona, Spain
*
Author to whom correspondence should be addressed.
Mathematics 2021, 9(18), 2304; https://doi.org/10.3390/math9182304
Submission received: 2 June 2021 / Revised: 8 September 2021 / Accepted: 15 September 2021 / Published: 18 September 2021

Abstract

:
Atrial fibrillation (AF) is nowadays the most common human arrhythmia and it is considered a marker of an increased risk of embolic stroke. It is known that 99% of AF-related thrombi are generated in the left atrial appendage (LAA), an anatomical structure located within the left atrium (LA). Left atrial appendage occlusion (LAAO) has become a good alternative for nonvalvular AF patients with contraindications to anticoagulants. However, there is a non-negligible number of device-related thrombus (DRT) events, created next to the device surface. In silico fluid simulations can be a powerful tool to better understand the relation between LA anatomy, haemodynamics, and the process of thrombus formation. Despite the increasing literature in LA fluid modelling, a consensus has not been reached yet in the community on the optimal modelling choices and boundary conditions for generating realistic simulations. In this line, we have performed a sensitivity analysis of several boundary conditions scenarios, varying inlet/outlet and LA wall movement configurations, using patient-specific imaging data of six LAAO patients (three of them with DRT at follow-up). Mesh and cardiac cycle convergence were also analysed. The boundary conditions scenario that better predicted DRT cases had echocardiography-based velocities at the mitral valve outlet, a generic pressure wave from an AF patient at the pulmonary vein inlets, and a dynamic mesh approach for LA wall deformation, emphasizing the need for patient-specific data for realistic simulations. The obtained promising results need to be further validated with larger cohorts, ideally with ground truth data, but they already offer unique insights on thrombogenic risk in the left atria.

1. Introduction

Atrial fibrillation (AF) is the most common arrhythmia diagnosed worldwide [1]. It causes abnormal electrical rhythm, and altered atrial contraction can lead to relative blood stagnation and thrombus formation, especially inside the left atrial appendage (LAA), a little protruding sack in the left atrium located just above the mitral valve. A recent study by Cresti et al. [2] showed that 99% of the thrombi found in patients with nonvalvular AF were generated in the LAA. Thrombus formation, AF, and LAA have been strongly linked over the years [3,4,5]. According to the Virchow’s triad three conditions need to be met for thrombus formation [6]: hypercoagulability, where most clinical variables might have an impact; endothelial injury; and blood stasis.
First-line treatments for nonvalvular AF patients are anticoagulants. Unfortunately, a non-negligible number of patients have a high risk of bleeding or other contraindications to anticoagulants, due to other comorbidities. Alternative treatments for those patients include percutaneous epicardial approaches for LAA ligation [7] or external closure of the LAA (e.g., AtriClip procedure; Atricure, Inc., Westchester, OH, USA) [8]; and the implantation of a device for left atrial appendage occlusion (LAAO) [9], where the endothelium is replaced by a nitinol surface after LAAO. However, suboptimal implantation of the device can lead to device-related thrombus (DRT). DRT increases the rate of stroke and has become an important concern, since the different antithrombotic therapies used after LAAO have not lowered its incidence, i.e., around 2–5% [10,11,12]. Hence, identifying potential factors that promote thrombus formation is essential to ensure an optimal and personalised device implantation, as well as a tailored post-procedural follow-up.
The study of blood stasis requires a complete characterisation of the local haemodynamics, which requires, in turn, a comprehensive morphological analysis. The latter can be achieved with advanced cardiac computed tomography (CT) images, while echocardiography is currently the main clinical tool to explore blood flow patterns and velocity profiles, usually through Doppler sequences. Typically, blood velocity is measured at end-diastole at the LAA ostium (i.e., the interface between the LA and LAA), with LAA emptying velocities <20 cm/s being associated with thrombus formation [5]. Colour Doppler acquisitions are also used to identify peridevice leaks (<3 mm) after LAAO [13]. However, echocardiographic images cannot fully characterise the complexity of 4D blood flow patterns in the LA. New imaging techniques such as 4D flow magnetic resonance imaging (MRI) or blood speckle tracking are promising but whether they can reach the sufficient resolution to capture the low blood velocities related to thrombus formation is still unclear.
As an alternative, in silico fluid modelling is a very interesting option to thoroughly assess the haemodynamics inside the LA. Several researchers [14,15,16,17,18,19,20,21,22,23,24,25,26,27,28,29,30,31,32,33,34] have investigated blood flow patterns in the left atria using computational fluid dynamics (CFD) simulations, in particular in AF conditions. Most of these studies focused on analysing in silico haemodynamics parameters in the LAA in relation to thrombogenic risk, including explicit models of thrombus formation [26,29]. The influence of pulmonary vein configuration on blood flow patterns in the LA was also studied [15,19,31,33]. In addition, the effect of LAA closure has been modelled [14,23,28], the most advanced investigations having incorporated LAAO devices [22,28] and the relation thereof to DRT [27].
The cited works use a wide range of boundary conditions and of modelling choices in terms of inlet/outlet setup (e.g., velocities and pressures in the pulmonary veins and mitral valve; from literature or patient-specific), LA wall behaviour (e.g., rigid, modelled dynamic mesh or deformation from medical images, and fluid–structure interaction), number of simulated cardiac cycles (e.g., from 1 to 20), and mesh resolution (e.g., from 0.4 to 30 × 10 5 mesh elements), among other factors. Table 1 shows a complete review of the corresponding modelling strategies reported in the literature. Unfortunately, the absence of joint benchmark studies with reliable ground truth makes it difficult to identify which are the optimal configurations to achieve realistic simulations. Moreover, there is no consensus on the most appropriate metrics for the quantification of blood flow simulations. Most studies report velocity profiles in relevant points of interest (e.g., filling/emptying velocities in the LAA), typically complemented with estimations of time-averaged wall shear stress (TAWSS), oscillatory index (OSI), endothelial cell activation potential (ECAP), residence times (TR), shear strain rate (SSR), kinetic energy (KE), particle tracking/residence analysis, and vortex visualisation with the Q-criterion or the Lambda2 metrics. Qualitative analyses of the blood flow patterns with streamline-based visualisation are commonly included. Arguably, the published investigations are usually based on only a few (<10) sets of patient-specific LA geometries (see Table 1), yet the most recent LA flow simulation studies [27,32,34] propose automatic modelling pipelines that allow substantial improvements in the capacity to process increased numbers of cases.
Due to the extensive range of modelling options reported in LA computational fluid dynamics, there is a need for best practice guidelines to build robust models and achieve reliable simulations as regards relevant clinical outcomes in LAAO. Accordingly, the present work aimed to perform a sensitivity analysis to variations in the main LA fluid modelling options, with patient-specific imaging data from six patients who underwent LAAO, including three DRT cases at follow-up. For each simulated case, the respective effects of four different boundary conditions scenarios (Scenarios 1–4 in Figure 1) were explored, with varying inlet/outlet configurations (e.g., pressure and velocity profiles at PV and MV, and rigid vs. dynamic mesh LA wall behaviour), to determine the ones that allow optimal predictions of the risk of DRT after LAAO. Mesh and cardiac cycle convergence analyses were also performed.

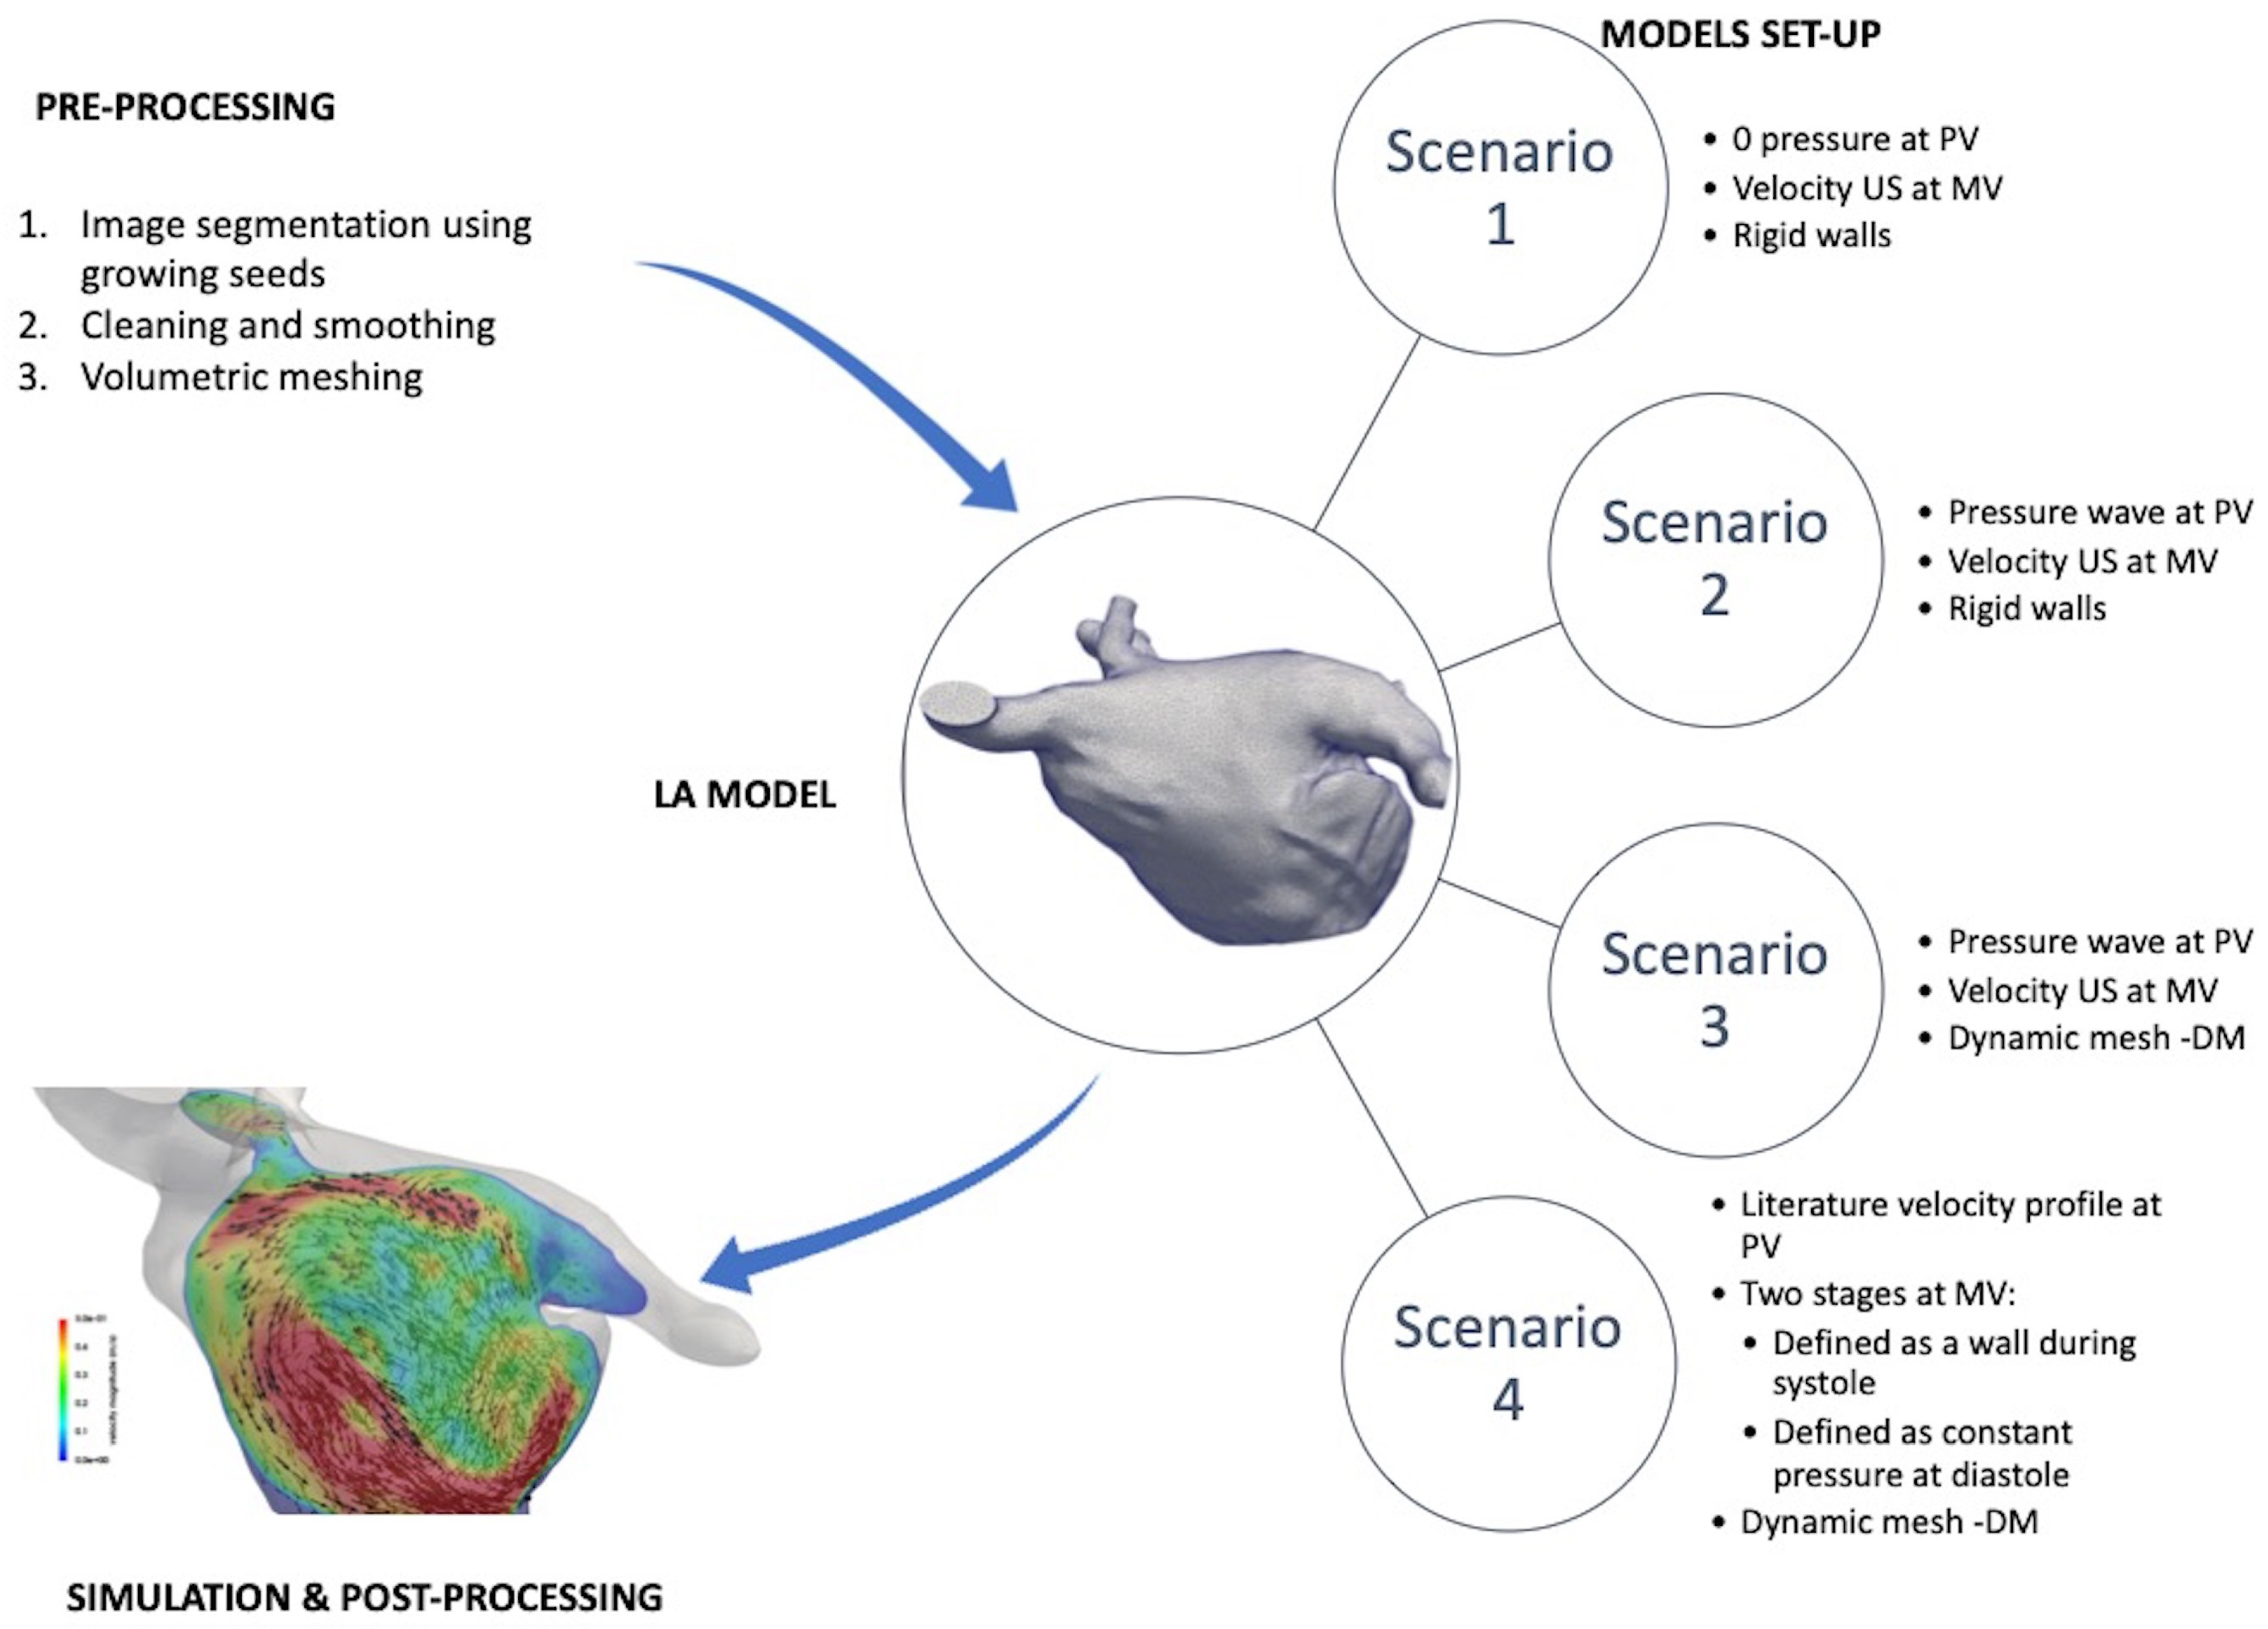
2. Materials and Methods

2.1. Database

A dataset of six patients from Hospital de la Santa Creu i Sant Pau (Barcelona) who underwent a LAAO were selected for the study. All patients had an implanted Amulet device (Abbott Vascular, Santa Clara, CA, USA), with sizes adapted to the different LA and LAA anatomies, as shown in Table 2. The selection of patients was based on the availability of a complete CT study at follow-up including the whole atrium anatomy and an echocardiography (transesophageal, TTE) study with mitral flow analysis. All patients had nonvalvular atrial fibrillation, with four of them being permanent and the remaining two paroxysmal (see Table 2). One of them (Pat 2) also presented severe mitral regurgitation. Three patients (Pat 4–6) had a history of DRT after LAAO. The study protocol was approved by the local ethical committee of the hospital, and patient written consents were obtained.
CT images were acquired at least twice, between months 1–3 and months 3–6 after LAAO implantation, respectively. Prospective cardiac-gated computed tomography angiography was performed with a Phillips Brilliance iCT scanner. A volumetric scan from heart to diaphragm (14–16 cm) was acquired. Cardiac phase reconstruction was performed at 30–40% of the RR interval. Initial digital image post-processing and reconstruction were achieved with the Brilliance Workstation™ to assess LAAO device positioning and presence/location of DRT. DRT was defined as a CT hypodensity at the left atrial extremity of the device: (1) not explained by imaging artefacts; (2) inconsistent with normal healing; (3) visible in multiple CT planes; and (4) in contact with the device. Patient data were anonymised prior to any computational processing. Two-dimensional and Doppler echocardiography were performed within 7 days from CT follow-up acquisition. Trans-mitral flow pulsed-wave Doppler velocities were recorded from the apical four-chamber view, the Doppler samples being placed between the tips of the mitral leaflets. Finally, pressure curves in the pulmonary veins (PV) and the mitral valve from an AF patient, different from the six cases analysed in our study, acquired with invasive catheterisation, were available to setup inlet boundary conditions and to estimate pressure gradients to be compared with the simulated ones.
The LA morphology of the six studied patients was different, as can be seen in Table 2. For instance, LA volumes ranged between 143 mL and 281 mL. Additionally, the number of PV also differed (from 4 to 6 PV), while their inclination, particularly for the right PV, was more pronounced in some cases (e.g., Pat 2) than in others.

2.2. Methodological Steps

The fluid modelling pipeline (see Figure 1) started with the creation of patient-specific volumetric computational meshes of the LA from the available CT images. Four different scenarios of boundary conditions were tested to identify the numerical approximations that lead to the most reliable DRT in silico predictions after LAAO device implantation. Additionally, mesh and cardiac cycle convergence analyses were performed. Fluid simulation results were post-processed to obtain in silico haemodynamic indices including blood flow velocities near the device surface, time-averaged wall shear stress (TAWSS), oscillatory index (OSI), endothelial cell activation potential (ECAP), and relative residence times (RRT). For visualisation purposes, blood flow simulations were qualitatively assessed with streamlines and 2D flattened representations of the LA.

2.2.1. 3D Model Construction

For each selected patient, the anatomy of the left atrium (LA) was extracted out of the clinical computed tomography (CT) images, by using the open-source software Slicer (4.10.1 (http://www.slicer.org/)) and a semi-automatic region-growing technique. A binary mask representing the LA was obtained, and a surface mesh was created with the classical marching cubes algorithm, followed by a smoothing process to correct irregularities generated by the segmentation process. A Taubin filter smoothing was applied ( λ = 0.5 and μ = −0.53) [35], followed by manual removal of self-intersecting faces and nonmanifold edges wherever necessary. The software used to reconstruct the models were Meshlab 2016.12 (http://www.meshlab.net/), and Meshmixer 3.5 (http://www.meshmixer.com). The pulmonary veins could be reconstructed directly from the CT-based segmentation. To consistently define the inlets of the computational models for all 3D models, we followed a common criterion to determine the PV length, defining a cut just before the first branch coming out from the LA.
In order to solve the fluid domain inside the LA, a volumetric mesh was generated. The Delaunay algorithm available in the open-source software Gmsh (4.0.4 (http://gmsh.info/)) was used for this purpose, creating a tetrahedral mesh with a maximum of 5 × 10 5 elements due to the limitations of the academic license of ANSYS Fluent 19.2 (Ansys, Inc., Canonsburg, PA, USA (https://www.ansys.com/products/fluids/ansys-fluent)), which was the software used to run the fluid simulations. Additionally, one patient was selected for the mesh convergence study, creating meshes of 1 × 10 5 , 2 × 10 5 , 3 × 10 5 , 4 × 10 5 , and 5 × 10 5 elements. The Netgen (https://ngsolve.org) software was also used for further optimisation of the resulting volumetric meshes.

2.2.2. Simulation Setup

Blood was modelled as an incompressible Newtonian fluid with a density of 1060 kg/m3 and a dynamic viscosity of 0.0035 Pa.s. The Reynolds numbers (Re), computed at the MV and PV, indicated that a laminar regime shall be considered (Re values ranging from 651 to 2260). The flow was deemed to be Newtonian, since the shear rate values were higher than 100 s−1 [36]. The time step was set to 0.01 s. Residuals for continuity equations were set as 0.001 to reach absolute convergence criteria.
Three cardiac cycles were calculated for each patient-specific simulation. The first cycle was used to initialise the model, in terms of fluid regimes, whereas the remaining two cycles were used for case analyses and comparisons of the different boundary conditions scenarios. The length of each cardiac cycle was adapted to the information available from the electrocardiogram (ECG) of each patient. In addition, one geometrical model was chosen to study the convergence of simulations, with the calculation of up to 15 heartbeats.

2.3. Boundary Conditions Scenarios

Due to the large variability of boundary conditions found in the literature for LA fluid modelling, we evaluated the influence of the most common corresponding approximations on the simulation results. In particular, different configurations of inlets and outlets, respectively, at the pulmonary veins and mitral valve, were tested. Fluid pressure or velocity profiles at the PV (inlet) and MV (outlet) were selected, either from the literature or from patient-specific data. Furthermore, the impact of considering the dynamic behaviour of the LA wall was compared to the classical assumption of rigid walls.

2.3.1. Scenario 1: Constant (Null) Inlet Pressure, Imaging-Based Personalised Outlet Velocities, and Rigid Wall

The first scenario consisted of setting up a constant inlet pressure equal to 0 mmHg (as in [18,20]), while a patient-specific Doppler-based velocity profile was defined in the MV outlet. Mitral velocities from Doppler data were quite variable for different patients, from 0.4 to 3 m/s. The LA wall was considered rigid, i.e., without movement, resulting in a pure computational fluid dynamics (CFD) modelling study. Such an assumption is a common approach in the literature [15,18,19,22,23,26,32], which is based on the reduced wall movement in patients with atrial fibrillation.

2.3.2. Scenario 2: Generic Patient Pressure Wave as Inlet, Imaging-Based Personalised Outlet Velocities, and Rigid Wall

The second scenario replaced the constant inlet pressure in Scenario 1 with the available pressure waves in the pulmonary veins of an AF patient. For each simulated case, this AF pressure wave was personalised, as it was adapted to the cardiac rhythm of each patient, derived from the ECG. A smoothing filter was also applied to the pressure wave, using MATLAB R2018a (Mathworks, Natick, MS, USA), to remove the noise in the signal. Similarly to Scenario 1, patient-specific velocities were set up as outlet boundary conditions and the LA wall was assumed as rigid.

2.3.3. Scenario 3: Generic Patient Pressure Wave as Inlet, Imaging-Based Personalised Outlet Velocities, and Dynamic Mesh Wall Deformation

Scenario 3 incorporated deformation of the LA wall to study the differences with respect to the rigid wall assumption in the previous scenarios. In the literature, some studies imposed LA deformation extracted from the processing of CT or MR images into the fluid simulations [16,17,20,21,25,29,30], while others developed advanced fluid–structure interaction models [14,24,31]. When dynamic medical images are not available, an interesting alternative is to use a dynamic mesh approach [27,28,33,34] with displacements generated either synthetically or from literature data.
In this work, a dynamic mesh approach was applied to the LA meshes, guided by the longitudinal movement of the mitral valve (MV) ring and based on a diffusion-based method available in ANSYS Fluent 19.2 (Ansys, Inc., Canonsburg, PA, USA (further information can be found at http://www.ansys.com/support). Physiologically speaking, this approach mimics the passive movement of the LA produced by the contraction of the left ventricle (LV), omitting the LA radial movement since AF patients rarely have strong active contraction. A MV annulus ring displacement function measured by Veronesi et al. [37] was used, assuming similar longitudinal behaviour in nonvalvular AF and healthy subjects (i.e., from 8 to 10 mm), as shown in [38].
Finally, the displacements of the LA wall results from the Laplace equation:
· ( γ u ) = 0 ,
where u is the velocity field of the mesh displacement. γ is the diffusion coefficient that controls the propagation (i.e., interpolation) of the boundary displacements away from the application points as follows:
γ = 1 d α ,
where d is a normalised boundary distance and α is a diffusion parameter introduced by the user. α was set to 0, which yielded a uniform diffusion of the boundary motion throughout the mesh. The resulting dynamic mesh displacements were also synchronised to each patient, based on the cardiac rhythm extracted from each individual ECG and using linear interpolation functions available in MATLAB R2018a (Mathworks, Natick, MS, USA), as described above for the pressure waves.

2.3.4. Scenario 4: Literature Velocity Profile as Inlet, Mitral Valve as Wall (Systole) or Constant Pressure (Diastole), and Dynamic Mesh Wall Deformation

The fourth studied scenario represented a different set of boundary conditions, often found in the literature [14,19,22,23,29,31,32,34]. A velocity profile was imposed in the PV inlets, while the mitral valve was modelled as a wall during ventricular systole and with a constant pressure at diastole (equal to 8 mmHg in our study). A generic PV velocity profile from literature [39] was used in all analysed cases since it was not possible to obtain reliable PV velocity curves from all the available echocardiographic studies (i.e., due to an insufficient visual window in some locations such as the right superior pulmonary vein). The LA wall behaviour was modelled with the dynamic mesh approach, as in Scenario 3.

2.4. In Silico Haemodynamic Indices
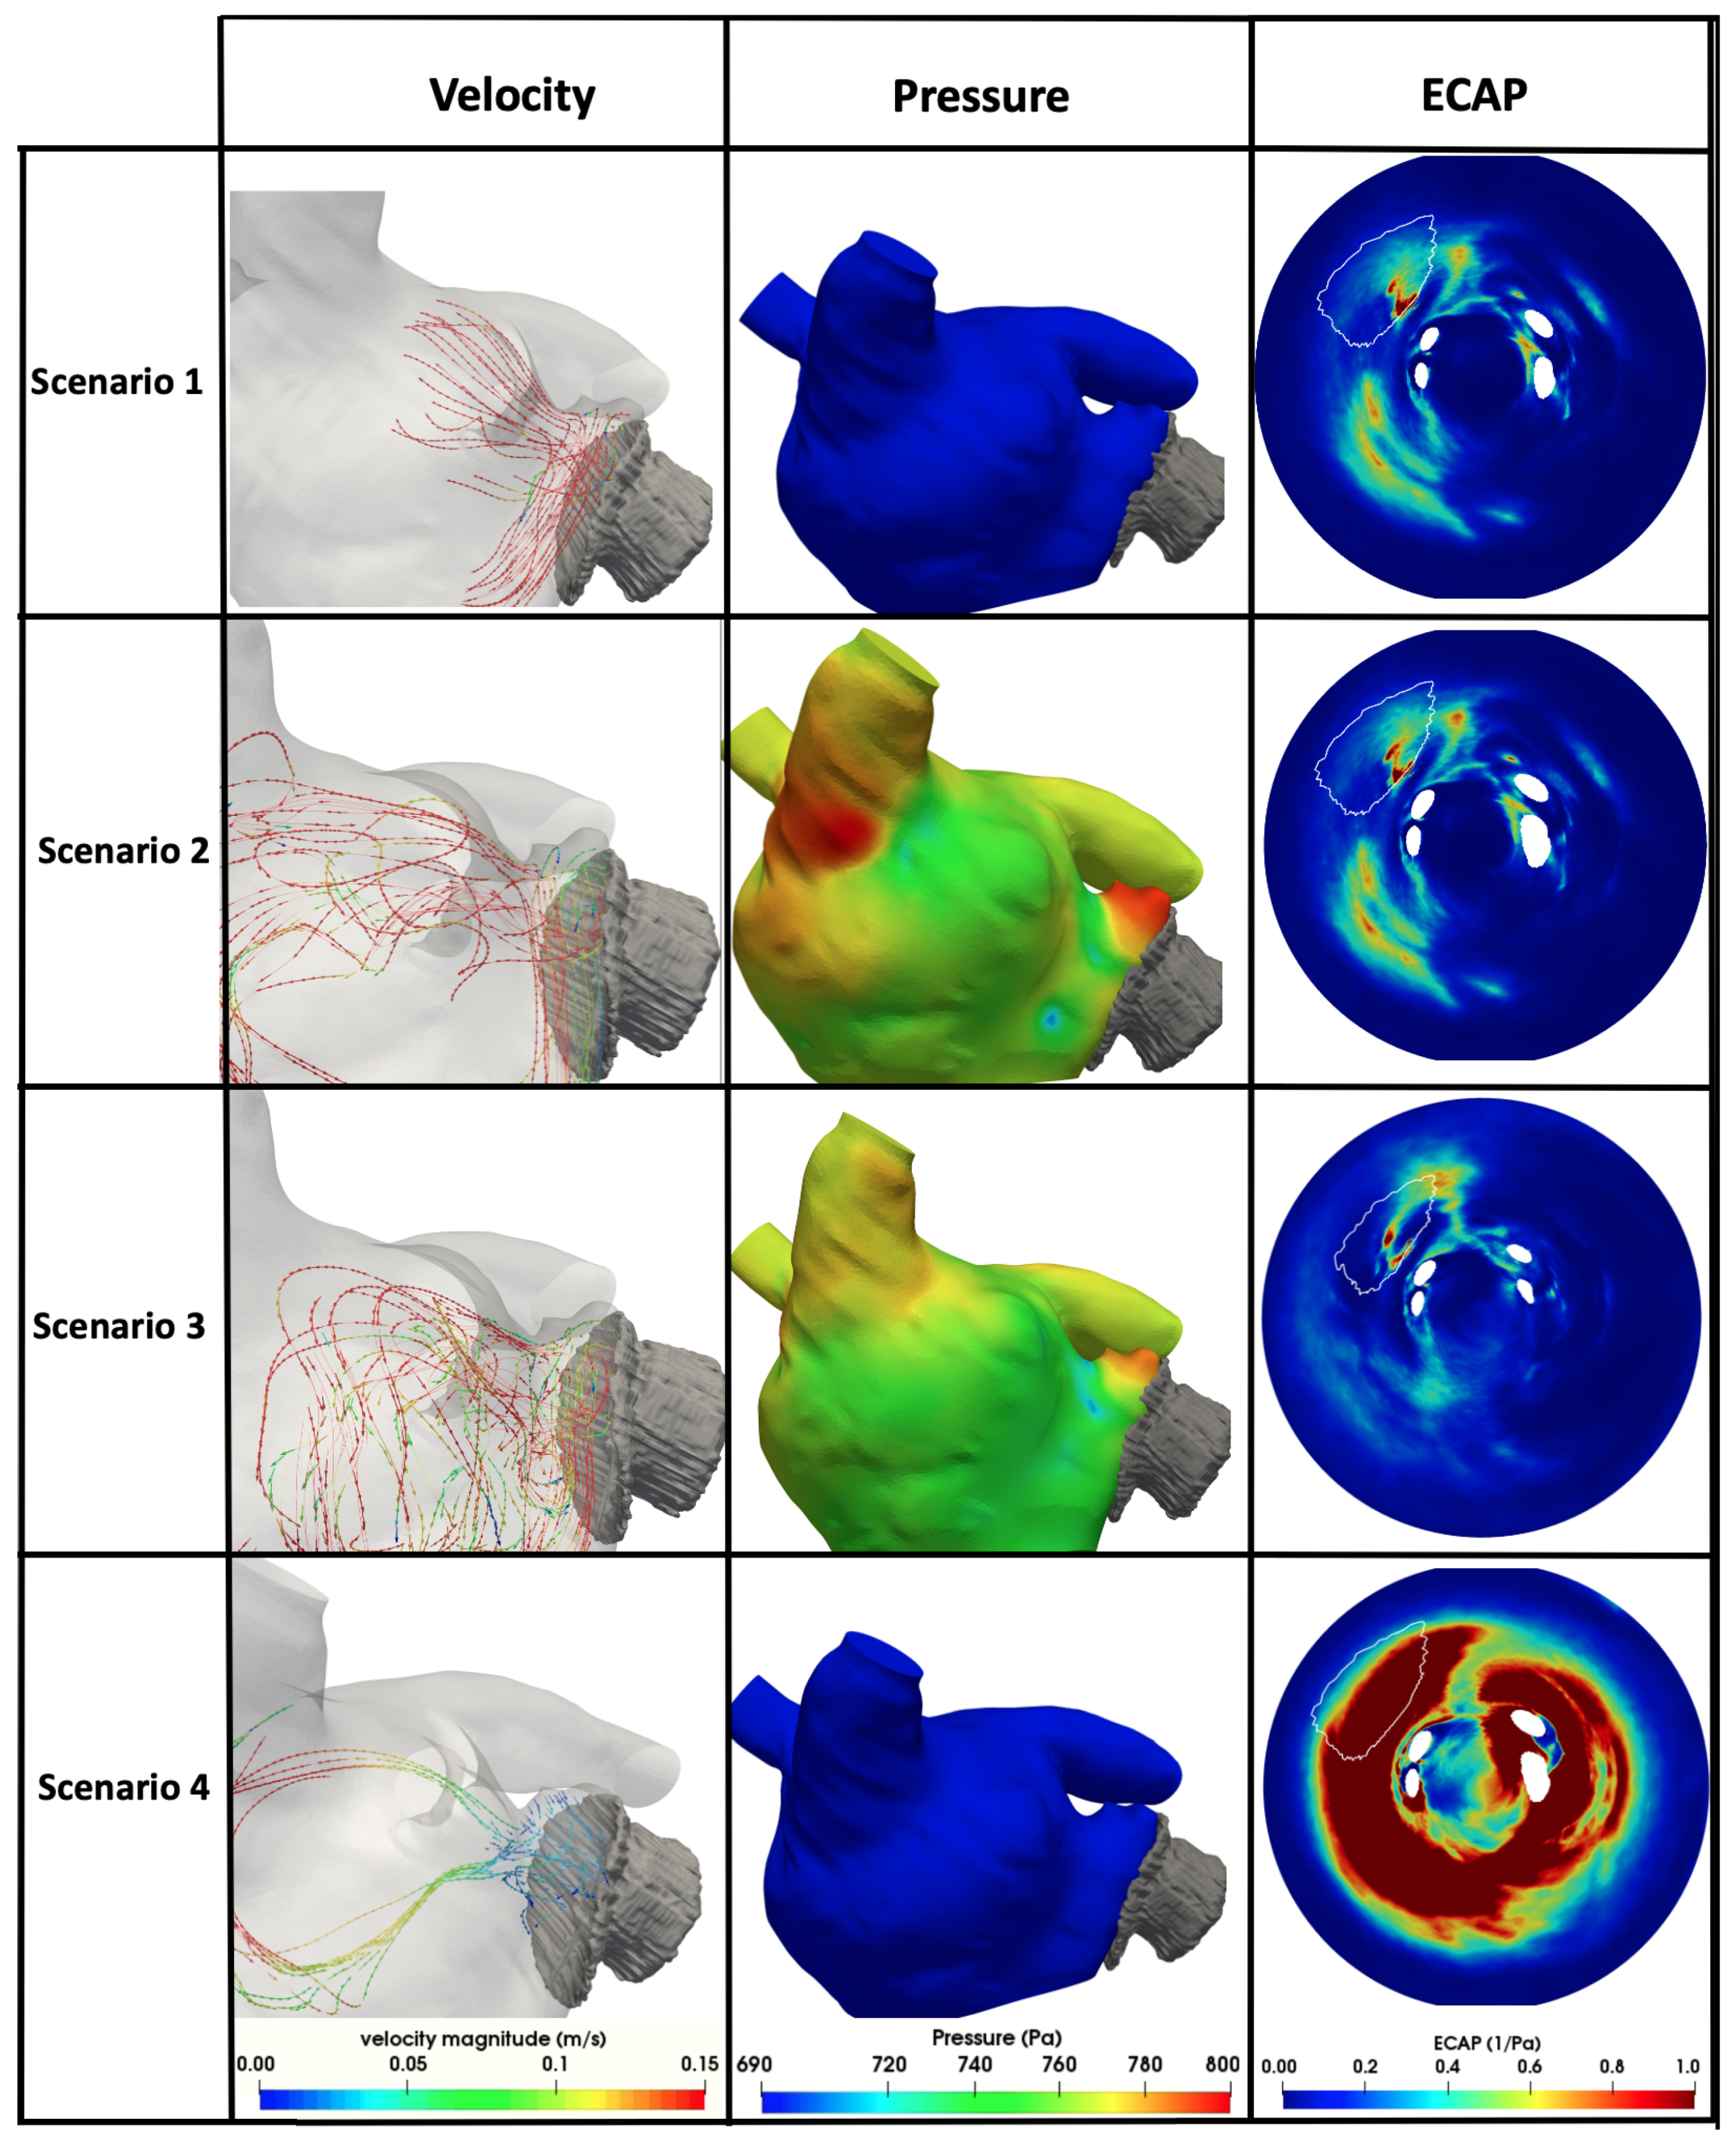
Several in silico haemodynamic indices were estimated from the fluid simulations to compare the different scenarios. First, blood flow velocities were integrated in an area between the end of the left superior pulmonary vein (LSPV) and the device surface, including the pulmonary ridge. This area is very relevant for DRT modelling since it is where thrombi tend to form due to low blood flow velocities and complex fluid patterns. Additionally, unlike most of the LA fluid modelling literature, we analysed the simulated pressure distributions and gradients, which could be compared with invasive measurements from AF patients.
The ECAP haemodynamic index, originally developed to detect areas prone to produce aneurysm thrombi [40], was estimated from the fluid simulations to determine regions with low blood flow velocities and complex flow patterns. The computation of ECAP was performed as the ratio between the TAWSS (related to flow velocities) and the OSI (related to flow complexity; 0 and 0.5 meaning an unidirectional and bidirectional flow, respectively) indices, as follows:
T A W S S = 1 T 0 T | W S S | d t .
O S I = 1 2 0 T W S S d t 0 T | W S S | d t .
E C A P = O S I T A W S S ¯ .
The ECAP values would be higher in areas with low blood flow velocities (i.e., small TAWSS values) and complex fluid patterns (i.e., large OSI values), precisely where the risk of thrombus formation is higher. The relative residence time (RRT) [41], another in silico haemodynamic index that combines WSS and OSI estimates to reflect the residence time of blood particles near the wall, was also computed as follows:
R R T = [ 1 ( 2 · O S I ) · T A W S S ) ] 1 .
Post-processing and visualisation of the simulation results were performed using ParaView 5.4.1 (https://www.paraview.org/). Finally, a quasiconformal (i.e., angle-preserving) flattening [42] was applied to obtain a 2D disk-like representation of the LA (mapping the MV contour to the external boundary of the 2D disk) for visualisation and interstudy comparison purposes.

3. Results

3.1. Inlet/Outlet and Wall Behaviour Scenarios

Figure 2 shows a qualitative comparison of haemodynamics in silico indices obtained with different inlet/outlet and wall behaviour boundary conditions (BC) in one DRT patient out of the six studied clinical cases. It includes velocity and pressure profiles as well as ECAP maps (i.e., high values of ECAP indicating more thrombogenic risk since they reflect low velocities and more complex flows). For a simplified visualisation of in silico haemodynamic indices and easier comparison among the different cases, a flattening algorithm [42] was applied to the LA 3D meshes so that a 2D common representation of the LA was obtained. The white holes in the 2D maps correspond to the pulmonary veins.

3.1.1. Scenario 1: Constant (Null) Inlet Pressure, Imaging-Based Outlet Velocities, and Rigid Wall

Scenario 1 delivered pressure values from −100 Pa (−0.75 mmHg) to 300 Pa (2.25 mmHg), which were substantially lower than the ones measured with invasive catheters, which ranged from 6 mmHg to 12 mmHg. In addition, the simulated mean pressure gradient between the PV and MV was of 190 Pa (1.43 mmHg), being much higher than those acquired in the clinical setup (between 0.07 mmHg and 0.5 mmHg). Velocity magnitudes were within the physiological range, with blood flow patterns (see Figure 2) qualitatively simpler than in other scenarios, without obvious recirculations despite the clinical evidence of DRT. Pressure values were homogeneous in the whole LA. The highest values of ECAP (i.e., linked to higher thrombogenic risk) were obtained at the LAAO device’s surface, at the upper part, near the pulmonary ridge.

3.1.2. Scenario 2: Patient Pressure Wave as Inlet, Imaging-Based Outlet Velocities, and Rigid Wall

The inclusion of an AF patient pressure wave at the inlet BCs in Scenario 2 (i.e., pressure wave from an AF patient at the inlet pulmonary veins, velocity curve from a generic ultrasound images as mitral valve outlet, with rigid wall behaviour) provided a more realistic simulated pressure map than in Scenario 1, as illustrated in Figure 2. Pressure values ranged from 125 Pa (0.94 mmHg) to 1110 Pa (8.33 mmHg), while the mean PV–MV gradient was of 15 Pa (0.11 mmHg), which were closer to clinical measurements than in Scenario 1. Velocity streamlines showed more recirculations with low velocities (blue-green in Figure 2) near the device than in Scenario 1. Regions of high ECAP were similarly located as in Scenario 1, but with slightly higher values.

3.1.3. Scenario 3: Patient Pressure Wave as Inlet, Imaging-Based Outlet Velocities, and Dynamic Mesh Wall Deformation

The inclusion of a dynamic mesh-based movement in Scenario 3 led to lower pressure values near the device’s surface compared to Scenario 2. Pressure values ranged from 174 Pa (1.31 mmHg) to 1240 Pa (9.30 mmHg), with the average PV–MV pressure gradient of 11 Pa (0.08 mmHg). The blood flow patterns in Scenario 3 (see Figure 2) showed more recirculations than the other scenarios, with complex haemodynamic areas near the LAAO device, including low velocities. Interestingly, the ECAP map of Scenario 3 presented a new area with high risk of thrombus formation, at the right side of the device, in addition to the area identified in previous scenarios.

3.1.4. Scenario 4: Literature Velocity Profile as Inlet, Mitral Valve as Wall (Systole) or Constant Pressure (Diastole), and Dynamic Mesh Wall Deformation

Fluid simulations with Scenario 4 boundary conditions diverged in four out of the six analysed cases, whereas convergence was reached for all cases in the rest of the scenarios. With its opposite BC strategy (i.e., velocities at inlets and pressures at outlets), Scenario 4 provided substantially different haemodynamic in silico indices compared to the other three scenarios. Pressure maps provided during ventricular systole (i.e., MV closed without outlet pressure BC) were similar to Scenario 1 (around 0 Pa). With the opening of the mitral valve in ventricular diastole and the application of constant outlet pressure BC, the pressure raised up to 1200 Pa (9 mmHg), resulting in the largest pressure range in all scenarios. In contrast, the pressure gradient between the PV and MV was 4 Pa (0.03 mmHg), i.e., the lowest in any of the tested boundary conditions. High blood velocities were found in the superior part of the LA, in contrast to other scenarios. However, blood flow stagnation was also largely pronounced in the inferior part of the LA, presenting very low velocities (blue streamlines in Figure 2). The consequence of this flow overstagnation was an ECAP mapping with high values almost all over the LA, making it difficult to distinguish thrombogenic from healthy areas.

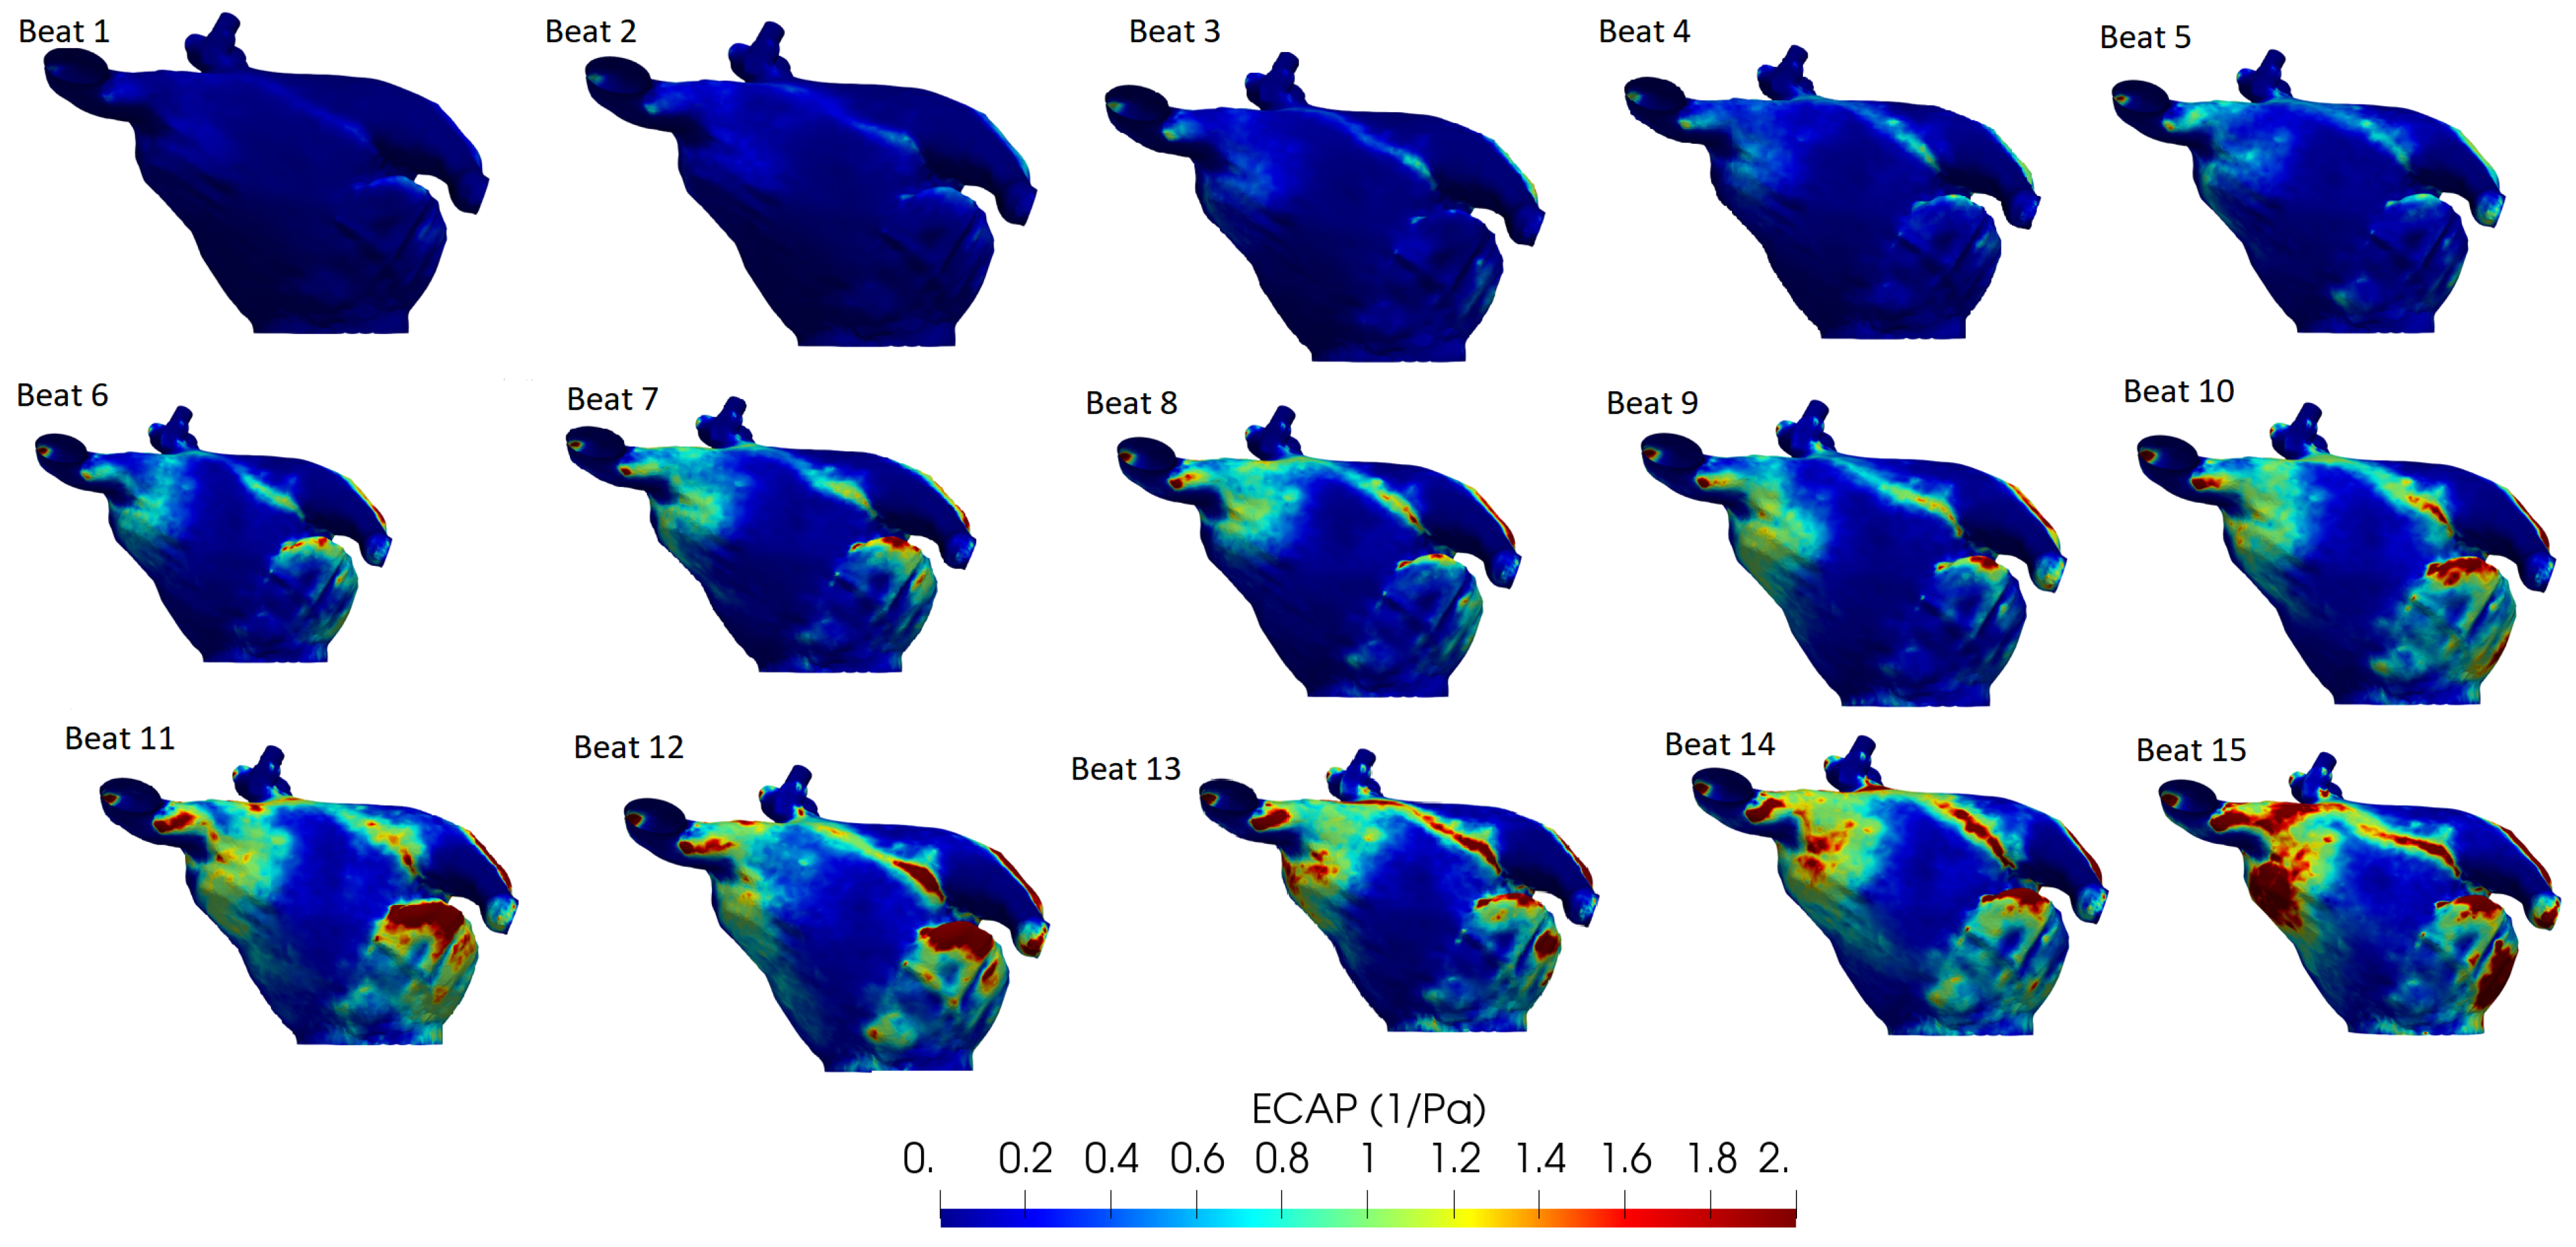
3.2. Mesh and Cardiac Cycle Convergence

Simulated blood flow velocities (with Scenario 3 boundary conditions) next to a pressure inlet (the left superior pulmonary vein, which is the closest to the LAA) were used to assess mesh convergence. The reference mesh was the one with the highest resolution, i.e., 5 × 10 5 elements. The mesh with 4 × 10 5 elements had a mean difference of 0.8% (maximum error of 3%) in velocities compared to the reference; substantially lower than coarser meshes (10.2% with 1 × 10 5 elements, 5.5% with 2 × 10 5 elements, and 2.7% with 3 × 10 5 elements).
Figure 3 illustrates the ECAP maps for 15 simulated cardiac cycles for one case in our study (Scenario 3 boundary conditions). The initial couple of beats were required for warming up and numerical stabilisation. From beat 3 on, initial areas with higher values of ECAP emerged, especially around the LAA and PV, which were maintained over all cycles. After beat 6–7, the main regions with high ECAP were established, with values tending to increase over the cardiac cycles.

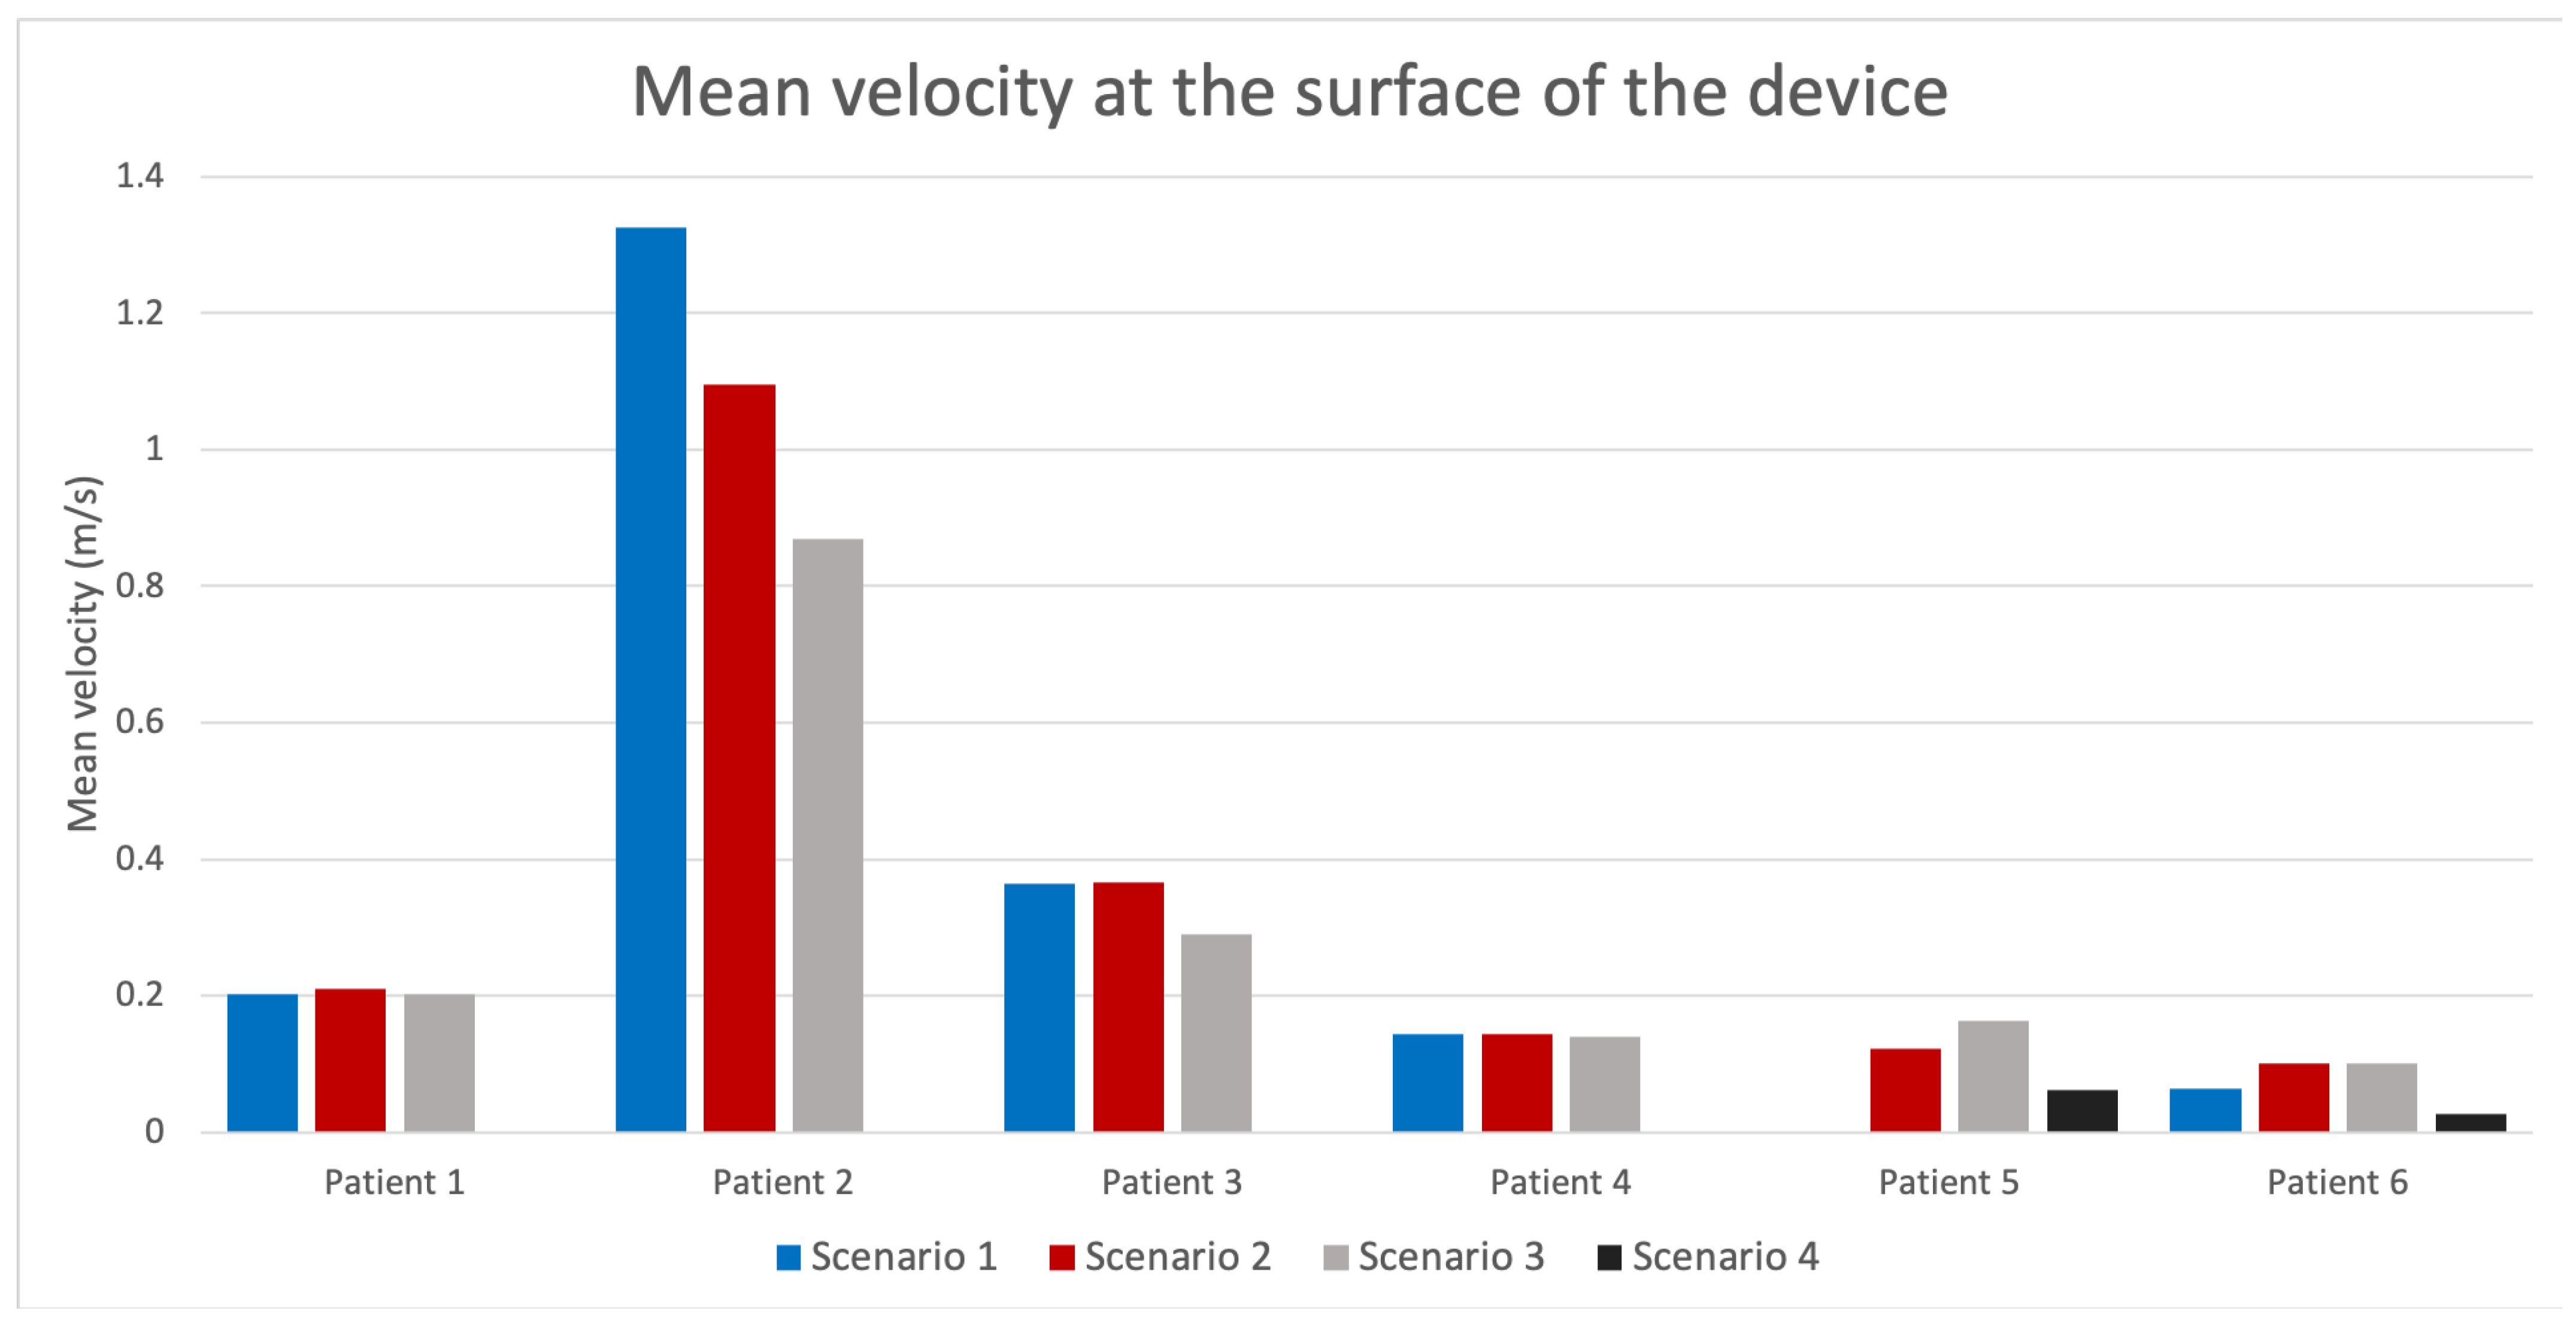
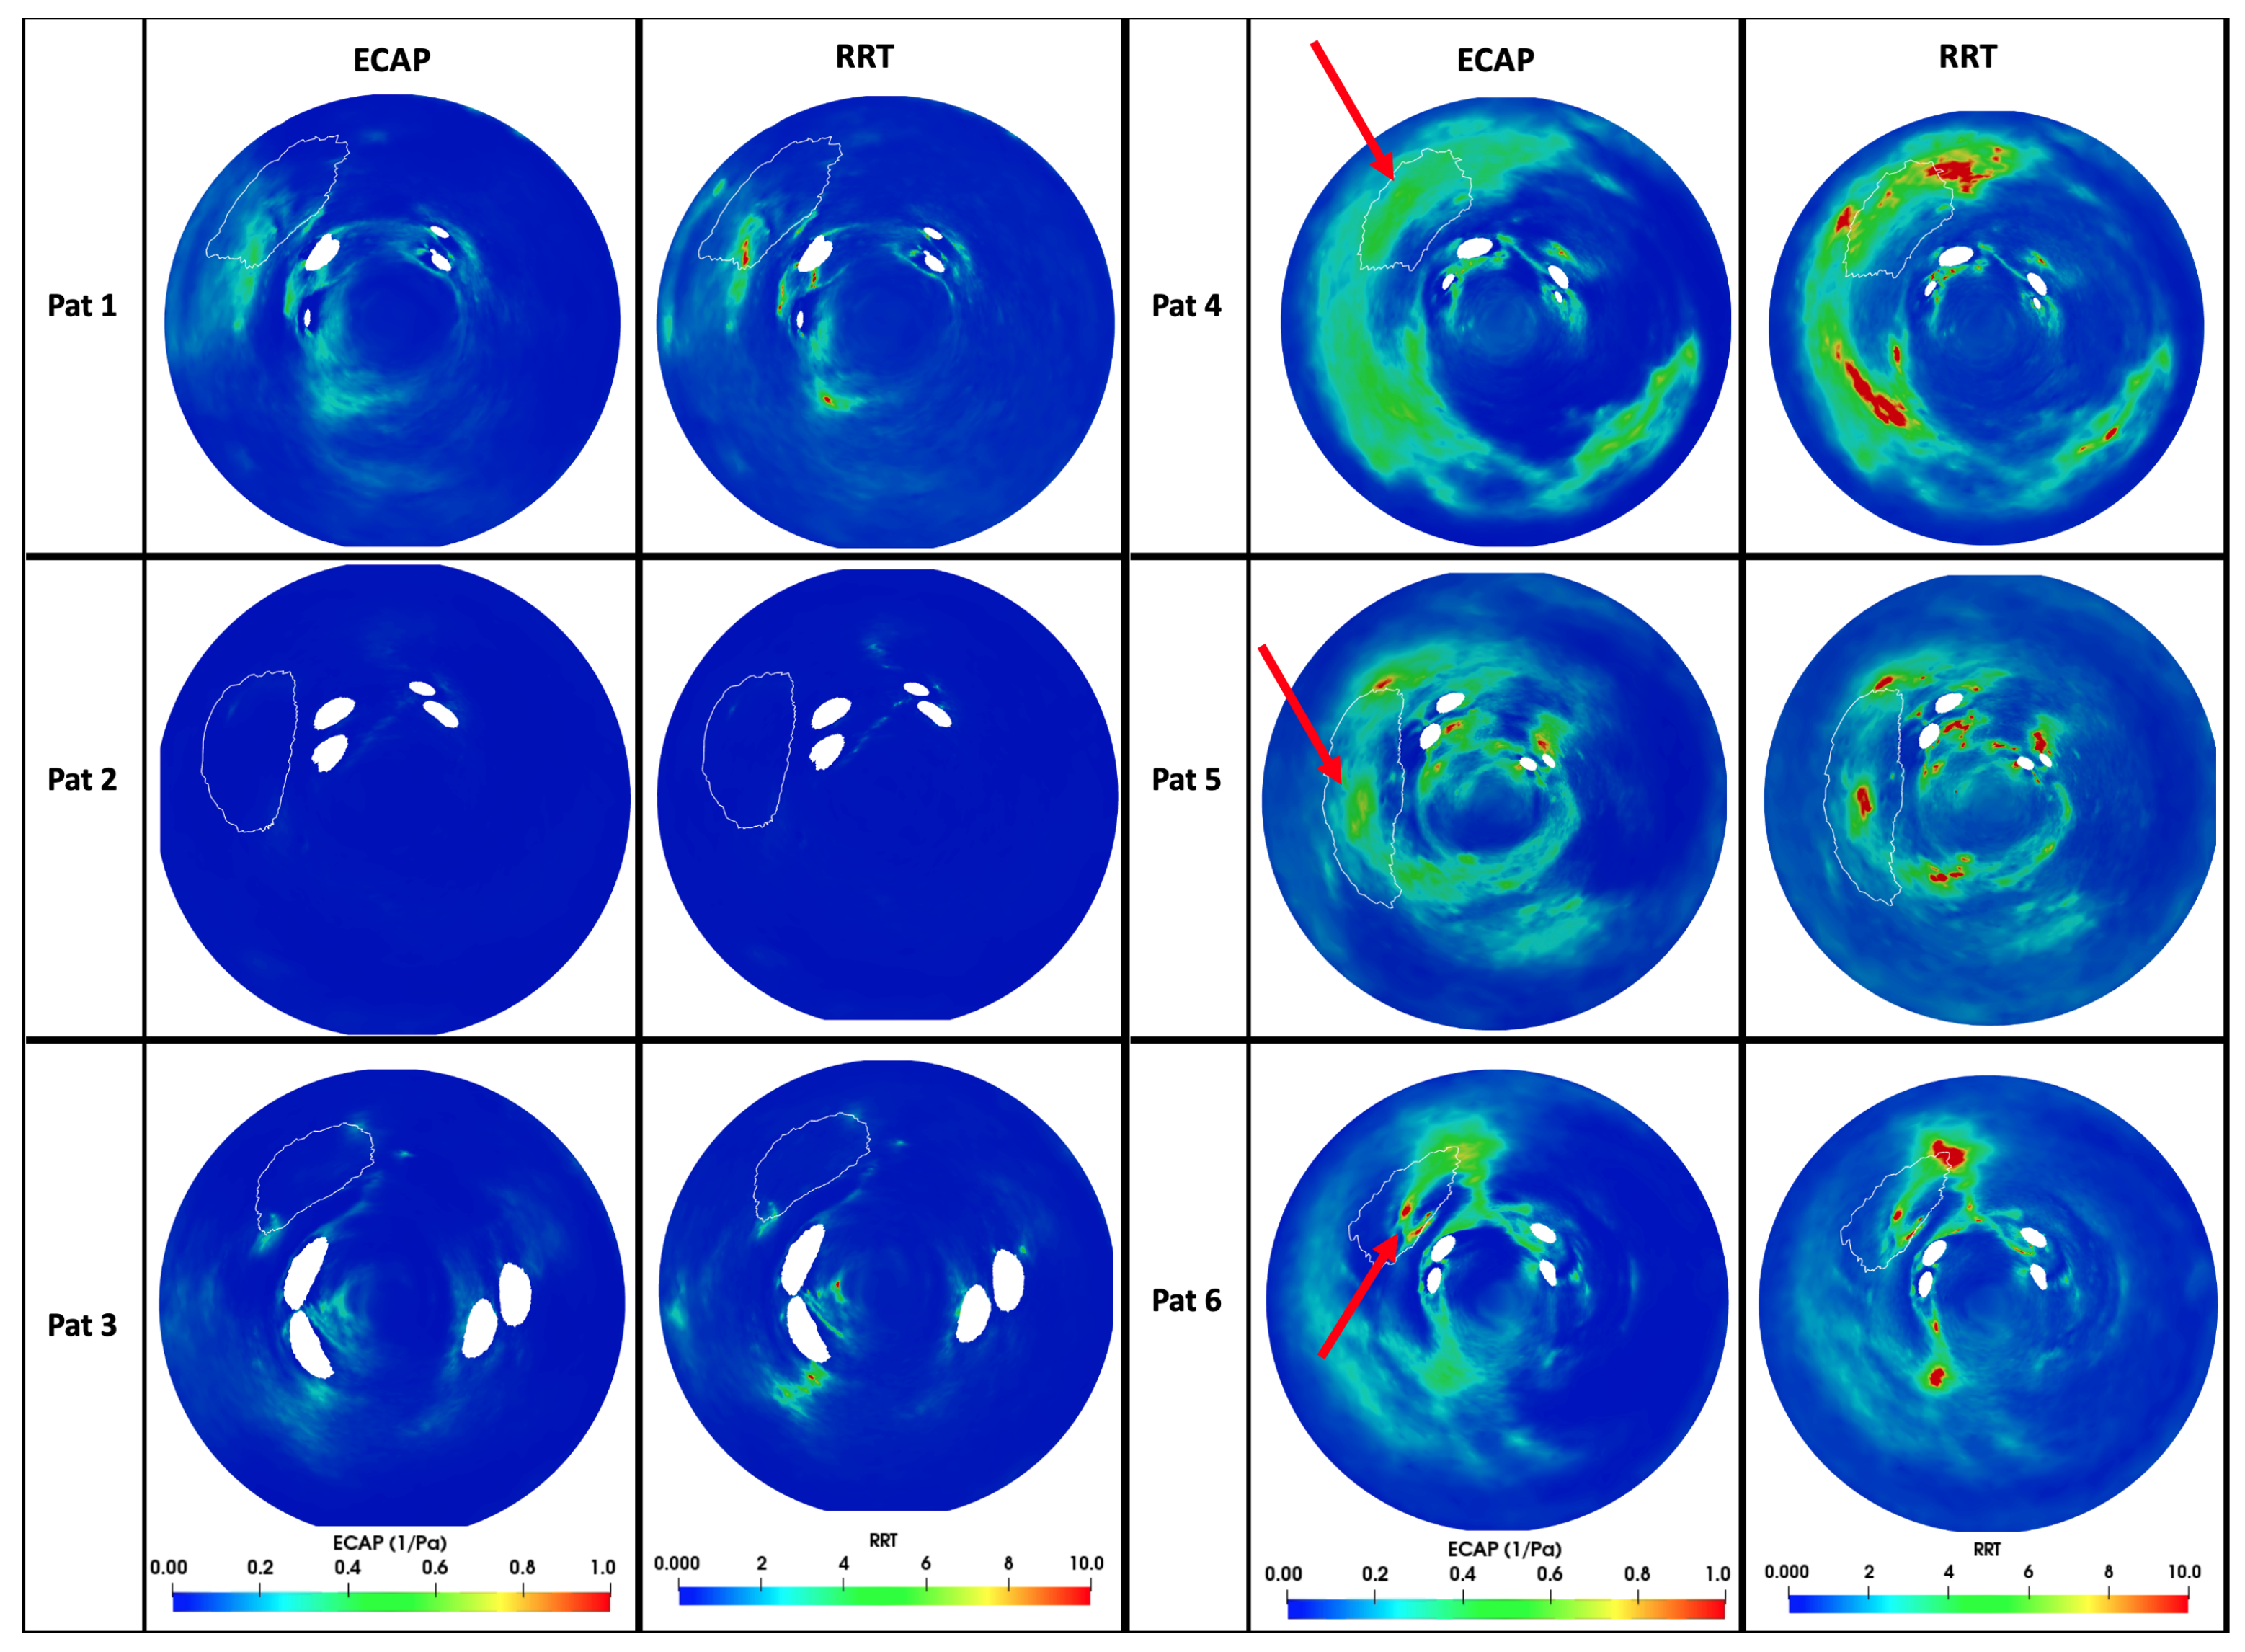
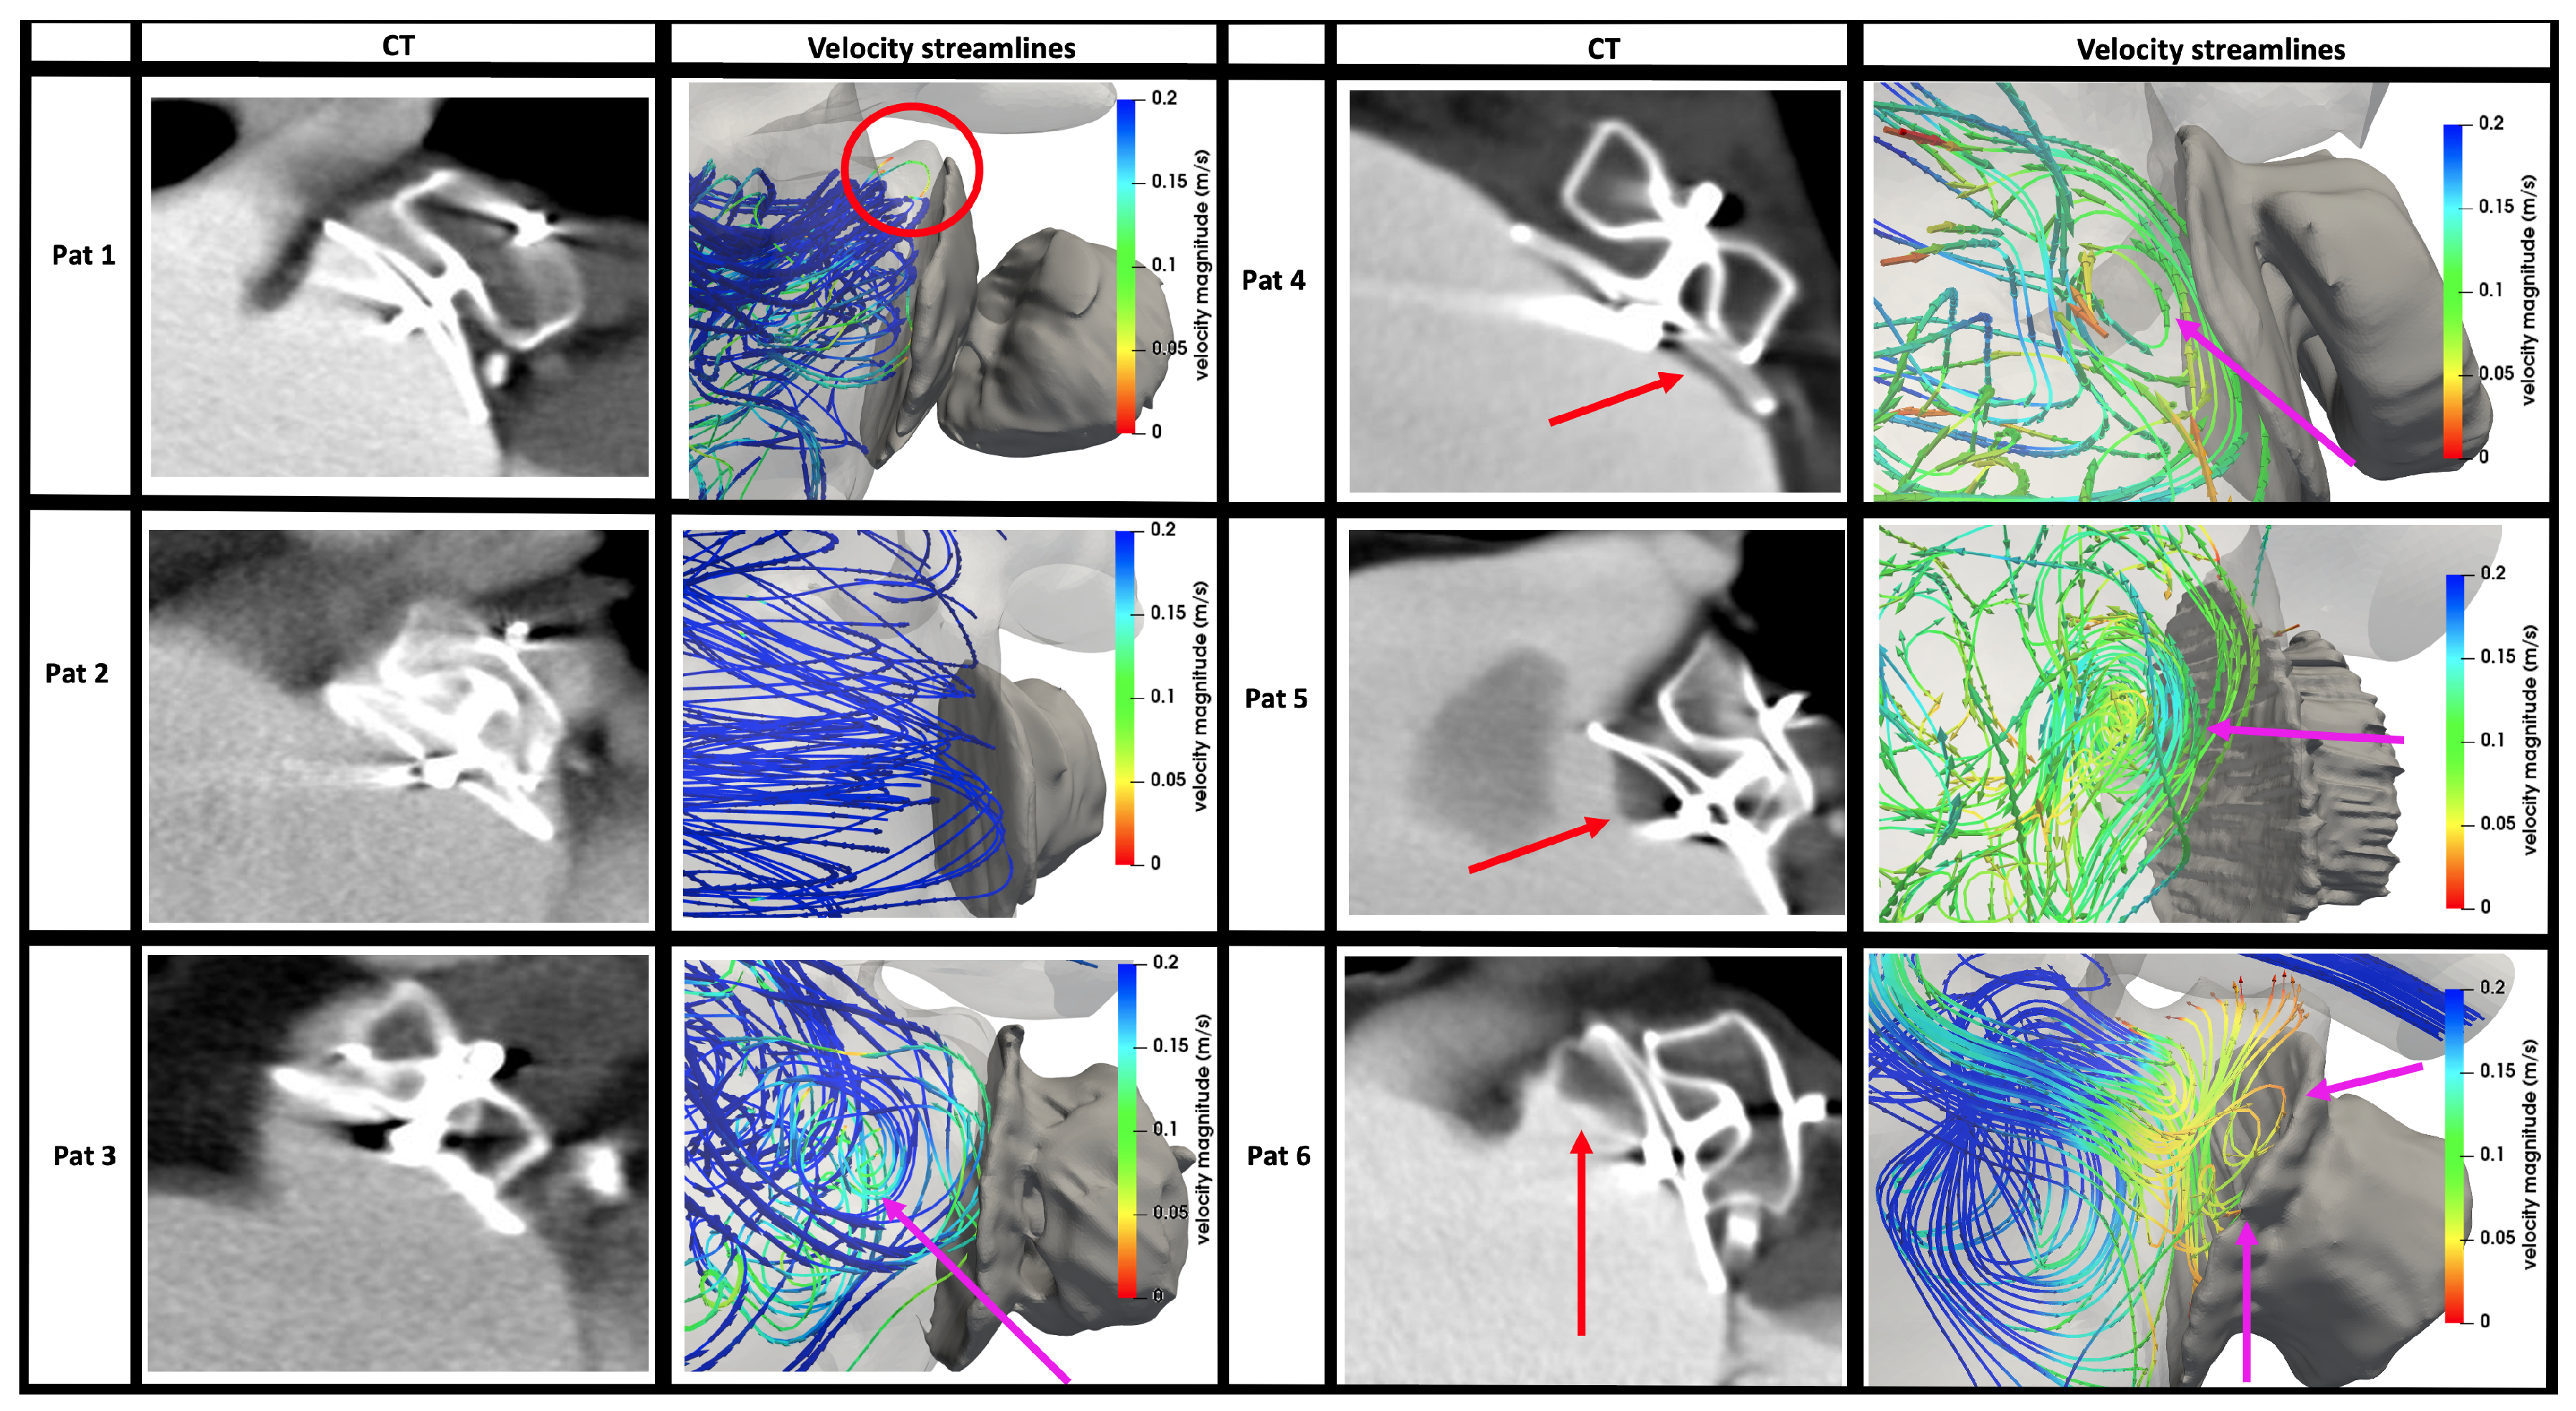
3.3. In Silico Prediction of Device-Related Thrombosis

Figure 4 shows the mean blood flow velocities near the surface of the implanted LAAO device in all analysed cases, including simulations with different boundary conditions scenarios. It can easily be observed that DRT cases (Pat 4–6) had lower velocities (<0.20 m/s) than patients without thrombogenic history (Pat 1–3), independently of the BC scenarios. Interestingly, the second case (Pat 2), which suffered from a severe mitral regurgitation (MR), presented substantially higher velocities than the remaining cases.
Two-dimensional flattened maps of the LA showing the distribution of the ECAP and RRT in silico haemodynamic indices in the six studied cases (with Scenario 3 boundary conditions) can be seen in Figure 5. Similarly to the analysis of the blood flow velocities near the device surface, DRT and non-DRT cases present substantial differences in ECAP and RRT, with the former showing larger values, especially in the device surroundings. Both ECAP and RRT maps depicted comparable distribution maps, with RRT showing more areas with maximum values. Figure 6 shows the follow-up CT scans of all analysed patients together with the simulated blood flow patterns, including where the thrombus was formed in DRT cases. It can be observed a good agreement between thrombus localisation and areas with low blood flow velocities and complex patterns (i.e., recirculations; red arrows in velocity streamlines of Figure 6) in the fluid simulations.

4. Discussion

In silico fluid simulations have the potential to play a major role in the optimisation of LAAO procedures, contributing to a better understanding of haemodynamics after the implantation and avoiding adverse outcomes such as the formation of DRT. Despite several LA-based fluid models available in the literature, which are usually applied on a limited number of patient-specific geometries, there is a lack of consensus on the most appropriate set of boundary conditions (see Table 1 to generate realistic simulations). Systematic verification and validation studies, following the ASME V&V40 guidelines [43] with in vitro and/or ex vivo data, are also missing due to the difficulties to obtain ground truth data. Therefore, there is a need for building credibility of LAAO-based in silico models to integrate them as part of the medical device certification procedures by organisations such as the Food and Drug Administration (FDA).
In this work we have presented a sensitivity analysis to demonstrate the relevance of the most important modelling choices in LA fluid modelling for the prediction of DRT after LAAO implantation, using patient-specific geometries from CT scans of six patients. The obtained results with four different scenarios of boundary conditions confirmed that they are critical for achieving accurate predictions, despite using the same (commercial) solver. The most important consideration is having a good synchronisation between the LA wall movement, anatomy, and volume changes, with the inlet/outlet parameters (i.e., velocities and pressures) selected at the pulmonary veins and mitral valve, respectively. In the absence of a good synchronisation of these factors, which could be due to using generic or literature-based pressure/velocity constant values or waves in conjunction with assuming rigid LA wall in complex LA geometries, fluid simulations could easily have continuity issues leading to divergence and providing unrealistic blood flow patterns.
The recommended approach is to leverage as many patient-specific data as possible to personalise the fluid models, especially velocity/pressure waves at the PV/MV and LA wall deformation from medical images such as echocardiography and dynamic CT/MR scans, ensuring a good match between blood flow (velocities), LA volume changes, and wall deformation. Despite being difficult to obtain all the required data for every case, it should be sufficient to acquire either velocity profiles (easier at the MV for outlet BC) or LA wall movement, and set up the remaining boundary conditions accordingly.

4.1. Boundary Conditions Scenarios

In the present study, Scenarios 2 and 3 provided more realistic pressure and in silico haemodynamic indices (see Figure 2) due to the generic pressure wave from an AF patient imposed at the PV and patient-specific velocity profiles at the MV outlet, despite having different LA wall dynamics (rigid and dynamic mesh LA wall for Scenarios 2 and 3, respectively). Scenario 1 provided the largest differences in pressure ranges comparing to cathlab measurements since the inlet pressure was constant, unlike the generic pressure wave used in the other scenarios. As LA walls were also considered rigid in Scenario 1 (i.e., lack of LA volume change), PV–MV differential pressure could not be easily created, leading to unrealistic pressures inside the LA to move the blood flow.
Unlike the other scenarios (with pressure BC at the inlets), Scenario 4 had a velocity profile obtained from literature in the PV, which led to continuity problems in the fluid simulations in 4/6 analysed cases due to the difficulties for properly synchronising the velocity profile from literature with the different LA anatomies and wall movements, although a dynamic mesh approach was used. Moreover, simulated pressure curves were not realistic, with a square shape. Even in the two cases that converged, blood flow velocities were abnormally low, creating overstagnation and ECAP maps that could not differentiate different DRT risk areas (too many red areas in the ECAP map of Scenario 4 in Figure 2). The main issue with Scenario 4 was that the amount of flow entering the LA through the PV was not fully absorbed by the LA volume increase created with the dynamic mesh approach. In the remaining scenarios (all of them converged), with pressure values defined during ventricular systole, the system had more freedom to adapt, estimating the inlet velocities at the PV to match the velocity profile at the MV outlet and the LA wall deformations, fulfilling the mass conservation law. Another advantage of using echocardiographic-based boundary conditions at the outlet is that they captured potential little leaks that occurred even in healthy mitral valves, which was not possible in Scenario 4 with the MV treated as a wall. In LAAO patients, mitral regurgitation may play a protective role, contributing to a proper washing of the LAA and avoiding DRT [44]. Finally, divergence issues in Scenario 4 could be related to the proximity of the inlet (just before the first main PV bifurcation) with the LA main cavity, preventing flow development; García-Isla et al. [19], using similar boundary conditions as in Scenario 4, solved this problem artificially by adding tubes in each PV, which adds operator-dependence into the 3D model creation.
The inclusion of LA wall deformation guided by MV annulus ring displacement in the dynamic mesh (DM) approach of Scenario 3 produced small changes (e.g., new possible high DRT risk area next to the device) in pressure and ECAP maps comparing to Scenario 2, which assumed rigid LA walls. On the other hand, using a DM approach contributed to make blood flow recirculations in the LA more realistic, also generating a small peak in PV velocity profiles due to blood flow going into the LA during ventricular systole (S curve reported in the literature), which was absent in the scenarios with rigid LA walls (Scenarios 1 and 2). Imposing full LA displacements derived by the processing of dynamic medical images such as in [16,17,20,29,30], or applying sinusoidally-controlled small displacements over the entire LA [21,25,28], could help to better model PV velocity profiles and synchronise LA volume changes with inlet/outlet boundary conditions. Unfortunately, obtaining dynamic CT or MR scans of candidates undergoing LAAO implantation is rarely available in clinical routine, unlike echocardiographic studies. Fluid–structure interaction can be a valid modelling alternative to include LA wall movement, as in [14,24,31], at the expense of higher computational costs and the uncertainty on material properties to be assigned to the LA wall (i.e., wall thickness, elasticity, and fibre orientation).

4.2. In Silico Prediction of Device-Related Thrombosis Risk

Among the evaluated boundary conditions, scenarios that converged (all except Scenario 4) found lower blood flow velocities next to the LAAO device’s surface in DRT cases (see Figure 4), below the threshold (0.20 m/s) reported for thrombosis risk [5]. Out of the evaluated scenarios, ECAP and RRT maps from Scenario 3 (generic AF pressure wave as PV inlet, echocardiography-based velocity profile as MV outlet, and dynamic mesh LA wall behaviour) were the most accurate to assess DRT risk and predict the possible localisation of the formed thrombus. Figure 5 clearly shows elevated ECAP and RTT values around the implanted LAAO device in DRT cases compared to non-DRT cases. Equivalently, the same areas presented blood flow recirculations and lower velocities in DRT cases, as can be observed in Figure 6. For instance, in silico haemodynamic indices for Pat 6 perfectly predicted DRT in the superior-anterior part of the LAAO device (as shown by the red arrows in the figures). Nevertheless, ECAP maps might not be specific enough to identify the exact location of DRT in cases where the pulmonary ridge (the space between the LAA and the LSPV) is not covered (see Pat 4 and Pat 5 in Figure 6). Furthermore, it is not obvious to define a consistent threshold in the ECAP and RRT maps to determine the risk of DRT for all cases. In the studied cases, ECAP values larger than 0.5 Pa 1 were associated to DRT areas but we could not find a conclusive threshold for RRT, which should be computed in more than two cardiac cycles. Despite the mentioned limitations of ECAP and RRT indices, they were good descriptors of the overall LA haemodynamics that, combined with velocity magnitudes and blood flow recirculation analysis, can be used to assess the risk of DRT. The multifactorial analysis of haemodynamic simulations can contribute to identifying factors guiding LA blood flow patterns that are potentially important for DRT such as covering of the pulmonary ridge [45] or PV orientation [33]. For instance, Figure 6) shows that having the pulmonary ridge uncovered with the LAAO device (such as in Pat 1, red circle in the figure), or the presence of vortices (such as in Pat 3, pink arrow in the figure) is not necessarily linked to DRT if blood flow velocities are high in this area.
In LA fluid modelling literature, each study usually reports results from a set of boundary conditions, being difficult to compare with the presented sensitivity analysis. On the other hand, Dueñas-Pamplona et al. [46] recently published a complete boundary-condition analysis in fluid simulations on an idealised left atrium in vitro (rigid) model, combined with particle image velocimetry to obtain ground truth data. The authors compared five different combinations of velocity and pressure boundary conditions in the inlets and outlets, including some equivalent to the scenarios in our work. They found practically negligible differences in the simulations with different boundary conditions, in disagreement with our results, which could be explained by the idealized LA geometry and lack of LA wall movement in their in vitro setup. In agreement with our findings, García-Villalba et al. [30] recently demonstrated the benefit of in silico haemodynamic indices for assessing the risk of LAA thrombogenesis in a database of six patients, having better patient stratification, based on residence times and kinetic energy, when using moving-wall simulations compared to rigid LA walls. In an elegant way, the authors set up flow boundary conditions at the PV/MV based on volume changes of the LA and the left ventricle extracted from available dynamic CT scans and applying mass conservation.

4.3. Mesh and Cardiac Cycle Convergence Analysis

Although mesh convergence analysis is a common requirement for a sound modelling study, mesh resolutions found in LA fluid modelling (see Table 1) are far from being consistent, ranging from 0.4 to 30 × 10 5 number of elements. In our study, we also performed a mesh convergence study, but were limited by the constraints of the used commercial solver. However, we observed small differences between the two largest meshes (i.e., 4 and 5 × 10 5 elements). It will always depend on the particular LA geometry to mesh, the selected boundary conditions, and which in silico indices are estimated, but a reasonable target would be to have a minimum of 4–5 × 10 5 (approximately equivalent to element size of 1.5 mm, as in [17]) for a good compromise between the accuracy of the simulations and the associated computational cost.
In a similar fashion, there is not a consensus on the required number of cardiac cycles to reach numerical stabilisation, even if most published studies are between 2 and 7, with some outliers [26,29,30,32] going beyond 15 heartbeats, at the expense of higher computational costs. In our study, we could already identify meaningful differences in boundary conditions scenarios with 3 heartbeats, requiring 1–2 for warming up. However, the cardiac cycle convergence analysis performed in one of the studied LA geometries showed consistency in the most relevant ECAP areas around the LAA after around 5 beats, but still with unstable maximum ECAP values up to 15 beats. Interestingly, there were areas next to the PV (e.g., under the right superior PV) with high ECAP values after 10 beats. These areas are too far from the LAA to be associated with thrombogenesis processes related to DRT. The high ECAP values at the PV could be the result of numerical artefacts due to accumulating dyssynchrony between inlet boundary conditions and LA wall deformation over several beats after using nonspecific boundary conditions. Further investigations are required to confirm this hypothesis. In any case, multifactorial analysis of in silico haemodynamics is needed when assessing DRT. In our study, ECAP maps were not specific enough but complementary to maps of low velocities and recirculations from streamline visualisations in order to have more robust predictions.

4.4. Limitations and Future Work

The current study presents some limitations that should be acknowledged. First, the mesh and cardiac cycle convergence analysis should be performed with more elements and beats, respectively, for better identifying the necessary spatio-temporal resolution to get accurate and stable simulation results. However, using meshes with 5 × 10 5 elements and 3 heart beats represented an acceptable simplification with reasonable computational times that was useful enough to identify the most appropriate boundary conditions. It could also be interesting to explore the use of mixed meshes including prisms close to the LA wall for a more accurate model of local haemodynamics.
The limited number of processed cases was due to the challenge in obtaining patient datasets including post-procedural CT scans, covering the whole LA. In most hospitals, LAAO patients are followed up with echocardiography or CT images, which only include part of the LA to minimise radiation. Additionally, in the analysed cases, there was a large variation in the CT and echocardiography acquisition times at follow-up for the different patients. Ideally, both imaging modalities should be acquired during the same day to better synchronise LA geometry (and deformation, if available) with echocardiographic measurements. Acquisition of MV velocities with echocardiography is straightforward, thus being well suited for outlet boundary conditions. On the other hand, we could not reliably measure velocities in all pulmonary veins (issues with right and left superior PV) for the whole database since the visual window was not good enough, thus limiting their use at the inlets (i.e., Scenario 4).
In general, there is a need in LA fluid modelling for generating ground truth data to benchmark the different approaches that have been published in the literature, including various numerical strategies (e.g., Newtonian vs. non-Newtonian flow, laminar vs. turbulent models, etc.) and solvers. Dueñas-Pamplona et al. [46] advanced in this direction developing an in vitro phantom that could be the basis for detailed comparison studies, especially if more realistic LA geometries with moving walls could be incorporated. 4D flow MRI is a promising imaging modality that is already being used to study LA haemodynamics [47,48] and would certainly play a role in the near future for the validation of LA fluid models. Finally, more quantitative and reliable metrics of LA haemodynamics (derived either from imaging or simulations) are required, in particular for determining the complexity of flow beyond current insufficient vorticity indices, being validated in large cohorts of LA data to establish thresholds for the robust prediction of DRT.

5. Conclusions

In silico fluid simulations of the LA are becoming a hot topic in heart modelling due to their potential for impacting several interventional cardiology procedures, such as the implantation of LAAO devices. However, there is a lack of consensus on the most appropriate boundary conditions to predict adverse events such as DRT. In this paper we have presented a sensitivity analysis of different boundary conditions scenarios available in the literature to identify the optimal modelling choices for predicting DRT. The obtained results demonstrate the need for assimilating into the models patient-specific data from medical images, such as MV velocities from echocardiography, to synchronise LA anatomy, wall deformation, and pressure/velocity profiles at the inlets/outlet. Moreover, the use of generic pressure waves (rather than constant values) and dynamic LA walls achieved more physiological simulation results. Over the analysed cases, the combination of different in silico haemodynamic indices, including blood flow velocities and patterns next to the device surface, ECAP, and RRT maps, clearly identified which patients were at most risk of DRT, which was confirmed upon the inspection of the follow-up data. These promising results should be confirmed in larger cohorts.

Author Contributions

Conceptualization, J.M., V.A., D.A. and X.F.; methodology, J.M., M.N.-G. and X.M.; software, J.M., X.M., A.L.O., M.I.P. and M.N.-G.; validation, X.F., D.A. and V.A.; formal analysis, J.M. and A.L.O.; investigation, J.M., A.L.O. and V.A.; resources, D.A., E.S. and V.A.; data curation, V.A., M.N.-G. and X.M.; writing—original draft preparation, J.M. and O.C.; writing—review and editing, O.C. and J.N.; visualization, J.M. and M.N.-G.; supervision, J.N. and O.C.; project administration, D.A. and O.C. All authors have read and agreed to the published version of the manuscript.

Funding

This work was supported by the Spanish Ministry of Science, Innovation and Universities under the Retos I+D Programme (RTI2018-101193-B-I00), the Maria de Maeztu Units of Excellence Programme (MDM-2015-0502), the Spanish Ministry of Economy and Competitiveness under the Programme for the Formation of Doctors (PRE2018-084062), and MINECO (RYC-2015-18888). Additionally, this work was supported by the H2020 EU SimCardioTest project (Digital transformation in Health and Care SC1-DTH-06-2020; grant agreement No. 101016496).

Institutional Review Board Statement

The study was approved by the Institutional Review Board (or Ethics Committee) of Hospital de la Santa Creu i Sant Pau.

Informed Consent Statement

Informed consent was obtained from all subjects involved in the study.

Conflicts of Interest

Dabit Arzamendi has received personal grants for proctoring for Abbott and Boston Scientific. Xavier Freixa has received personal grants for proctoring for Abbott. The other authors have no conflicts of interest to declare.

Abbreviations

The following abbreviations are used in this manuscript:
AFAtrial Fibrillation
BCBoundary Conditions
CFDComputational Fluid Dynamics
CTComputed Tomography
dCTDynamic CT
DMDynamic Mesh
DRTDevice-related Thrombus
ECAPEndothelial Cell Activation Potential
ECGElectrocardiogram
FSIFluid–Structure Interaction
LALeft Atrium
LAALeft Atrial Appendage
LAAOLeft Atrial Appendage Occlusion
MVMitral Valve
MRIMagnetic Resonance Imaging
OSIOscillatory Shear Index
PSPatient Specific
PVPulmonary Veins
ReReynolds Number
RSPVRight Superior Pulmonary Vein
RRTResidence Time
LSPVLeft Superiror Pulmonary Vein
TTETransthoracic Echocardiography
TAWSSTime Average Wall Shear Stress
WSSWall Shear Stress

References

  1. Rahman, F.; Kwan, G.F.; Benjamin, E.J. Global epidemiology of atrial fibrillation. Nat. Rev. Cardiol. 2014, 11, 639–654. [Google Scholar] [CrossRef]
  2. Cresti, A.; García-Fernández, M.A.; Sievert, H.; Mazzone, P.; Baratta, P.; Solari, M.; Geyer, A.; De Sensi, F.; Limbruno, U. Prevalence of extra-appendage thrombosis in non-valvular atrial fibrillation and atrial flutter in patients undergoing cardioversion: A large transoesophageal echo study. Eurointervention 2019, 15, e225–e230. [Google Scholar] [CrossRef] [Green Version]
  3. Benjamin, E.J.; Wolf, P.A.; D’Agostino, R.B.; Silbershatz, H.; Kannel, W.B.; Levy, D. Impact of atrial fibrillation on the risk of death: The Framingham Heart Study. Circulation 1998, 98, 946–952. [Google Scholar] [CrossRef] [Green Version]
  4. Takada, T.; Yasaka, M.; Nagatsuka, K.; Minematsu, K.; Yamaguchi, T. Blood flow in the left atrial appendage and embolic stroke in nonvalvular atrial fibrillation. Eur. Neurol. 2001, 46, 148–152. [Google Scholar] [CrossRef] [PubMed]
  5. García-Fernández, M.A.; Torrecilla, E.G.; Román, D.S.; Azevedo, J.; Bueno, H.; Moreno, M.M.; Delcán, J.L. Left atrial appendage doppler flow patterns: Implications on thrombus formation. Am. Heart J. 1992, 124, 955–961. [Google Scholar] [CrossRef]
  6. Watson, T.; Shantsila, E.; Lip, G.Y. Mechanisms of thrombogenesis in atrial fibrillation: Virchow’s triad revisited. Lancet 2009, 373, 155–166. [Google Scholar] [CrossRef]
  7. Sanchez, J.M.; Lee, A.; Bartus, K.; Lee, R.J. Percutaneous epicardial approach for LAA ligation. J. Interv. Card. Electrophysiol. 2020. [Google Scholar] [CrossRef]
  8. Bedeir, K.; Warriner, S.; Kofsky, E.; Gullett, C.; Ramlawi, B. Left Atrial Appendage Epicardial Clip (AtriClip): Essentials and Post-Procedure Management. J. Atr. Fibrillation 2019, 11, 2087. [Google Scholar] [CrossRef] [PubMed]
  9. Reddy, V.Y.; Doshi, S.K.; Kar, S.; Gibson, D.N.; Price, M.J.; Huber, K.; Horton, R.P.; Buchbinder, M.; Neuzil, P.; Gordon, N.T.; et al. 5-Year Outcomes After Left Atrial Appendage Closure: From the PREVAIL and PROTECT AF Trials. J. Am. Coll. Cardiol. 2017, 70, 2964–2975. [Google Scholar] [CrossRef] [PubMed]
  10. Aminian, A.; Schmidt, B.; Mazzone, P.; Berti, S.; Fischer, S.; Montorfano, M.; Lam, S.C.C.; Lund, J.; Asch, F.M.; Gage, R.; et al. Incidence, Characterization, and Clinical Impact of Device-Related Thrombus Following Left Atrial Appendage Occlusion in the Prospective Global AMPLATZER Amulet Observational Study. JACC Cardiovasc. Interv. 2019, 12, 1003–1014. [Google Scholar] [CrossRef]
  11. Fauchier, L.; Cinaud, A.; Brigadeau, F.; Lepillier, A.; Pierre, B.; Abbey, S.; Fatemi, M.; Franceschi, F.; Guedeney, P.; Jacon, P.; et al. Device-Related Thrombosis After Percutaneous Left Atrial Appendage Occlusion for Atrial Fibrillation. J. Am. Coll. Cardiol. 2018, 71, 1528–1536. [Google Scholar] [CrossRef] [PubMed]
  12. López-Mínguez, J.R.; Eldoayen-Gragera, J.; González-Fernández, R.; Fernández-Vegas, C.; Fuentes-Cañamero, M.E.; Millán-Nuñez, V.; Nogales-Asensio, J.M.; Martínez-Naharro, A.; Sánchez-Giralt, S.; Doblado-Calatrava, M.; et al. Immediate and One-year Results in 35 Consecutive Patients After Closure of Left Atrial Appendage With the Amplatzer Cardiac Plug. Rev. Esp. Cardiol. (Engl. Ed.) 2013, 66, 90–97. [Google Scholar] [CrossRef]
  13. Glikson, M.; Wolff, R.; Hindricks, G.; Mandrola, J.; Camm, A.J.; Lip, G.Y.H.; Fauchier, L.; Betts, T.R.; Lewalter, T.; Saw, J.; et al. EHRA/EAPCI expert consensus statement on catheter-based left atrial appendage occlusion—An update. EuroIntervention 2020, 15, 1133–1180. [Google Scholar] [CrossRef] [Green Version]
  14. Zhang, L.T.; Gay, M. Characterizing left atrial appendage functions in sinus rhythm and atrial fibrillation using computational models. J. Biomech. 2008, 41, 2515–2523. [Google Scholar] [CrossRef] [PubMed]
  15. Dahl, S.K.; Thomassen, E.; Hellevik, L.R.; Skallerud, B. Impact of Pulmonary Venous Locations on the Intra-Atrial Flow and the Mitral Valve Plane Velocity Profile. Cardiovasc. Eng. Technol. 2012, 3, 269–281. [Google Scholar] [CrossRef] [Green Version]
  16. Koizumi, R.; Funamoto, K.; Hayase, T.; Kanke, Y.; Shibata, M.; Shiraishi, Y.; Yambe, T. Numerical analysis of hemodynamic changes in the left atrium due to atrial fibrillation. J. Biomech. 2015, 48, 472–478. [Google Scholar] [CrossRef]
  17. Otani, T.; Al-Issa, A.; Pourmorteza, A.; McVeigh, E.R.; Wada, S.; Ashikaga, H. A Computational Framework for Personalized Blood Flow Analysis in the Human Left Atrium. Ann. Biomed. Eng. 2016, 44, 3284–3294. [Google Scholar] [CrossRef] [PubMed]
  18. Bosi, G.M.; Cook, A.; Rai, R.; Menezes, L.J.; Schievano, S.; Torii, R.; Burriesci, G. Computational Fluid Dynamic Analysis of the Left Atrial Appendage to Predict Thrombosis Risk. Front. Cardiovasc. Med. 2018, 5, 34. [Google Scholar] [CrossRef] [Green Version]
  19. García-Isla, G.; Olivares, A.L.; Silva, E.; Nuñez-Garcia, M.; Butakoff, C.; Sanchez-Quintana, D.; Morales, H.G.; Freixa, X.; Noailly, J.; De Potter, T.; et al. Sensitivity analysis of geometrical parameters to study haemodynamics and thrombus formation in the left atrial appendage. Int. J. Numer. Methods Biomed. Eng. 2018, 34, 1–14. [Google Scholar] [CrossRef]
  20. Dillon-Murphy, D.; Marlevi, D.; Ruijsink, B.; Qureshi, A.; Chubb, H.; Kerfoot, E.; O’Neill, M.; Nordsletten, D.; Aslanidi, O.; De Vecchi, A. Modeling left atrial flow, energy, blood heating distribution in response to catheter ablation therapy. Front. Physiol. 2018, 9, 1757. [Google Scholar] [CrossRef] [Green Version]
  21. Masci, A.; Barone, L.; Dedè, L.; Fedele, M.; Tomasi, C.; Quarteroni, A.; Corsi, C. The impact of left atrium appendage morphology on stroke risk assessment in atrial fibrillation: A computational fluid dynamics study. Front. Physiol. 2019, 9, 1–11. [Google Scholar] [CrossRef]
  22. Aguado, A.M.; Olivares, A.L.; Yagüe, C.; Silva, E.; Nuñez-García, M.; Fernandez-Quilez, A.; Mill, J.; Genua, I.; Arzamendi, D.; De Potter, T.; et al. In silico Optimization of Left Atrial Appendage Occluder Implantation Using Interactive and Modeling Tools. Front. Physiol. 2019, 10, 237. [Google Scholar] [CrossRef] [PubMed] [Green Version]
  23. Jia, D.; Jeon, B.; Park, H.B.; Chang, H.J.; Zhang, L.T. Image-Based Flow Simulations of Pre- and Post-left Atrial Appendage Closure in the Left Atrium. Cardiovasc. Eng. Technol. 2019, 10, 225–241. [Google Scholar] [CrossRef] [PubMed]
  24. Feng, L.; Gao, H.; Griffith, B.; Niederer, S.; Luo, X. Analysis of a coupled fluid-structure interaction model of the left atrium and mitral valve. Int. J. Numer. Methods Biomed. Eng. 2019, 35, e3254. [Google Scholar] [CrossRef] [PubMed] [Green Version]
  25. Masci, A.; Alessandrini, M.; Forti, D.; Menghini, F.; Dedé, L.; Tomasi, C.; Quarteroni, A.; Corsi, C. A Proof of concept for computational fluid dynamic analysis of the left atrium in atrial fibrillation on a patient-specific basis. J. Biomech. Eng. 2020, 142, 011002. [Google Scholar] [CrossRef] [PubMed]
  26. Wang, Y.; Qiao, Y.; Mao, Y.; Jiang, C.; Fan, J.; Luo, K. Numerical prediction of thrombosis risk in left atrium under atrial fibrillation. Math. Biosci. Eng. 2020, 17, 2348–2360. [Google Scholar]
  27. Mill, J.; Olivares, A.L.; Arzamendi, D.; Agudelo, V.; Regueiro, A.; Camara, O.; Freixa, X. Impact of flow-dynamics on device related thrombosis after left atrial appendage occlusion. Can. J. Cardiol. 2020, 36, 968.e13–968.e14. [Google Scholar] [CrossRef]
  28. D’Alessandro, N.; Masci, A.; Andalo, A.; Dede, L.; Tomasi, C.; Quarteroni, A.; Corsi, C. Simulation of the Hemodynamic Effects of the Left Atrial Appendage Occlusion in Atrial Fibrillation: Preliminary Results. In Proceedings of the Computing in Cardiology, Rimini, Italy, 13–16 September 2020. [Google Scholar]
  29. Qureshi, A.; Darwish, O.; Dillon-Murphy, D.; Chubb, H.; Williams, S.; Nechipurenko, D.; Ataullakhanov, F.; Nordsletten, D.; Aslanidi, O.; De Vecchi, A. Modelling Left Atrial Flow and Blood Coagulation for Risk of Thrombus Formation in Atrial Fibrillation. In Proceedings of the Computing in Cardiology, Rimini, Italy, 13–16 September 2020. [Google Scholar]
  30. García-Villalba, M.; Rossini, L.; Gonzalo, A.; Vigneault, D.; Martinez-Legazpi, P.; Durán, E.; Flores, O.; Bermejo, J.; McVeigh, E.; Kahn, A.M.; et al. Demonstration of Patient-Specific Simulations to Assess Left Atrial Appendage Thrombogenesis Risk. Front. Physiol. 2021, 12, 596596. [Google Scholar] [CrossRef]
  31. Fang, R.; Li, Y.; Zhang, Y.; Chen, Q.; Liu, Q.; Li, Z. Impact of left atrial appendage location on risk of thrombus formation in patients with atrial fibrillation. Biomech. Model. Mechanobiol. 2021, 20, 1431–1443. [Google Scholar] [CrossRef]
  32. Sanatkhani, S.; Nedios, S.; Menon, P.G.; Bollmann, A.; Hindricks, G.; Shroff, S.G. Subject-Specific Calculation of Left Atrial Appendage Blood-Borne Particle Residence Time Distribution in Atrial Fibrillation. Front. Physiol. 2021, 12, 633135. [Google Scholar] [CrossRef]
  33. Mill, J.; Harrison, J.; Legghe, B.; Olivares, A.L.; Morales, X.; Noailly, J.; Iriart, X.; Cochet, H.; Sermesant, M.; Camara, O. In-Silico Analysis of the Influence of Pulmonary Vein Configuration on Left Atrial Haemodynamics and Thrombus Formation in a Large Cohort. Lect. Notes Comput. Sci. 2021, 605–616. [Google Scholar] [CrossRef]
  34. Morales Ferez, X.; Mill, J.; Juhl, K.A.; Acebes, C.; Iriart, X.; Legghe, B.; Cochet, H.; Backer, O.D.; Paulsen, R.R.; Camara, O. Deep Learning Framework for Real-Time Estimation of In-silico Thrombotic Risk Indices in the Left Atrial Appendage. Front. Physiol. 2021, 12, 694945. [Google Scholar] [CrossRef]
  35. Taubin, G. A Signal Processing Approach to Fair Surface Design. In Proceedings of the 22nd Annual Conference on Computer Graphics and Interactive Techniques, Los Angeles, CA, USA, 6–11 August 1995; pp. 351–358. [Google Scholar]
  36. Berger, S.A.; Jou, L.D. Flows in Stenotic Vessels. Annu. Rev. Fluid Mech. 2000, 32, 347–382. [Google Scholar] [CrossRef]
  37. Veronesi, F.; Corsi, C.; Sugeng, L.; Caiani, E.G.; Weinert, L.; Mor-Avi, V.; Cerutti, S.; Lamberti, C.; Lang, R.M. Quantification of Mitral Apparatus Dynamics in Functional and Ischemic Mitral Regurgitation Using Real-time 3-Dimensional Echocardiography. J. Am. Soc. Echocardiogr. 2008, 21, 347–354. [Google Scholar] [CrossRef] [PubMed]
  38. Emilsson, K.; Wandt, B. The relation between ejection fraction and mitral annulus motion before and after direct-current electrical cardioversion. Clin. Physiol. 2000, 20, 218–224. [Google Scholar] [CrossRef]
  39. Fernandez-Perez, G.C.; Duarte, R.; Corral de la Calle, M.; Calatayud, J.; Sanchez Gonzalez, J. Analysis of left ventricular diastolic function using magnetic resonance imaging. Radiologia 2012, 54, 295–305. [Google Scholar] [CrossRef] [PubMed]
  40. Di Achille, P.; Tellides, G.; Figueroa, C.A.; Humphrey, J.D. A haemodynamic predictor of intraluminal thrombus formation in abdominal aortic aneurysms. Proc. R. Soc. Math. Phys. Eng. Sci. 2014, 470, 20140163. [Google Scholar] [CrossRef] [Green Version]
  41. Himburg, H.A.; Grzybowski, D.M.; Hazel, A.L.; LaMack, J.A.; Li, X.M.; Friedman, M.H. Spatial comparison between wall shear stress measures and porcine arterial endothelial permeability. Am. J. Physiol. Heart Circ. Physiol. 2004, 286, H1916–H1922. [Google Scholar] [CrossRef] [PubMed] [Green Version]
  42. Nunez-Garcia, M.; Bernardino, G.; Alarcon, F.; Caixal, G.; Mont, L.; Camara, O.; Butakoff, C. Fast Quasi-Conformal Regional Flattening of the Left Atrium. IEEE Trans. Vis. Comput. Graph. 2020, 26, 2591–2602. [Google Scholar] [CrossRef] [Green Version]
  43. Viceconti, M.; Pappalardo, F.; Rodriguez, B.; Horner, M.; Bischoff, J.; Musuamba Tshinanu, F. In silico trials: Verification, validation and uncertainty quantification of predictive models used in the regulatory evaluation of biomedical products. Methods 2021, 185, 120–127. [Google Scholar] [CrossRef]
  44. Cresti, A.; Galli, C.A.; Alimento, M.L.; De Sensi, F.; Baratta, P.; D’Aiello, I.; Limbruno, U.; Pepi, M.; Fusini, L.; Maltagliati, A.C. Does mitral regurgitation reduce the risks of thrombosis in atrial fibrillation and flutter? J. Cardiovasc. Med. 2019, 20, 660–666. [Google Scholar] [CrossRef] [PubMed]
  45. Freixa, X.; Cepas-Guillen, P.; Flores-Umanzor, E.; Regueiro, A.; Sanchis, L.; Fernandez-Valledor, A.; Brugaletta, S.; Carretero, M.J.; Vidal, B.; Masotti, M.; et al. Pulmonary ridge coverage and device-related thrombosis after left atrial appendage occlusion. EuroIntervention 2021, 16, E1288–E1294. [Google Scholar] [CrossRef]
  46. Dueñas-Pamplona, J.; Sierra-Pallares, J.; García, J.; Castro, F.; Munoz-Paniagua, J. Boundary-Condition Analysis of an Idealized Left Atrium Model. Ann. Biomed. Eng. 2021, 49, 1507–1520. [Google Scholar] [CrossRef]
  47. Markl, M.; Lee, D.C.; Carr, M.L.; Foucar, C.; Ng, J.; Schnell, S.; Carr, J.C.; Goldberger, J.J. Assessment of left atrial and left atrial appendage flow and stasis in atrial fibrillation. J. Cardiovasc. Magn. Reson. 2015, 17, M3. [Google Scholar] [CrossRef] [Green Version]
  48. Morales, X.; Mill, J.; Delso, G.; Loncaric, F.; Doltra, A.; Freixa, X.; Sitges, M.; Bijnens, B.; Camara, O. 4D Flow Magnetic Resonance Imaging for Left Atrial Haemodynamic Characterization and Model Calibration. Lect. Notes Comput. Sci. 2021, 12592, 156–165. [Google Scholar]
Figure 1. Fluid modelling pipeline, including preprocessing steps to build patient-specific left atria (LA) meshes and four different boundary conditions scenarios. PV: pulmonary veins; MV: mitral valve; US: ultrasound imaging; DM: dynamic mesh.
Mathematics 09 02304 g001
Figure 2. Haemodynamic in silico indices obtained with different boundary condition scenarios (1–4). ECAP: endothelial cell activation potential. The white line in the ECAP maps indicates the position of the implanted device. Scenario 1: null inlet pressure, imaging-based outlet velocities, and rigid wall; Scenario 2: as Scenario 1 but with patient pressure wave as inlet; Scenario 3: as Scenario 2 but with dynamic mesh wall deformation; Scenario 4: literature velocity profile as inlet, mitral valve as wall (systole) or constant pressure (diastole), and dynamic mesh wall deformation.
Mathematics 09 02304 g002
Figure 3. Endothelial cell activation potential (ECAP) maps for 15 simulated cardiac cycles/beats. Higher values (red colour) indicate a higher risk of thrombosis.
Mathematics 09 02304 g003
Figure 4. Average blood flow velocities near the device surface for the different simulated scenarios in all analysed patients. Pat 1–3 and Pat 4–6 were without and with device-related thrombus, respectively. Missing bars in some patients indicate simulation divergence.
Mathematics 09 02304 g004
Figure 5. In silico haemodynamic indices for the prediction of device-related thrombosis (DRT) after left atrial appendage occlusion in the six analysed cases: Pat 1–3 were controls and Pat 4–6 had DRT. Higher values (red colour) indicate a higher risk of thrombosis. The white line in the 2D maps signals the position of the implanted device. ECAP: endothelial cell activation potential; RRT: relative residence times. The red arrows indicate the positions where the thrombus were found in the post-procedural computed tomography images (see Figure 6).
Mathematics 09 02304 g005
Figure 6. Computed tomography (CT) scans after left atrial appendage implantation for cases with (Pat 4–6) and without (Pat 1–3) device-related thrombus together with streamline-based visualisation of the simulated blood flow patterns, coloured by velocity magnitude (blue and red corresponding to high and low values, respectively). Red arrows in CT scans indicate where the thrombus was found. Pink arrows in the velocity streamline plots indicate flow recirculations or flow stagnation patterns (independently of velocity magnitude); the red circle indicates the pulmonary ridge (PR). Although Pat 1 had an uncovered PR, the velocities in the area were relatively high, reducing the risk of thrombus formation.
Mathematics 09 02304 g006
Table 1. Review of boundary conditions and different modelling choices for left atrial fluid simulations reported in the literature. PV: pulmonary veins; MV: mitral valve; geoms: number of geometries; lit: literature; vels: velocities; press: pressures; dCT/MRI: dynamic computed tomography/magnetic resonance imaging; diff. DM: diffusion-based dynamic mesh; FSI: fluid–structure interaction; * synthetic LA and realistic LAA geometries; ** estimated value from element size reported in the paper; *** 256 synthetic and 114 real LAA.
StudyPV InletMV Outlet LV Systole/DiastoleWall BehaviourCardiac CyclesMesh Elements ( × 10 5 )Geoms
Zhang [14]Lit. vels.Wall/0 mmHgFSI321
Dahl [15]Patient flowAdded mass fluxRigid1211
Koizumi [16]10 mmHgWall/8 mmHgdMRI51.51
Otani [17]dCT vels.Wall/dCT flowdCT53.6–5.52
Bosi [18]0 mmHgLit. vels.Rigid422–304
García-Isla [19]Lit. vels.Wall/8 mmHgRigid13.5–5.036 *
Dillon-Murphy [20]0 mmHgdMRI flowdMRI1012 **2
Masci-a [21]Flow balanceLit. flowSinusoidal517–195
Aguado [22]Lit. vels.Wall/8 mmHgRigid12–9.62
Jia [23]Synthetic vels.Wall/0 mmHgRigid100.41
Feng [24]Lit. press.Lit. press.FSI211
Masci-b [25]Flow balanceLit. flowSinusoidal78–102
Wang [26]10 mmHgLit. flowRigid20241
Mill-a [27]Lit vels.Wall/8 mmHgDiff. DM252
D’Alessandro [28]Flow balanceLit. vels.Sinusoidal517–192
Qureshi [29]Synthetic vels.UnknowndMRI1542
García-Villalba [30]Flow balanceWall/OpenRigid/dCT205–9 **6
Fang [31]AF vels.Wall/0 mmHgFSI4Unknown1 *
Sanatkhani [32]Lit. vels.Open/0 mmHgRigid253.5–516
Mill-b [33]AF press.AF vels.Diff. DM38–952
Morales [34]Lit. vels.Wall/8 mmHgDiff. DM33.5–9370 ***
This workAF press.Personalised vels.Rigid/Diff. DM1–21–56
Table 2. Left atrial (LA) and clinical characteristics of the studied cases. PV: pulmonary veins; AF: atrial fibrillation; DRT: device-related thrombus.
Patient IDNumber of PVLA Volume (mL)Device Size (In mm)AF TypeDRT
Patient 1520128PermanentNo
Patient 2526128ParoxysmalNo
Patient 3621522ParoxysmalNo
Patient 4514322PermanentYes
Patient 5628131PermanentYes
Patient 6417628PermanentYes
Publisher’s Note: MDPI stays neutral with regard to jurisdictional claims in published maps and institutional affiliations.

