Comparative RNA-Sequencing Analysis Reveals High Complexity and Heterogeneity of Transcriptomic and Immune Profiles in Hepatocellular Carcinoma Tumors of Viral (HBV, HCV) and Non-Viral Etiology

 , , , , and
Abstract
:1. Introduction
2. Materials and Methods
2.1. Patient Selection and Sample Collection
2.2. RNA Isolation
2.3. RNA Quantification and Quality Assessment of Isolated RNA
2.4. Total RNA Library Preparation and Sequencing
2.5. Analysis of Sequencing Data—Identification of Differentially Expressed Genes (DEGs)
2.6. Functional Enrichment Analysis
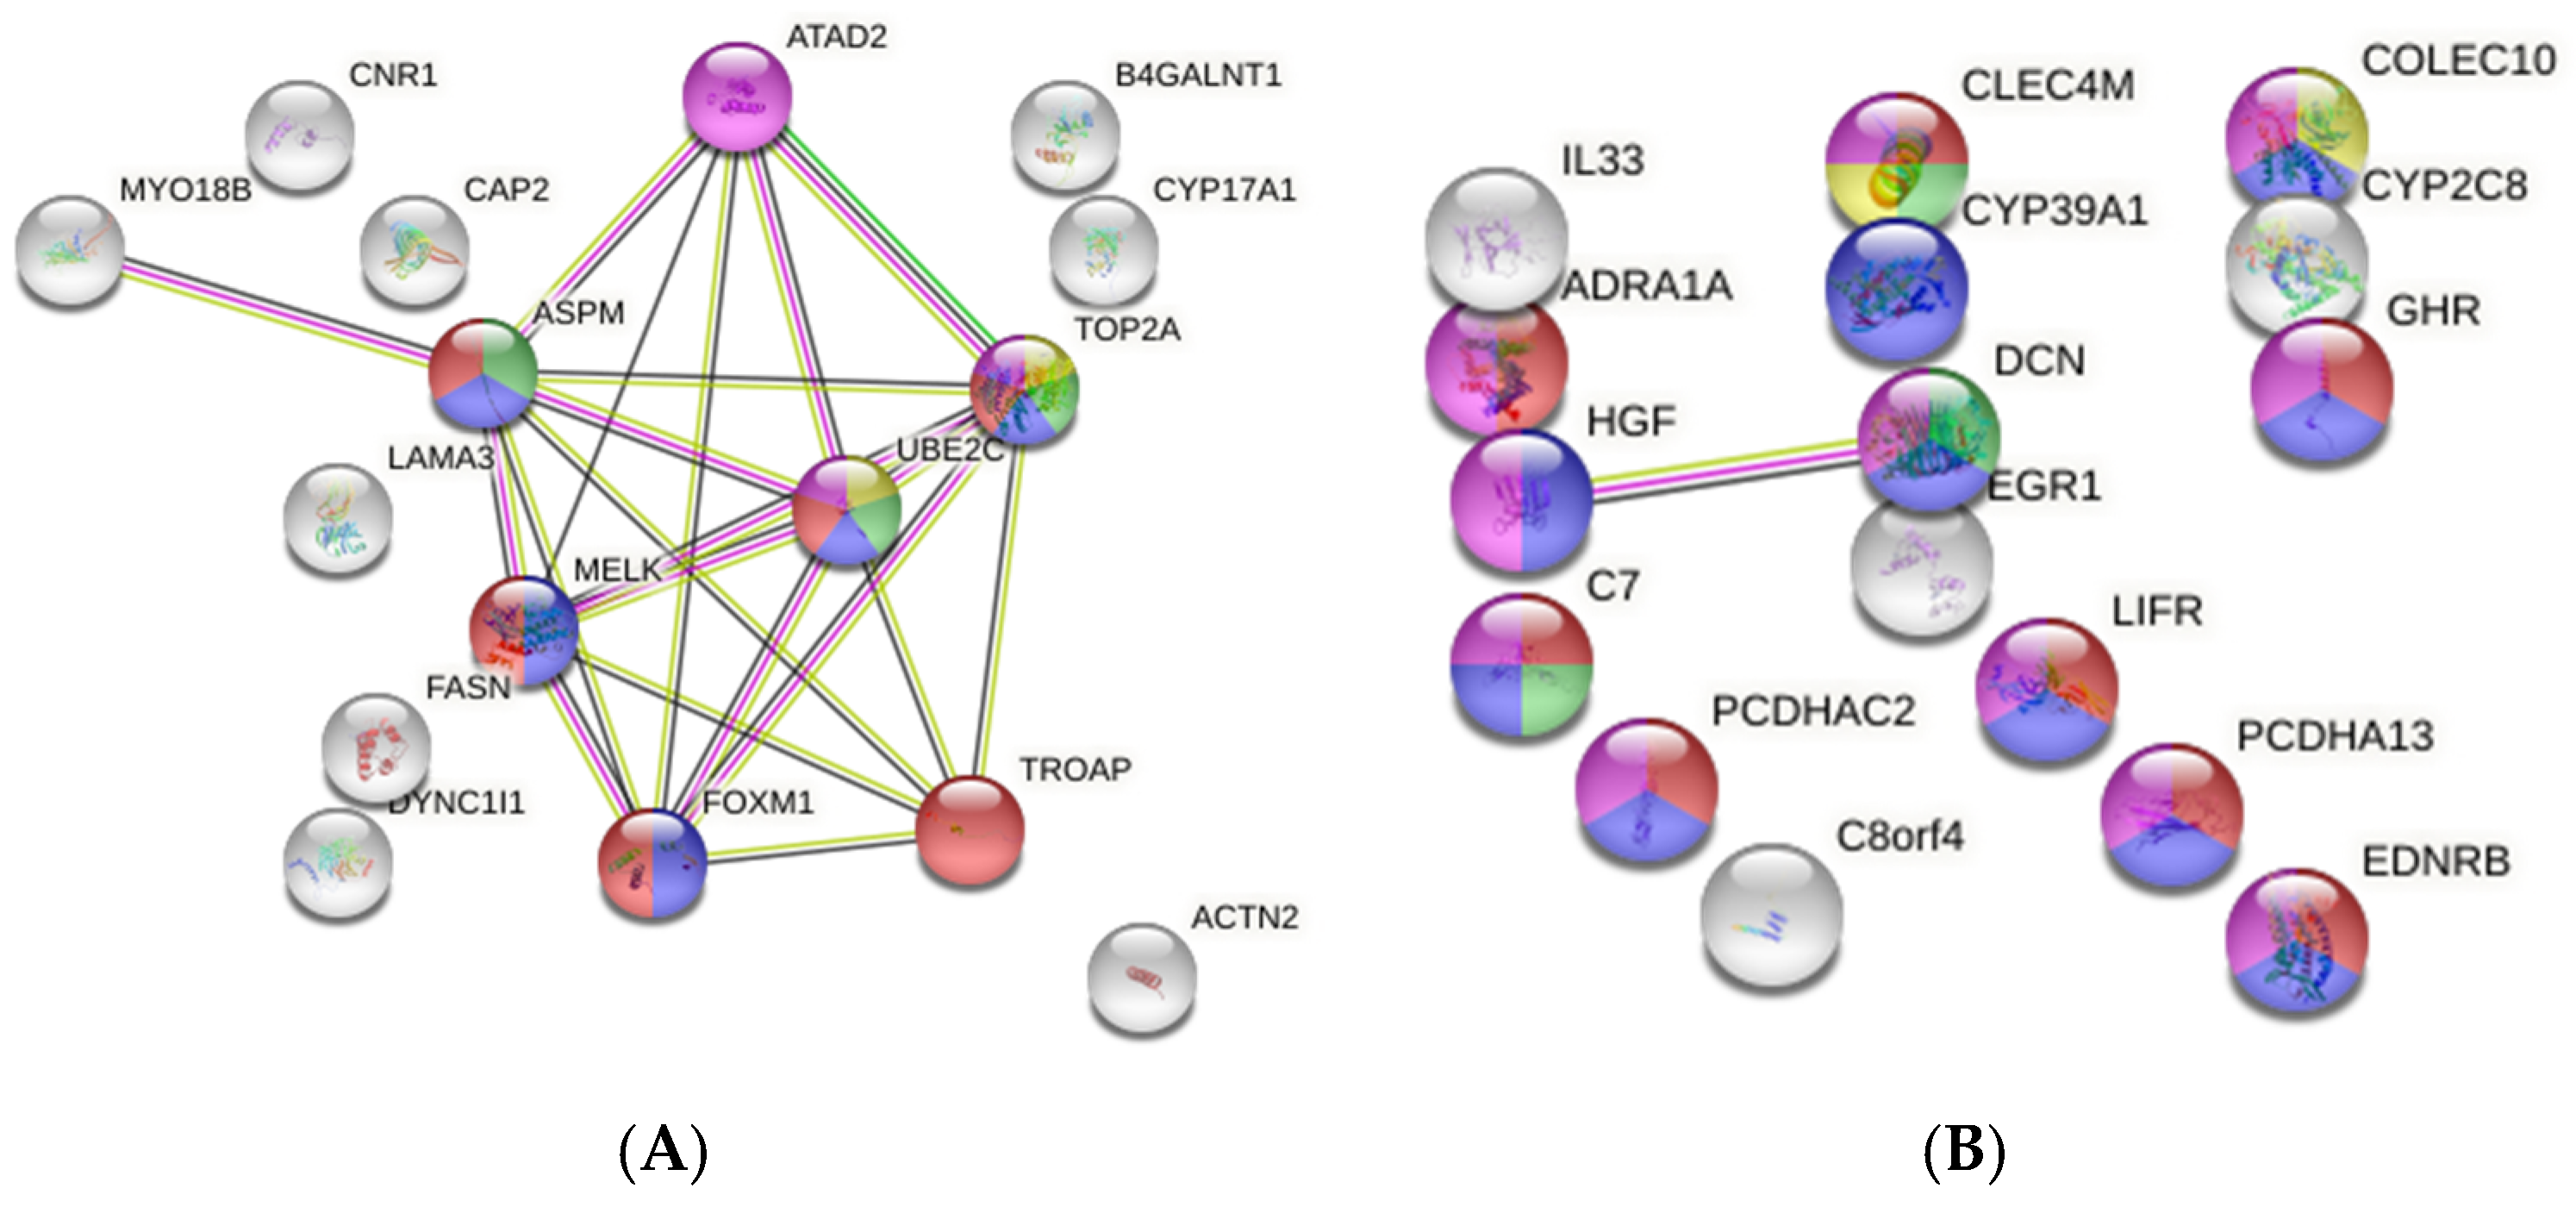
2.7. Protein–Protein Interaction (PPI) Network Analysis of DEGs
2.8. Immune Infiltrate Analysis
2.9. Validation of Target mRNA Levels Using Quantitative Real-Time PCR
2.10. Gene Expression Validation
3. Results
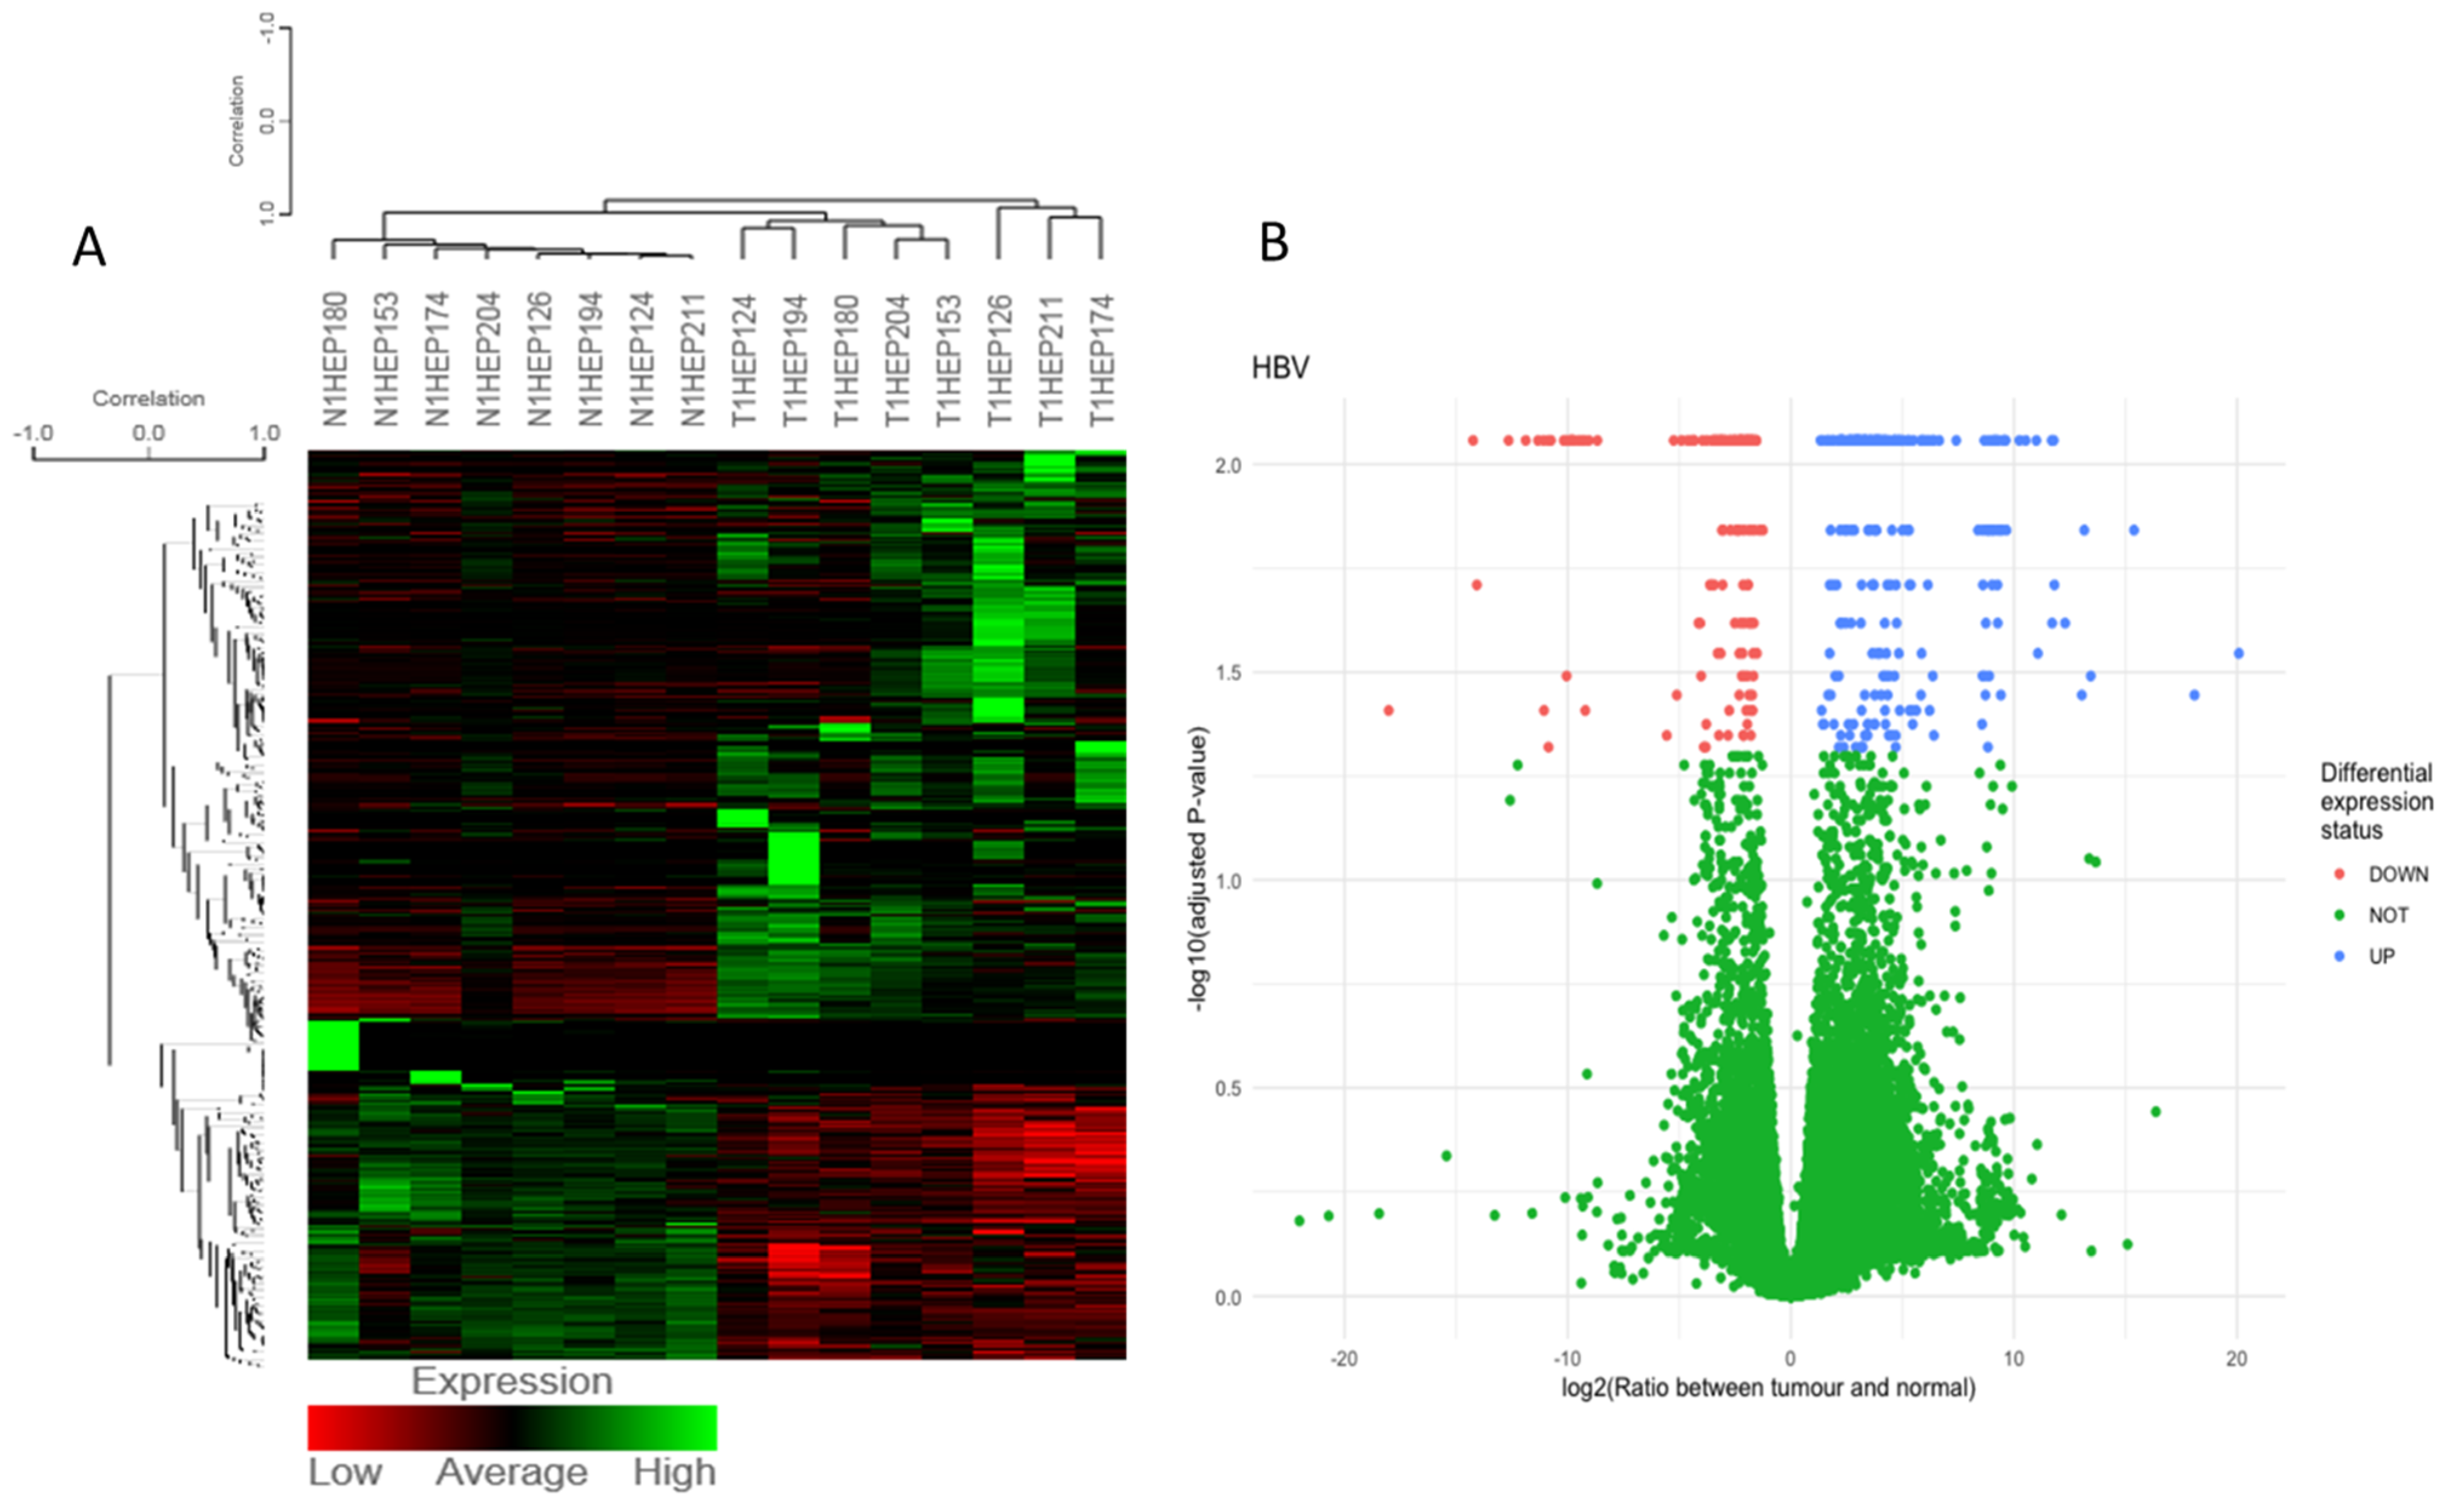
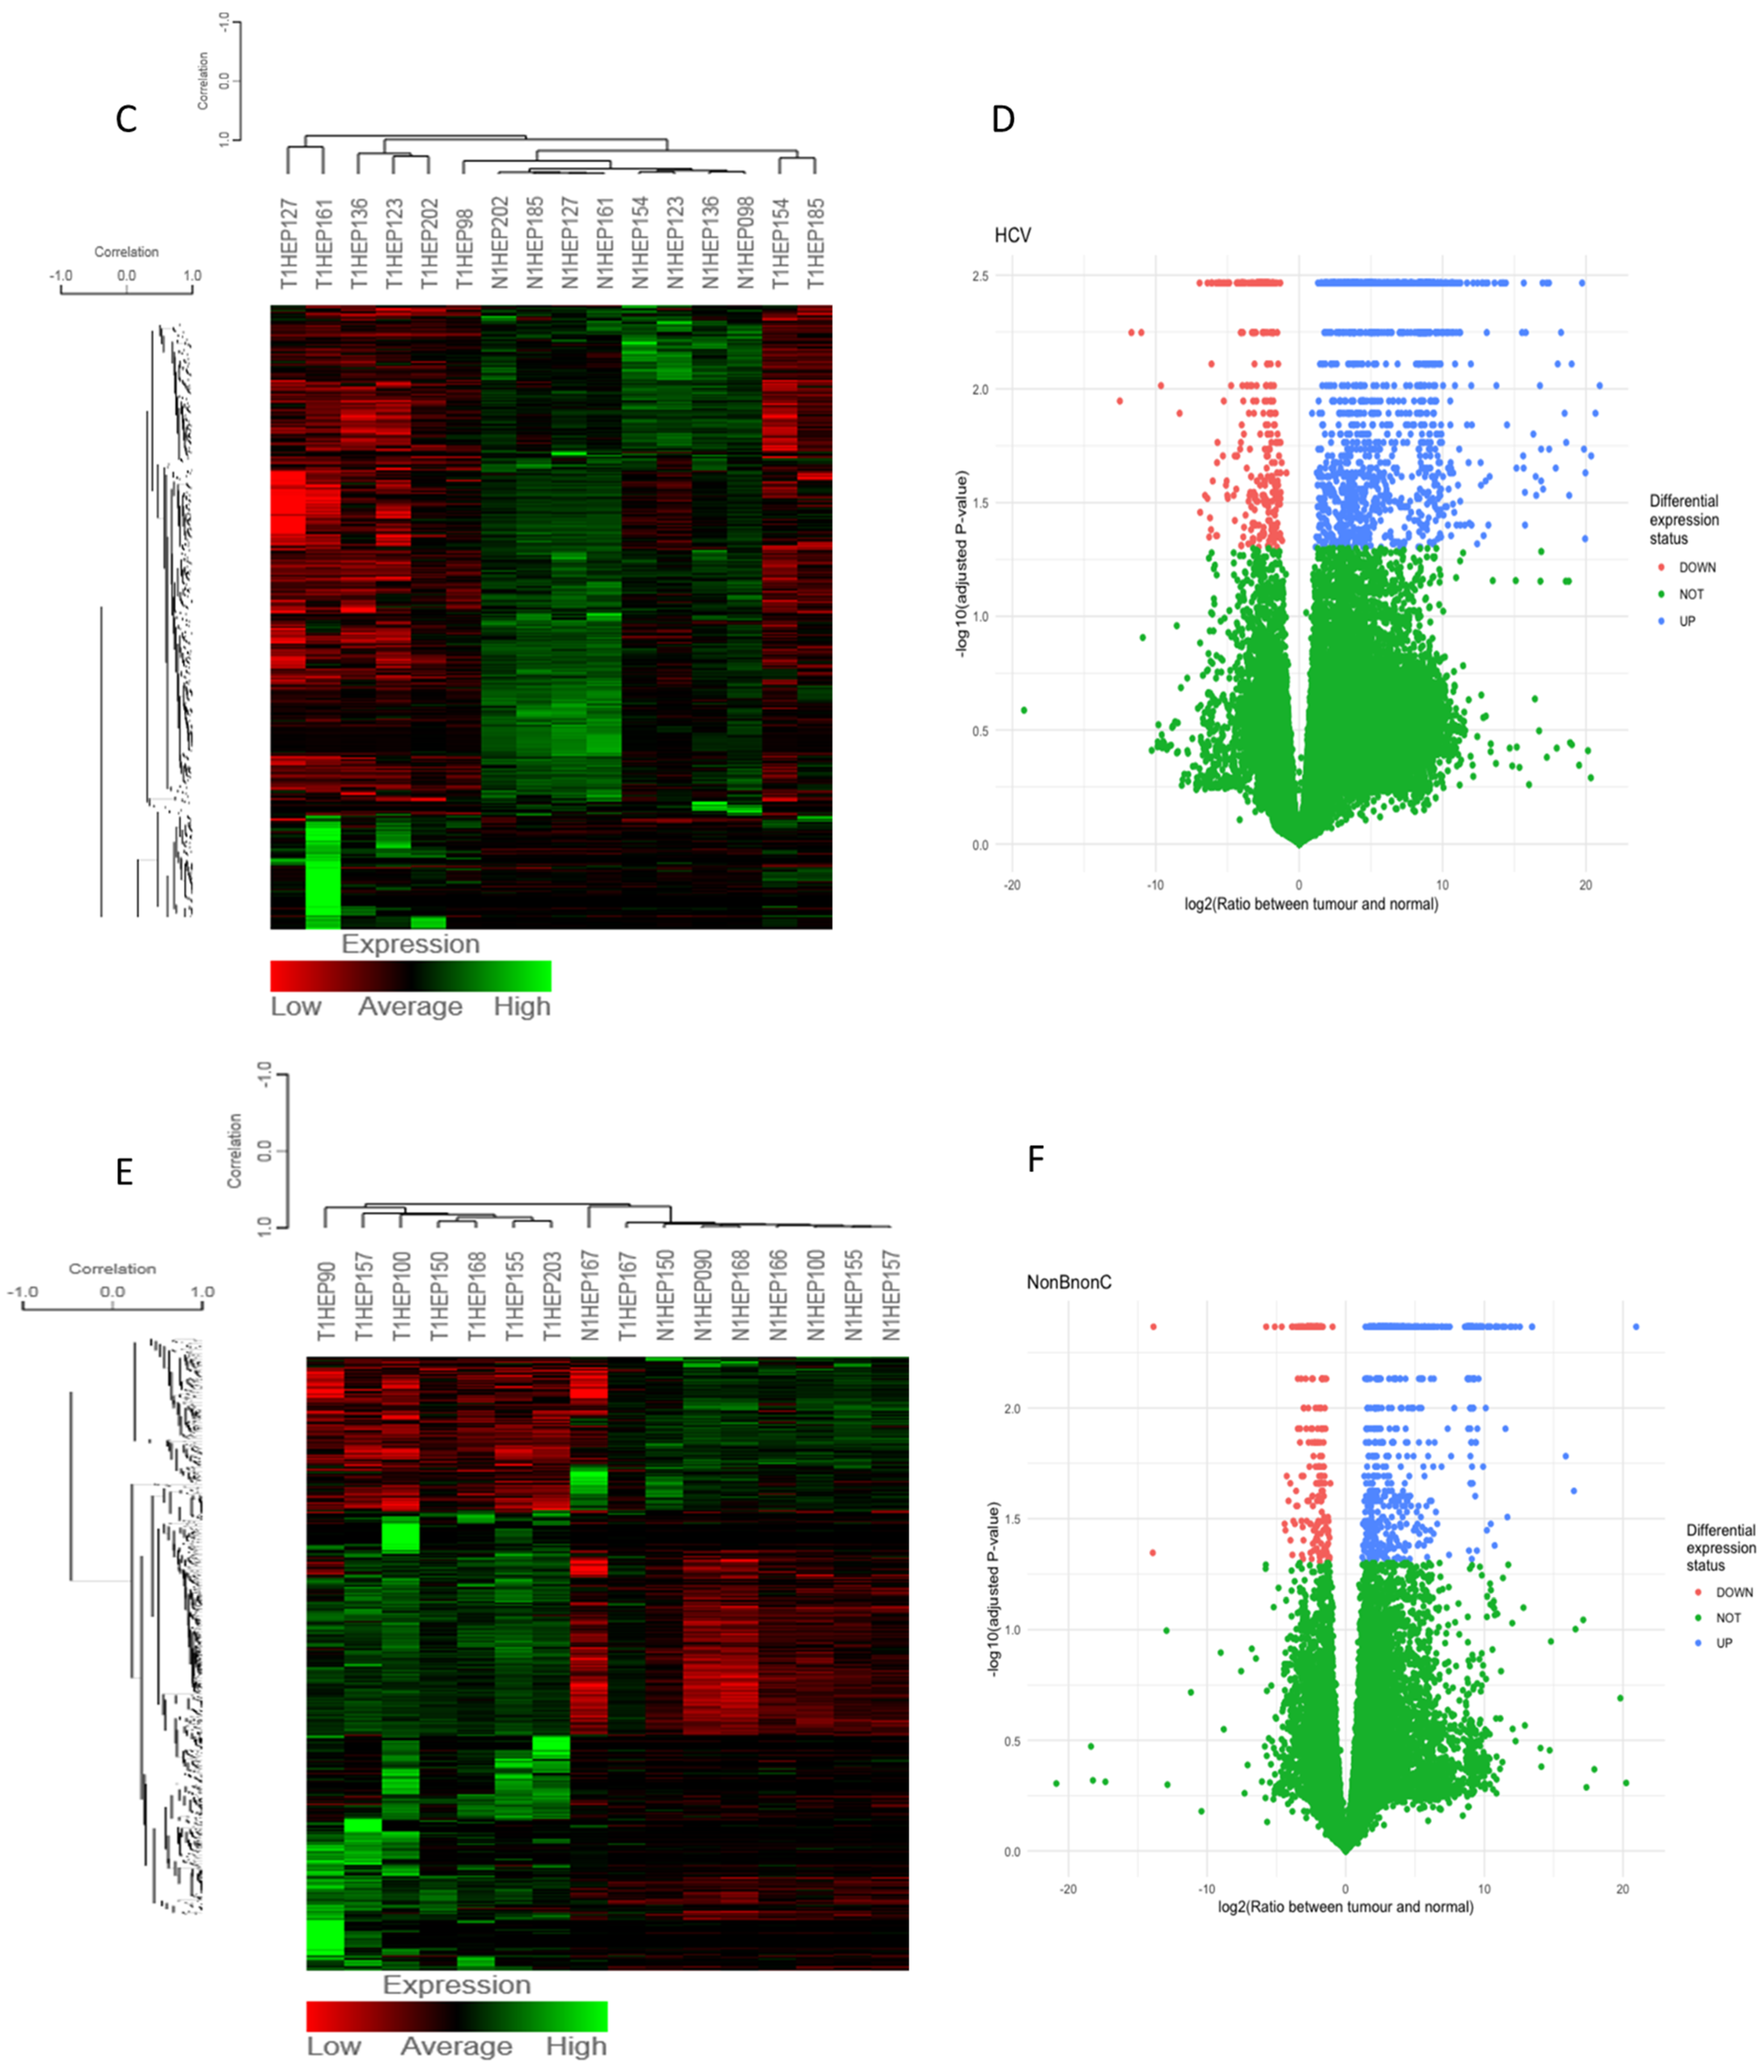
3.1. Differentially Expressed Gene (DEG) Analysis
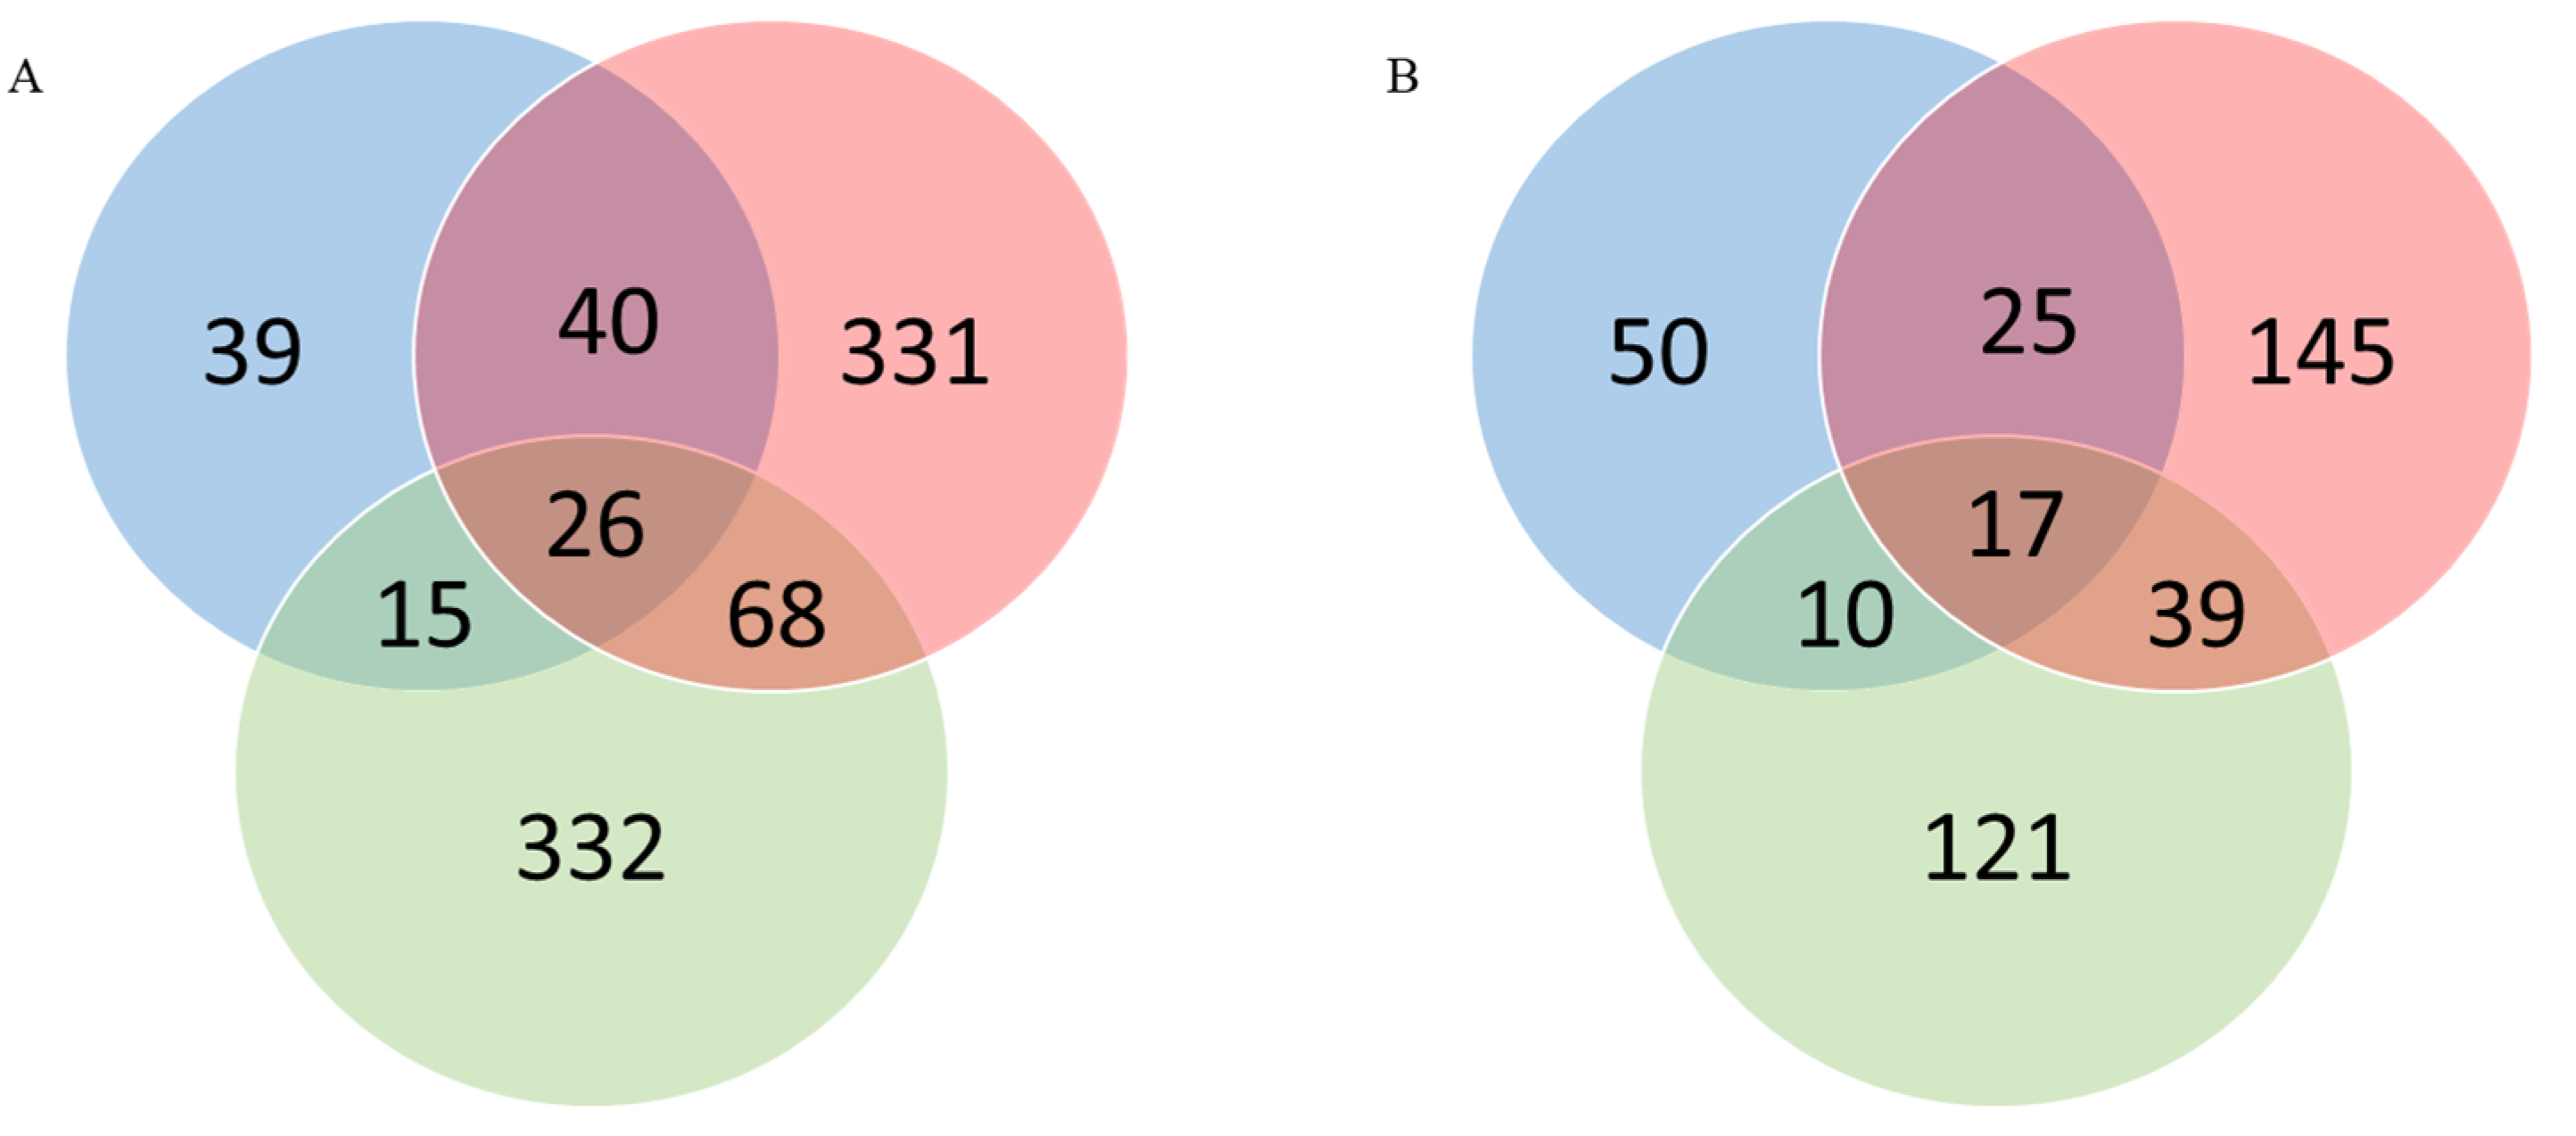
3.2. Identification of “Common” and “Unique” Genes
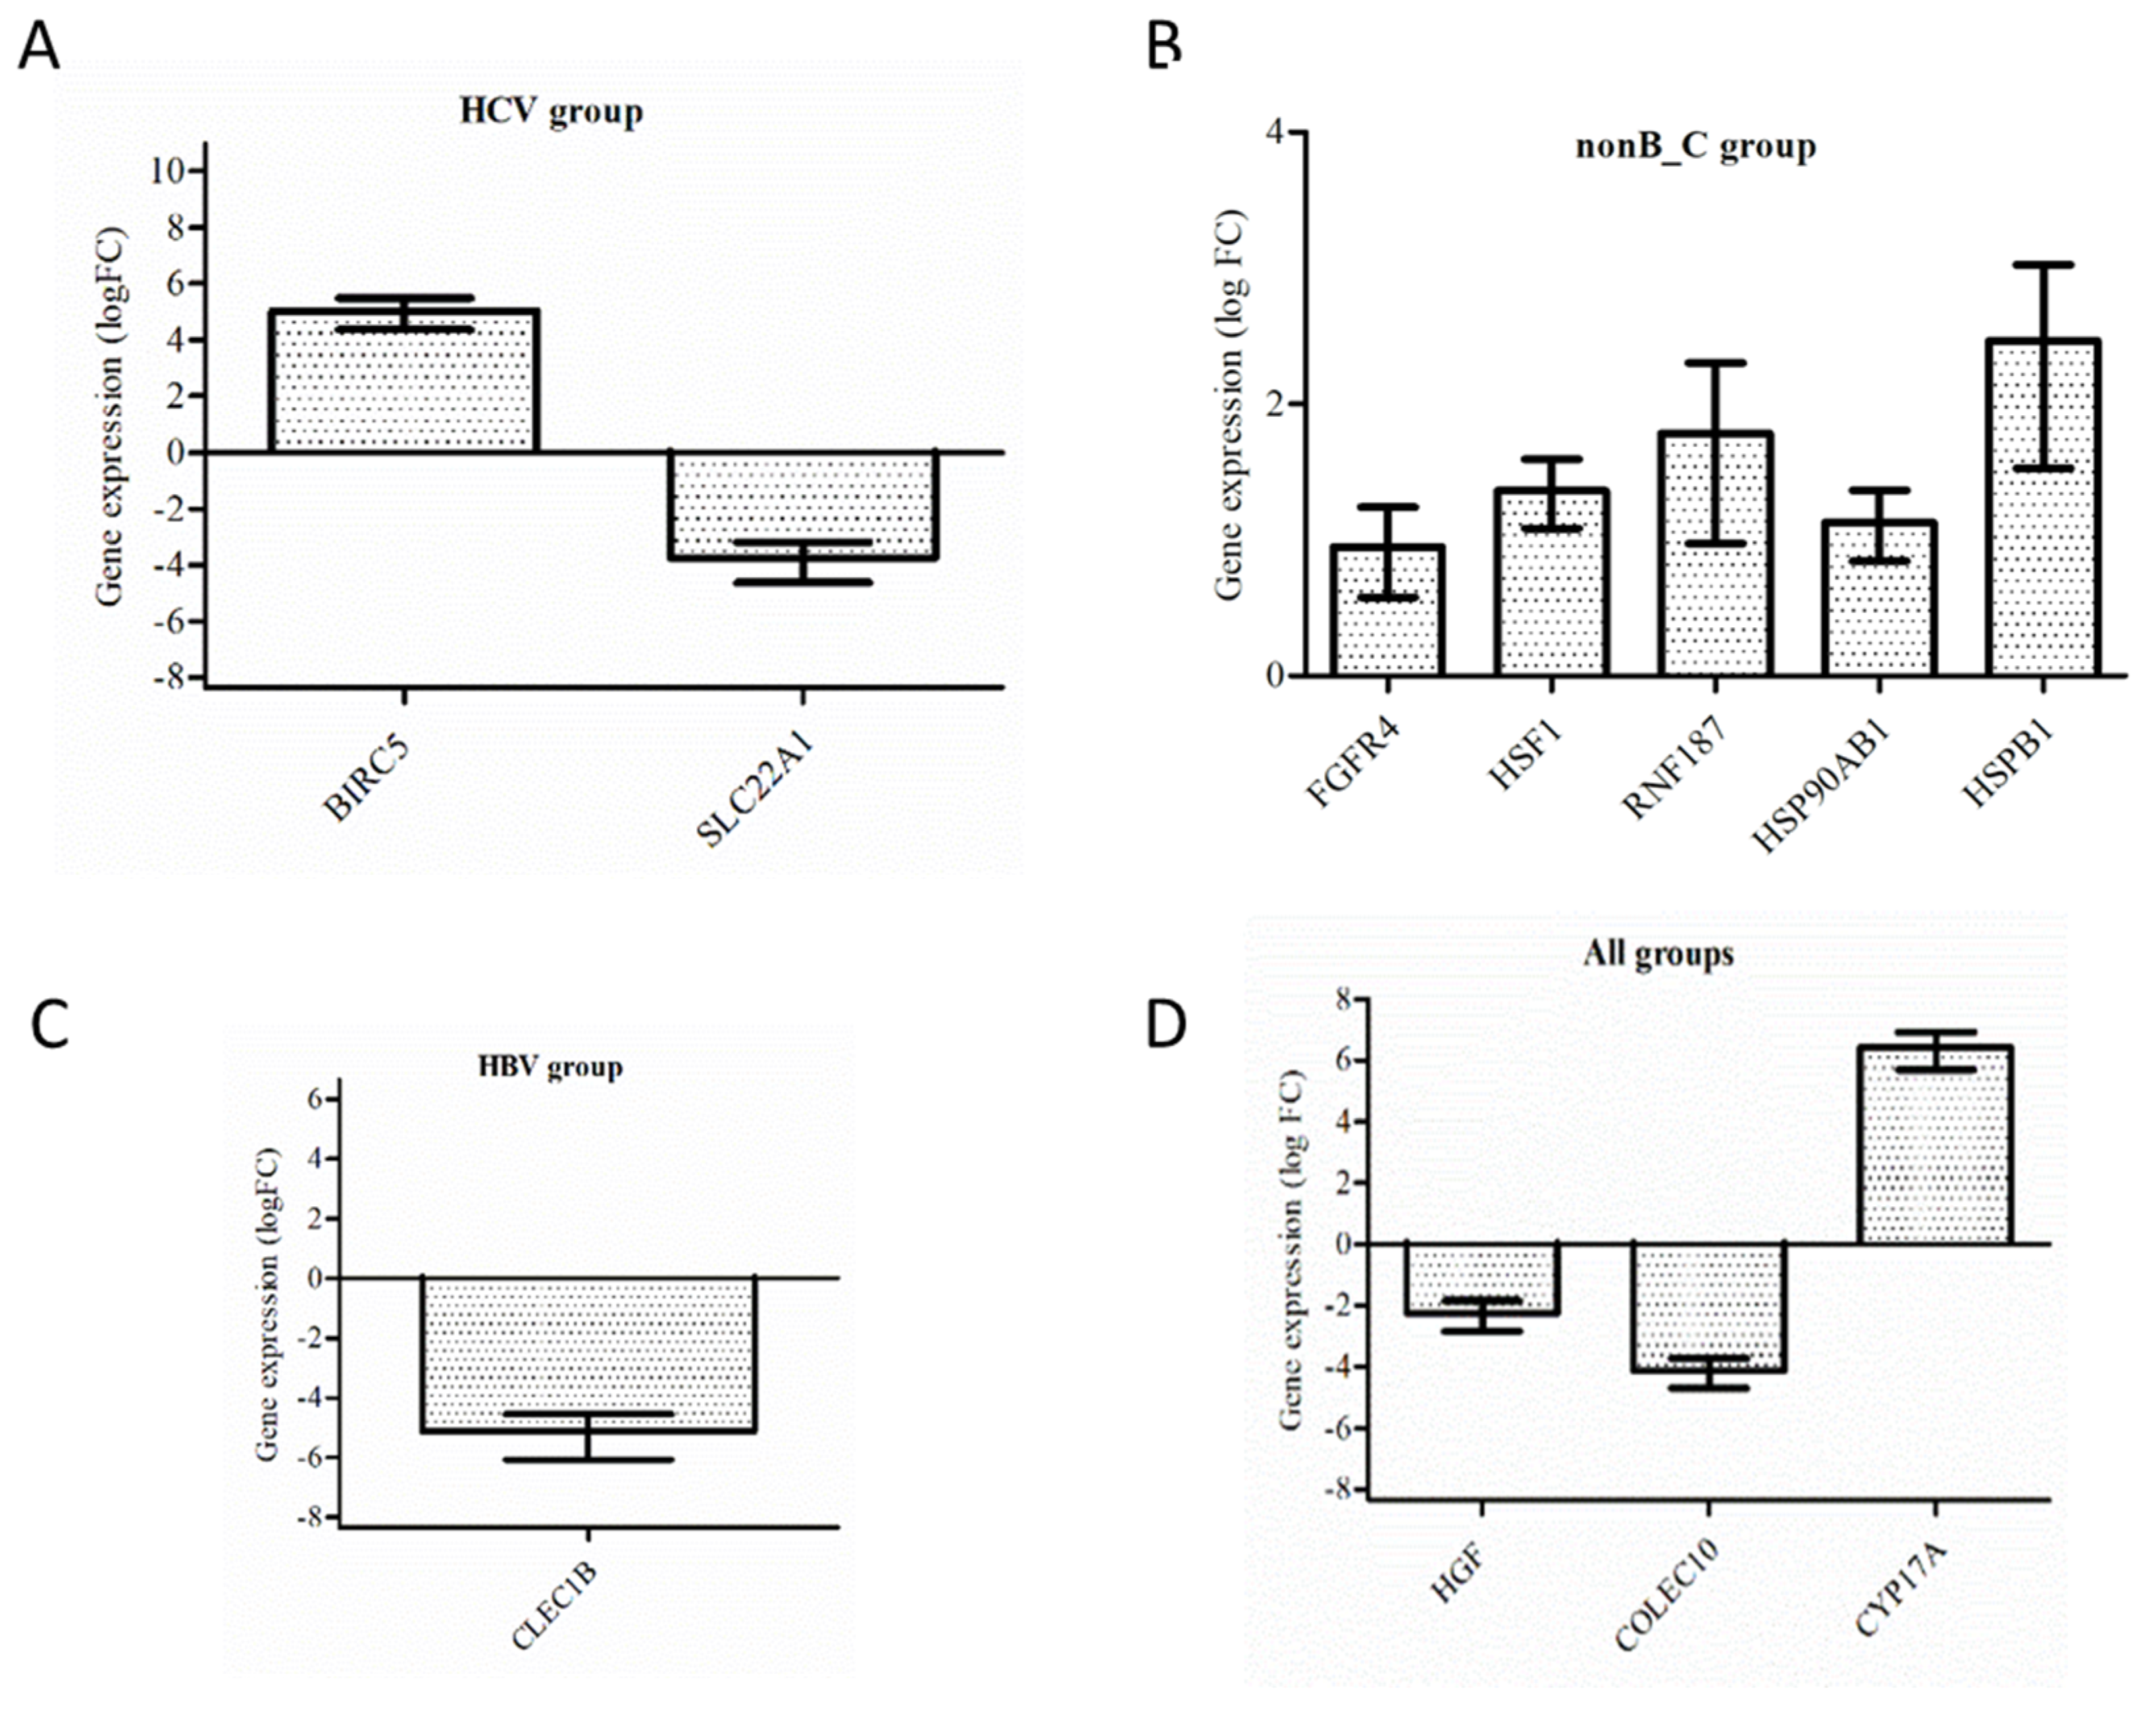
3.3. Validation by RT-PCR
3.4. Differential Gene Expression of Solute Carrier Transporters (SLC), ATP Binding Cassette, and Cytochrome Genes
- SLC44A5 is an intermediate-affinity choline transporter; high expression of SLC44A5 demonstrates its important role in the development and progression of HCC [38].
- SLC38A4 transporter is found predominantly in the liver and transports both cationic and neutral amino acids. Low expression of SLC38A4 is associated with poor prognosis of HCC patients [41].
- SLC22A1 codes for one of the three organic cation transporters, OCT1, an integral transmembrane protein involved in metabolic processes and detoxification. OCT1/SLCCA1 transports a wide range of substances, such as catecholamines, toxins, and anticancer drugs, and is of pharmaceutical interest [42]. In HCC, the expression of OCT1 is significantly reduced and associated with tumor progression and worse patient survival [43].
- CYP17A1 codes for an enzyme involved in the synthesis of steroid hormones, mineralocorticoids, and glucocorticoids [44]. CYP17A1 is significantly increased in human HCC. CYP17A1, as well as CYP19A1, is targeted by inhibitors in cancer treatments.
- CYP39A1 studies revealed that total bile acid, total bilirubin, and direct bilirubin were significantly increased in patients with low CYP39A1, and survival analysis of HCC patients indicated that lower CYP39A1 expression was associated with poorer overall survival. The downregulation of CYP39A1 is associated with HCC carcinogenesis, tumor differentiation, and poor overall survival. CYP39A1 may serve as a tumor suppressor gene and a novel biomarker for HCC patients [45].
- CYP2C9 codes for one of the most important drug metabolizing enzymes in humans. Substrates for CYP2C9 include fluoxetine, losartan, phenytoin, tolbutamide, torsemide, S-warfarin, numerous NSAIDs, etc. [46]. In the TCGA database, low expression of CYP2C8, CYP2C9, and CYP2C19 in tumor tissue was associated with short median survival [47]. CYP2C9 could be used as a new biomarker for diagnosis.
- CYP2C8 plays an important role in oxidative metabolism; the enzyme metabolizes certain chemicals that contain steroids, arachidonic acids, and retinoids and the anionic parts of some drugs.
- CYP2C19 is an enzyme that metabolizes many drugs, such as as clopidogrel (Plavix), omeprazole, mephenytoin, proguanil, diazepam, tamoxifen, amitriptyline, citalopram, lomipramine, etc.
- CYP3A4 is an important mono-oxygenase that metabolizes xenobiotics (drugs, toxins, etc.) to eliminate them from the body. The enzyme is predominantly found in the liver but also in the intestines. Dowregulation of CYP3A4 in HCC is associated with poor prognosis. It may be a novel biomarker for HCC [49]. In our study, we identified CYP3A4 as being dowregulated only in the HCV tumor group.
- ABC transporters are mostly exporters; they transport a large variety of molecules using the energy generated by hydrolysis of ATP against their electrochemical gradient. They regulate cellular levels of lipids, ions, xenobiotics, and other small molecules. Studies have revealed that the members of the ABCA subfamily are significantly involved in membrane lipid trafficking (ABCA1, A3, A5, and A9 are detected in almost all tissues) and in cholesterol homeostasis and they have been associated with some inherited diseases [50]. In hepatocellular cancer, ABCA8 and ABCA9 are downregulated, and HCC patients had significantly shorter survival times [51].
3.5. Differential Expression of Cancer-Testis-Specific Genes
- The Melanoma Antigen Gene (MAGE) family was reported to participate in the progression of multiple cancers in humans, including HCC [57].
- ATAD2 (ATPase family AAA domain-containing 2) participates in carcinogenic processes. ATAD2 is overexpressed in various human malignancies, including HCC; it is a potential proliferation marker for liver regeneration and is a poor prognostic marker for hepatocellular carcinoma after curative resection [61,62].
3.6. Differential Expression of Heat Shock Proteins and Heat Shock Factors
- HSF4 (Heat Shock Transcription Factor 4)
- HSF1, HSP70, HSP90, and HSPB1 are further described as hub genes.
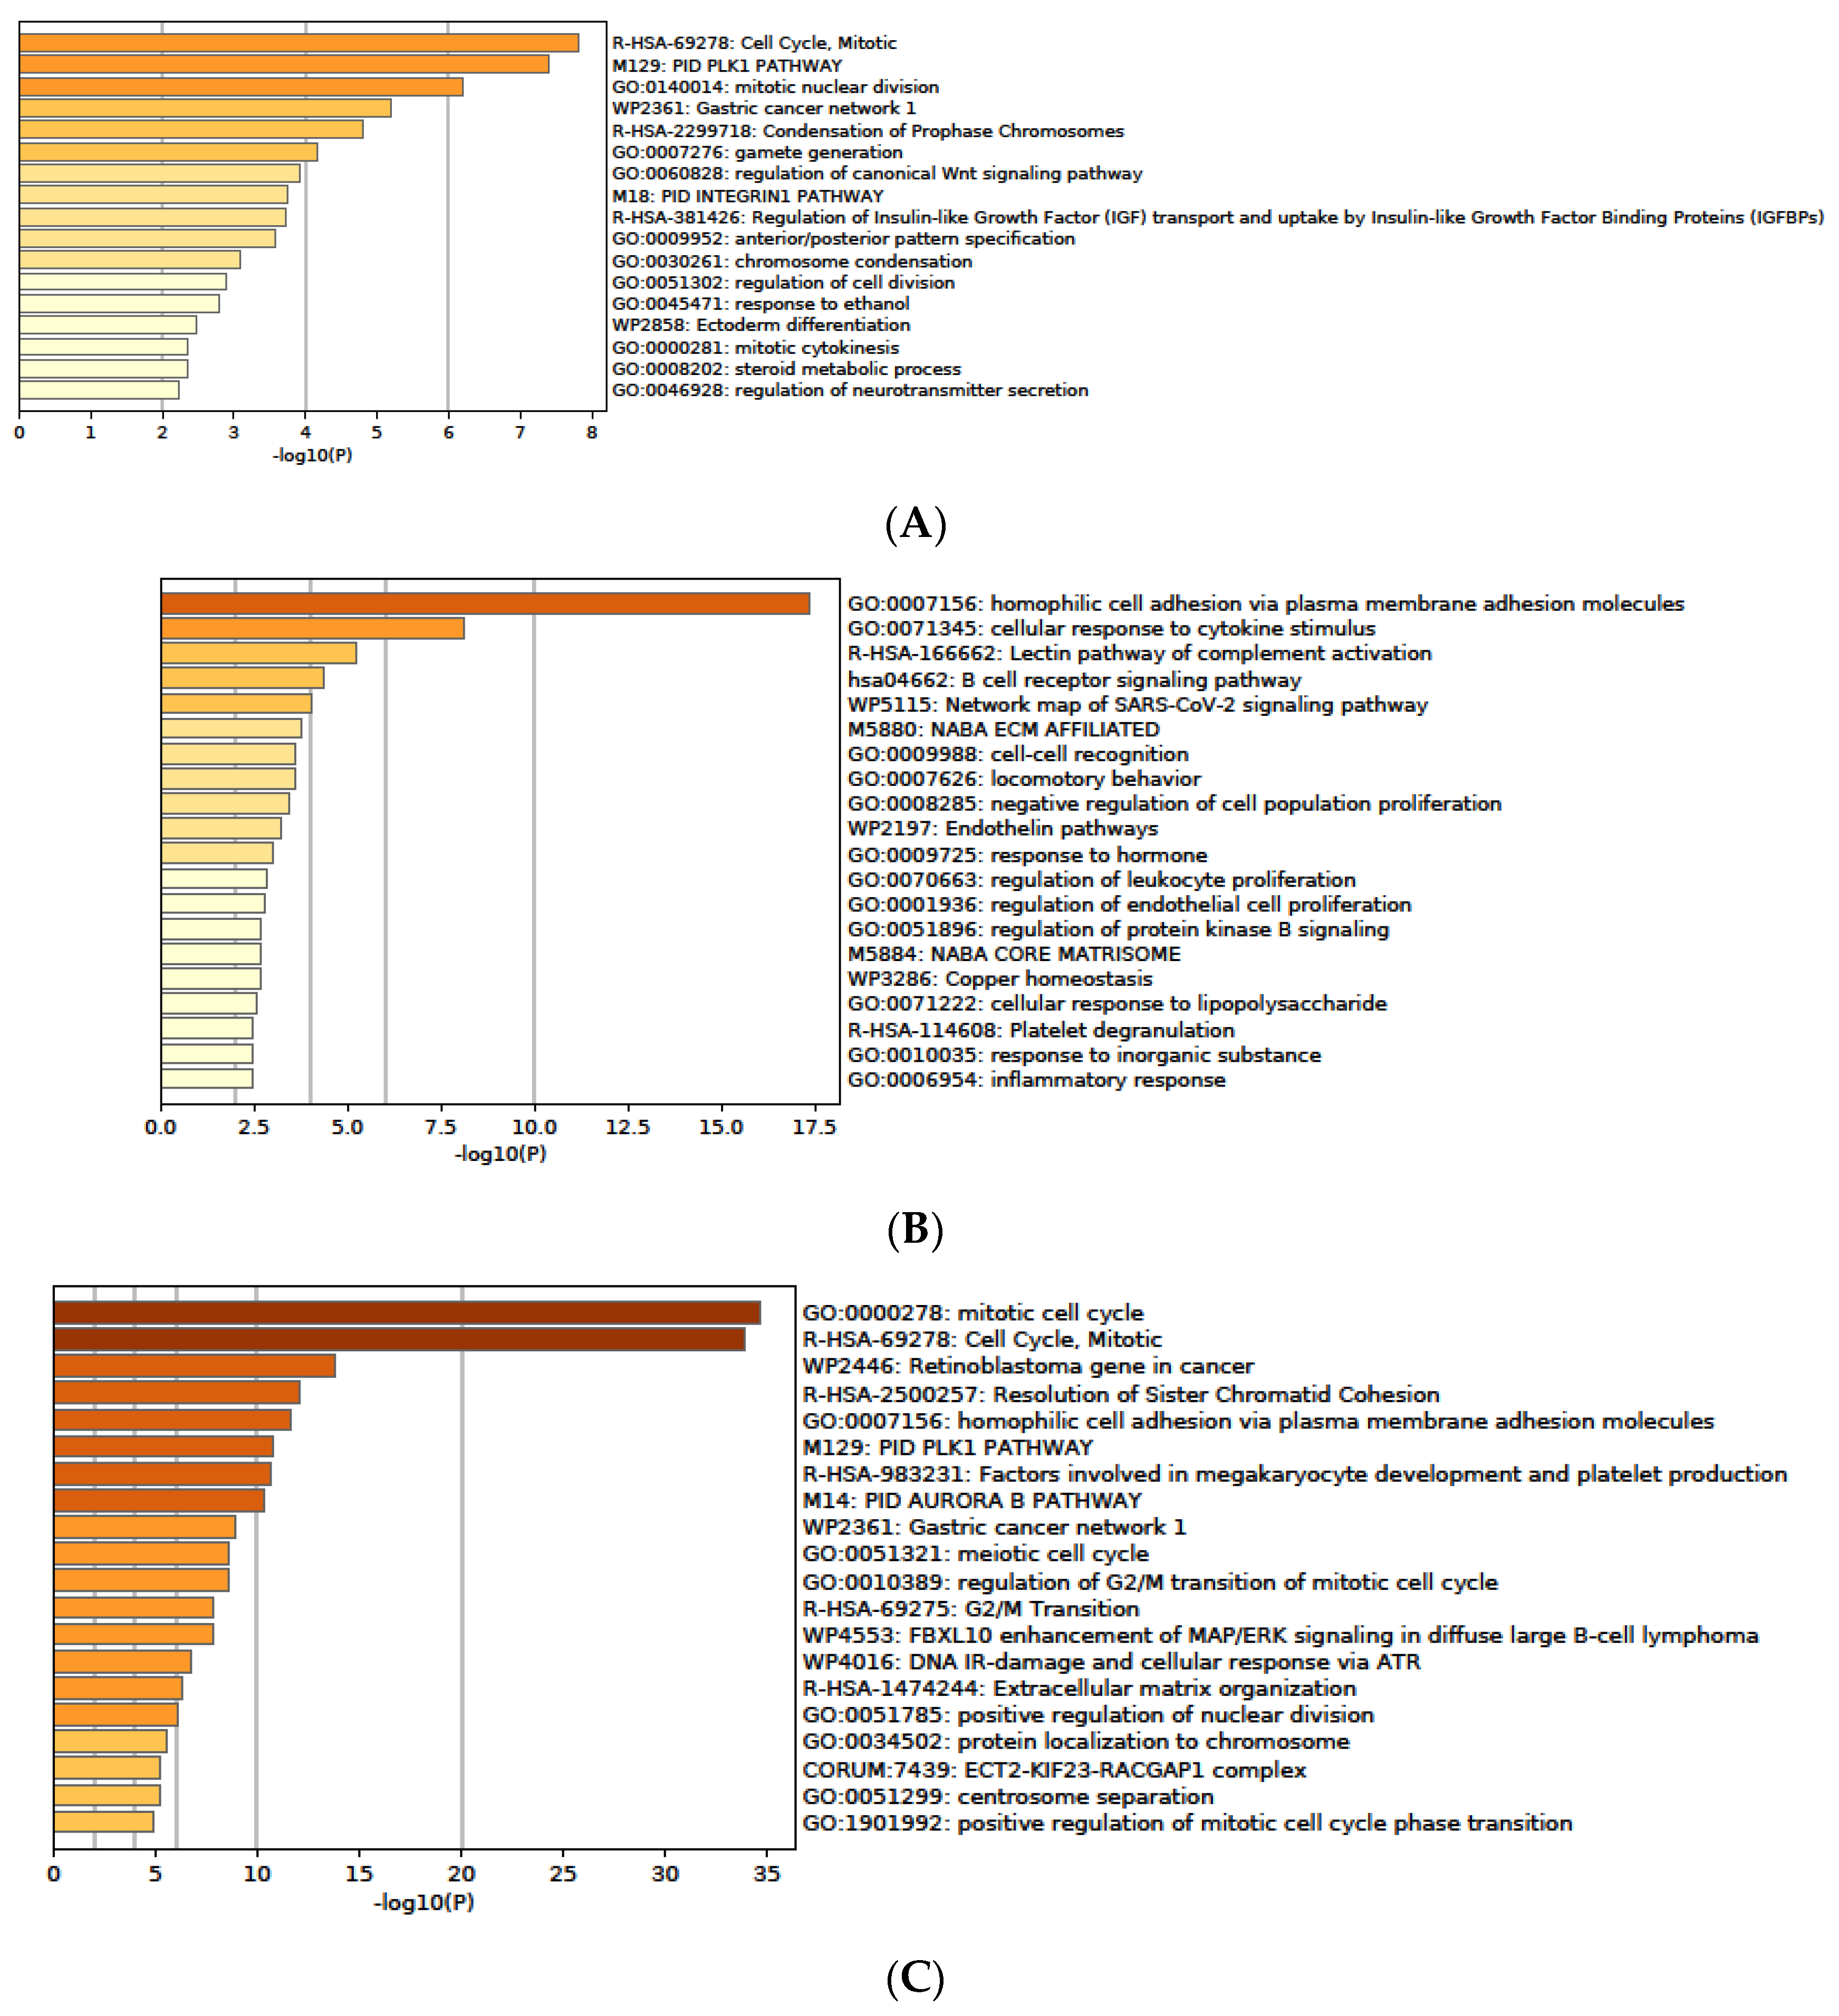
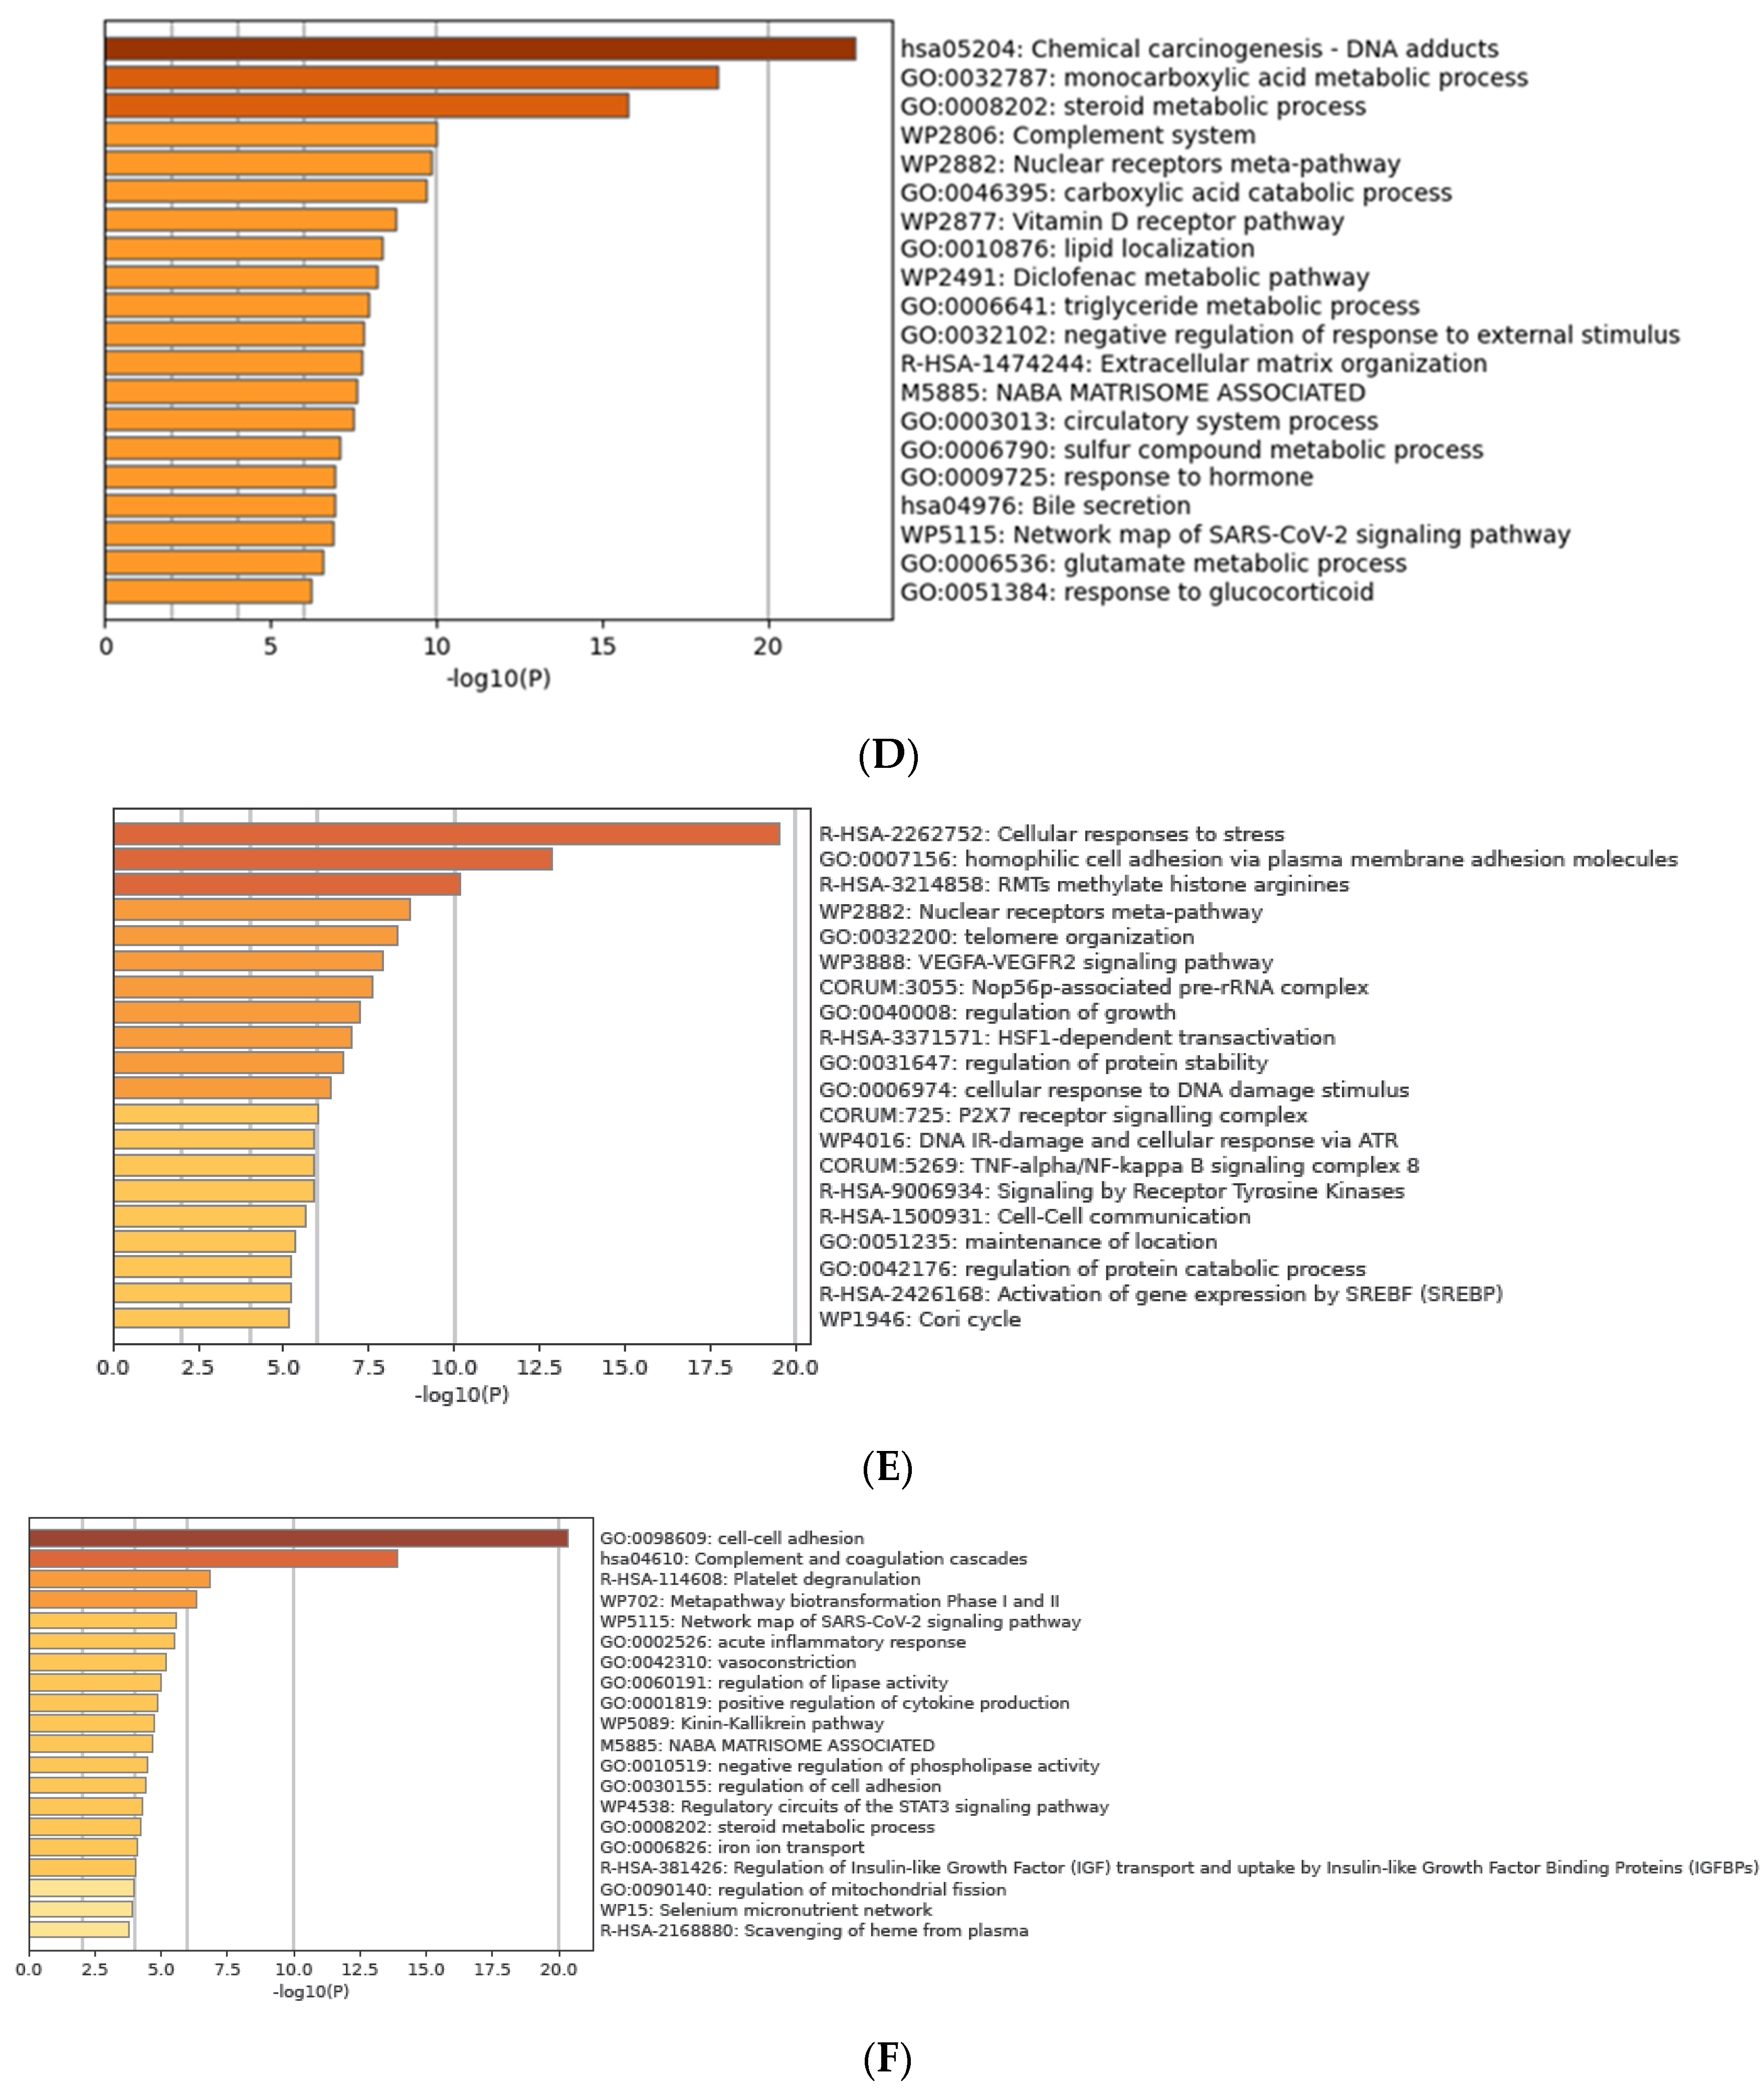
3.7. Functional Enrichment Analysis of DEGs
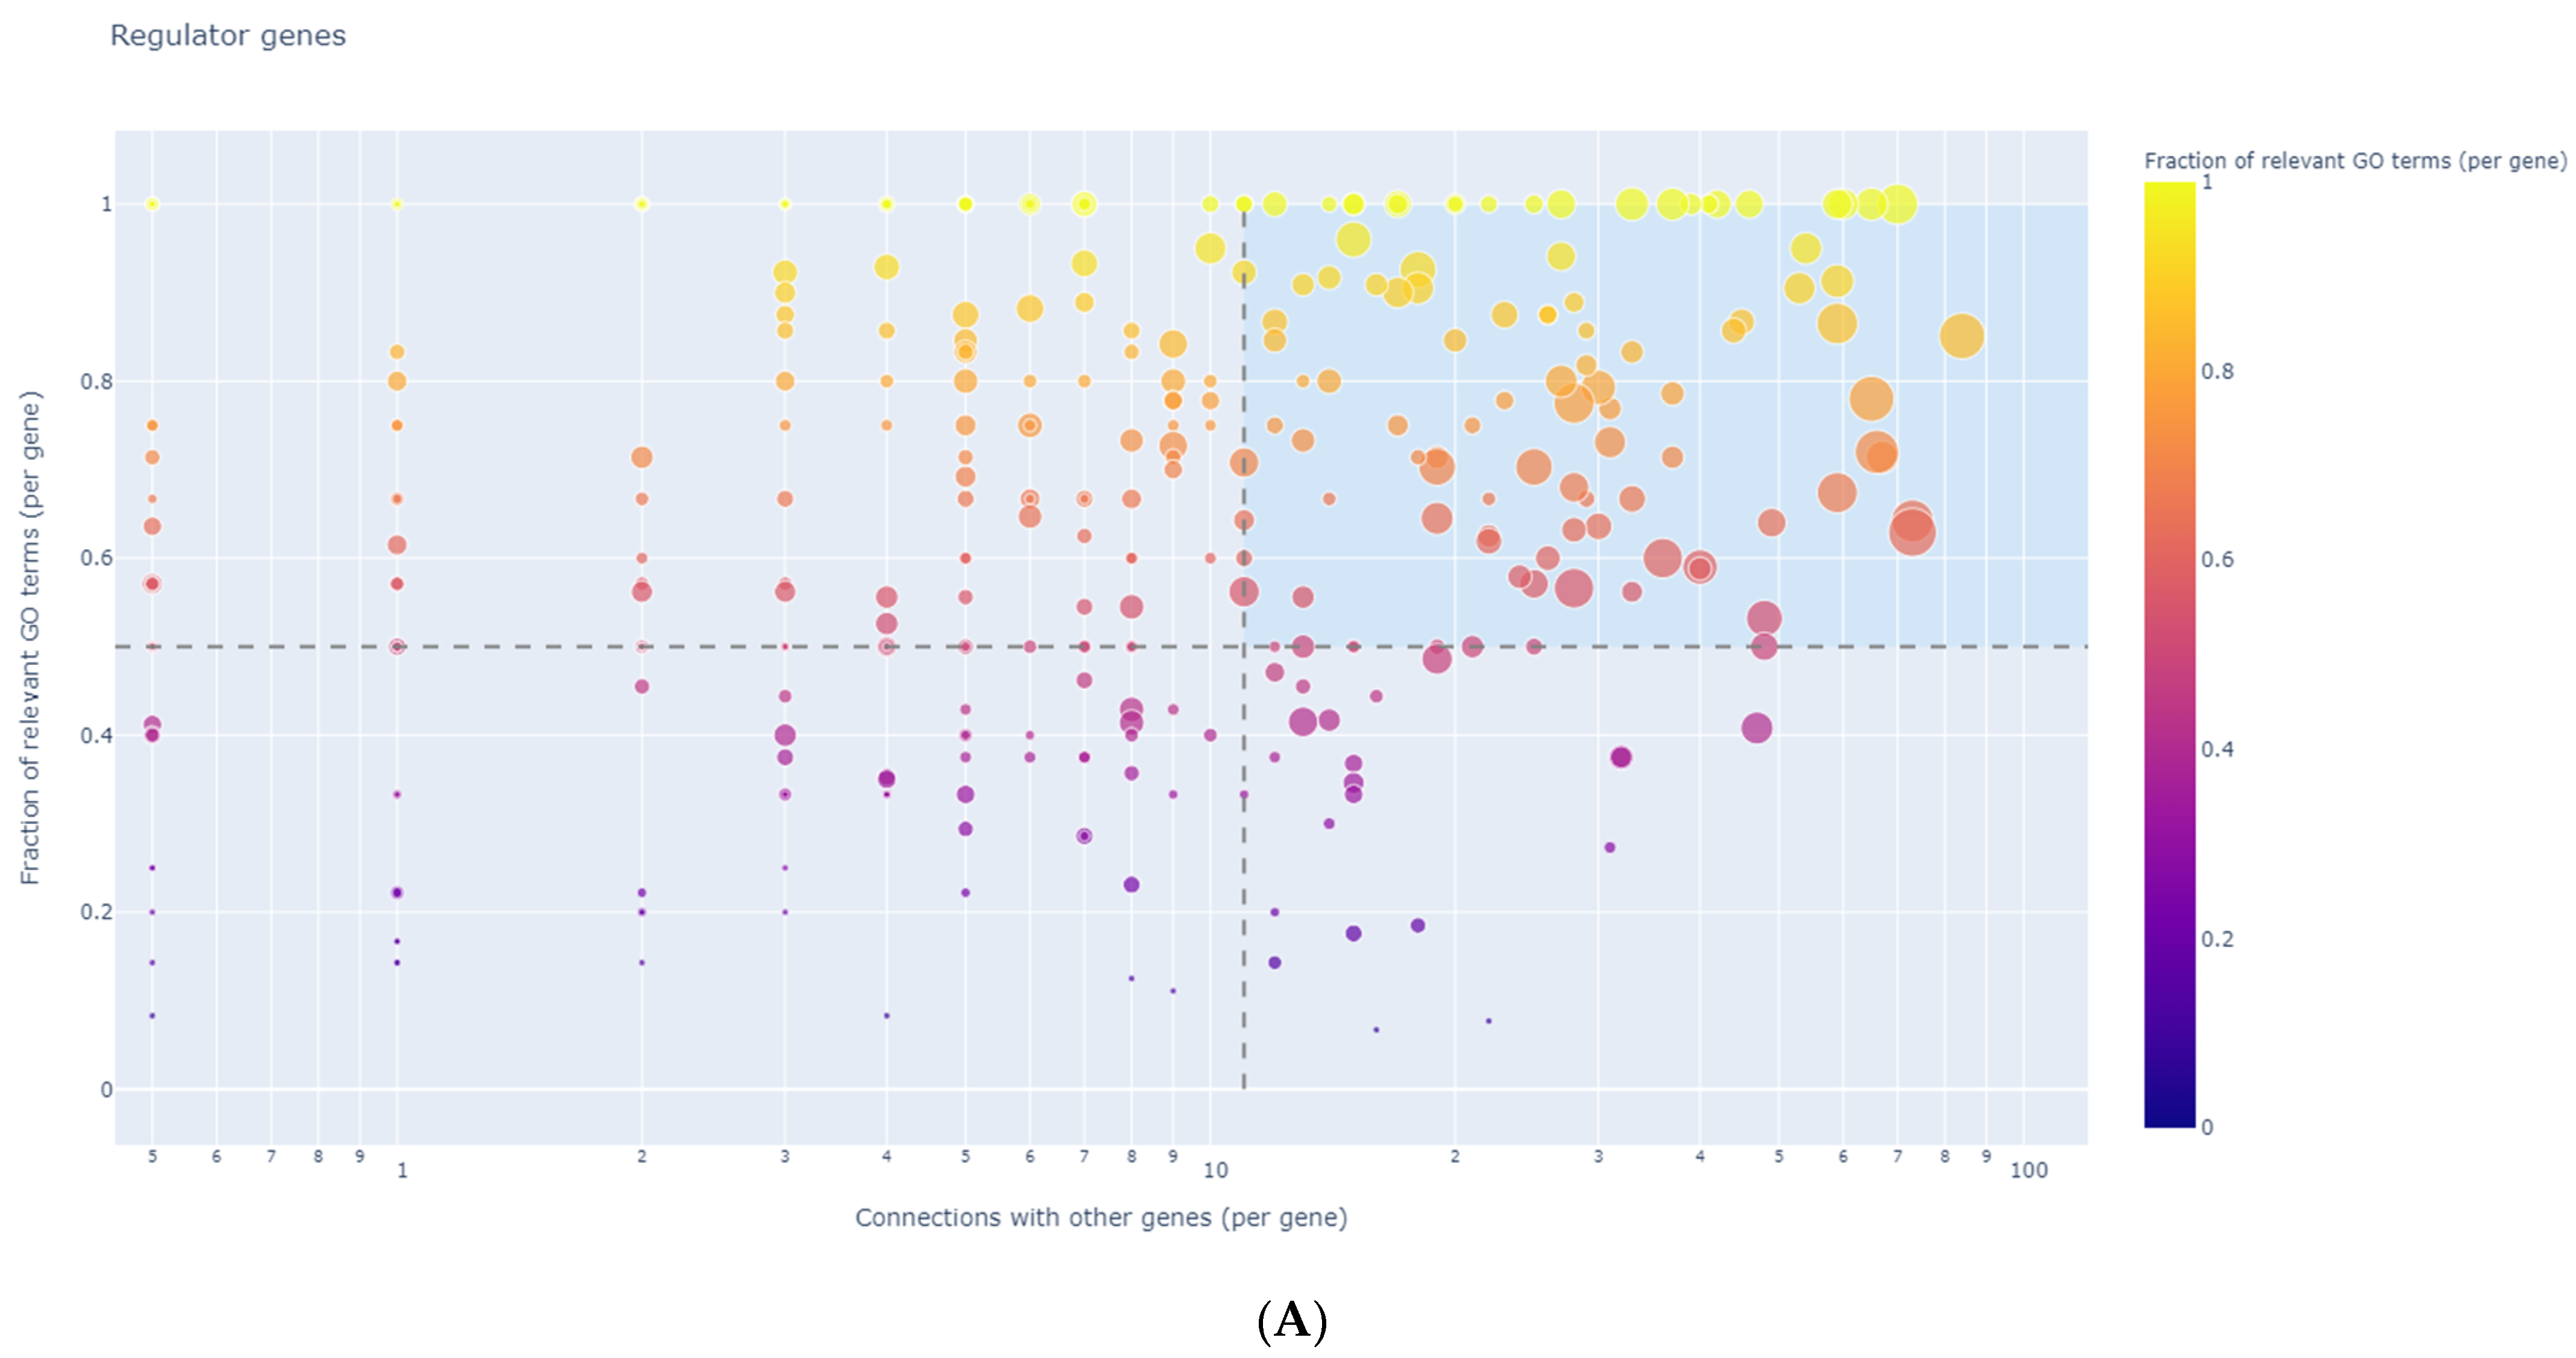
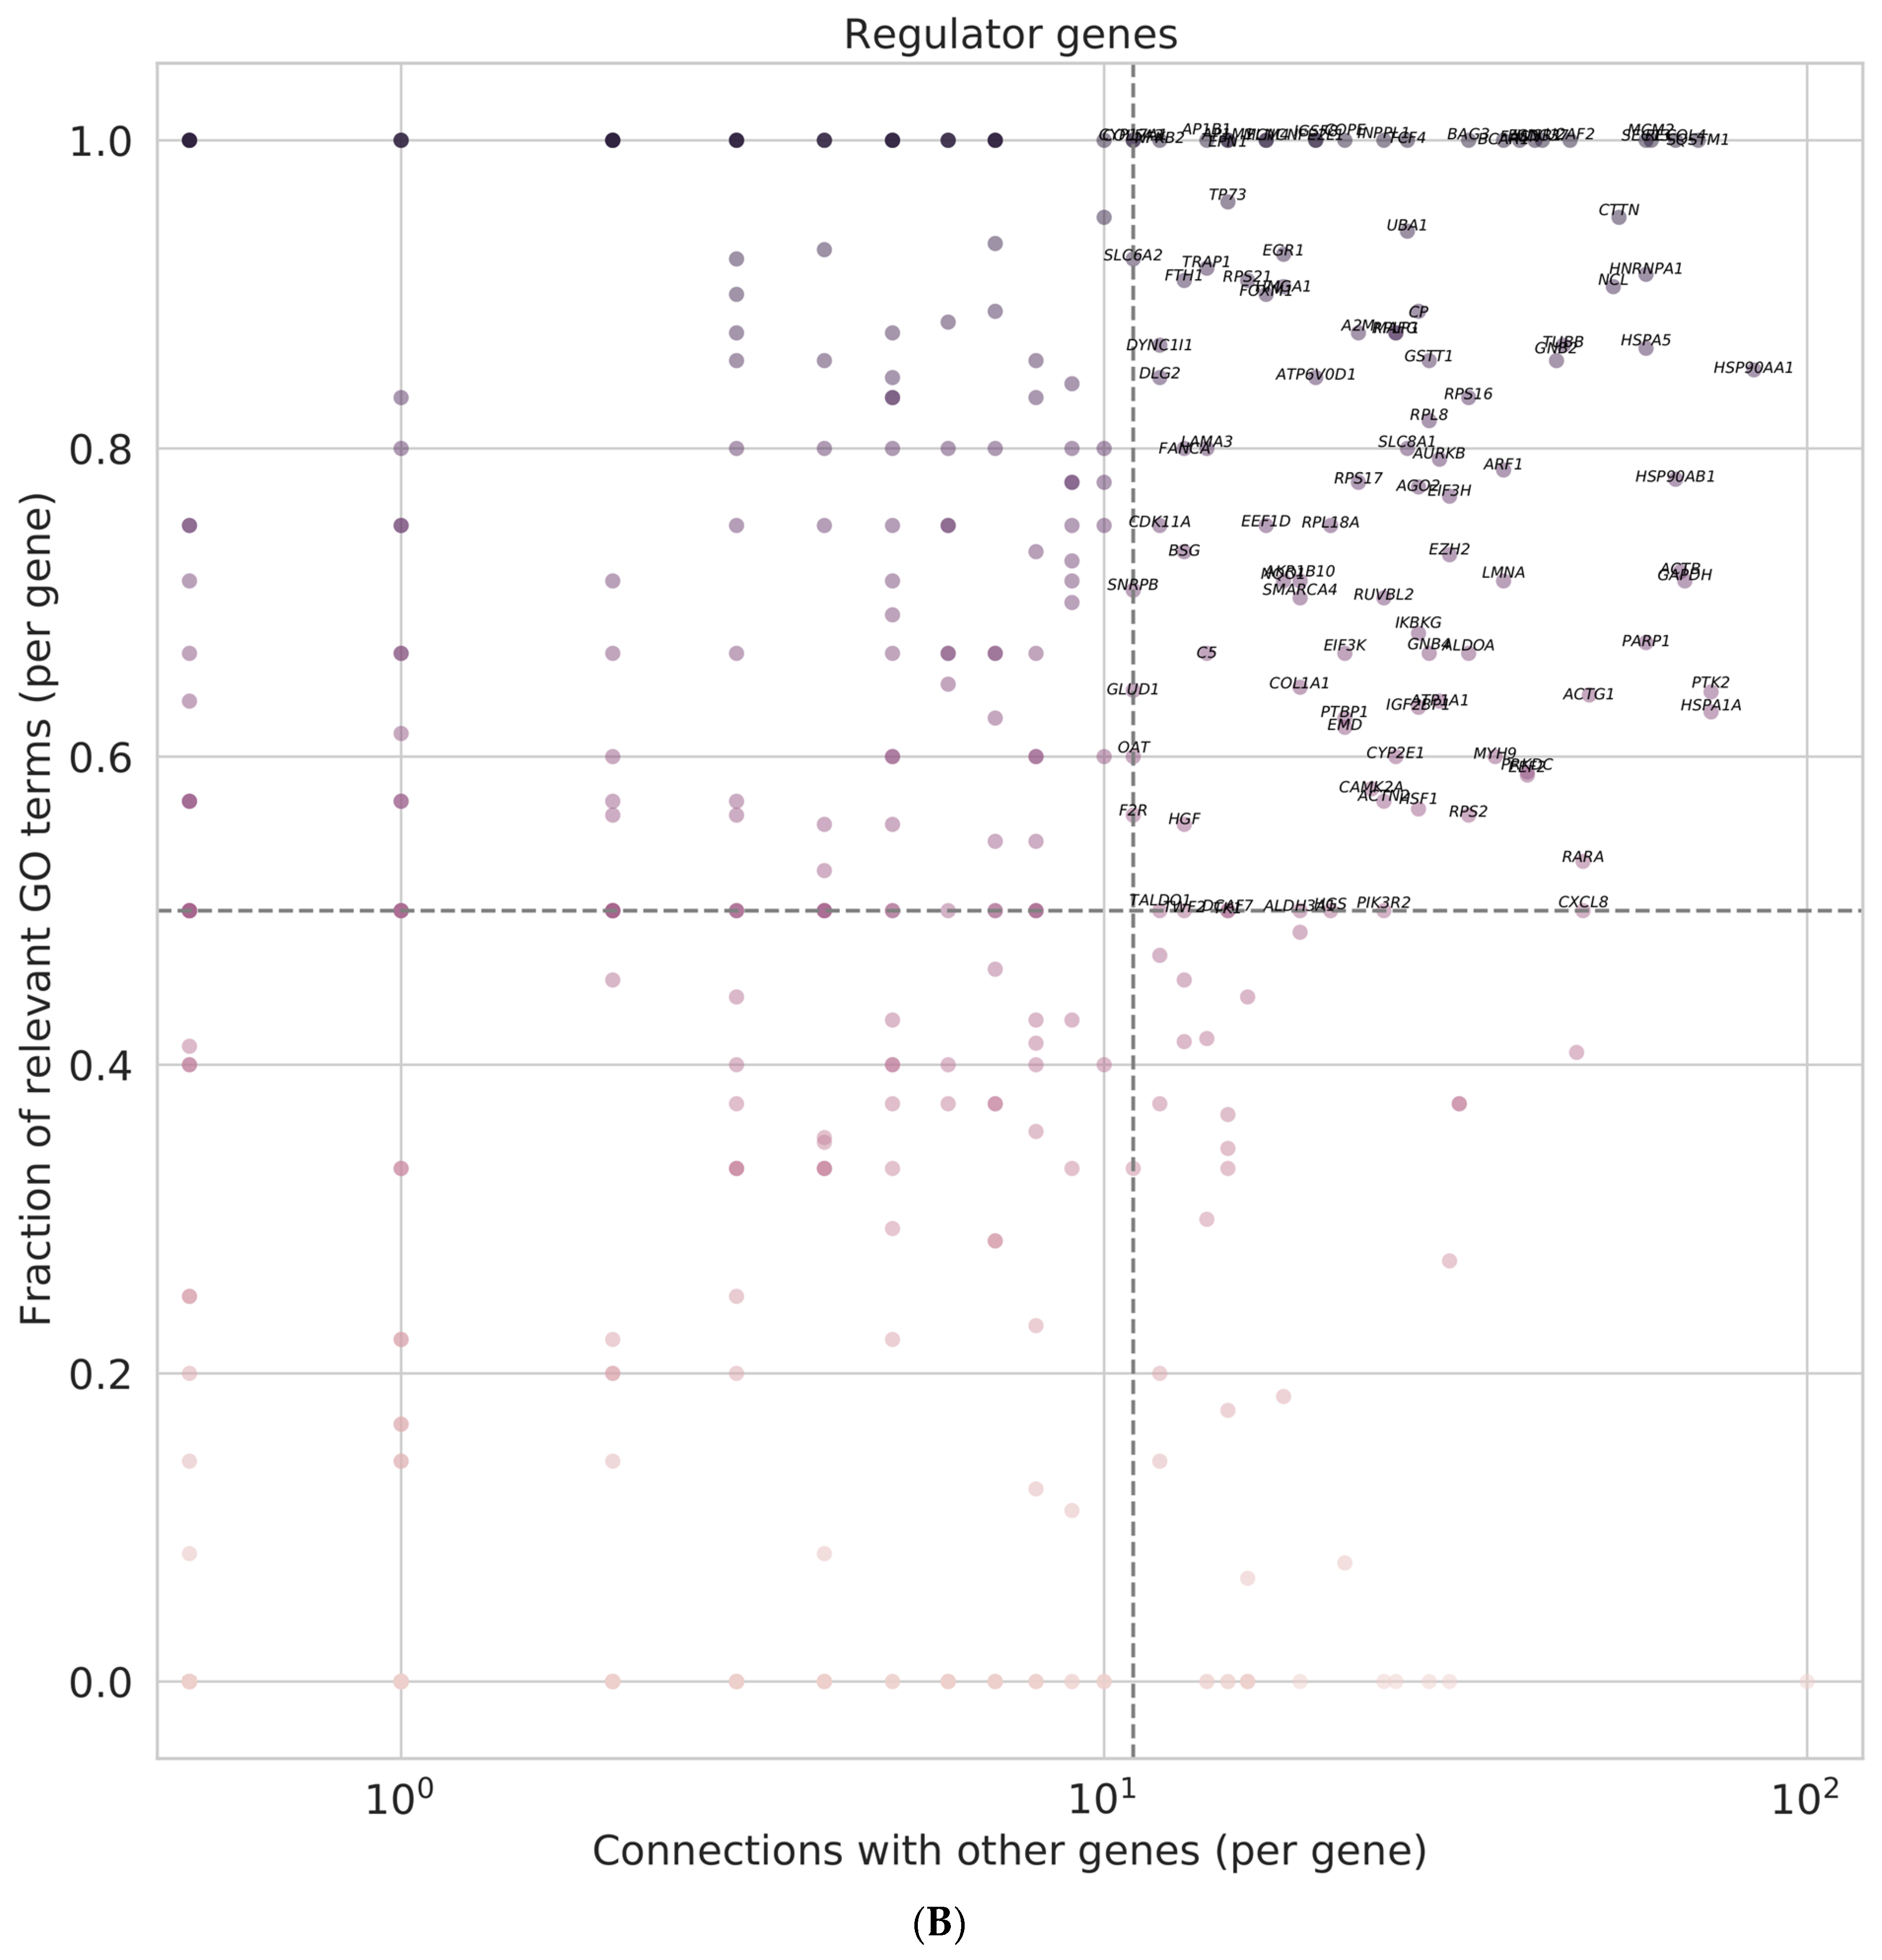
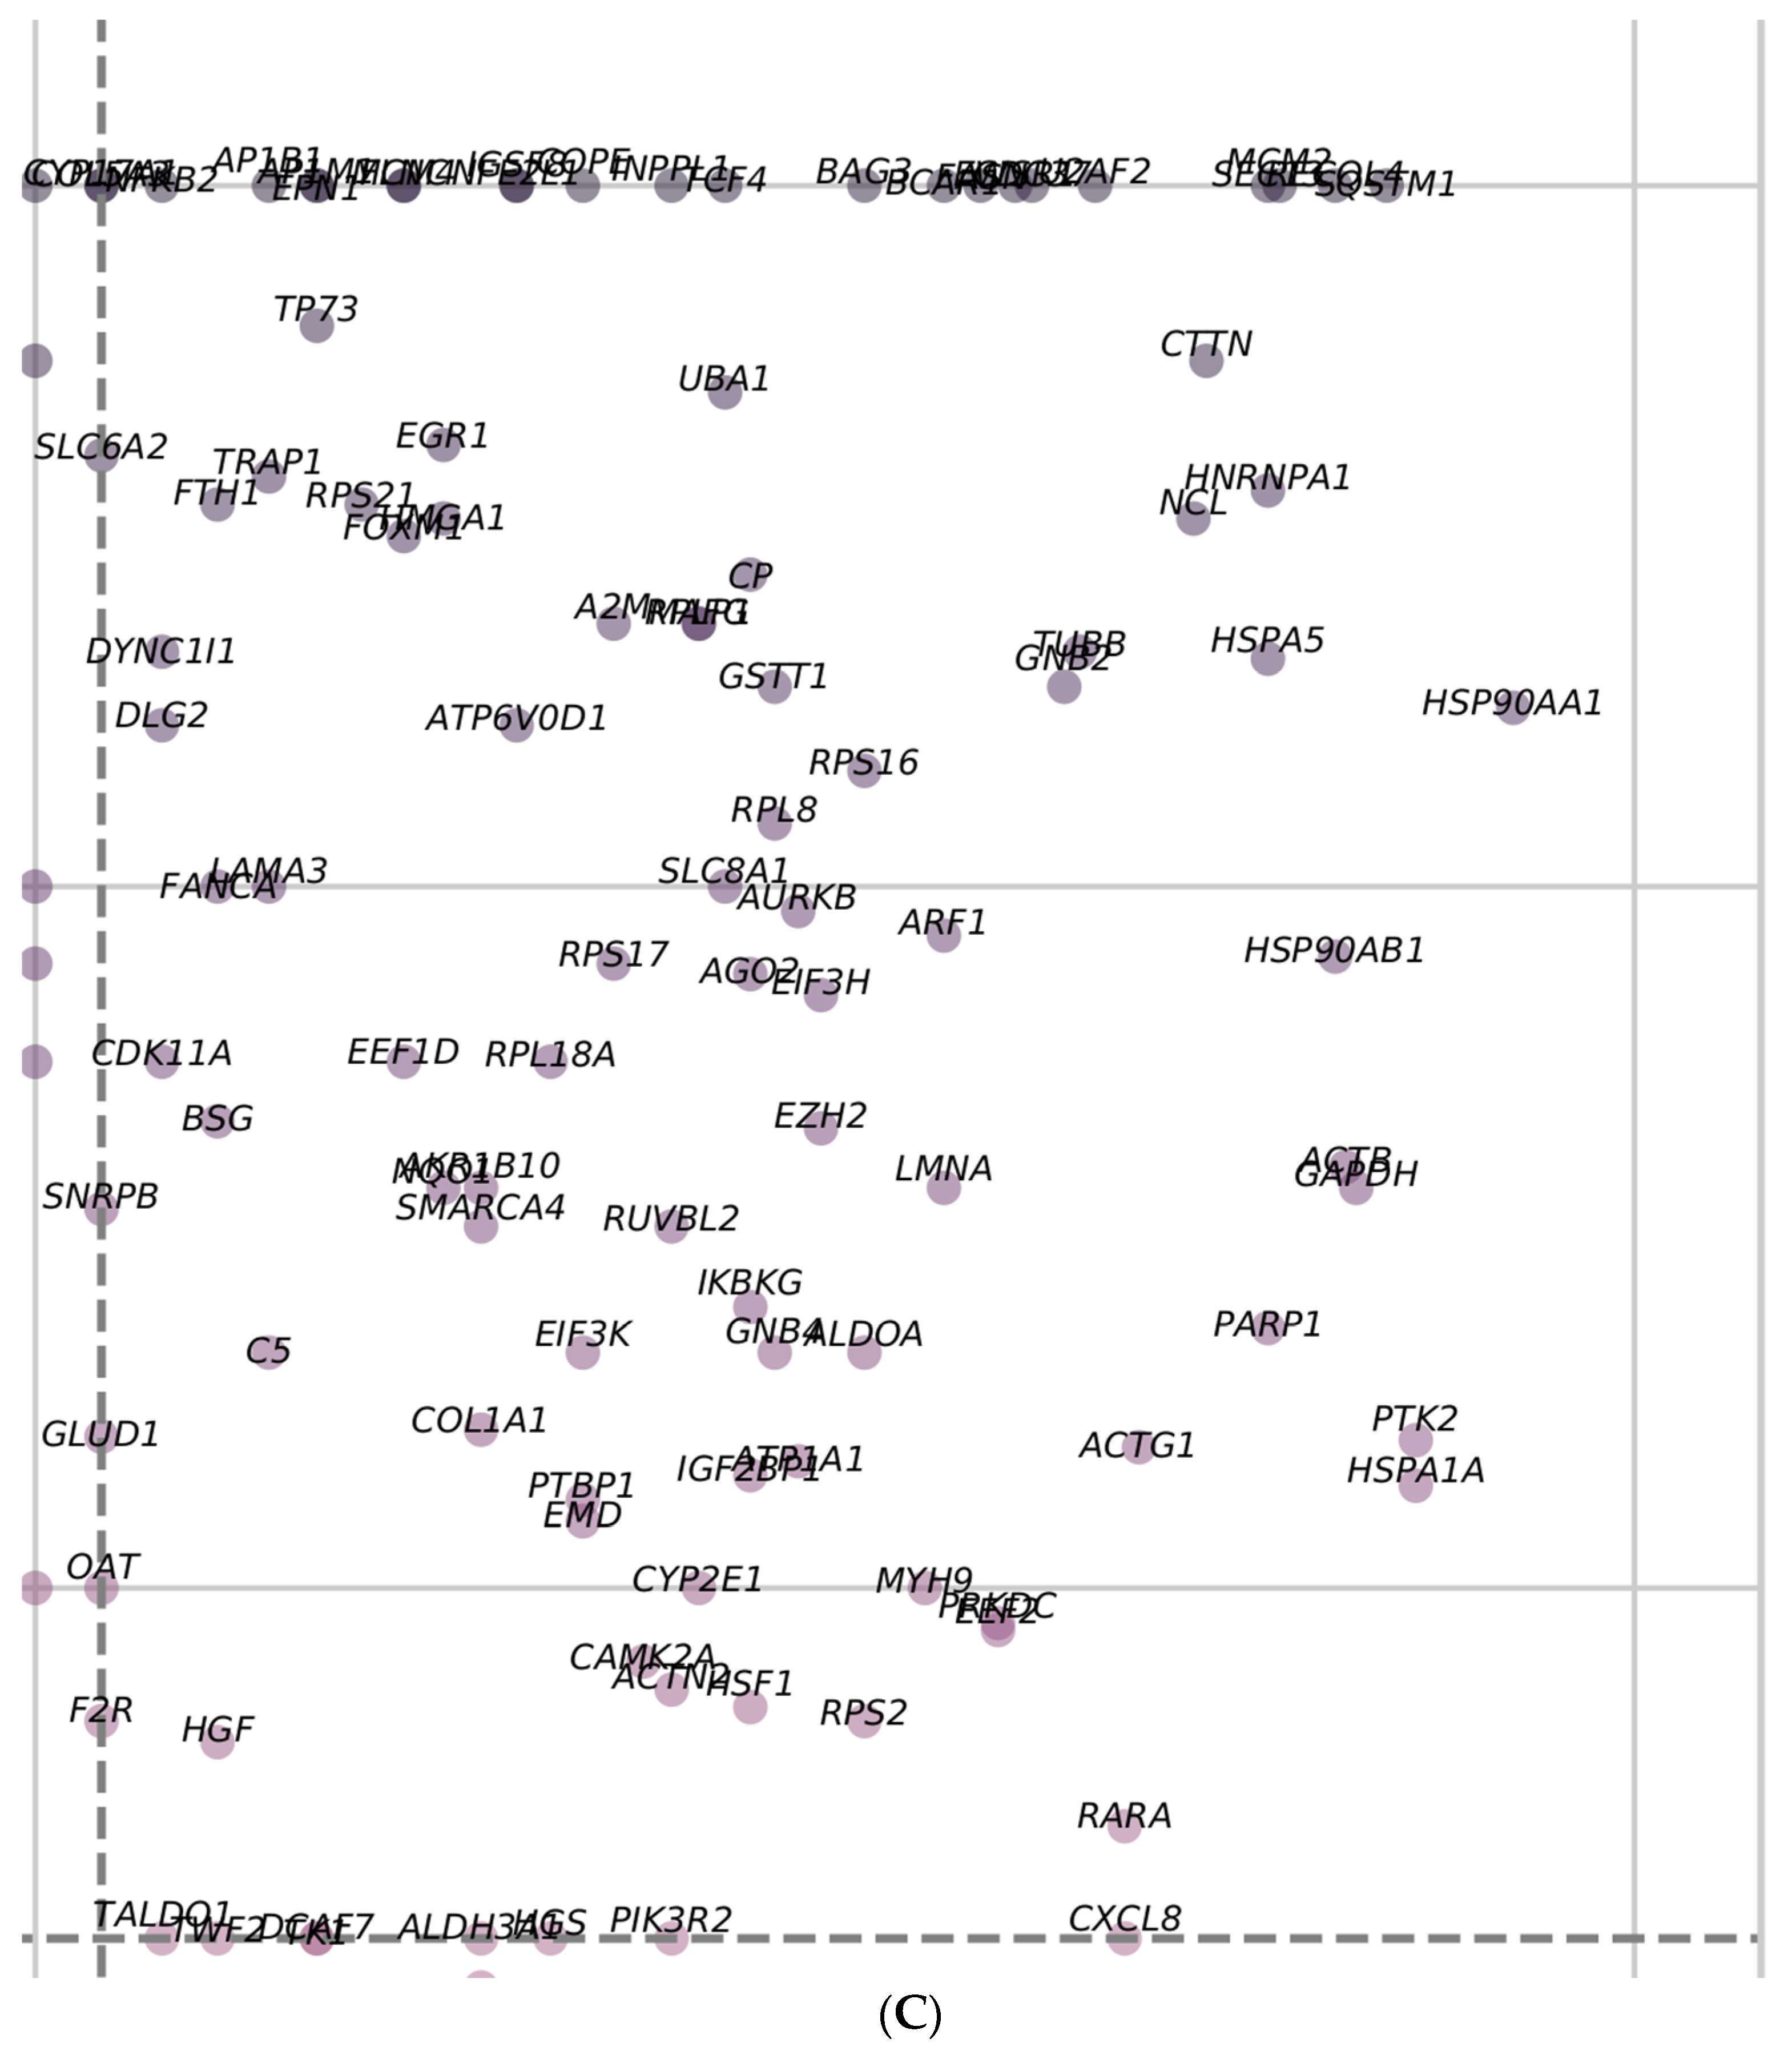
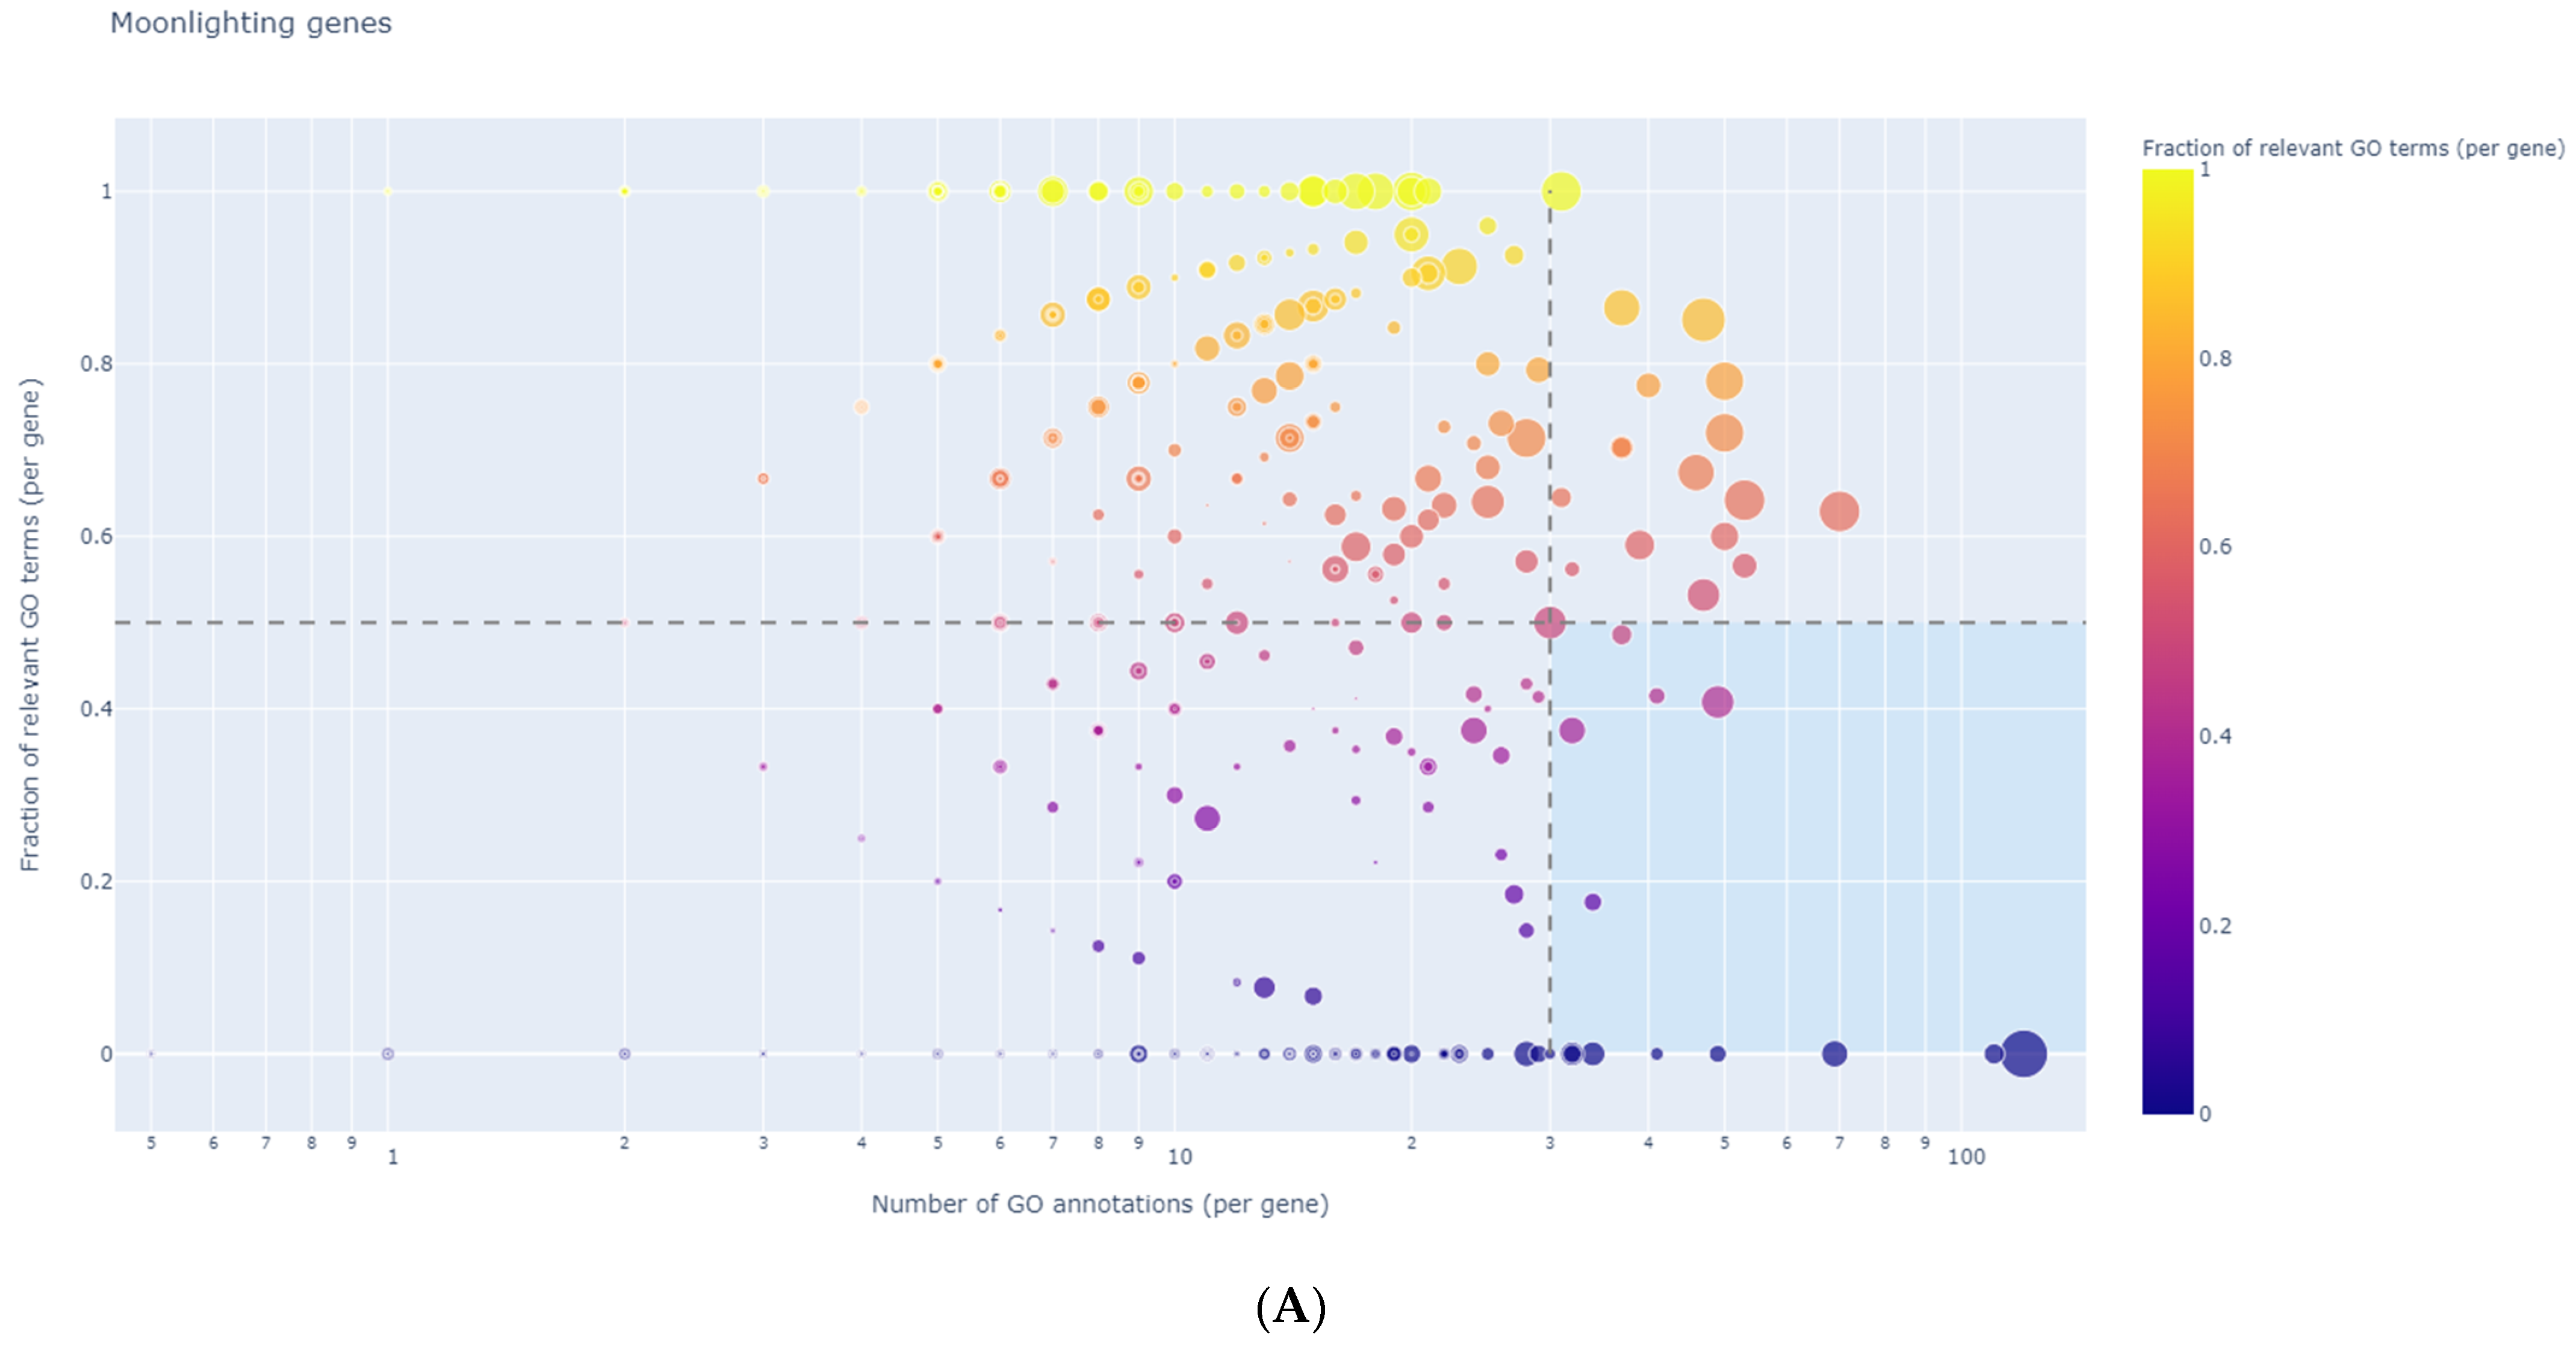
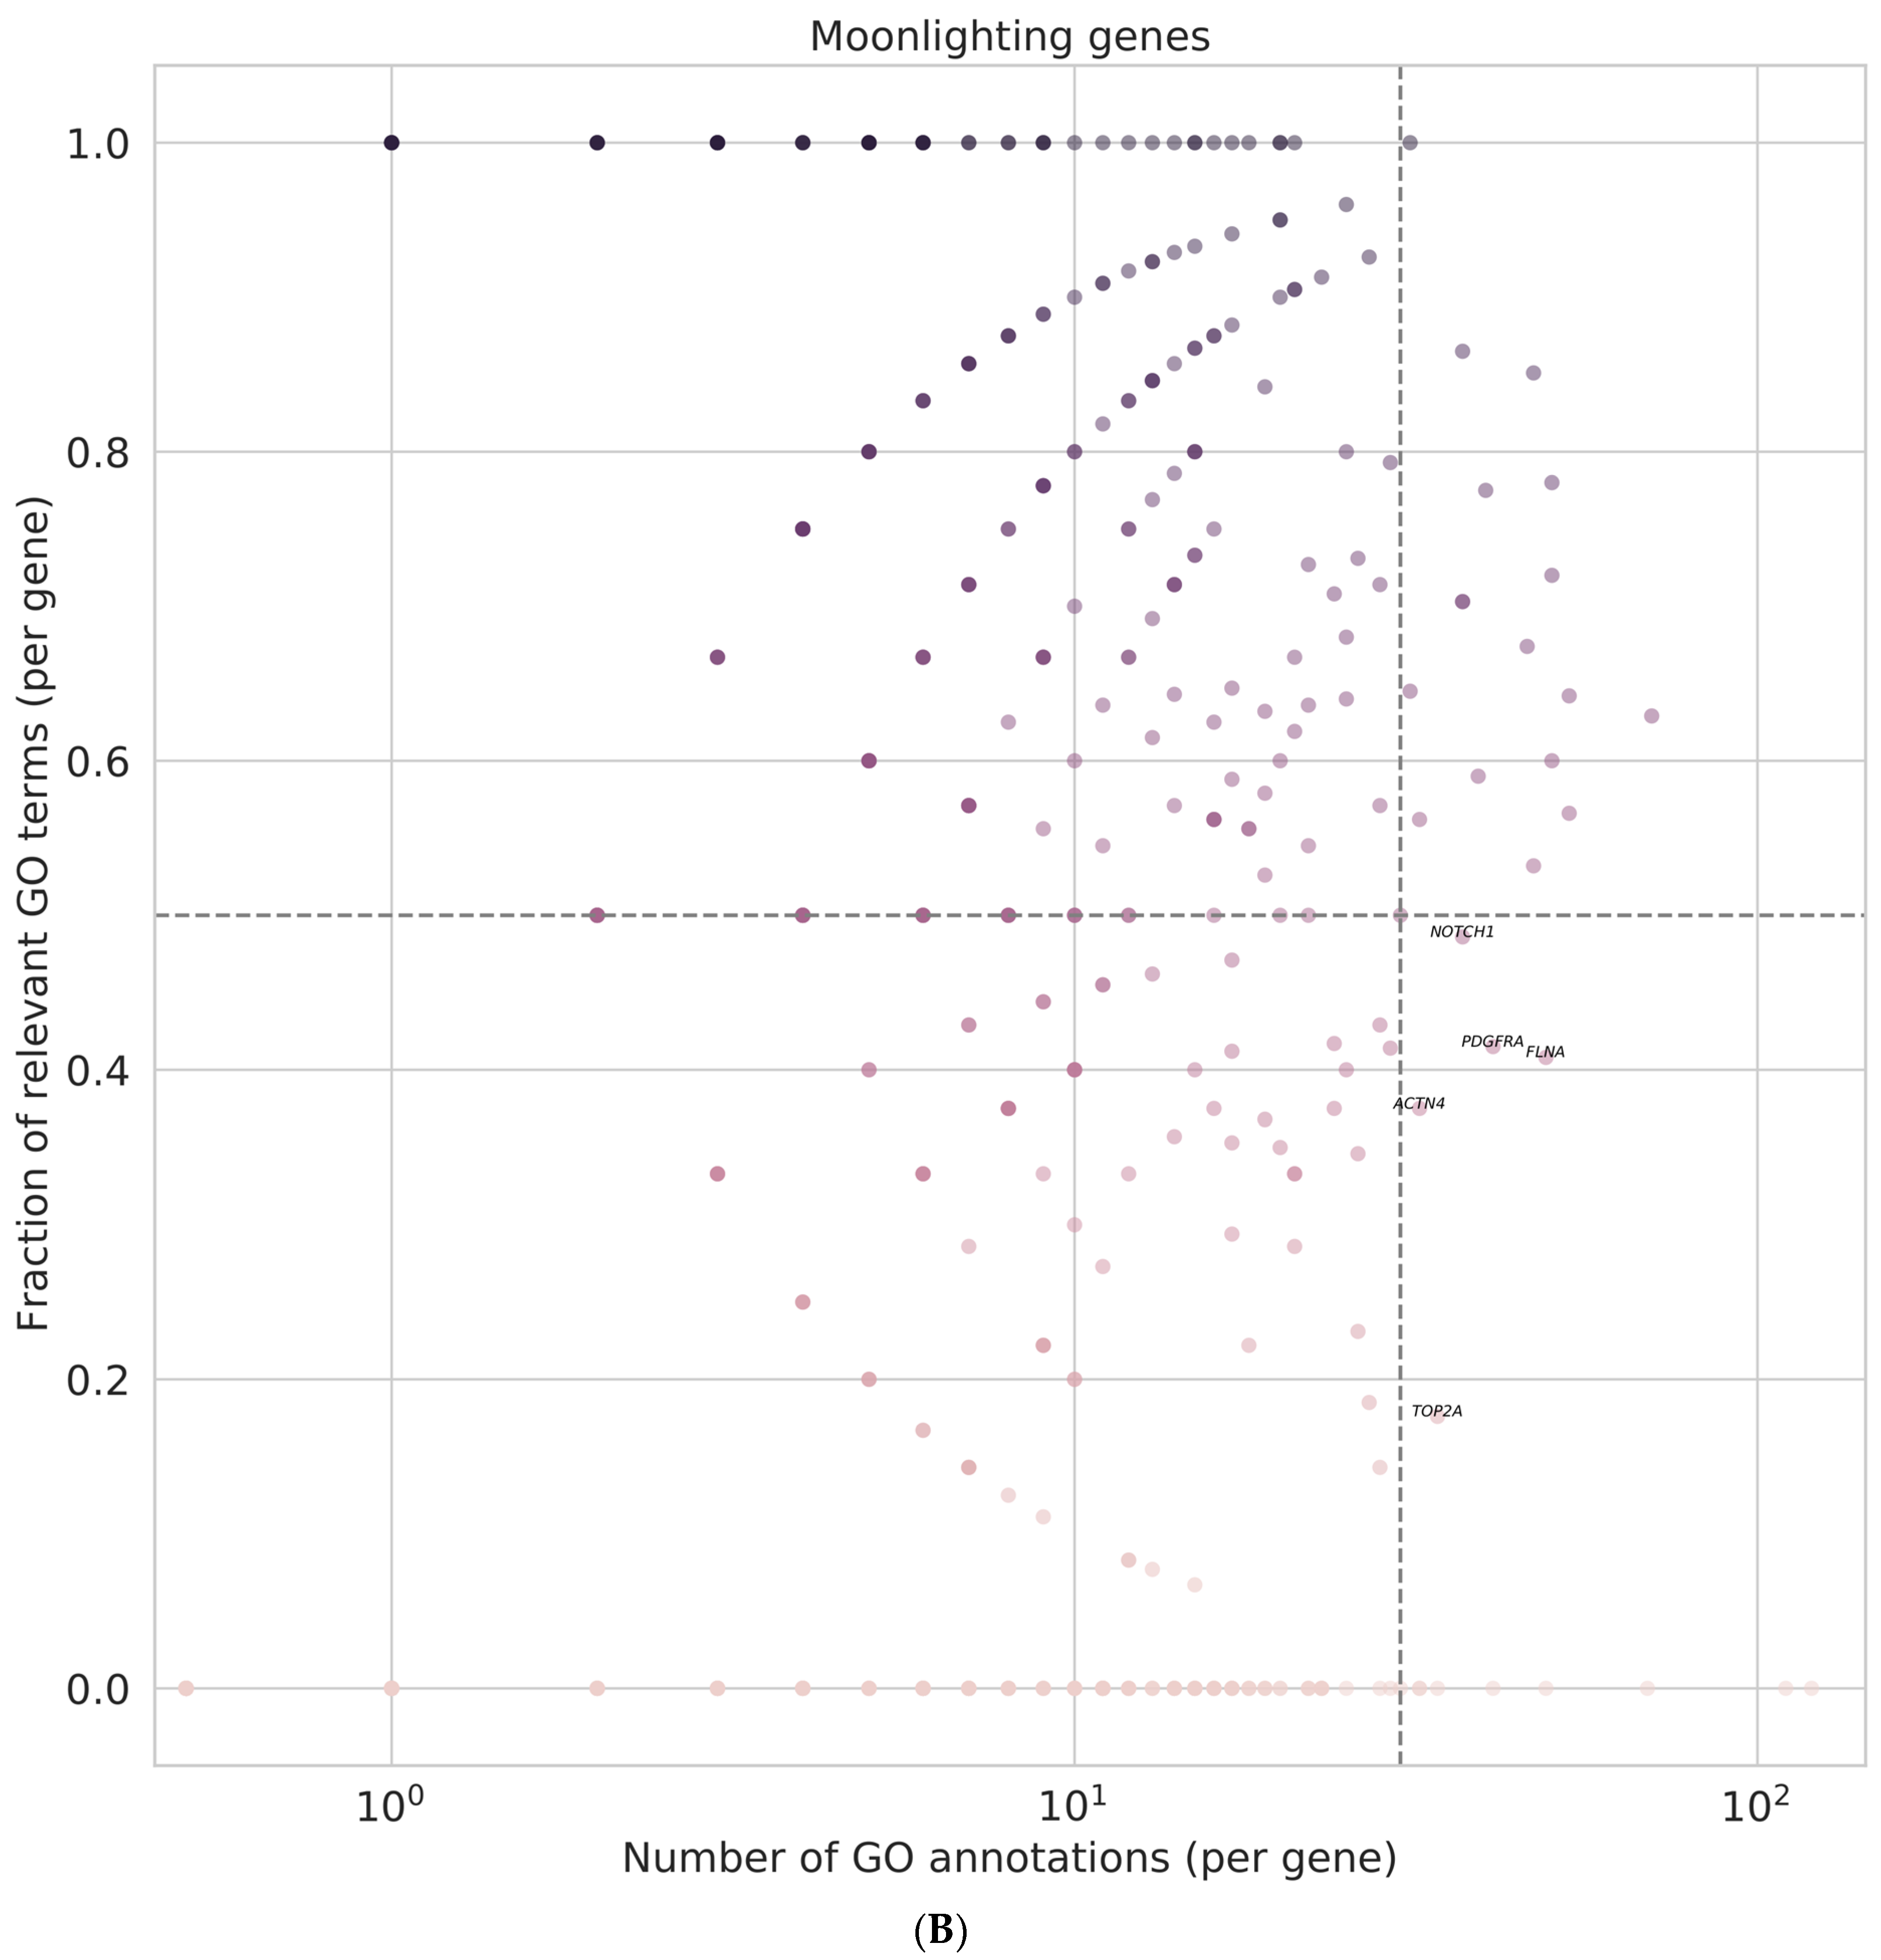
3.8. Identification of Regulator Genes, Hub Genes, and Moonlighting Genes
3.8.1. Non-Viral Group HUB Genes and Proteins
- HSF1 (Heat Shock Transcription Factor 1). In vertebrates, the prototype of heat shock transcription factor is HSF1, which mediates the induction of heat shock gene expression in response to environmental stress [73].
- HSPB1/HSP27 is a stress-inducible chaperone which belongs to the small heat shock protein family [79]. HSPB1 has multiple functions and regulates many cellular processes, such as cytoskeleton organization, maintenance of cellular proteostasis, inhibition of apoptosis, modulation of autophagy induction of resistance to anticancer drugs, etc. [80,81,82]. Numerous studies have revealed that HSPB1 promotes tumorigenesis [66,83,84] and is dysregulated in different malignancies. HSPB1 is upregulated in HCC, and it was identified as a hub gene [85]. The overexpression of HSPB1 was associated with a worse prognosis in HCC patients and it was considered a possible target of immunotherapy in HCC [86].
- HSP90AA1: The heat shock protein 90 (HSP90) family perform a large number of cellular regulatory functions in normal and pathological processes. In vertebrates, the two major paralog isoforms are HSP90AA1 and HSPAB1 [87].
- HSPA1A gene codes for molecular chaperons proteins, belonging to the HSP70 Heat Shock Protein Family A. HSPA1A is a major stress-induced member, having crucial roles in protein homeostasis and cell survival [93].
- HSPA5 (GRP78, BiP) is a chaperone protein constitutively expressed in the endoplasmatic reticulum (ER); GRP78 maintains normal ER functions and is the principal regulator of cellular response to ER stress [101,102]. A series of studies have demonstrated that GRP78/HSPA5 is anti-apoptotic and has a critical cytoprotective role in oncogenesis (protects tumor cells from ER stress) [103].
- ALDO A (Aldolase A) is an important member of the glucose metabolism enzyme family. Glucose metabolism dysfunction is one of the most important characteristics of cancers. High expression of ALDOA is associated with the initiation and progression of many cancers. ALDOA contributes to moonlighting functions; under hypoxia, ALDO A regulates cell proliferation, invasion, and apoptosis, being an essential driver in HCC [110,111].
- GAPDH (Glyceraldehyde-3-phosphate dehydrogenase) is an essential regulator of glycolysis overexpressed in numerous cancers, including HCC, and enabling tumor progression. GAPDH is functionally active in the nucleus, cytoplasm, and plasma membrane and also carries out numerous, non-glycolytic ‘‘moonlighting’’ functions. Glycolytic enzymes have gained increasing attention as potential anticancer therapeutic targets.
- CTTN (Cortactin) is an important actin-binding and assembly protein involved in cytoskeletal regulation. It is found at sites of dynamic actin assembly, in cellular protrusions, such as invadopodia, and is associated with cell motility and invasion. CTTN enhances cell migration, invasion, and tumor cell metastasis and is overexpressed in many cancers, including HCC [112,113].
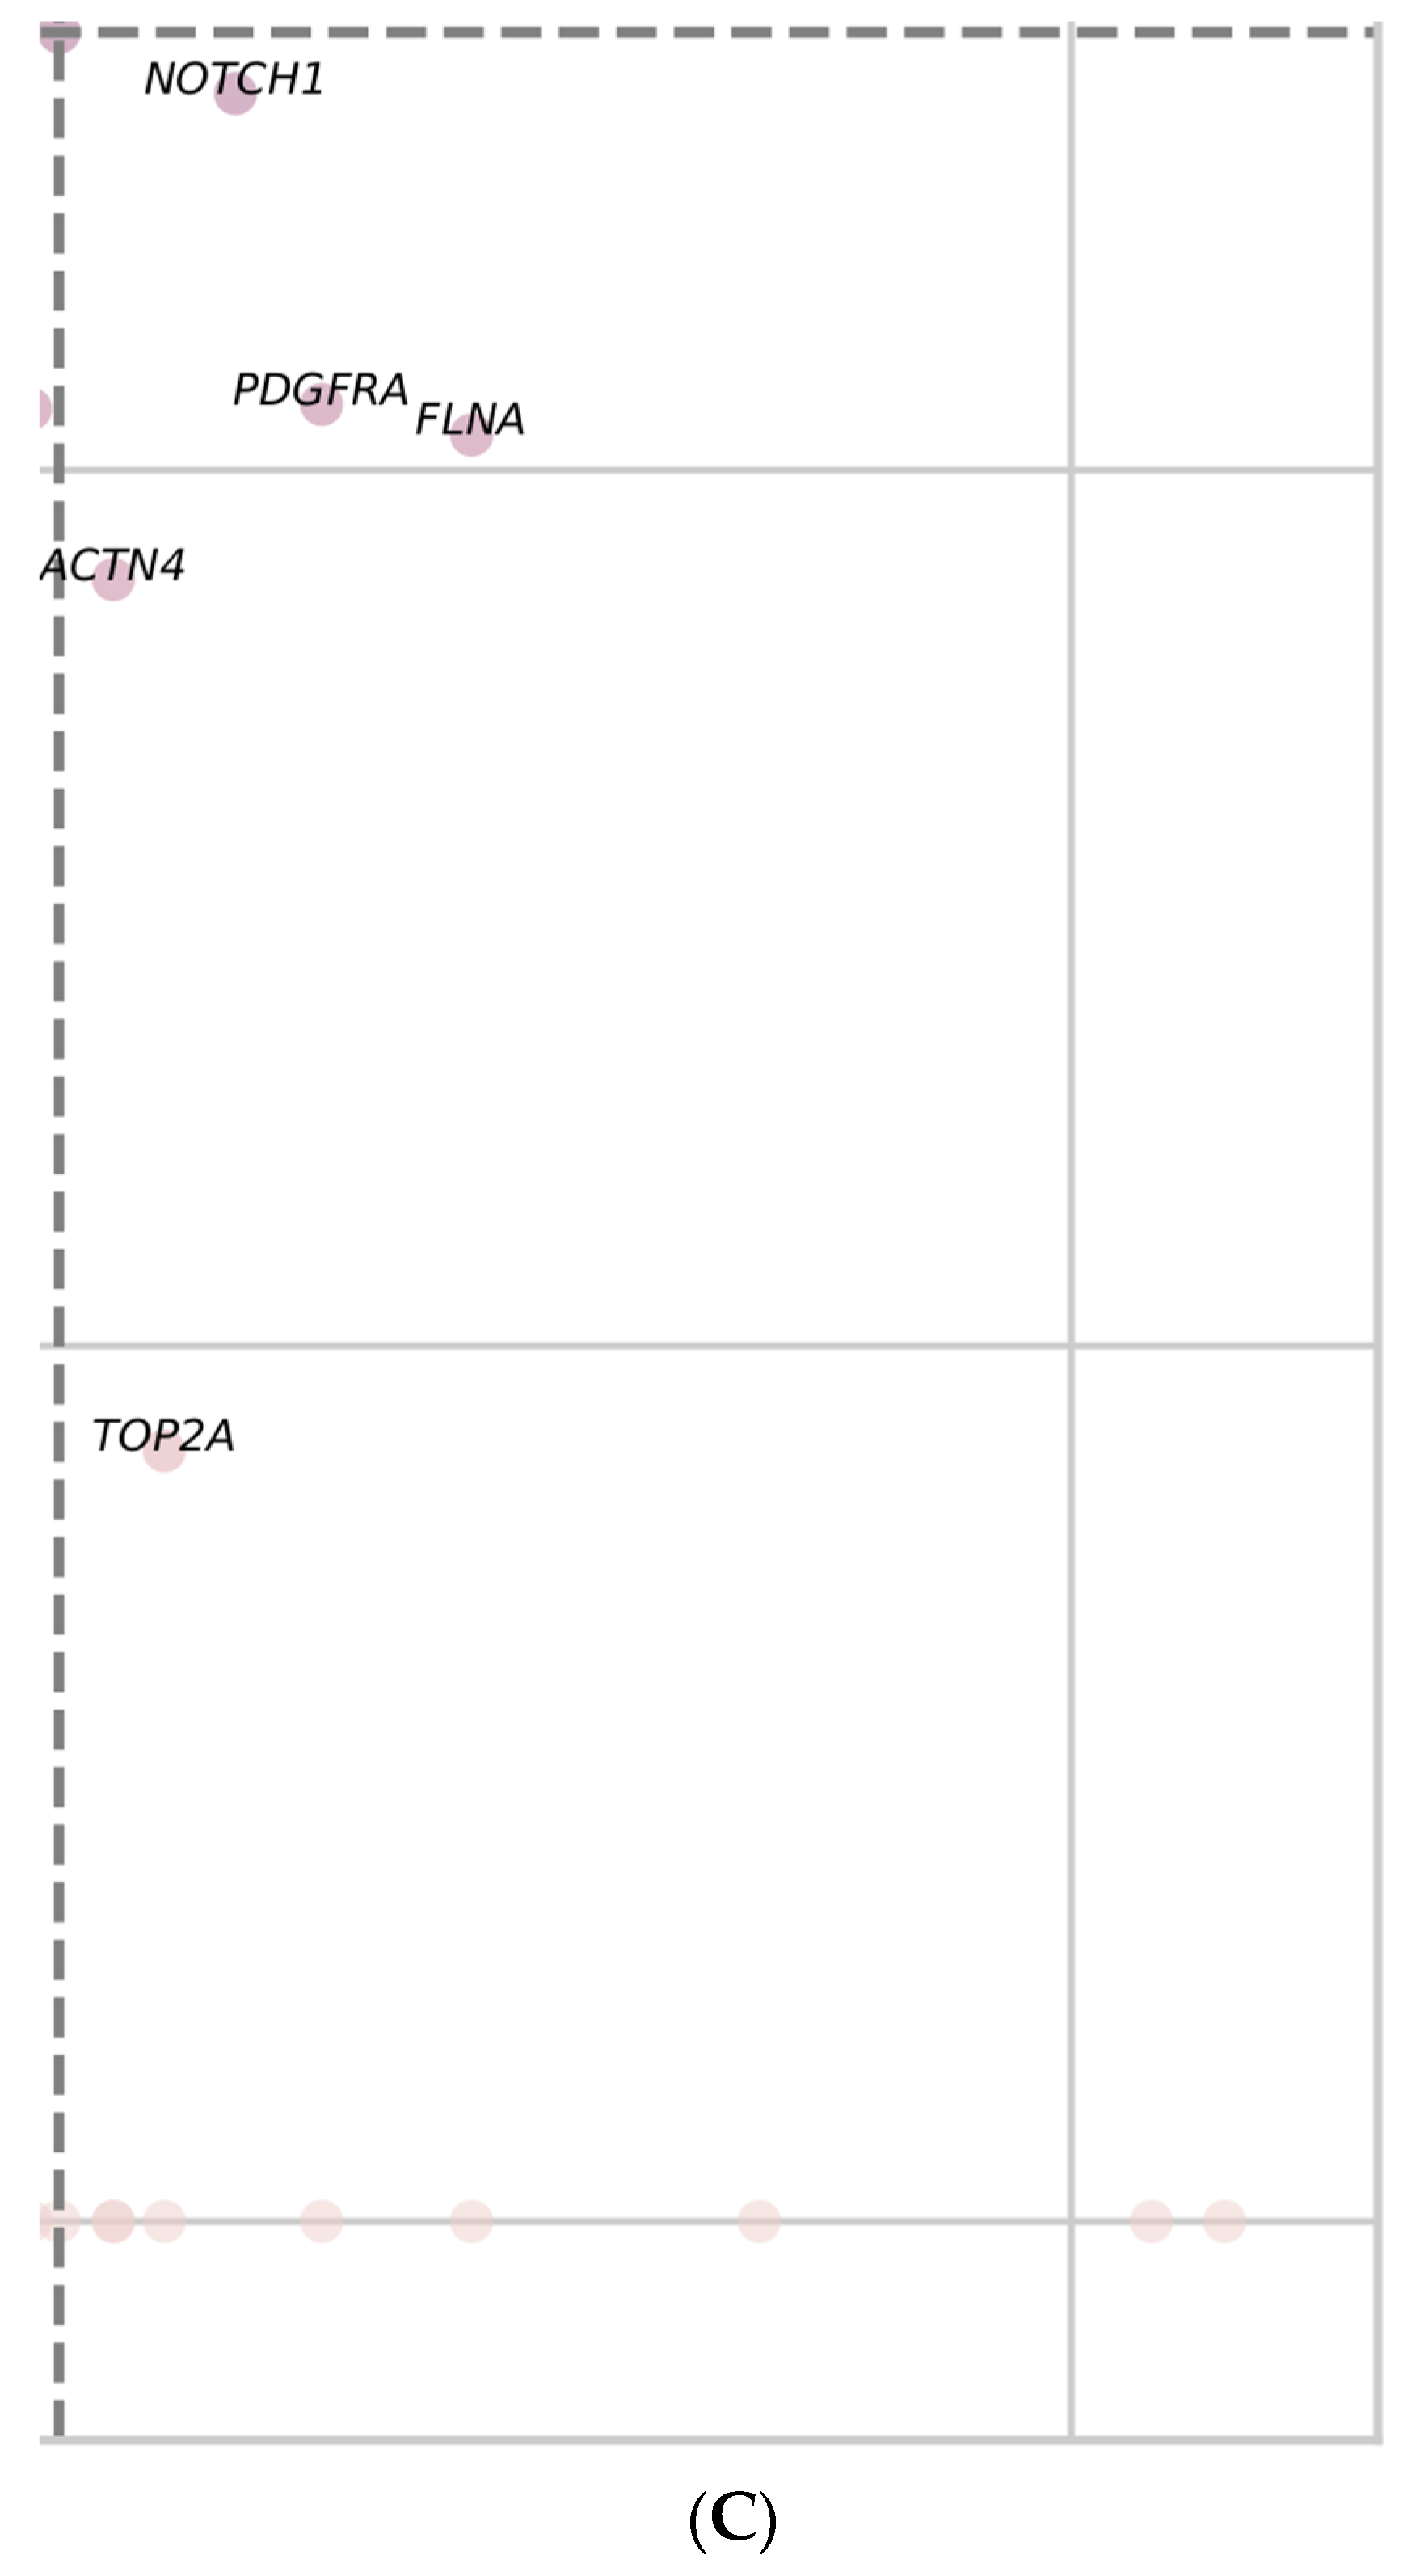
3.8.2. HCV Group HUB Genes and Proteins
- ACTN2-Alpha actinin is an actin-binding cytoskeletal protein. The alpha actinin isoform, which is concentrated in the cytoplasm, is thought to be involved in metastatic processes.
- ANXA 2-Annexin A2 belongs to a protein family (annexins) whose members bind anionic phospholipids in a calcium-dependent manner and have the ability to aggregate membranes.
- AURKA (Aurora Kinase A) is a serine/threonine kinase that plays essential roles in regulating cell division during mitosis. Abnormal activity of AURKA promotes tumorigenic progression [119] and is highly expressed in various cancers, including HCC [120]. It might be a reliable predictor of early-stage HCC, a crucial biomarker for HCC development, and a reliable target for cancer therapy [121,122,123].
- AURKB (Aurora Kinase B) is a serine/threonine fundamental kinase (as is AURKA) involved in the regulation of cell mitosis, especially in chromosomal segregation [124]. The dysregulation of aurora kinase genes has been reported in many cancers. The expression of AURKB was found to be higher in HCC than in a control and was consistently correlated with patient tumor stage [125].
- BRCA1 (BRCA1 DNA Repair Associated) encodes a nuclear phosphoprotein that plays an important role in the correct repair of damaged DNA and maintaining genomic stability. BRCA1 is overexpressed in many type of cancers, including HCC, where its expression correlates with immune cell infiltration [125,126].
- CCNB1 (Cyclin B1) belongs to the cyclin family. Eukaryotic cell-cycle progression is regulated by cyclin-dependent kinases (Cdks) and their regulatory cyclin subunits. Cyclin/Cdk complexes activate transcription, enable DNA replication, and catalyze mitosis [127,128]. Overexpression of CCNB1 can promote proliferation in human HCC cells and was identified as a hub gene in HCC in others studies as well [129].
- CDK1 (Cyclin Dependent Kinase 1) is a member of the serine/threonine protein kinase family and has a crucial role in cell proliferation initiating mitosis [127,128]. Overexpression of CDK1 has been observed in different type cancers, including hepatocellular carcinoma [130,131], where it is correlated with poor OS. Moreover, expression levels of CDK1, CCNB1, and CCNB2 were positively correlated with infiltrating levels of CD4+ T cells, CD8+ T cells, neutrophils, macrophages, and dendritic cells in HCC [132,133]. Other studies also identified CDK1 and CCNB1 as Hub genes for HCC [129].
- CYP3A4 (Cytochrome P450 Family 3 Subfamily A Member 4) codes for an important mono-oxygenase, metabolizing xenobiotics (drugs, toxins, etc.) to eliminate them from the body [134]. The enzyme is predominantly found in the liver but also in the intestines. Dowregulation of Cyp3A4 in HCC was associated with poor prognosis [135].
- CYP1A2 (Cytochrome P450 family 1 Subfamily A Member 2) is the major hepatic isoform of the human CYP1A subfamily. It is involved in the clearance mechanisms for important drugs (tizanidine, theophylline, clozapine, caffeine, etc.) and participates in the biotransformation processes of different procarcinogens. CYP1A2 is markedly decreased in primary HCC tumors and is an independent predictor for post-surgical recurrence in early-stage HCC patients [136,137].
- EGF (Epidermal Growth Factor) is a growth factor secreted by tumors and inflammatory cells in the tumor microenvironment. EGF binds to a transmembrane glycoprotein, its receptor EGFR (epidermal growth factor receptor), and activates/triggers regulatory signal transduction pathways of proliferation, differentiation, survival, and migration.
- TERT (Telomerase reverse transcriptase) is the catalytic subunit of telomerase. In early stages of cancer, because of the increased cell proliferation, telomeres are shortened, but with tumor progression telomerase is reactivated and the capacity for infinite cell division (immortalization) is gained [140]. TERT upregulation is a critical event in hepatocarcinogenesis. It has been shown that TERT expression increases in hepatocyte cultures after overexpression of HCV core protein as compared to normal human liver and uninfected cells [141]. The HCV core protein is a transcriptional activator of a number of host genes [142] and it has been suggested that it interferes with telomerase expression and might be essential for malignancy [141].
- TOP2A (DNA Topoisomerase II Alpha) is a gene that encodes a nuclear enzyme which catalyzes the transient breaking and rejoining of two strands of duplex DNA (which allows the strands to pass through one another). It is involved in processes that occur during DNA transcription and replication, such as relief of torsional stress, chromosome condensation, and chromatid separation [143]. TOP2A is involved in many cancers, being a prognostic biomarker and potential therapeutic target for bladder cancer, lung adenocarcinoma, prostate cancer, colon cancer, breast cancer, and HCC [144,145].
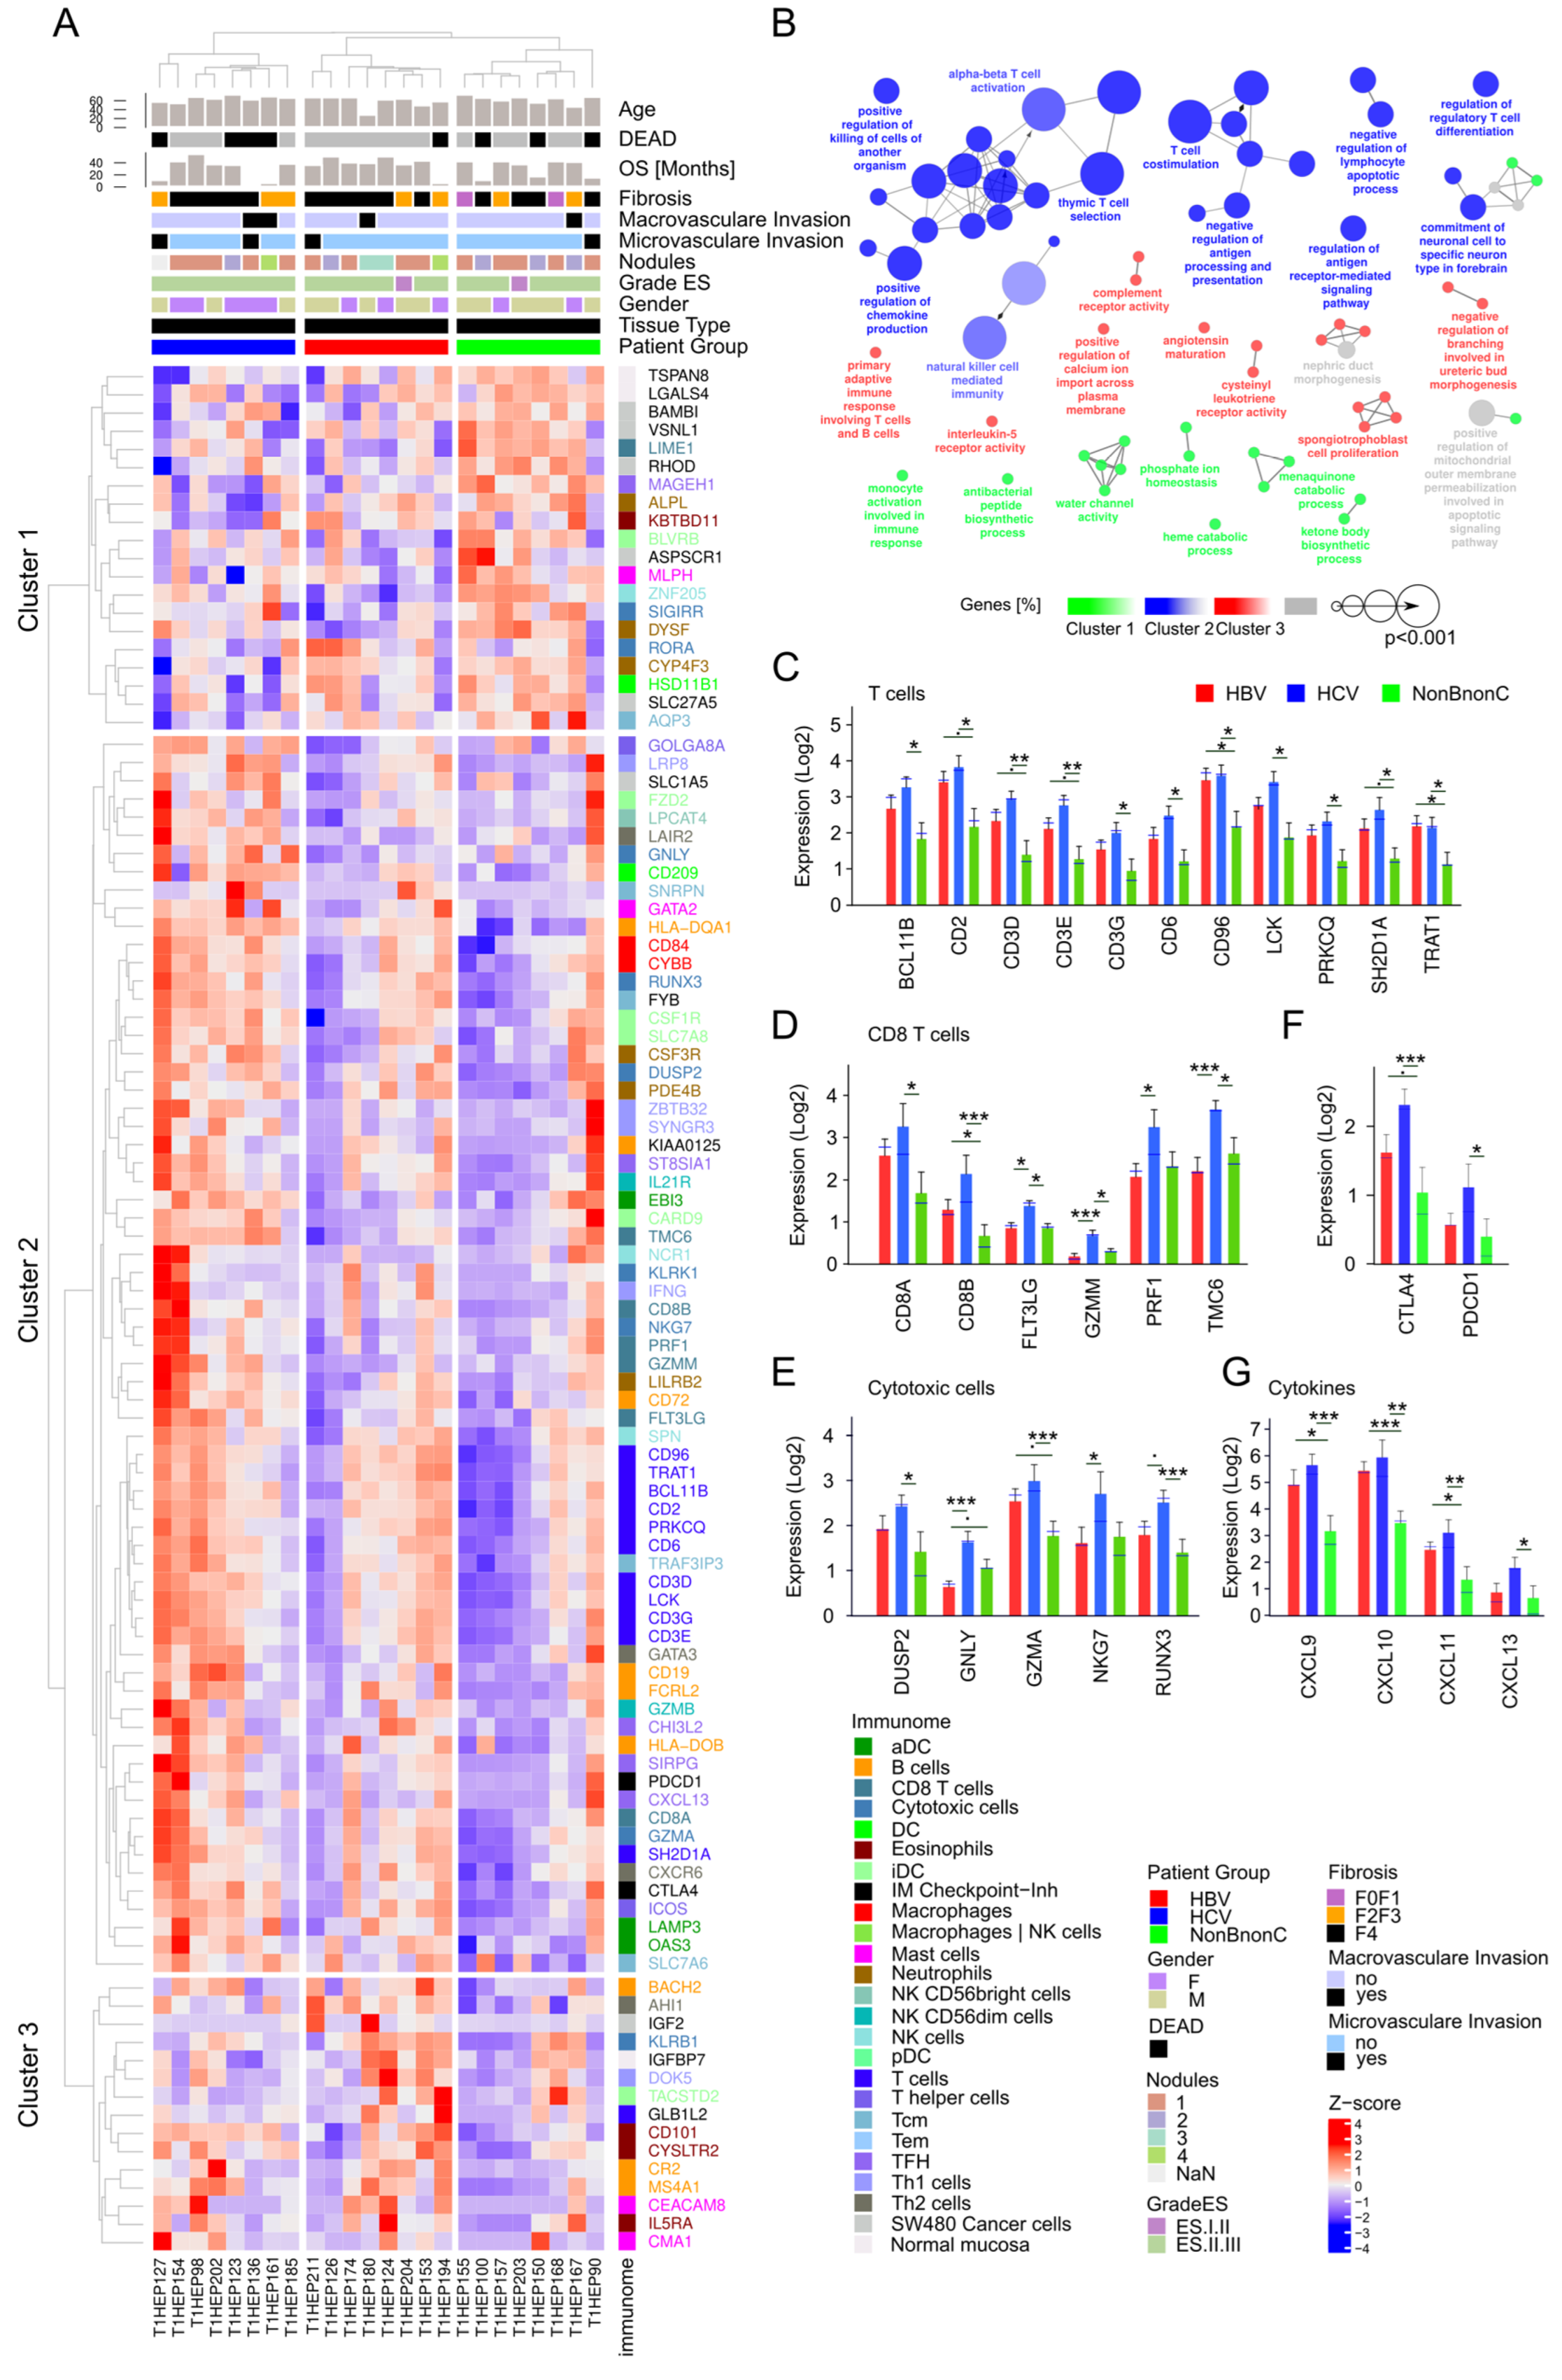
3.9. Analysis of Tumor Immune Infiltrate
4. Discussion
5. Conclusions
Supplementary Materials
Author Contributions
Funding
Institutional Review Board Statement
Informed Consent Statement
Data Availability Statement
Acknowledgments
Conflicts of Interest
References
- Globocan. Available online: https://gco.iarc.fr/today (accessed on 1 May 2021).
- McGlynn, K.A.; Petrick, J.L.; El-Serag, H.B. Epidemiology of Hepatocellular Carcinoma. Hepatology 2021, 73 (Suppl. 1), 4–13. [Google Scholar] [CrossRef] [PubMed]
- Llovet, J.M.; Ricci, S.; Mazzaferro, V.; Hilgard, P.; Gane, E.; Blanc, J.F.; de Oliveira, A.C.; Santoro, A.; Raoul, J.L.; Forner, A.; et al. Sorafenib in advanced hepatocellular carcinoma. N. Engl. J. Med. 2008, 359, 378–390. [Google Scholar] [CrossRef] [PubMed] [Green Version]
- Bruix, J.; Qin, S.; Merle, P.; Granito, A.; Huang, Y.H.; Bodoky, G.; Pracht, M.; Yokosuka, O.; Rosmorduc, O.; Breder, V.; et al. Regorafenib for patients with hepatocellular carcinoma who progressed on sorafenib treatment (RESORCE): A randomised, double-blind, placebo-controlled, phase 3 trial. Lancet 2017, 389, 56–66. [Google Scholar] [CrossRef] [PubMed] [Green Version]
- Zhu, A.X.; Park, J.O.; Ryoo, B.Y.; Yen, C.J.; Poon, R.; Pastorelli, D.; Blanc, J.F.; Chung, H.C.; Baron, A.D.; Pfiffer, T.E.; et al. Ramucirumab versus placebo as second-line treatment in patients with advanced hepatocellular carcinoma following first-line therapy with sorafenib (REACH): A randomised, double-blind, multicentre, phase 3 trial. Lancet Oncol. 2015, 16, 859–870. [Google Scholar] [CrossRef] [PubMed]
- Forner, A.; Llovet, J.M.; Bruix, J. Hepatocellular carcinoma. Lancet 2012, 379, 1245–1255. [Google Scholar] [CrossRef]
- Schulze, K.; Imbeaud, S.; Letouze, E.; Alexandrov, L.B.; Calderaro, J.; Rebouissou, S.; Couchy, G.; Meiller, C.; Shinde, J.; Soysouvanh, F.; et al. Exome sequencing of hepatocellular carcinomas identifies new mutational signatures and potential therapeutic targets. Nat. Genet. 2015, 47, 505–511. [Google Scholar] [CrossRef] [Green Version]
- Shen, C.; Zhao, C.Y.; Zhang, R.; Qiao, L. Obesity-related hepatocellular carcinoma: Roles of risk factors altered in obesity. Front. Biosci. 2012, 17, 2356–2370. [Google Scholar] [CrossRef] [Green Version]
- Yang, J.D.; Roberts, L.R. Hepatocellular carcinoma: A global view. Nat. Rev. Gastroenterol. Hepatol. 2010, 7, 448–458. [Google Scholar] [CrossRef] [Green Version]
- Singh, A.K.; Kumar, R.; Pandey, A.K. Hepatocellular Carcinoma: Causes, Mechanism of Progression and Biomarkers. Curr. Chem. Genom. Transl. Med. 2018, 12, 9–26. [Google Scholar] [CrossRef]
- Li, L.; Wang, H. Heterogeneity of liver cancer and personalized therapy. Cancer Lett. 2016, 379, 191–197. [Google Scholar] [CrossRef]
- McGlynn, K.A.; Petrick, J.L.; London, W.T. Global epidemiology of hepatocellular carcinoma: An emphasis on demographic and regional variability. Clin. Liver Dis. 2015, 19, 223–238. [Google Scholar] [CrossRef] [PubMed] [Green Version]
- Llovet, J.M.; Kelley, R.K.; Villanueva, A.; Singal, A.G.; Pikarsky, E.; Roayaie, S.; Lencioni, R.; Koike, K.; Zucman-Rossi, J.; Finn, R.S. Hepatocellular carcinoma. Nat. Rev. Dis. Prim. 2021, 7, 6. [Google Scholar] [CrossRef] [PubMed]
- Hino, O.; Kajino, K.; Umeda, T.; Arakawa, Y. Understanding the hypercarcinogenic state in chronic hepatitis: A clue to the prevention of human hepatocellular carcinoma. J. Gastroenterol. 2002, 37, 883–887. [Google Scholar] [CrossRef]
- Fattovich, G.; Stroffolini, T.; Zagni, I.; Donato, F. Hepatocellular carcinoma in cirrhosis: Incidence and risk factors. Gastroenterology 2004, 127, S35–S50. [Google Scholar] [CrossRef] [PubMed]
- El-Serag, H.B.; Rudolph, K.L. Hepatocellular carcinoma: Epidemiology and molecular carcinogenesis. Gastroenterology 2007, 132, 2557–2576. [Google Scholar] [CrossRef] [PubMed]
- Guerrieri, F.; Belloni, L.; Pediconi, N.; Levrero, M. Molecular mechanisms of HBV-associated hepatocarcinogenesis. Semin. Liver Dis. 2013, 33, 147–156. [Google Scholar] [CrossRef]
- Zamor, P.J.; deLemos, A.S.; Russo, M.W. Viral hepatitis and hepatocellular carcinoma: Etiology and management. J. Gastrointest. Oncol. 2017, 8, 229–242. [Google Scholar] [CrossRef] [Green Version]
- Villanueva, A. Hepatocellular Carcinoma. N. Engl. J. Med. 2019, 380, 1450–1462. [Google Scholar] [CrossRef] [Green Version]
- Thomas, M.B.; Zhu, A.X. Hepatocellular carcinoma: The need for progress. J. Clin. Oncol. 2005, 23, 2892–2899. [Google Scholar] [CrossRef]
- Balogh, J.; Victor, D., 3rd; Asham, E.H.; Burroughs, S.G.; Boktour, M.; Saharia, A.; Li, X.; Ghobrial, R.M.; Monsour, H.P., Jr. Hepatocellular carcinoma: A review. J. Hepatocell. Carcinoma 2016, 3, 41–53. [Google Scholar] [CrossRef]
- Barcena-Varela, M.; Lujambio, A. The Endless Sources of Hepatocellular Carcinoma Heterogeneity. Cancers 2021, 13, 2621. [Google Scholar] [CrossRef] [PubMed]
- Trapnell, C.; Roberts, A.; Goff, L.; Pertea, G.; Kim, D.; Kelley, D.R.; Pimentel, H.; Salzberg, S.L.; Rinn, J.L.; Pachter, L. Differential gene and transcript expression analysis of RNA-seq experiments with TopHat and Cufflinks. Nat. Protoc. 2012, 7, 562–578. [Google Scholar] [CrossRef] [PubMed] [Green Version]
- Zhou, Y.; Zhou, B.; Pache, L.; Chang, M.; Khodabakhshi, A.H.; Tanaseichuk, O.; Benner, C.; Chanda, S.K. Metascape provides a biologist-oriented resource for the analysis of systems-level datasets. Nat. Commun. 2019, 10, 1523. [Google Scholar] [CrossRef] [PubMed]
- Ietswaart, R.; Gyori, B.M.; Bachman, J.A.; Sorger, P.K.; Churchman, L.S. GeneWalk identifies relevant gene functions for a biological context using network representation learning. Genome Biol. 2021, 22, 55. [Google Scholar] [CrossRef] [PubMed]
- Szklarczyk, D.; Franceschini, A.; Kuhn, M.; Simonovic, M.; Roth, A.; Minguez, P.; Doerks, T.; Stark, M.; Muller, J.; Bork, P.; et al. The STRING database in 2011: Functional interaction networks of proteins, globally integrated and scored. Nucleic Acids Res. 2011, 39, D561–D568. [Google Scholar] [CrossRef] [PubMed] [Green Version]
- Bindea, G.; Mlecnik, B.; Tosolini, M.; Kirilovsky, A.; Waldner, M.; Obenauf, A.C.; Angell, H.; Fredriksen, T.; Lafontaine, L.; Berger, A.; et al. Spatiotemporal dynamics of intratumoral immune cells reveal the immune landscape in human cancer. Immunity 2013, 39, 782–795. [Google Scholar] [CrossRef] [Green Version]
- Shannon, P.; Markiel, A.; Ozier, O.; Baliga, N.S.; Wang, J.T.; Ramage, D.; Amin, N.; Schwikowski, B.; Ideker, T. Cytoscape: A software environment for integrated models of biomolecular interaction networks. Genome Res. 2003, 13, 2498–2504. [Google Scholar] [CrossRef]
- Bindea, G.; Mlecnik, B.; Hackl, H.; Charoentong, P.; Tosolini, M.; Kirilovsky, A.; Fridman, W.H.; Pages, F.; Trajanoski, Z.; Galon, J. ClueGO: A Cytoscape plug-in to decipher functionally grouped gene ontology and pathway annotation networks. Bioinformatics 2009, 25, 1091–1093. [Google Scholar] [CrossRef] [Green Version]
- Bindea, G.; Galon, J.; Mlecnik, B. CluePedia Cytoscape plugin: Pathway insights using integrated experimental and in silico data. Bioinformatics 2013, 29, 661–663. [Google Scholar] [CrossRef]
- Durinck, S.; Spellman, P.T.; Birney, E.; Huber, W. Mapping identifiers for the integration of genomic datasets with the R/Bioconductor package biomaRt. Nat. Protoc. 2009, 4, 1184–1191. [Google Scholar] [CrossRef]
- Lian, Q.; Wang, S.; Zhang, G.; Wang, D.; Luo, G.; Tang, J.; Chen, L.; Gu, J. HCCDB: A Database of Hepatocellular Carcinoma Expression Atlas. Genom. Proteom. Bioinform. 2018, 16, 269–275. [Google Scholar] [CrossRef] [PubMed]
- Chandrashekar, D.S.; Bashel, B.; Balasubramanya, S.A.H.; Creighton, C.J.; Ponce-Rodriguez, I.; Chakravarthi, B.; Varambally, S. UALCAN: A Portal for Facilitating Tumor Subgroup Gene Expression and Survival Analyses. Neoplasia 2017, 19, 649–658. [Google Scholar] [CrossRef] [PubMed]
- Almeida, L.G.; Sakabe, N.J.; deOliveira, A.R.; Silva, M.C.; Mundstein, A.S.; Cohen, T.; Chen, Y.T.; Chua, R.; Gurung, S.; Gnjatic, S.; et al. CTdatabase: A knowledge-base of high-throughput and curated data on cancer-testis antigens. Nucleic Acids Res. 2009, 37, D816–D819. [Google Scholar] [CrossRef] [Green Version]
- Hu, D.G.; Marri, S.; McKinnon, R.A.; Mackenzie, P.I.; Meech, R. Deregulation of the Genes that Are Involved in Drug Absorption, Distribution, Metabolism, and Excretion in Hepatocellular Carcinoma. J. Pharmacol. Exp. Ther. 2019, 368, 363–381. [Google Scholar] [CrossRef] [Green Version]
- El-Gebali, S.; Bentz, S.; Hediger, M.A.; Anderle, P. Solute carriers (SLCs) in cancer. Mol. Asp. Med. 2013, 34, 719–734. [Google Scholar] [CrossRef]
- Pizzagalli, M.D.; Bensimon, A.; Superti-Furga, G. A guide to plasma membrane solute carrier proteins. FEBS J. 2021, 288, 2784–2835. [Google Scholar] [CrossRef]
- Peng, G.Z.; Ye, Q.F.; Wang, R.; Li, M.X.; Yang, Z.X. Knockdown by shRNA identifies SLC44A5 as a potential therapeutic target in hepatocellular carcinoma. Mol. Med. Rep. 2016, 13, 4845–4852. [Google Scholar] [CrossRef] [PubMed] [Green Version]
- Wang, J.; Wang, W.; Wang, H.; Tuo, B. Physiological and Pathological Functions of SLC26A6. Front. Med. 2020, 7, 618256. [Google Scholar] [CrossRef] [PubMed]
- Zhu, Y.; Huang, Y.; Chen, L.; Guo, L.; Wang, L.; Li, M.; Liang, Y. Up-Regulation of SLC26A6 in Hepatocellular Carcinoma and Its Diagnostic and Prognostic Significance. Crit. Rev. Eukaryot. Gene Expr. 2021, 31, 79–94. [Google Scholar] [CrossRef]
- Li, J.; Li, M.H.; Wang, T.T.; Liu, X.N.; Zhu, X.T.; Dai, Y.Z.; Zhai, K.C.; Liu, Y.D.; Lin, J.L.; Ge, R.L.; et al. SLC38A4 functions as a tumour suppressor in hepatocellular carcinoma through modulating Wnt/beta-catenin/MYC/HMGCS2 axis. Br. J. Cancer 2021, 125, 865–876. [Google Scholar] [CrossRef]
- Ciarimboli, G. Regulation Mechanisms of Expression and Function of Organic Cation Transporter 1. Front. Pharmacol. 2020, 11, 607613. [Google Scholar] [CrossRef] [PubMed]
- Vollmar, J.; Lautem, A.; Closs, E.; Schuppan, D.; Kim, Y.O.; Grimm, D.; Marquardt, J.U.; Fuchs, P.; Straub, B.K.; Schad, A.; et al. Loss of organic cation transporter 3 (Oct3) leads to enhanced proliferation and hepatocarcinogenesis. Oncotarget 2017, 8, 115667–115680. [Google Scholar] [CrossRef] [PubMed] [Green Version]
- Brodeur, C.M.; Thibault, P.; Durand, M.; Perreault, J.P.; Bisaillon, M. Dissecting the expression landscape of cytochromes P450 in hepatocellular carcinoma: Towards novel molecular biomarkers. Genes Cancer 2019, 10, 97–108. [Google Scholar] [CrossRef]
- Li, D.; Yu, T.; Hu, J.; Wu, J.; Feng, S.; Xu, Q.; Zhu, H.; Zhang, X.; Zhang, Y.; Zhou, B.; et al. Downregulation of CYP39A1 Serves as a Novel Biomarker in Hepatocellular Carcinoma with Worse Clinical Outcome. Oxidative Med. Cell. Longev. 2021, 2021, 5175581. [Google Scholar] [CrossRef] [PubMed]
- Miners, J.O.; Birkett, D.J. Cytochrome P4502C9: An enzyme of major importance in human drug metabolism. Br. J. Clin. Pharmacol. 1998, 45, 525–538. [Google Scholar] [CrossRef] [Green Version]
- Wang, X.; Yu, T.; Liao, X.; Yang, C.; Han, C.; Zhu, G.; Huang, K.; Yu, L.; Qin, W.; Su, H.; et al. The prognostic value of CYP2C subfamily genes in hepatocellular carcinoma. Cancer Med. 2018, 7, 966–980. [Google Scholar] [CrossRef]
- Ashida, R.; Okamura, Y.; Ohshima, K.; Kakuda, Y.; Uesaka, K.; Sugiura, T.; Ito, T.; Yamamoto, Y.; Sugino, T.; Urakami, K.; et al. The down-regulation of the CYP2C19 gene is associated with aggressive tumor potential and the poorer recurrence-free survival of hepatocellular carcinoma. Oncotarget 2018, 9, 22058–22068. [Google Scholar] [CrossRef] [Green Version]
- Ashida, R.; Okamura, Y.; Ohshima, K.; Kakuda, Y.; Uesaka, K.; Sugiura, T.; Ito, T.; Yamamoto, Y.; Sugino, T.; Urakami, K.; et al. CYP3A4 Gene Is a Novel Biomarker for Predicting a Poor Prognosis in Hepatocellular Carcinoma. Cancer Genom. Proteom. 2017, 14, 445–453. [Google Scholar] [CrossRef] [Green Version]
- Wang, J.Q.; Wu, Z.X.; Yang, Y.; Teng, Q.X.; Li, Y.D.; Lei, Z.N.; Jani, K.A.; Kaushal, N.; Chen, Z.S. ATP-binding cassette (ABC) transporters in cancer: A review of recent updates. J. Evid. Based Med. 2021, 14, 232–256. [Google Scholar] [CrossRef]
- Zhang, J.; Zhang, X.; Li, J.; Song, Z. Systematic analysis of the ABC transporter family in hepatocellular carcinoma reveals the importance of ABCB6 in regulating ferroptosis. Life Sci. 2020, 257, 118131. [Google Scholar] [CrossRef]
- Qiu, Y.; Li, H.; Xie, J.; Qiao, X.; Wu, J. Identification of ABCC5 Among ATP-Binding Cassette Transporter Family as a New Biomarker for Hepatocellular Carcinoma Based on Bioinformatics Analysis. Int. J. Gen. Med. 2021, 14, 7235–7246. [Google Scholar] [CrossRef] [PubMed]
- Leung, I.C.; Chong, C.C.; Cheung, T.T.; Yeung, P.C.; Ng, K.K.; Lai, P.B.; Chan, S.L.; Chan, A.W.; Tang, P.M.; Cheung, S.T. Genetic variation in ABCB5 associates with risk of hepatocellular carcinoma. J. Cell. Mol. Med. 2020, 24, 10705–10713. [Google Scholar] [CrossRef] [PubMed]
- Fung, S.W.; Cheung, P.F.; Yip, C.W.; Ng, L.W.; Cheung, T.T.; Chong, C.C.; Lee, C.; Lai, P.B.; Chan, A.W.; Tsao, G.S.; et al. The ATP-binding cassette transporter ABCF1 is a hepatic oncofetal protein that promotes chemoresistance, EMT and cancer stemness in hepatocellular carcinoma. Cancer Lett. 2019, 457, 98–109. [Google Scholar] [CrossRef] [PubMed]
- Zhang, Y.P.; Bao, Z.W.; Wu, J.B.; Chen, Y.H.; Chen, J.R.; Xie, H.Y.; Zhou, L.; Wu, J.; Zheng, S.S. Cancer-Testis Gene Expression in Hepatocellular Carcinoma: Identification of Prognostic Markers and Potential Targets for Immunotherapy. Technol. Cancer Res. Treat. 2020, 19, 1533033820944274. [Google Scholar] [CrossRef] [PubMed]
- Noordam, L.; Ge, Z.; Ozturk, H.; Doukas, M.; Mancham, S.; Boor, P.P.C.; Campos Carrascosa, L.; Zhou, G.; van den Bosch, T.P.P.; Pan, Q.; et al. Expression of Cancer Testis Antigens in Tumor-Adjacent Normal Liver Is Associated with Post-Resection Recurrence of Hepatocellular Carcinoma. Cancers 2021, 13, 2499. [Google Scholar] [CrossRef] [PubMed]
- Li, R.; Gong, J.; Xiao, C.; Zhu, S.; Hu, Z.; Liang, J.; Li, X.; Yan, X.; Zhang, X.; Li, D.; et al. A comprehensive analysis of the MAGE family as prognostic and diagnostic markers for hepatocellular carcinoma. Genomics 2020, 112, 5101–5114. [Google Scholar] [CrossRef]
- Han, Q.; Sun, M.L.; Liu, W.S.; Zhao, H.S.; Jiang, L.Y.; Yu, Z.J.; Wei, M.J. Upregulated expression of ACTL8 contributes to invasion and metastasis and indicates poor prognosis in colorectal cancer. Onco Targets Ther. 2019, 12, 1749–1763. [Google Scholar] [CrossRef] [Green Version]
- Li, B.; Zhu, J.; Meng, L. High expression of ACTL8 is poor prognosis and accelerates cell progression in head and neck squamous cell carcinoma. Mol. Med. Rep. 2019, 19, 877–884. [Google Scholar] [CrossRef] [Green Version]
- Ma, S.; Wang, X.; Zhang, Z.; Liu, D. Actin-like protein 8 promotes cell proliferation, colony-formation, proangiogenesis, migration and invasion in lung adenocarcinoma cells. Thorac. Cancer 2020, 11, 526–536. [Google Scholar] [CrossRef]
- Liu, H.; Wen, Q.; Yan, S.; Zeng, W.; Zou, Y.; Liu, Q.; Zhang, G.; Zou, J.; Zou, X. Tumor-Promoting ATAD2 and Its Preclinical Challenges. Biomolecules 2022, 12, 1040. [Google Scholar] [CrossRef]
- Meng, X.; Wang, L.; Zhu, B.; Zhang, J.; Guo, S.; Li, Q.; Zhang, T.; Zheng, Z.; Wu, G.; Zhao, Y. Integrated Bioinformatics Analysis of the Clinical Value and Biological Function of ATAD2 in Hepatocellular Carcinoma. BioMed Res. Int. 2020, 2020, 8657468. [Google Scholar] [CrossRef] [PubMed]
- Morimoto, R.I. Cells in stress: Transcriptional activation of heat shock genes. Science 1993, 259, 1409–1410. [Google Scholar] [CrossRef] [PubMed]
- Bhattacharya, S.R.S. The Science of Hormesis in Health and Longevity; Elsevier: Amsterdam, The Netherlands, 2018. [Google Scholar]
- Paslaru, L.; Rallu, M.; Manuel, M.; Davidson, S.; Morange, M. Cyclosporin A induces an atypical heat shock response. Biochem. Biophys. Res. Commun. 2000, 269, 464–469. [Google Scholar] [CrossRef] [PubMed]
- Calderwood, S.K.; Khaleque, M.A.; Sawyer, D.B.; Ciocca, D.R. Heat shock proteins in cancer: Chaperones of tumorigenesis. Trends Biochem. Sci. 2006, 31, 164–172. [Google Scholar] [CrossRef] [PubMed]
- Syafruddin, S.E.; Ling, S.; Low, T.Y.; Mohtar, M.A. More Than Meets the Eye: Revisiting the Roles of Heat Shock Factor 4 in Health and Diseases. Biomolecules 2021, 11, 523. [Google Scholar] [CrossRef]
- Ma, P.; Tang, W.G.; Hu, J.W.; Hao, Y.; Xiong, L.K.; Wang, M.M.; Liu, H.; Bo, W.H.; Yu, K.H. HSP4 triggers epithelial-mesenchymal transition and promotes motility capacities of hepatocellular carcinoma cells via activating AKT. Liver Int. 2020, 40, 1211–1223. [Google Scholar] [CrossRef]
- Semsey, S.A.S. Brenner’s Encyclopedia of Genetics, 2nd ed.; Elsevier: Amsterdam, The Netherlands, 2013; pp. 119–122. [Google Scholar]
- Jeffery, C.J. Why study moonlighting proteins? Front. Genet. 2015, 6, 211. [Google Scholar] [CrossRef] [Green Version]
- Commichau, F.M.; Stulke, J. Trigger enzymes: Bifunctional proteins active in metabolism and in controlling gene expression. Mol. Microbiol. 2008, 67, 692–702. [Google Scholar] [CrossRef]
- Singh, N.; Bhalla, N. Moonlighting Proteins. Annu. Rev. Genet. 2020, 54, 265–285. [Google Scholar] [CrossRef]
- Pirkkala, L.; Nykanen, P.; Sistonen, L. Roles of the heat shock transcription factors in regulation of the heat shock response and beyond. FASEB J. 2001, 15, 1118–1131. [Google Scholar] [CrossRef]
- Prince, T.L.; Lang, B.J.; Guerrero-Gimenez, M.E.; Fernandez-Munoz, J.M.; Ackerman, A.; Calderwood, S.K. HSF1: Primary Factor in Molecular Chaperone Expression and a Major Contributor to Cancer Morbidity. Cells 2020, 9, 1046. [Google Scholar] [CrossRef] [PubMed]
- Ciocca, D.R.; Arrigo, A.P.; Calderwood, S.K. Heat shock proteins and heat shock factor 1 in carcinogenesis and tumor development: An update. Arch. Toxicol. 2013, 87, 19–48. [Google Scholar] [CrossRef] [PubMed] [Green Version]
- Fang, F.; Chang, R.; Yang, L. Heat shock factor 1 promotes invasion and metastasis of hepatocellular carcinoma in vitro and in vivo. Cancer 2012, 118, 1782–1794. [Google Scholar] [CrossRef] [PubMed]
- Mendillo, M.L.; Santagata, S.; Koeva, M.; Bell, G.W.; Hu, R.; Tamimi, R.M.; Fraenkel, E.; Ince, T.A.; Whitesell, L.; Lindquist, S. HSF1 drives a transcriptional program distinct from heat shock to support highly malignant human cancers. Cell 2012, 150, 549–562. [Google Scholar] [CrossRef] [PubMed] [Green Version]
- Dai, W.; Ye, J.; Zhang, Z.; Yang, L.; Ren, H.; Wu, H.; Chen, J.; Ma, J.; Zhai, E.; Cai, S.; et al. Increased expression of heat shock factor 1 (HSF1) is associated with poor survival in gastric cancer patients. Diagn. Pathol. 2018, 13, 80. [Google Scholar] [CrossRef]
- Kampinga, H.H.; de Boer, R.; Beerstra, N. The Multicolored World of the Human HSPB Family. In The Big Book on Small Heat Shock Proteins; Tanguay, R.M., Hightower, L.E., Eds.; Springer International Publishing: Cham, Switzerland, 2015; pp. 3–26. [Google Scholar]
- Guay, J.; Lambert, H.; Gingras-Breton, G.; Lavoie, J.N.; Huot, J.; Landry, J. Regulation of actin filament dynamics by p38 map kinase-mediated phosphorylation of heat shock protein 27. J. Cell Sci. 1997, 110 Pt 3, 357–368. [Google Scholar] [CrossRef]
- Wang, X.; Chen, M.; Zhou, J.; Zhang, X. HSP27, 70 and 90, anti-apoptotic proteins, in clinical cancer therapy (Review). Int. J. Oncol. 2014, 45, 18–30. [Google Scholar] [CrossRef] [Green Version]
- Matsumoto, T.; Urushido, M.; Ide, H.; Ishihara, M.; Hamada-Ode, K.; Shimamura, Y.; Ogata, K.; Inoue, K.; Taniguchi, Y.; Taguchi, T.; et al. Small Heat Shock Protein Beta-1 (HSPB1) Is Upregulated and Regulates Autophagy and Apoptosis of Renal Tubular Cells in Acute Kidney Injury. PLoS ONE 2015, 10, e0126229. [Google Scholar] [CrossRef] [Green Version]
- Heinrich, J.C.; Donakonda, S.; Haupt, V.J.; Lennig, P.; Zhang, Y.; Schroeder, M. New HSP27 inhibitors efficiently suppress drug resistance development in cancer cells. Oncotarget 2016, 7, 68156–68169. [Google Scholar] [CrossRef] [Green Version]
- Kaigorodova, E.V.; Bogatyuk, M.V. Heat shock proteins as prognostic markers of cancer. Curr. Cancer Drug Targets 2014, 14, 713–726. [Google Scholar] [CrossRef]
- Fei, Z.; Lijuan, Y.; Jing, Z.; Xi, Y.; Yuefen, P.; Shuwen, H. Molecular characteristics associated with ferroptosis in hepatocellular carcinoma progression. Hum. Cell 2021, 34, 177–186. [Google Scholar] [CrossRef] [PubMed]
- Long, S.; Peng, F.; Song, B.; Wang, L.; Chen, J.; Shang, B. Heat Shock Protein Beta 1 is a Prognostic Biomarker and Correlated with Immune Infiltrates in Hepatocellular Carcinoma. Int. J. Gen. Med. 2021, 14, 5483–5492. [Google Scholar] [CrossRef] [PubMed]
- Taipale, M.; Jarosz, D.F.; Lindquist, S. HSP90 at the hub of protein homeostasis: Emerging mechanistic insights. Nat. Rev. Mol. Cell Biol. 2010, 11, 515–528. [Google Scholar] [CrossRef]
- Zuehlke, A.D.; Beebe, K.; Neckers, L.; Prince, T. Regulation and function of the human HSP90AA1 gene. Gene 2015, 570, 8–16. [Google Scholar] [CrossRef] [Green Version]
- Wang, B.; Chen, Z.; Yu, F.; Chen, Q.; Tian, Y.; Ma, S.; Wang, T.; Liu, X. Hsp90 regulates autophagy and plays a role in cancer therapy. Tumor Biol. 2016, 37, 1–6. [Google Scholar] [CrossRef] [PubMed]
- Nouri-Vaskeh, M.; Alizadeh, L.; Hajiasgharzadeh, K.; Mokhtarzadeh, A.; Halimi, M.; Baradaran, B. The role of HSP90 molecular chaperones in hepatocellular carcinoma. J. Cell. Physiol. 2020, 235, 9110–9120. [Google Scholar] [CrossRef]
- Qin, L.; Huang, H.; Huang, J.; Wang, G.; Huang, J.; Wu, X.; Li, J.; Yi, W.; Liu, L.; Huang, D. Biological characteristics of heat shock protein 90 in human liver cancer cells. Am. J. Transl. Res. 2019, 11, 2477–2483. [Google Scholar]
- Cheng, W.; Ainiwaer, A.; Xiao, L.; Cao, Q.; Wu, G.; Yang, Y.; Mao, R.; Bao, Y. Role of the novel HSP90 inhibitor AUY922 in hepatocellular carcinoma: Potential for therapy. Mol. Med. Rep. 2015, 12, 2451–2456. [Google Scholar] [CrossRef] [Green Version]
- Rosenzweig, R.; Nillegoda, N.B.; Mayer, M.P.; Bukau, B. The Hsp70 chaperone network. Nat. Rev. Mol. Cell Biol. 2019, 20, 665–680. [Google Scholar] [CrossRef]
- Garrido, C.; Brunet, M.; Didelot, C.; Zermati, Y.; Schmitt, E.; Kroemer, G. Heat shock proteins 27 and 70: Anti-apoptotic proteins with tumorigenic properties. Cell Cycle 2006, 5, 2592–2601. [Google Scholar] [CrossRef] [Green Version]
- Albakova, Z.; Armeev, G.A.; Kanevskiy, L.M.; Kovalenko, E.I.; Sapozhnikov, A.M. HSP70 Multi-Functionality in Cancer. Cells 2020, 9, 587. [Google Scholar] [CrossRef] [PubMed]
- Wang, B.; Lan, T.; Xiao, H.; Chen, Z.H.; Wei, C.; Chen, L.F.; Guan, J.F.; Yuan, R.F.; Yu, X.; Hu, Z.G.; et al. The expression profiles and prognostic values of HSP70s in hepatocellular carcinoma. Cancer Cell Int. 2021, 21, 286. [Google Scholar] [CrossRef] [PubMed]
- Wu, F.H.; Yuan, Y.; Li, D.; Liao, S.J.; Yan, B.; Wei, J.J.; Zhou, Y.H.; Zhu, J.H.; Zhang, G.M.; Feng, Z.H. Extracellular HSPA1A promotes the growth of hepatocarcinoma by augmenting tumor cell proliferation and apoptosis-resistance. Cancer Lett. 2012, 317, 157–164. [Google Scholar] [CrossRef] [PubMed]
- Jiang, H.; Liang, Z.; Qin, S.; Liu, K. Prognostic Value of Members of the HSP70 Family in Hepatocellular Carcinoma. 2020; preprint. [Google Scholar] [CrossRef]
- Joo, M.; Chi, J.G.; Lee, H. Expressions of HSP70 and HSP27 in hepatocellular carcinoma. J. Korean Med. Sci. 2005, 20, 829–834. [Google Scholar] [CrossRef] [Green Version]
- Xiong, J.; Jiang, X.M.; Mao, S.S.; Yu, X.N.; Huang, X.X. Heat shock protein 70 downregulation inhibits proliferation, migration and tumorigenicity in hepatocellular carcinoma cells. Oncol. Lett. 2017, 14, 2703–2708. [Google Scholar] [CrossRef] [Green Version]
- Hendershot, L.M. The ER function BiP is a master regulator of ER function. Mt. Sinai J. Med. 2004, 71, 289–297. [Google Scholar]
- Lee, A.S. The ER chaperone and signaling regulator GRP78/BiP as a monitor of endoplasmic reticulum stress. Methods 2005, 35, 373–381. [Google Scholar] [CrossRef]
- Reddy, R.K.; Mao, C.; Baumeister, P.; Austin, R.C.; Kaufman, R.J.; Lee, A.S. Endoplasmic reticulum chaperone protein GRP78 protects cells from apoptosis induced by topoisomerase inhibitors: Role of ATP binding site in suppression of caspase-7 activation. J. Biol. Chem. 2003, 278, 20915–20924. [Google Scholar] [CrossRef] [Green Version]
- Yorimitsu, T.; Klionsky, D.J. Endoplasmic reticulum stress: A new pathway to induce autophagy. Autophagy 2007, 3, 160–162. [Google Scholar] [CrossRef] [Green Version]
- Li, J.; Ni, M.; Lee, B.; Barron, E.; Hinton, D.R.; Lee, A.S. The unfolded protein response regulator GRP78/BiP is required for endoplasmic reticulum integrity and stress-induced autophagy in mammalian cells. Cell Death Differ. 2008, 15, 1460–1471. [Google Scholar] [CrossRef]
- Su, R.; Li, Z.; Li, H.; Song, H.; Bao, C.; Wei, J.; Cheng, L. Grp78 promotes the invasion of hepatocellular carcinoma. BMC Cancer 2010, 10, 20. [Google Scholar] [CrossRef]
- Wu, J.; Qiao, S.; Xiang, Y.; Cui, M.; Yao, X.; Lin, R.; Zhang, X. Endoplasmic reticulum stress: Multiple regulatory roles in hepatocellular carcinoma. Biomed. Pharmacother. 2021, 142, 112005. [Google Scholar] [CrossRef]
- Blanquicett, C.; Johnson, M.R.; Heslin, M.; Diasio, R.B. Housekeeping gene variability in normal and carcinomatous colorectal and liver tissues: Applications in pharmacogenomic gene expression studies. Anal. Biochem. 2002, 303, 209–214. [Google Scholar] [CrossRef] [PubMed]
- Gu, Y.; Tang, S.; Wang, Z.; Cai, L.; Lian, H.; Shen, Y.; Zhou, Y. A pan-cancer analysis of the prognostic and immunological role of beta-actin (ACTB) in human cancers. Bioengineered 2021, 12, 6166–6185. [Google Scholar] [CrossRef] [PubMed]
- Gizak, A.; Wisniewski, J.; Heron, P.; Mamczur, P.; Sygusch, J.; Rakus, D. Targeting a moonlighting function of aldolase induces apoptosis in cancer cells. Cell Death Dis. 2019, 10, 712. [Google Scholar] [CrossRef] [PubMed] [Green Version]
- Niu, Y.; Lin, Z.; Wan, A.; Sun, L.; Yan, S.; Liang, H.; Zhan, S.; Chen, D.; Bu, X.; Liu, P.; et al. Loss-of-Function Genetic Screening Identifies Aldolase A as an Essential Driver for Liver Cancer Cell Growth Under Hypoxia. Hepatology 2021, 74, 1461–1479. [Google Scholar] [CrossRef] [PubMed]
- Yin, M.; Ma, W.; An, L. Cortactin in cancer cell migration and invasion. Oncotarget 2017, 8, 88232–88243. [Google Scholar] [CrossRef] [Green Version]
- Chuma, M.; Sakamoto, M.; Yasuda, J.; Fujii, G.; Nakanishi, K.; Tsuchiya, A.; Ohta, T.; Asaka, M.; Hirohashi, S. Overexpression of cortactin is involved in motility and metastasis of hepatocellular carcinoma. J. Hepatol. 2004, 41, 629–636. [Google Scholar] [CrossRef]
- Lo, L.H.; Lam, C.Y.; To, J.C.; Chiu, C.H.; Keng, V.W. Sleeping Beauty insertional mutagenesis screen identifies the pro-metastatic roles of CNPY2 and ACTN2 in hepatocellular carcinoma tumor progression. Biochem. Biophys. Res. Commun. 2021, 541, 70–77. [Google Scholar] [CrossRef]
- Roy, N.; Lodh, R.; Sarma, A.; Bhattacharyya, D.K.; Barah, P. Integrative analysis identified common and unique molecular signatures in hepatobiliary cancers. bioRxiv 2021. [Google Scholar] [CrossRef]
- Wang, T.; Wang, Z.; Niu, R.; Wang, L. Crucial role of Anxa2 in cancer progression: Highlights on its novel regulatory mechanism. Cancer Biol. Med. 2019, 16, 671–687. [Google Scholar] [CrossRef] [PubMed]
- Li, Z.; Yu, L.; Hu, B.; Chen, L.; Jv, M.; Wang, L.; Zhou, C.; Wei, M.; Zhao, L. Advances in cancer treatment: A new therapeutic target, Annexin A2. J. Cancer 2021, 12, 3587–3596. [Google Scholar] [CrossRef] [PubMed]
- El-Abd, N.; Fawzy, A.; Elbaz, T.; Hamdy, S. Evaluation of annexin A2 and as potential biomarkers for hepatocellular carcinoma. Tumor Biol. 2016, 37, 211–216. [Google Scholar] [CrossRef] [PubMed]
- Guo, M.; Lu, S.; Huang, H.; Wang, Y.; Yang, M.Q.; Yang, Y.; Fan, Z.; Jiang, B.; Deng, Y. Increased AURKA promotes cell proliferation and predicts poor prognosis in bladder cancer. BMC Syst. Biol. 2018, 12, 118. [Google Scholar] [CrossRef] [PubMed]
- Wang-Bishop, L.; Chen, Z.; Gomaa, A.; Lockhart, A.C.; Salaria, S.; Wang, J.; Lewis, K.B.; Ecsedy, J.; Washington, K.; Beauchamp, R.D.; et al. Inhibition of AURKA Reduces Proliferation and Survival of Gastrointestinal Cancer Cells With Activated KRAS by Preventing Activation of RPS6KB1. Gastroenterology 2019, 156, 662–675.e7. [Google Scholar] [CrossRef] [PubMed]
- Wang, B.; Hsu, C.J.; Chou, C.H.; Lee, H.L.; Chiang, W.L.; Su, C.M.; Tsai, H.C.; Yang, S.F.; Tang, C.H. Variations in the AURKA Gene: Biomarkers for the Development and Progression of Hepatocellular Carcinoma. Int. J. Med. Sci. 2018, 15, 170–175. [Google Scholar] [CrossRef] [Green Version]
- Chen, C.; Song, G.; Xiang, J.; Zhang, H.; Zhao, S.; Zhan, Y. AURKA promotes cancer metastasis by regulating epithelial-mesenchymal transition and cancer stem cell properties in hepatocellular carcinoma. Biochem. Biophys. Res. Commun. 2017, 486, 514–520. [Google Scholar] [CrossRef]
- Du, R.; Huang, C.; Liu, K.; Li, X.; Dong, Z. Targeting AURKA in Cancer: Molecular mechanisms and opportunities for Cancer therapy. Mol. Cancer 2021, 20, 15. [Google Scholar] [CrossRef]
- Xiao, J.; Zhang, Y. AURKB as a Promising Prognostic Biomarker in Hepatocellular Carcinoma. Evol. Bioinform. 2021, 17, 11769343211057589. [Google Scholar] [CrossRef]
- Wang, G.H.; Zhao, C.M.; Huang, Y.; Wang, W.; Zhang, S.; Wang, X. BRCA1 and BRCA2 expression patterns and prognostic significance in digestive system cancers. Hum. Pathol. 2018, 71, 135–144. [Google Scholar] [CrossRef]
- Mei, J.; Wang, R.; Xia, D.; Yang, X.; Zhou, W.; Wang, H.; Liu, C. BRCA1 Is a Novel Prognostic Indicator and Associates with Immune Cell Infiltration in Hepatocellular Carcinoma. DNA Cell Biol. 2020, 39, 1838–1849. [Google Scholar] [CrossRef] [PubMed]
- Pines, J. Four-dimensional control of the cell cycle. Nat. Cell Biol. 1999, 1, E73–E79. [Google Scholar] [CrossRef] [PubMed]
- Araki, H. Cyclin-dependent kinase-dependent initiation of chromosomal DNA replication. Curr. Opin. Cell Biol. 2010, 22, 766–771. [Google Scholar] [CrossRef] [PubMed]
- Meng, Z.; Wu, J.; Liu, X.; Zhou, W.; Ni, M.; Liu, S.; Guo, S.; Jia, S.; Zhang, J. Identification of potential hub genes associated with the pathogenesis and prognosis of hepatocellular carcinoma via integrated bioinformatics analysis. J. Int. Med. Res. 2020, 48, 300060520910019. [Google Scholar] [CrossRef]
- Wu, C.X.; Wang, X.Q.; Chok, S.H.; Man, K.; Tsang, S.H.Y.; Chan, A.C.Y.; Ma, K.W.; Xia, W.; Cheung, T.T. Blocking CDK1/PDK1/beta-Catenin signaling by CDK1 inhibitor RO3306 increased the efficacy of sorafenib treatment by targeting cancer stem cells in a preclinical model of hepatocellular carcinoma. Theranostics 2018, 8, 3737–3750. [Google Scholar] [CrossRef]
- Liu, X.; Wu, H.; Liu, Z. An Integrative Human Pan-Cancer Analysis of Cyclin-Dependent Kinase 1 (CDK1). Cancers 2022, 14, 2658. [Google Scholar] [CrossRef]
- Wang, M.; Wang, L.; Wu, S.; Zhou, D.; Wang, X. Identification of Key Genes and Prognostic Value Analysis in Hepatocellular Carcinoma by Integrated Bioinformatics Analysis. Int. J. Genom. 2019, 2019, 3518378. [Google Scholar] [CrossRef] [Green Version]
- Zou, Y.; Ruan, S.; Jin, L.; Chen, Z.; Han, H.; Zhang, Y.; Jian, Z.; Lin, Y.; Shi, N.; Jin, H. CDK1, CCNB1, and CCNB2 are Prognostic Biomarkers and Correlated with Immune Infiltration in Hepatocellular Carcinoma. Med. Sci. Monit. 2020, 26, e925289. [Google Scholar] [CrossRef]
- Rodriguez-Antona, C.; Ingelman-Sundberg, M. Cytochrome P450 pharmacogenetics and cancer. Oncogene 2006, 25, 1679–1691. [Google Scholar] [CrossRef] [Green Version]
- Yu, T.; Wang, X.; Zhu, G.; Han, C.; Su, H.; Liao, X.; Yang, C.; Qin, W.; Huang, K.; Peng, T. The prognostic value of differentially expressed CYP3A subfamily members for hepatocellular carcinoma. Cancer Manag. Res. 2018, 10, 1713–1726. [Google Scholar] [CrossRef] [Green Version]
- Yu, J.; Xia, X.; Dong, Y.; Gong, Z.; Li, G.; Chen, G.G.; Lai, P.B.S. CYP1A2 suppresses hepatocellular carcinoma through antagonizing HGF/MET signaling. Theranostics 2021, 11, 2123–2136. [Google Scholar] [CrossRef] [PubMed]
- Tanaka, S.; Mogushi, K.; Yasen, M.; Ban, D.; Noguchi, N.; Irie, T.; Kudo, A.; Nakamura, N.; Tanaka, H.; Yamamoto, M.; et al. Oxidative stress pathways in noncancerous human liver tissue to predict hepatocellular carcinoma recurrence: A prospective, multicenter study. Hepatology 2011, 54, 1273–1281. [Google Scholar] [CrossRef] [PubMed]
- Herbst, R.S. Review of epidermal growth factor receptor biology. Int. J. Radiat. Oncol. Biol. Phys. 2004, 59, 21–26. [Google Scholar] [CrossRef] [PubMed]
- Liu, Z.; Chen, D.; Ning, F.; Du, J.; Wang, H. EGF is highly expressed in hepatocellular carcinoma (HCC) and promotes motility of HCC cells via fibronectin. J. Cell. Biochem. 2018, 119, 4170–4183. [Google Scholar] [CrossRef]
- Wu, L.; Fidan, K.; Um, J.Y.; Ahn, K.S. Telomerase: Key regulator of inflammation and cancer. Pharmacol. Res. 2020, 155, 104726. [Google Scholar] [CrossRef]
- Zhu, Z.; Wilson, A.T.; Gopalakrishna, K.; Brown, K.E.; Luxon, B.A.; Schmidt, W.N. Hepatitis C virus core protein enhances Telomerase activity in Huh7 cells. J. Med. Virol. 2010, 82, 239–248. [Google Scholar] [CrossRef]
- Ray, R.B.; Meyer, K.; Ray, R. Hepatitis C virus core protein promotes immortalization of primary human hepatocytes. Virology 2000, 271, 197–204. [Google Scholar] [CrossRef] [Green Version]
- Watt, P.M.; Hickson, I.D. Structure and function of type II DNA topoisomerases. Biochem. J. 1994, 303 Pt 3, 681–695. [Google Scholar] [CrossRef] [Green Version]
- Panvichian, R.; Tantiwetrueangdet, A.; Angkathunyakul, N.; Leelaudomlipi, S. TOP2A amplification and overexpression in hepatocellular carcinoma tissues. BioMed Res. Int. 2015, 2015, 381602. [Google Scholar] [CrossRef] [Green Version]
- Meng, J.; Wei, Y.; Deng, Q.; Li, L.; Li, X. Study on the expression of TOP2A in hepatocellular carcinoma and its relationship with patient prognosis. Cancer Cell Int. 2022, 22, 29. [Google Scholar] [CrossRef]
- Sia, D.; Jiao, Y.; Martinez-Quetglas, I.; Kuchuk, O.; Villacorta-Martin, C.; Castro de Moura, M.; Putra, J.; Camprecios, G.; Bassaganyas, L.; Akers, N.; et al. Identification of an Immune-specific Class of Hepatocellular Carcinoma, Based on Molecular Features. Gastroenterology 2017, 153, 812–826. [Google Scholar] [CrossRef] [PubMed]
- Cao, J.; Wang, P.; Chen, J.; He, X. Systemic characterization of the SLC family genes reveals SLC26A6 as a novel oncogene in hepatocellular carcinoma. Transl. Cancer Res. 2021, 10, 2882–2894. [Google Scholar] [CrossRef] [PubMed]
- Caballero, O.L.; Chen, Y.T. Cancer/testis (CT) antigens: Potential targets for immunotherapy. Cancer Sci. 2009, 100, 2014–2021. [Google Scholar] [CrossRef] [PubMed]
- Yang, P.; Meng, M.; Zhou, Q. Oncogenic cancer/testis antigens are a hallmarker of cancer and a sensible target for cancer immunotherapy. Biochim. Biophys. Acta Rev. Cancer 2021, 1876, 188558. [Google Scholar] [CrossRef] [PubMed]
- Florke Gee, R.R.; Chen, H.; Lee, A.K.; Daly, C.A.; Wilander, B.A.; Fon Tacer, K.; Potts, P.R. Emerging roles of the MAGE protein family in stress response pathways. J. Biol. Chem. 2020, 295, 16121–16155. [Google Scholar] [CrossRef]
- Wu, J.M.; Skill, N.J.; Maluccio, M.A. Evidence of aberrant lipid metabolism in hepatitis C and hepatocellular carcinoma. HPB 2010, 12, 625–636. [Google Scholar] [CrossRef] [Green Version]
- Bindea, G.; Mlecnik, B.; Galon, J. Immune sunrise: From the immunome to the cancer immune landscape. Oncoimmunology 2022, 11, 2019896. [Google Scholar] [CrossRef]
- Mlecnik, B.; Torigoe, T.; Bindea, G.; Popivanova, B.; Xu, M.; Fujita, T.; Hazama, S.; Suzuki, N.; Nagano, H.; Okuno, K.; et al. Clinical Performance of the Consensus Immunoscore in Colon Cancer in the Asian Population from the Multicenter International SITC Study. Cancers 2022, 14, 4346. [Google Scholar] [CrossRef]
- Galon, J.; Bruni, D. Approaches to treat immune hot, altered and cold tumours with combination immunotherapies. Nat. Rev. Drug Discov. 2019, 18, 197–218. [Google Scholar] [CrossRef]
- Blake, S.J.; Stannard, K.; Liu, J.; Allen, S.; Yong, M.C.; Mittal, D.; Aguilera, A.R.; Miles, J.J.; Lutzky, V.P.; de Andrade, L.F.; et al. Suppression of Metastases Using a New Lymphocyte Checkpoint Target for Cancer Immunotherapy. Cancer Discov. 2016, 6, 446–459. [Google Scholar] [CrossRef] [Green Version]
- Sun, H.; Huang, Q.; Huang, M.; Wen, H.; Lin, R.; Zheng, M.; Qu, K.; Li, K.; Wei, H.; Xiao, W.; et al. Human CD96 Correlates to Natural Killer Cell Exhaustion and Predicts the Prognosis of Human Hepatocellular Carcinoma. Hepatology 2019, 70, 168–183. [Google Scholar] [CrossRef] [PubMed]
- Hou, Y.; Zhang, G. Identification of immune-infiltrating cell-related biomarkers in hepatocellular carcinoma based on gene co-expression network analysis. Diagn. Pathol. 2021, 16, 57. [Google Scholar] [CrossRef] [PubMed]


| Parameter | Number |
|---|---|
| Number of Incident Cases | 3615 |
| Crude rate | 18.8 |
| ASR (world) per 100,000 | 8.8 |
| Cumulative risk (0–74) | 2.1 |
| Group/Groups | Upregulated | Downregulated |
|---|---|---|
| Total HBV | 120 | 102 |
| Total HCV | 465 | 226 |
| Total non-B, non-C | 441 | 187 |
| Unique HBV | 39 | 50 |
| Unique HCV | 331 | 145 |
| Unique non-B, non-C | 332 | 121 |
| Crt. No. | Differentially Expressed Genes (DEGs) | Tumor Group Etiology | ||
|---|---|---|---|---|
| HBV Log 2 (Ratio) | HCV Log 2 (Ratio) | Non-Viral (Non-B, Non-C) Log 2 (Ratio) | ||
| 1 | LINC00383—Long Intergenic Non-Protein Coding RNA 383 | 6.08 | 7.56 | 7.19 |
| 2 | LVCAT8—Liver cancer-associated transcript 8 | 5.91 | 3.82 | 3.87 |
| 3 | ACTN2—Actinin Alpha 2 | 5.48 | 2.73 | 4.26 |
| 4 | RAB9BP1 RAB9B—Member RAS Oncogene Family Pseudogene 1 | 4.08 | 7.82 | 5.64 |
| 5 | MYO18B—Myosin XVIIIB | 3.88 | 6.74 | 5.49 |
| 6 | UBE2C—Ubiquitin Conjugating Enzyme E2 C | 3.79 | 5.13 | 3.7 |
| 7 | LVCAT5—Liver cancer-associated transcript 5 | 3.54 | 8.85 | 6.62 |
| 8 | TROAP—Trophinin Associated Protein | 3.46 | 5.07 | 4.1 |
| 9 | CYP17A1—Cytochrome P450 17A1 | 3.35 | 5.87 | 4.41 |
| 10 | TOP2A—DNA Topoisomerase 2-Alpha | 3.35 | 4.72 | 2.59 |
| 11 | DYNC1I1—Dynein Cytoplasmic 1 Intermediate Chain 1 | 3.25 | 2.85 | 3.72 |
| 12 | LINC01344—Long Intergenic Non-Protein Coding RNA 1344 ZNF648—Zinc Finger Protein 648 | 3.21 | 2.4 | 2.92 |
| 13 | CNR1—cannabinoid receptor 1 | 3.19 | 2.77 | 3.95 |
| 14 | MELK—Maternal Embryonic Leucine Zipper Kinase | 3.01 | 5.07 | 3.16 |
| 15 | B4GALNT1—Beta-1,4-N-Acetyl-Galactosaminyltransferase 1 | 2.84 | 4.95 | 3.94 |
| 16 | HIST1H2AI—Histone H2A type 1 HIST1H3H—Histone H3.1/Histone cluster 1, H3h | 2.83 | 3.86 | 3.92 |
| 17 | ASPM—Assembly Factor For Spindle Microtubules | 2.81 | 4.92 | 2.92 |
| 18 | HIST1H3A—H3 Clustered Histone 1 HIST1H3C—H3 Clustered Histone 3 | 2.71 | 3.83 | 3.33 |
| 20 | FOXM1 Forkhead Box M1 | 2.66 | 3.69 | 3.66 |
| 21 | CAP2—Cyclase Associated Actin Cytoskeleton Regulatory Protein 2 | 2.46 | 2.62 | 2.8 |
| 22 | TEX41—Testis Expressed 41 | 2.13 | 4.7 | 4.13 |
| 23 | ATAD2—ATPase Family AAA Domain Containing 2 | 1.89 | 2.19 | 1.58 |
| 24 | LINC0115—Long Intergenic Non-Protein Coding RNA 1151 LOC105375734—Uncharacterized LOC105375734 | 1.86 | 3.56 | 3.63 |
| 25 | FASN—Fatty acid synthase | 1.74 | 2.25 | 3.73 |
| 26 | LAMA3—Laminin Subunit Alpha 3 | 1.74 | 1.85 | 2.98 |
| 27 | CCDC162P—Coiled-coil domain containing 162, pseudogene LOC100996634—Uncharacterized | 1.49 | 1.77 | −1.81 |
| 28 | CDKN2B-AS1—CDKN2B Antisense RNA 1 | 1.43 | 2.21 | 1.48 |
| 29 | NR2F2-AS1— Nuclear Receptor Subfamily 2 Group F Member 2 Antisense RNA 1 | −1.41 | −2.09 | −1.51 |
| 30 | PCDHA1—Protocadherin alpha-1;10;11;12;13… PCDHA10; PCDHA11; PCDHA12; PCDHA13; PCDHA2; PCDHA3; PCDHA4; PCDHA5; PCDHA6; PCDHA7; PCDHA8; PCDHA9; PCDHAC1; PCDHAC2 | −1.54 | 1.57 | 2.07 |
| 31 | HGF—Hepatocyte Growth Factor | −1.69 | −2.22 | −1.96 |
| 32 | IL33—Interleukin 33 | −1.79 | −2.09 | −2.44 |
| 33 | ADRA1A—Adrenoceptor Alpha 1A | −1.81 | −2.16 | −1.55 |
| 34 | EDNRB—Endothelin Receptor Type B | −1.96 | −1.49 | −1.79 |
| 35 | EGR1—Early Growth Response 1 | −1.98 | −2.38 | −1.98 |
| 36 | AFM—Afamin LOC728040—Uncharacterized LOC728040 | −2.11 | −2.58 | −2.11 |
| 37 | DCN—Decorin | −2.22 | −2.67 | −3.05 |
| 38 | CYP39A1—Cytochrome 39A1 | −2.26 | −2.28 | −2.12 |
| 39 | ADAMTS9-AS2— ADAM Metallopeptidase With Thrombospondin Type 1 Motif 9Antisense RNA2 | −2.27 | −2.75 | −2.23 |
| 40 | C8orf4—Thyroid Cancer Protein 1 | −2.49 | −2.76 | −1.94 |
| 41 | C7—Complement C7 | −2.71 | −3.84 | −2.82 |
| 42 | LIFR—LIF Receptor Subunit Alpha | −2.72 | −2.78 | −2.77 |
| 43 | LOC100506869—Uncharacterized LOC100506869 LOC101927653—Uncharacterized LOC101927653 | −2.96 | −2.9 | −3.11 |
| 44 | GHR—Growth Hormone Receptor | −2.98 | −2.7 | −2.09 |
| 45 | COLEC10—Collectin Subfamily Member 10 | −3.52 | −3.33 | −3.05 |
| 46 | CLEC4M—C-Type Lectin Domain Family 4 Member M | −5.56 | −4.33 | −3.29 |
| 47 | CYP2C8—Cytochrome 2C8 | −2.8 | −4.89 | −2.68 |
| Crt. No. | Differentially Expressed Genes (DEGs) | Tumor Group Etiology | ||
|---|---|---|---|---|
| HBV Log 2 (Ratio) Fold Change | HCV Log 2 (Ratio) Fold Change | Non-Viral (Non-B, Non-C) Log 2 (Ratio) Fold Change | ||
| 1 | CYP17A1 | 3.35 | 5.87 | 4.41 |
| 2 | CYP7A1 | 3.03 | 3.12 | |
| 3 | CYP39A1 | −2.26 | −2.28 | −2.12 |
| 4 | CYP2C8 | −2.4 | −4.89 | −2.68 |
| 5 | CYP2C9 | −2.59; 8.14 | ||
| 6 | CYP2B6 | −3.01 | ||
| 7 | CYP2B7P | −3.01 | ||
| 8 | CYP3A43 | −2.94 | −1.36 | |
| 9 | CYP2C18 | −2.59 | ||
| 10 | CYP2C19 | −2.59 | ||
| 11 | CYP3A4 | −2.38 | ||
| 12 | CYP3A5 | −2.38 | ||
| 13 | CYP3A7 | −2.38 | ||
| 14 | CYP3A51P | −2.38 | ||
| 15 | CYP2E1 | −1.95 | −1.77 | |
| 16 | CYP4V2 | −1.67 | ||
| 17 | CYP1A2 | −3.98 | ||
| DEG HBV | Log 2 (Ratio) Fold Change | DEG HCV | Log 2 (Ratio) Fold Change | DEG Non-Viral | Log 2 (Ratio) Fold Change |
|---|---|---|---|---|---|
| SLC5A6 | 2.47 | ||||
| SLC5A1 | −4.75 | ||||
| SLC22A1 | −5.05 | ||||
| SLC25A36 | −2.14 | ||||
| SLC14A1 | −3.46 | ||||
| SLC8A1 | −2.01 | ||||
| SLC7A2 | −1.98 | ||||
| SLC4A2 | 2.14 | ||||
| SLC9A3 | 1.76 | ||||
| SLC22A1 | −3.12 | ||||
| SLC29A4 | 1.76 | ||||
| SLC6A9 | 3.26 | ||||
| SLC26A6 | 2.14 | SLC26A6 | 3.02 | ||
| SLC7A9 | −2.47 | ||||
| SLC38A4 | −2.05 | SLC38A4 | −1.61 | ||
| SLC44A5 | 2.77 | ||||
| SLC27A2 | −1.47 | ||||
| SLC38A2 | −1.41 | ||||
| SLC25A39 | 2.21 | ||||
| SLC22A18 | 3.32 | ||||
| SLC52A2 | 3.44 | ||||
| SLC6A2 | 6.91 | ||||
| SLC22A12 | 12.56 | ||||
| ABCF1 | 1.95 | ||||
| ABCB8 | 2.74 | ||||
| SLC28A2 | 3.8 | ||||
| SLC2A5 | 3.81 | ||||
| SLC01C1 | 4.38 | ||||
| ABCB 5 | 5.57 | ||||
| ABCA 5 | −1.19 | ||||
| ABCA 6 | −1.19 | ||||
| ABCA 8 | −1.19 | ||||
| ABCA 9 | −1.19 | ||||
| ABCA10 | −1.19 |
| Cancer Testis Antigenes and Related Genes | |||
|---|---|---|---|
| Genes CTDatabase/Code | HBV | HCV | Non-B, Non-C |
| ATAD (ATPase Family AAA Domain)/CT 137 | 1.89 | 2.19 | 1.58 |
| BUB1B (BUB1 Mitotic Checkpoint Serine/Threonine Kinase B) | 4.52 | ||
| PBK (PDZ Binding Kinase)/CT 84 | 5.12 | ||
| MAGEA1 (MAGE Family Member A1)/CT 1.1 | 4.74 | ||
| MAGEC3 (MAGE Family Member C3)/CT 7.2 | 4.13 | ||
| MAGEB17 (MAGE Family Member B17) | 5.99 | ||
| MAGEB2 (MAGE Family Member B2)/CT 3.2 | 9.05 | ||
| PAGE 4 (Prostate-associated gene 4)/CT 16.4 | 9.58 | ||
| PAGE 5 (Prostate-associated gene 5)/CT 16.1 | 4.21 | ||
| GAGE2A/CT 4.1 | 11.86 | ||
| BAGE (B Melanoma Antigen)/CT 2.1 BAGE 3 (B Melanoma Antigen 3)/CT 2.3 BAGE4 (B Melanoma Antigen 4)/CT 2.4 BAGE5 (B Melanoma Antigen 5)/CT 2.5 | 5.46 | 6.93 | 5.82 |
| HSPB9 (Heat shock protein B family member 9/CT 51 | 4.7 | ||
| TPTE Transmembrane Phosphatase With Tensin Homology)/CT 44 | 6.93 | 5.82 | |
| ACTL8 (Actin like 8)/CT 57 | 11.23 | 9.12 | |
| FAM133A (Family With Sequence Similarity 133 Member A/CT 115 | 5.22 | ||
| TEX41 (Testis Expressed 41) | 2.13 | 4.7 | 4.13 |
| TTK (MPS1—Serine/threonine-protein kinase/CT 96 | 4.71 | ||
| No. | Differentially Expressed Genes | Tumor Group Etiology | ||
|---|---|---|---|---|
| HBV Log 2 (Ratio) Fold Change | HCV Log 2 (Ratio) Fold Change | Non-Viral (Non-B, Non-C) Log 2 (Ratio) Fold Change | ||
| 1 | HSP90AA1 Heat Shock Protein 90 Alpha Family Class A Member 1 | 1.44 | ||
| 2 | HSP90AB1, Heat Shock Protein 90 Alpha Family Class B Member 1 | 1.75 | ||
| 3 | HSPA1A, Heat Shock Protein Family A (HSP70) Member 1A | 2.33 | ||
| 4 | HSPA5, Heat Shock Protein Family A (HSP70) Member 5 | 1.51 | ||
| 5 | HSPB1 Heat Shock Protein Family B (HSP27) Member 1 | 5.65 | ||
| 6 | HSPA1B Heat Shock Protein Family A (HSP70) Member B | 2.33 | ||
| 7 | HSPB9 Heat Shock Protein Family B (small HSP) Member 9 | 3.70 | ||
| 8 | HSF1 Heat Shock Factor 1 | 3.67 | ||
| 9 | HSF4 Heat Shock Factor 4 | 1.84 | ||
| 10 | CDC37 Cell Division Cycle 37, HSP90 Cochaperone | 1.54 | ||
| 11 | BAG3 BAG family molecular chaperone regulator 3 | 1.98 | ||
| Gene Symbol | Gene Description | Connectivity Degree (Ncon_Gene) |
|---|---|---|
| ACTB | Actin Beta | 116 |
| ACTG1 | Actin Gamma 1 | 74 |
| AGO2 | Argonaute RISC Catalytic Component 2 | 68 |
| ALDOA | Aldolase, Fructose-Bisphosphate A | 54 |
| ARF1 | ADP Ribosylation Factor 1 | 51 |
| ATP1A1 | ATPase Na+/K+ Transporting Subunit Alpha 1 | 52 |
| AURKB | Aurora Kinase B | 59 |
| BAG3 | BAG Cochaperone 3 | 54 |
| BCAR1 | BCAR1 Scaffold Protein, Cas Family Member | 57 |
| CDC37 | Cell Division Cycle 37, HSP90 Cochaperone | 57 |
| CTTN | Cortactin | 74 |
| CXCL8 | C-X-C Motif Chemokine Ligand 8 | 78 |
| EEF2 | Eukaryotic Translation Elongation Factor 2 | 57 |
| EZH2 | Enhancer Of Zeste 2 Polycomb Repressive Complex 2 Subunit | 57 |
| GAPDH | Glyceraldehyde-3-Phosphate Dehydrogenase | 95 |
| GNB2 | G Protein Subunit Beta 2 | 58 |
| HNRNPA1 | Heterogeneous Nuclear Ribonucleoprotein A1 | 82 |
| HSF1 | Heat Shock Transcription Factor 1 | 81 |
| HSP90AA1 | Heat Shock Protein 90 Alpha Family Class A Member 1 | 131 |
| HSP90AB1 | Heat Shock Protein 90 Alpha Family Class B Member 1 | 115 |
| HSPA1A | Heat Shock Protein Family A (Hsp70) Member 1A | 143 |
| HSPA5 | Heat Shock Protein Family A (Hsp70) Member 5 | 96 |
| HSPB1 | Heat Shock Protein Family B (Small) Member 1 | 56 |
| LMNA | Lamin A/C | 51 |
| MCM2 | Minichromosome Maintenance Complex Component 2 | 78 |
| MYH9 | Myosin Heavy Chain 9 | 86 |
| PTK2 | Protein Tyrosine Kinase 2 | 126 |
| RARA | Retinoic Acid Receptor Alpha | 95 |
| RECQL4 | RecQ Like Helicase 4 | 85 |
| RUVBL2 | RuvB Like AAA ATPase 2 | 62 |
| SEC13 | Homolog, Nuclear Pore And COPII Coat Complex Component | 76 |
| SLC8A1 | Solute Carrier Family 8 Member A1 | 52 |
| SMARCA4 | SWI/SNF-Related, Matrix Associated, Actin DependentRegulator Of Chromatin, Subfamily A, Member 4 | 56 |
| SQSTM1 | Sequestosome 1 | 101 |
| TUBB | Tubulin Beta Class I | 60 |
| U2AF2 | U2 Small Nuclear RNA Auxiliary Factor 2 | 61 |
| Gene Symbol | Gene Description | Connectivity Degree (Ncon_Gene) |
|---|---|---|
| ACTN2 | Actinin Alpha 2 | 60 |
| ANXA2 | Annexin A2 | 71 |
| AURKA | Aurora Kinase A | 63 |
| AURKB | Aurora Kinase B | 71 |
| BRCA1 | BRCA1 DNA Repair Associated | 121 |
| CCNB1 | Cyclin B1 | 63 |
| CDK1 | Cyclin Dependent Kinase 1 | 99 |
| CFTR | CF Transmembrane Conductance Regulator | 78 |
| CHEK1 | Checkpoint Kinase 1 | 56 |
| CYP1A2 | Cytochrome P450 Family1 Subfam A Member 2 | 52 |
| CYP3A4 | Cytochrome P450 Family 3 Subfamily A Member 4 | 60 |
| EGF | Epidermal Growth Factor | 68 |
| ENO1 | Enolase 1 | 56 |
| EZH2 | Enhancer Of Zeste 2 Polycomb Repressive Complex 2 Subunit | 62 |
| HMGA2 | High Mobility Group AT-Hook 2 | 63 |
| IGF1 | Insulin Like Growth Factor 1 | 104 |
| MCM2 | Minichromosome Maintenance Complex Component 2 | 69 |
| NME1 | Nucleoside Diphosphate Kinase 1 | 52 |
| PCK1 | Phosphoenolpyruvate Carboxykinase 1 | 52 |
| PKM | Pyruvate Kinase M1/2 | 57 |
| PRKDC | Protein Kinase, DNA-Activated, Catalytic Subunit | 72 |
| RECQL4 | RecQ Like Helicase 4 | 68 |
| SLC27A2 | Solute Carrier Family 27 Member 2 | 52 |
| SLC5A1 | Solute Carrier Family 5 Member 1 | 51 |
| SQSTM1 | Sequestosome 1 | 72 |
| TERT | Telomerase Reverse Transcriptase | 58 |
| TOP2A | DNA Topoisomerase II Alpha | 52 |
Publisher’s Note: MDPI stays neutral with regard to jurisdictional claims in published maps and institutional affiliations. |
© 2022 by the authors. Licensee MDPI, Basel, Switzerland. This article is an open access article distributed under the terms and conditions of the Creative Commons Attribution (CC BY) license (https://creativecommons.org/licenses/by/4.0/).
Share and Cite
Paslaru, L.; Bindea, G.; Nastase, A.; Sorop, A.; Zimbru, C.; Herlea, V.; Hrehoret, D.; Brasoveanu, V.; Zamfir, R.; Dima, S.; et al. Comparative RNA-Sequencing Analysis Reveals High Complexity and Heterogeneity of Transcriptomic and Immune Profiles in Hepatocellular Carcinoma Tumors of Viral (HBV, HCV) and Non-Viral Etiology. Medicina 2022, 58, 1803. https://doi.org/10.3390/medicina58121803
Paslaru L, Bindea G, Nastase A, Sorop A, Zimbru C, Herlea V, Hrehoret D, Brasoveanu V, Zamfir R, Dima S, et al. Comparative RNA-Sequencing Analysis Reveals High Complexity and Heterogeneity of Transcriptomic and Immune Profiles in Hepatocellular Carcinoma Tumors of Viral (HBV, HCV) and Non-Viral Etiology. Medicina. 2022; 58(12):1803. https://doi.org/10.3390/medicina58121803
Chicago/Turabian StylePaslaru, Liliana, Gabriela Bindea, Anca Nastase, Andrei Sorop, Cristian Zimbru, Vlad Herlea, Doina Hrehoret, Vlad Brasoveanu, Radu Zamfir, Simona Dima, and et al. 2022. "Comparative RNA-Sequencing Analysis Reveals High Complexity and Heterogeneity of Transcriptomic and Immune Profiles in Hepatocellular Carcinoma Tumors of Viral (HBV, HCV) and Non-Viral Etiology" Medicina 58, no. 12: 1803. https://doi.org/10.3390/medicina58121803