In Situ and Post-Mortem Characterizations of Ultrasonic Spot Welded AZ31B and Coated Dual Phase 590 Steel Joints


Oak Ridge National Laboratory, Oak Ridge, TN 37831, USA
*
Author to whom correspondence should be addressed.
Metals 2020, 10(7), 899; https://doi.org/10.3390/met10070899
Submission received: 30 April 2020
/
Revised: 30 June 2020
/
Accepted: 1 July 2020
/
Published: 6 July 2020
(This article belongs to the Special Issue Ultrasonic Processing of Alloys)
Abstract
:Ultrasonic spot welding using different welding conditions was applied to join dissimilar metals of galvanized DP590 steel and AZ31B magnesium sheets. In situ high-speed imaging, digital image correlation, and infrared thermography were utilized to quantitatively study the interfacial relative motion, surface indentation, and heat generation across the joint faying interface and the sheet/sonotrode interfaces under the welding condition of moderate welding power and short welding time. For welds made with high power and long welding time, lap shear tensile tests as well as fatigue tests were carried out. Different fracture modes were observed after the lap shear tensile tests and fatigue tests performed under different peak loads. Post-weld cross-sectional analysis with scanning electron microscopy coupled with energy dispersive X-Ray spectroscopy revealed the variation of morphology and chemical composition at the joint interface for welds made with different welding conditions.
1. Introduction
With increasing demand of lightweight materials in automobiles to reduce fuel consumption and greenhouse gas emissions, magnesium (Mg) alloys have received much attention due to their low density and high specific strength [1]. However, joining Mg alloys with steel structures is challenging. This is because the physical and chemical properties of these two materials are quite different. The melting point of Mg is 650 °C versus steel or iron (Fe) at approximately 1500 °C. Mg and Fe are immiscible and no intermetallic compounds (IMCs) are formed in the Mg/Fe system. The solubility between them is very low. One effective way to metallurgically join Mg and steel is to obtain an interlayer. The elements of the interlayer can be from the alloy elements of the base metals or by adding a layer of coating material such as zinc (Zn) [2].
Various welding technologies have been attempted to join Mg and steel, among which laser welding and resistance spot welding are two widely used joining techniques in the automotive industry. For instance, Miao et al. applied a laser brazing technique to join AZ31 Mg alloy and Q235 steel [3]. An Al-rich interface consisting of Mg17Al12, Mg2Al3, FeAl, and Fe4Al13 [4] was formed at the joint interface. Wang et al. joined AZ31 Mg alloy and Q235 steel by metal inert gas (MIG) welding with a copper interlayer [5]. Feng et al. joined AZ31 magnesium alloy and electrogalvanized DP600 steel by resistance spot welding with a hot dip galvanized (HDG) Q235 steel interlayer [6]. However, joining Mg alloys by conventional fusion welding methods is problematic, resulting in defects such as hot cracking and porosity from nonequilibrium solidification and the segregation of impurity elements [7,8] in Mg alloys. Solid-state joining in which the temperature stays well below the melting point of the involved materials is an alternative way to mitigate such problems. One example is friction stir welding (FSW). Jana et al. applied FSW to join AZ31 Mg and HDG steel. The joining mechanism was mainly due to the Mg–Zn eutectic reaction, as well as the mechanical interlocking induced by the wavy interfacial structure by the rotating tool [9]. Little porosity or cracks were observed in the weld region. However, the typical FSW method leaves an exit hole in the material, which could impact the overall mechanical performance of the joint. There are ways to fill the exit hole [10], but it makes the process more complicated.
Ultrasonic spot welding (USW) is another solid-state joining method that can be used to join dissimilar materials. It creates less surface damage, which is a crucial consideration for many car manufacturers. In the automotive industry, USW has been successfully applied to join dissimilar metal components such as aluminum and copper in the battery assemblies of electric vehicles [11]. During USW processes, the ultrasonic transducer delivers a moderate clamping force and a high-frequency interfacial vibration onto the joint interface. The welding heat is mainly generated through interfacial friction, as well as plastic deformation and elastic hysteresis [12]. The heating and the interfacial pressure induce rapid diffusion, and the resulting reaction at the interface forms the joint [13,14]. Since the ultrasonic vibration is critical to the interfacial heat generation and joint formation, Chen et al. applied a high-speed digital image correlation (DIC) and infrared temperature-sensing approach to measure the interfacial motion and heat generation during a Mg–Mg USW process, and they established a correlation with the progression of joint formation [15]. So far, most of the work related to the USW of dissimilar metals deal with Fe–Al, Al–Cu, and Al–Mg material pairs. Mastuoka and Imai [16] studied the ultrasonic welding between aluminum and copper alloy. The welding conditions such as vibration amplitude and welding time to achieve a good joint were quantified. Watanabe et al. [17] investigated the effect of clamping load on the joint strength of an ultrasonic weld between mild steel and Al/Mg alloy. They found that a longer welding time (>3 s) would lead to the formation of Fe–Al intermetallics, which reduces the joint strength. Due to the highly immiscible nature of the Fe–Mg system, very limited studies on the ultrasonic welding of steel and magnesium alloys can be found in the literature. Mg–Zn reaction at the faying interface was found to be responsible for the interface bond between the AZ31 and galvanized steel [18]. Patel et al. [19] characterized the Zn-layer deformation and texture behaviors under different processing conditions. However, the in situ behaviors such as heat generation and interfacial motion as well as fatigue properties of the welds were still unclear.
In this research, the dissimilar materials (AZ31B Mg alloy and HDG DP590) welded by USW processes with low and high welding energy inputs were studied. In situ measurements on the Mg–steel interfacial motion, heat generation, and surface indentation were performed on the cases with low energy input. Then, high welding energy was used to produce lap shear joint coupons to obtain the lap shear strength and fatigue behaviors of the joint samples. In addition, the influence of input energy on the microstructure chemistry distribution at the joint interface was also investigated.
2. Experiments
The materials used in this study include 2-mm-thick AZ31B Mg alloy (POSCO, Pohang, Korea) and 1-mm-thick hot dipped galvanized (HDG) DP590 steel (U.S. Steel, Pittsburgh, PA, USA), with the Zn coating thickness varying from 50 to 70 μm. Two experimental setup and welding conditions were used as listed in Table 1. The first experimental setup involves a dual sonotrode ultrasonic welder, and it was used to quantitatively study the interfacial motion, surface indentation, and heat generation mechanisms. An infrared camera and a high-speed digital image correlation (DIC) were coupled to measure the in situ interfacial temperature and deformation behaviors. To track the motion of the interfaces by DIC, a high-contrast (in visible wavelength) speckle pattern capable of sustaining a temperature exposure up to 1100 °C was coated on the edge of Mg and steel sheets. Another important reason to apply such a coating was that the emissivity (in infrared wavelength) was uniformly high (approximately 0.95). As such, the influence of surface emissivity on temperature measurement by the IR camera was negligible. Details of the setup and calibration procedure of the infrared temperature measurement can be found in a previously published manuscript [15,20]. The infrared camera recorded the temperature evolution at a speed of 200 frames/s. Meanwhile, the high-speed camera recorded the vibratory motion of both sonotrode tips and both metal sheets at a speed of 120,000 frames/s. The pixel resolution of the high-speed images was 18 μm/pixel. The size of the AZ31B and the steel sheets was 25.4 mm × 25.4 mm square shape. The welding region was positioned on one edge of the sheet stack to monitor the interfacial motion and heat generation. The clamping force between the sonotrodes was 1.1 kN. Both sonotrode tips had an identical 7 mm × 7 mm nominal contact area with six parallel teeth perpendicular to the vibration direction. The ultrasonic welder had a fixed vibration frequency of 20 kHz on both sonotrodes with a 180° phase shift from each other. A moderate welding energy input (1000 W for 0.5 s) was applied. The reason to select this energy input was that it was just enough to make an effective metallurgical bond without causing severe deformation on the edge of the metal stack. If the input energy is too high, it could crash the materials and even damage the sonotrodes. The second experimental setup was to produce lap shear and fatigue testing coupons. Both the AZ31B and the steel sheets were 101.6 mm long and 25.4 mm wide with an overlap area of 25.4 mm × 25.4 mm. The steel sheet was placed on the top of the Mg sheet, with the Mg sheet resting on the top of an anvil. The ultrasonic welder in this setup only had one sonotrode on the top with a fixed vibration frequency of 20 kHz. The model of the ultrasonic transducer and the contact area of the sonotrode tip were identical to those used on the dual-head ultrasonic welder. The USW joint was made in the center of the overlap region. The clamping force was also set as 1.1 kN. Since the joint area was in the middle of the sheets and the chance to crash the materials or damage the sonotrodes was low, a relatively high welding energy input (3500 W for 4 s) that maximized the machine output limit was applied. It is noted that the nominal welding energies in Setup 2 were 28 times higher than those in Setup 2 (3500 W × 4 s = 14,000 J versus 1000 W × 0.5 s = 500 J). The difference of actual vibration energy delivered to the joint interface in these two conditions was smaller, since the dual sonotrode machine in Setup 1 in which both sonotrodes vibrate in 180° phase shift was much more efficient to generate vibrational shear motion at the faying interface.
Lap shear tensile tests were conducted using an MTS hydraulic system at a cross-head rate of 10 mm·min−1 and at room temperature. Shims (25 × 25 mm2) were used at both gripping ends of the samples to minimize specimen bending at the beginning of the lap shear test. The gripping area on both ends was 25 × 25 mm2. Load-controlled fatigue tests were performed on the same hydraulic machine with the same gripping condition. Sinusoidal waveforms in tension–tension mode were applied. The ratio of the minimum load and the maximum load or R ratio was 0.1, and the test frequency was 20 Hz in all the tests. Three maximum load conditions were performed corresponding to 20%, 40%, and 60% of the average peak load measured in the static lap shear tension tests.
To characterize the joint interface and study the influence of welding power and time on the microstructure of the joint interface, USW samples made from both experimental setups were cross-sectioned through the center of the welds (along the dash lines indicated in the inserted figures in Table 1 and characterized using a high-resolution scanning electron microscopy (SEM) coupled with energy-dispersive X-Ray spectroscopy (EDS). The morphology and chemical composition at the center of the joint interface made in different welding conditions were compared.
3. Results and Discussion
3.1. Interfacial Relative Motion, Surface Indentation, and Heat Generation
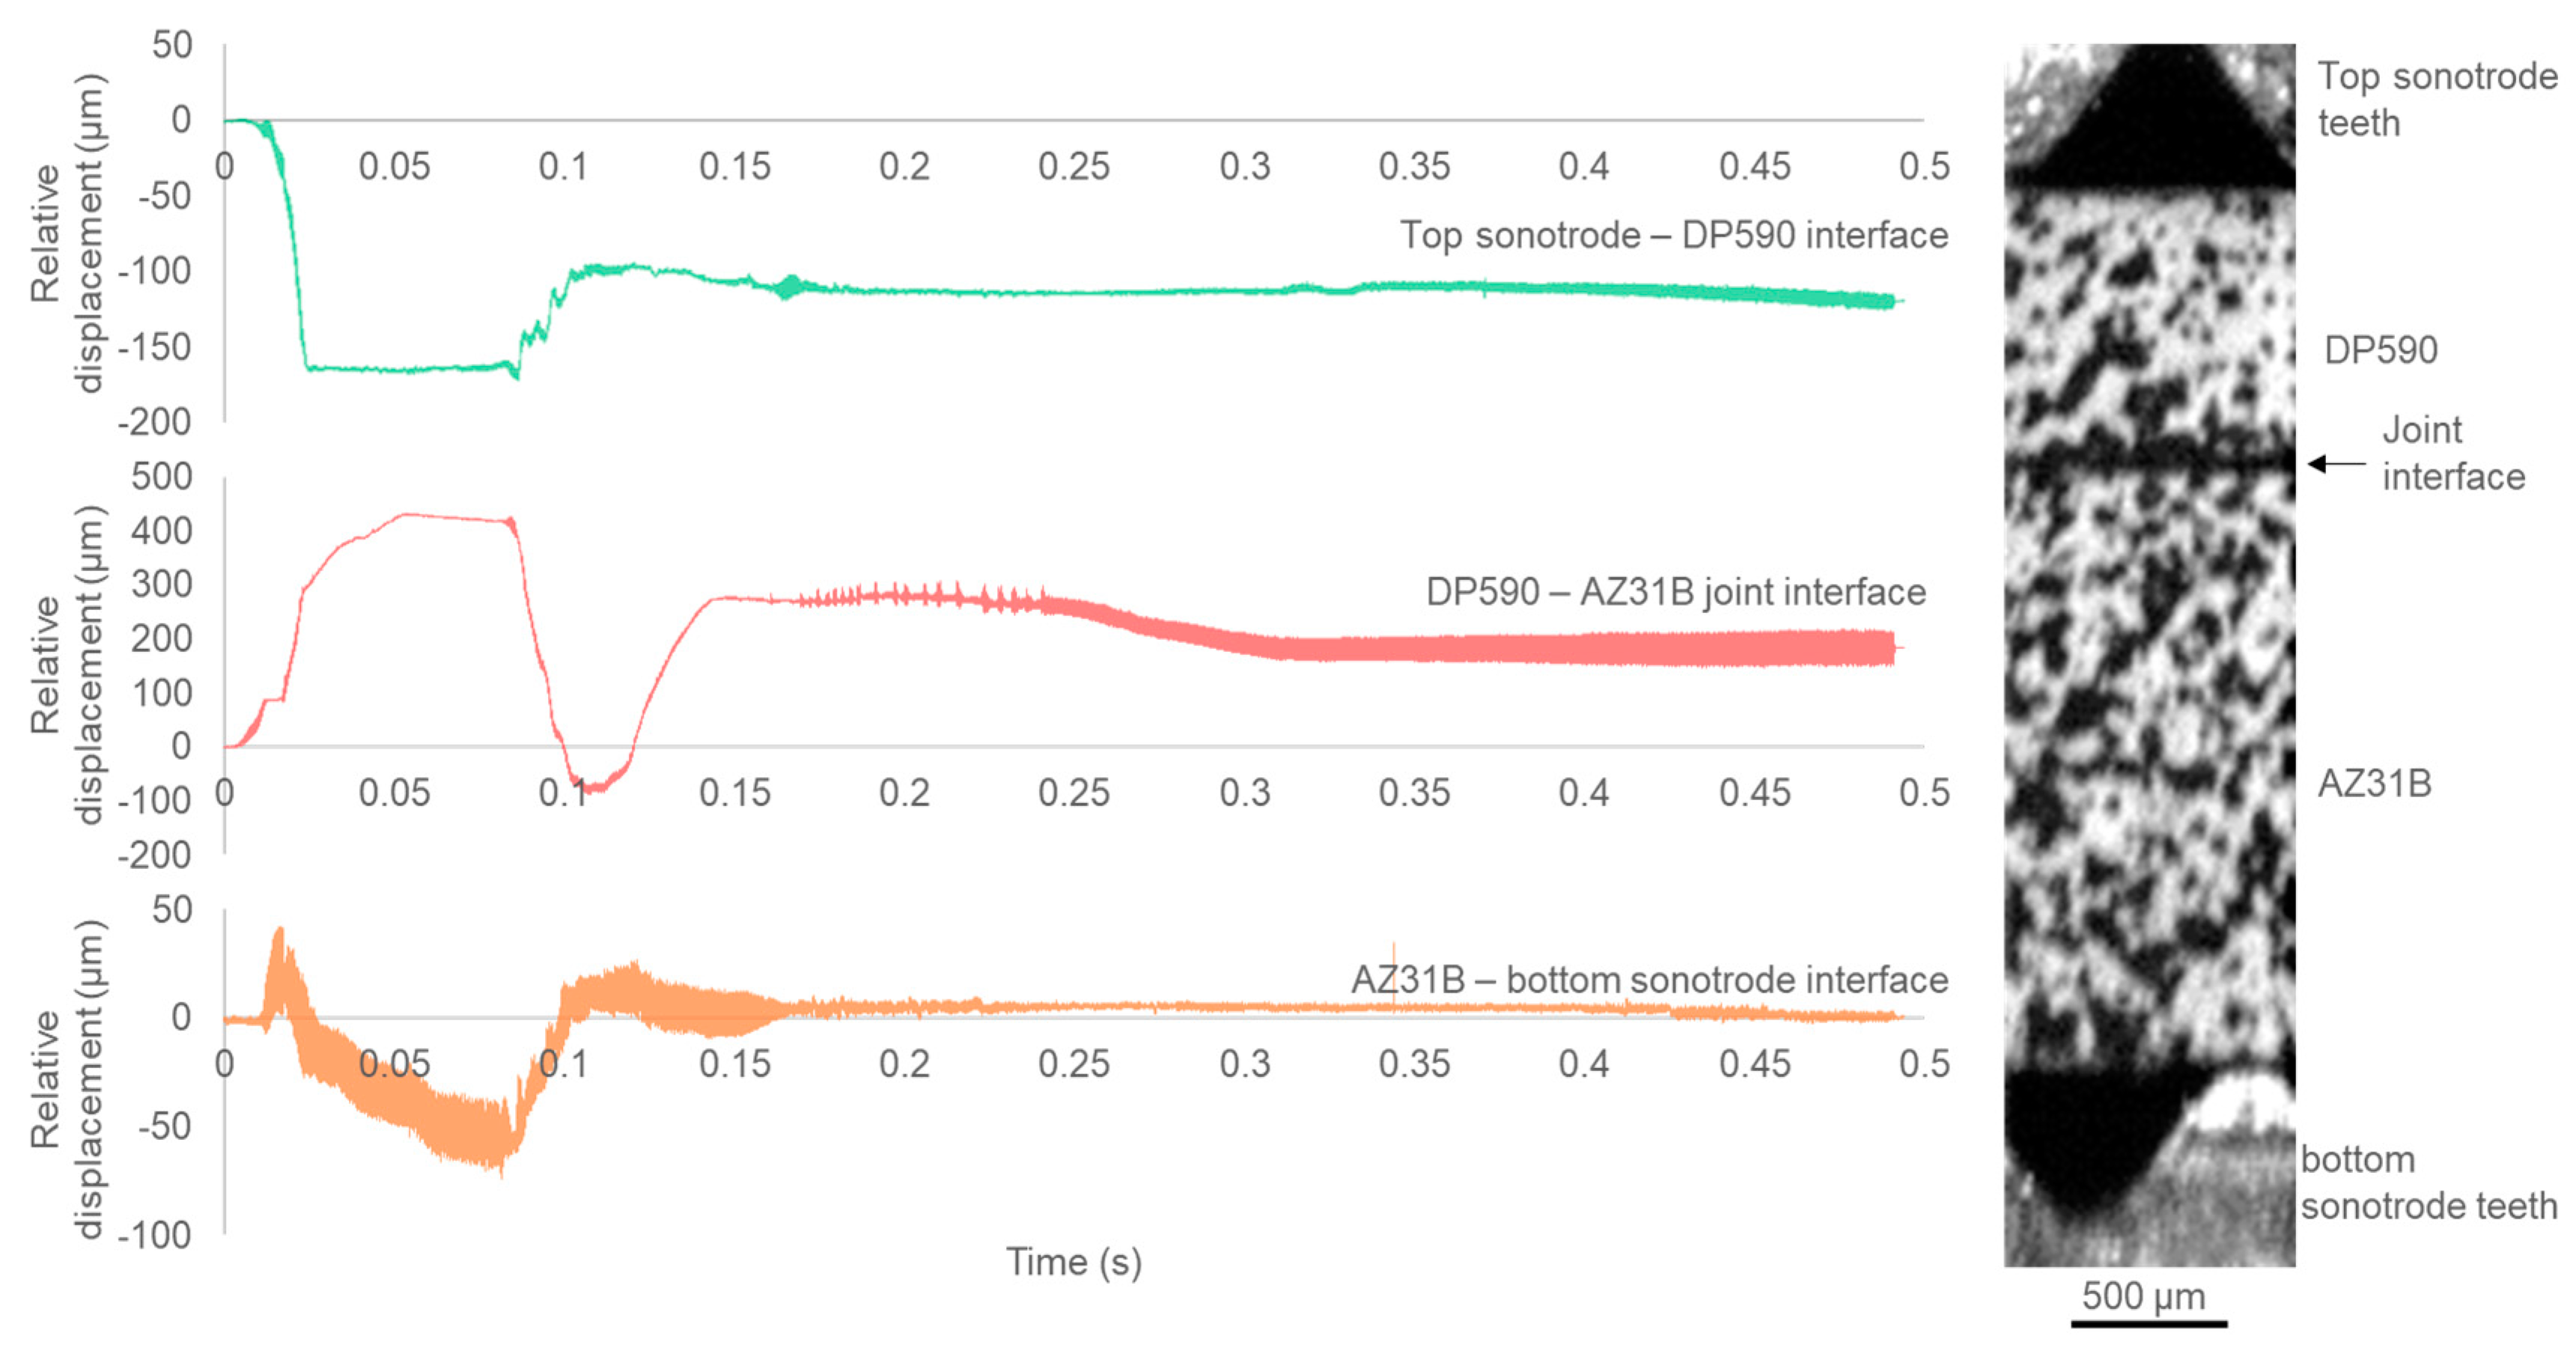
In Experimental Setup 1 as listed in Table 1, the displacement of the sonotrodes and the metal sheets were monitored by the DIC approach. It was found that the oscillation amplitude of both sonotrodes during welding was at approximately 10 μm. The relative displacement curves across three interfaces (top sonotrode–DP590 interface, DP590–AZ31B joint interface, and AZ31B–bottom sonotrode interface) were obtained as shown in Figure 1. There was a significant relative displacement at all interfaces (up to approximately 400 μm), and it varied throughout the welding process.
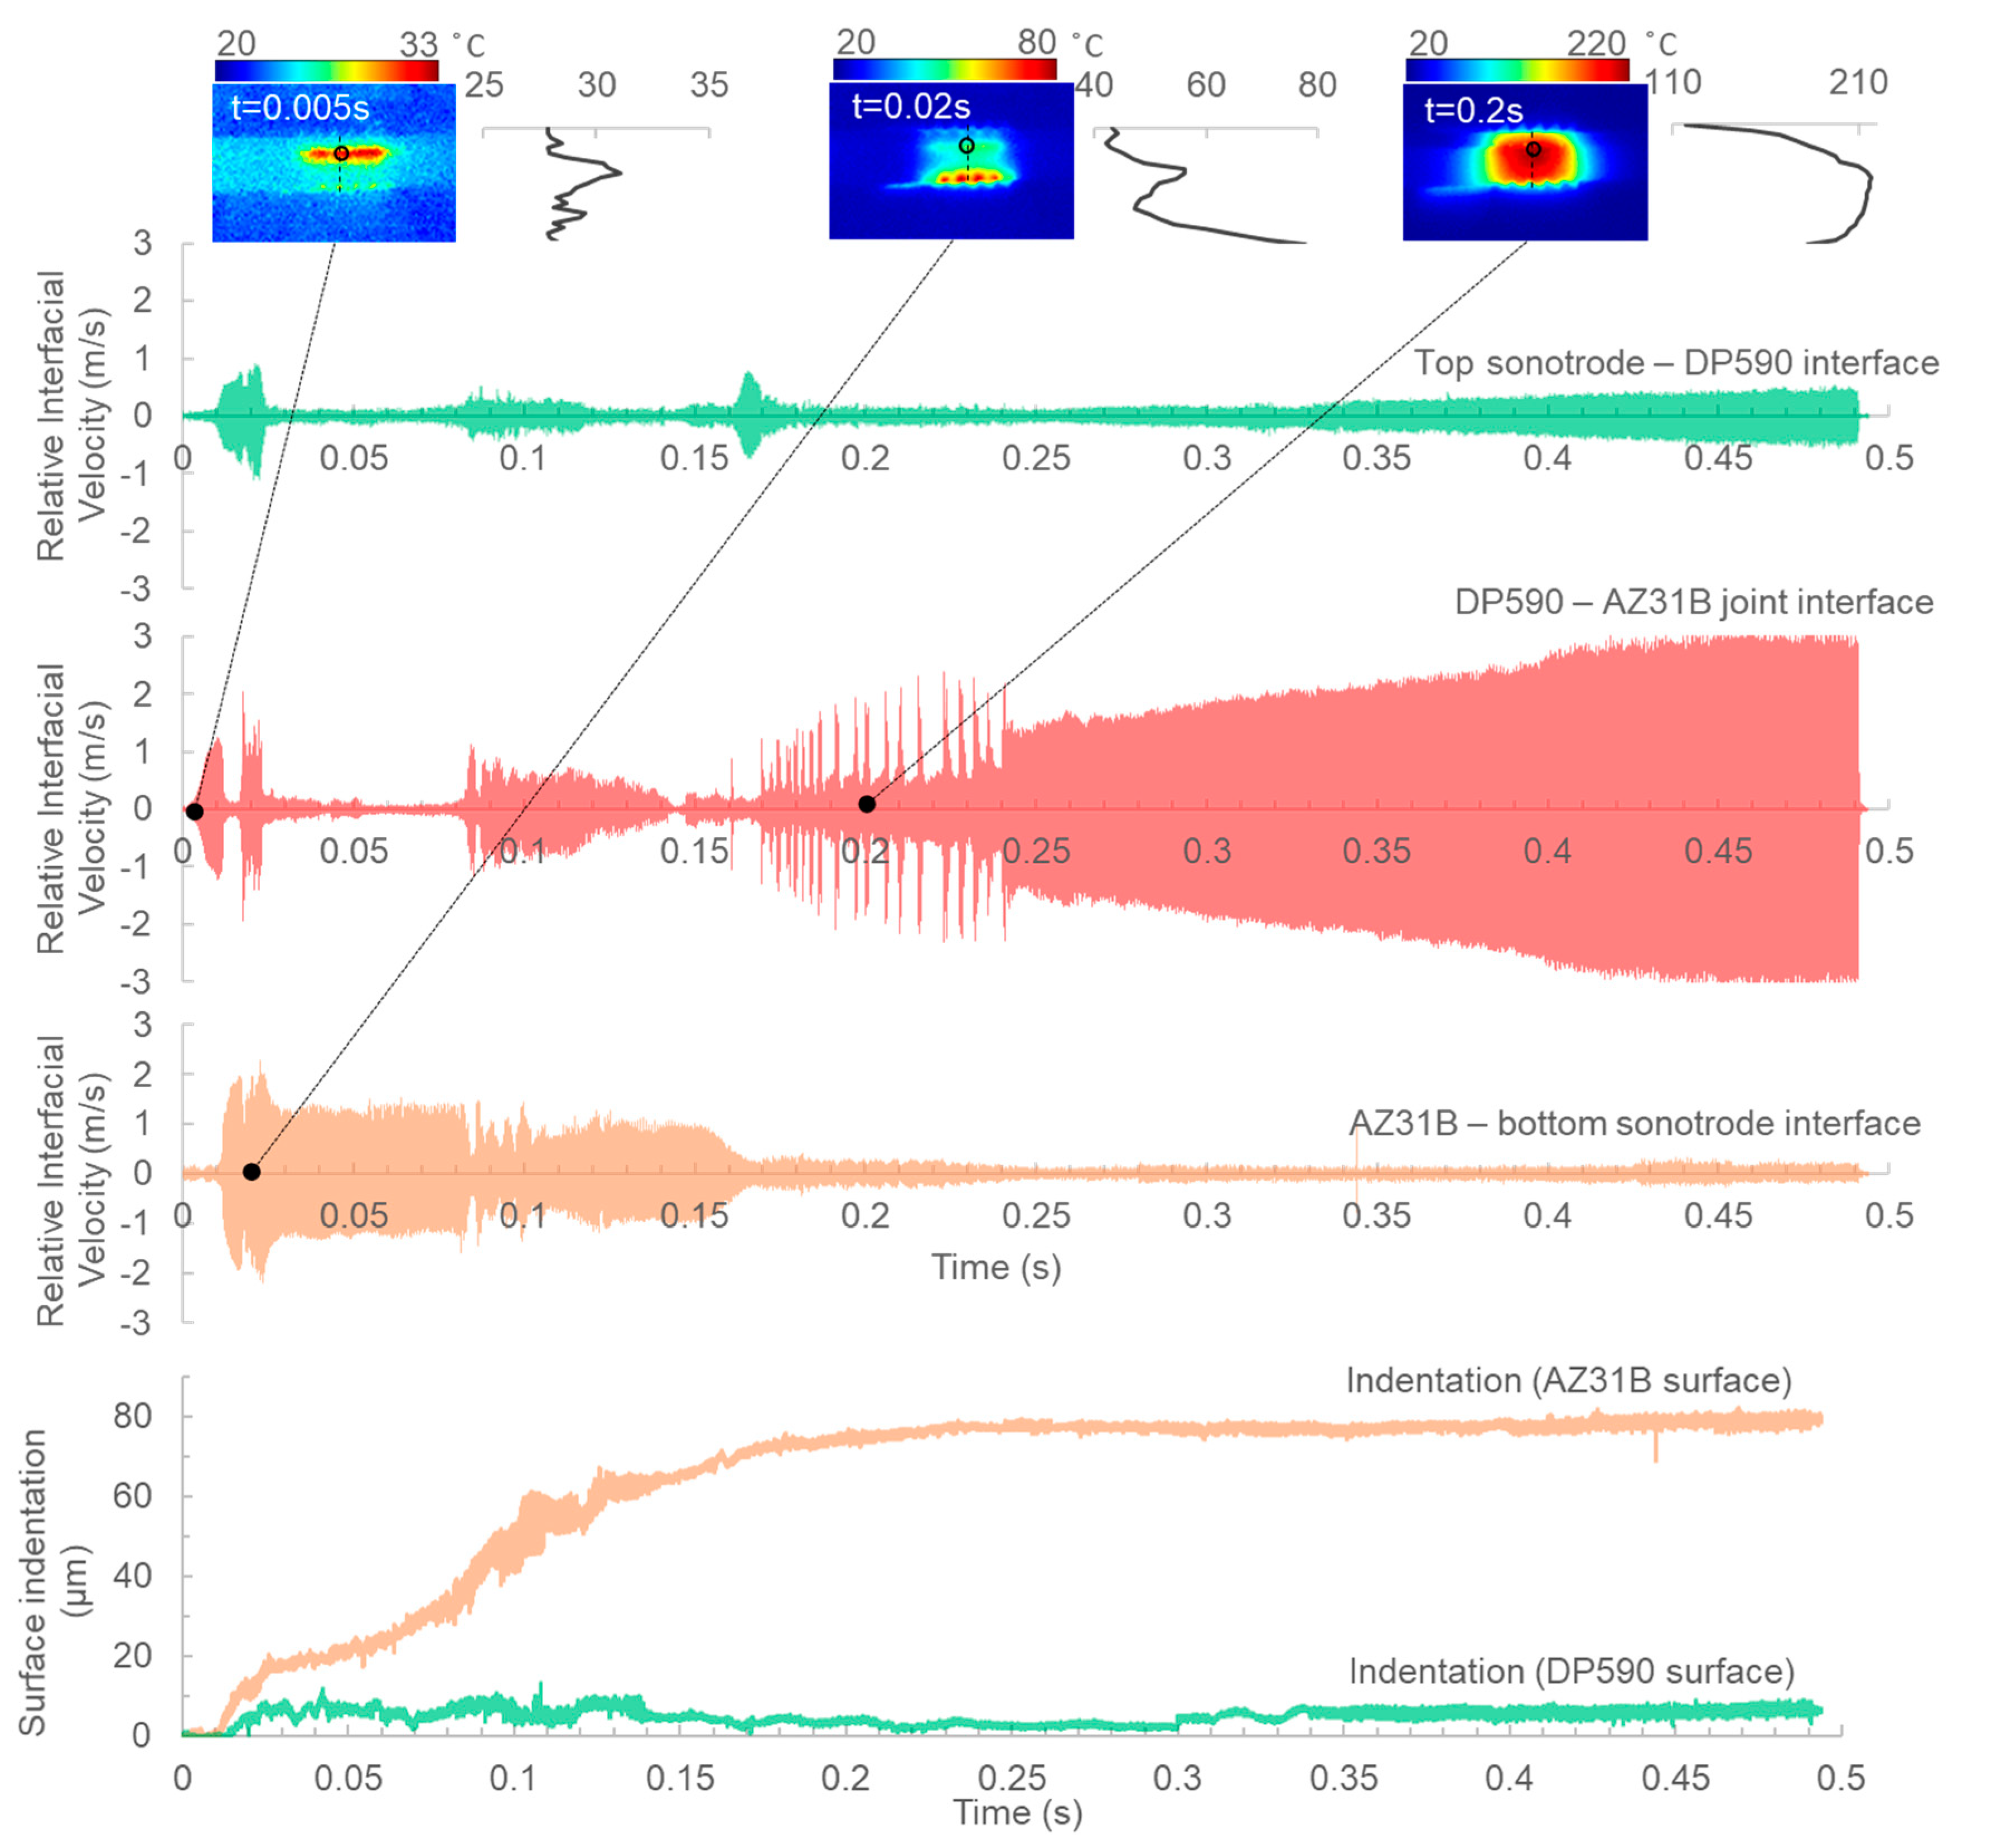
The relative velocity at all three interfaces were further calculated as shown in Figure 2. Details of the approach can be found in a recent publication by the authors [15]. Meanwhile, surface indentation depth on both sides created by the sonotrode teeth was also monitored by the similar DIC approach, and the heat generation across the interfaces were measured by the infrared sensing approach. By examining the high-speed image frames, the high relative velocity (above 0.5 m/s) regions in the curves appear to correspond to the moments in time when interfacial sliding was observed. In contrast, when the materials across the interface got stuck or bonded together, the relative velocity amplitude was relatively low. It is noted that the measurement points tracked by the DIC approach were 0.2 mm apart from the interfaces. Thus, the measured relative velocity at a stuck or joined interface was non-zero due to shear deformation. From the relative velocity curves in Figure 2, the interfacial sliding was first observed at the DP590–AZ31B joint interface, and it then switched back and forth among all three interfaces within the first 0.17 s, although most of the sliding occurred at the AZ31B–bottom sonotrode interface. Such a sliding/sticking motion was similar to those discovered during the USW of AZ31B [15]. The phenomenon was associated with the following factors: (1) dynamic change of friction coefficient among the three interfaces and (2) formation and destruction of localized microscale bonds [15]. During the same time period (0~0.17 s), the indentation depth on the AZ31B interface created by the bottom sonotrode teeth quickly increased to around 70 μm. From 0.17 s to the end of the welding, the sliding motion switched permanently from the AZ31B–bottom sonotrode interface to the DP590–AZ31B joint interface. This could be a result of rapidly increased indentation on the AZ31B surface developed before 0.17 s that helped to lock down the AZ31B–bottom sonotrode interface. The indentation depth on the AZ31B surface only slightly increased from 70 to 75 μm from 0.17 to 0.49 s. The change of indentation during welding could be a result of hardness change on the AZ31B side as a function of temperature [21] as well as the surface material removal due to scribing. Since DP590 is much stronger than AZ31B, the indentation on the DP590 surface only increased by 5 μm through the entire welding process, which is much shallower than that created on the AZ31B surface. Another interesting phenomenon is the increasing velocity amplitude at the DP590–AZ31B joint interface from 0.17 s to the end. This could be a result of the decrease of the yield strength of the zinc coating with increasing temperature [22], which reduced the resistance against the shear motion.
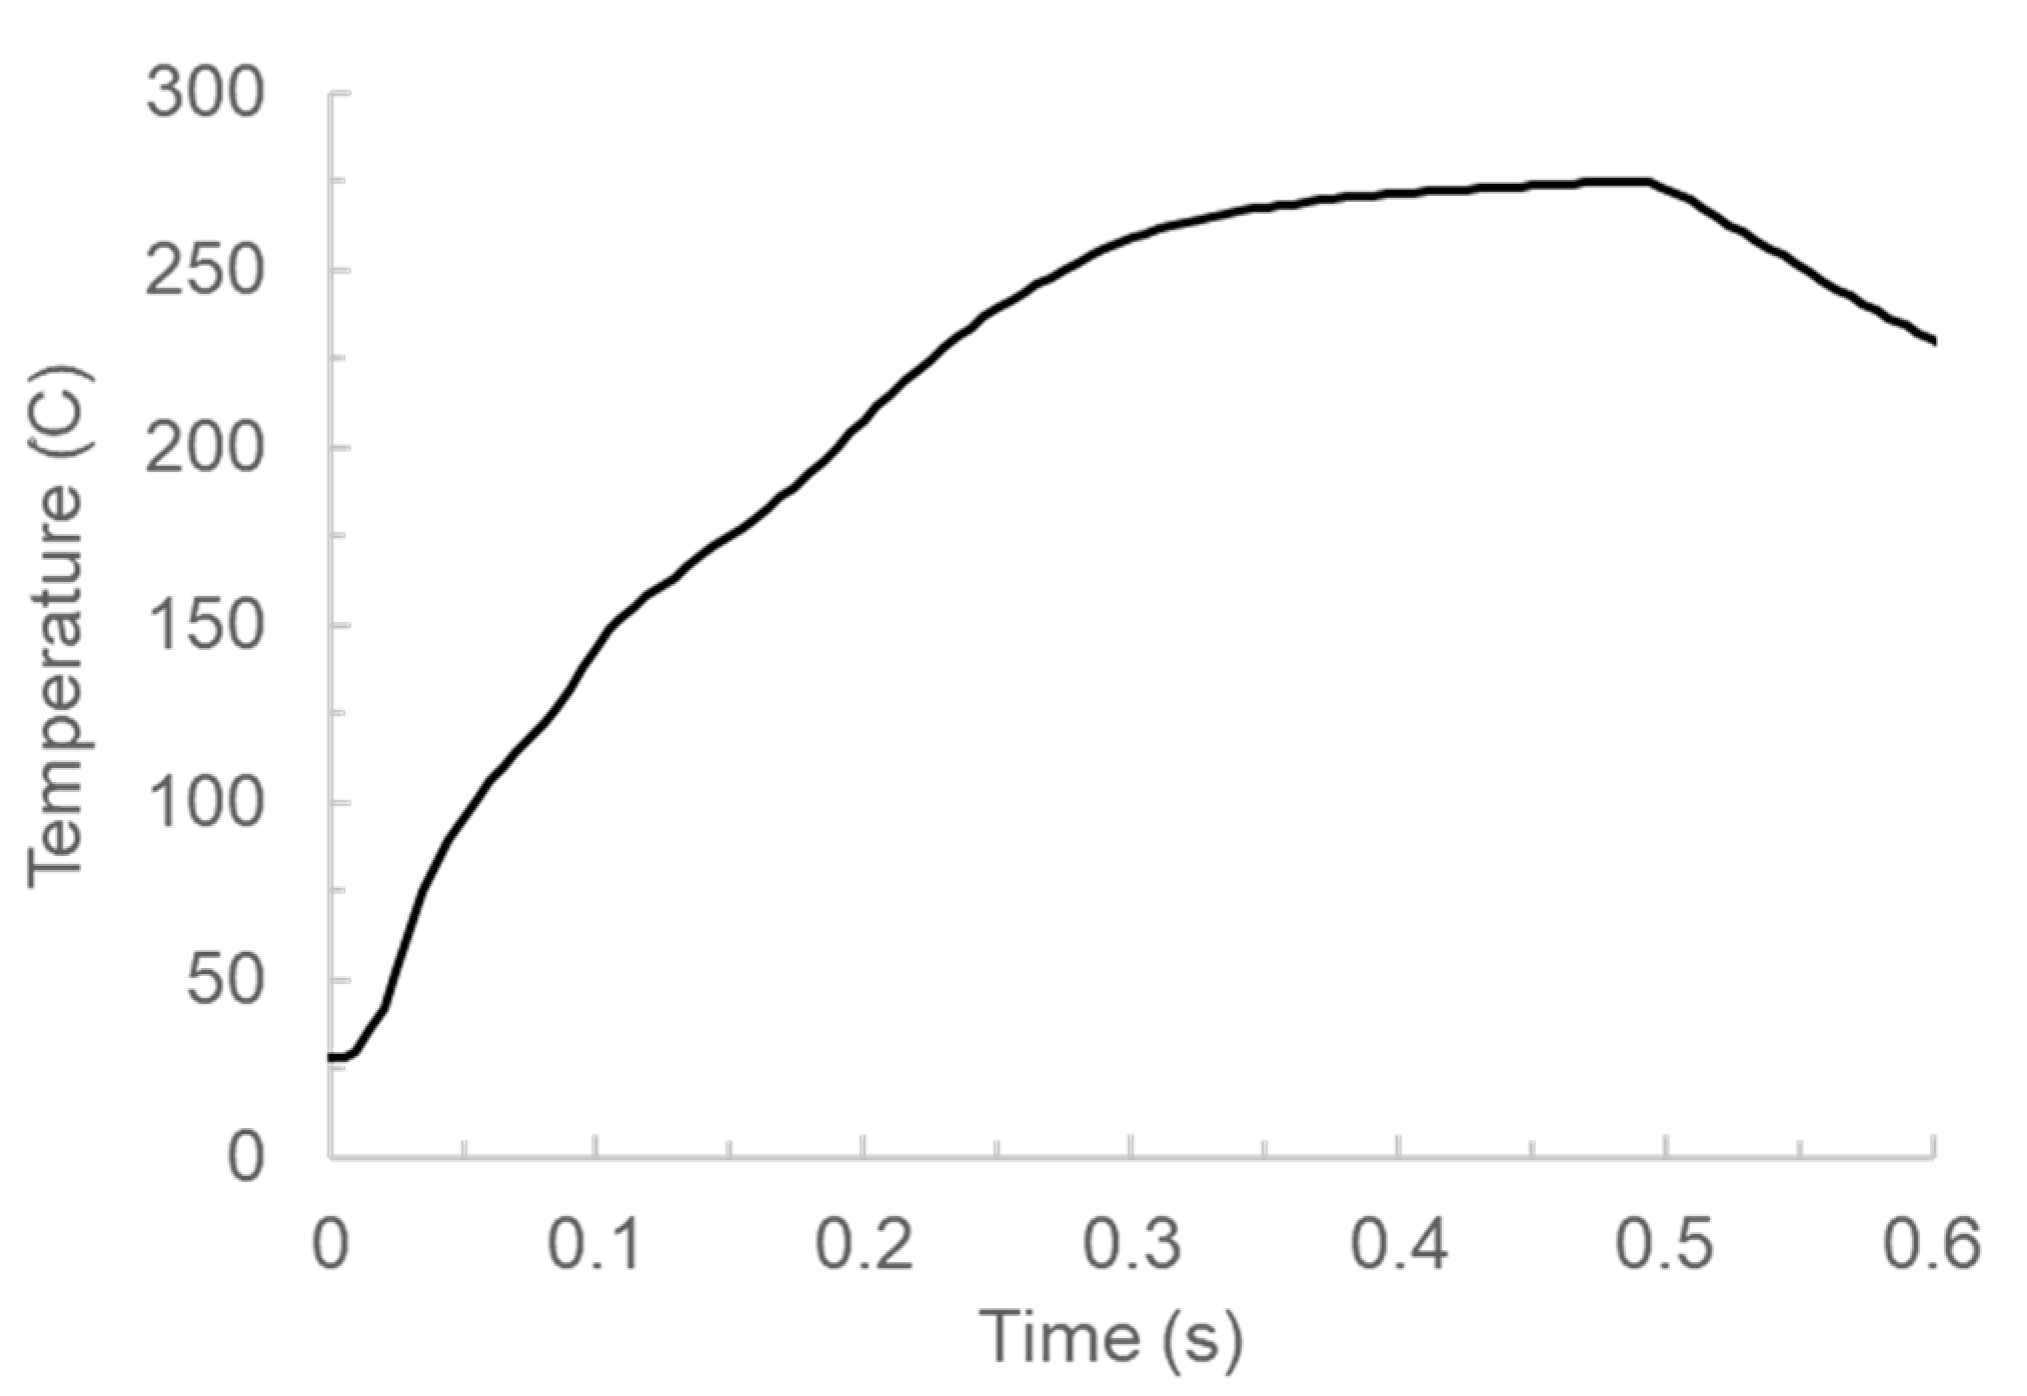
The inserted color maps above the velocity curves in Figure 2 represent the temperature distribution across the interfaces at different time frames, and the numbers on the color bars are in unit of Celsius. The transient interfacial heat generation shifted from interface to interface, and it could be associated with the reciprocating interfacial sliding (relatively high amplitude of interfacial velocity) occurring at the corresponding interfaces. At 0.005 s, the increase of temperature first occurred at the DP590–AZ31B joint interface (the location of this joint interface is indicated by a small circle in the inserted temperature plots). Correspondingly, first sliding was observed at the same interface. The line plot (the curves between the inserted temperature plots in Figure 2) along the cross-sectional centerline shows that the peak temperature at the DP590–AZ31B joint interface was 32 °C, and the temperature near the two sonotrodes was approximately 26 °C. At 0.02 s, the maximum relative velocity was observed at the AZ31B–bottom sonotrode interface, although sliding was occurring at all interfaces. Thus, the location of maximum temperature rise shifted to the AZ31B–bottom sonotrode interface (from 26 to 80 °C). At 0.2 s, the highest temperature shifted back to the DP590–AZ31 joint interface, since sliding was only occurring at this interface from 0.17 s to the end of welding. Such an association between interfacial heat generation and relative motion was also observed when welding AZ31B similar welds [15]. The temperature history at the center of the DP590–AZ31B joint interface (indicated by the small circle in the inserted temperature plots in Figure 2) monitored by the infrared camera is plotted in Figure 3. The maximum temperate reached 275 °C at the end of welding (0.5 s). It is noted that this center was located on the edge of the material stack that was exposed to the air during welding. The internal maximum temperature was expected to be higher.
3.2. Lap Shear Strength and Fatigue Life of USW Joints
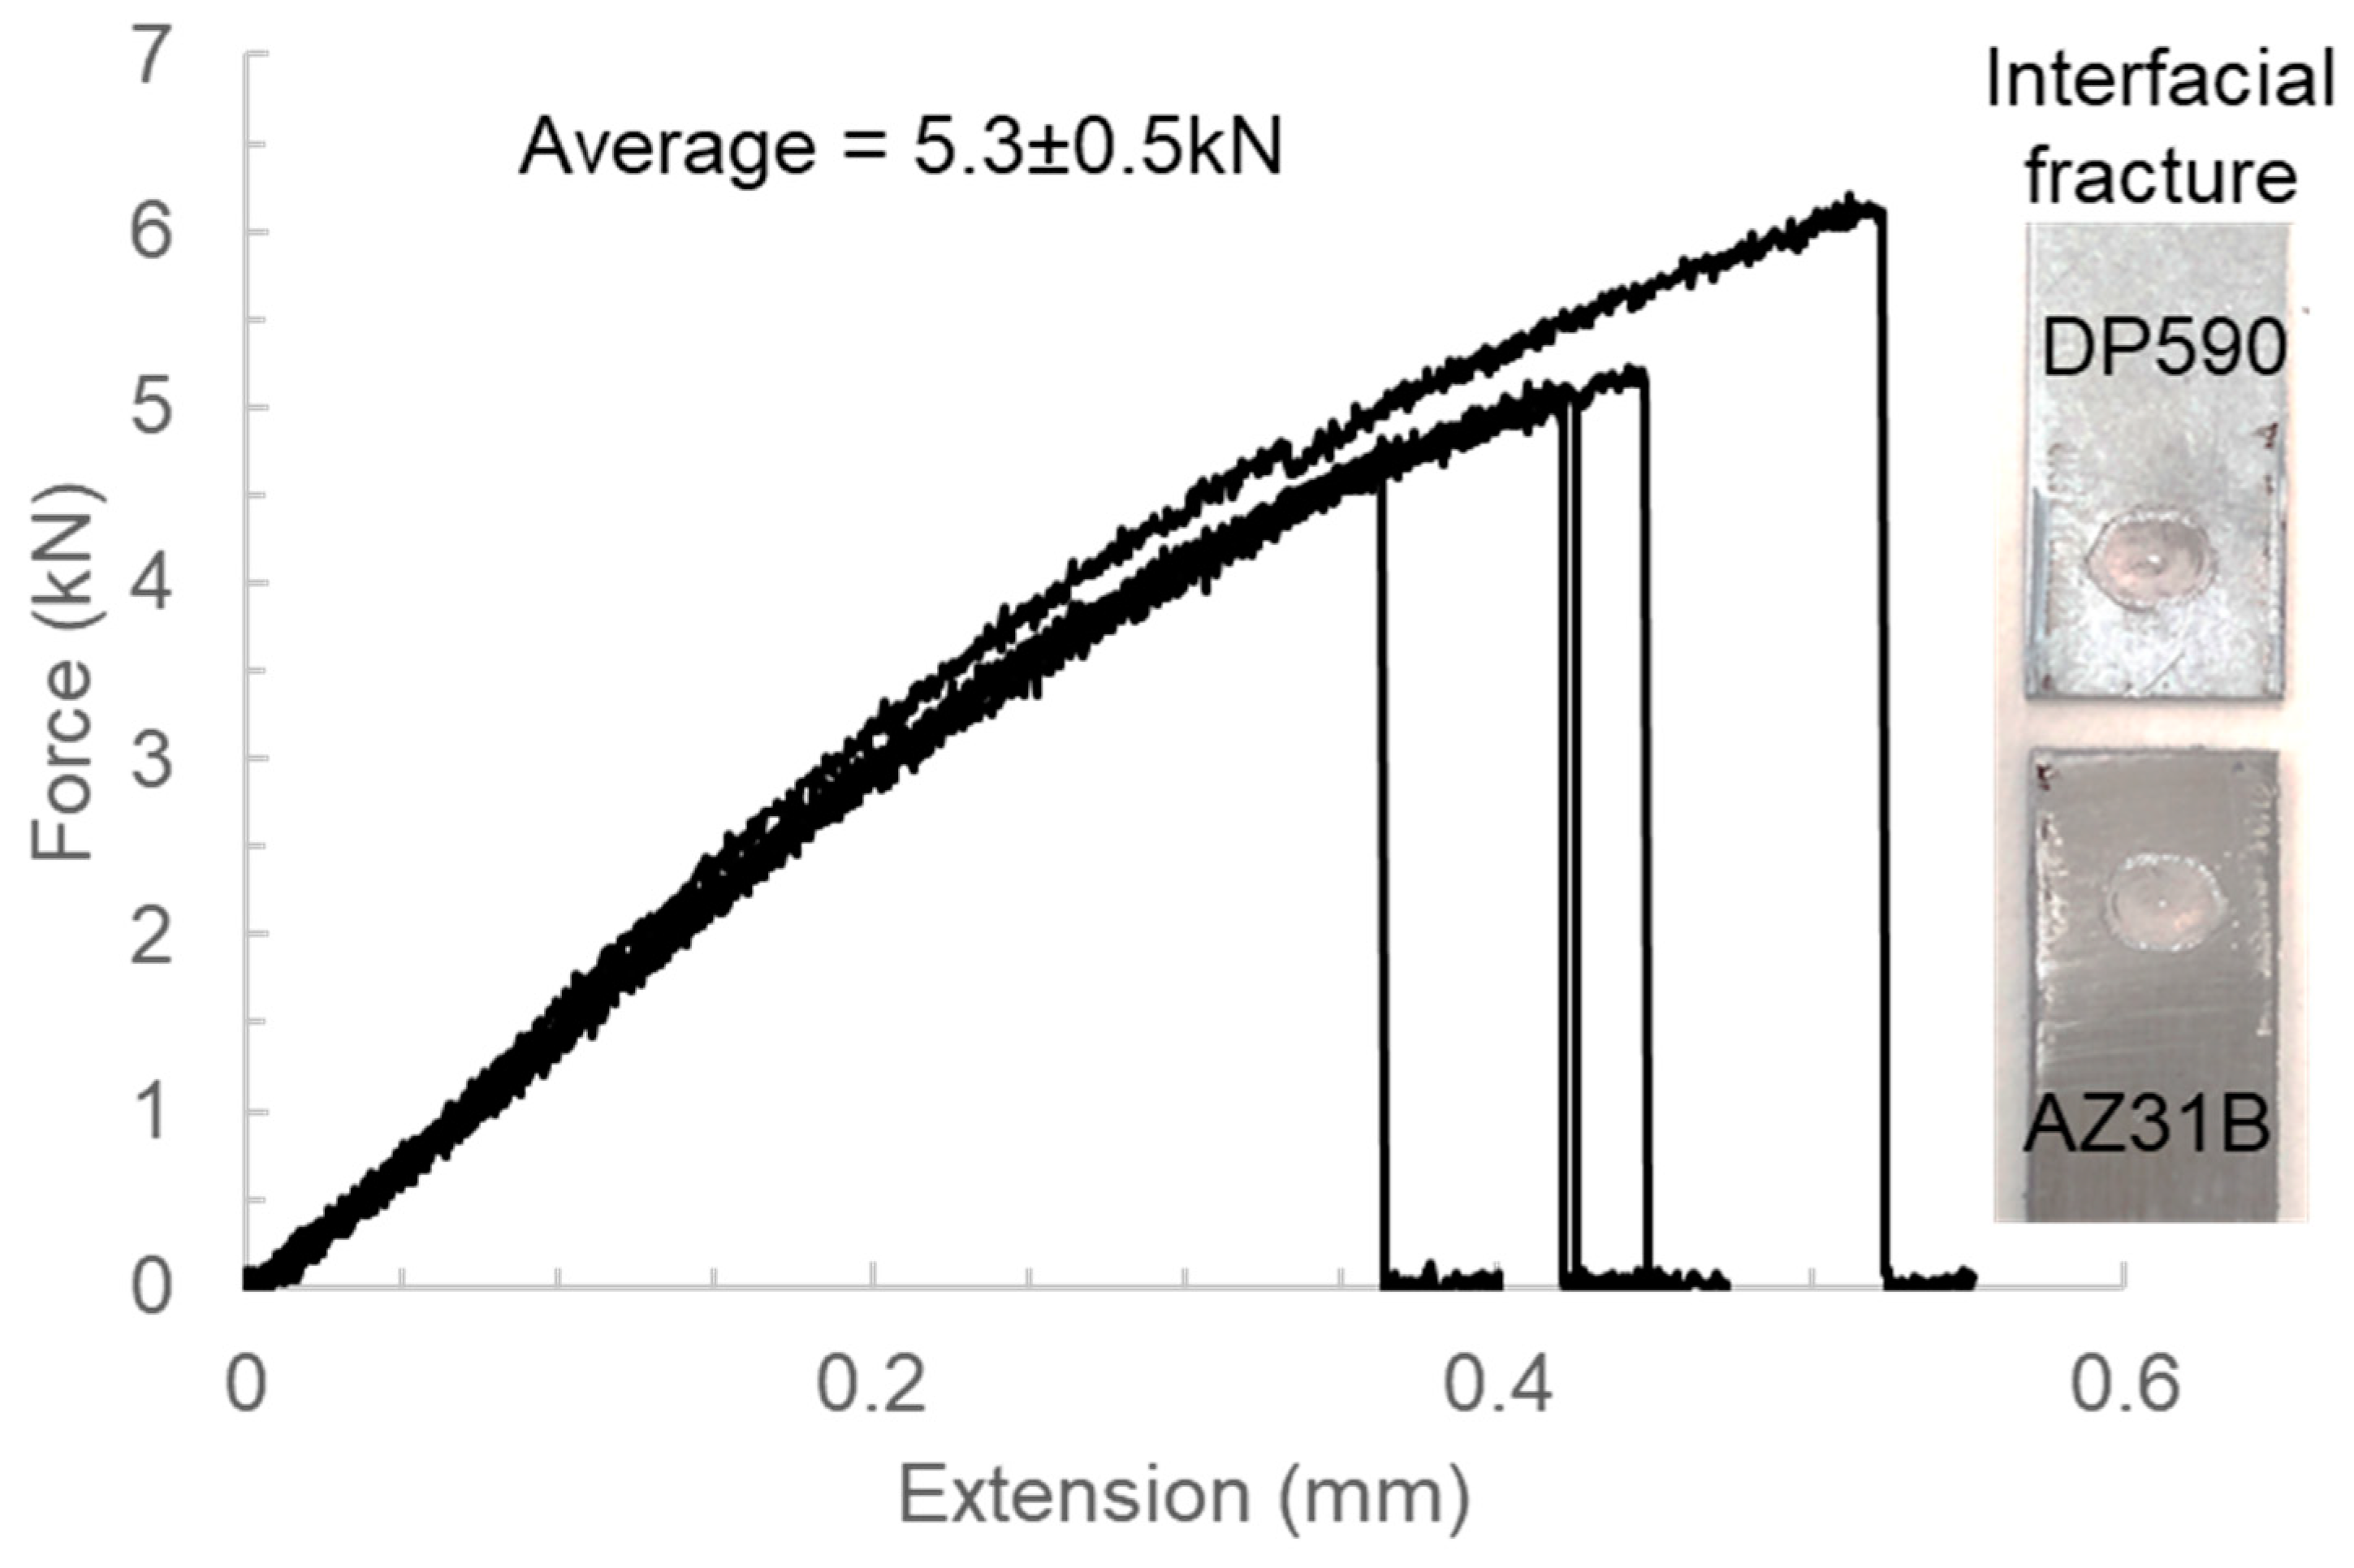
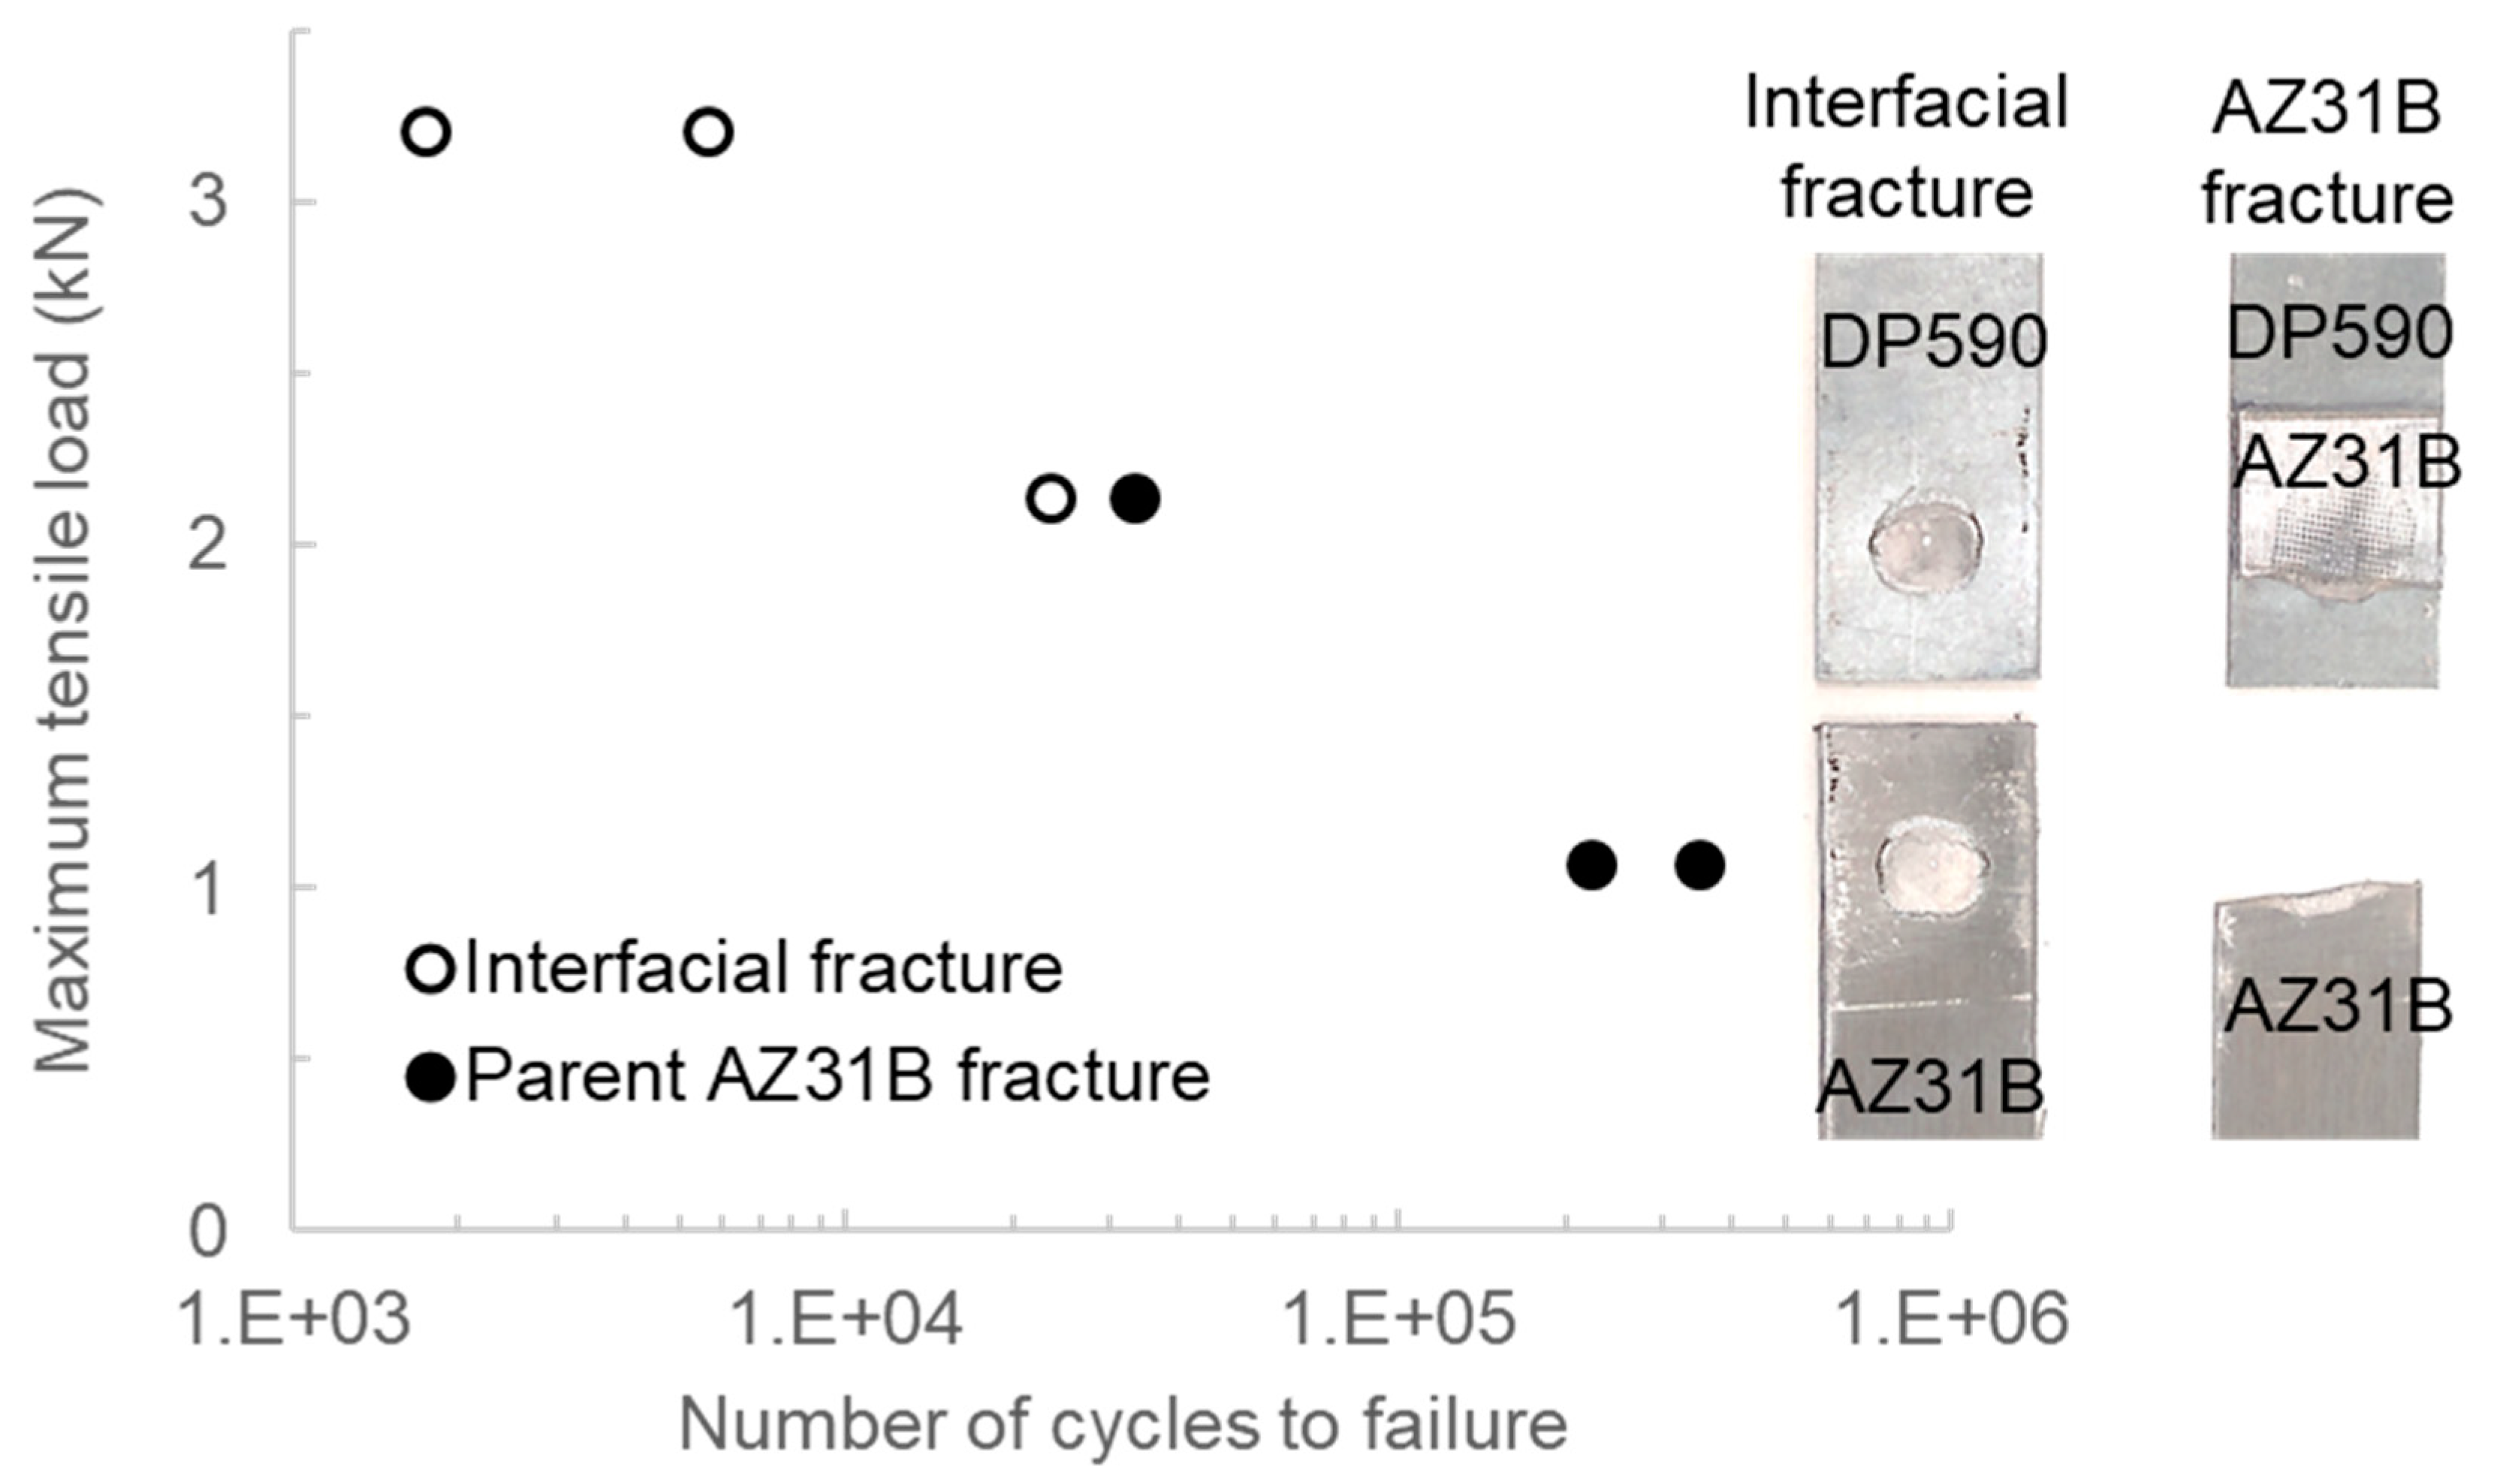
Five lap shear tensile tests were performed for weld coupons made in the Experimental Setup 2 condition as listed in Table 1. As plotted in the force–extension curves in Figure 4, the maximum tensile strength ranged from 4.7 to 6.2 kN. The average maximum tensile load was 5.3 kN with a standard deviation of 0.5 kN. All five weld coupons failed at the joint faying interface, as shown in the inserted image in Figure 4. Figure 5 shows the relationship between maximum lap shear tensile load and the number of cycles to failure during fatigue testing. Overall, the fatigue life increased with decreasing maximum tensile load, ranging from 1.74 × 10³ cycles to 3.52 × 10⁵ cycles when the maximum tensile load decreased from 60% to 20% of the average peak load measured in the static lap shear tension tests. Two fatigue failure modes occurred: interfacial fracture at the joint faying interface and parent AZ31B fracture. As indicated in Figure 5, the fatigue failure modes depend on the magnitude of applied load. When the maximum tensile load was at 3.2 kN (60% of the average peak load in lap shear tension tests), fracture occurred at the faying interface, similar to the fracture mode observed in lap shear tests. When the maximum tensile load decreased to 1.1 kN (20% of the average peak load in lap shear tension tests), fracture occurred in the parent AZ31B sheets. A transition region around 2.1 kN maximum tensile load (40% of the average peak load in lap shear tension tests) was noted where fatigue fracture could happen in either the parent AZ31B sheet or at the joint interface. Such a relationship between the fatigue fracture mode and the amplitude of the maximum tensile load is consistent to that discovered on Mg/Mg and Mg/steel refill friction stir spot welds [23]. During fatigue testing, the crack could propagate either along the Mg/steel faying surface or through the Mg base metal [23]. At high maximum tensile loads, such as the situation in the static lap shear testing, the failure or fracture was dominated by the strength of the IMC layer. So, the fracture occurred at the Mg/steel faying surface with low fatigue cycles, and the fracture surface was overall brittle [23]. While at low maximum tensile loads with high fatigue cycles, the fracture was dominated by crack propagation. The propagation rate in the Mg base metal was much faster than that of the Mg/steel interface [24]. Thus, the fracture mostly occurred in the parent AZ31B sheet.
3.3. Microstructural Characterization
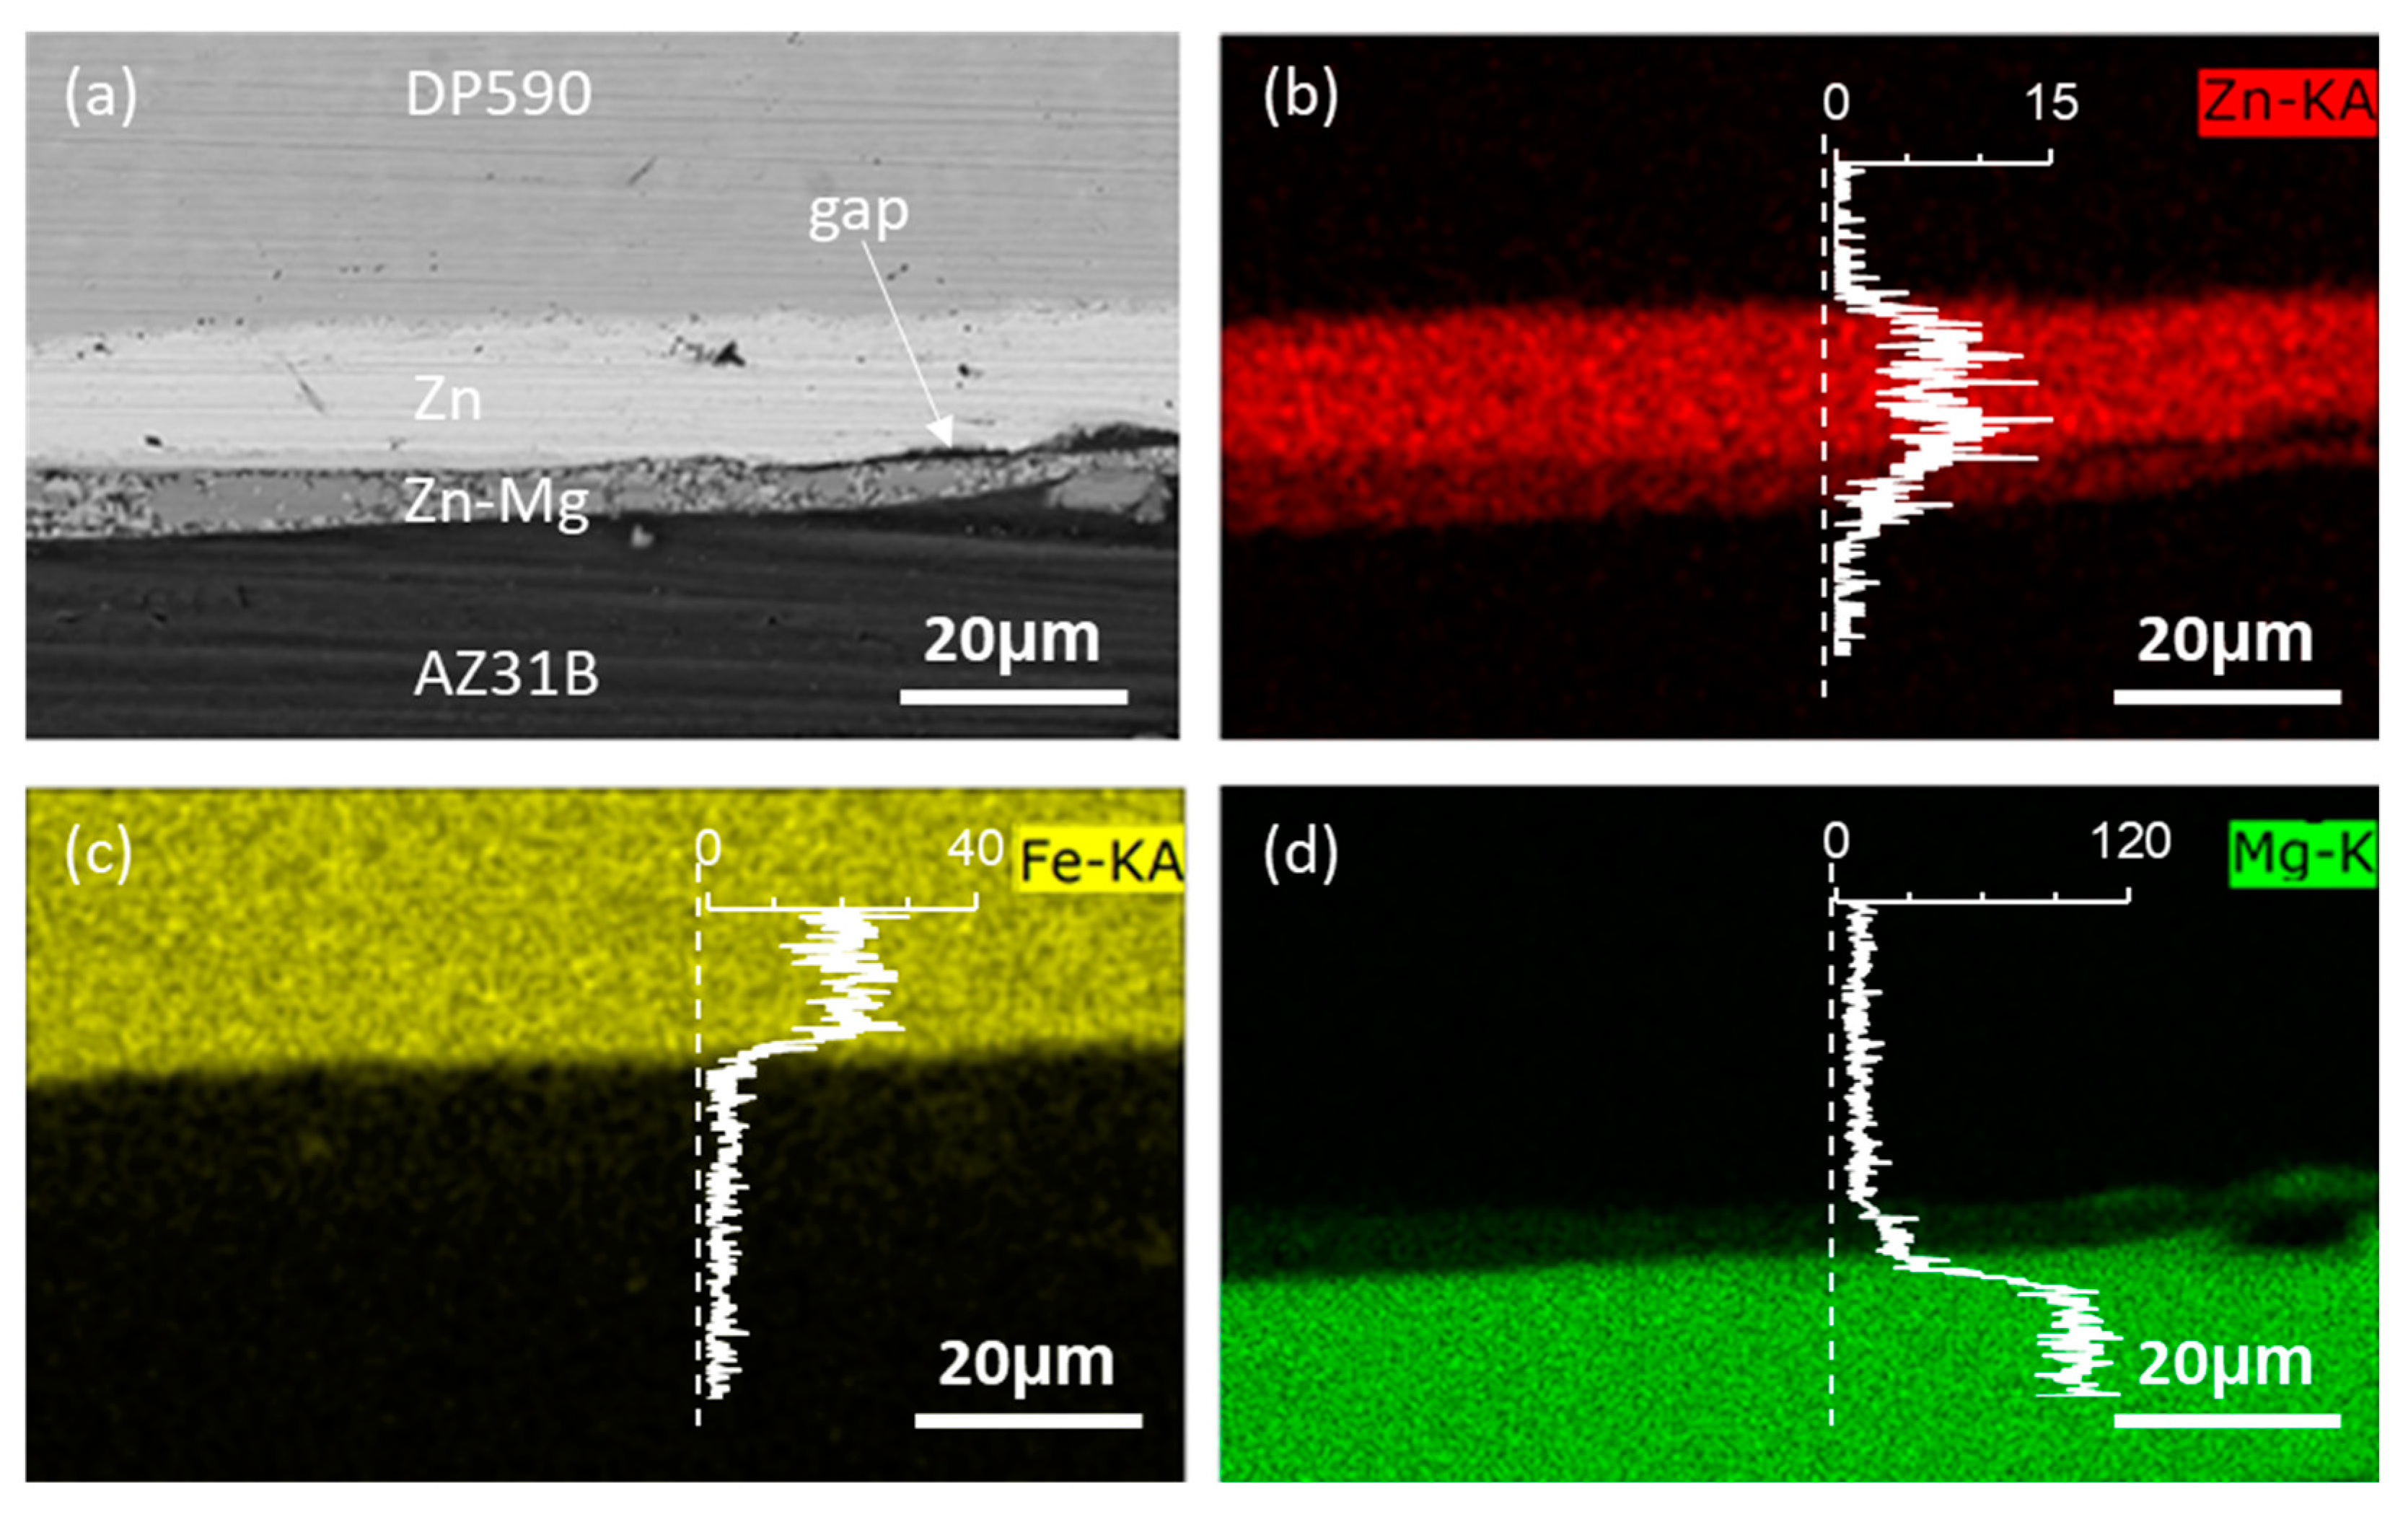
The SEM image in Figure 6a shows the morphology of the cross-section at the center of the joint interface on welds produced with low welding energy (Experimental Setup 1 condition as listed in Table 1). The distribution of the major chemical composition (Zn, Fe, and Mg) in the same area is shown in Figure 6b–d respectively. Considering that the maximum temperature at 275 °C was measured at the edge of the stacked sheets during the welding experiment as shown in Figure 3, the internal temperature would be higher than 275 °C and close to the Mg–Zn eutectic reaction temperature at 341 °C, suggesting the formation of a Zn–Mg reaction layer [18]. Hence, a layer of Zn–Mg region with a thickness of 5 μm was observed between Mg and Zn, as shown in Figure 6a. The total thickness of the Mg–Zn reaction layer and the remaining Zn layer was approximately 20 μm, which was much less than the as-received Zn coating thickness (ranging from 50 to 70 μm). The reduction of the thickness was a result of the vibrational shear motion at the interface, which squeezed a portion of the Zn out of the faying surface. After further inspection of the line scan data along the dashed line in Figure 6b–d, it was found that the average counts of Zn and Mg in the Mg–Zn reaction layer were approximately 4 and 30. The presence of a gap between the Zn layer and the Zn–Mg reaction layer indicates that an overall strong bond has not formed, which gave rise to the sliding motion (high amplitude of the relative interfacial velocity) at the DP590–AZ31B faying interface toward the end of the welding process, as shown in Figure 2.
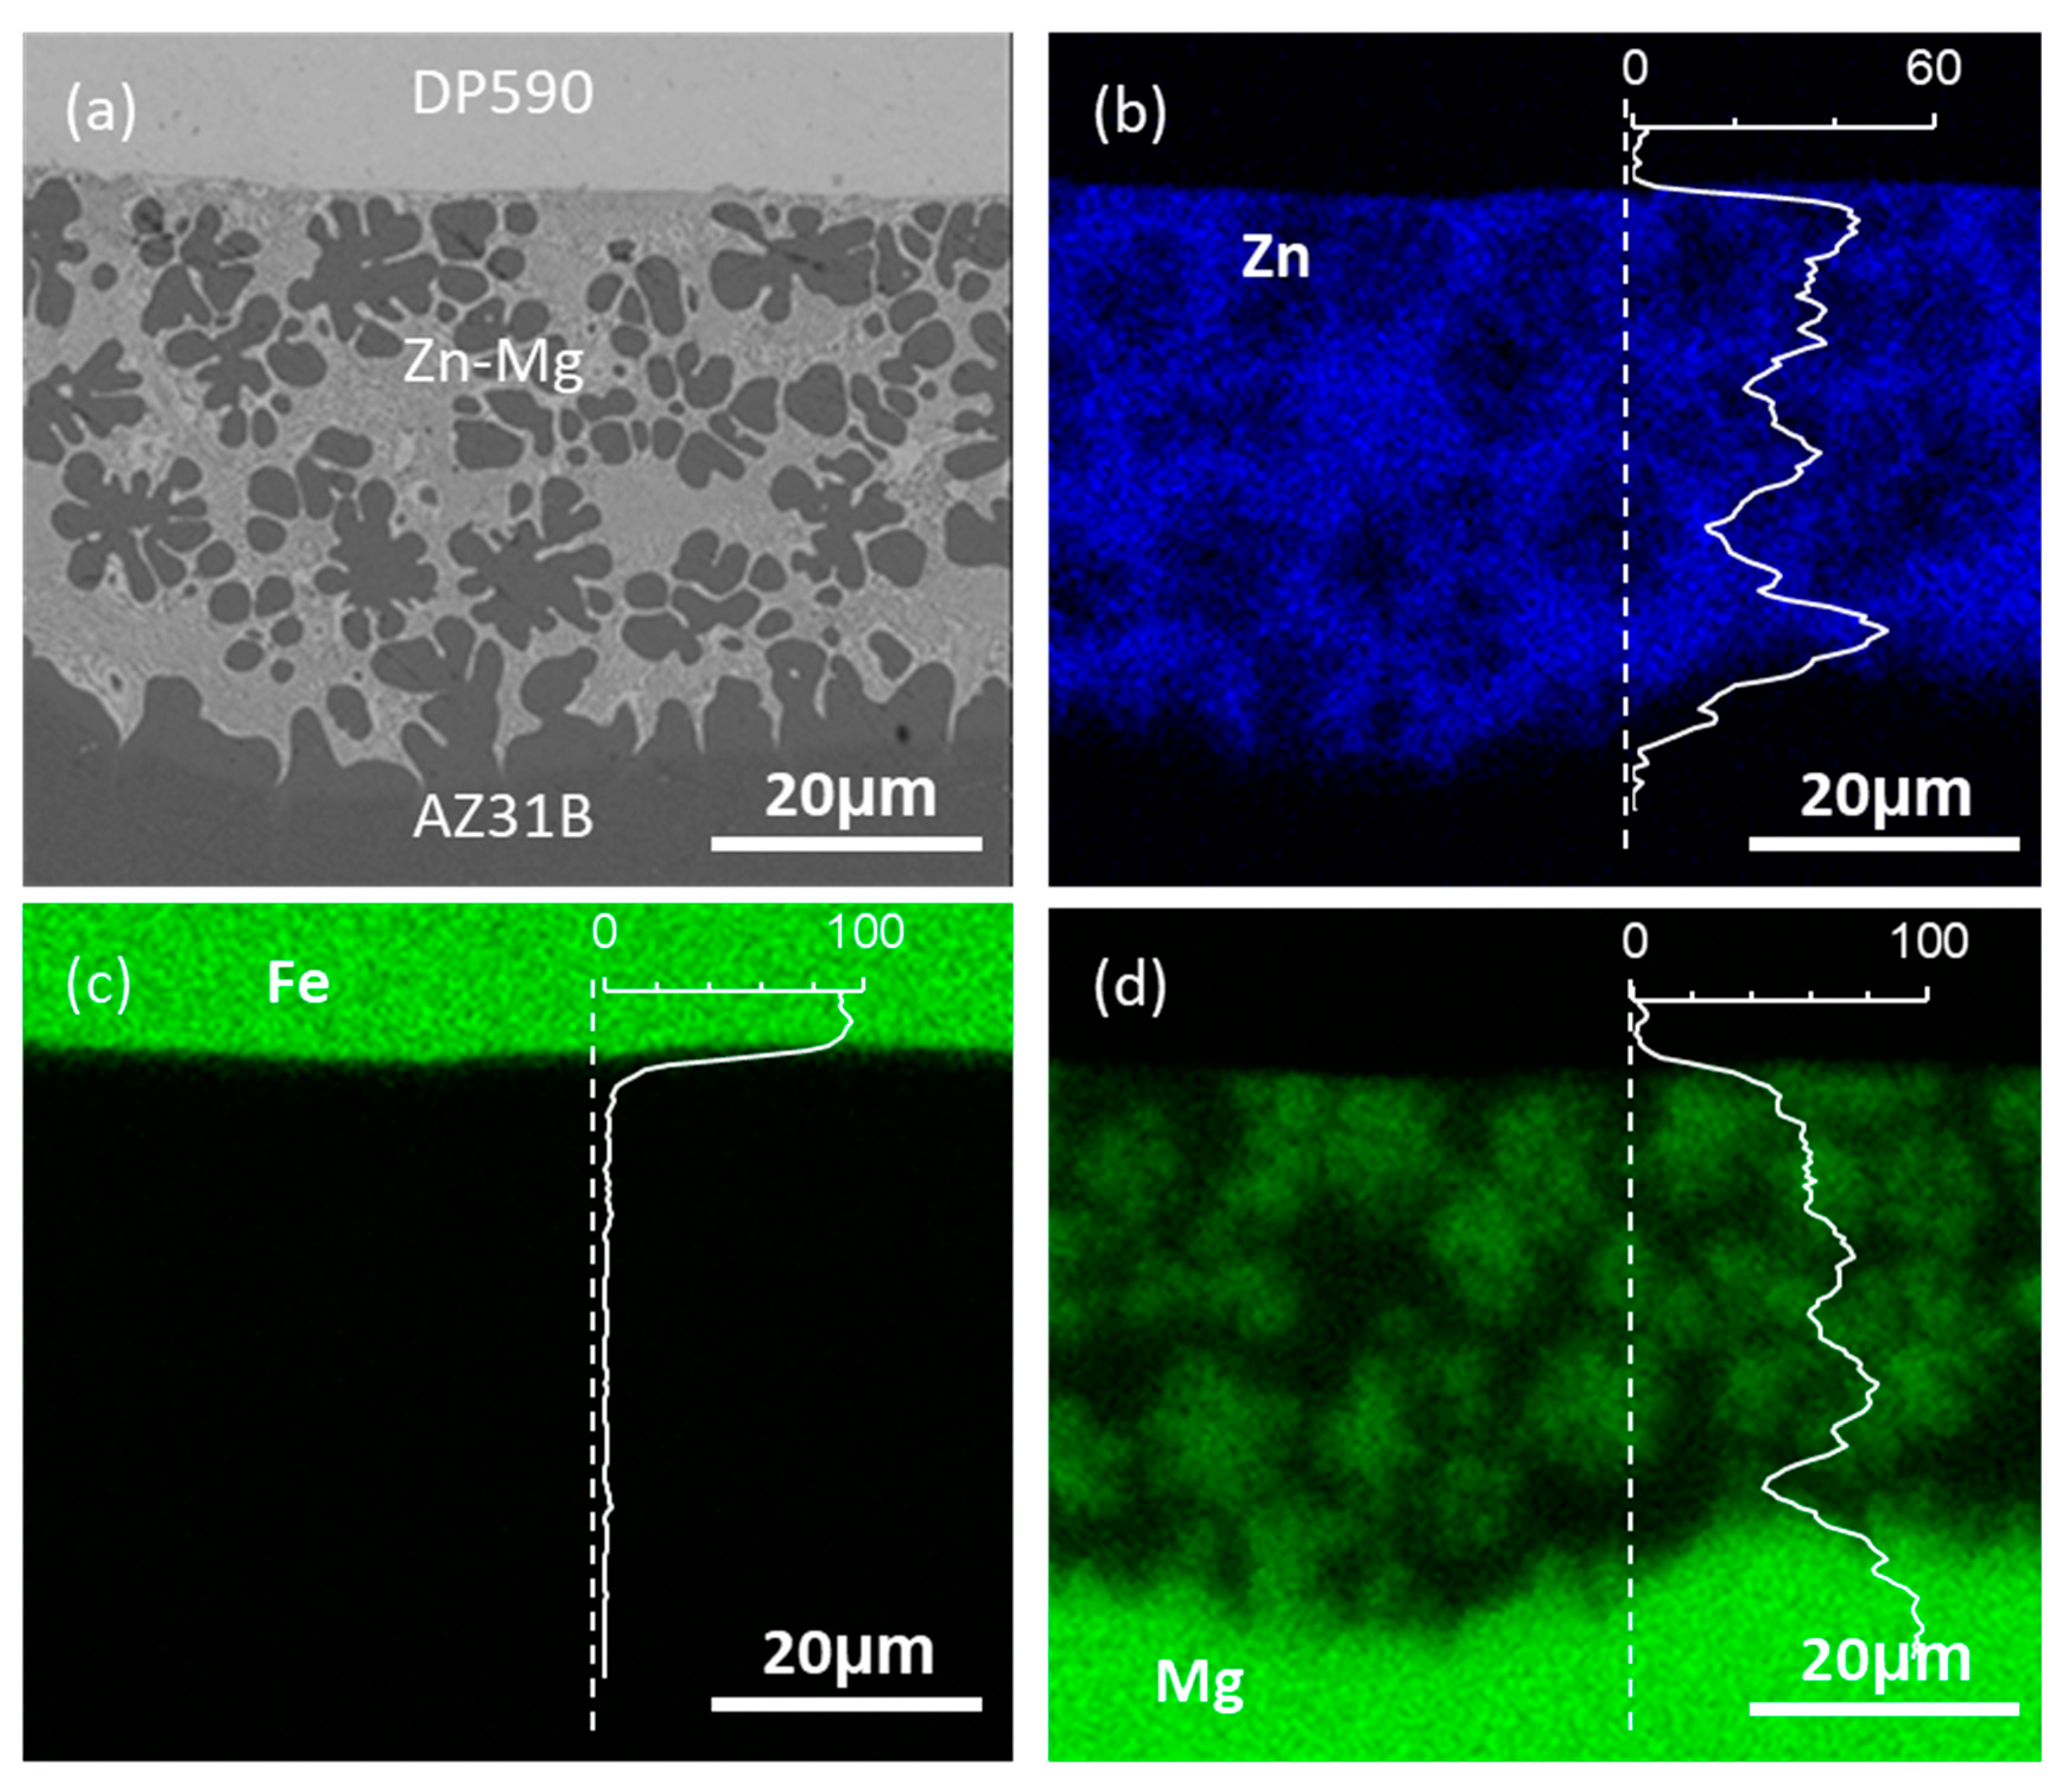
The SEM and EDS analysis on the welds made with the high welding power input and long welding time (using Experimental Setup 2 as listed in Table 1) are shown in Figure 7. Since the interface was expected to experience a much higher temperature for a much longer time period, the original Zn coating layer has completely transformed to a Zn–Mg reaction layer, as shown in Figure 7. The total thickness of this layer was 30 μm, which was also much less than the as-received Zn coating thickness (ranging from 50 to 70 μm). The morphology of the Zn–Mg layer in Figure 7 (high welding energy) was different from that in Figure 6 (low welding energy). The line scan data along the dashed line in Figure 7b–d shows that the Zn counts within the Zn–Mg reaction layer varied from 15 to 50 and the Mg counts varied from 50 to 55. No gap was observed at the joint interface, suggesting the formation of a stronger bond, which explains the reasonable lap shear strength measured in the tensile tests, as shown in Figure 4.
4. Conclusions
Interfacial sliding and the corresponding heat generation was alternatively observed across the joint faying interface and the sheet/sonotrode interfaces when making a AZ31B-DP590 USW joint using a moderate energy input (1000 W for 0.5 s). The switch of sliding motion from interface to interface could be associated with the dynamic change of friction coefficient among the interfaces, the competing formation–destruction process of localized microscale bonds, as well as the evolution of sonotrode teeth indentation that created an interlocking between sonotrodes and base metals. For the weld coupons made with high energy input (3500 W for 4 s), interfacial fracture occurred after lap shear static loading tests and fatigue tests under high maximum load. With low maximum load, fatigue fracture occurred in the AZ31B parent material. The morphology and chemical composition at the joint interface varied depending upon the welding conditions. With low welding energy, a fraction of the Zn coating layer reacted with the Mg and formed a Zn–Mg reaction layer. However, such a welding condition did not create enough heat input to form a strong bond, and gaps were observed between the Zn and the Zn–Mg reaction layers. With increased welding energy, the entire Zn layer transformed to the Zn–Mg reaction layer with no gap observed at the joint interface. As a result, a reasonable lap shear strength was obtained.
Author Contributions
Conceptualization, Z.F. and X.S.; investigation, J.C., Y.C.L., D.L. and H.H.; writing—original draft preparation, J.C.; supervision, Z.F. All authors have read and agreed to the published version of the manuscript.
Funding
This research was sponsored by the US Department of Energy, Office of Energy Efficiency and Renewable Energy, Vehicle Technologies Office, under a prime contract with Oak Ridge National Laboratory (ORNL).
Acknowledgments
ORNL is managed by UT-Battelle, LLC for the U.S. Department of Energy under Contract DE-AC05-00OR22725. The authors would like to appreciate POSCO and U.S. Steel providing materials for the project.
Conflicts of Interest
The authors declare no conflict of interest.
Notice of Copyright
This manuscript has been authored by UT-Battelle, LLC under Contract No. DE-AC05-00OR22725 with the U.S. Department of Energy. The United States Government retains and the publisher, by accepting the article for publication, acknowledges that the United States Government retains a non-exclusive, paid-up, irrevocable, world-wide license to publish or reproduce the published form of this manuscript, or allow others to do so, for United States Government purposes. The Department of Energy will provide public access to these results of federally sponsored research in accordance with the DOE Public Access Plan (http://energy.gov/downloads/doe-public-access-plan).
References
- Kulekci, M.K. Magnesium and its alloys applications in automotive industry. Int. J. Adv. Manuf. Technol. 2008, 39, 851–865. [Google Scholar] [CrossRef]
- Song, G.; Li, T.; Yu, J.; Liu, L. A review of bonding immiscible Mg/steel dissimilar metals. Materials 2018, 11, 2515. [Google Scholar] [CrossRef] [PubMed] [Green Version]
- Miao, Y.G.; Han, D.F.; Yao, J.Z.; Li, F. Effect of laser offsets on joint performance of laser penetration brazing for magnesium alloy and steel. Mater. Des. 2010, 31, 3121–3126. [Google Scholar] [CrossRef]
- Miao, Y.G.; Han, D.F.; Xu, X.; Wu, B. Phase constitution in the interfacial region of laser penetration brazed magnesium–steel joints. Mater. Charact. 2014, 93, 87–93. [Google Scholar] [CrossRef]
- Wang, X.Y.; Sun, D.Q.; Sun, Y.; Ding, Z.Q. Effects of Cu addition on microstructure characteristics and tensile behaviors of metal inert-gas arc welded Mg-steel dissimilar joints. Mater. Trans. 2015, 56, 1868–1874. [Google Scholar] [CrossRef] [Green Version]
- Feng, Y.Q.; Li, Y.; Luo, Z.; Ling, Z.X.; Wang, Z.N. Resistance spot welding of Mg to electro-galvanized steel with hot-dip galvanized steel interlayer. J. Mater. Process. Technol. 2016, 236, 114–122. [Google Scholar] [CrossRef]
- Sun, D.Q.; Lang, B.; Sun, D.X.; Li, J.B. Microstructures and mechanical properties of resistance spot welded magnesium alloy joints. Mater. Sci. Eng. A 2007, 460–461, 494–498. [Google Scholar] [CrossRef]
- Cao, X.; Jahazi, M.; Immarigeon, J.P.; Wallace, W. A review of laser welding techniques for magnesium alloys. J. Mater. Process. Technol. 2006, 171, 188–204. [Google Scholar] [CrossRef]
- Jana, S.; Hovanski, Y.; Grant, G.J. Friction stir lap welding of magnesium alloy to steel: A preliminary investigation. Metall. Mater. Trans. A 2010, 41, 3173–3182. [Google Scholar] [CrossRef]
- Behmand, S.A.; Mirsalehi, S.E.; Omidvar, H.; Safarkhanian, M.A. Filling exit holes of friction stir welding lap joints using consumable pin tools. Sci. Technol. Weld. Join. 2015, 20, 330–336. [Google Scholar] [CrossRef]
- Wu, X.; Liu, T.; Cai, W. Microstructure, welding mechanism, and failure of Al/Cu ultrasonic welds. J. Manuf. Process. 2015, 20, 321–331. [Google Scholar] [CrossRef] [Green Version]
- Joshi, K.C. The formation of ultrasonic bonds between metals. Weld. J. 1971, 50, 840–848. [Google Scholar]
- Hulst, A.P. Macrosonics in industry 2: Ultrasonic welding of metals. Ultrasonics 1972, 10, 252–261. [Google Scholar] [CrossRef]
- Tsujino, J. Recent development of ultrasonic welding. In Proceedings of the 1995 IEEE Ultrasonics Symposium, Seattle, WA, USA, USA, 7–10 November 1995; Volume 2, pp. 1051–1060. [Google Scholar]
- Chen, J.; Lim, Y.C.; Huang, H.; Feng, Z.; Sun, X. Ultrasonic welding of AZ31B magnesium alloy. MRS Bull. 2019, 44, 630–636. [Google Scholar] [CrossRef]
- Matsuoka, S.I.; Imai, H. Direct welding of different metals used ultrasonic vibration. J. Mat. Proc. Technol. 2009, 209, 954–960. [Google Scholar] [CrossRef]
- Watanabe, T.; Sakuyama, H.; Yanagisawa, A. Ultrasonic welding between mild steel sheet and Al–Mg alloy sheet. J. Mat. Proc. Technol. 2009, 209, 5475–5480. [Google Scholar] [CrossRef]
- Santella, M.; Brown, E.; Pozuelo, M.; Pan, T.Y.; Yang, J.M. Details of Mg–Zn reactions in AZ31 to galvanised mild steel ultrasonic spot welds. Sci. Technol. Weld. Join. 2012, 17, 219–224. [Google Scholar] [CrossRef]
- Patel, V.K.; Chen, D.L.; Bhole, S.D. Dissimilar ultrasonic spot welding of Mg-Al and Mg-high strength low alloy steel. Theor. Appl. Mech. Lett. 2014, 4, 041005. [Google Scholar] [CrossRef] [Green Version]
- Chen, J.; Yu, X.; Miller, R.G.; Feng, Z. In situ strain and temperature measurement and modelling during arc welding. Sci. Technol. Weld. Join. 2015, 20, 181–188. [Google Scholar] [CrossRef]
- Malheiros, L.R.C.; Figueiredo, R.B.; Langdon, T.G. Grain size and microhardness evolution during annealing of a magnesium alloy processed by high-pressure torsion. J. Mater. Res. Technol. 2015, 4, 14–17. [Google Scholar] [CrossRef] [Green Version]
- Freeman, J.R. Pure Zinc at Normal and Elevated Temperatures: Scientific Papers of the Bureau of Standards, Vol. 20; National Institute of Standards and Technology (NIST): Columbus, OH, USA, 2013.
- Shen, Z.; Ding, Y.; Chen, J.; Gerlich, A.P. Comparison of fatigue behavior in Mg/Mg similar and Mg/steel dissimilar refill friction stir spot welds. Int. J. Fatigue 2016, 92, 78–86. [Google Scholar] [CrossRef]
- Liu, L.; Xiao, L.; Chen, D.L.; Feng, J.C.; Kim, S.; Zhou, Y. Microstructure and fatigue properties of Mg-to-steel dissimilar resistance spot welds. Mater. Des. 2013, 45, 336–342. [Google Scholar] [CrossRef]
Figure 1.
Relative displacement curves across each interface measured at different time frames. Welding was conducted in Experimental Setup 1 condition as listed in Table 1.
Figure 1.
Relative displacement curves across each interface measured at different time frames. Welding was conducted in Experimental Setup 1 condition as listed in Table 1.

Figure 2.
Relative velocity curves across each interface, surface indentation depth, as well as the temperature distribution (the inserted color plots above the velocity curves) measured at different time frames. Welding was conducted in Experimental Setup 1 condition as listed in Table 1. The curves between the inserted temperature plots are the line plots of temperature distribution along the cross-sectional centerline (indicated by dashed lines). The numbers on the color bars and the horizontal axis of the line plots represent the temperature distribution in Celsius. The small circles on the inserted temperature plots indicate the location of the joint interface.

Figure 3.
Temperature history at center of the joint interface measured in the Experimental Setup 1 condition as listed in Table 1. The measurement location is indicated by a small circle in the inserted temperature plots in Figure 2.

Figure 4.
Lap shear tensile load vs. extension curves measured on the weld coupons that were produced in Experimental Setup 2 condition as listed in Table 1. The inserted image shows the interfacial fracture occurred on one of the coupons.
Figure 4.
Lap shear tensile load vs. extension curves measured on the weld coupons that were produced in Experimental Setup 2 condition as listed in Table 1. The inserted image shows the interfacial fracture occurred on one of the coupons.

Figure 5.
Relation between maximum tensile load and the number of fatigue cycles to failure measured on the weld coupons that were produced in Experimental Setup 2 condition as listed in Table 1. The inserted image shows two fracture modes: interfacial fracture and parent AZ31B fracture.
Figure 5.
Relation between maximum tensile load and the number of fatigue cycles to failure measured on the weld coupons that were produced in Experimental Setup 2 condition as listed in Table 1. The inserted image shows two fracture modes: interfacial fracture and parent AZ31B fracture.

Figure 6.
Morphology and chemical composition at the center of the joint interface on welds produced with low welding energy (Experimental Setup 1 condition as listed in Table 1). (a) SEM image of the bonding interface between DP590 and AZ31B, and the element maps in the same region: (b) Zn, (c) Fe and (d) Mg. The inserted line plots represent the quantification of each composition along the dashed line. The unit of the horizontal axis is in count.

Figure 7.
Morphology and chemical composition at the center of the joint interface on welds produced with high welding energy (Experimental Setup 2 condition as listed in Table 1). (a) SEM image of the bonding interface between DP590 and AZ31B, and the element maps in the same region: (b) Zn, (c) Fe and (d) Mg. The inserted line plots represent the quantification of each composition along the dashed line. The unit of the horizontal axis is in count.


Table 1.
Ultrasonic spot welding (USW) joint coupons produced with different welding conditions.
| Experiment Setup 1 | Experimental Setup 2 | |
|---|---|---|
| Coupon dimension and joint location |  |  |
| Ultrasonic welder type | Dual head | Single head (on the top) |
| Welding condition | 1000 W for 0.5 s | 3500 W for 4 s |
Note: Dash lines across the square weld regions indicate the position of the cross-sectioning for post-weld characterization.
© 2020 by the authors. Licensee MDPI, Basel, Switzerland. This article is an open access article distributed under the terms and conditions of the Creative Commons Attribution (CC BY) license (http://creativecommons.org/licenses/by/4.0/).
Share and Cite
MDPI and ACS Style
Chen, J.; Lim, Y.C.; Leonard, D.; Huang, H.; Feng, Z.; Sun, X. In Situ and Post-Mortem Characterizations of Ultrasonic Spot Welded AZ31B and Coated Dual Phase 590 Steel Joints. Metals 2020, 10, 899. https://doi.org/10.3390/met10070899
AMA Style
Chen J, Lim YC, Leonard D, Huang H, Feng Z, Sun X. In Situ and Post-Mortem Characterizations of Ultrasonic Spot Welded AZ31B and Coated Dual Phase 590 Steel Joints. Metals. 2020; 10(7):899. https://doi.org/10.3390/met10070899
Chicago/Turabian StyleChen, Jian, Yong Chae Lim, Donovan Leonard, Hui Huang, Zhili Feng, and Xin Sun. 2020. "In Situ and Post-Mortem Characterizations of Ultrasonic Spot Welded AZ31B and Coated Dual Phase 590 Steel Joints" Metals 10, no. 7: 899. https://doi.org/10.3390/met10070899
Note that from the first issue of 2016, this journal uses article numbers instead of page numbers. See further details here.