Article

Numerical and Experimental Investigation of Cumulative Fatigue Damage under Random Dynamic Cyclic Loads of Lattice Structures Manufactured by Laser Powder Bed Fusion

Department of Mechanical Engineering, Politecnico di Milano, 20156 Milan, Italy
*
Author to whom correspondence should be addressed.
Metals 2021, 11(9), 1395; https://doi.org/10.3390/met11091395
Submission received: 28 July 2021 / Revised: 30 August 2021 / Accepted: 31 August 2021 / Published: 3 September 2021

Abstract

:
Lattice structures are lightweight engineering components suitable for a great variety of applications, including those in which the structural integrity under vibration fatigue is of paramount importance. In this work, we experimentally and numerically investigate the dynamic response of two distinct lattice configurations, in terms of fatigue damage and life. Specifically, Face-Centered-Cubic (FCC) and Diamond lattice-based structures are numerically studied and experimentally tested under resonant conditions and random vibrations, until their failure. To this end, Finite Element (FE) models are employed to match the dynamic behavior of the system in the neighborhood of the first natural frequency. The FE models are employed to estimate the structural integrity by way of frequency and tip acceleration drops, which allow for the identification of the failure time and a corresponding number of cycles to failure. Fatigue life under resonant conditions is well predicted by the application of conventional multiaxial high cycle fatigue criteria to the local state of stress. The same approach, combined with the Rainflow algorithm and Miner’s rule, provides good results in predicting fatigue damage under random vibrations.

1. Introduction

The exploitation of periodic lattice structures has lately biased the way lightweight components are designed, which is motivated by a number of static and dynamic properties that are not commonly achievable with conventional materials and configurations, such as high strength to weight ratio [1], negative Poisson’s ratio [2], improved damping capabilities [3,4], among others. Relevant examples include lattices characterized by peculiar topologies, see Ref. [5] for a review of the state of the art. Such configurations have sparked broad interest within several realms of engineering, such as aerospace, maritime engineering, automotive and biomedical. For instance, Lira et al. [6] employed a lattice structure to reduce the inertial forces of a fan blade by way of a graded 2D honeycomb core. Spadoni et al. [7] have functionally designed chiral-based auxetic cells to improve the response of airfoils in terms of dissipation.
In this context, additive manufacturing (AM) techniques are often used for a large variety of applications and suit the fabrication of many lattice structures present in the literature. Indeed, the continuous technological improvement of AM techniques has led to the fabrication of complex structures impossible to obtain with conventional manufacturing processes. Relevant examples include 3D printing techniques. For example, Colombo et al. [8] observed that the damping of AlSi10Mg manufactured by Selective Laser Melting (SLM) can be strongly affected by the printing directions. Fiocchi et al. [9,10] compared the damping of a lattice and full solid structures made of SLM Ti6Al4V, observing a two-orders of magnitude increase in the case of lattice structures. Similar results have been observed in a number of papers [7,11], which further confirms the improved dynamic performances of lattice structures. Practically, industrial applications require reliable methods capable of predicting the structural integrity of such components. A number of static and fatigue criteria have been presented in recent works, see Ref. [12] for a recent review of the state of the art on this matter.
Several experimental studies have been proposed [13,14,15,16] in the attempt to shed light on the fatigue behavior of a variety of lattice structures. The effect of porosity on the fatigue strength of cellular materials manufactured by SLM has been investigated in Ref. [17]. Different structures with porosities between 68% and 84% have been manufactured and dynamically tested under fatigue. It is shown that all fatigue data points collapse on a single Stress-Life (SN) curve when the applied stress amplitude is normalized with respect to the yield strength of the structures. However, it is also found that the normalized endurance limit of all tested porous structures is lower than that of the corresponding solid material, i.e., 10–20% of the yield strength of the lattice structure against 40% for the bulk material. This discrepancy has been attributed to the transitions in cell geometry and to defects induced during the printing process. Even if the cell topology is optimized for reducing the stress concentration in the transitions [18], the effect of the printing process on the surface roughness and on a non-uniform thickness of the struts can reduce fatigue life and strength.
Several studies have been proposed in the attempt to reduce the number of defects induced by the printing process of L-PBF. The effects of laser power, scanning speed, beam diameter, and powder variability on metal components have been studied in Refs. [19,20,21,22,23]. Regarding the surface roughness, a significant improvement has been offered in [24] through Laser polishing (LP). Despite the continuous technological improvement of L-PBF, the manufacturing of lattice structure still remains quite challenging due to the small feature size and complex shape. In this regard, Dallago et al. [25] observed that node geometry and printing directions have a relevant impact on the fatigue behavior of lattice structures and can be tailored to improve fatigue life. In addition, the dependence from defects and strut irregularities has been addressed numerically by Boniotti et al. [26] by way of a finite element model based on the as-manufactured geometry, which has been reconstructed by CT-scan. Then, a multiaxial high cycle fatigue criterion has been used to prove that the highest equivalent stress occurs in correspondence of the strut nodes and on the largest strut irregularities.
Better fatigue performance has been observed for triply periodic minimal surface (TPMS) structures, where the absence of struts and nodes significantly reduces the stress concentrations, and a continuous curvature of their surface provides great benefits in terms of fatigue strength [27,28,29]. In other words, there is a large variety of studies about static and fatigue criteria of lattice structures. However, the dynamic characterization under resonance and the random fatigue behavior has been elusive from the practical perspective and still represents an open point.
In this context, the fatigue assessment of porous structures has been so far performed only experimentally through imposed random accelerations [30]. In detail, Richard et al. developed an innovative loop heat pipe for a Nasa’s cubesat, with a porous wick fabricated by AM techniques, able to resist to a given power spectral density (PSD), which is representative of the acceleration of the satellite launch phase. In the proposed configuration, the structural integrity has been verified by way of an experimental campaign. However, for design purposes, a numerical method to predict fatigue life under random loads is often preferable, but existing vibration fatigue criteria have not been verified for lattice structures yet.
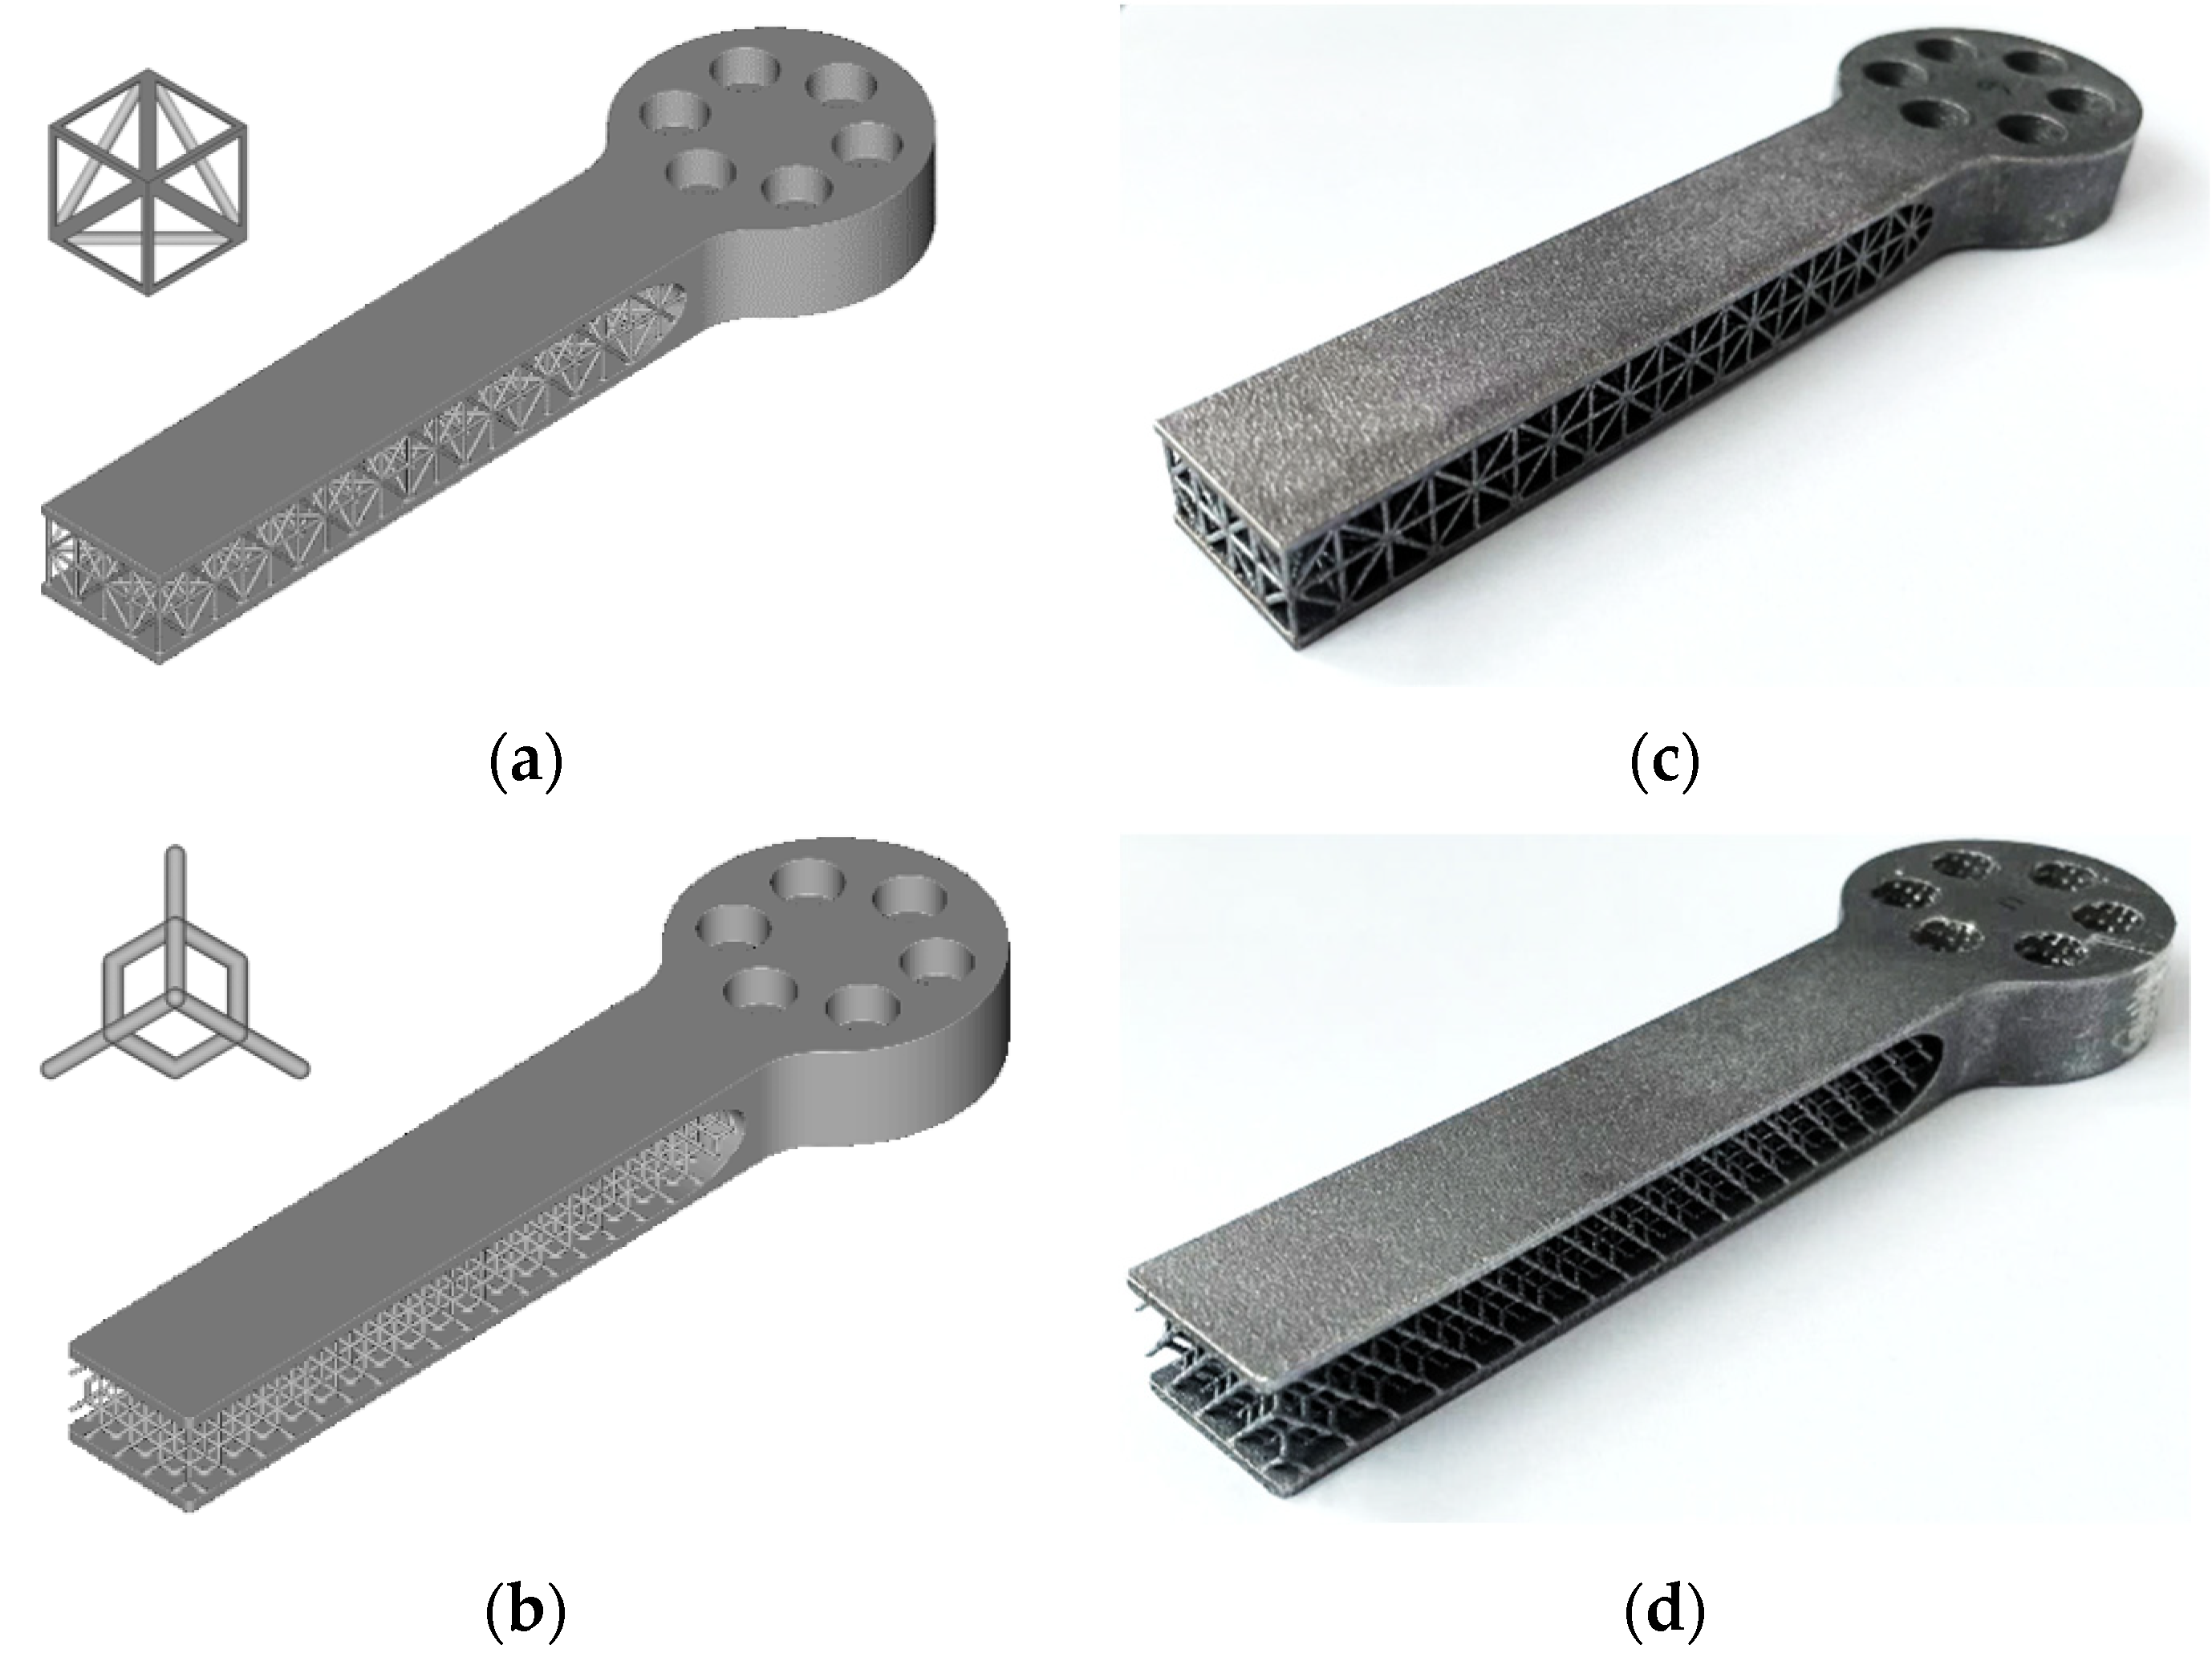
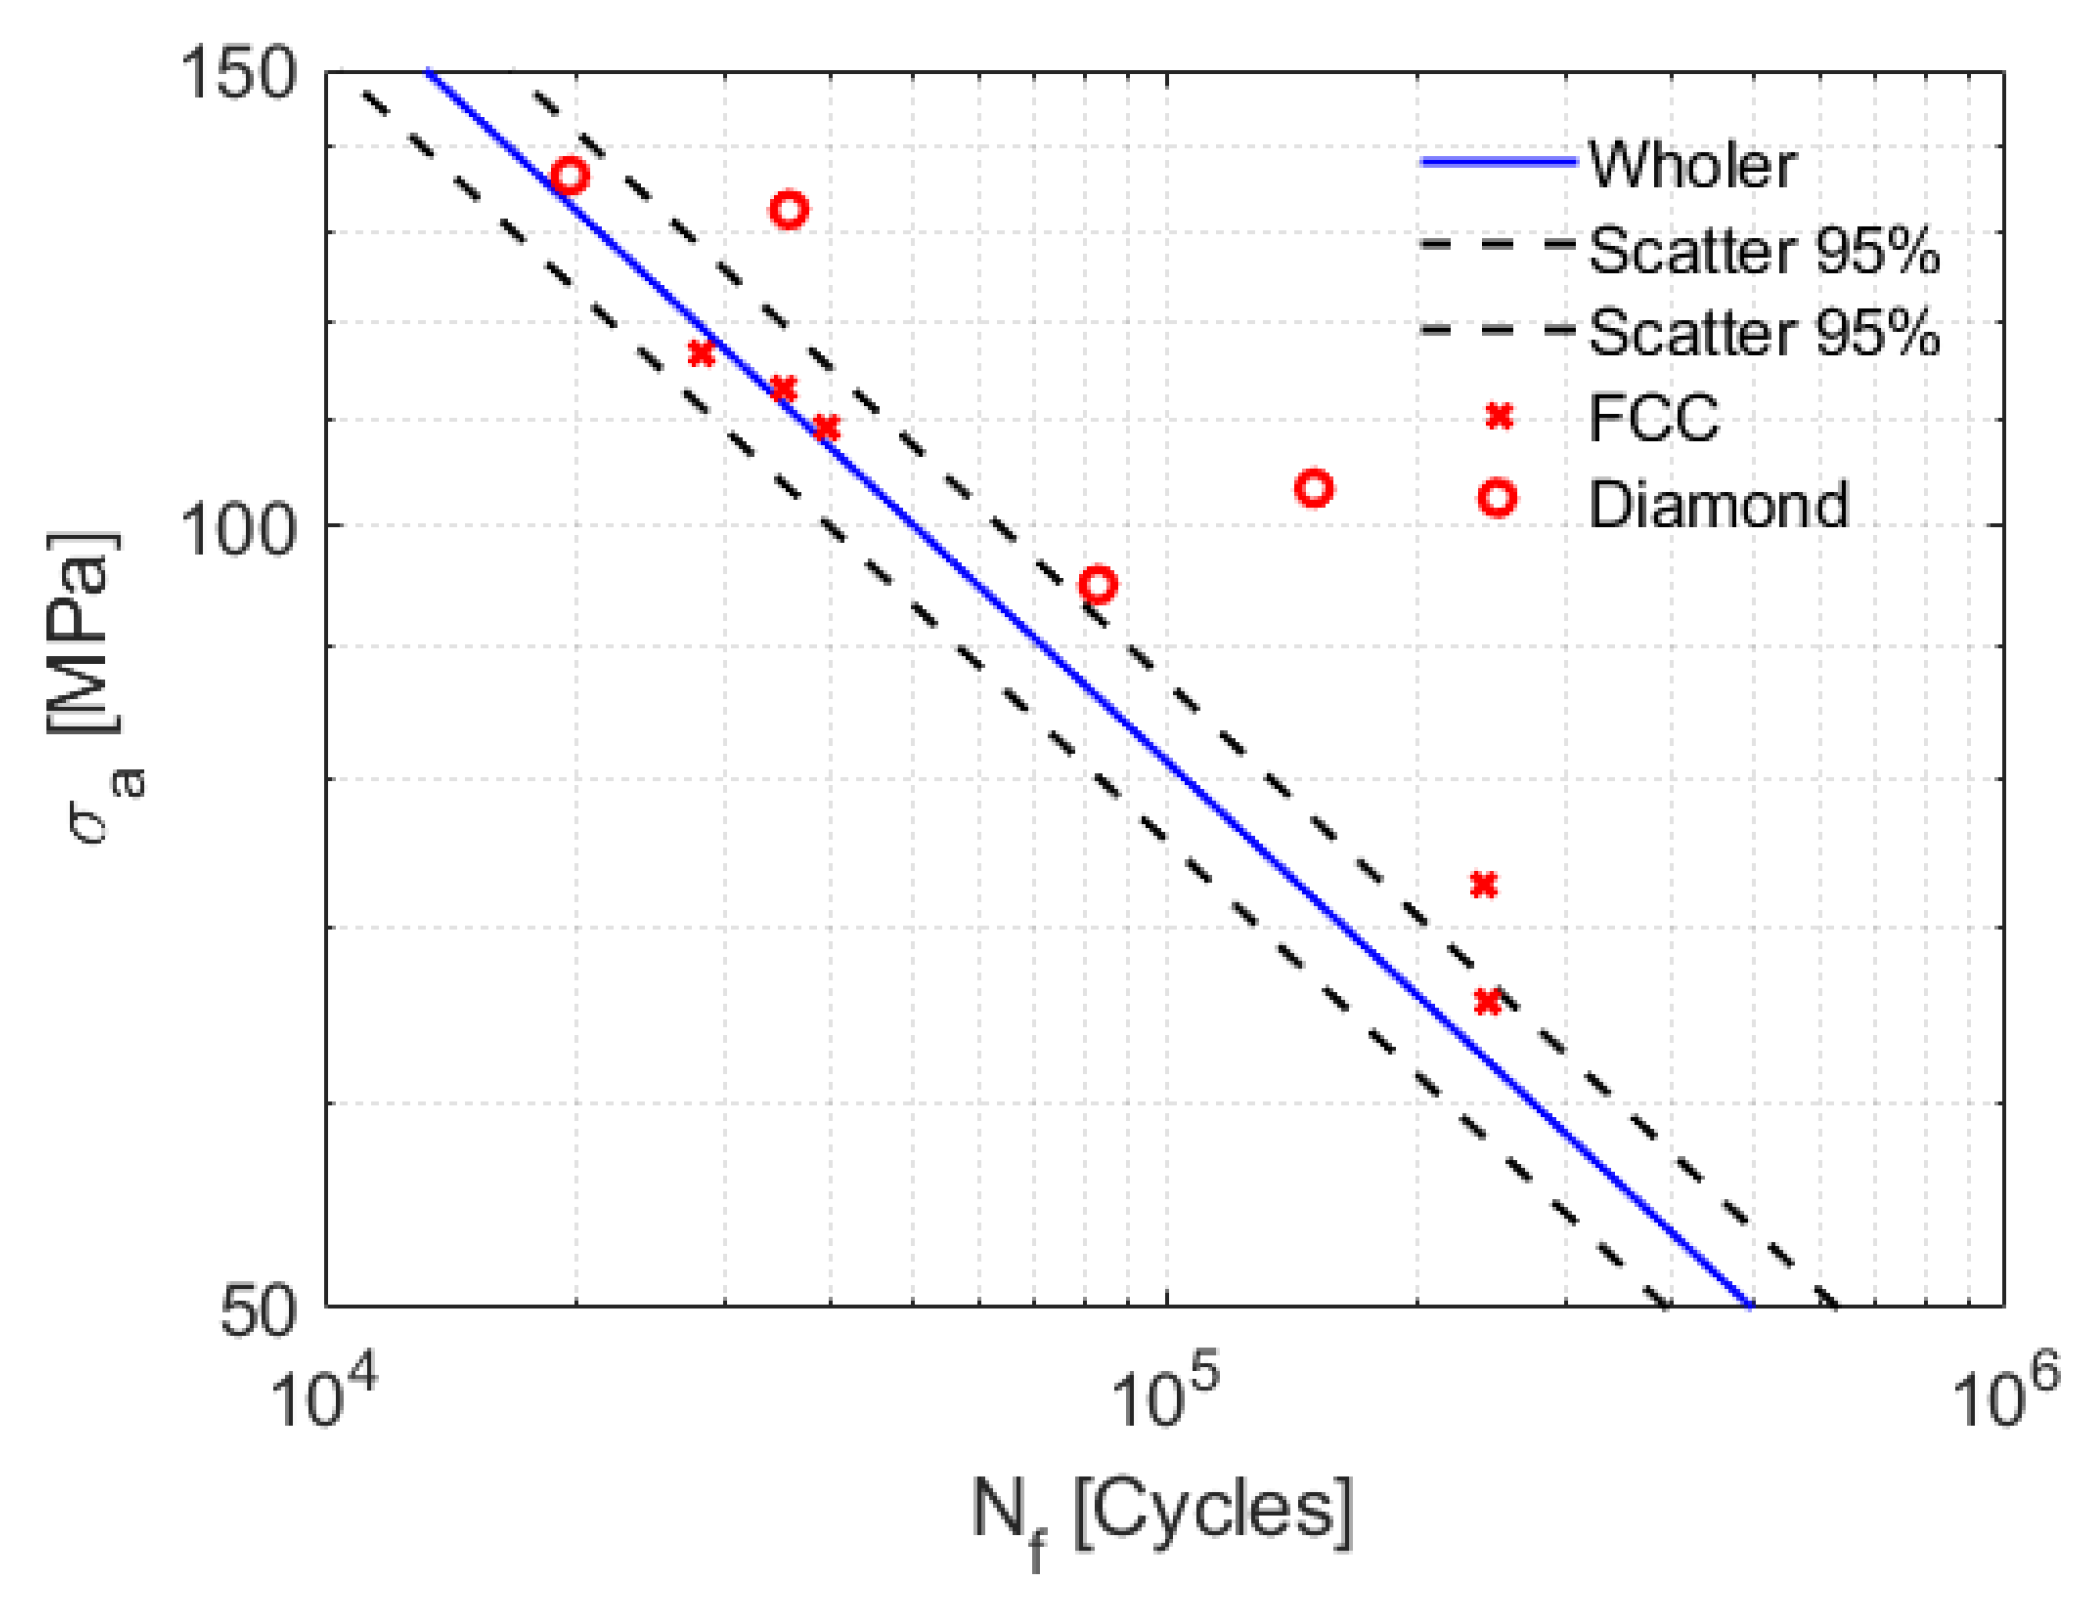
Motivated by this lack in the literature, in this work we present and experimentally validate a method for fatigue life prediction for face-centered-cubic (FCC) and Diamond lattice structures, manufactured by Laser Powder Bed Fusion (L-PBF), under resonant condition and random vibrations.
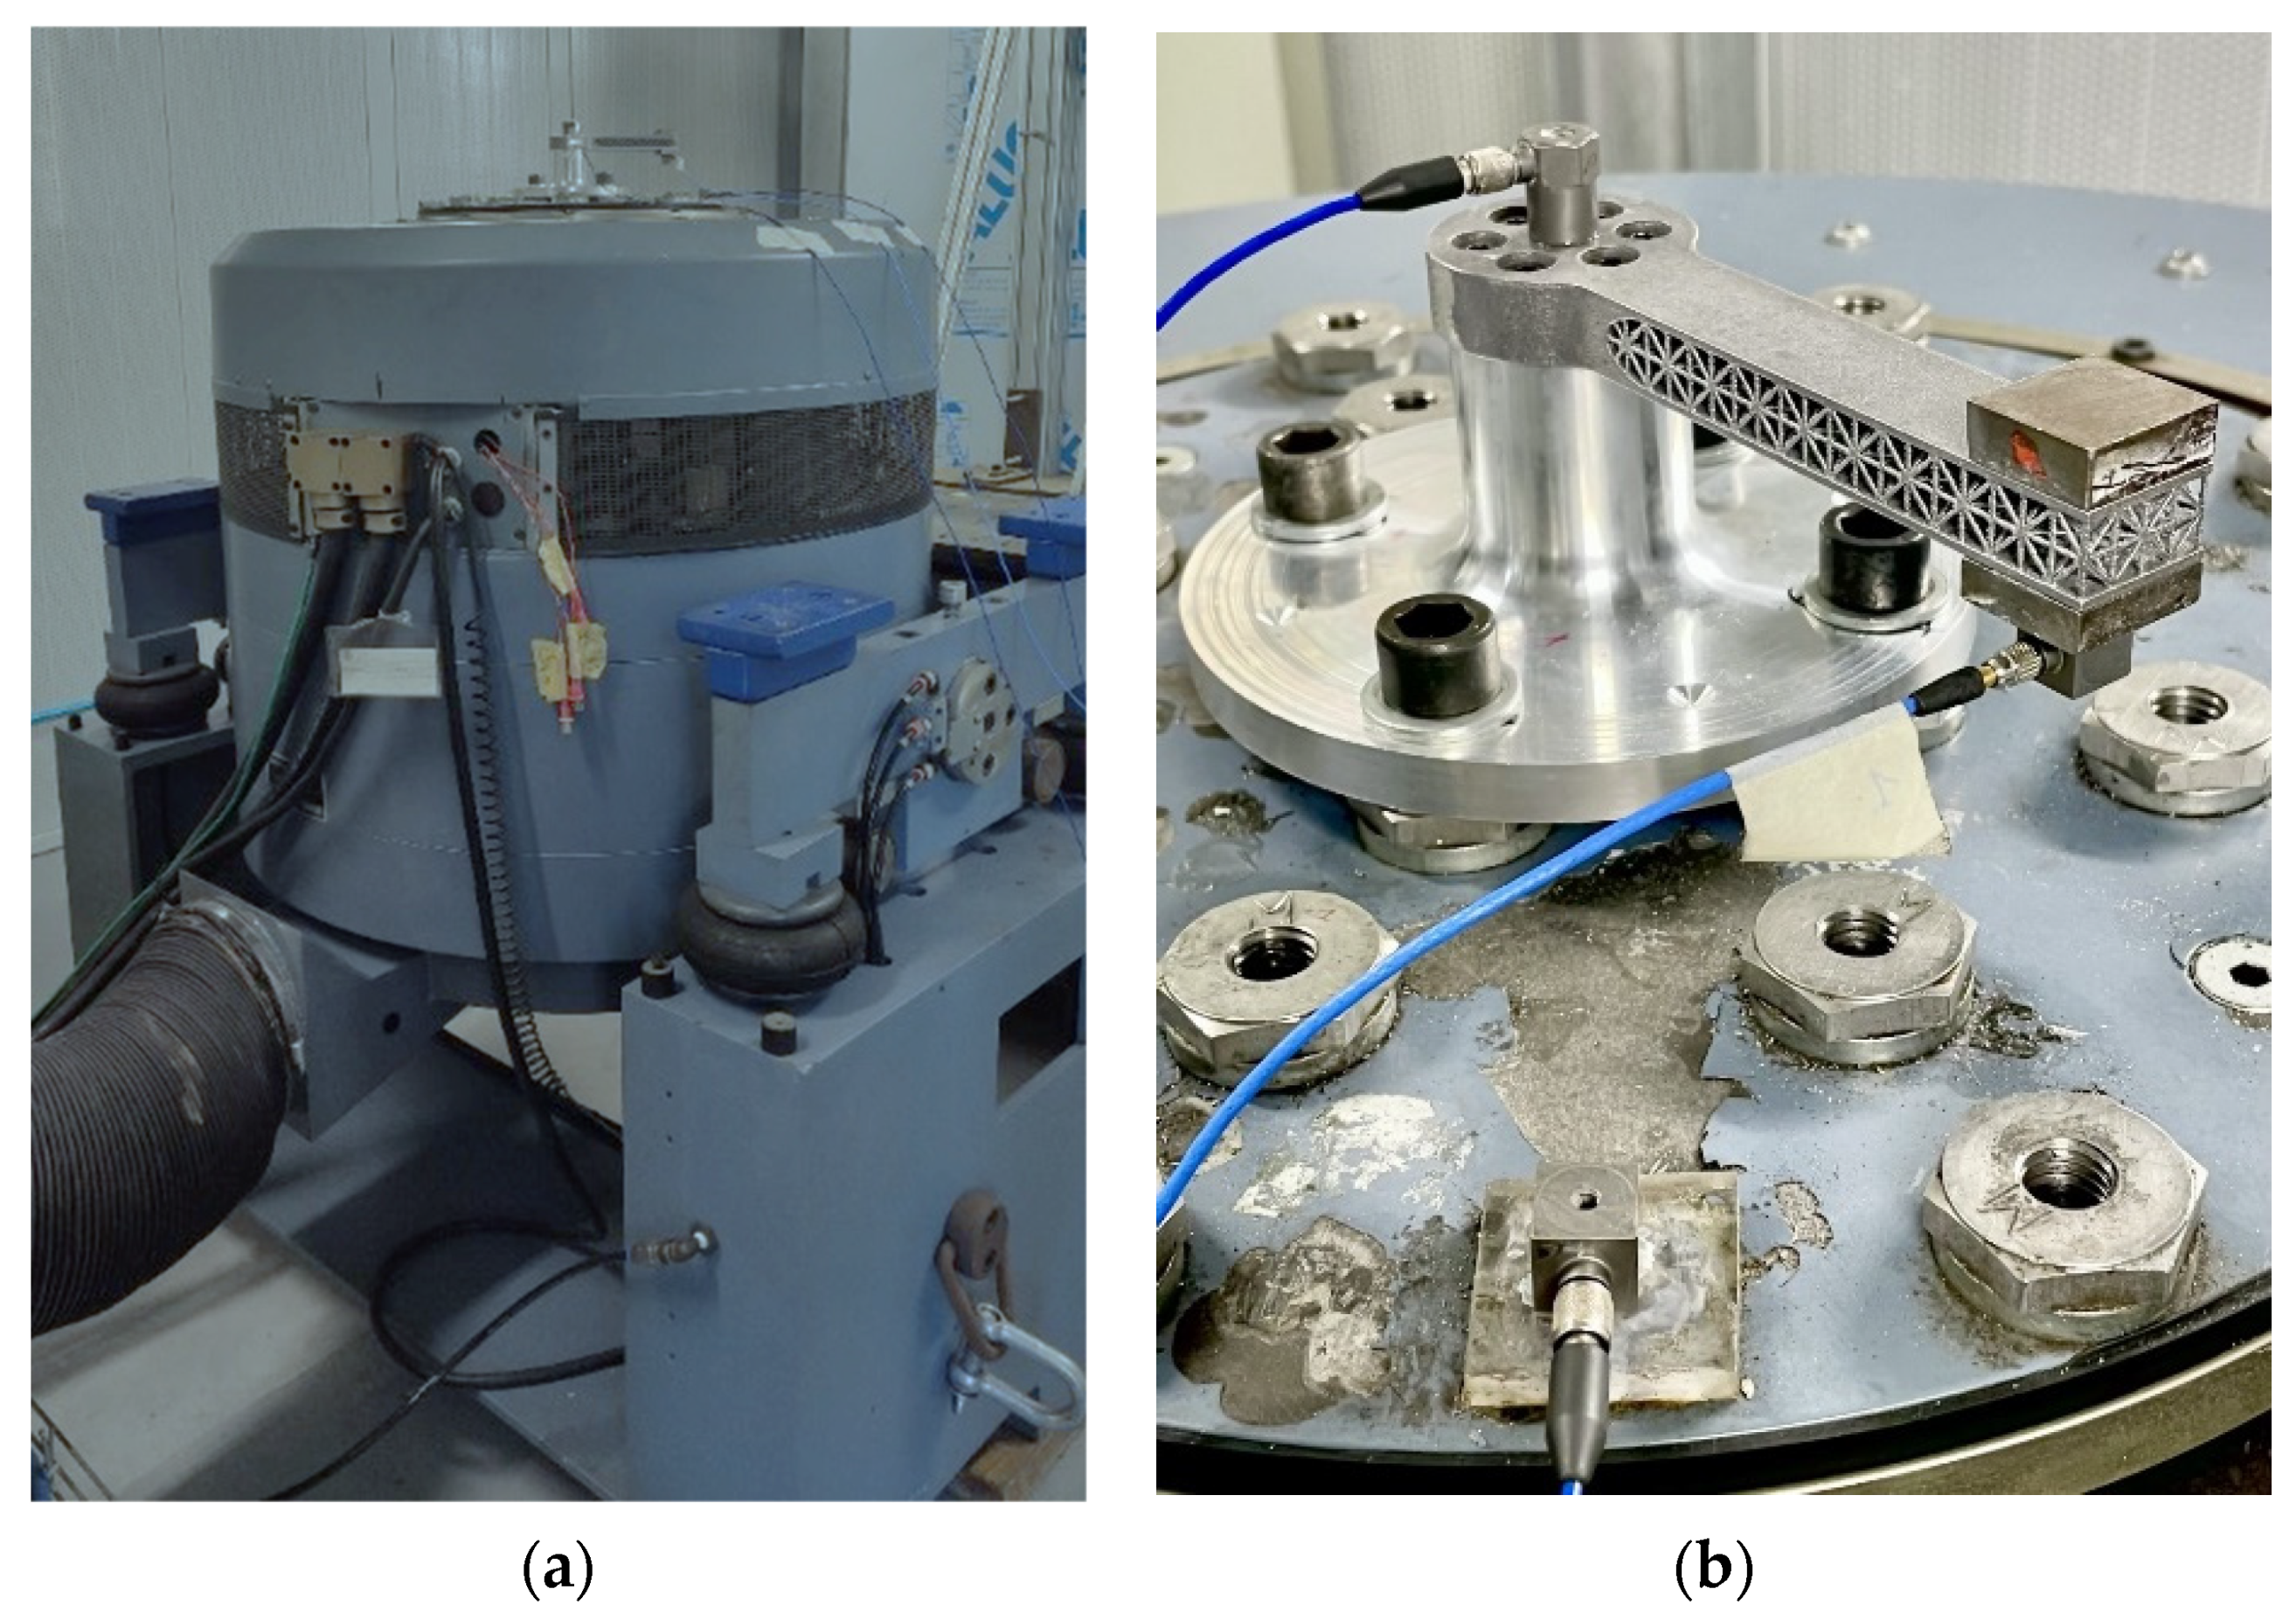
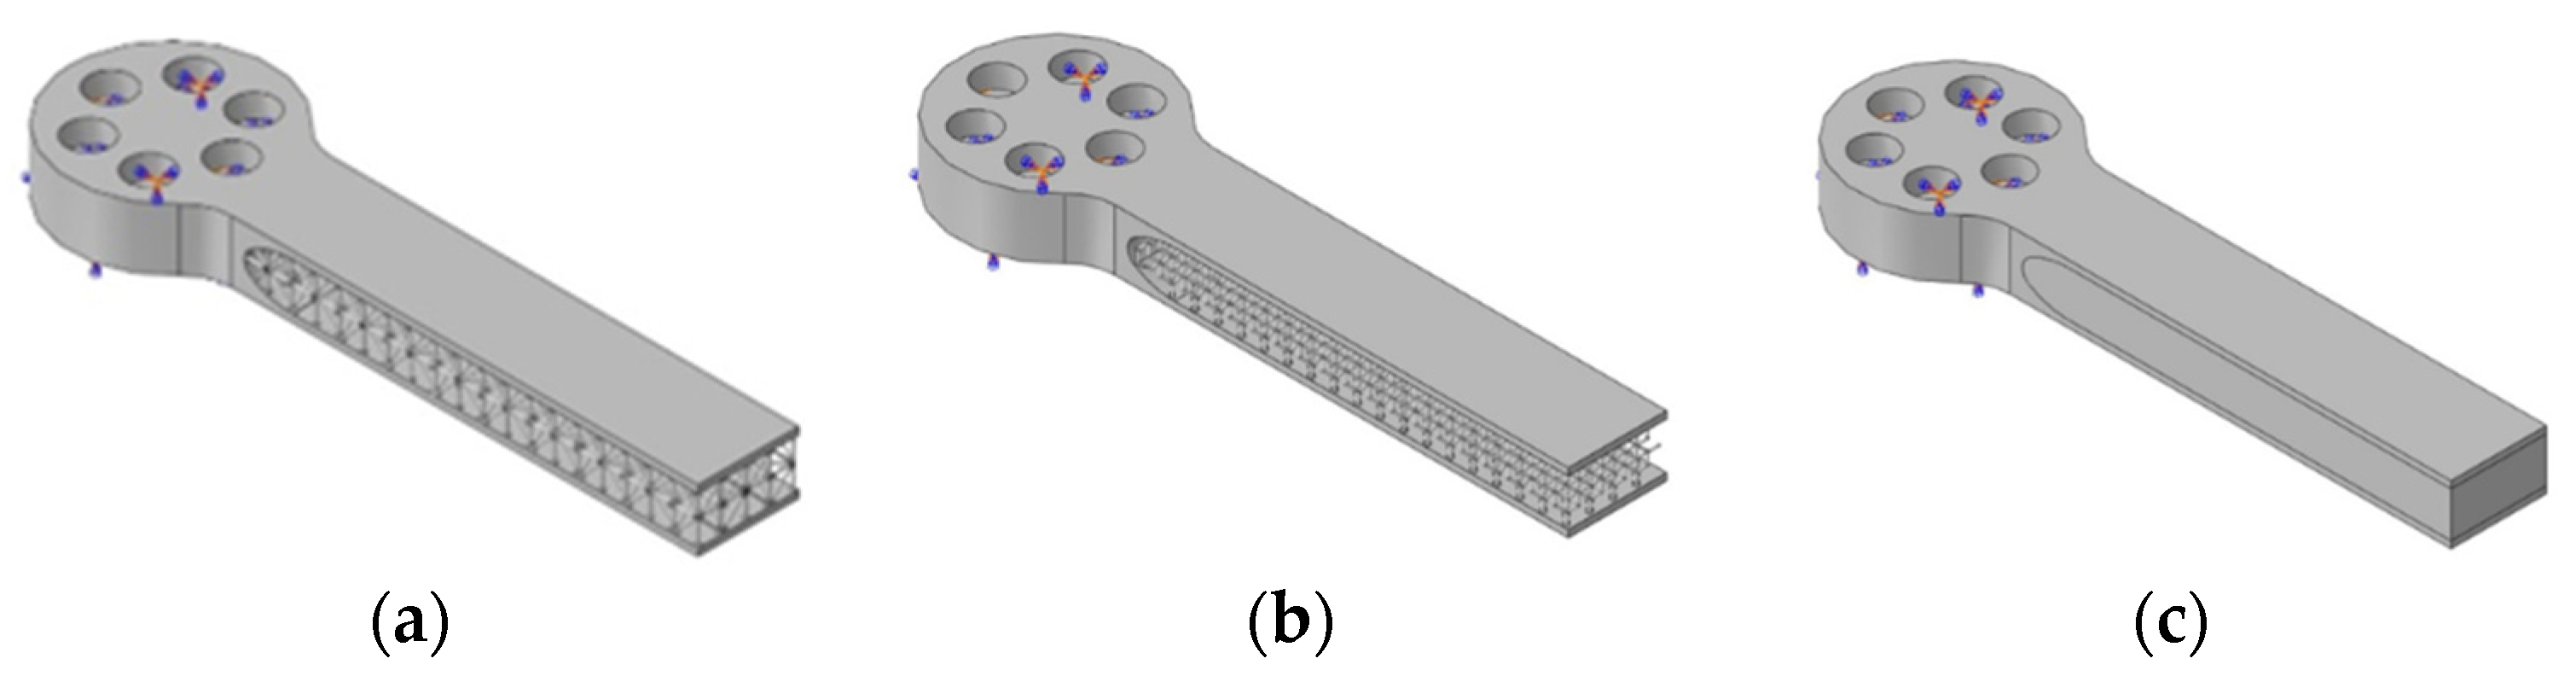
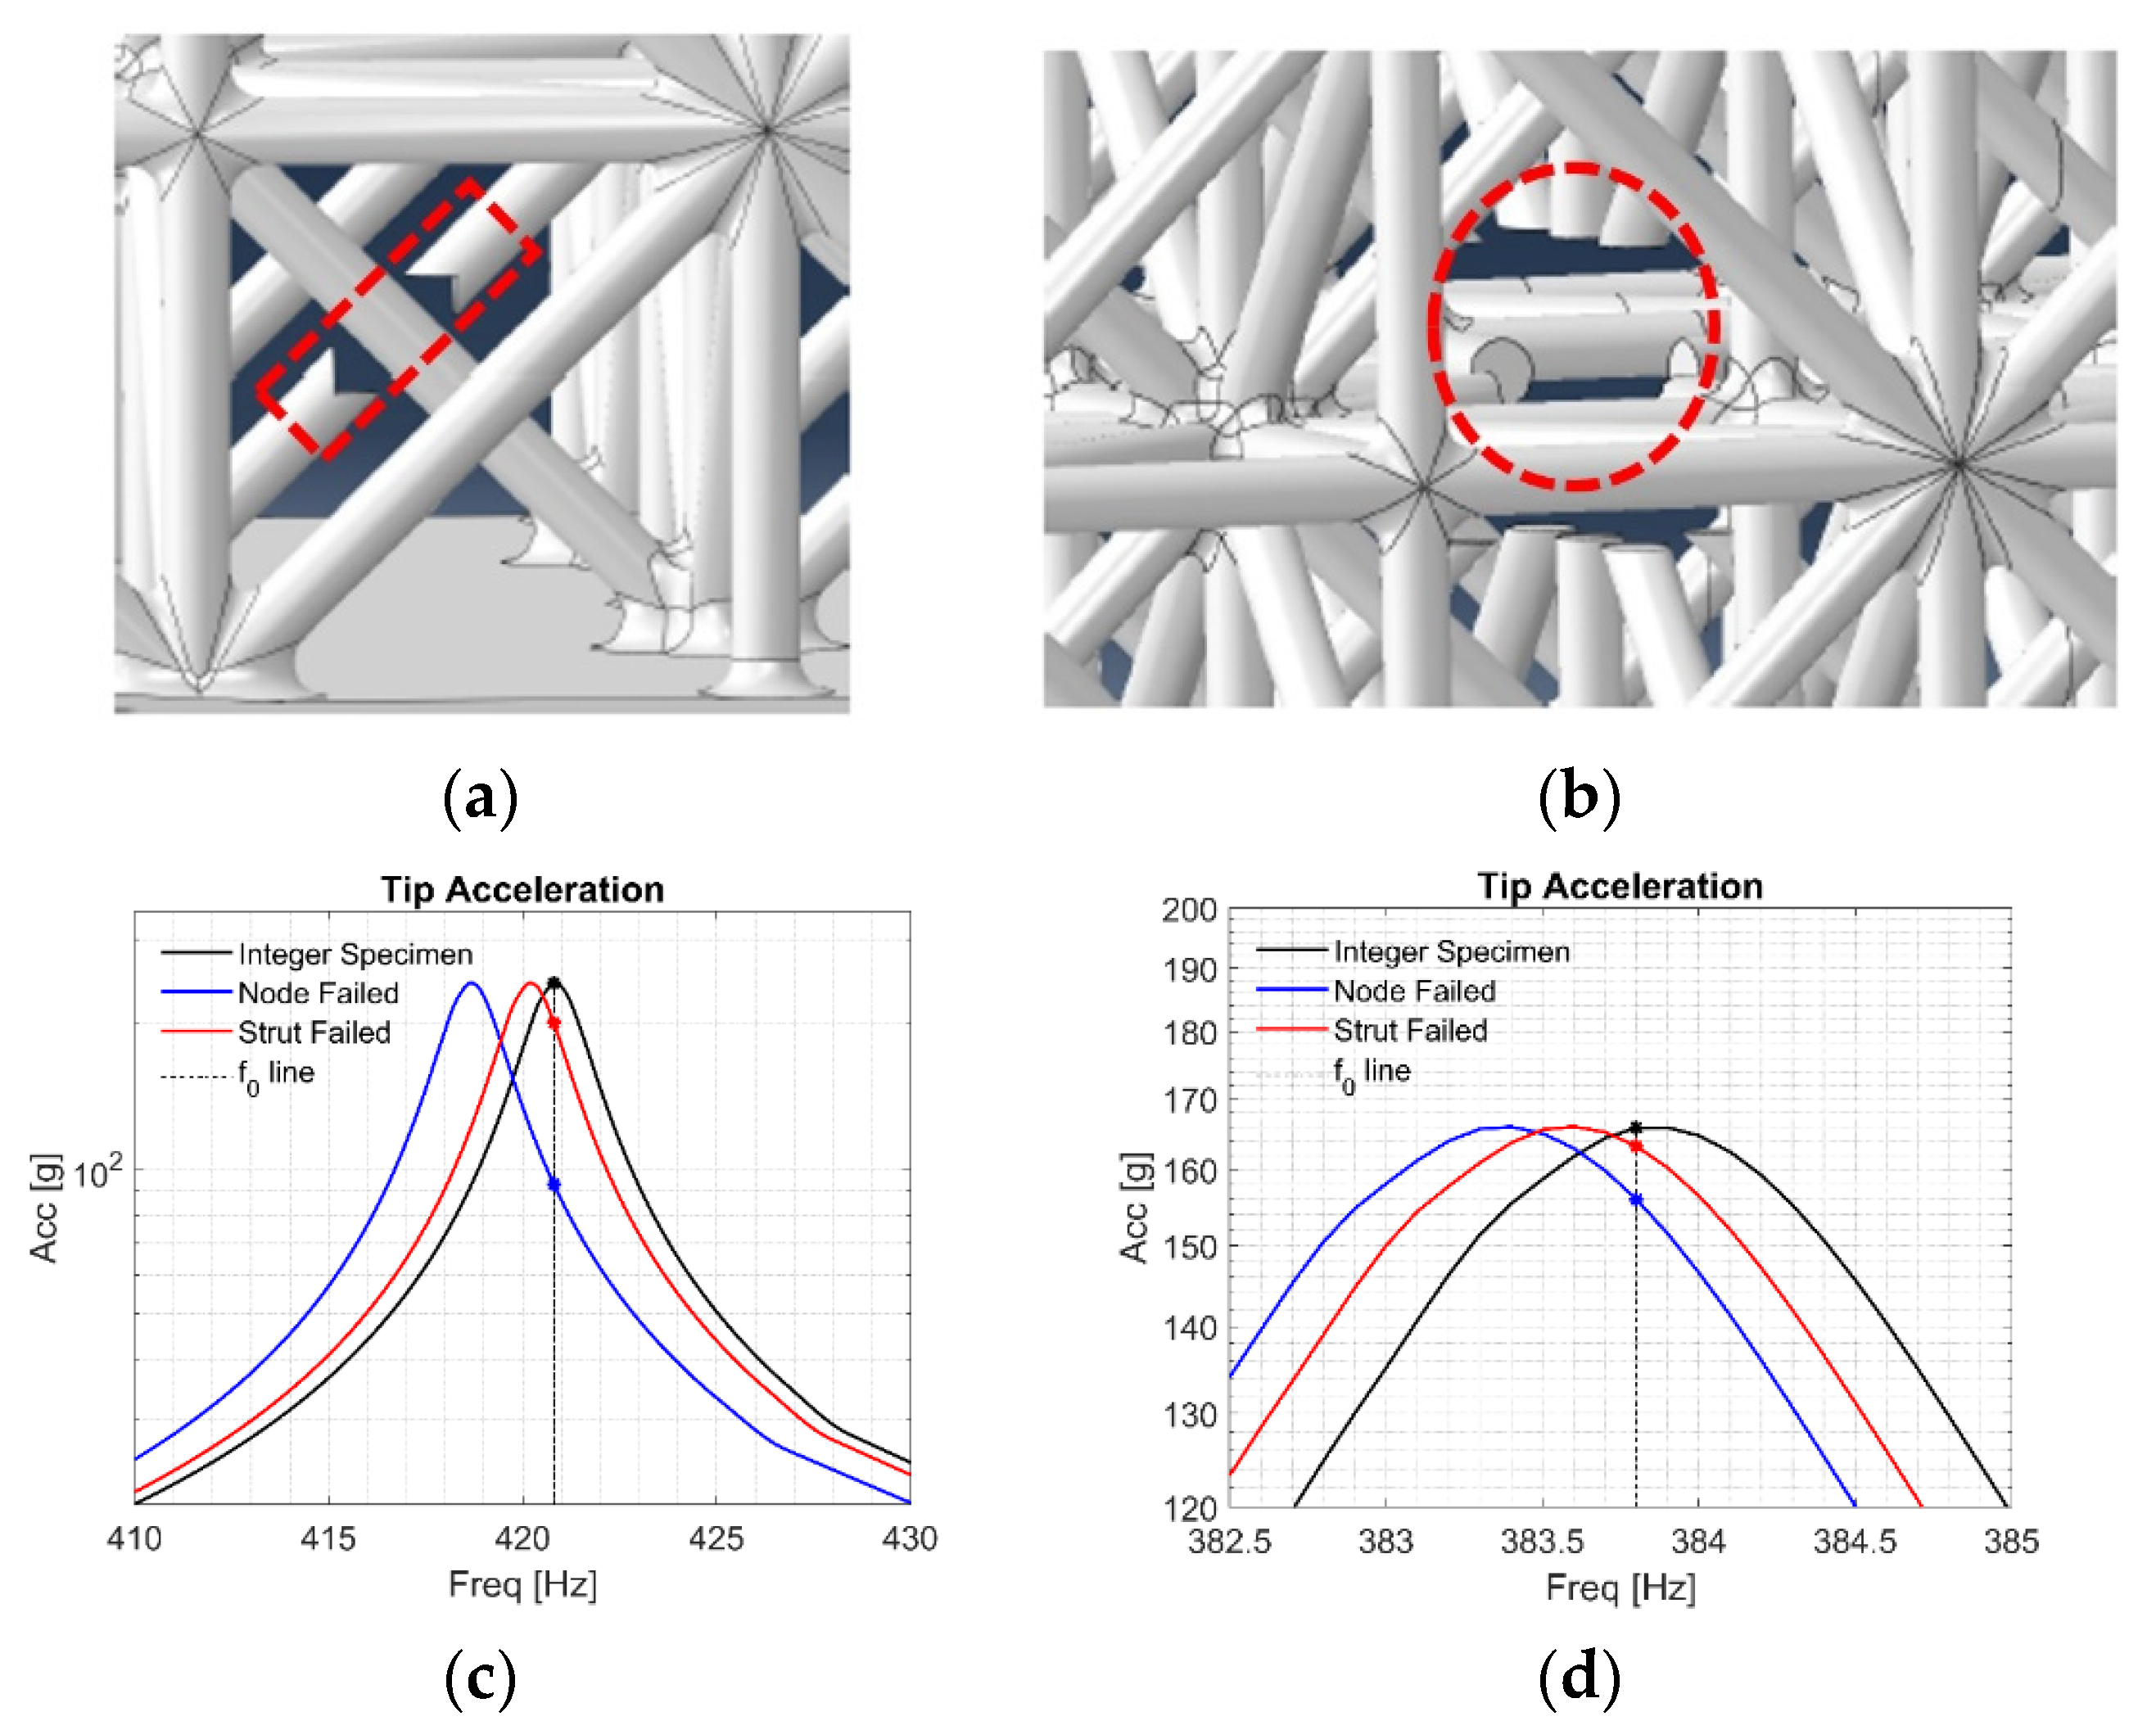
Two distinct types of experimental tests have been performed to study the fatigue behavior: (i) an endurance test imposing an excitation frequency corresponds to the first bending mode, (ii) a random excitation fatigue test to meet excitation levels and spectra consistent with real applications. Before fatigue tests, the frequency response function of all specimens, including all the relevant dynamic quantities such as damping and natural frequencies, has been estimated through sweep frequency tests. A numerical model with induced localized damage, broken strut, or missing node, is employed to emulate the effect of a local failure of the lattice elements to the drops in the global dynamic response in resonance and due to random input. The failure condition is defined as corresponding to the failure of the most loaded strut in the numerical analysis.
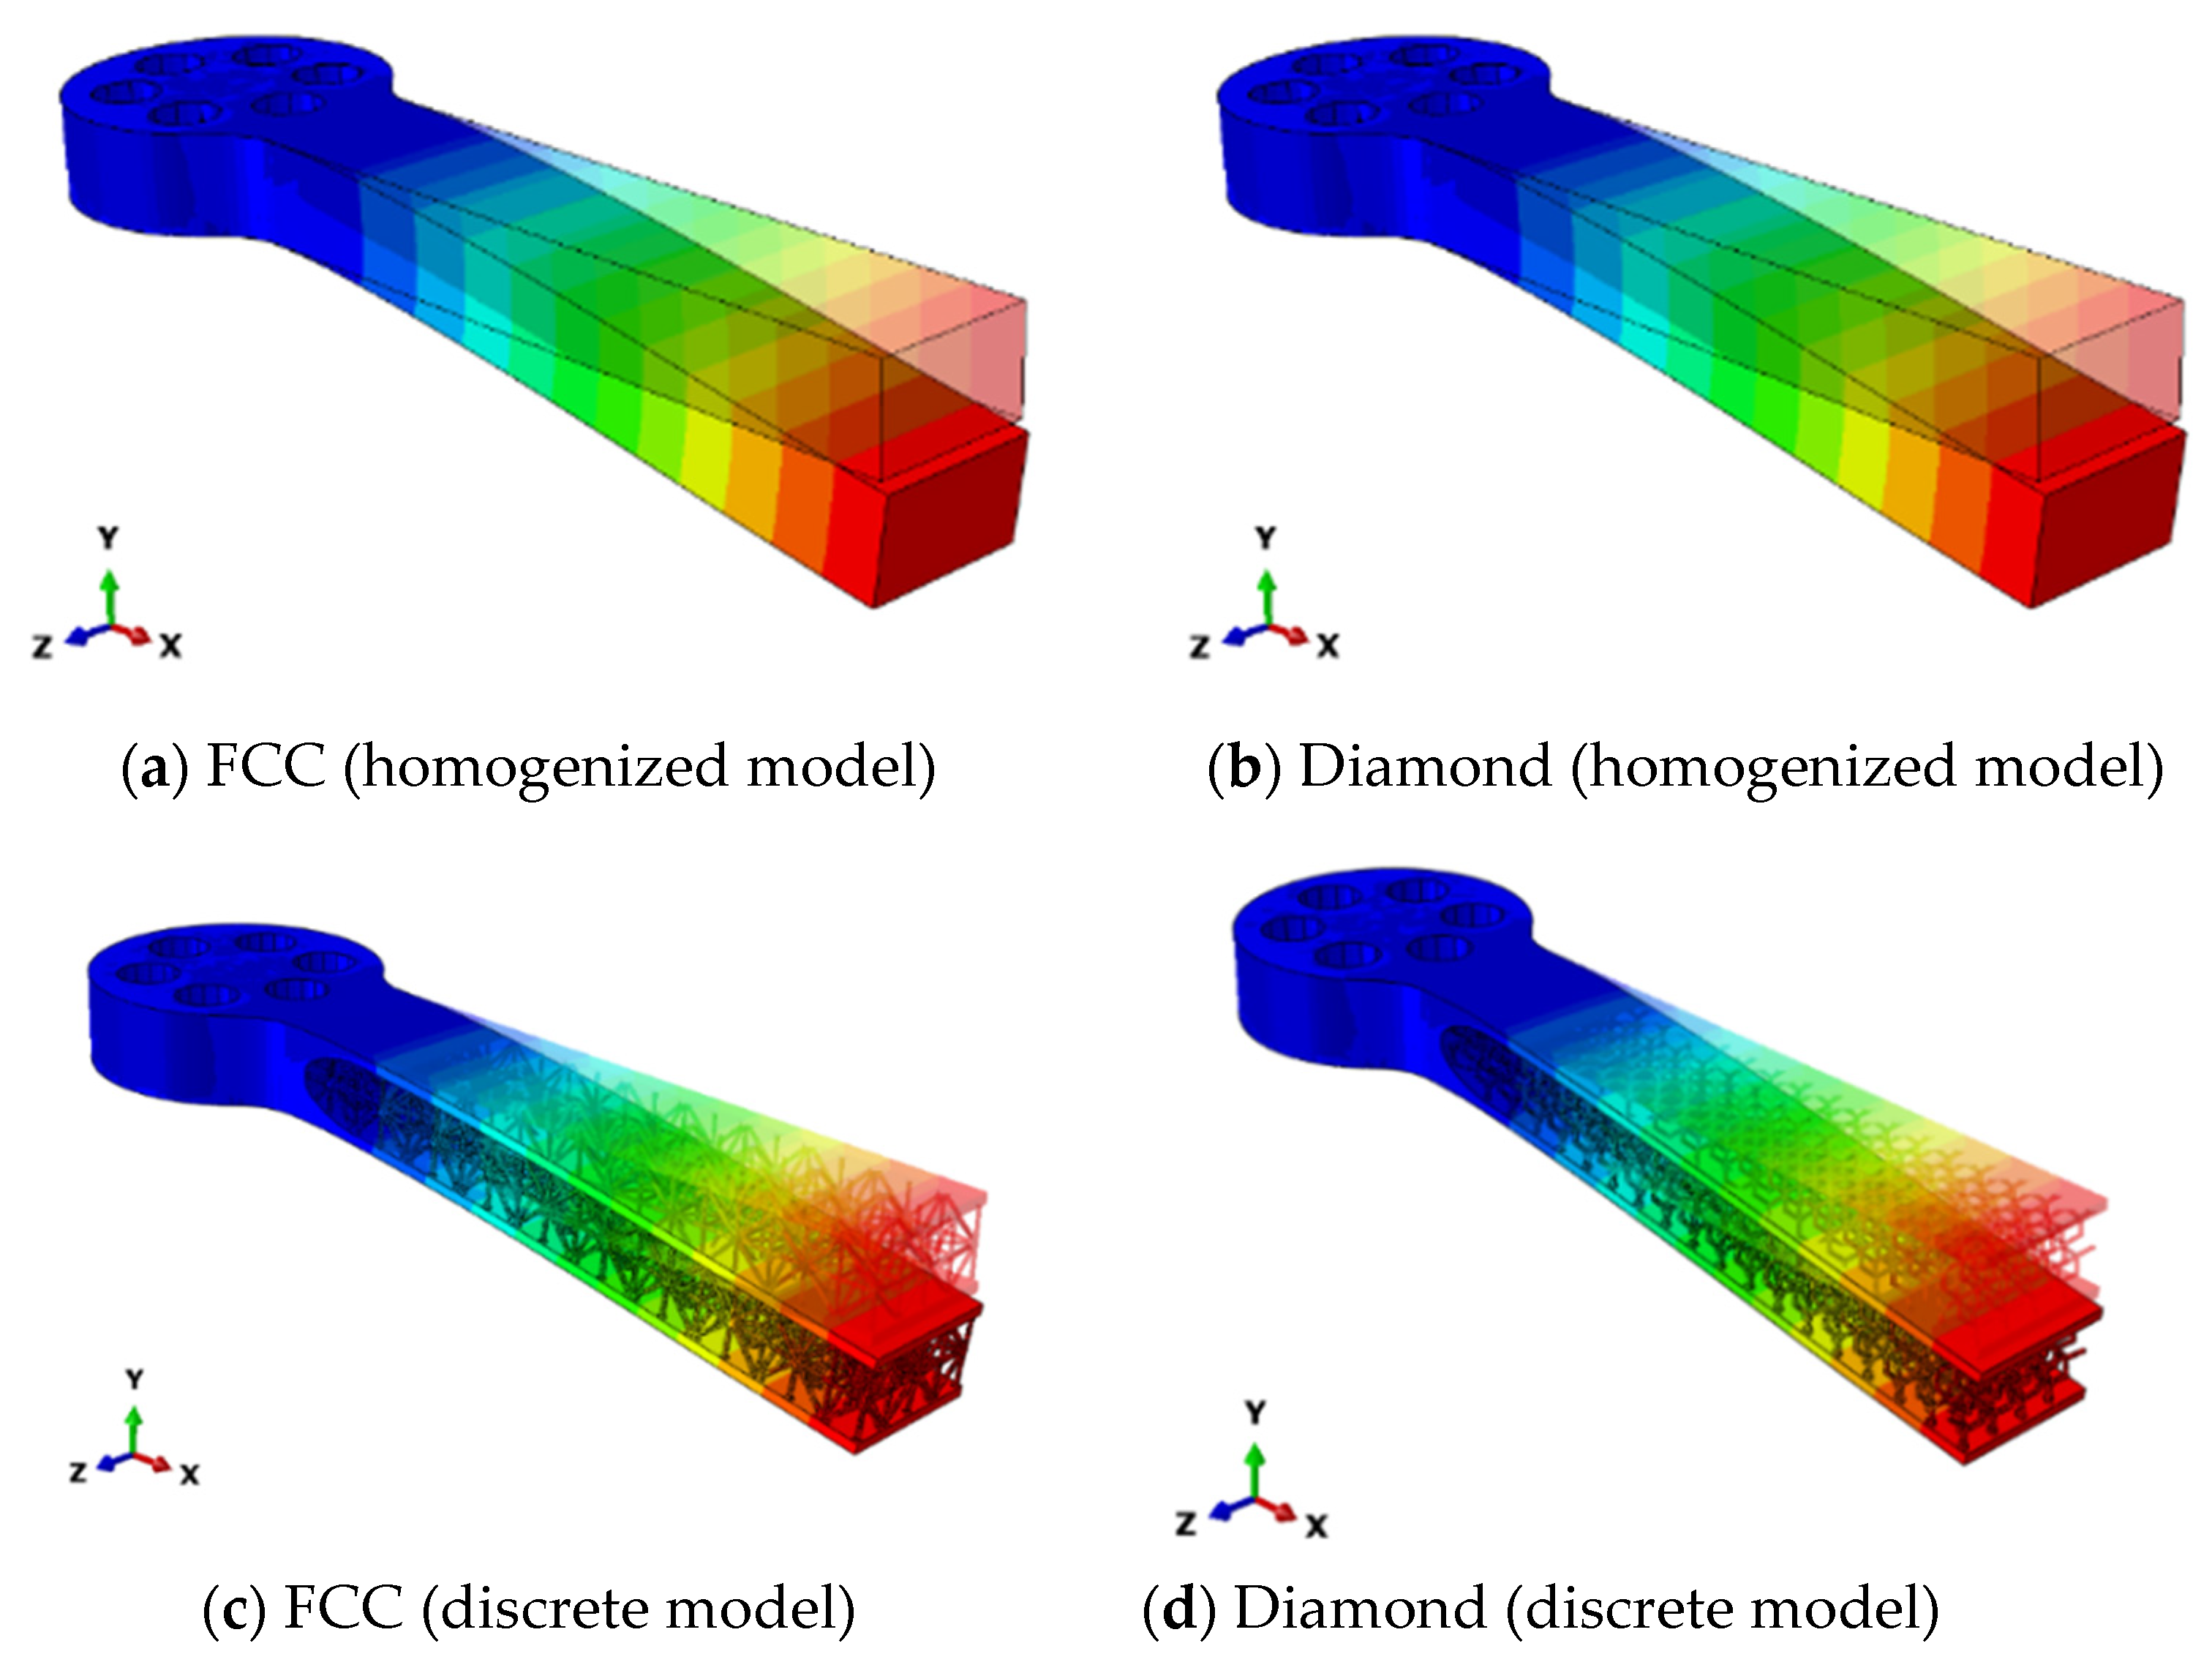
Fatigue test results under resonant conditions, i.e., at constant stress amplitude, have been analyzed through the procedure presented in Ref. [26]; i.e., by computing an equivalent stress amplitude based on a multiaxial high cycle fatigue criterion. In addition, a map of the equivalent stress amplitude has been obtained through finite element analyses for different values of tip displacement and damping ratios. By using the equivalent stress amplitude value in the SN diagram of the parent material, corresponding to the tip displacement and the damping ratio experimentally measured in the endurance tests, fatigue life can be predicted with good accuracy.
For the experimental tests under random vibrations, starting from the application of the Rainflow’s algorithm to the experimentally measured tip displacement, the cumulative fatigue damage has been computed with the Miner’s rule where, for every cycle, the damage is calculated considering the corresponding tip displacement, i.e., the equivalent stress amplitude thorough the stress map, and the SN diagram of the parent material.
The proposed procedure leads to fatigue damage to failure, which is around 1, demonstrating an accurate matching between the predictive model and experimental results.

2. Data and Experimental Methods

This section includes the geometrical and physical data of the lattice structures employed in this work and summarizes the experimental setup employed to characterize and study the fatigue behavior of the lattice structures.

2.1. Material, Cell Topology and Specimen Shape and Dimension

The bulk material used for the printing process of the FCC and Diamond lattices is the AlSi10Mg, whose mechanical properties are reported in Table 1. Two different periodic truss structures are selected and printed by L-PBF. For the first one, the periodic structure is obtained by the combination of 8 Simple Cubic and 1 Face Centered Cubic (FCC) cell. For the second one, a Diamond cell topology is used. Both configurations are designed with the unit length and strut diameter of 5 and 0.6 mm, respectively, while the corresponding relative density (ρ) is 7.3% and 7.0% for FCC and Diamond cell, respectively.
This specimen design is meant to be representative of a sandwich panel used as a heat dissipator with an upper and lower solid skin of 1.5 mm, see Figure 1. The core is characterized by two unit cells along the vertical direction, for a total height of the specimen of 13 mm, while four unit cells are considered along the lateral direction, corresponding to a total width of 20 mm. Such a configuration is designed to investigate the structural behavior under bending vibration, and, for this reason, the longitudinal dimension is designed to be dominant. The specimen length with 19 unit cells, for a total length of 95 mm, leads to a lattice gauge section of 4 × 2 × 19. Due to experimental requirements, the specimens are equipped with a solid part that serves as a rigid connection between the lattice structure and the shaker. Such a region has a circular geometry with a diameter of 42 mm with six equally spaced holes for proper clamping on the shaker. A transition region characterized by a growing lattice section (C-shaped fillet) is designed between the clamped solid and lattice structure to avoid possible stress concentration and fatigue damage near the clamped region in the solid-lattice interface. All the specimens were printed with a SLM280-1.0 printer (SLM-Solutions, Lubeck, Germany) driven with laser power of 350 W, scanning speed of 1150 mm/s, layer thickness of 50 μm, and hatching distance of 0.17 mm. The angle between the longitudinal direction of the sample and the build direction was set equal to 30°. Such process parameters have been selected as the result of an optimization procedure for printing lattice structures.

2.2. Experimental Tests and Setup

Three distinct types of experimental tests have been performed on the lattice specimens in the attempt to study their fatigue behavior: (i) a linear sweep test is firstly carried out for the dynamic characterization of the structure; (ii) an endurance and (iii) a random test have been designed to study the fatigue response.
For all the tests, the lattice sandwich is excited through an imposed vertical acceleration, which is feedback-controlled for the entire duration of the experiments. To this end, an air-cooled S452 series (Unholtz-Dickie Corp., Wallingford, CT, USA) one-axis electrodynamic shaker (as shown in Figure 2a) is employed, which can provide a maximum acceleration and force of 90 g and 20 KN. The acceleration control is implemented using a ±50 g PCB accelerometer (with a sensitivity of 104 mV/g) rigidly connected to the shaker piston and able to measure the vertical component of the acceleration. Two different accelerometers have been bonded to measure the base and tip accelerations. A triaxial accelerometer with a measurement range of ±500 g and a sensitivity of 10.41 mV/g is used to measure the tip acceleration, while two PCB piezoelectric uniaxial accelerometers with a measurement range ±50 g and a sensitivity of 100.2 mV/g have been bonded on the base of the specimen. Such a measurement point corresponds to the input location in the numerical models, as will be discussed more in detail later in the paper. The accelerometers are connected to a Sensor Signal Control Model 483C Series (PCB Piezotronic Inc., Depew, NY, USA) which, in turn, is connected to the data acquisition system (DAQ), consisting of a NI 9239 board, able to save the measured data with a sampling frequency of 5 kHz.
Under this configuration, the imposed acceleration can be considered sufficiently accurate and stable enough to perform the tests, provided that the tightening torque does not affect the dynamic behavior of the specimen. Finally, a pair of masses are placed at the tip of the specimen in such a way to preserve a symmetric mass distribution when the accelerometer is connected to the structure, as shown in Figure 2b. The total added mass is 50 g.

2.2.1. Sweep Frequency Test

The aim of the sweep test is to identify the first natural frequency, damping ratio and Frequency Response Function (FRF) of the FCC and Diamond lattice specimens. Such information is necessary to qualify the real stresses induced within the lattice structure and to validate the numerical model, which is preparatory for the fatigue life estimation. Practically, the frequency sweep is provided in terms of constant amplitude acceleration spanning a defined range of frequencies, which are centered in the neighborhood of the first natural frequency for both the FCC and Diamond configurations. That is, between 375–425 Hz and 325–375 Hz respectively for a time of 200 s. The acceleration levels for FCC and Diamond lattice specimen are set equal to 0.2 g and 0.11 g respectively, which is sufficiently low to avoid nonlinear interactions or failures within the lattice. The FRF is evaluated using the H1 estimator considering the base and tip accelerations as input and output. For the results hereafter presented, the goodness of the estimation is verified by way of the coherence function γ , which is observed to be always close to 1. The first natural frequency ω 0   and corresponding damping ratio ξ are estimated through the frequency response function by way of the Half-Power Method. That is:
ξ = ω 2 2 ω 1 2 4 ω 0 2
which is considered independent of the amplitude at this stage of the work.

2.2.2. Endurance Test

The endurance tests have been performed imposing a monochromatic excitation. This is necessary to define the SN curve for the fatigue life of the lattice prototypes. The excitation frequency corresponds to the first bending mode of the lattice sandwich. The state of stress of the prototype is estimated combining the measured acceleration at the tip and at the clamp and the numerical model. In the case at hand, five FCC and four Diamond specimens, have been tested in resonance imposing a base acceleration necessary to achieve tip displacements of 0.31 and 0.2 mm. From the numerical models, the corresponding stresses are estimated, as will be discussed in the following sections. At failure of some of the lattice elements, there is a change in the natural frequency of the prototype. After this point, the lattice structure experiences a softening behavior that is more pronounced for damaged specimens. For the scope of this work, a linear model and linear identification of the relevant parameters is considered sufficiently accurate to capture the first-order variations of the natural frequency, which is a blueprint of the local degradation within the core of the lattice sandwich.

2.2.3. Random Test

Random excitation fatigue tests are also considered to meet excitation levels and spectra that are more consistent with real applications, especially in the context of aerospace and mechanical engineering. To this end, the PSD reported in Table 2 has been employed to investigate the fatigue life.
Such a spectrum is scaled to meet two distinct excitation levels (the data in Table 2 are reduced by a factor of 10 and 15, respectively) and are applied for 1 and 2 h in the same experimental configuration detailed in Section 2.2. It is expected that during the experimental tests, the specimen experiences a modification of the first natural frequency which can be captured by a careful post-processing of the acceleration levels.

3. Numerical Models

The numerical models employed in this manuscript are of fundamental importance to provide an estimate of the stress levels within the lattice structure starting from the accelerations measured during the experimental tests. To this end, four distinct numerical models have been developed using the commercial software Abaqus. Specifically, a discrete model and a homogeneous one have been considered for each specimen type. The discrete model describes the full three-dimensional topology and dynamics of the FCC and Diamond configurations, while in the homogeneous models the lattice structure is replaced by a solid with equivalent properties. To simulate the homogenized response of the lattice structures, single cell models were developed and Periodic Boundary Conditions (PBC) were implemented coupling the degrees of freedom of different points on opposite faces of the reference volume element with a proper set of equations [31,32]. A graphical representation of such models is illustrated in Figure 3.
To model the interaction between shaker and specimen, the counterbore and the circular region below the solid are considered to be clamped to ground. A tetrahedral free mesh with 10 nodes quadratic elements (C3D10) is employed to discretize the spatial domain. The concentrated masses were modelled with two reference points kinematically coupled at the tip of the specimen, placed in the center of gravity of the two masses.
The material employed is AlSi10Mg, while the homogenized version of the model includes the elastic properties listed in Table 3.
The validation of the numerical models has been performed by comparing the experimental (evaluated through a frequency sweep test) and numerical acceleration response in terms of resonance frequency ω 0 and amplitude | A ( ω 0 ) | . For each model, a structural damping ratio of 0.21% and 0.31% has been considered for the FCC and Diamond. These values represent the mean values of experimental damping ratios measured during the experiments. The FRF of the FE models have been numerically computed imposing a constant acceleration of 1 g in the frequency range between 350 Hz and 450 Hz for the FCC specimen, and 300–400 for the diamond configuration. The results are listed in Table 4, along with the corresponding modeshapes, which are displayed in Figure 4 together with the mean value and standard deviation of the experimental results measured on 10 and 9 specimens for the FCC and Diamond cell respectively. The numerical models slightly overestimate the first natural frequency ω 0   with an error of about 3–4% for the homogenized model increasing to 5–8% for the discrete model. The error in the numerical prediction of the amplitude | A ( ω 0 ) | is 4–5% without a significant effect of the cell topology or the employed numerical model. These differences can be attributed to the geometrical differences and the variability in the damping that are introduced during the manufacturing process.
It is worth remarking that the homogenized model is less computationally expensive and the global dynamic behavior in the neighborhood of the first natural frequency is well captured with an acceptable error. On the contrary, the discrete model requires a refined mesh due to the peculiar geometry, but it is fundamental for the analysis of the local failures and stress concentrations.

Numerical Analyses for Failure Identification

A generally accepted method for the failure identification in the context of mechanical systems captures the natural frequency changes in response to a variation of mechanical properties. It is assumed that the failure of crossing struts is responsible for such a change. A graphical example is illustrated in Figure 5 and implemented in the numerical model in terms of broken strut, Figure 5a, and missing node, Figure 5b.
The concept is elucidated in the numerical frequency responses displayed in Figure 5c,d for FCC and Diamond specimens, respectively. As expected, a broken strut (red line) leads to a small frequency change, while a missing node (blue line) affects the resonance frequency in a more evident way, which leads also to a visible reduction also in terms of tip acceleration.
The numerical results of as-designed and induced damage for FCC and Diamond lattice models are reported in Table 5. For the FCC cell, the failure of a strut induces a reduction of about 0.14% and 17.4% of the natural frequency and tip acceleration. A more significant damage is given by a node failure when the frequency and tip acceleration decrease of about 0.5% and 61.9%. For the Diamond cell, a similar trend is visible but with a smaller drop of the frequency and tip acceleration since the strut connectivity is much higher.
Based on these numerical results, we set the failure condition corresponding to the failure of a single strut. For the endurance tests under resonant conditions, this condition leads to an acceleration drop of about 15% and 1.5% for the FCC and Diamond specimens, respectively. For the random tests, a frequency reduction of 0.14% and 0.05% is employed.

4. Experimental Results

This section describes the experimental results for the endurance and random tests, which are carried out assuming the criteria of failure identification defined in the previous chapter, i.e., acceleration drops and natural frequency variations for endurance and random test, respectively.

4.1. Endurance Test

A number of lattice specimens have been tested in order to have enough data for the SN diagrams. That is, five FCC prototypes and four for Diamond specimens. The results for the FCC and Diamond samples are reported in Table 6 and Table 7, in terms of tip displacement, excitation frequency, failure time, and number of cycles to failure (dependent from failure time and excitation frequency).
As mentioned in the previous section, acceleration drops of about 15% and 1.5% are considered sufficiently high to be representative to a failure condition. A representative example is shown in Figure 6 in terms of time history for FCC and Diamond specimens (number 7 and 4).
As expected, the tip acceleration for FCC specimens, displayed in Figure 6a, suddenly decreases after 88 s approximately, which is a blueprint of natural frequency decrease. According to the above arguments, a 15% reduction of the tip acceleration is representative of a variation in natural frequency caused by the failure of the most loaded strut within the lattice. A similar dynamic response is observed also for the FCC specimen number 8 and 9. In contrast, a different behavior is noticed for the Diamond, as shown in Figure 6b. That is, the Diamond specimens exhibit a smoother acceleration drop. For the sample number 4, the failure time is 102.2 s at 349.6 Hz (35,729 cycles), corresponding to a tip displacement of about 0.32 mm.
As expected, Table 6 and Table 7 show that the fatigue life increases as the tip displacement decreases, which corresponds to lower stresses within the lattice and, therefore, a longer fatigue life. The results discussed within this section will be used later in the paper to validate the SN diagram representative of the lattice metamaterial, which is necessary to also estimate the fatigue life under random excitation.

4.2. Random Tests

In contrast with the endurance tests, here, the failure identification is based on a frequency drop of about 0.14% and 0.05% the nominal value for the FCC and diamond prototypes, above which the lattice sandwich is considered as damaged. Figure 7a,b and Figure 8a,b are the spectrograms that show the frequency evolution in time relative to the FCC specimen number 4 and Diamond specimen number 7. Here, the frequency response function estimator H1 is computed windowing the time interval with a moving time window and displayed in the figures with a colored surface. The natural frequency evolution is tracked and reported with a red line in Figure 7c and Figure 8c. The failure time is identified as the intersection between the red line and the horizontal dashed blue line, which corresponds to the threshold value representative of the failure computed numerically.
The FCC specimen number 4 fails after 2035 s, after which there is a further natural frequency decrease until the end of the test. The specimen number 3 and 4 have been tested through a PSD with reduced amplitude (10 times lower), while specimen number 2 and 5 have been tested with 1/15 of the nominal amplitude, see Table 2. The experimental results for the number of tested specimens are reported in Table 8 and Table 9, in terms of failure time and frequency drops.

5. Fatigue Life Analysis

Now, the fatigue behavior of lattice structures tested under resonant conditions and random dynamic loads is studied by combining the experimentally computed number of cycles to failure, along with the numerical stress computed through the FE models.
The discrete models, see Figure 3, are employed to estimate the stresses within the lattice sandwich. That is, a number of FE analyses are performed to map the stresses as a function of the tip displacement (relative to the base) and damping ratio. The state of stress is computed through the numerical procedure presented in Ref. [26], which allows to evaluate an equivalent stress amplitude based on the application of the Sines criterion for each surface node i:
σ a , e q i = σ V M , a i 1 I 1 , m i R m
where σ V M , a i and I 1 , m i are the equivalent Von Mises stress amplitude and the first invariant. The map of the maximum equivalent stress amplitude in the lattice structure, displayed in Figure 9, has been obtained as interpolation of numerical results obtained for different values of imposed base acceleration and damping ratios.

5.1. Fatigue Life Evaluation under Resonant Conditions

The tip displacement and the damping ratio measured during the experimental tests under resonant conditions are introduced as input in Figure 9, which returns the associated stress amplitude level. Figure 10 shows the position of such points in the SN diagram of the bulk material in as-built condition, obtained from previous tests performed on solid specimens printed in the vertical direction with a loading ratio R = −1 [33].
Regarding the FCC configuration, four points lie within the 95% scatter band, while only one point is located outside. In contrast, for the Diamond configuration the data points are more scattered and, some of them, fall outside the 95% scatter band. This behavior can be attributed to several factors. Firstly, the time histories of the endurance tests are characterized by a less regular trend: at the beginning of the test, the acceleration increases and later decreases, which can be due to nonlinear interactions, see Figure 6. This modifies the actual starting point (with maximum amplitude) of the analysis. The differences can be also attributed to the manufacturing process, which introduces high variability in the printed dimension, especially in correspondence of the crossing points between lattice struts. In this context, a mismodelling of the fillet radius can be a source of errors in the stress estimation, and therefore, in the SN data points.
Despite these discrepancies, the SN curve of bulk material, combined with the numerical model can be considered an effective method to predict the fatigue life of lattice structures through standard fatigue design criteria.

5.2. Damage Evaluation under Random Fatigue Loads

To compute the equivalent stress, a Rainflow-counting algorithm is applied to the measured acceleration and, therefore, the corresponding displacement [34]. The algorithm computes a matrix with the alternate displacement as well as the relative occurrence. Such information is employed to evaluate the equivalent stress amplitude (through the map in Figure 9) which, when combined with the number of occurrences, are the necessary data to compute the cumulative damage to the FCC and Diamond lattice specimens using Miner’s rule and the SN diagram reported in Figure 10. According to [33], the fatigue limit of bulk material is set equal to 50 MPa. Below this value, the Haibach assumption is used for damage evaluation. Results are reported in Table 10 and Table 11.
Some considerations follow. The use of dynamic models with the Miner’s rule predicts cumulative damage between 0.9 and 1.55 for the FCC specimens, while for the Diamond lattice between 0.93 and 1.37. The theoretical failure occurs when the damage reaches 1, considering the range reported in the table, the evaluation of fatigue damage can be considered acceptable. These results are also in line with values obtained in [35].

6. Conclusions

In this study, the fatigue behavior of lattice structures under random cyclic loads has been numerically and experimentally investigated, providing a guideline for the assessment of lattice structures. The analysis is performed onto two distinct cell topologies, i.e., FCC and Diamond-based, which have been experimentally studied through different testing procedures, i.e., sweep, endurance and random tests. The modification in the dynamic response of the lattice sandwich during the experimental tests have been simulated through finite element analyses of the structure with induced defects (broken strut or missing node). Based on these numerical results, failure in vibration fatigue tests is defined as the acceleration change or frequency drop as induced by the failure of a single strut.
Based on the SN diagram of the bulk material, the fatigue life of FCC and Diamond specimens under resonant conditions is predicted with good accuracy by defining an equivalent stress amplitude as a function of the tip displacement and damping. Under random vibrations, fatigue damage is accomplished by using the SN curve of the bulk material, the Rainflow’s algorithm and Miner’s rule. The predicted results have been shown to be consistent with the failure observed during the tests, with damage values in the range between 0.9–1.55 and 0.93–1.37 for the FCC and Diamond lattice specimens.

Author Contributions

M.P.: formal analysis, investigation, writing—original draft, visualization; M.G.C.: formal analysis, investigation; S.B.: conceptualization, writing—review and editing, funding acquisition; E.R.: investigation, writing—original draft; F.B.: conceptualization, resources; S.F.: conceptualization, writing—review and editing, supervision, project administration. All authors have read and agreed to the published version of the manuscript.

Funding

This research received no external funding.

Institutional Review Board Statement

Not applicable.

Informed Consent Statement

Not applicable.

Data Availability Statement

The data presented in this study are available on request from the corresponding author.

Acknowledgments

The Italian Ministry of Education, University and Research is acknowledged for the support provided through the ”Department of Excellence LIS4.0—Lightweight and Smart Structures for Industry 4.0” Project. Material for experiments was supplied by Leonardo Electronics S.p.A. Their support of research activities is greatly acknowledged.

Conflicts of Interest

The authors declare no conflict of interest.

References

  1. Tancogne-Dejean, T.; Diamantopoulou, M.; Gorji, M.B.; Bonatti, C.; Mohr, D. 3D Plate-Lattices: An Emerging Class of Low-Density Metamaterial Exhibiting Optimal Isotropic Stiffness. Adv. Mater. 2018, 30, 1–6. [Google Scholar] [CrossRef]
  2. Kolken, H.M.A.; Zadpoor, A.A. Auxetic mechanical metamaterials. RSC Adv. 2017, 7, 5111–5129. [Google Scholar] [CrossRef] [Green Version]
  3. Scalzo, F.; Totis, G.; Vaglio, E.; Sortino, M. Experimental study on the high-damping properties of metallic lattice structures obtained from SLM. Precis. Eng. 2021, 71, 63–77. [Google Scholar] [CrossRef]
  4. Tancogne-Dejean, T.; Spierings, A.B.; Mohr, D. Additively-manufactured metallic micro-lattice materials for high specific energy absorption under static and dynamic loading. Acta Mater. 2016, 116, 14–28. [Google Scholar] [CrossRef]
  5. Maconachie, T.; Leary, M.; Lozanovski, B.; Zhang, X.; Qian, M.; Faruque, O.; Brandt, M. SLM lattice structures: Properties, performance, applications and challenges. Mater. Des. 2019, 183, 108137. [Google Scholar] [CrossRef]
  6. Lira, C.; Scarpa, F.; Rajasekaran, R. A gradient cellular core for aeroengine fan blades based on auxetic configurations. J. Intell. Mater. Syst. Struct. 2011, 22, 907–917. [Google Scholar] [CrossRef]
  7. Spadoni, A.; Ruzzene, M.; Scarpa, F. Dynamic response of chiral truss-core assemblies. J. Intell. Mater. Syst. Struct. 2006, 17, 941–952. [Google Scholar] [CrossRef] [Green Version]
  8. Colombo, C.; Biffi, C.; Fiocchi, J.; Scaccabarozzi, D.; Saggin, B.; Tuissi, A.; Vergani, L. Modulating the damping capacity of SLMed AlSi10Mg trough stress-relieving thermal treatments. Theor. Appl. Fract. Mech. 2020, 107, 1–6. [Google Scholar] [CrossRef]
  9. Fiocchi, J.; Biffi, C.A.; Scaccabarozzi, D.; Saggin, B.; Tuissi, A. Enhancement of the Damping Behavior of Ti6Al4V Alloy through the Use of Trabecular Structure Produced by Selective Laser Melting. Adv. Eng. Mater. 2020, 22, 1–6. [Google Scholar] [CrossRef]
  10. Liu, J.; Guo, K.; Sun, J.; Sun, Q.; Wang, L.; Li, H. Compressive behavior and vibration-damping properties of porous Ti-6Al-4V alloy manufactured by laser powder bed fusion. J. Manuf. Process. 2021, 66, 1–10. [Google Scholar] [CrossRef]
  11. Zadeh, M.N.; Alijani, F.; Chen, X.; Dayyani, I.; Yasaee, M.; Mirzaali, M.J.; Zadpoor, A.A. Dynamic characterization of 3D printed mechanical metamaterials with tunable elastic properties. Appl. Phys. Lett. 2021, 118, 211901. [Google Scholar] [CrossRef]
  12. Benedetti, M.; du Plessis, A.; Ritchie, R.; Dallago, M.; Razavi, S.; Berto, F. Architected cellular materials: A review on their mechanical properties towards fatigue-tolerant design and fabrication. Mater. Sci. Eng. R Rep. 2021, 144, 100606. [Google Scholar] [CrossRef]
  13. Yavari, S.A.; Ahmadi, S.; Wauthle, R.; Pouran, B.; Schrooten, J.; Weinans, H.; Zadpoor, A.A. Relationship between unit cell type and porosity and the fatigue behavior of selective laser melted meta-biomaterials. J. Mech. Behav. Biomed. Mater. 2015, 43, 91–100. [Google Scholar] [CrossRef]
  14. Van Hooreweder, B.; Apers, Y.; Lietaert, K.; Kruth, J.-P. Improving the fatigue performance of porous metallic biomaterials produced by Selective Laser Melting. Acta Biomater. 2017, 47, 193–202. [Google Scholar] [CrossRef] [PubMed]
  15. Ahmadi, S.; Hedayati, R.; Li, Y.; Lietaert, K.; Tümer, N.; Fatemi, A.; Rans, C.; Pouran, B.; Weinans, H.; Zadpoor, A.; et al. Fatigue performance of additively manufactured meta-biomaterials: The effects of topology and material type. Acta Biomater. 2018, 65, 292–304. [Google Scholar] [CrossRef] [Green Version]
  16. Zhao, S.; Li, S.; Wang, S.; Hou, W.; Li, Y.; Zhang, L.; Hao, Y.; Yang, R.; Misra, R.; Murr, L. Compressive and fatigue behavior of functionally graded Ti-6Al-4V meshes fabricated by electron beam melting. Acta Mater. 2018, 150, 1–15. [Google Scholar] [CrossRef]
  17. Yavari, S.A.; Wauthle, R.; van der Stok, J.; Riemslag, A.; Janssen, M.; Mulier, M.; Kruth, J.; Schrooten, J.; Weinans, H.; Zadpoor, A.A. Fatigue behavior of porous biomaterials manufactured using selective laser melting. Mater. Sci. Eng. C 2013, 33, 4849–4858. [Google Scholar] [CrossRef] [PubMed]
  18. Abad, E.M.K.; Khanoki, S.A.; Pasini, D. Fatigue design of lattice materials via computational mechanics: Application to lattices with smooth transitions in cell geometry. Int. J. Fatigue 2013, 47, 126–136. [Google Scholar] [CrossRef] [Green Version]
  19. Dobson, S.D.; Starr, T.L. Powder characterization and part density for powder bed fusion of 17-4 PH stainless steel. Rapid Prototyp. J. 2020, 27, 53–58. [Google Scholar] [CrossRef]
  20. Donik, Č.; Kraner, J.; Paulin, I.; Godec, M. Influence of the Energy Density for Selective Laser Melting on the Microstructure and Mechanical Properties of Stainless Steel. Metals 2020, 10, 919. [Google Scholar] [CrossRef]
  21. Ullah, A.; Wu, H.; Rehman, A.U.; Zhu, Y.; Liu, T.; Zhang, K. Influence of laser parameters and Ti content on the surface morphology of L-PBF fabricated Titania. Rapid Prototyp. J. 2020, 27, 71–80. [Google Scholar] [CrossRef]
  22. Pal, S.; Lojen, G.; Gubeljak, N.; Kokol, V.; Drstvensek, I. Melting, fusion and solidification behaviors of Ti-6Al-4V alloy in selective laser melting at different scanning speeds. Rapid Prototyp. J. 2020, 26, 1209–1215. [Google Scholar] [CrossRef]
  23. Pawlak, A.; Szymczyk-Ziółkowska, P.; Kurzynowski, T.; Chlebus, E. Selective laser melting of magnesium AZ31B alloy powder. Rapid Prototyp. J. 2019, 26, 249–258. [Google Scholar] [CrossRef]
  24. Liang, C.; Hu, Y.; Liu, N.; Zou, X.; Wang, H.; Zhang, X.; Fu, Y.; Hu, J. Laser Polishing of Ti6Al4V Fabricated by Selective Laser Melting. Metals 2020, 10, 191. [Google Scholar] [CrossRef] [Green Version]
  25. Dallago, M.; Raghavendra, S.; Luchin, V.; Zappini, G.; Pasini, D.; Benedetti, M. The role of node fillet, unit-cell size and strut orientation on the fatigue strength of Ti-6Al-4V lattice materials additively manufactured via laser powder bed fusion. Int. J. Fatigue 2020, 142, 105946. [Google Scholar] [CrossRef]
  26. Boniotti, L.; Beretta, S.; Patriarca, L.; Rigoni, L.; Foletti, S. Experimental and numerical investigation on compressive fatigue strength of lattice structures of AlSi7Mg manufactured by SLM. Int. J. Fatigue 2019, 128, 105181. [Google Scholar] [CrossRef]
  27. Yang, L.; Yan, C.; Cao, W.; Liu, Z.; Song, B.; Wen, S.; Zhang, C.; Shi, Y.; Yang, S. Compression–compression fatigue behaviour of gyroid-type triply periodic minimal surface porous structures fabricated by selective laser melting. Acta Mater. 2019, 181, 49–66. [Google Scholar] [CrossRef]
  28. Kelly, C.N.; Francovich, J.; Julmi, S.; Safranski, D.; Guldberg, R.E.; Maier, H.J.; Gall, K. Fatigue behavior of As-built selective laser melted titanium scaffolds with sheet-based gyroid microarchitecture for bone tissue engineering. Acta Biomater. 2019, 94, 610–626. [Google Scholar] [CrossRef]
  29. Bobbert, F.; Lietaert, K.; Eftekhari, A.A.; Pouran, B.; Ahmadi, S.; Weinans, H.; Zadpoor, A.A. Additively manufactured metallic porous biomaterials based on minimal surfaces: A unique combination of topological, mechanical, and mass transport properties. Acta Biomater. 2017, 53, 572–584. [Google Scholar] [CrossRef] [PubMed] [Green Version]
  30. Richard, B.; Pellicone, D.; Anderson, W.G. Progress on the Development of a 3D Printed Loop Heat Pipe. In Proceedings of the 2019 35th Semiconductor Thermal Measurement, Modeling and Management Symposium (SEMI-THERM), San Jose, CA, USA, 18–22 March 2019; pp. 1–11. [Google Scholar]
  31. Schmitz, A.; Horst, P. A finite element unit-cell method for homogenised mechanical properties of heterogeneous plates. Compos. Part A Appl. Sci. Manuf. 2014, 61, 23–32. [Google Scholar] [CrossRef]
  32. Tancogne-Dejean, T.; Mohr, D. Elastically-isotropic truss lattice materials of reduced plastic anisotropy. Int. J. Solids Struct. 2018, 138, 24–39. [Google Scholar] [CrossRef]
  33. Sausto, F.; Carrion, P.; Shamsaei, N.; Beretta, S. Fatigue failure mechanisms for AlSi10Mg manufactured by L-PBF under axial and torsional loads: The role of defects and residual stresses. Int. J. Fatigue 2021, submit. [Google Scholar]
  34. Lee, Y.L.; Tjhung, T. Rainflow Cycle Counting Techniques; Elsevier Inc.: Amsterdam, The Netherlands, 2012. [Google Scholar] [CrossRef]
  35. Nourian-Avval, A.; Fatemi, A. Variable amplitude fatigue behavior and modeling of cast aluminum. Fatigue Fract. Eng. Mater. Struct. 2021, 44, 1611–1621. [Google Scholar] [CrossRef]
Figure 1. (a,b) FCC and Diamond specimen modelled with nTopology. (c,d) FCC and Diamond lattice specimens made by L-PBF.
Metals 11 01395 g001
Figure 2. (a) Lateral view of the electrodynamic shaker with mounted FCC specimen. (b) Axonometric view of the structure. A set of accelerometers is bonded on the tip, base and shaker piston, while a pair of masses have been rigidly connected on the tip to tailor the desired dynamic behavior.
Metals 11 01395 g002
Figure 3. (a,b) Discrete model of FCC and Diamond lattice structure. (c) Homogenized lattice model.
Metals 11 01395 g003
Figure 4. First shape mode of (a,b) the homogenized models and (c,d) the discrete models.
Metals 11 01395 g004
Figure 5. Detailed view of the damage families considered in this work for the FCC lattice configuration. (a) Broken strut and (b) missing node. (c,d) FRF of the as-designed (black line) and induced-damage geometry (red and blue lines) for FCC and diamond cell respectively.
Metals 11 01395 g005
Figure 6. Accelerations measured in correspondence of the base and tip during the endurance tests. (a) FCC specimen number 7 and (b) Diamond specimen 4.
Metals 11 01395 g006
Figure 7. Spectrogram relative to the FCC specimen number 4 tested under random vibration. (a) Axonometric and (b) top view. The frequency trend is tracked and displayed in (c) for a better visualization of the failure time.
Metals 11 01395 g007aMetals 11 01395 g007b
Figure 8. Spectrogram relative to the Diamond specimen number 7 tested under random vibration. (a) Axonometric view and (b) top view. (c) Peak amplitude tracked in time to show the frequency drop.
Metals 11 01395 g008
Figure 9. Equivalent stress amplitude map for FCC specimens.
Metals 11 01395 g009
Figure 10. SN curve of the AlSi10Mg bulk material with superimposed SN data points associated to the FCC and Diamond configuration for resonant condition tests.
Metals 11 01395 g010
Table 1. Mechanical properties for the bulk material used for specimen fabrication.
MaterialElastic Modulus [MPa]Shear Modulus [MPa]Poisson’s Ratio Yield Stress [MPa]
AlSi10Mg68,00026,1540.3240
Table 2. PSD of imposed acceleration.
Frequency [Hz]Amplitude [g2/Hz]
150.04
1000.04
3000.17
10000.17
20000.05
Table 3. Homogenized mechanical elastic properties and yield strength of the FCC and Diamond unit cells.
Cell Typeρ [%]Elastic Modulus [MPa]Shear Modulus [MPa]Poisson’s RatioYield Stress [MPa]
FCC7.31371.4314.40.195.74
Diamond7.0174.1178.80.461.65
Table 4. First natural frequency and FRF of the numerical models and the results of the sweep tests.
Damping Ratio [%] f 0   [ Hz ] | A ( ω 0 ) |
FCCNumerical (Homogenized)0.21410.7244.5
Numerical (Discrete)0.21420.8243.9
Experimental *0.21 (0.03)399.2 (2.7)256.2 (31.7)
DiamondNumerical (Homogenized)0.31368.7166.2
Numerical (Discrete)0.31383.8166.0
Experimental *0.31 (0.08)353.8 (3.8)176.0 (25.5)
* Mean and standard deviation (in parentheses).
Table 5. Reduction of frequency and tip acceleration under resonant conditions through numerical models.
As-DesignedMissing StrutMissing Node
FCC f 0 [Hz]420.8420.2418.7
Tip acceleration [g]243.7201.492.9
Diamond f 0 [Hz]420.8420.2418.7
Tip acceleration [g]243.7201.492.9
Table 6. Endurance test results for the FCC specimen.
Specimen No.Tip Displacement [mm]Excitation Frequency [Hz]Failure Time [s]Cycle to Failure
70.3139888.235104
80.340099.239680
90.32392.571.428024
100.2400.4598.1239480
110.18396.3610.9242100
Table 7. Endurance tests results for the Diamond specimen.
Specimen No.Tip Displacement [mm]Excitation Frequency [Hz]Failure Time [s]Cycle to Failure
10.23352.6236.183249
20.25357.3421.1150460
30.33353.955.419606
40.32349.6102.235729
Table 8. Random test results for the FCC lattice specimens.
Specimen No.PSD TypeTest Duration [h]Initial Sweep Freq. [Hz]Mid-Sweep Freq. [Hz]Final Sweep Freq. [Hz]Initial FRFTime to Failure [s]
2/152398.9398.1397.5273.52400
3/101399.9/398.5198.22060
4/101400.8/397259.22035
5/152401.4401.4400.5273.84355
Table 9. Random tests result for the Diamond lattice specimens.
Specimen No.PSD TypeTest Duration [h]Initial Sweep Freq. [Hz]Mid-Sweep Freq. [Hz]Final Sweep Freq. [Hz]Initial FRFTime to Failure [s]
6/101358.9/357.8122.61620
7/101351.9/350.2169.3855
8/152353.7352.9352.6172.8Undamaged
9/152357.1356.3355.9151.82430
Table 10. Cumulative damage computed by Miner’s rule for the FCC specimens.
Specimen No.2345
Time to failure [s]2400206020354355
Damage to failure0.90.941.551.31
Table 11. Cumulative damage computed by Miner’s rule for the Diamond specimens.
Specimen No.6789
Time to failure [s]1620855/2430
Damage to failure1.370.93/1.18
Publisher’s Note: MDPI stays neutral with regard to jurisdictional claims in published maps and institutional affiliations.

