
Corrosion Behavior of Mg-xGd-1Zn-0.4Zr Alloys with Different Gd Additions for Biomedical Application

1
School of Materials Science and Engineering, Nanjing Institute of Technology, Nanjing 211167, China
2
Jiangsu Key Laboratory of Advanced Structural Materials and Application Technology, Nanjing 211167, China
*
Author to whom correspondence should be addressed.
Metals 2022, 12(10), 1763; https://doi.org/10.3390/met12101763
Submission received: 30 September 2022
/
Revised: 17 October 2022
/
Accepted: 18 October 2022
/
Published: 20 October 2022
(This article belongs to the Special Issue Corrosion Science and Engineering: Recent Research, Insights, and Challenges)
Abstract
:In recent years, Mg alloys have attracted increased attention for biomedical application owing to their good biodegradability, biocompatibility, and biomechanical properties. However, rapid corrosion is still one of the most common limitations for their implanted application. In this work, the microstructure and corrosion behavior of the solution- and aging-treated Mg-xGd-1Zn-0.4Zr (x = 3, 6, and 9 wt%, denoted as GZ31K, GZ61K, and GZ91K, respectively) alloys were studied using optical microscope (OM), scanning electron microscope (SEM), immersion tests, electrochemical tests, and quasi in situ corrosion method. The results show that block Gd-rich precipitates and needle-like Zr-Zn-rich precipitates are formed as well as α-Mg matrix. With the increase in Gd content, the precipitates increase and the grain size first reduces and then increases. Corrosion experiment results show that the GZ61K alloy has the best corrosion resistance and the GZ91K alloy shows the highest corrosion rate among the three alloys in simulated body fluid (SBF). It is found that α-Mg is preferentially corroded and the precipitates have better corrosion resistance as compared to the α-Mg matrix. The GZ61K alloy with the corrosion rate of 0.23 mm/y in SBF shows a promising prospect for biomedical application.
1. Introduction
Biomedical Mg alloys exhibit good biodegradability, biocompatibility, and biomechanical properties [1,2]. Compared with traditional metal materials, the biodegradable Mg alloys can effectively relieve the “stress shielding” effect and avoid the economic, physiological, and psychological burden brought by secondary surgical removal and thus show wide application prospects in cardiovascular stents, bone fixation scaffolds, and porous repair [3,4,5]. However, the corrosion rate of biomedical Mg alloys in physiological environment is high, which easily leads to the premature loss of mechanical integrity and support, thus restricting their application [6]. Therefore, improving corrosion resistance of Mg alloys is of great significance for its clinical application.
Alloying and heat treatment are important means to improve the corrosion properties of Mg alloys [7,8,9,10,11,12,13,14,15,16,17,18,19]. Rare earth (RE) Gd element can significantly improve the corrosion properties of Mg alloys [7,8,9,10,18,19]. The main reason is that when the Gd element is added into Mg-RE-Zn alloy, the microstructure is refined, and the long period stacking ordered (LPSO) or stacking fault (SF) structure is formed. The formation of LPSO or SF structure can not only limit grain growth, but also acts as a barrier between the α-Mg matrix and eutectic phase when it is distributed at the outer edge of matrix grains, thus reducing galvanic corrosion, protecting the matrix from corrosion, and improving the corrosion resistance of Mg-Gd-Zn series alloys [6,18,19]. Moreover, appropriate addition of Zn and Zr elements can refine the grain size as well as improve corrosion resistance of Mg alloys [11]. Nevertheless, it has also been reported that adding Gd into Mg alloys accelerates corrosion due to the noble MgxGd phase discontinuously distributed at the grain boundaries, which forms galvanic couples with the LPSO or matrix and acts as cathodic sites [20,21,22]. In addition, a solution treatment (T4 treatment) can homogenize the microstructure, and make the second phase partially or completely dissolve into the matrix, which reduces galvanic corrosion and improves corrosion resistance [23,24,25,26]. However, it has also been reported that the T4 treatment accelerates the corrosion of Mg alloy mainly due to the galvanic corrosion between the matrix and discontinuously distributed precipitates [18,27]. The aging treatment followed by the solution treatment (T6 treatment) may increase the microgalvanic couples formed between the precipitated phase and the matrix and then decrease the corrosion resistance of the solid solution [17]. On the other hand, studies have shown that the appropriate T6 treatment changes the distribution of second phase and then forms a dense protective film during corrosion. Furthermore, the aging treatment may release inner stress, and thus enhances the corrosion resistance [15,28]. Therefore, the effect of heat treatment on the corrosion properties of different Mg alloys is different.
In the present work, the Mg-xGd-1Zn-0.4Zr alloy was used as the research object, and the T6 treatment was carried out to study the effect of Gd content on the corrosion behavior of the alloy for biomedical application.
2. Experimental Procedure
The as-cast Mg-xGd-1Zn-0.4Zr (x = 3, 6, and 9 wt%, denoted as GZ31K, GZ61K, and GZ91K, respectively) alloys prepared by the gravity casting method [29] were first solution-treated at 535 °C × 12 h and then aged at 200 °C × 12 h. After aging, the samples were cooled in air. The chemical compositions of the prepared alloys were analyzed by inductively coupled plasma optical emission spectrometry (ICP-OES, iCAP 6300, Thermo-Fisher Scientific, Waltham, MA, USA). The nominal and analyzed compositions of the major alloying elements are listed in Table 1. Samples with diameter of 12 mm and thickness of 3 mm were cut for microstructure observation and corrosion tests. The surfaces of the samples were successively polished with 600, 1200, and 2000 grid sandpaper, and then polished with diamond paste. After etching by 4 wt% HNO3 alcohol solution and drying by warm air, the microstructures of the specimens were observed using optical microscope (OM, OLYMPUS GX51, Olympus, Tokyo, Japan) and scanning electron microscope (SEM, JSM-6360LV, JEOL, Tokyo, Japan) equipped with an energy dispersive X-ray spectroscope (EDS, Oxford Atec X-max 50, Oxford Company, Oxford, UK). The average grain size of the alloys was calculated by Image-Pro Plus software (Image-Pro Plus 6.0, Kebai Biotechnology, Nanjing, China).
The corrosion electrochemical behavior of the alloys in simulated body fluid (SBF, the composition was listed in Table 2) [18] was measured on a standard three-electrode system electrochemical workstation. The alloy was used as working electrode, platinum electrode as auxiliary electrode, and saturated calomel electrode as reference electrode. The electrochemical impedance spectrum (EIS) tests were conducted by an electrochemical workstation (PARSTAT2273, Ametek Company, Berwyn, PA, USA). At the beginning of the electrochemical testing, an open circuit potential was measured for 15 min to stabilize the potential. The scanning speed of the polarization curve is 1 mV/s. The amplitude of sine wave excitation signal used in EIS test is 10 mV, and the frequency range is 100 kHz~100 mHz.
The corrosion rates of the alloys were evaluated by mass loss and hydrogen evolution tests. The diameter, thickness, and mass of the samples were measured before immersion. A small hole was made on the edge of the sample wafer, and then it was suspended in the funnel. A collecting pipe filled with SBF was placed above the funnel to collect hydrogen. Moreover, 60 mL of SBF per 1 cm2 of sample surface area was used for the immersion experiment under water bath at 37 °C [30]. During the immersion process, the volume of hydrogen evolution was recorded every 1 h in the first 6 h, every 2 h in the next 6 h, and then every 12 h. SBF was renewed every 24 h for a total immersion time of 120 h to reduce the influence of pH value on corrosion of the samples. After immersion, the samples were cleaned for 5 min with a boiled solution (200 g/L CrO3 + 10 g/L AgNO3) to remove corrosion products on the surface, and were then weighed.
To further reveal the corrosion behavior of the alloys, quasi in situ corrosion was carried out using SEM to characterize the corrosion process. After the sample was immersed in SBF solution for 0, 3, 30, and 120 min, the EDS maps of Mg, Gd, Zn, Zr, and O were collected to observe the distribution of elements, and the corrosion morphology of the alloy was observed.
3. Results and Discussion
3.1. Microstructure
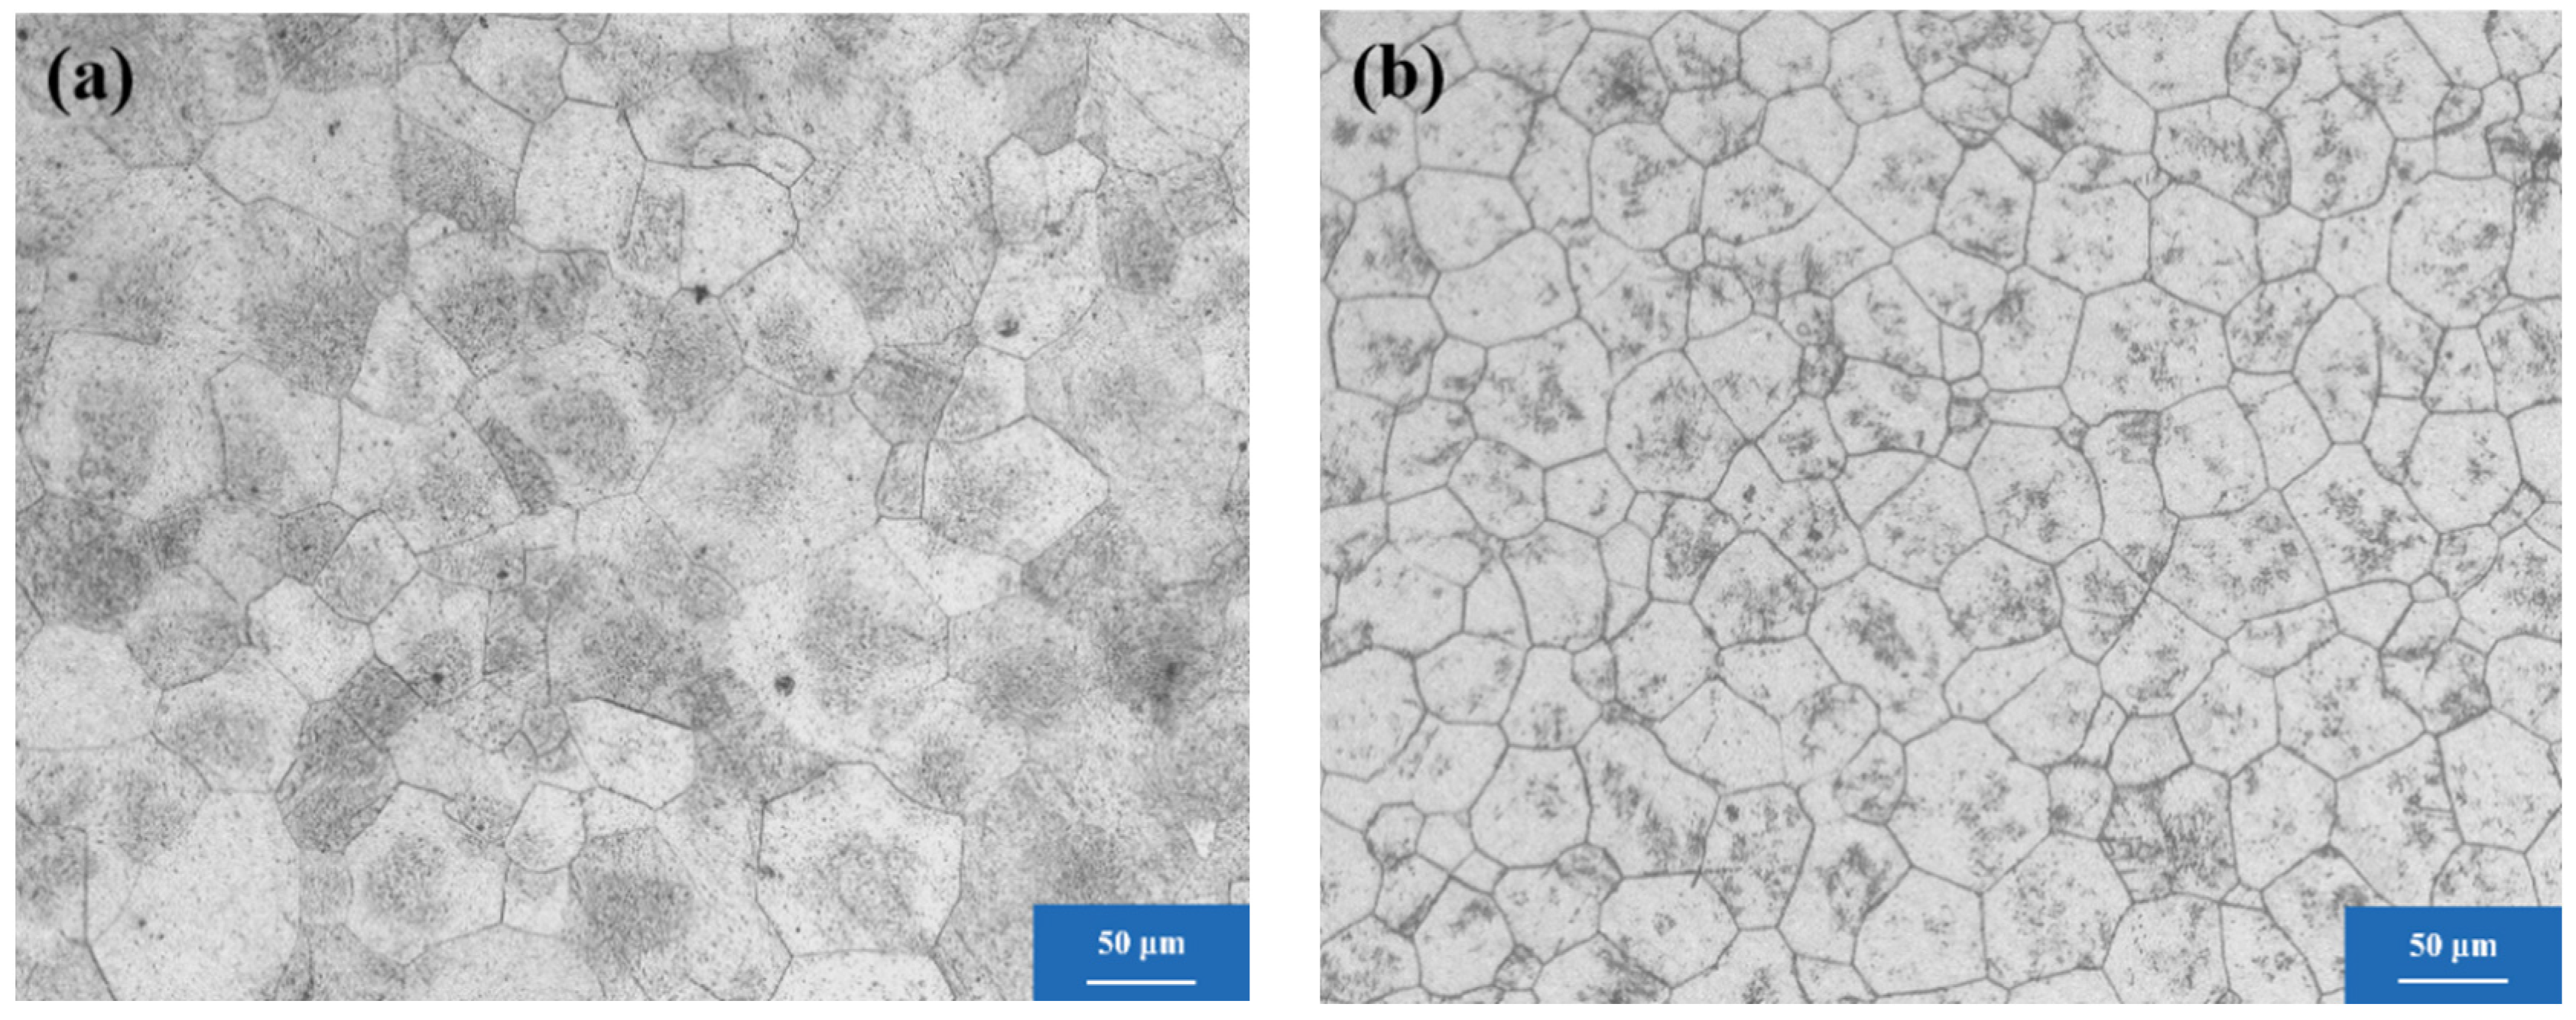
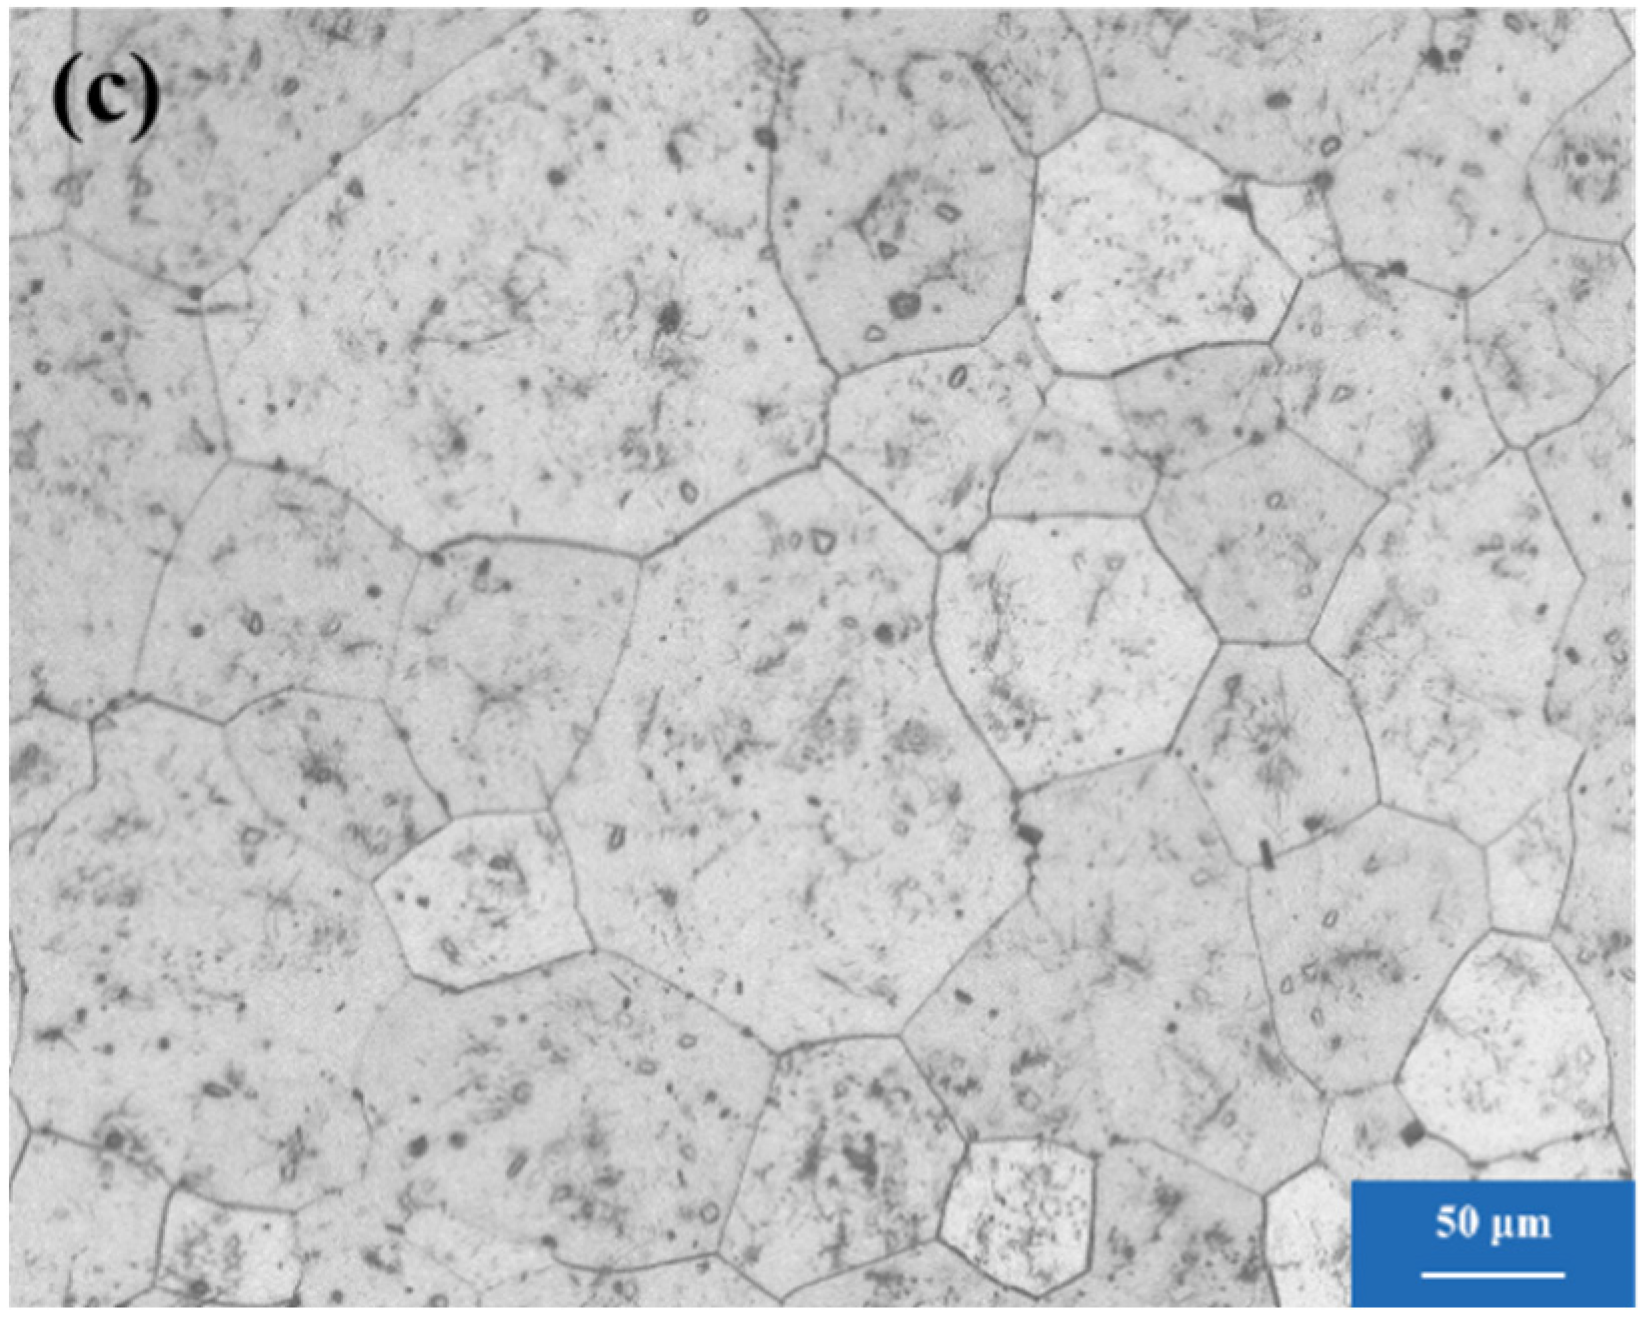
The OM micrographs of the T6-treated Mg-xGd-1Zn-0.4Zr alloys with different Gd contents are shown in Figure 1. The microstructures of the three alloys are composed of α-Mg matrix grains and tiny precipitates, which are distributed at grain boundaries and interiors. The matrix grains of GZ61K are the smallest and evenly distributed, while those of GZ91K are coarse and clearly unevenly distributed. The grain size distribution of the three alloys is shown in Figure 2, which shows that the grain size distribution of GZ61K is the most uniform. The average grain size of the three alloys is about 48.3, 41.9, and 76.7 μm, respectively, indicating that the grain size of the alloy increases first and then decreases with the increasing Gd addition.
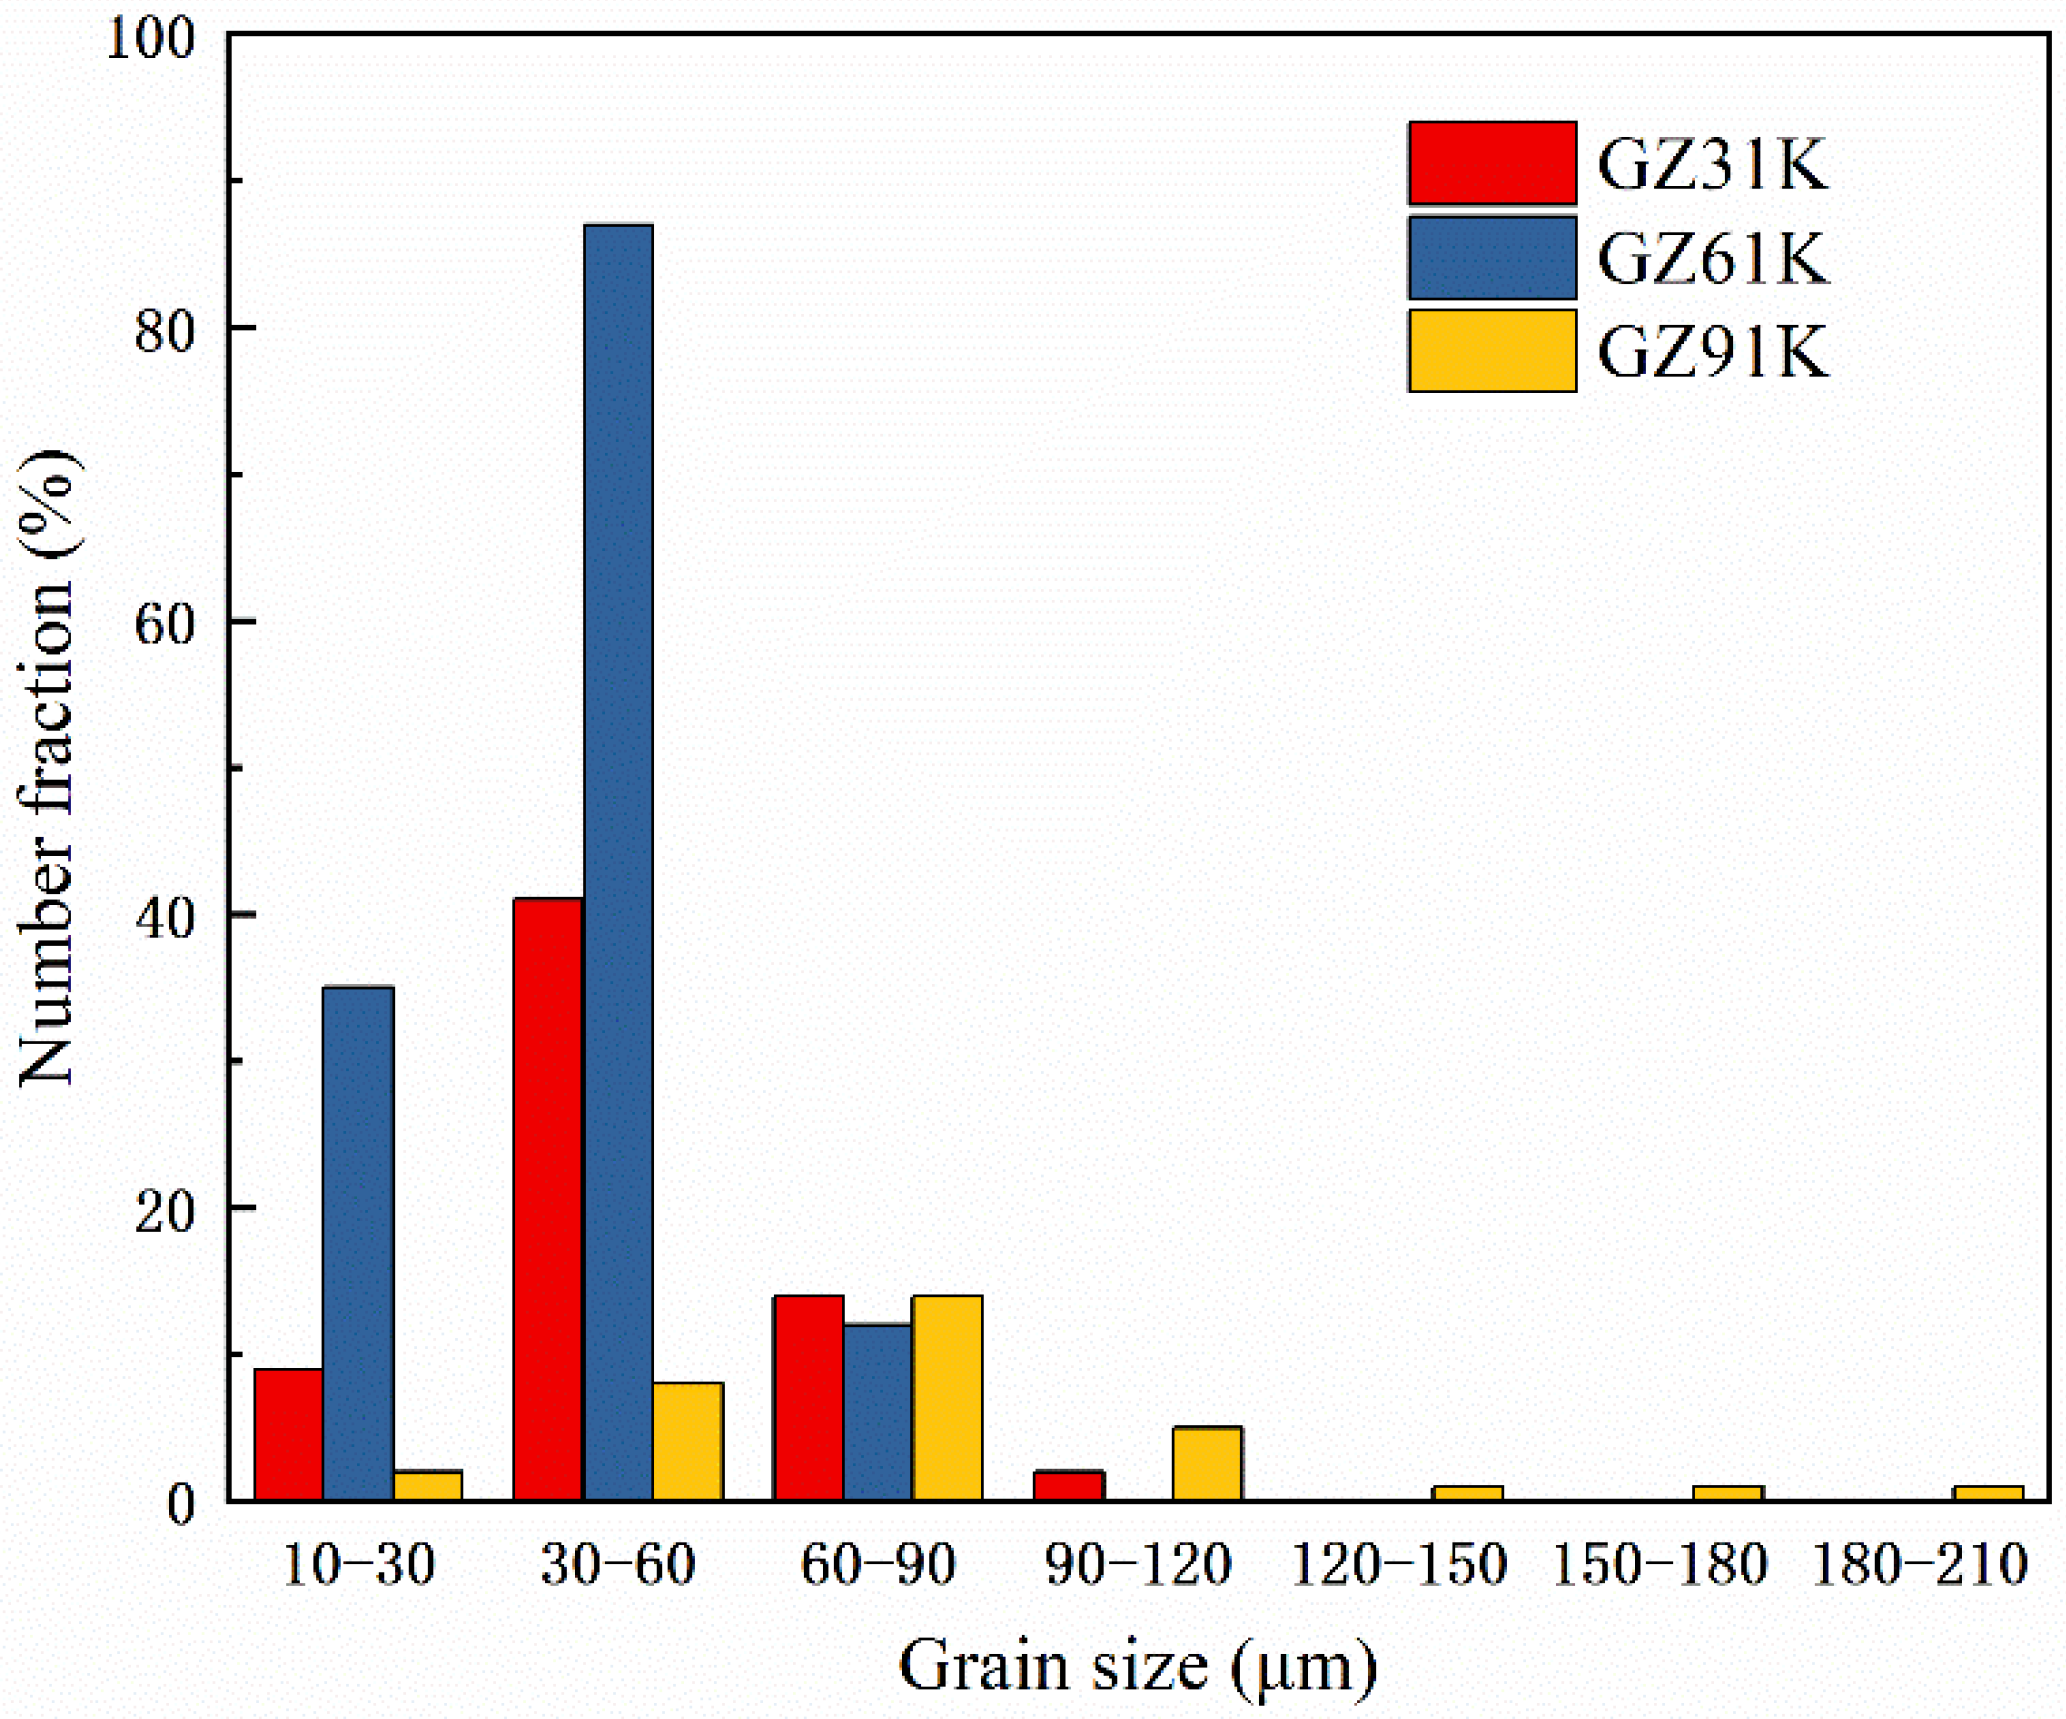
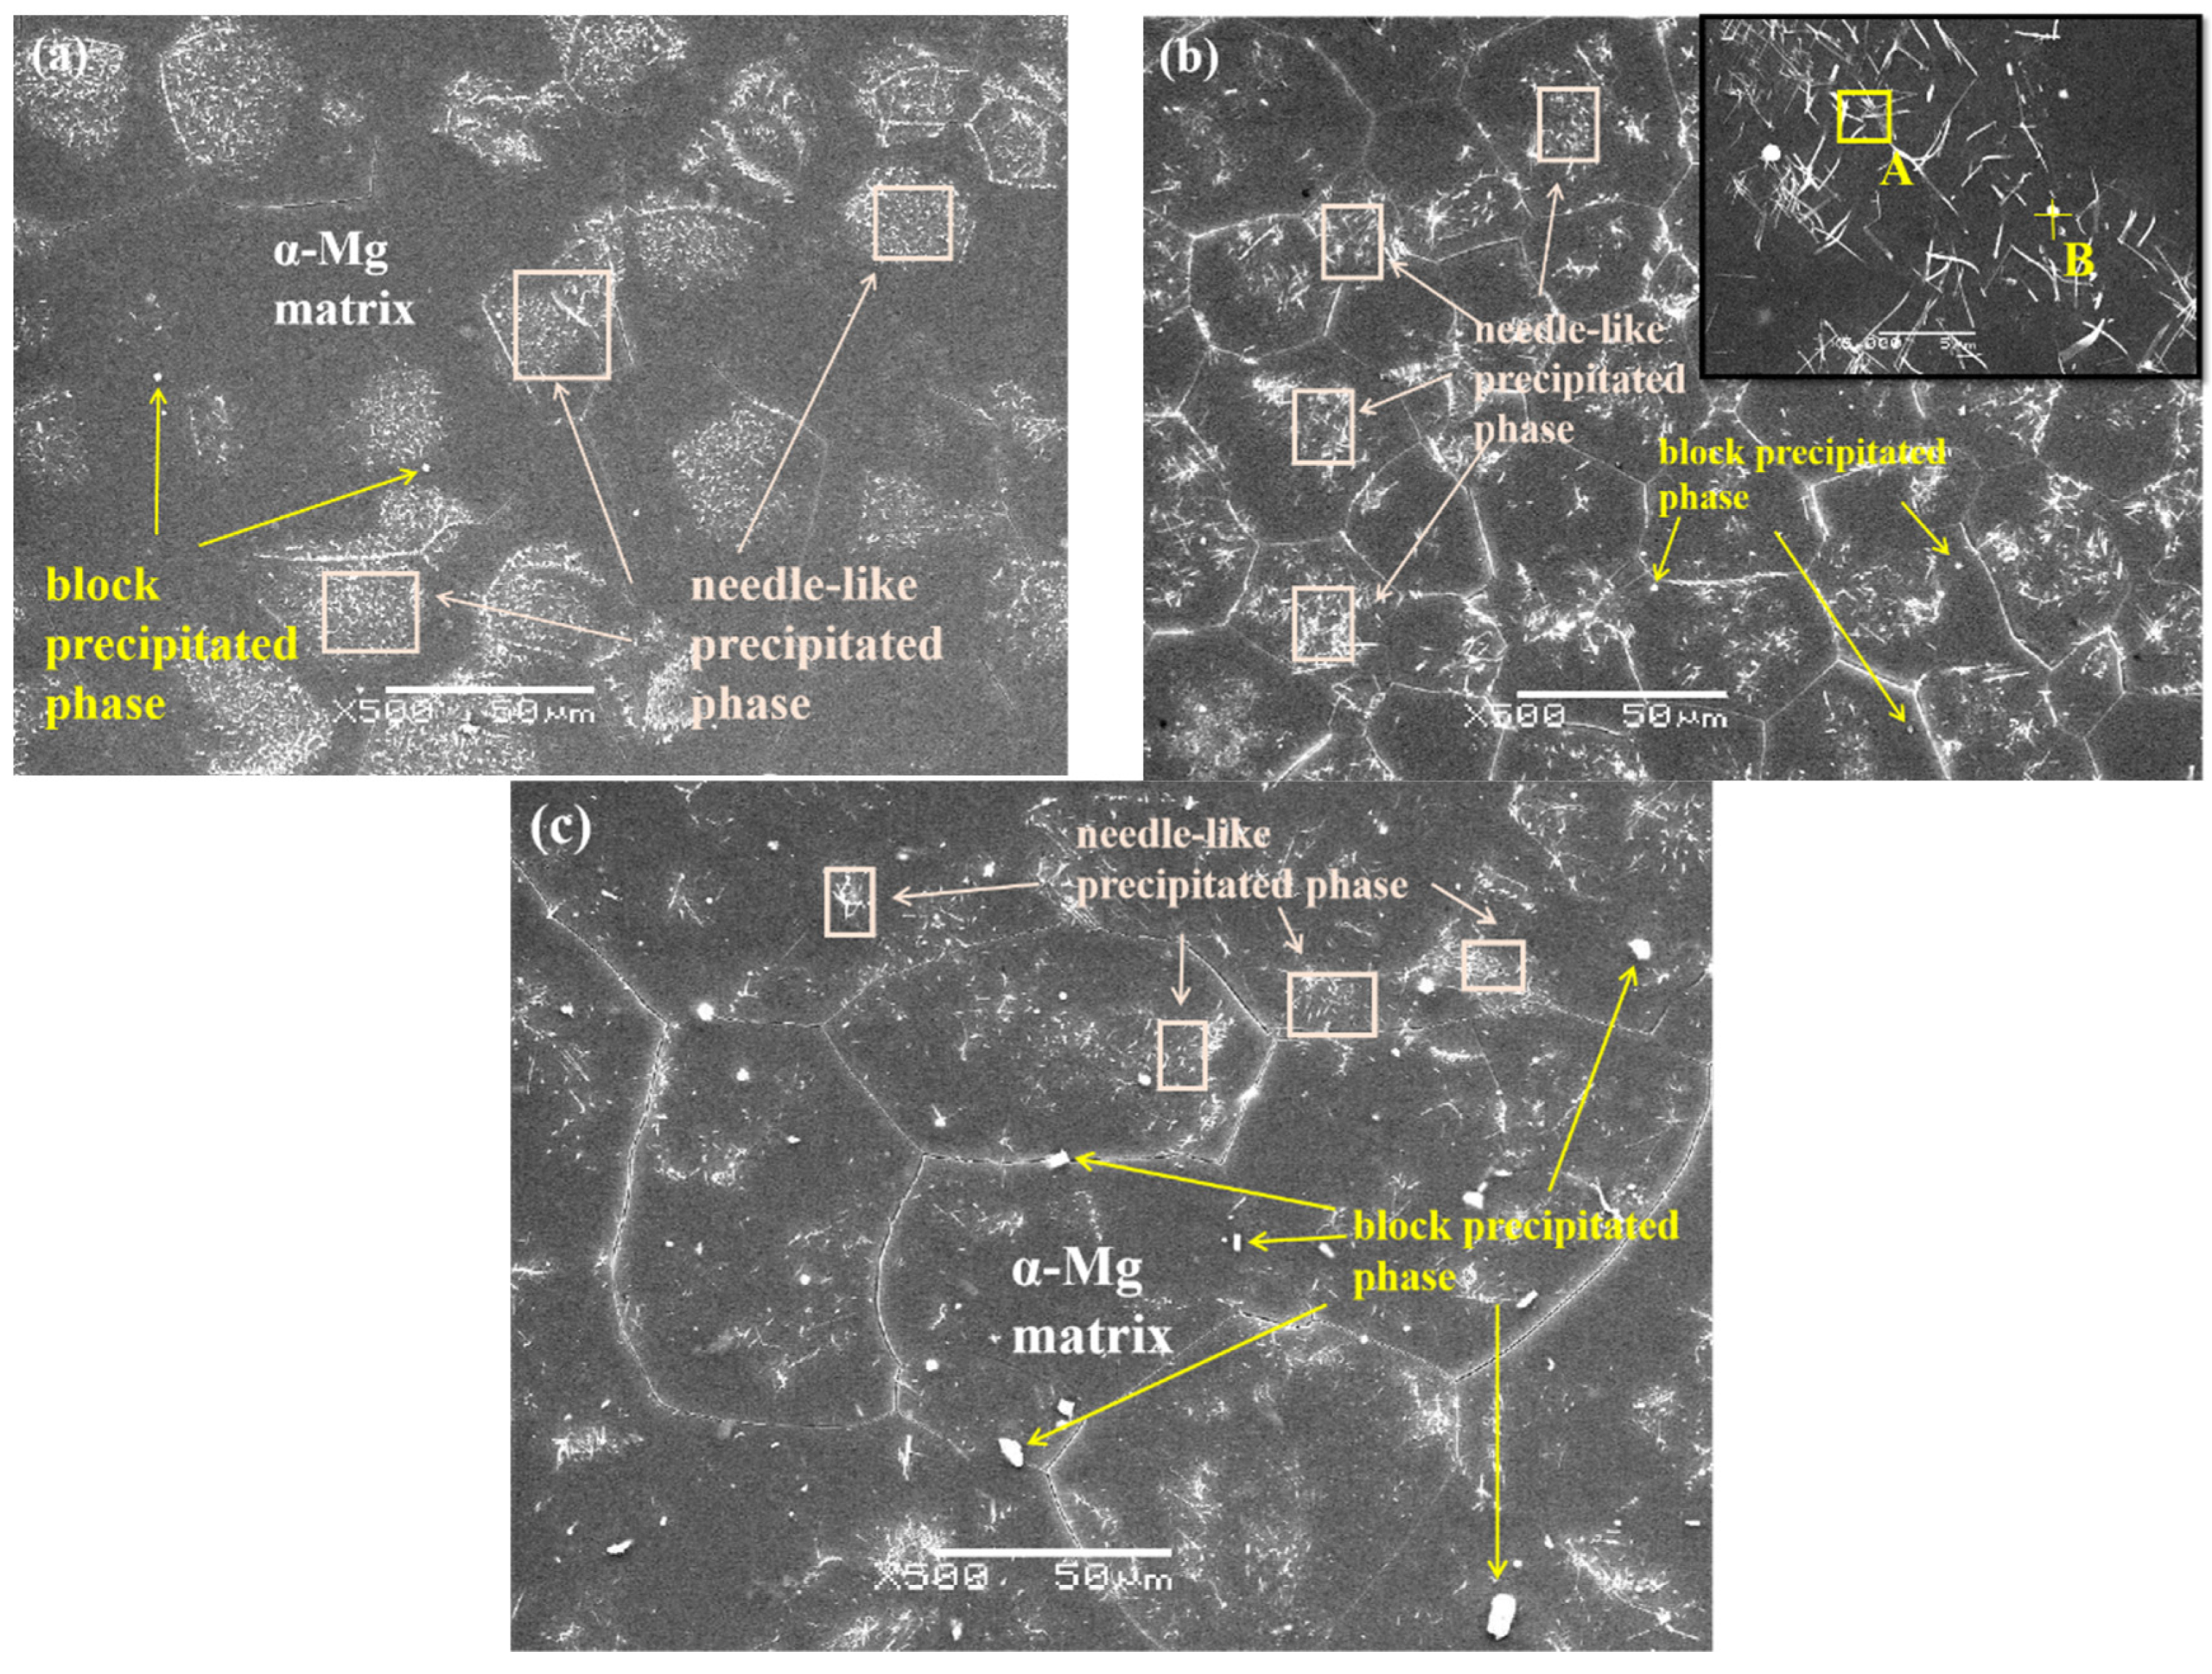
Figure 3 shows SEM micrographs of the alloys with different Gd contents. Compared with the OM micrographs, the needle-like and block precipitated phases in Figure 3 are more clear. The SEM image with higher magnification of the GZ61K alloy is inserted in the top right corner of Figure 3b. According to EDS analysis results, the needle-like precipitated phase marked as A in Figure 3b is rich in Zr and Zn elements (Mg: 82.31 wt%, Gd: 5.62 wt%, Zn: 3.87 wt%, Zr: 8.20 wt%), which has also been reported in our previous studies [18,29,31]. Furthermore, it is found that the block precipitated phase marked as B is a Gd-rich compound (Mg: 43.92 wt%, Gd: 55.89 wt%, Zn: 0.12 wt%, Zr: 0.07 wt%), which can be determined as Mg5Gd according to the atomic ratio of Mg and Gd since trace Zn and Zr captured from the neighboring area can be neglected. It was reported that the Mg5Gd phase could precipitate in the grains and grain boundaries of Mg-Gd alloys [32]. In addition, it can be seen that the block Mg5Gd increases with the increase in Gd addition according to Figure 3. Additionally, neither the needle-like Zr-Zn-rich precipitated phase nor block Mg5Gd phase could be detected by X-ray diffraction due to the limited content.
Needle-like and block precipitates are also formed in other heat-treated Mg alloys [14] and Chang et al., 2007. According to our previous report [18], with the increase in heat treatment temperature, the amount of the β phase with higher Gd and Zn decreases since increased Gd and Zn atoms dissolve into the α-Mg matrix. In addition, during the solution treatment, the Zr element consumes some Zn, then hinders the formation of LPSO structure with α-Mg matrix. Therefore, more Zr precipitates from α-Mg matrix with the increase in the heat temperature lead to more volume fraction of the precipitates [33]. As can be seen in Figure 3b, the Zr-Zn-rich precipitates present a needle shape, which can also be found in the heat-treated Mg-Nd-Zn-Zr alloy [34]. Since the concentration of solute atoms in SFs or LPSO is higher than the matrix, the structure of SFs or LPSO disappears after Gd and Zn atoms diffuse from SFs or LPSO to the matrix. The reason for more massive Mg5Gd precipitates formation is that Gd is more solubilized into the matrix in the process of solid solution treatment, while the solid solubility of Zn and Zr is not as high as Gd. As a result, supersaturated Gd blocks are separated to form Mg5Gd, and more phase transitions are precipitated with the increase in Gd content [20,35].
When the Gd content is relatively low, the grain size decreases with the increase in Gd content. The main reason is that the addition of Gd content increases the subcooling at the solid-liquid interface during solidification, which leads to an increase in the nucleation rate and promotes grain refinement [36]. However, when the Gd content continues to increase to a certain amount, the main reason for the grain coarsening is that the increased amount of Gd element reduces the LPSO phase and decreases the formation of grain boundaries, thus increasing the grain size [37]. During the solid solution treatment, the LPSO phase is almost completely dissolved into the matrix, and needle-like precipitation phases rich in Zr and Zn elements are formed in grain interiors and boundaries. As the Gd content increases, more needle-like phases are precipitated, which are enriched at the grain boundaries and delay the growth of α-Mg grains. Nevertheless, when the Gd content exceeds a certain value, more Gd-rich blocks are precipitated by supersaturation, which are distributed in grain interiors and boundaries, while the number of needle-like precipitated phases becomes less and some of them are discontinuously distributed at the grain boundaries, which reduces the hindering effect on the grain growth and leads to the grain growth. Therefore, in this study, the grain size of GZ61K alloy is the smallest.
3.2. Corrosion Behavior
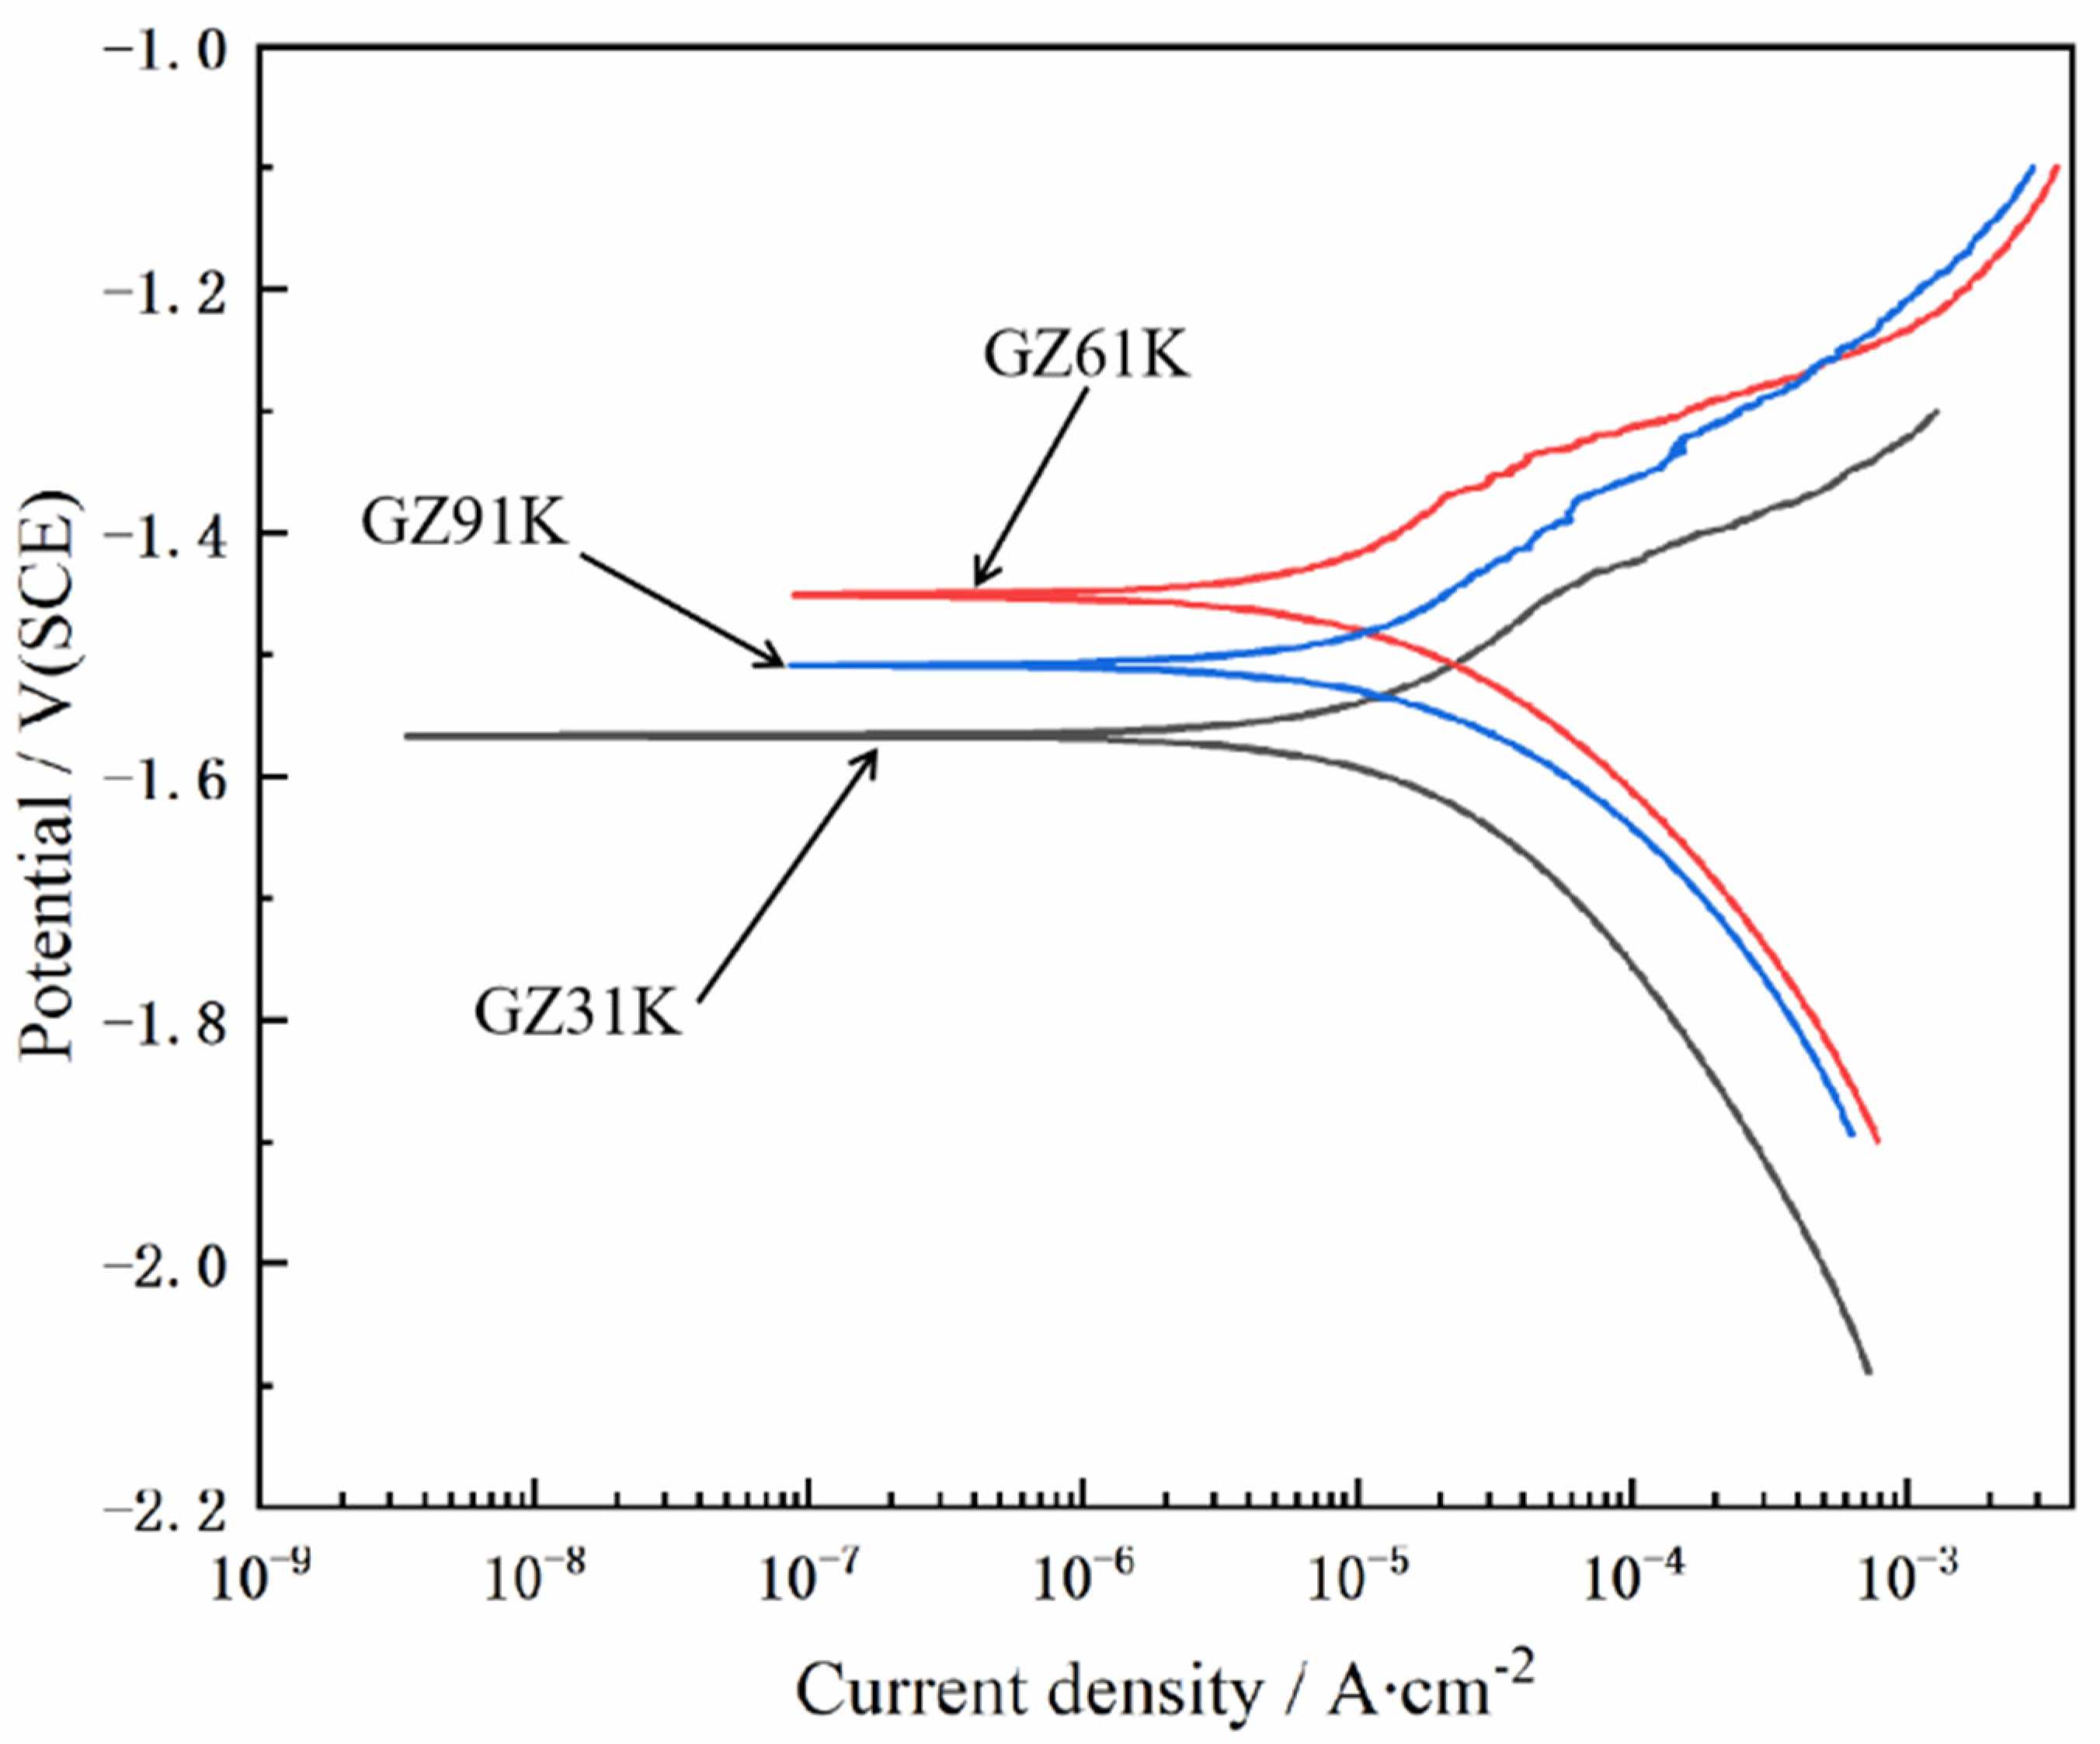
The representative polarization curves of the specimens are plotted in Figure 4 and the electrochemical parameters fitted by Tafel extrapolation are listed in Table 3. All the samples have similar cathodic polarization curves. The corrosion potential reflects the corrosion tendency of the alloy from the perspective of thermodynamics. The more positive the corrosion potential, the less the corrosion tendency of the alloy [38]. Therefore, from the perspective of thermodynamics, the GZ61K alloy has the best corrosion performance, followed by the GZ91K and GZ31K alloys. However, there is no direct relationship between the corrosion potential and rate. The corrosion current density determines the corrosion rate of the alloy from the perspective of dynamics. The lower the corrosion current density, the better the corrosion resistance of the alloy [39]. The order of corrosion rate from high to low is GZ91K > GZ31K > GZ61K, indicating that the GZ61K alloy has the best corrosion resistance and the GZ91K alloy shows the worst corrosion resistance in this work.
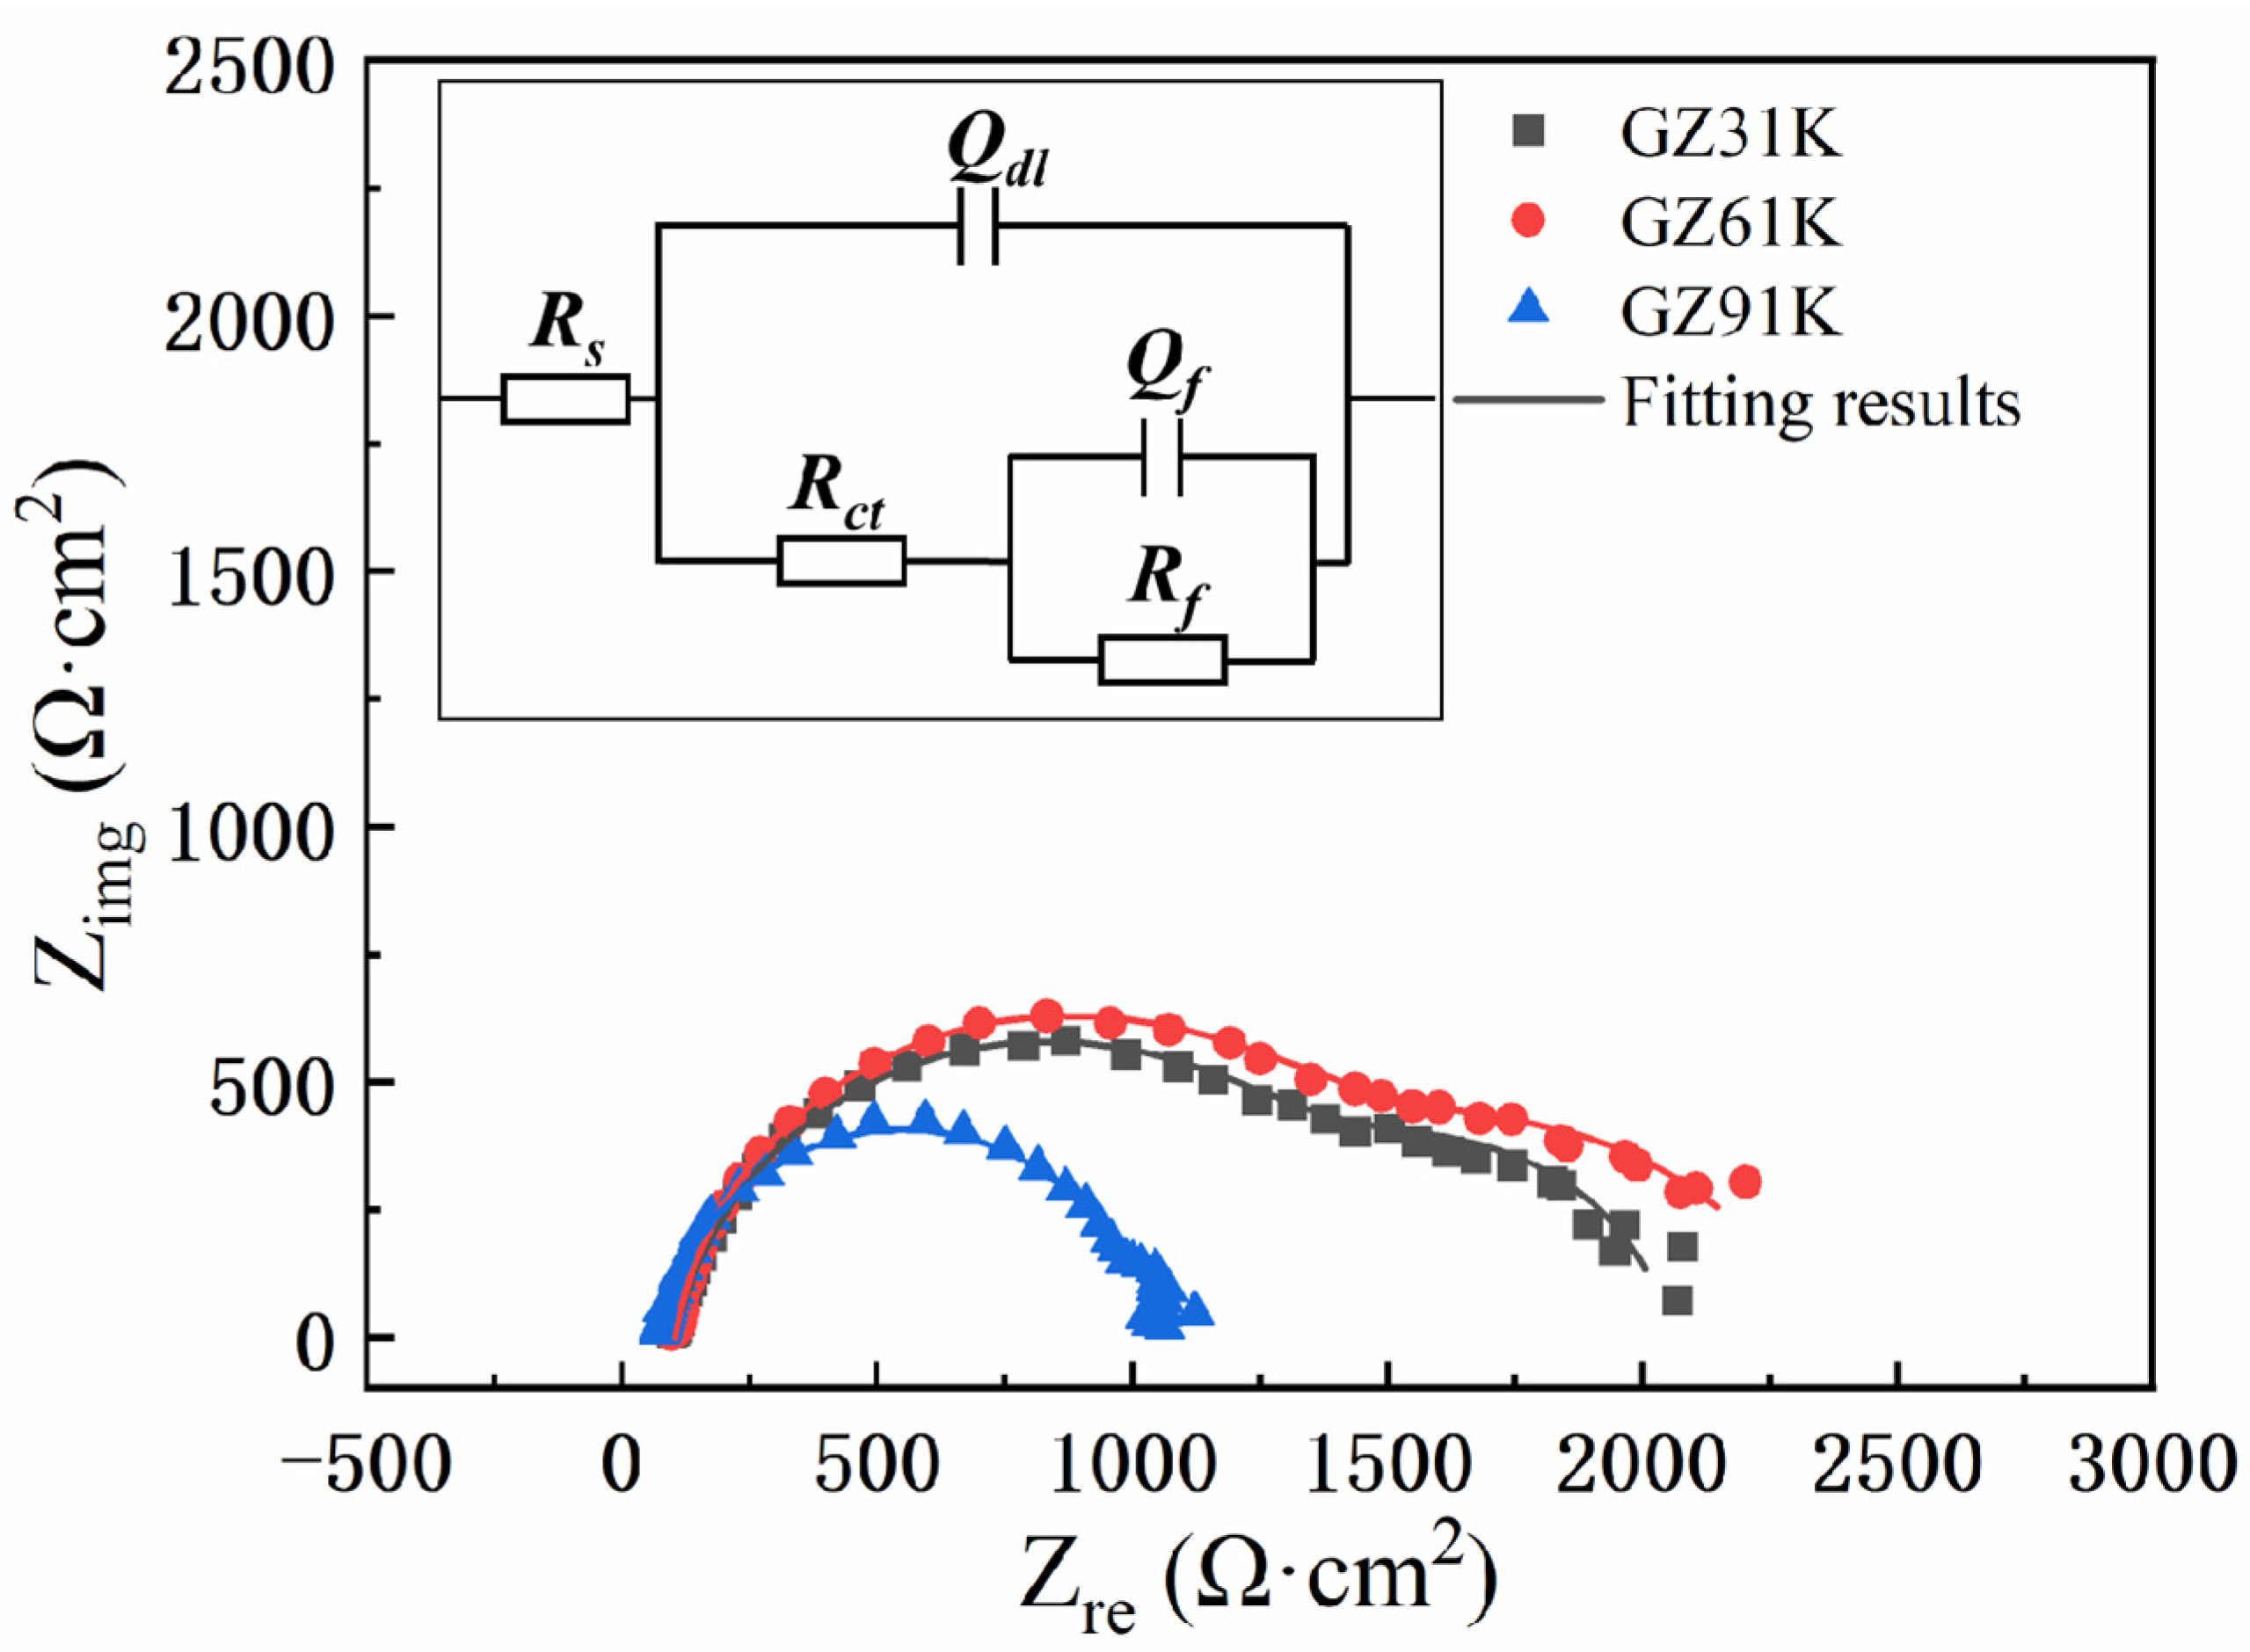
Figure 5 displays EIS plots of the specimens in SBF. EIS Nyquist plots are composed of two capacitive loops, indicating that Mg alloys exhibit a similar corrosion behavior but different corrosion resistance. EIS plots are fitted with an equivalent circuit model Rs(Qdl(Rct(QfRf))), and the fitting electrochemical parameters are listed in Table 4. In the equivalent circuit model, Rs is the solution resistance, Qdl is the double-layer constant phase angle element, Rct is the charge transfer resistance, Qf is the constant phase angle element of oxidation film, and Rf is the film resistance. In addition, Rct paralleled with Qdl corresponds to the solution-substrate interface reaction, and Rf paralleled with Qf corresponds to the surface oxidation film. Moreover, the polarization resistance (Rp) is calculated based on Equation (1), and the higher Rp represents better corrosion resistance.
As a result, it can be concluded that the GZ61K alloy has the best corrosion resistance and the GZ91K alloy presents the worst corrosion resistance, which is consistent with the results obtained by polarization curves.

Table 4.
Fitting results of electrochemical parameters obtained from EIS.
| Alloys | Rs/Ω·cm2 | Qdl | Rct/Ω·cm2 | Qf | Rf/Ω·cm2 | Rp/Ω·cm2 | ||
|---|---|---|---|---|---|---|---|---|
| Ydl/Ω−1·cm−2·sn | n | Yf/Ω−1·cm−2·sn | nf | |||||
| GZ31K | 102.90 | 1.87 × 10⁻⁵ | 0.87 | 1408 | 5.26 × 10⁻⁴ | 0.90 | 541.10 | 1949.10 |
| GZ61K | 103.60 | 2.23 × 10⁻⁵ | 0.90 | 1430 | 6.81 × 10⁻⁴ | 0.77 | 790.90 | 2220.90 |
| GZ91K | 78.69 | 7.25 × 10⁻⁶ | 0.91 | 940.9 | 1.98 × 10⁻³ | 0.83 | 86.12 | 1027.02 |
Figure 5.
Nyquist plots of Mg alloys in SBF solution and their equivalent circuit model.

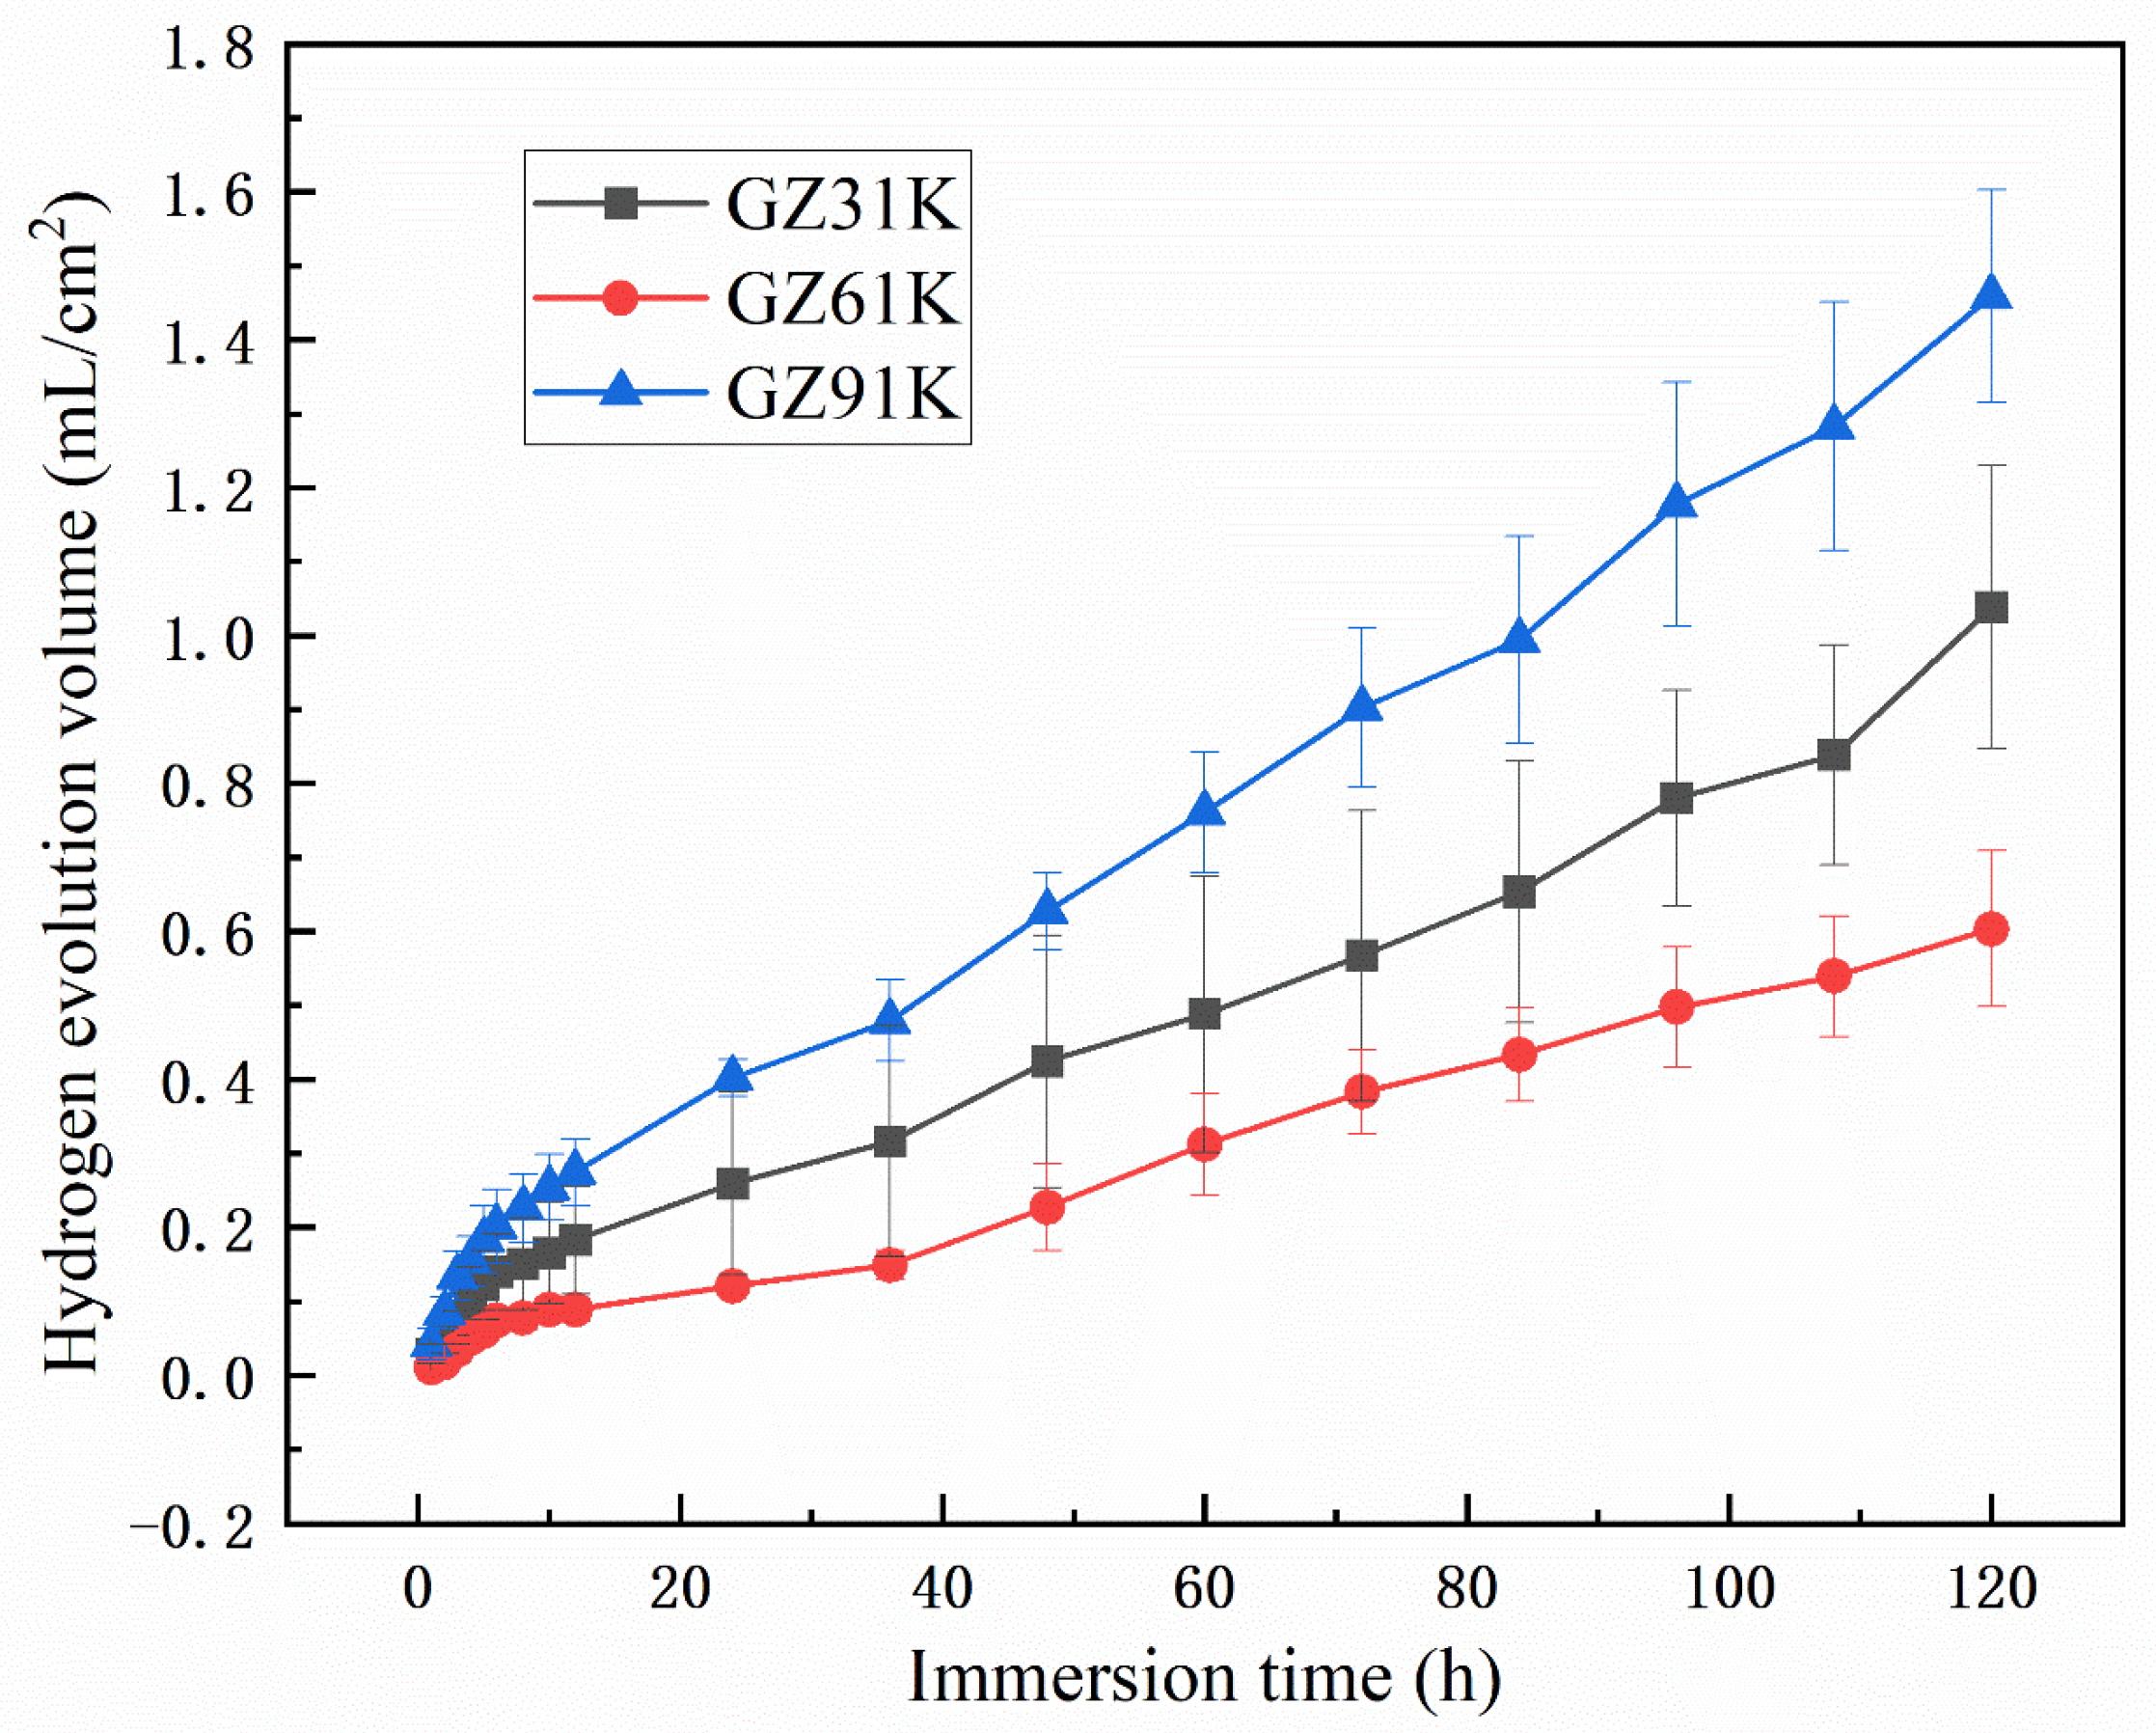
Figure 6 shows the hydrogen evolution of the T6-treated alloys immersed in SBF for 120 h. The hydrogen evolution trend of the alloys with different Gd contents is the same, but the amount of hydrogen evolution is different. The GZ91K alloy has the most hydrogen evolution, followed by the GZ31K and GZ61K alloys. At the initial stage of soaking (the first 8 h), the hydrogen evolution amount of the specimens is lower than 0.3 mL/cm2. The amount of hydrogen evolution increases with the increase in soaking time. After soaking for 120 h, the hydrogen evolution of the GZ31K, GZ61K, and GZ91K alloys reaches 1.04, 0.60, and 1.46 mL/cm2, respectively.
The corrosion rates of the alloys by mass loss, hydrogen evolution, and polarization tests were calculated and listed in Table 5. It can be seen that the corrosion rates of the three alloys using different methods show the same trend but the values show a little difference. It is clear that the corrosion rate of GZ91K alloy calculated by the mass loss method is higher than the rate calculated by the hydrogen evolution method. This could be explained by the fact that the Gd content in the alloy is high, forming a massive Gd-rich phase. Herein, the precipitated phase falls off when the sample is pickling, resulting in the increase in weight loss. The reason why the corrosion rate of the mass loss method of GZ31K and GZ61K alloys is lower than the hydrogen evolution method is that the oxide produced on the surface of the sample is not clean or the sample is slightly oxidized in the process of weighing after pickling, and there is a small amount of oxide on the surface. Among them, the electrochemical corrosion rate of GZ91K alloy is quite different from the data obtained in the immersion experiment. The main reason is that the corrosion rate measured in the immersion experiment is the average rate of the alloy after soaking in SBF for 120 h, while the electrochemical test is the instantaneous corrosion rate of the alloy. Namely, the corrosion rate order of alloys with different Gd contents was GZ91K > GZ31K > GZ61K.
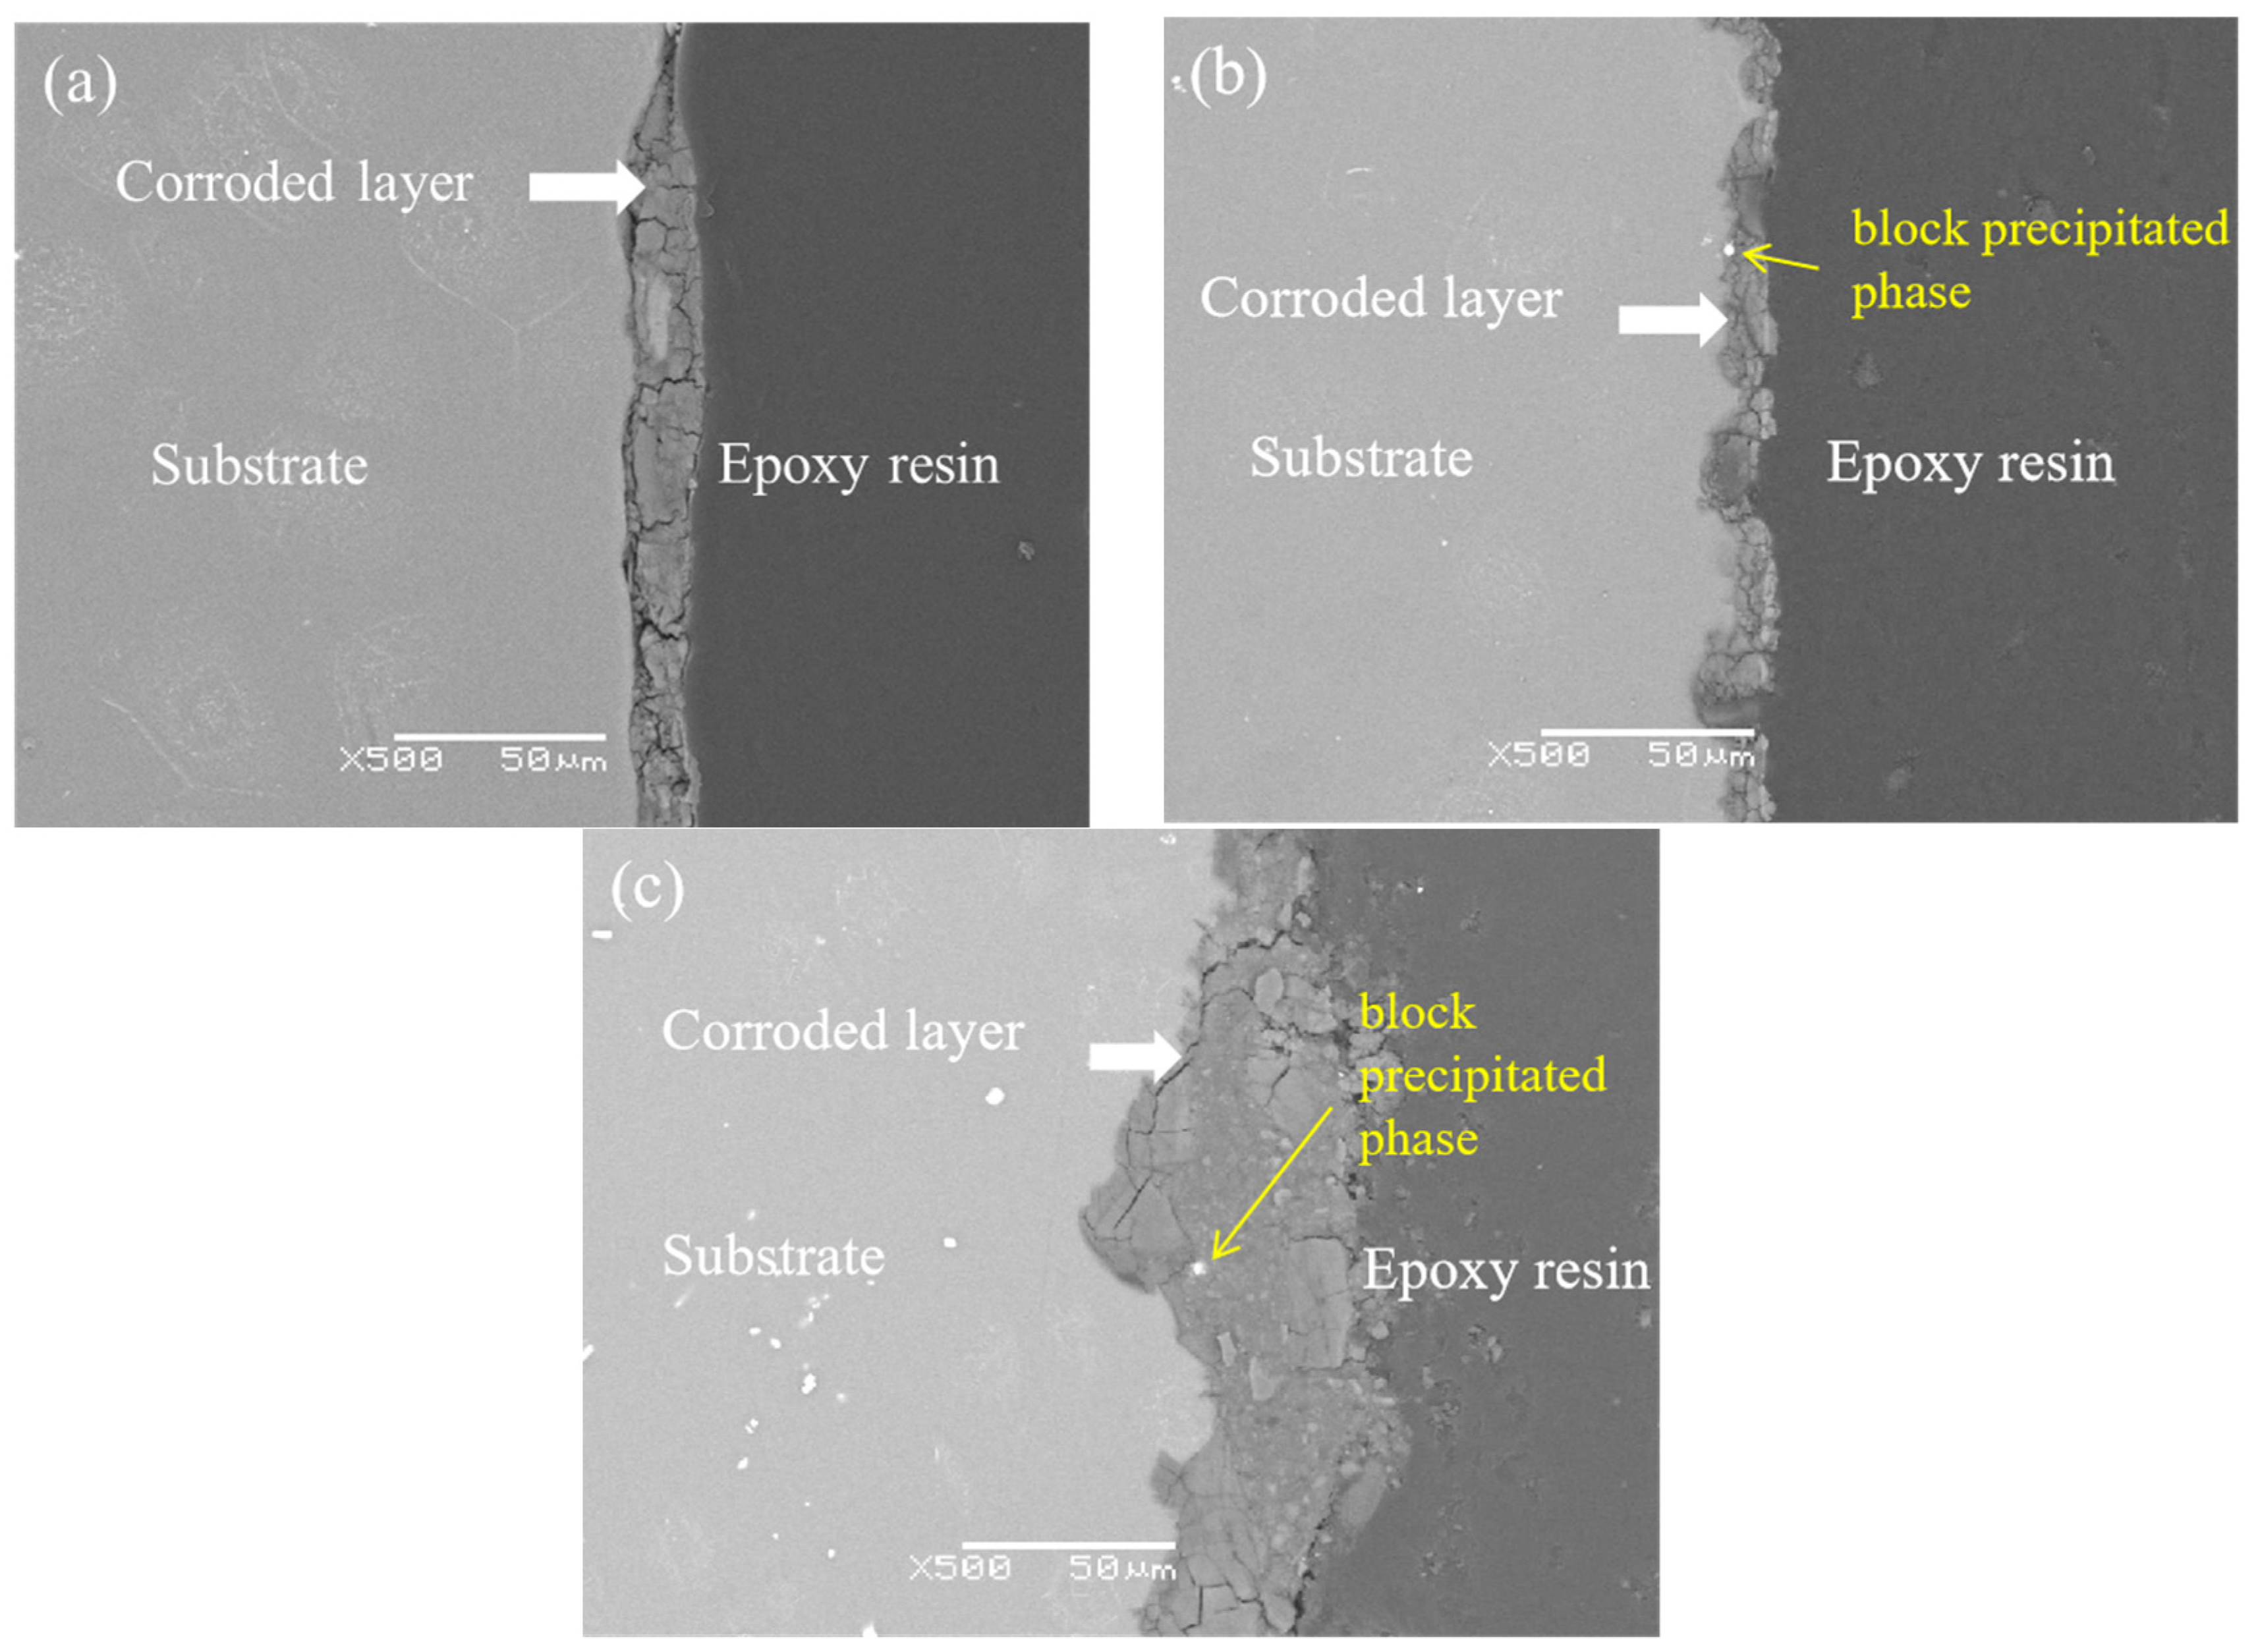
The cross-section morphologies of the T6-treated alloys after immersion in SBF for 120 h are shown in Figure 7. It clearly shows that the GZ61K alloy has the thinnest corrosion layer while the GZ91K alloy has the thickest corrosion layer. The GZ31K and GZ61K alloys present a more uniform corrosion mode than the GZ91K alloy. Moreover, it is worth noting that the block Mg5Gd precipitated phase remains in the corroded layer in Figure 7b,c, indicating that the Mg5Gd is more corrosion resistant than the α-Mg matrix.
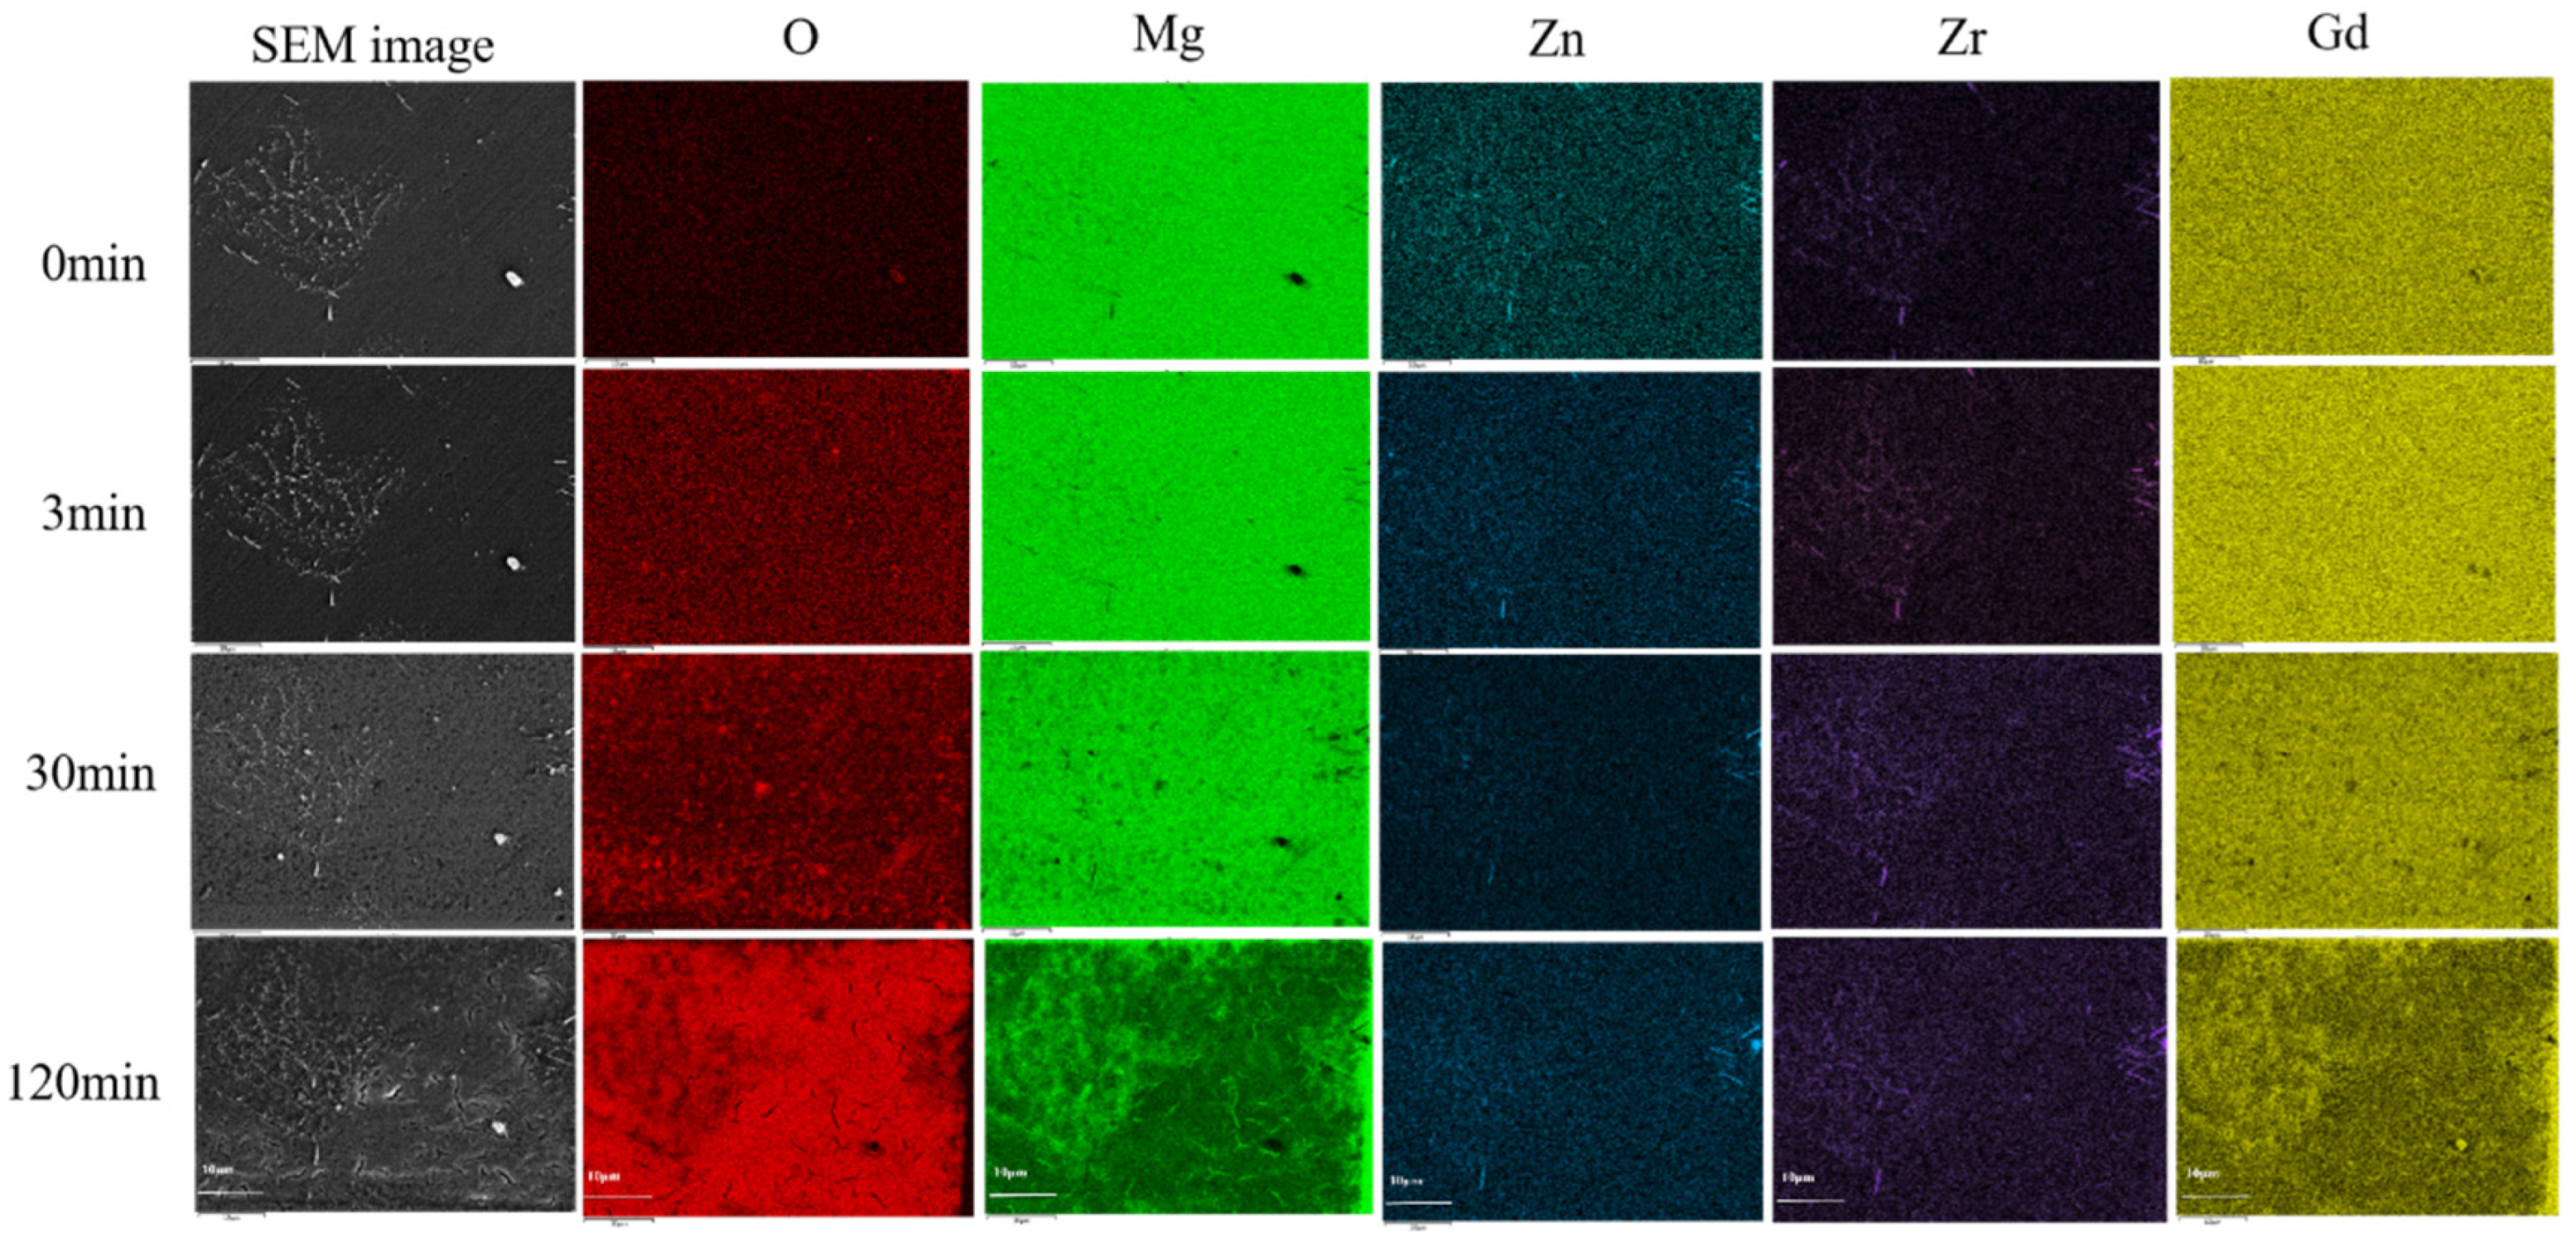
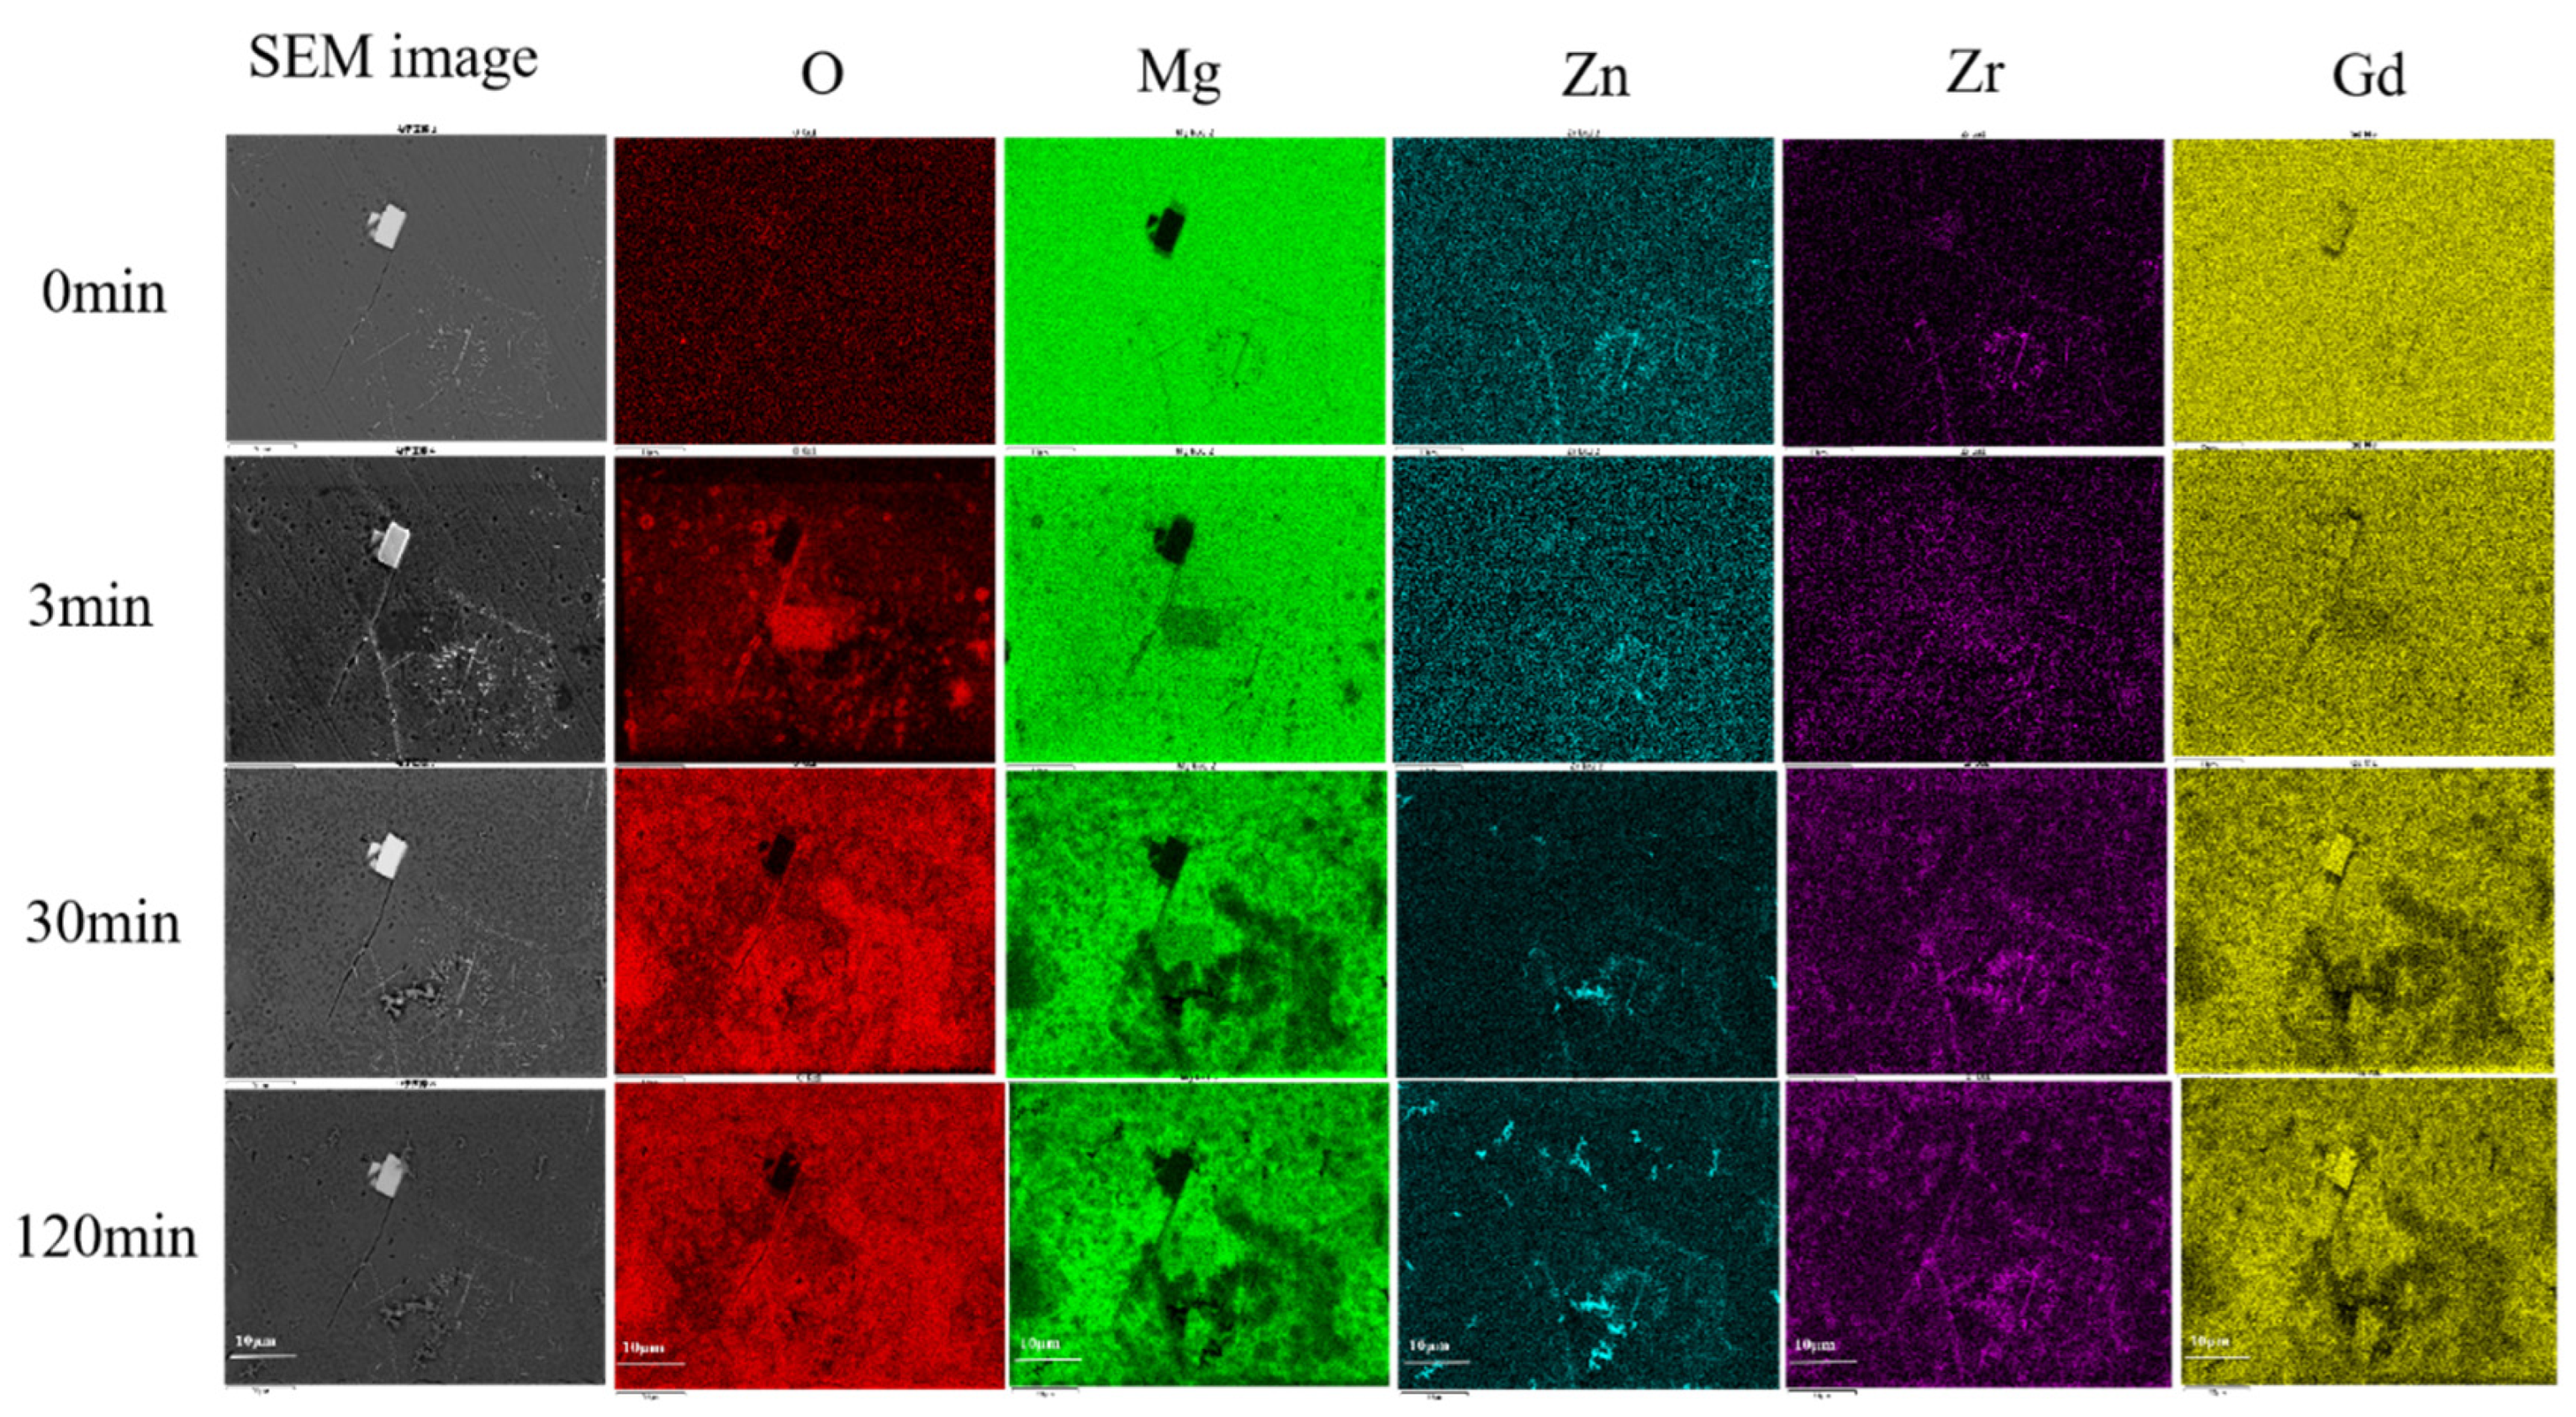
Typical regions, which include the α-Mg matrix, needle-like Zr-Zn-rich precipitated phase, and block Mg5Gd precipitated phase, were selected to analyze the corrosion process of the T6-treated alloys in SBF by the quasi in situ SEM method. The GZ61K alloy with the best corrosion resistance and the GZ91K alloy with the worst corrosion resistance were conducted, and the results are shown in Figure 8 and Figure 9, respectively. It can be clearly observed that the needle-like precipitates are rich in Zr and Zn elements, and the block precipitate is rich in Gd element.
As shown in Figure 8, after soaking for 3 min, the surface of GZ61K alloy does not change clearly, but the content of O element increases significantly and the distribution is uniform, indicating that the surface is oxidized. After soaking for 30 min, it can be observed that the content of O element in the area without needle-like Zr-Zn-rich precipitates is higher, and the corrosion is still not clear. After soaking for 120 min, the content of O element in the region without needle-like Zr-Zn-rich precipitates significantly increases, while the contour of needle-like Zr-Zn-rich precipitates and block Mg5Gd precipitates is clearly visible, indicating that the corrosion resistance of the precipitates is better than the matrix.
As for the GZ91K alloy in Figure 9, after soaking for 3 min, the degree of oxidation in the local area is more clear and uneven around the block and needle-like Zr-Zn-rich precipitates than the GZ61K alloy, which is caused by the galvanic corrosion between the large block Mg5Gd phase and matrix, as well as between the needle-like Zr-Zn-rich precipitated phase and matrix in GZ91K alloy. After soaking for 30 min, apparent corrosion can be observed in the vicinity of the precipitates. With the increase in soaking time, more O and less Mg are detected due to corrosion, but Zn, Zr, and Gd elements are clearly seen on the surface since they are more anti-corrosive than the α-Mg matrix.
Previous studies have shown that the corrosion products on the surface of Mg-Gd-Zn-Zr magnesium alloy are mainly composed of two parts: The dense film on the substrate surface and the bright particles on the film. First, the dense protective film formed on the substrate surface can prevent the substrate from immersion in the corrosion solution to a certain extent. In addition, the film on the substrate surface is separated by a large number of cracks, among which the cracks are mainly caused by drying after the immersion experiment. EDS results showed that the bright particles and dense membrane mainly contained Mg, O, P, and Ca elements, and the bright particles contained slightly more O, P, and Ca elements, but less Mg [40]. In addition, it has been reported that the corrosion products were mainly MgO, Mg (OH)2, hydroxyapatite (HA), and calcium-magnesium phosphates in SBF [41,42,43].
The results obtained by mass loss, hydrogen evolution, and electrochemical tests in this paper show the same trend with the corrosion resistance of GZ61K > GZ31K > GZ91K. Moreover, the corrosion rate of the T6-treated GZ31K alloy is 0.41 mm/y. Both GZ31K and GZ61K alloys can meet the corrosion resistance requirement (less than 0.5 mm/y) proposed by Erinc et al. [44] for Mg alloys as degradable orthopedic implanted materials. The T6-treated GZ61K alloy exhibits the lowest corrosion rate (0.23 mm/y) by the mass loss test, which is significantly lower than most of the biomedical Mg alloys, as listed in Table 6.
The corrosion performance of Mg alloys is mainly affected by composition, grain size, precipitated phases, and other factors [50]. The corrosion potential of Gd is close to Mg, and the corrosion resistance of the matrix will be improved with dissolution of Gd, Zn, and Zr. The corrosion potential difference between MgxGd and the matrix is small [51], and the potential difference between the precipitated phase of Zr4Zn and α-Mg matrix is 180 mV, thus the galvanic corrosion potential difference between the Zr-Zn-rich compound and matrix is smaller than the different phases in other alloys [52,53,54,55]. Generally, as the potential difference between the second phase and the matrix increases, more serious galvanic corrosion will be formed [56]. However, there are also cases of a small potential difference and serious galvanic corrosion, which may be due to the fact that the addition of alloying elements fails to form a uniform and dense protective film, thus accelerating the corrosion of the alloy [48]. Consequently, the corrosion rate of GZK series alloys studied in this paper is slower than most Mg alloys.
The decrease in grain size will reduce the trend of electrochemical corrosion [57]. The precipitation has dual effects on the corrosion resistance of Mg alloy [57,58,59]: The fine and uniform distribution of precipitates is beneficial to the formation of protective film, corrosive solutions are difficult to penetrate and corrode, and thus improve the corrosion resistance of the alloy. The coarse or uneven distribution of precipitated phase will accelerate the galvanic corrosion and reduce the corrosion performance. When the Gd content is 6%, the corrosion rate of the alloy is the lowest in the present work. It can be seen in Figure 1 and Figure 3 that the Zr-Zn-rich precipitates are more evenly distributed on the grain boundaries and interiors. As a result, a relatively uniform and dense oxide film can be formed in the corrosion process and hinder the corrosion of the alloy, which is confirmed by the quasi in situ corrosion observation in Figure 9. Moreover, as revealed in Figure 2, the matrix grains of the GZ61K alloy are finer and more uniform as compared to those of the other two alloys, which are also beneficial to improving corrosion resistance. As for the GZ91K alloy, the large and uneven grain size is detrimental to corrosion resistance, and more block Mg5Gd precipitates accelerate galvanic corrosion and cause clear local corrosion.
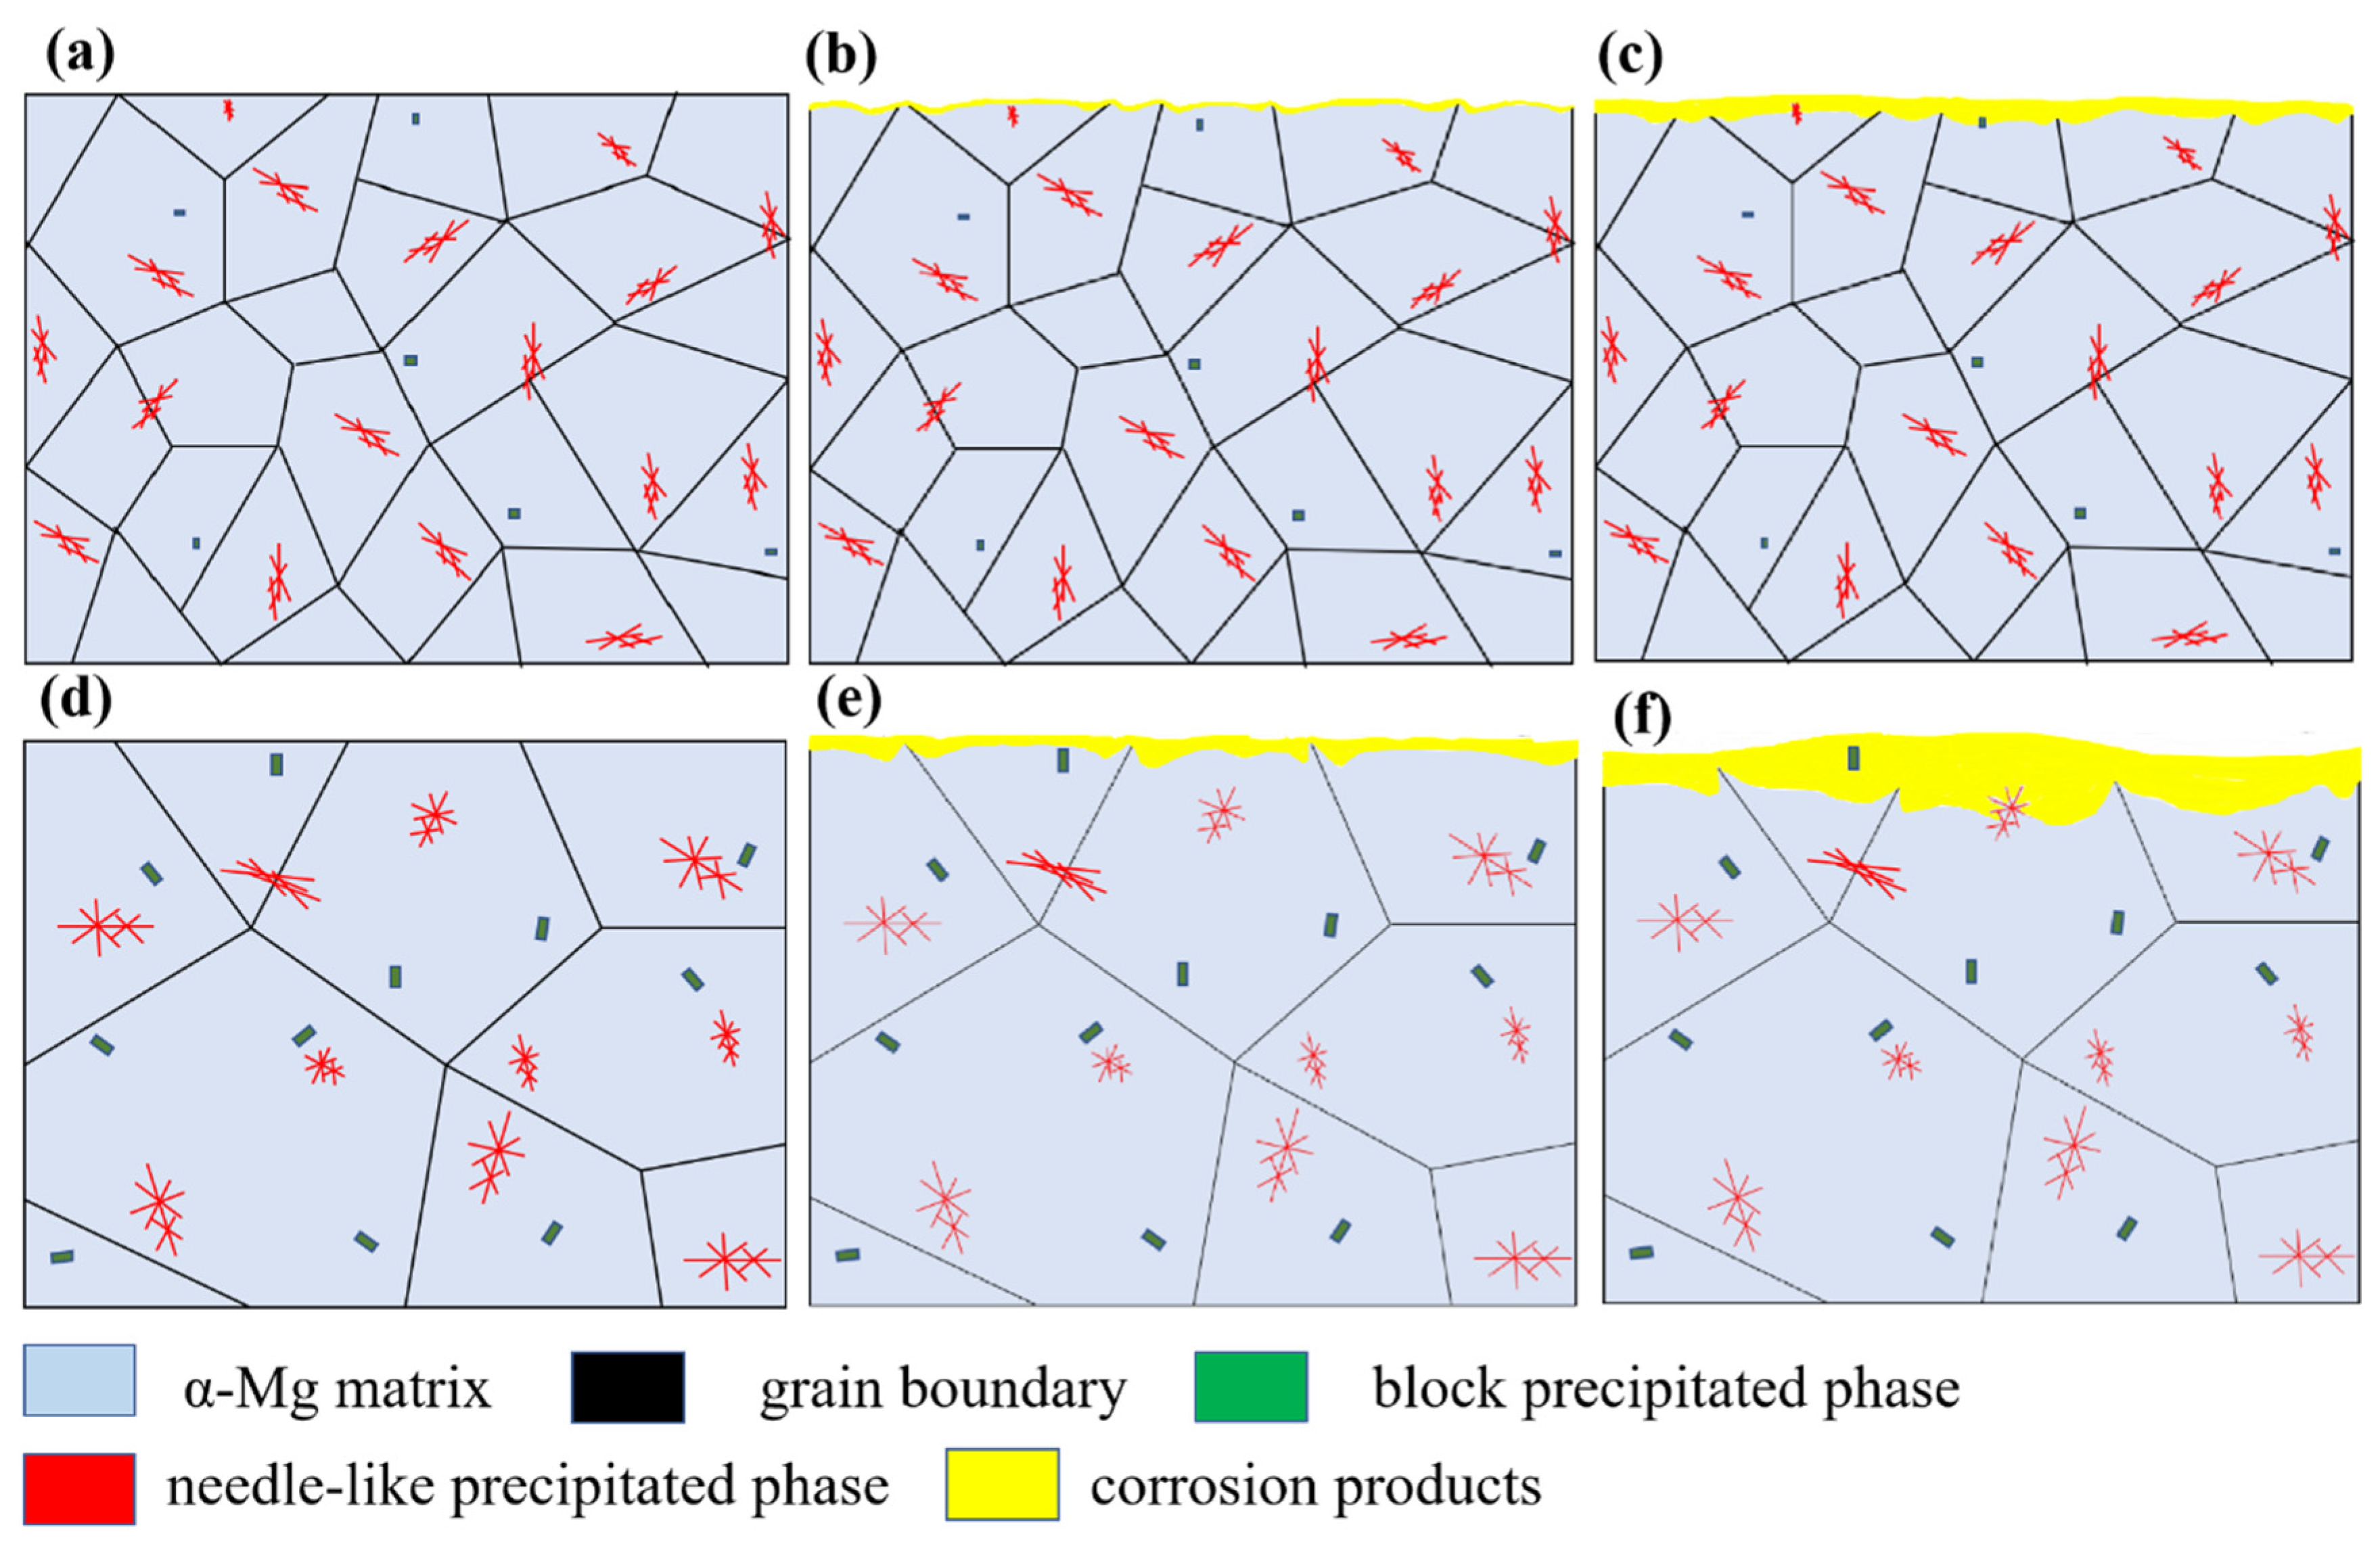
According to the cross-section and quasi in situ corrosion morphologies shown in Figure 7, Figure 8 and Figure 9, the corrosion processes of the T6-treated GZ61K and GZ91K alloys are shown in Figure 10. For both alloys, the α-Mg matrix dissolves first due to its lower corrosion potential. When the corrosion extends to the needle-like and/or block precipitates, the precipitates act as cathodes, the matrix near the precipitates is corroded preferentially by microgalvanic corrosion, and the block precipitates are retained in the corrosion product layer. Compared with GZ61K, GZ91K suffers faster and results in more localized corrosion mainly due to more and larger Mg5Gd precipitates as well as coarser grains.
4. Conclusions
- (1)
- The microstructure of T6-treated Mg-xGd-1Zn-0.4Zr (x = 3, 6, and 9 wt%) alloy is composed of α-Mg matrix, needle-like Zr-Zn-rich precipitates, and block Mg5Gd precipitates. With the increase in Gd content, the grain size of the alloy decreases first and then increases, and an increased amount and larger block of Mg5Gd is formed. Homogeneous and fine microstructure is obtained with 6 wt% Gd addition.
- (2)
- With the increase in Gd content, the corrosion rate of T6-treated Mg-xGd-1Zn-0.4Zr alloy decreases first and then increases. The GZ61K alloy exhibits the best corrosion resistance in SBF mainly due to the finer grains and more homogeneously distributed precipitates.
- (3)
- The corrosion rate of T6-treated GZ61K alloy is 0.23 mm/y and GZ31K alloy is 0.41 mm/y in SBF, which meets the requirement of clinical application compared with the most existing medical Mg alloys, and thus are promising biodegradable Mg alloys.
Author Contributions
Conceptualization, X.G. and X.Z.; methodology, X.G.; validation, X.G. and J.J.; formal analysis, X.G.; investigation, X.G. and J.J.; resources, X.Z.; data curation, X.G. and J.J.; writing—original draft preparation, X.G.; writing—review and editing, X.Z.; visualization, X.G. and J.J.; supervision, X.Z.; project administration, X.Z.; funding acquisition, X.Z. All authors have read and agreed to the published version of the manuscript.
Funding
This project was supported by the National Natural Science Foundation of China (52071175), the Key Research & Development Plan (Social Development) of Jiangsu Province (BE2020702), and the Postgraduate Research & Practice Innovation Program of Jiangsu Province (No. SJCX22_1055).
Data Availability Statement
Research data are available upon reasonable request to the authors.
Conflicts of Interest
The authors declare no conflict of interest.
References
- Liu, D.X.; Yang, D.L.; Li, X.L.; Hu, S.W. Mechanical properties, corrosion resistance and biocompatibilities of degradable Mg-RE alloys: A review. J. Mater. Res. Technol. 2019, 8, 1538–1549. [Google Scholar] [CrossRef]
- Meysam, N.A.; Abolfazl, Z.; Oluwole, K.B.; Bankole, I.O. A review of current challenges and prospects of magnesium and its alloy for bone implant applications. Prog. Biomater. 2022, 11, 1–26. [Google Scholar] [CrossRef]
- Violeta, T.; Christu, T.; Florentina, M.C. Biodegradable Mg alloys for orthopedic implants-A review. J. Magnes. Alloy. 2021, 9, 1884–1905. [Google Scholar] [CrossRef]
- Su, J.L.; Teng, J.; Xu, Z.L.; Li, Y. Biodegradable magnesium-matrix composites: A review. Int. J. Miner. Metall. Mater. 2020, 27, 724. [Google Scholar] [CrossRef]
- Song, M.S.; Zeng, R.C.; Ding, Y.F. Recent advances in biodegradation controls over Mg alloys for bone fracture management: A review. J. Mater. Sci. Technol. 2019, 35, 535–544. [Google Scholar] [CrossRef]
- Nie, Y.J.; Dai, J.W.; Li, X.; Zhang, X.B. Recent developments on corrosion behaviors of Mg alloys with stacking fault or long period stacking ordered structures. J. Magnes. Alloy. 2021, 9, 1123–1146. [Google Scholar] [CrossRef]
- Buzolin, R.H.; Mohedano, M.; Mendis, C.L.; Mingo, B.; Tolnai, D.; Blawert, C.; Kainer, K.U.; Pinto, H.; Hort, N. As cast microstructures on the mechanical and corrosion behaviour of ZK40 modified with Gd and Nd additions. Mater. Sci. Eng. A 2017, 682, 238–247. [Google Scholar] [CrossRef]
- Hong, L.X.; Wang, R.X.; Zhang, X.B. The Role of Nd in Corrosion Properties of Mg-12Gd-2Zn-0.4Zr Alloys. J. Mater. Eng. Perform. 2021, 30, 6000–6008. [Google Scholar] [CrossRef]
- Zhang, Y.; Gore, P.; Rong, W.; Wu, Y.J.; Yan, Y.M.; Zhang, R.F.; Peng, L.M.; Nie, J.F.; Birbilis, N. Quasi-in-situ STEM-EDS insight into the role of Ag in the corrosion behaviour of Mg-Gd-Zr alloys. Corros. Sci. 2018, 136, 106–118. [Google Scholar] [CrossRef]
- Xu, Y.Z.; Li, J.Y.; Qi, M.F.; Gu, J.B. The influence of Gd content on the microstructure, mechanical properties, corrosion behavior and corrosion film deposition mechanisms of as-extruded Mg-Zn-Mn-Sr-Gd alloys for biomedical applications. J. Mater. Sci. 2022, 57, 2053–2072. [Google Scholar] [CrossRef]
- Yin, S.Q.; Duan, W.C.; Liu, W.H.; Zhang, Z.Q. Influence of specific second phases on corrosion behaviors of Mg-Zn-Gd-Zr alloys. Corros. Sci. 2019, 166, 108419. [Google Scholar] [CrossRef]
- Yang, L.; Guo, S.; Li, G.Y.; Nie, X.P.; Yang, M.N.; Wang, C.M. The microstructure, mechanical properties and corrosion behaviour of Ce-containing Mg-3Sn-1Ca alloy. Mater. Sci. Technol. 2019, 35, 946–952. [Google Scholar] [CrossRef]
- Yuan, X.; Du, Y.Z.; Dong, D.; Liu, D.J.; Jiang, B.L. Corrosion Resistance Improvement of an Extruded Mg-Gd-Y-Zn-Zr-Ca via Aging Treatment. J. Mater. Eng. Perform. 2022, 31, 2909–2917. [Google Scholar] [CrossRef]
- Liu, J.X.; Chen, J.; Li, Q.A.; Chen, X.Y.; Zhang, Z.Y. Effect of aging treatment on corrosion behavior of Mg-4Nd-2Gd-0.5Zr alloy. Mater. Res. Express 2022, 9, 016503. [Google Scholar] [CrossRef]
- Zhang, Q.; Li, Q.A.; Chen, X.Y. Effect of heat treatment on corrosion behavior of Mg-5Gd-3Y-0.5Zr alloy. RSC Adv. 2020, 10, 43371. [Google Scholar] [CrossRef]
- Liu, Y.; Wen, J.B.; Yao, H.; He, J.G.; Li, H. Enhancing the Corrosion Resistance Performance of Mg-1.8Zn-1.74Gd-0.5Y-0.4Zr Biomaterial via Solution Treatment Process. Materials 2020, 13, 836. [Google Scholar] [CrossRef] [PubMed] [Green Version]
- Li, L.; Wang, T.; Wang, Y.; Zhang, C.C.; Lv, H.; Lin, H.; Yu, W.B.; Huang, C.J. Effects of ytterbium addition and heat treatment on the mechanical properties and biocorrosion behaviors of Mg-Zn-Zr alloy. J. Magnes. Alloy. 2020, 8, 499–509. [Google Scholar] [CrossRef]
- Zhang, X.B.; Ba, Z.X.; Wang, Z.Z.; Xue, Y.J. Microstructures and corrosion behavior of biodegradable Mg-6Gd-xZn-0.4Zr alloys with and without long period stacking ordered structure. Corros. Sci. 2016, 105, 68–77. [Google Scholar] [CrossRef]
- Shuai, C.J.; Liu, L.; Gao, C.D.; Yang, Y.W.; Zhao, M.C.; Kong, L.Y. Uniform degradation mode and enhanced degradation resistance of Mg alloy via a long period stacking ordered phase in the grain interior. Mater. Res. Express 2019, 6, 065406. [Google Scholar] [CrossRef]
- Srinivasan, A.; Huang, Y.; Mendis, C.L. Investigations on microstructures, mechanical and corrosion properties of Mg-Gd-Zn alloys. Mater. Sci. Eng. A 2014, 595, 224–234. [Google Scholar] [CrossRef]
- Han, Z.H.; Zhang, K.; Yang, J.; Wei, R.; Zhang, C.J. Effects of volume fraction of Ni-containing LPSO phase on mechanical and corrosion properties of Mg-Gd-Ni alloys. Mater. Corros. 2019, 70, 537–548. [Google Scholar] [CrossRef]
- Han, Z.H.; Zhang, K.; Yang, J.; Wei, R.; Liu, Y.X.; Zhang, C.J. The Anodic Role of Ni-Containing LPSO Phases During the Microgalvanic Corrosion of Mg98Gd1.5Ni0.5 Alloy. J. Mater. Eng. Perform. 2019, 28, 2451–2458. [Google Scholar] [CrossRef]
- Pham, D.N.; Hiromoto, S.; Kobayashi, E. Influences of Zinc Content and Solution Heat Treatment on Microstructure and Corrosion Behavior of Mg-Zn Binary Alloys. Corrosion 2021, 77, 323–338. [Google Scholar] [CrossRef]
- Zhang, S.; Li, Q.A.; Zhu, H.X.; Chen, X.Y.; Wang, S.B.; Guan, H.K. Effect of Heat Treatment Process on Microstructure and Corrosion Behavior of Mg-11Gd-3Y-0.6Ca-0.5Zr Alloy. Mater. R 2020, 34, 20070–20075. [Google Scholar] [CrossRef]
- Xu, D.Z.; He, J.G.; Wen, J.B.; Ren, X.L.; Wang, Y.F.; Zeng, T. Effects of solution treatment on microstructure, mechanical properties and corrosion behavior of Mg-2Zn-1Y-0.5Zr alloy. Mater. Res. Express 2019, 6, 125411. [Google Scholar] [CrossRef]
- Cao, F.Y.; Zhang, J.; Li, K.K.; Song, G.L. Influence of heat treatment on corrosion behavior of hot rolled Mg5Gd alloys. Trans. Nonferrous Met. Soc. China 2021, 31, 939–951. [Google Scholar] [CrossRef]
- Zhang, X.B.; Dai, J.W.; Zhang, R.F.; Ba, Z.X.; Birbilis, N. Corrosion behavior of Mg-3Gd-1Zn-0.4Zr alloy with and without stacking faults. J. Magnes. Alloy. 2019, 7, 240–248. [Google Scholar] [CrossRef]
- Gui, Y.W.; Li, Q.A.; Chen, J. Effect of Heat Treatment on Corrosion Behaviors of Mg-5Y-2Nd-3Sm-0.5Zr Alloys. Int. J. Electrochem. Sci. 2019, 14, 1342–1357. [Google Scholar] [CrossRef]
- Zheng, X.Y.; Fan, J.; Tan, S.Y.; Zhang, X.B. Effects of Gd and heat treatments on mechanical properties of Mg-xGd-1Zn-0.4Zr alloys. Kov. Mater. 2020, 58, 423–432. [Google Scholar] [CrossRef]
- Zhang, X.B.; Dai, J.W.; Dong, Q.S.; Ba, Z.X.; Wu, Y.J. Corrosion behavior and mechanical degradation of as-extruded Mg-Gd-Zn-Zr alloys for orthopedic application. J. Biomed. Mater. Res. 2020, 108B, 698–708. [Google Scholar] [CrossRef]
- Zhang, J.; Zhang, X.B.; Liu, Q.H. Effects of Load on Dry Sliding Wear Behavior of Mg-Gd-Zn-Zr Alloys. J. Mater. Sci. Technol. 2017, 33, 645–651. [Google Scholar] [CrossRef]
- Hort, N.; Huang, Y.D.; Fechner, D. Magnesium alloys as implant materials--principles of property design for Mg-RE alloys. Acta Biomater. 2010, 6, 1714–1725. [Google Scholar] [CrossRef] [PubMed] [Green Version]
- Zhao, L.; Chen, W.; Dai, J.W.; Wang, Z.Z.; Zhang, X.B. Effects of Heat Treatment on Corrosion and Wear Behaviors of Mg-6Gd-2Zn-0.4Zr Alloy in Simulated Body Fluid. J. Mater. Eng. Perform. 2017, 26, 5501–5510. [Google Scholar] [CrossRef]
- Chang, J.W.; Fu, P.H.; Guo, X.W.; Peng, L.M.; Ding, W.J. The effects of heat treatment and zirconium on the corrosion behaviour of Mg–3Nd–0.2Zn–0.4Zr (wt.%) alloy. Corros. Sci. 2007, 49, 2612–2627. [Google Scholar] [CrossRef]
- Wang, W.Z.; Wu, D.; Chen, R.S.; Qi, Y.; Ye, H.Q.; Yang, Z.Q. Revisiting the role of Zr micro-alloying in a Mg-Nd-Zn alloy. J. Alloy. Compd. 2020, 155016. [Google Scholar] [CrossRef]
- Yao, H.; Wen, J.B.; Xiong, Y.; Liu, Y.; Lu, Y.; Cao, W. Microstructures, Mechanical Properties, and Corrosion Behavior of As-Cast Mg–2.0Zn–0.5Zr–xGd (wt%) Biodegradable Alloys. Materials 2018, 11, 1564. [Google Scholar] [CrossRef] [Green Version]
- Zhang, J.Y.; Xu, M.; Teng, X.Y.; Zuo, M. Effect of Gd addition on microstructure and corrosion behaviors of Mg-Zn-Y alloy. J. Magnes. Alloys. 2016, 4, 319–325. [Google Scholar] [CrossRef] [Green Version]
- Liu, C.; Wang, J.S.; Xu, Y.D.; Fu, Y.; Han, J.G.; Cao, Z.X.; Chen, X.H.; Zhao, S.M.; Zhu, X.R. In Vitro Corrosion Performance of As-Extruded Mg-Gd-Dy-Zr Alloys for Potential Orthopedic Applications. Metals 2022, 12, 604. [Google Scholar] [CrossRef]
- Zheng, Y.Q.; Zhang, Y.; Liu, Y.; Tian, Y.Q.; Zheng, X.P.; Chen, L.S. Microstructure Characteristics and Corrosion Behaviors of Mg-2Zn-2Er-0.3Zr-0.3Mn Alloy under Various Rolling Reductions. Metals 2022, 12, 365. [Google Scholar] [CrossRef]
- Zhang, X.B.; Wu, Y.Y.; Xue, Y.J.; Wang, Z.Z.; Yang, L. Before electrochemical testing, an open circuit voltage test was performed for 15min to stabilize the circuit. Mater. Lett. 2012, 86, 42–45. [Google Scholar] [CrossRef]
- Nie, Y.J.; Dai, J.W.; Zhang, X.B. Efect of Ag Addition on Microstructure, Mechanical and Corrosion Properties of Mg–Nd–Zn–Zr Alloy for Orthopedic Application. Acta Metall. Sin. (Engl. Lett.) 2022. online. [Google Scholar] [CrossRef]
- Wang, Z.Z.; Tao, X.W.; Zhang, X.B.; Ba, Z.X.; Wang, Q. Corrosion behaviour of Nd ion implanted Mg–Gd–Zn–Zr alloy in simulated body fluid. Mater. Technol. Adv. Perform. Mater. 2015, 30, 321–326. [Google Scholar] [CrossRef]
- Zhang, X.B.; Yuan, G.Y.; Mao, L.; Niu, J.L. Effects of extrusion and heat treatment on the mechanical properties and biocorrosion behaviors of a Mg–Nd–Zn–Zr alloy. J. Mech. Behav. Biomed. Mater. 2012, 7, 77–86. [Google Scholar] [CrossRef] [PubMed]
- Erinc, M.; Sillekens, W.H.; Mannens, R.G.T.M.; Werkhoven, R.J. Applicability of existing magnesium alloys as biomedical implant materials. Magnes. Technol. 2009, 209–214. [Google Scholar]
- Zhang, L.L.; Zhang, Y.T.; Zhang, J.S.; Zhao, R.; Zhang, J.X.; Xu, C.X. Effect of Alloyed Mo on Mechanical Properties, Biocorrosion and Cytocompatibility of As-Cast Mg-Zn-Y-Mn Alloys. Acta Metall. Sin. (Engl. Lett.) 2020, 33, 500–513. [Google Scholar] [CrossRef]
- Zong, X.M.; Zhang, J.S.; Liu, W.; Chen, J.G.; Nie, K.B.; Xu, C.X. Effects of Li on Microstructures, Mechanical, and Biocorrosion Properties of Biodegradable Mg94-xZn2Y4LixAlloys with Long Period Stacking Ordered Phase. Adv. Eng. Mater. 2016, 19, 1600606. [Google Scholar] [CrossRef]
- Sun, Y.; Zhang, W.X.; Xu, C.X.; Nie, K.B.; Zhang, J.S.; Zong, X.M. Microstructures and biocorrosion properties of biodegradable Mg-Zn-Y-Ca-xZr alloys. Int. J. Mater. Res. 2018, 109, 621–628. [Google Scholar] [CrossRef]
- Li, L.; Wang, T.; Hou, M.M.; Xue, P.; Lv, H.; Huang, C.J. In vitro degradation behavior and biocompatibility of Mg-5.8 Zn-2.0 Yb-0.5 Zr alloy during aging treatment. Mater. Lett. 2021, 282, 128682. [Google Scholar] [CrossRef]
- Zhang, Y.; Li, J.X.; Li, J.Y. Effects of calcium addition on phase characteristics and corrosion behaviors of Mg-2Zn-0.2Mn-xCa in simulated body fluid. J. Alloy. Compd. 2017, 728, 37–46. [Google Scholar] [CrossRef]
- Ben-Haroush, M.; Ben-Hamu, G.; Eliezer, D. The relation between microstructure and corrosion behaviour of AZ80 Mg alloy following different extrusion temperatures. Corros. Sci. 2008, 50, 1766–1778. [Google Scholar] [CrossRef]
- Yao, S.; Liu, S.H.; Zeng, G.; Li, X.J.; Lei, T.; Li, Y.P.; Du, Y. Effect of Manganese on Microstructure and Corrosion Behavior of the Mg-3Al Alloys. Metals 2019, 9, 460. [Google Scholar] [CrossRef]
- Coy, A.E.; Viejo, F.; Skeldon, P.; Thompson, G.E. Susceptibility of rare-earth-magnesium alloys to micro-galvanic corrosion. Corros. Sci. 2010, 52, 3896–3906. [Google Scholar] [CrossRef]
- Chen, Y.; Yan, H.; Ji, K.Z.; Ling, L.S.B.; Luo, C.; Liu, R.L.; Hu, Z. Effect of Ultrasonic Treatment during Solidification on Corrosion Behavior of Mg-3Al-1Zn and Mg-4Zn Magnesium Alloys. J. Electrochem. Soc. 2020, 167, 161505. [Google Scholar] [CrossRef]
- Yin, Z.; He, R.H.; Chen, Y.; Yin, Z.; Yan, K.; Wang, K.; Yan, H.; Song, H.G.; Yin, C.X.; Guan, H.Y.; et al. Effects of surface micro-galvanic corrosion and corrosive film on the corrosion resistance of AZ91-xNd alloys. Appl. Surf. Sci. 2021, 536, 147761. [Google Scholar] [CrossRef]
- Xie, J.S.; Zhang, J.H.; Zhang, Z.; Yang, Q.; Guan, K.; He, Y.Y.; Wang, R.; Zhang, H.; Qiu, X.; Wu, R.Z. New insights on the different corrosion mechanisms of Mg alloys with solute-enriched stacking faults or long period stacking ordered phase. Corros. Sci. 2022, 198, 110163. [Google Scholar] [CrossRef]
- Hu, Z.; Yin, Z.; Yin, Z.; Wang, K.; Liu, Q.; Luc, C. Corrosion behavior characterization of as extruded Mg-8Li-3Al alloy with minor alloying elements (Gd, Sn and Cu) by scanning Kelvin probe force microscopy. Corros. Sci. 2020, 176, 108923. [Google Scholar] [CrossRef]
- Mandal, M.; Mondal, K. Effect of micro-alloying and microstructure on the corrosion behavior of as-cast Mg-6.2 wt% Zn alloy. J. Mater. Eng. Perform. 2020, 29, 6691–6700. [Google Scholar] [CrossRef]
- Song, G.L.; Xu, Z.Q. The surface, microstructure and corrosion of magnesium alloy AZ31 Sheet. Electrochim. Acta 2010, 55, 4148–4161. [Google Scholar] [CrossRef]
- Zhang, Y.P. Influence of the amount of intermetallics on the degradation of Mg-Nd alloys under physiological conditions. Acta Biomater. 2021, 121, 695–712. [Google Scholar] [CrossRef]
Figure 1.
OM images of the T6-treated alloys. (a) GZ31K, (b) GZ61K, (c) GZ91K.


Figure 2.
The α-Mg grain size distribution of the T6-treated alloys.

Figure 3.
SEM images of the T6-treated alloys. (a) GZ31K, (b) GZ61K, (c) GZ91K.

Figure 4.
Polarization curves of T6-treated alloys in SBF.

Figure 6.
Hydrogen evolution curves of the T6-treated alloys immersed in SBF for 120 h.

Figure 7.
Cross-section morphologies of the specimens after immersion in SBF for 120 h. (a) GZ31K, (b) GZ61K, (c) GZ91K.
Figure 7.
Cross-section morphologies of the specimens after immersion in SBF for 120 h. (a) GZ31K, (b) GZ61K, (c) GZ91K.

Figure 8.
SEM images and element distribution maps of GZ61K alloy following various immersion durations.
Figure 8.
SEM images and element distribution maps of GZ61K alloy following various immersion durations.

Figure 9.
SEM images and element distribution maps of GZ91K alloy following various immersion durations.
Figure 9.
SEM images and element distribution maps of GZ91K alloy following various immersion durations.

Figure 10.
Schematic diagrams showing corrosion processes of T6-treated GZ61K (a–c) and GZ91K (d–f) alloys.
Figure 10.
Schematic diagrams showing corrosion processes of T6-treated GZ61K (a–c) and GZ91K (d–f) alloys.

Table 1.
Nominal and analyzed compositions of the alloys (wt%).
| Nominal Compositions | Analyzed Compositions | |||
|---|---|---|---|---|
| Gd | Zn | Zr | Mg | |
| Mg-3Gd-1Zn-0.4Zr (GZ31K) | 2.77 | 1.00 | 0.46 | Bal. |
| Mg-6Gd-1Zn-0.4Zr (GZ61K) | 5.57 | 0.87 | 0.39 | Bal. |
| Mg-9Gd-1Zn-0.4Zr (GZ91K) | 8.62 | 0.77 | 0.32 | Bal. |
Table 2.
Composition of the simulated body fluid.
| Component | NaCl | CaCl2 | KCl | NaHCO3 | MgCl2·6H2O | Glucose | Na2HPO4·2H2O | KH2PO4 | MgSO4·7H2O |
|---|---|---|---|---|---|---|---|---|---|
| Concentration/g·L−1 | 8.00 | 0.14 | 0.40 | 0.35 | 0.10 | 1.00 | 0.06 | 0.06 | 0.06 |
Table 3.
Electrochemical parameters of the samples fitted from Figure 4.
Table 3.
Electrochemical parameters of the samples fitted from Figure 4.
| Alloys | Icorr/(A·cm−2) | Ecorr/V(SCE) |
|---|---|---|
| GZ31K | 2.04 × 10⁻⁵ | −1.56 |
| GZ61K | 1.30 × 10⁻⁵ | −1.45 |
| GZ91K | 2.30 × 10⁻⁵ | −1.51 |
Table 5.
Corrosion rates (mm/year) of the T6-treated alloys calculated by different methods.
| Alloy | Mass Loss | Hydrogen Evolution | Polarization |
|---|---|---|---|
| GZ31K | 0.41 | 0.45 | 0.46 |
| GZ61K | 0.23 | 0.25 | 0.29 |
| GZ91K | 0.89 | 0.61 | 0.53 |
Table 6.
The corrosion rates of biomedical Mg alloys.
| Alloys | Condition | Corrosion Rate (mm/Year) | Corrosion Medium | Immersion Time | Ref. |
|---|---|---|---|---|---|
| Mg-3Gd-1Zn-0.4Zr | T6 | 0.41 | SBF | 120 h | Present work |
| Mg-6Gd-1Zn-0.4Zr | 0.23 | ||||
| Mg-9Gd-1Zn-0.4Zr | 0.90 | ||||
| Mg-2Zn-0.4Mn-0.1Sr-0Gd | As-extruded | 0.50 | Hank’s solution | 240 h | [10] |
| Mg-2Zn-0.4Mn-0.1Sr-0.5Gd | 0.41 | ||||
| Mg-2Zn-0.4Mn-0.1Sr-1Gd | 0.48 | ||||
| Mg-2Zn-0.4Mn-0.1Sr-2Gd | 0.87 | ||||
| Mg-5.8Zn-0.5 Zr | T4 | 2.51 | SBF | 240 h | [17] |
| T6 | 25.29 | ||||
| Mg-5.8Zn-0.5 Zr-1Yb | T4 | 1.31 | |||
| T6 | 5.83 | ||||
| Mg-5.8Zn-0.5 Zr-2Yb | T4 | 1.49 | |||
| T6 | 2.27 | ||||
| Mg-6Zn-8.16Y-2.02Mn-0Mo | As-cast | 4.83 | Hank’s solution | 120 h | [45] |
| Mg-6Zn-8.16Y-2.02Mn-0.1Mo | 1.60 | ||||
| Mg-6Zn-8.16Y-2.02Mn-0.3Mo | 1.34 | ||||
| Mg-6Zn-8.16Y-2.02Mn-0.5Mo | 1.90 | ||||
| Mg-6Zn-8.16Y-2.02Mn-0.7Mo | 2.20 | ||||
| Mg94Zn2Y4 | 2.06 | Hank’s solution | 130 h | [46] | |
| Mg89Zn2Y4Li5 | 0.98 | ||||
| Mg81Zn2Y4Li13 | 5.02 | ||||
| Mg-1.8Zn-1.74Gd-0.5Y-0.4Zr | As-cast | 0.72 | SBF | 120 h | [16] |
| T4-470 °C | 0.67 | ||||
| T4-490 °C | 0.47 | ||||
| T4-510 °C | 0.52 | ||||
| Mg-2.0Zn-0.5Zr | As-cast | 1.23 | SBF | 120 h | [36] |
| Mg-2.0Zn-0.5Zr-1Gd | 1.19 | ||||
| Mg-2.0Zn-0.5Zr-2Gd | 0.93 | ||||
| Mg-2.0Zn-0.5Zr-3Gd | 0.85 | ||||
| Mg-2.0Zn-0.5Zr-4Gd | 1.14 | ||||
| Mg-2.0Zn-0.5Zr-5Gd | 1.16 | ||||
| Mg-3Zn-0.6Y-0.3Ca | As-cast | 1.07 | SBF | 168 h | [47] |
| Mg-3Zn-0.6Y-0.3Ca-0.25Zr | 0.66 | ||||
| Mg-3Zn-0.6Y-0.3Ca-0.5Zr | 0.46 | ||||
| Mg-3Zn-0.6Y-0.3Ca-1.0Zr | 0.85 | ||||
| Mg-5.8 Zn-2.0 Yb-0.5 Zr | T6-8 h | 23.50 | SBF | 240 h | [48] |
| T6-16 h | 2.30 | ||||
| T6-24 h | 58.60 | ||||
| Mg-2Zn-0.2Mn | As-cast | 13.48 | SBF | 240 h | [49] |
| Mg-2Zn-0.2Mn-0.38Ca | 20.39 | ||||
| Mg-2Zn-0.2Mn-0.76Ca | 23.48 | ||||
| Mg-2Zn-0.2Mn-1.10Ca | 27.80 |
Publisher’s Note: MDPI stays neutral with regard to jurisdictional claims in published maps and institutional affiliations. |
© 2022 by the authors. Licensee MDPI, Basel, Switzerland. This article is an open access article distributed under the terms and conditions of the Creative Commons Attribution (CC BY) license (https://creativecommons.org/licenses/by/4.0/).
Share and Cite
MDPI and ACS Style
Geng, X.; Jiang, J.; Zhang, X. Corrosion Behavior of Mg-xGd-1Zn-0.4Zr Alloys with Different Gd Additions for Biomedical Application. Metals 2022, 12, 1763. https://doi.org/10.3390/met12101763
AMA Style
Geng X, Jiang J, Zhang X. Corrosion Behavior of Mg-xGd-1Zn-0.4Zr Alloys with Different Gd Additions for Biomedical Application. Metals. 2022; 12(10):1763. https://doi.org/10.3390/met12101763
Chicago/Turabian StyleGeng, Xue, Jiahao Jiang, and Xiaobo Zhang. 2022. "Corrosion Behavior of Mg-xGd-1Zn-0.4Zr Alloys with Different Gd Additions for Biomedical Application" Metals 12, no. 10: 1763. https://doi.org/10.3390/met12101763
Note that from the first issue of 2016, this journal uses article numbers instead of page numbers. See further details here.