Article

Thermomechanical and Microstructural Analysis of the Influence of B- and Ti-Content on the Hot Ductility Behavior of Microalloyed Steels

1
K1-MET GmbH, 4020 Linz, Austria
2
Institute of Materials Science, Joining and Forming, Graz University of Technology, Campus Neue Technik, 8010 Graz, Austria
3
School of Materials Science & Engineering, UNSW Sydney, Sydney, NSW 2052, Australia
4
Electron Microscope Unit, UNSW Sydney, Sydney, NSW 2052, Australia
5
Voestalpine Stahl GmbH, 4020 Linz, Austria
*
Author to whom correspondence should be addressed.
Metals 2022, 12(11), 1808; https://doi.org/10.3390/met12111808
Submission received: 25 August 2022 / Revised: 10 October 2022 / Accepted: 20 October 2022 / Published: 25 October 2022
(This article belongs to the Special Issue Continuous Casting and Hot Ductility of Advanced High-Strength Steels)

Abstract

:
The effects of the combined addition of B and Ti, as well as the influence of different strain rates on the hot ductility behavior of low carbon, continuously cast, microalloyed steels were investigated in this work. Tensile tests, microstructure analyses, and thermokinetic simulations were performed with in situ melted samples. Furthermore, prior austenite grain evaluations were carried out for the two different microalloyed steels. Increasing the strain rate brought improvements to the ductility, which was more significant in the steel with the leanest composition. The steel containing more B and Ti presented a better hot ductility behavior under all conditions tested. The main causes for the improvements rely on the precipitation behavior and the austenite–ferrite phase transformation. The preferential formation of TiN instead of fine BN and AlN was seen to be beneficial to the ductility, as well as the absence of MnS. Grain boundary segregation of free B that did not form BN retarded the ferrite formation, avoiding the brittleness brought by the thin ferrite films at the austenite grain boundaries. Furthermore, it was revealed that for the steels in question, the prior austenite grains have less influence on the hot ductility behavior than the precipitates and ferrite formation.

1. Introduction

The problem of transverse cracks in continuously cast slabs has been addressed following different approaches for many years [1,2,3,4]. The formation of these cracks occurs when the hot ductility of the alloy being cast is too low during the bending and straightening operations of this process. Therefore, improving the ductility of microalloyed steels via parameters such as critical temperatures, casting speed, and cooling rate is of great interest for a more effective production process.
The hot ductility of steels is usually assessed via hot tensile testing [1,5,6,7]. Even though it does not reproduce the exact same conditions as in the industrial process, this test has been shown to provide one of the best approximations [8]. The hot ductility curve is determined with the reduction in area (RA), and the results are evaluated based on the 40% minimum RA value, which has been indicated as a threshold for good ductility [1].
The critical temperatures are the range at which the ductility is below 40%, where a trough is formed and is called the second ductility minimum. This is usually seen between 700 and 1000 °C, varying with the composition of the material and other test parameters such as the strain rate and cooling rate [6,9,10].
Microalloying elements are commonly used for achieving specific properties in the final product and are an important aspect for the control of ductility during casting, being able to strongly change the manufacturing behavior and even suppress the formation of a ductility trough [2,4,7,11]. Usually, B is added to low-carbon steels to improve hardenability and Ti to improve the impact properties of the final products [12,13,14]. However, the addition of both elements also has an impact on the hot ductility behavior during casting, depending on the amount present. This is mainly correlated to the austenite–ferrite phase transformation and the detailed precipitation behavior [2,15].
Another parameter that can markedly influence the hot ductility of microalloyed steels apart from the temperature and composition is the strain rate. This testing parameter can be translated to the industrial process as a function of the casting velocity, the bending radius, and the gauge length necessary for the full bending strain [1]. A strain rate of 10−3 s−1 is usually used in the hot ductility test to simulate the straightening operation [1,11,16,17]. Increasing the strain rate has often been reported to improve the hot ductility behavior of microalloyed steels, as has been shown in a previous study, as well as in many other publications [1,9,11,16,18,19,20]. However, the intensity of change depends on the alloy under investigation.
Another aspect of interest regarding mechanical properties is the grain size when the deformation is applied. Larger austenite grains can be detrimental to ductility due to easier crack propagation [21]. Different methods for measuring the prior austenite grains (PAG) have been used by other authors, and the results were discussed from different approaches [21,22,23,24].
The experimental methods used to investigate the influence of the factors mentioned on the ductility, i.e., B- and Ti-addition, strain rate, and grain size, are affected by the thermal cycle chosen, especially the temperature the tensile specimens reach before cooling and straining to failure. For example, when hot ductility tests on high strength low alloyed steels (HSLA) containing Nb, Al, and V are carried out, solution treatment at temperatures close to 1350 °C is often used to simulate the continuous casting process. This temperature is generally high enough to take all the microalloying additions back into solution, the condition present during the continuous casting operation. However, with Ti-containing steels, TiN is still present at 1350 °C and can refine the austenite grain size improving the hot ductility. In order to represent the condition relating to continuous casting, melting is required to dissolve the TiN with a consequent coarsening of the grain size and worsening of the ductility [15,25].
In previous work, it was shown that there was a great improvement in ductility after the addition of B and Ti [26]. However, the reasons for this change have not yet been clarified. In the literature, divergent results can be found when either B or Ti is present. The hot ductility of steels alloyed with B was reported to be improved or deteriorated depending on the test conditions and N content [27,28]. The same is also the case for Ti [15,25]. Studies about the hot ductility behavior of continuously cast microalloyed steels when both Ti and B are present, however, are limited yet very important due to the changes in the precipitation behavior when both are present [29]. Therefore, the analysis of the effects of both elements simultaneously is one focus of the present study.
This work investigated the influence of the combined addition of B and Ti on the hot ductility behavior of low-carbon steel to be produced by continuous casting. The effect of different strain rates was explored, as well as the microstructure changes that led to the observed thermomechanical behavior. The phase transformations, precipitation behavior, as well as the prior austenite grains were investigated using different methods to better understand the differences in the ductility behavior shown by the microalloyed steels in question. Furthermore, hot tensile testing was carried out after the in situ melting of the samples, thus giving a better representation of the phenomena occurring during the continuous casting process.

2. Materials and Methods

Two different low-carbon, microalloyed steels were under investigation. One with generally lower content of the alloying elements and the second one with a higher B, Ti, V, Ni, and Cu content, as described in Table 1. The lower S content of the second steel is also relevant. The samples were taken from the continuously cast slabs, and their final composition was determined with optical emission spectroscopy (OES).
Different analyses were carried out on samples from both steels to investigate and compare different aspects of the ductility behavior; thermomechanical tests for determining the hot ductility curves, the strain rate influence, as well as fracture and microstructural analysis, were performed using a scanning electron microscope (SEM) (TESCAN, Dortmund, Germany) and light optical microscope (LOM) (Carl Zeiss AG, Oberkochen, Germany). The precipitation behavior of the samples from the two steels was analyzed via SEM, transmission electron microscopy (TEM) (JEOL GmbH, Freising, Germany), and numerical simulations. Moreover, the PAG size analysis was carried out by the grain reconstruction via the electron backscatter diffraction (EBSD) method and chemical etching.
The next subsections describe the methods chosen and materials used for each of the three analyses mentioned.

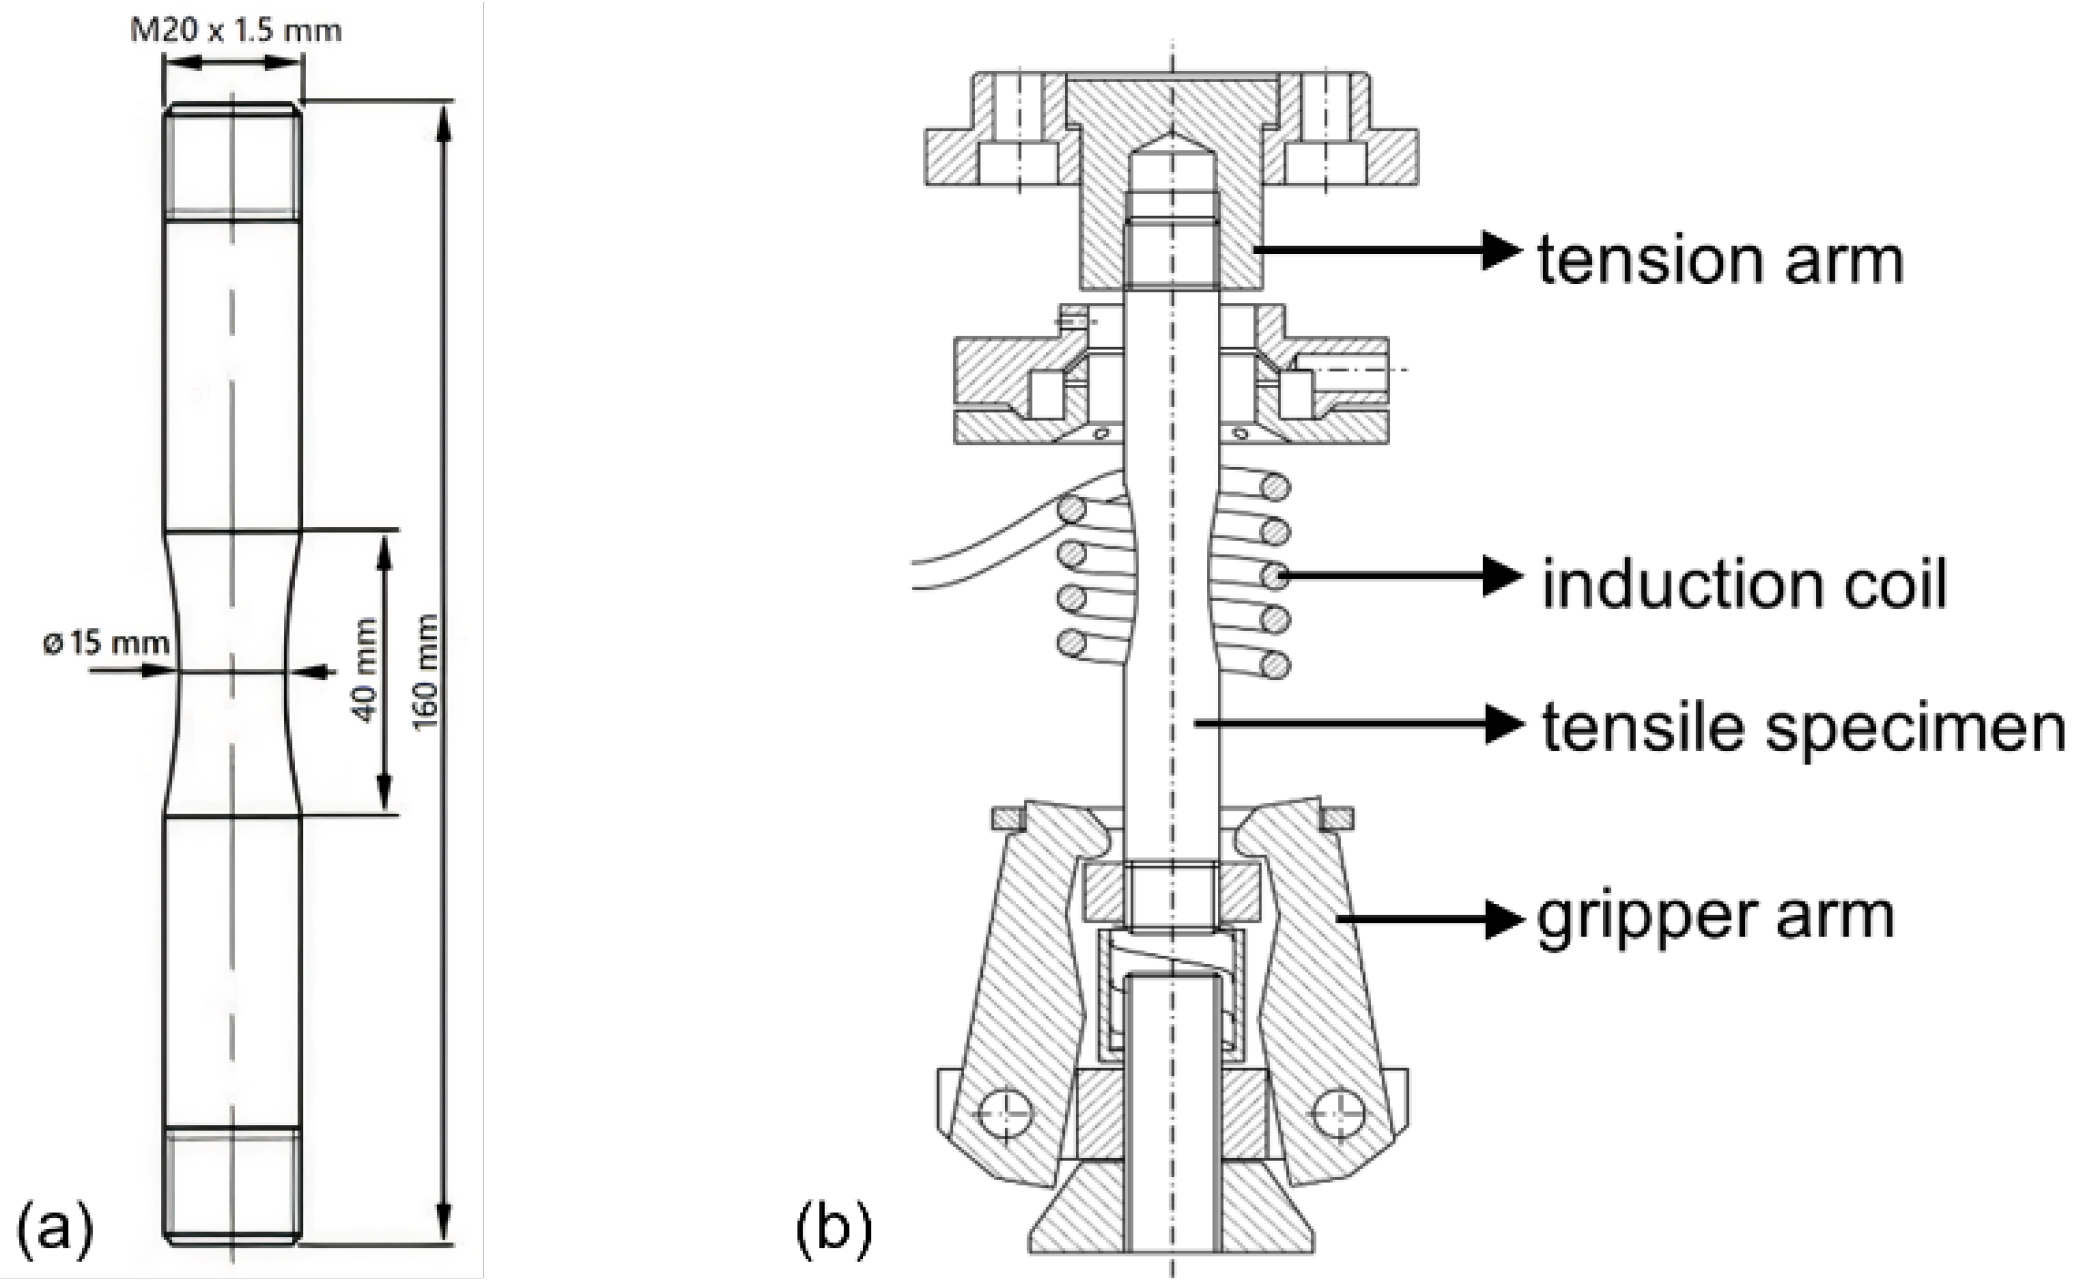
2.1. Hot Ductility Behavior

For the determination of the hot ductility curves, dog-bone-shaped samples were machined from slabs of both steels, and hot tensile tests after in situ melting were performed. The machine used for the tests was an in-house built thermomechanical simulator, given the designation BETA 250-5, with tensile test unit delivered by Messphysik (Fürstenfeld, Austria) which was rebuilt from MTS (Mechanical Testing Systems, Eden Prairie, MN, USA) and comprised of a vacuum chamber. The machine also holds changes and adjustments in the setup to fit the needs of the experiments performed. The geometry of the samples and sketch of the assembly in the machine were shown in a previous publication and are replicated in Figure 1 [30].
The samples are assembled in the machine in such a way that the lower part is fixed by a gripper arm, and the upper is attached to the tension arm. An induction coil heats the middle portion of the samples, and the temperature is measured by a Pt/Pt-Rh thermocouple spot welded in the center.
The thermal cycle consisted of first heating the samples until melting of the inner part of the gauge length, the point at which the temperature measured by the thermocouple at the surface was around 1450 °C. The formation of an outer thin oxide layer (due to the fine vacuum in the chamber) prevents the breakage of the samples and the spilling of the liquid pool from the inside. The samples were then held at this temperature for 90 s for the dissolution of precipitates and closer replication of the first stage of the continuous casting process when the liquid steel was poured into the molds. Afterward, the cooling before straining was carried out in two steps: first with a cooling rate of 5 °C/s until 1250 °C, and then from 1250 °C until the desired test temperature at 1 °C/s. On reaching the test temperatures, which ranged between 650 and 1100 °C, the tensile specimens were strained to failure.
The hot tensile tests were carried out at the previously used strain rate of 10−3 s−1, and the RA value was determined by measurement of the fractured surface using a stereo microscope, Zeiss Discovery.V20 (Carl Zeiss AG, Oberkochen, Germany). With these results, the critical temperature range could be identified, and new tests were performed at varying strain rates to observe the influence of these parameters in both steels.
The fractured surfaces of the samples were examined with a TESCAN Mira3 Field Emission SEM (TESCAN, Dortmund, Germany) to identify the failure mechanism. The samples were also prepared for etching with 3% Nital for the analysis of the microstructure at each temperature and strain rate with the LOM Zeiss Axio Observer Inverted (Carl Zeiss AG, Oberkochen, Germany).

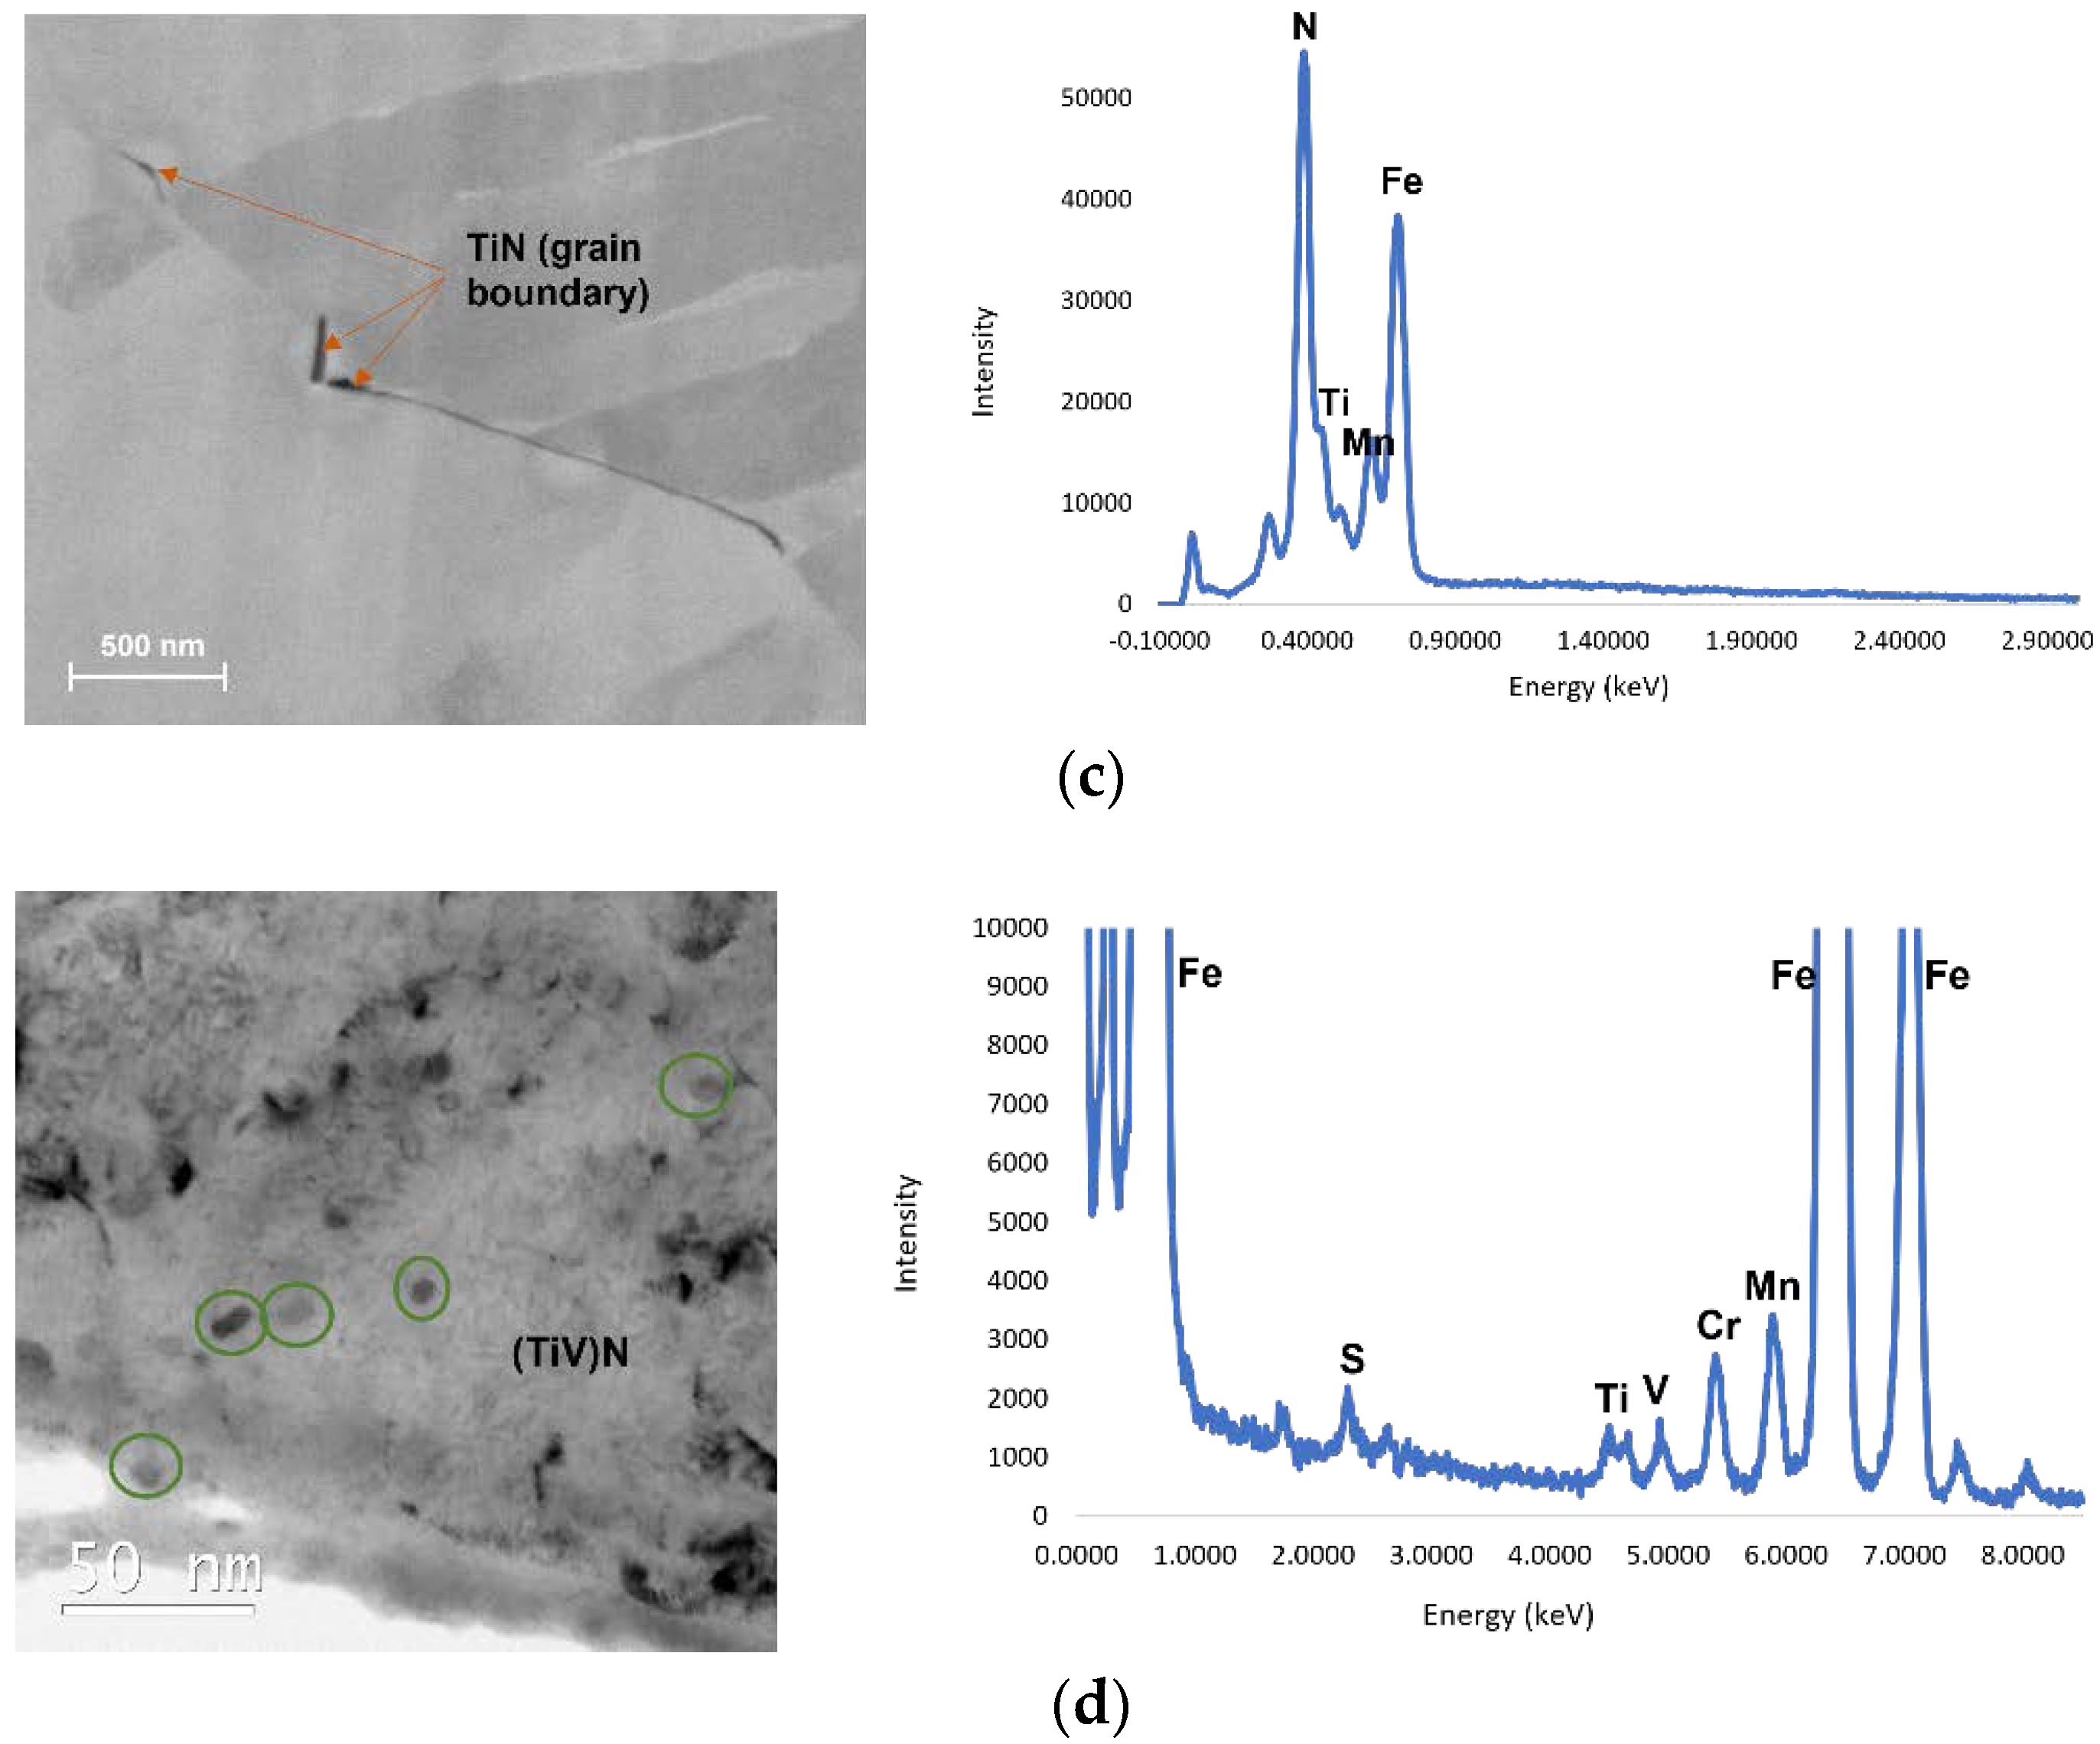
2.2. Precipitation Behavior

In order to analyze the precipitation behavior, first thermokinetic simulations were performed using the MatCalc software (version 6.03/rel 1.003, MatCalc Engineering GmbH, Vienna, Austria). In the simulations, the thermal cycle with melting, cooling and hot tensile testing was reproduced using the parameters chosen for the laboratory tests, such as the test temperatures, cooling, and strain rate. MnS and AlN were considered in the simulations for steel A. BN and TiN were considered for steel B (a small correction from the previous publication [26] where Ti(C,N) was also considered from the simulations). Even though steel B has a similar Al content, AlN precipitates were not found in the final simulations for the second steel. AlN is not formed because Ti and B preferentially consume the N available. Moreover, MnS were also considered in the first simulations of steel B, but they were seen to be in a phase fraction that was too low to be further considered (lower than 10−15).
For both steels, the simulations were carried out at two temperatures, 800 and 900 °C. Lower temperatures were not simulated due to the presence of a considerable fraction of ferrite, and this dual-phase region cannot be precisely simulated. The precipitation was considered to occur at grain boundaries (gb) and dislocations (d) for both steels. However, for steel A the precipitation of AlN was considered only at the grain boundaries and MnS at the dislocations. MnS at grain boundaries and AlN at dislocations were disregarded due to the preferential precipitation location and very low phase fraction (below 10−12) [31,32,33]. For steel B, BN and TiN were taken to precipitate both at the grain boundaries and dislocations.
The confirmation of the simulation considerations and results was sought via microscopy investigations of the samples tested with the BETA 250-5 machine since this is the experiment that best replicates the continuous casting process. SEM and TEM analyses, in combination with energy dispersive spectroscopy (EDX) for the elemental composition, were used for the samples from both steels tested at 900 °C. This temperature was chosen because it gave a better comparison with the simulations.
The SEM used for these precipitation investigations was a ZEISS GeminiSEM 450 with a Ultim® Extreme detector for the EDX analysis. An ION Slicer (Hitachi IM4000+), with a cross-section mode, was used to prepare the samples for the SEM. An acceleration voltage of 5 kV and beam energy of 10 keV were chosen to enable the detection of B, which has a very low atomic number.
Following electrochemical jet polishing, the TEM and scanning TEM (STEM) examinations were performed on a JEOL JEM-F200 cold field emission microscope operated with an accelerating voltage of 200 kV. Bright field TEM (BF-TEM) images were recorded on a 4 k × 4 k Gatan OneView IS camera, and high angle annular dark field images (HAADF-STEM) were recorded with a camera length of 120 mm with a corresponding inner collection angle of 62 mrad.

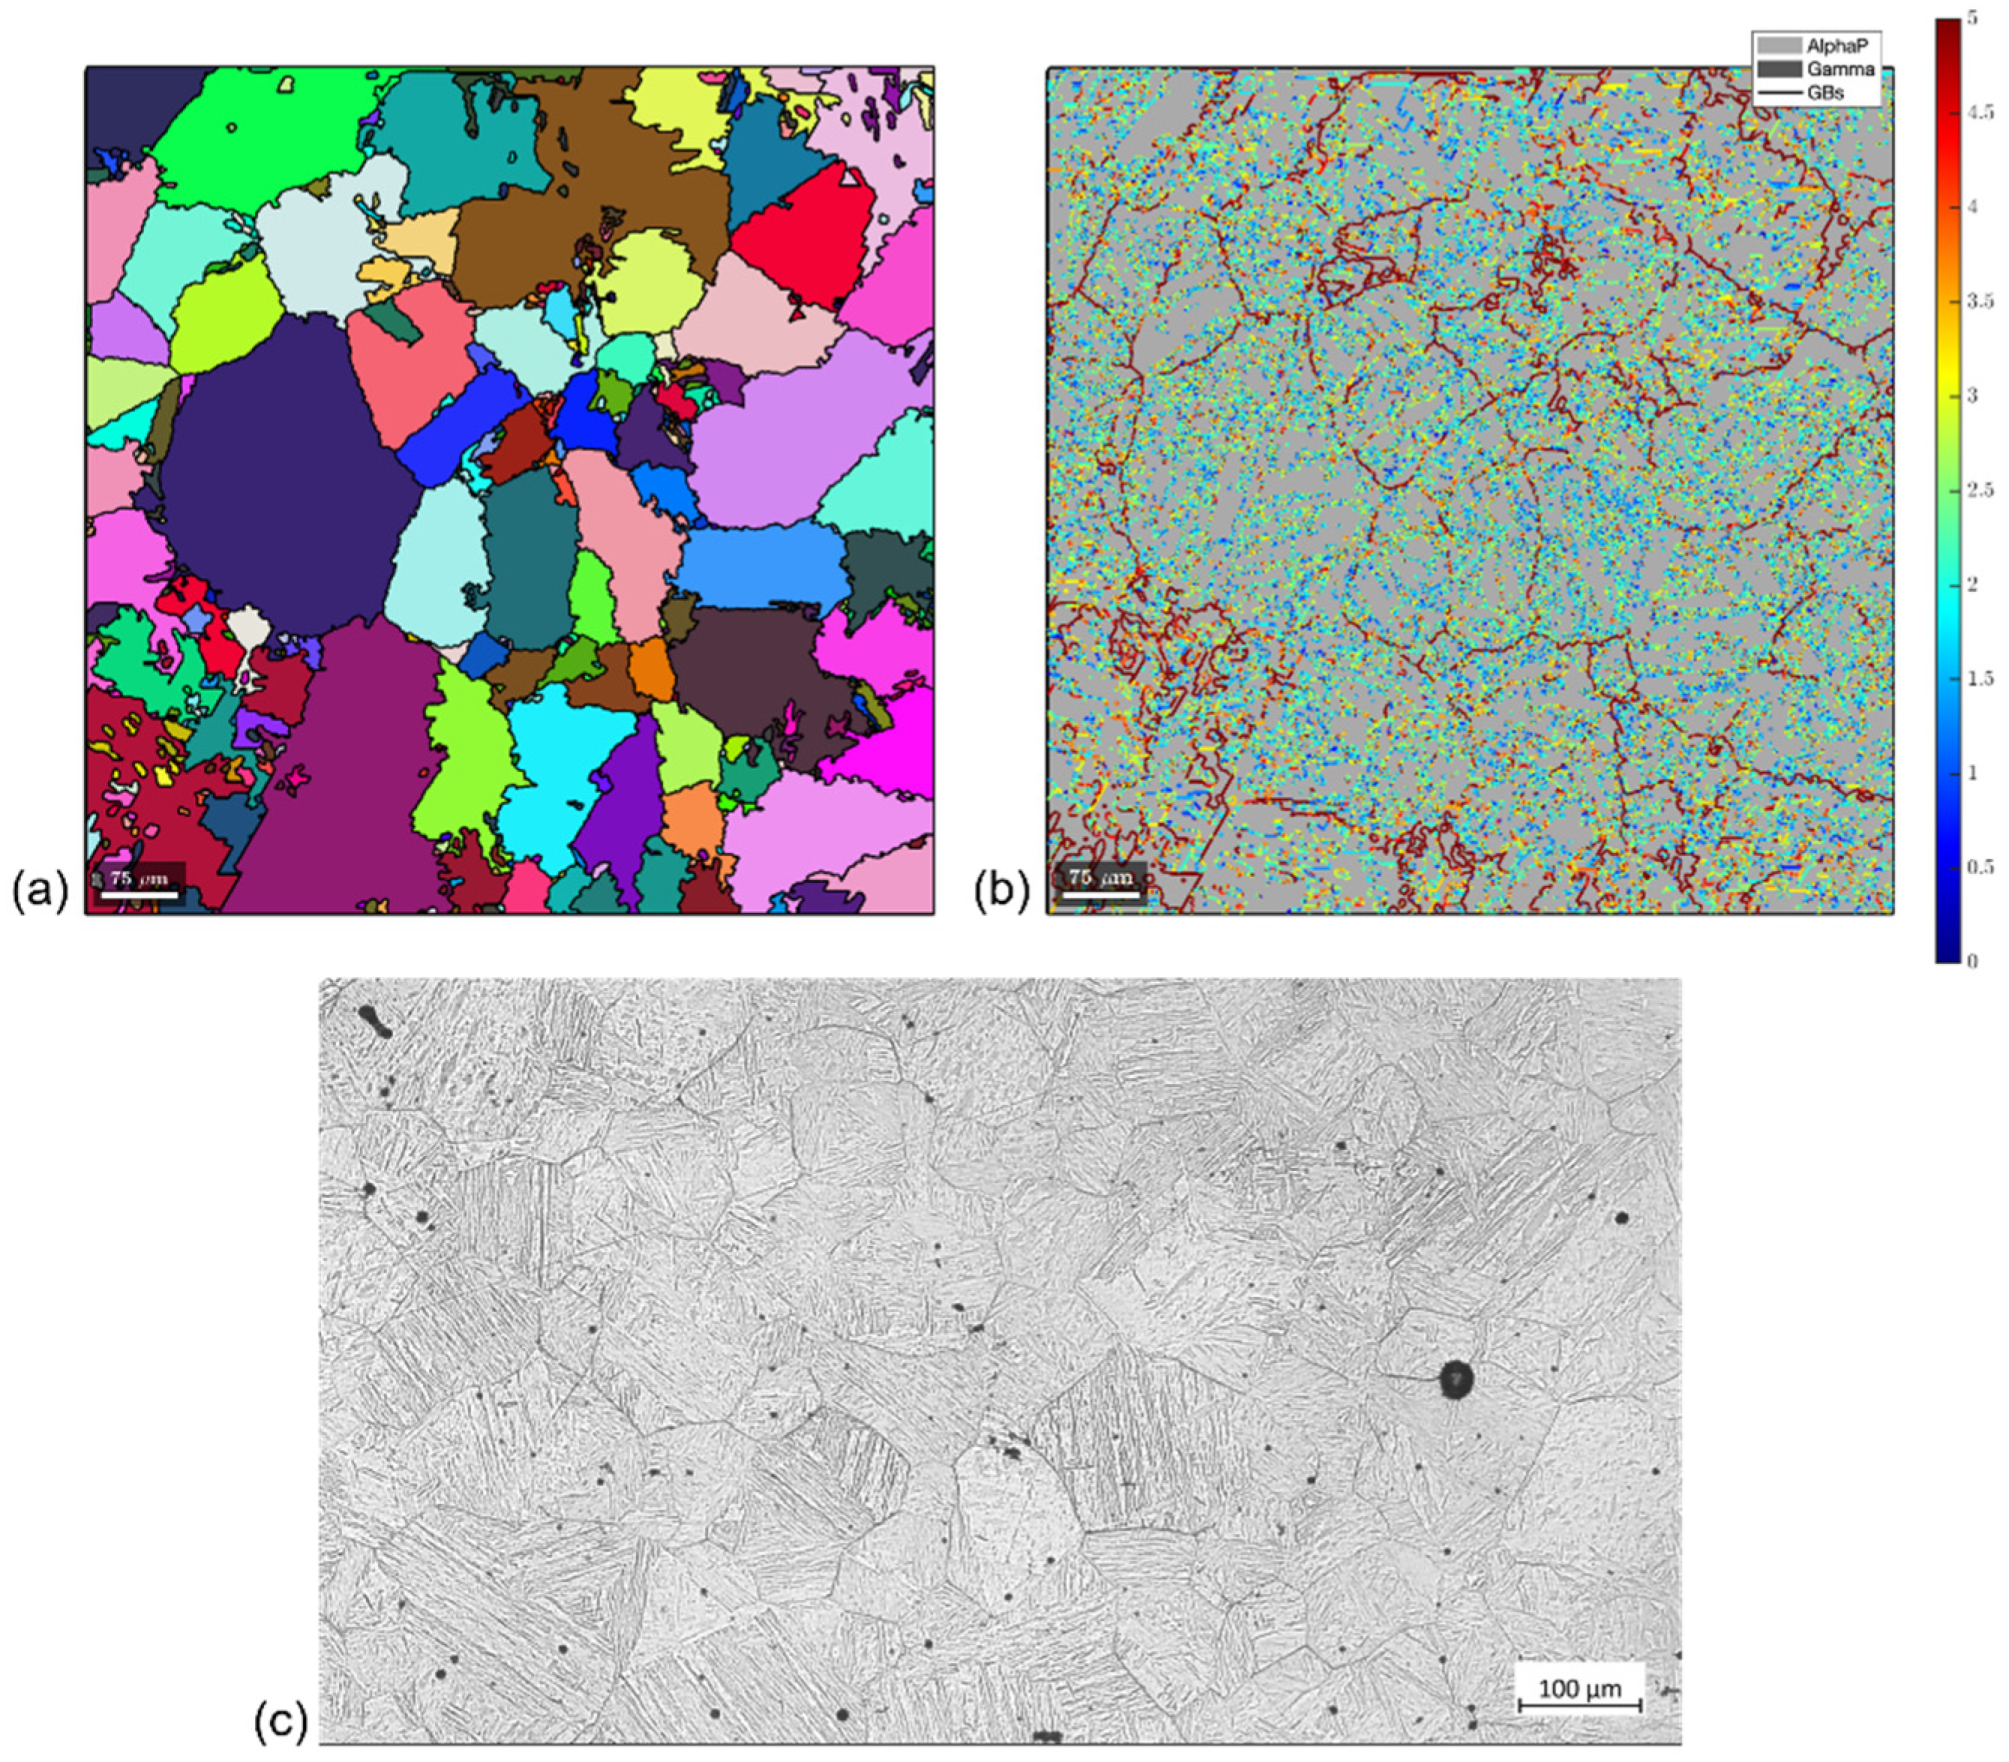
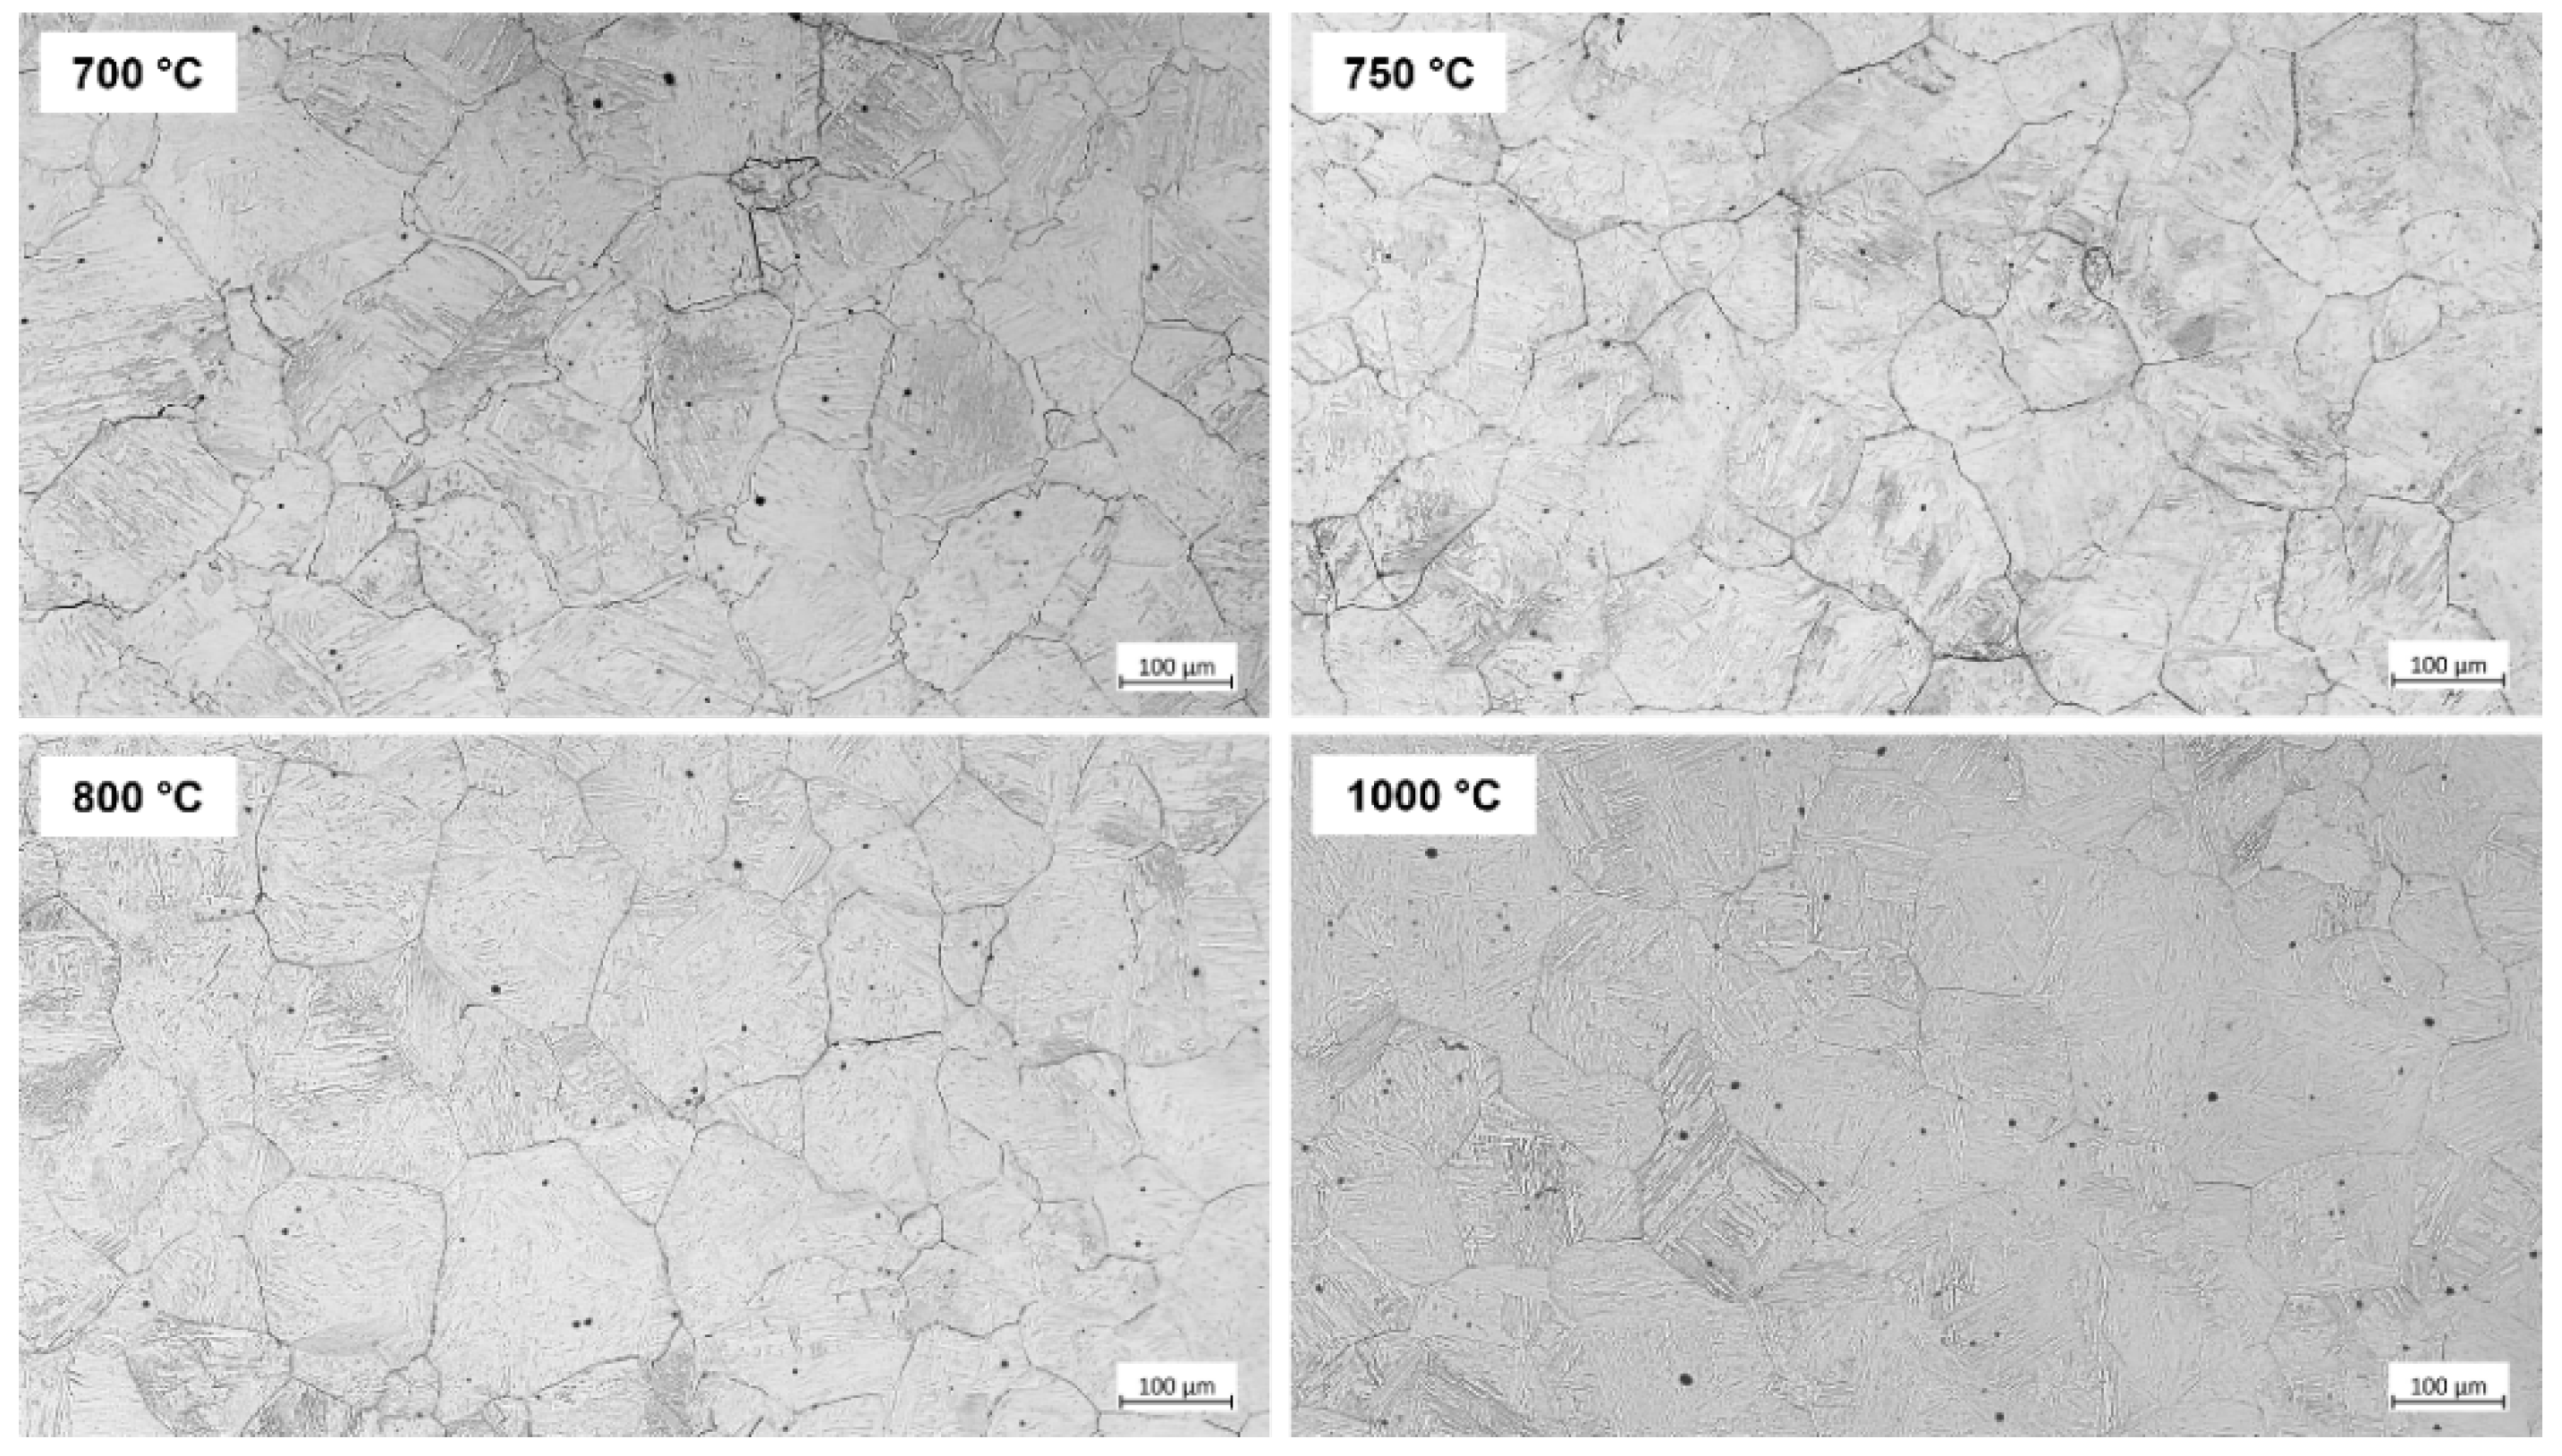
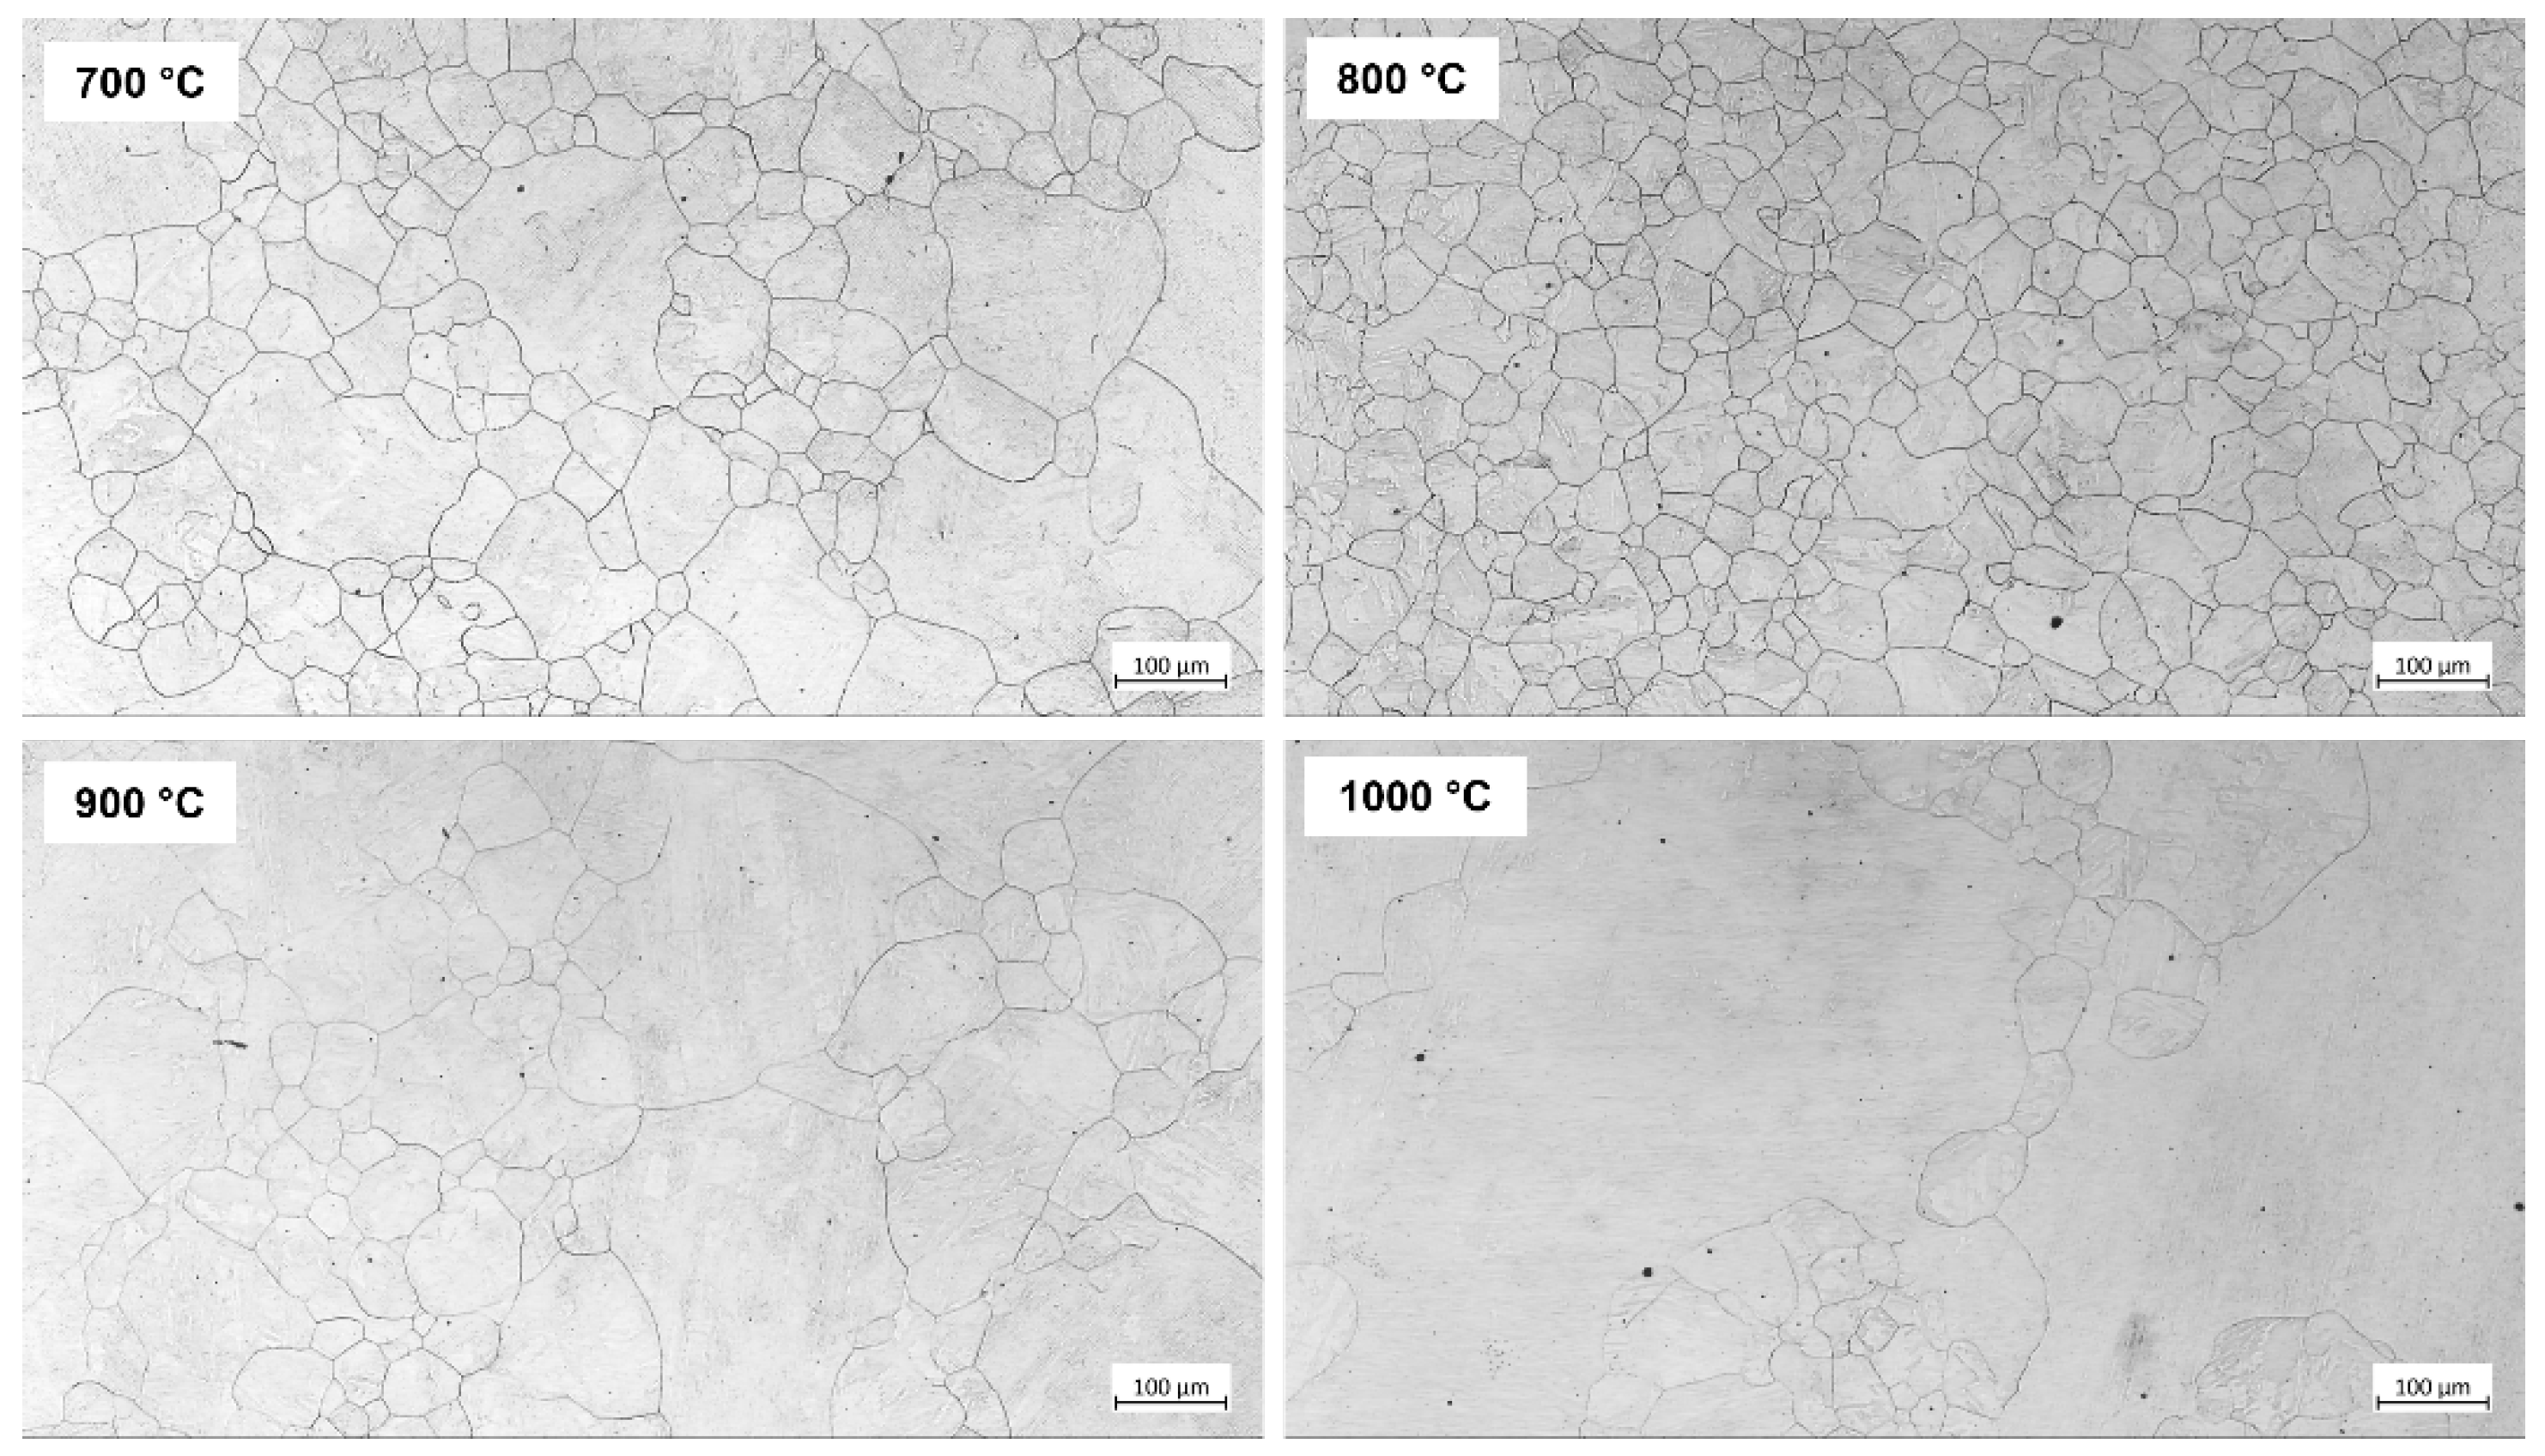
2.3. Grain Size Analysis

A Gleeble 3800 thermomechanical simulator was chosen to perform new tests for the investigations of the prior austenite grains and their size before the onset of the deformation. The reason for the change in the test apparatus used lies in the rate of cooling. With the BETA 250-5, even though the continuous casting process can be better replicated for the determination of the hot ductility curves through the in-situ melting, the samples need to be cooled with air. Air cooling allows diffusional transformation during cooling and makes it not feasible to reveal clearly and reconstruct the prior austenite grains. In contrast, when using the Gleeble, quenching with water is possible, and consequently, better freezing of the microstructure can be achieved. With this rapid cooling, diffusionless transformation occurs from austenite to martensite, enabling the reconstruction of the prior austenite grains.
The samples used for these tests were cylindrical and had 10 mm diameter and 15 mm length. First, the samples were heated to 1200 °C, held for 10 min, and then cooled to the desired test temperature. Subsequently, they were cooled until the desired test temperature, chosen between 700 and 1000 °C depending on the steel, and water-quenched without any deformation. The interruption of the test before deformation was carried out to establish whether the prior austenite grain size was influencing the hot ductility behavior.
The tests for steel A were carried out at 750, 850, 900, and 1000 °C and for steel B at 700, 800, 900, and 1000 °C. The samples were cut, embedded, ground, and polished in a preparation procedure for the analysis following standard metallographic methods.
One of the approaches used for the PAG analyses is the parent grain reconstruction. The reconstruction is based on the correlation of the orientation relationships between the child and the parent phase. The austenite/martensite diffusionless phase transformation was therefore required. The analysis was performed using the open-source Matlab toolbox MTEX on EBSD scan data from the samples. The EBSD scans were performed in a JEOL 7001 field emission SEM equipped with a Hikari Super EBSD system under 20 kV accelerating voltage and a working distance of 18–20 mm. EBSD maps were recorded for a window size of 850 × 800 µm at 0.75 µm step size under 6 × 6 binning. Post-mapping data evaluation was performed with TSL OIM Analysis 7 software following the grain dilation step with a grain tolerance angle of 5 degrees and a minimum pixel size of 5. A further clean-up step was investigated with a neighbor confidence index (CI) correlation with a threshold CI value of 0.1 Maps were then exported in .ang format as an input file for parent grain reconstructions using MTEX. Matlab-based parent grain reconstruction suite MTEX (version 5.7.0) incorporating parent austenite reconstruction script from another freeware MTEX toolbox OR (orientation relationship) toolkit (version 1.2.0) was used [34]. A slightly higher grain boundary merging threshold of 10 degrees was employed instead of the default 7.5 degrees in the reconstruction script for the cleaning up of finally reconstructed parent austenite maps using the OR toolkit. This change minimized ambiguity in the parent grain size evaluations since several fragmented grains within individual parent grains were still present when using the default MTEX OR tool clean-up script with a threshold value of 7.5 degrees. Cleaner individual parent grains without fragments were observed for a threshold value of 10 degrees. This enabled an easier quantification of the PAG sizes without any significant change in the overall microstructure of the grains.
The other method used to reveal the PAG boundaries of the samples was a picric acid-based etchant, recommended for low-carbon microalloyed steels. In this work, the CRIDA-QT Plus etchant from Crida Chemie manufacturer was used. This is an etchant specifically developed for the revelation of prior austenite grain boundaries in microalloyed steels. After 15 min of submersion, the grain boundaries were satisfactorily revealed and analyzed with the same LOM mentioned in Section 2.1. In some of the samples, the measurement of average grain size was possible using the linear intercept method, following the instructions from the ASTM E112 standard [35].

3. Results

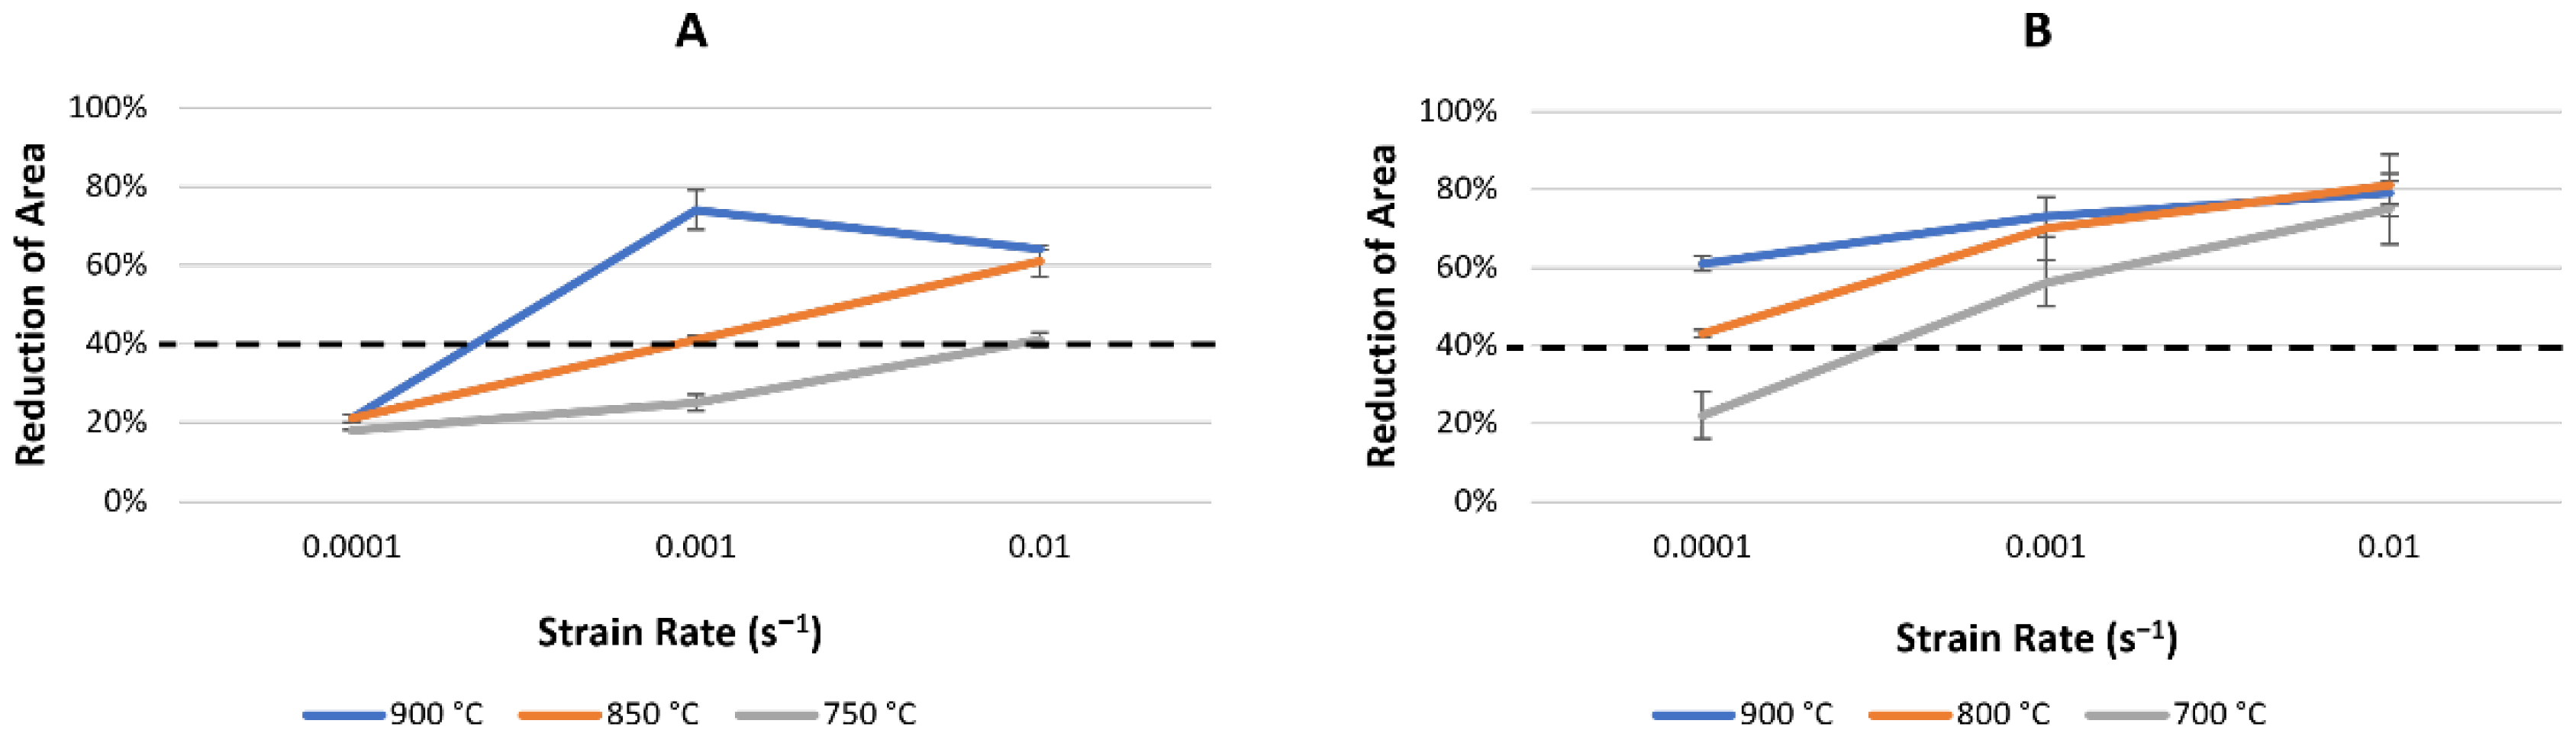
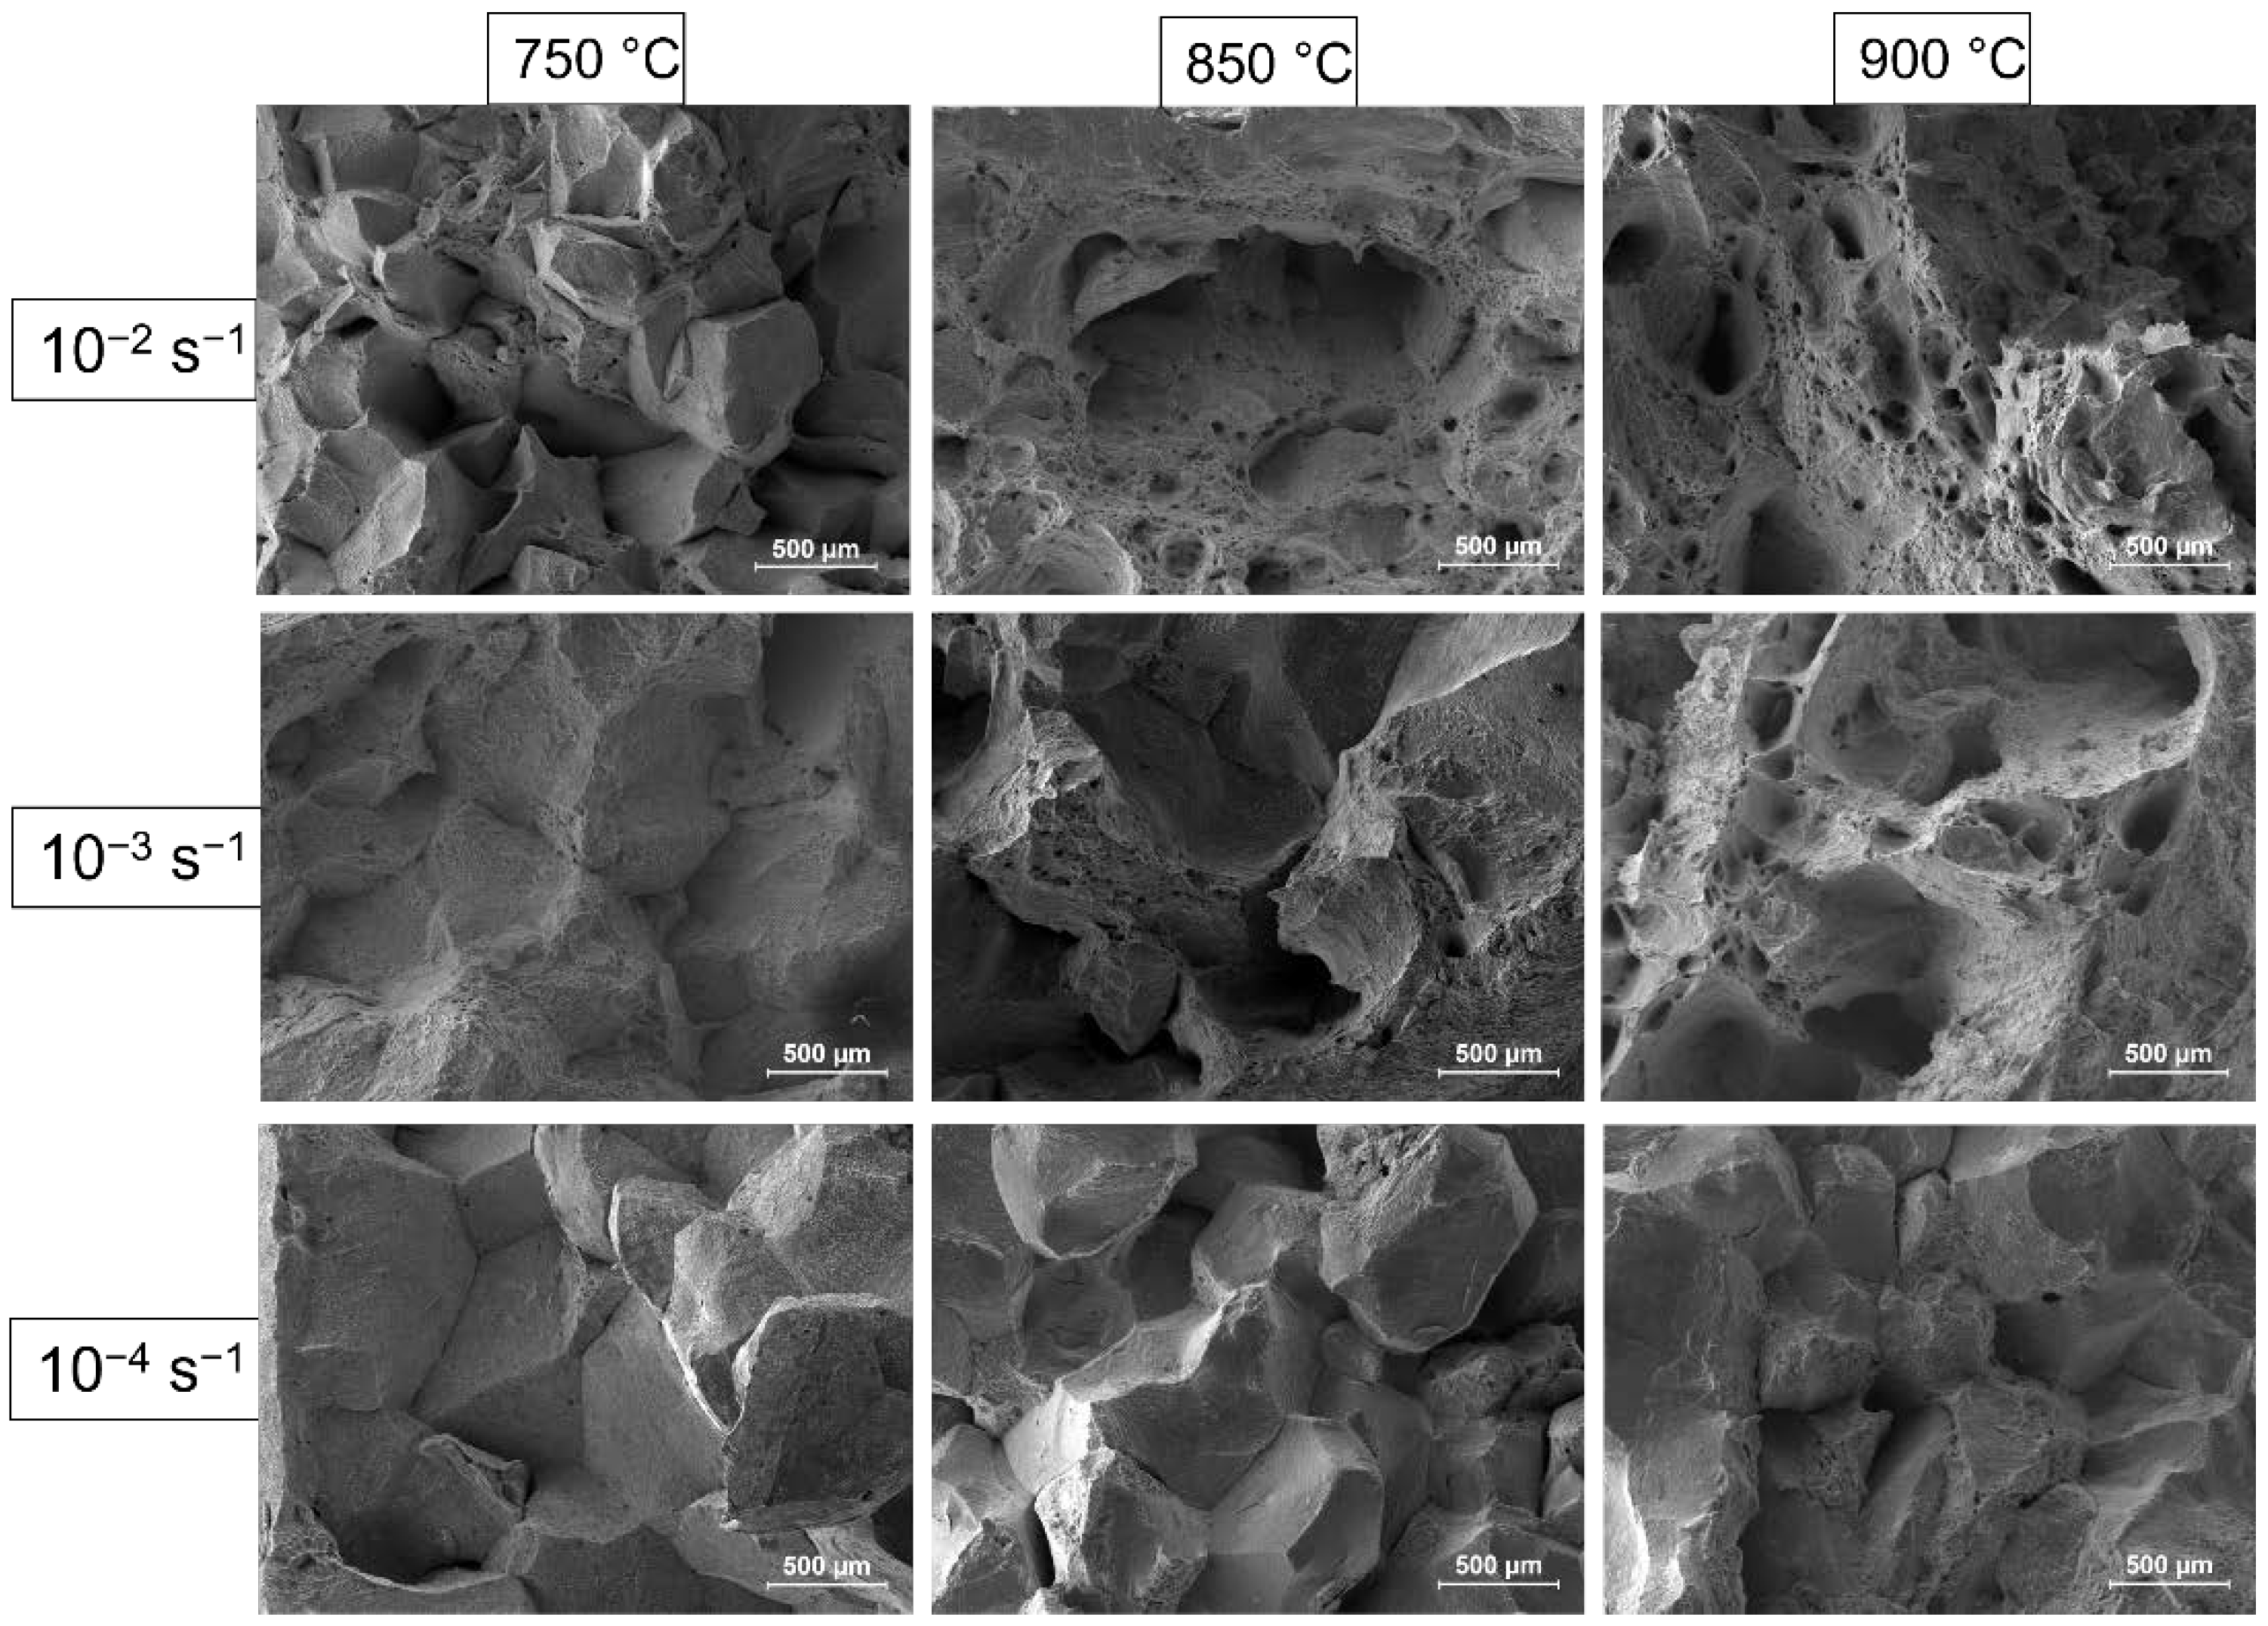
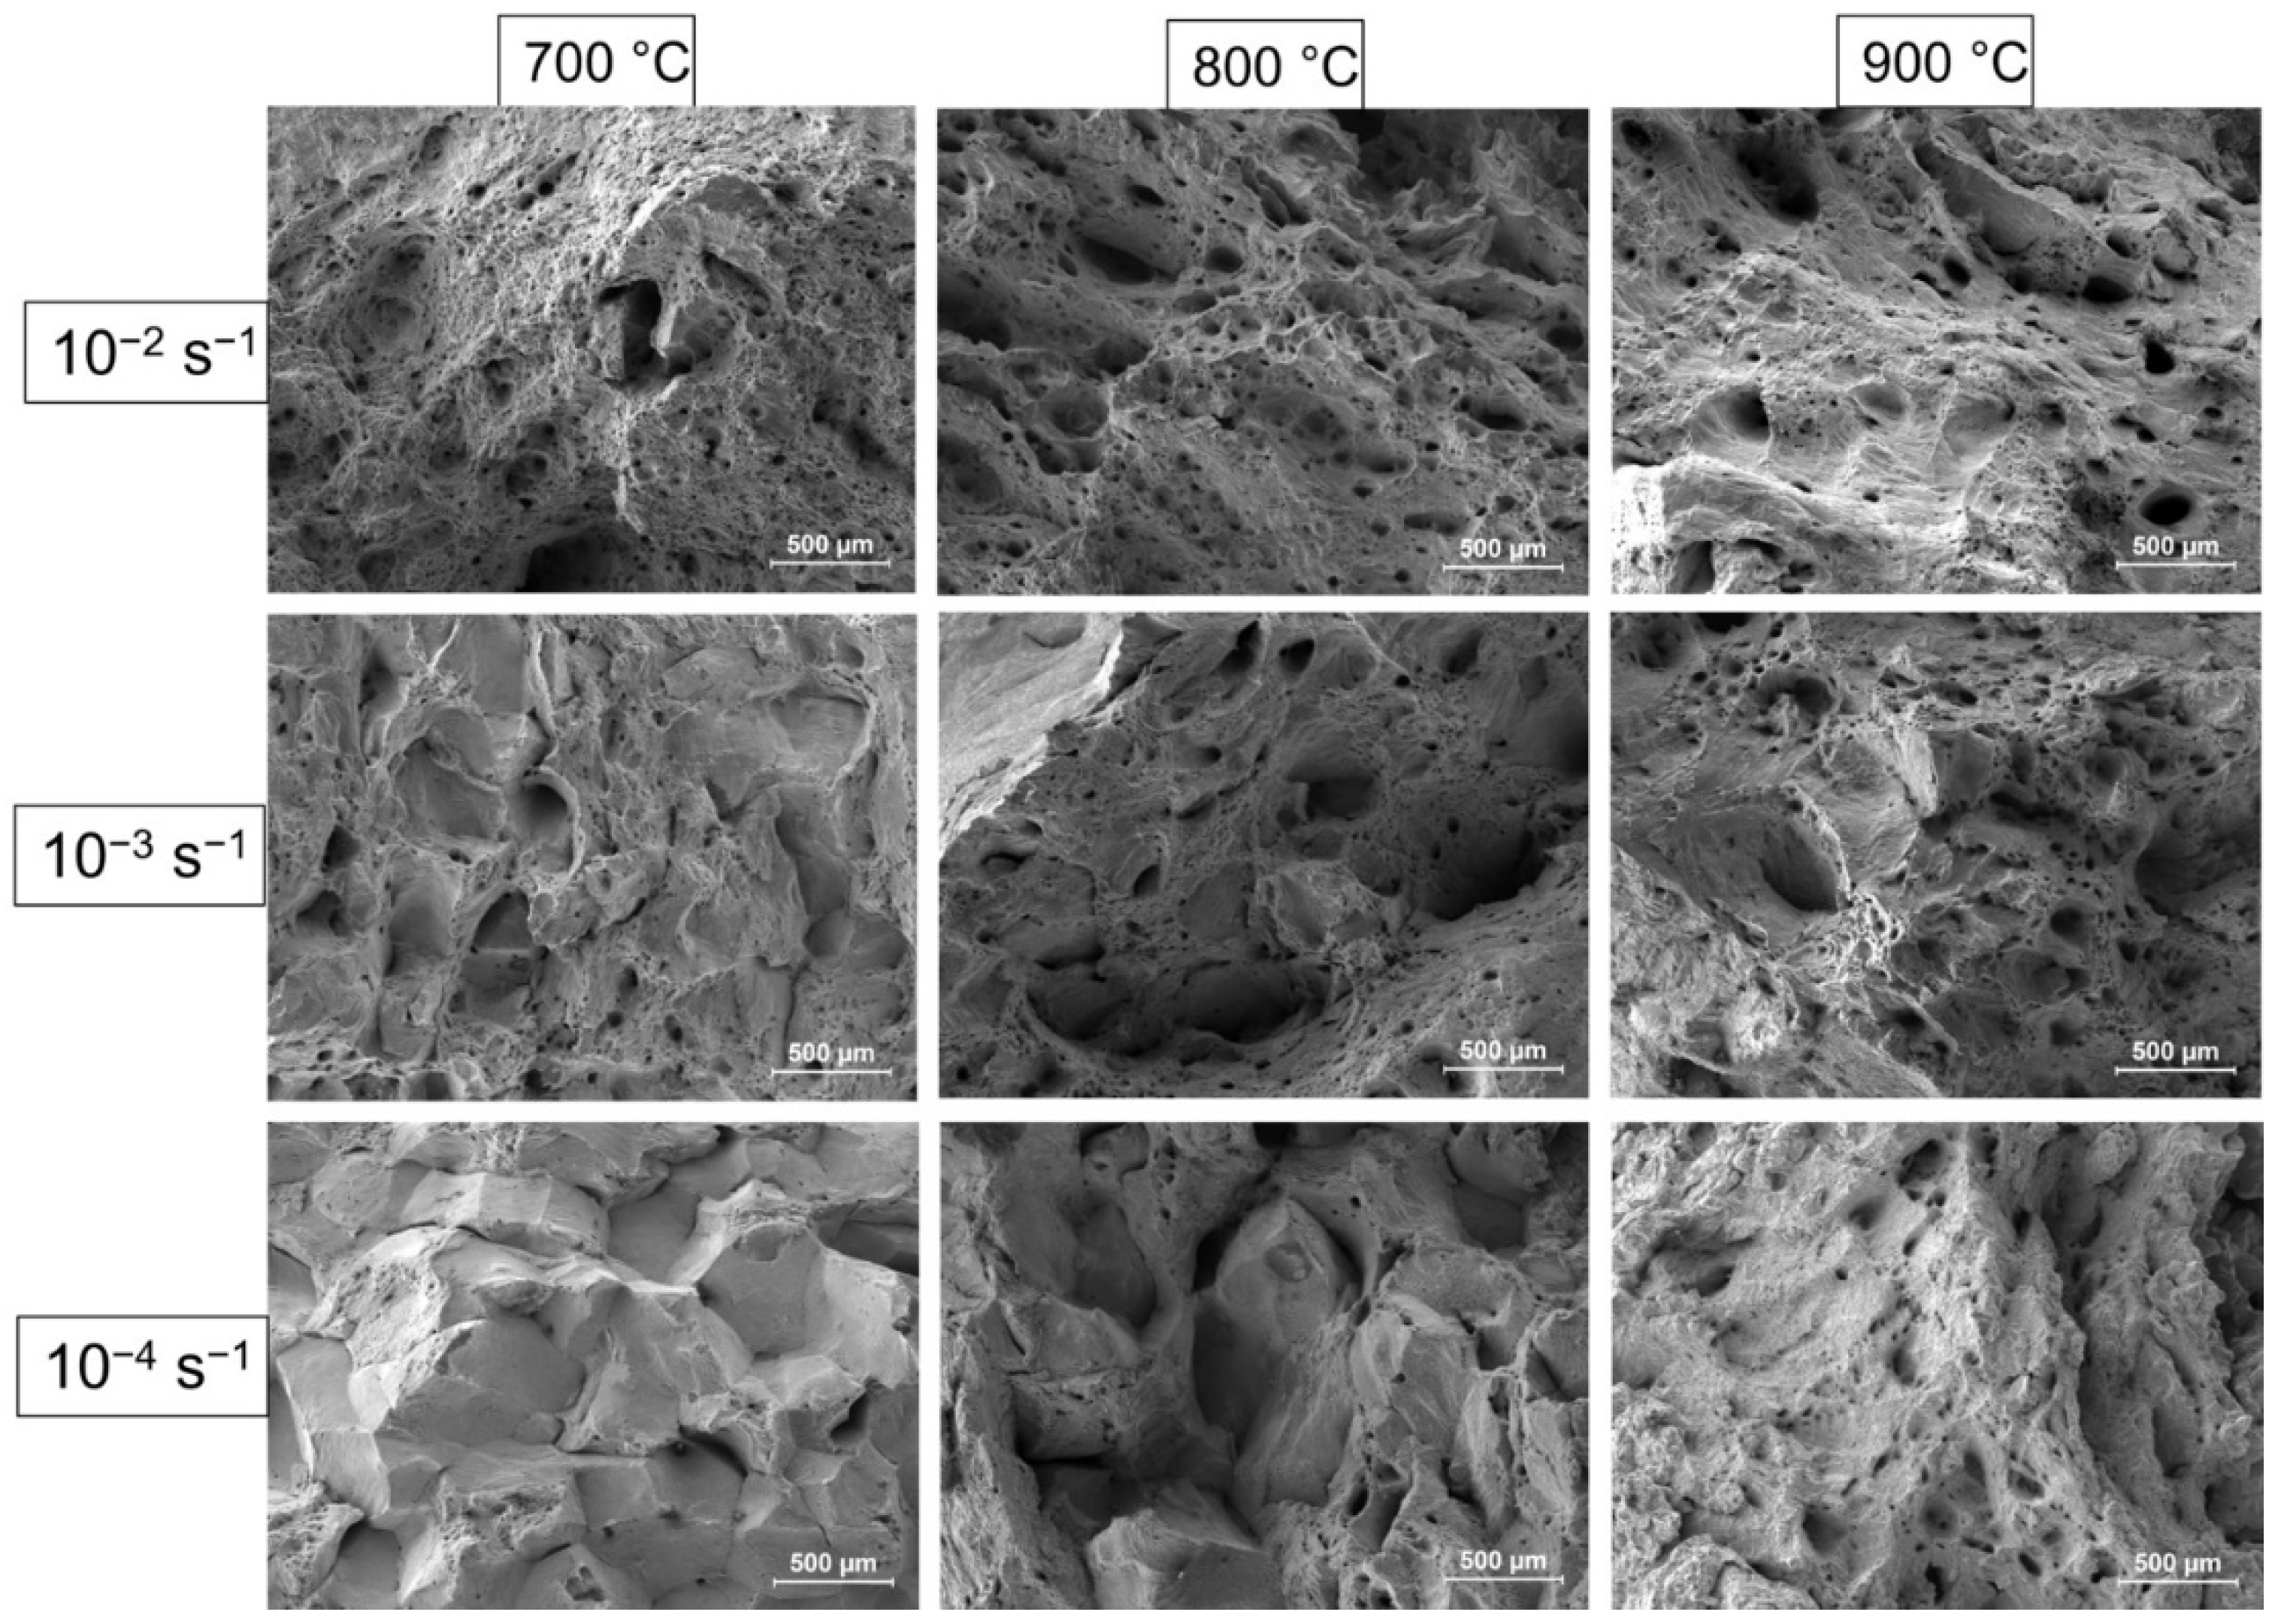
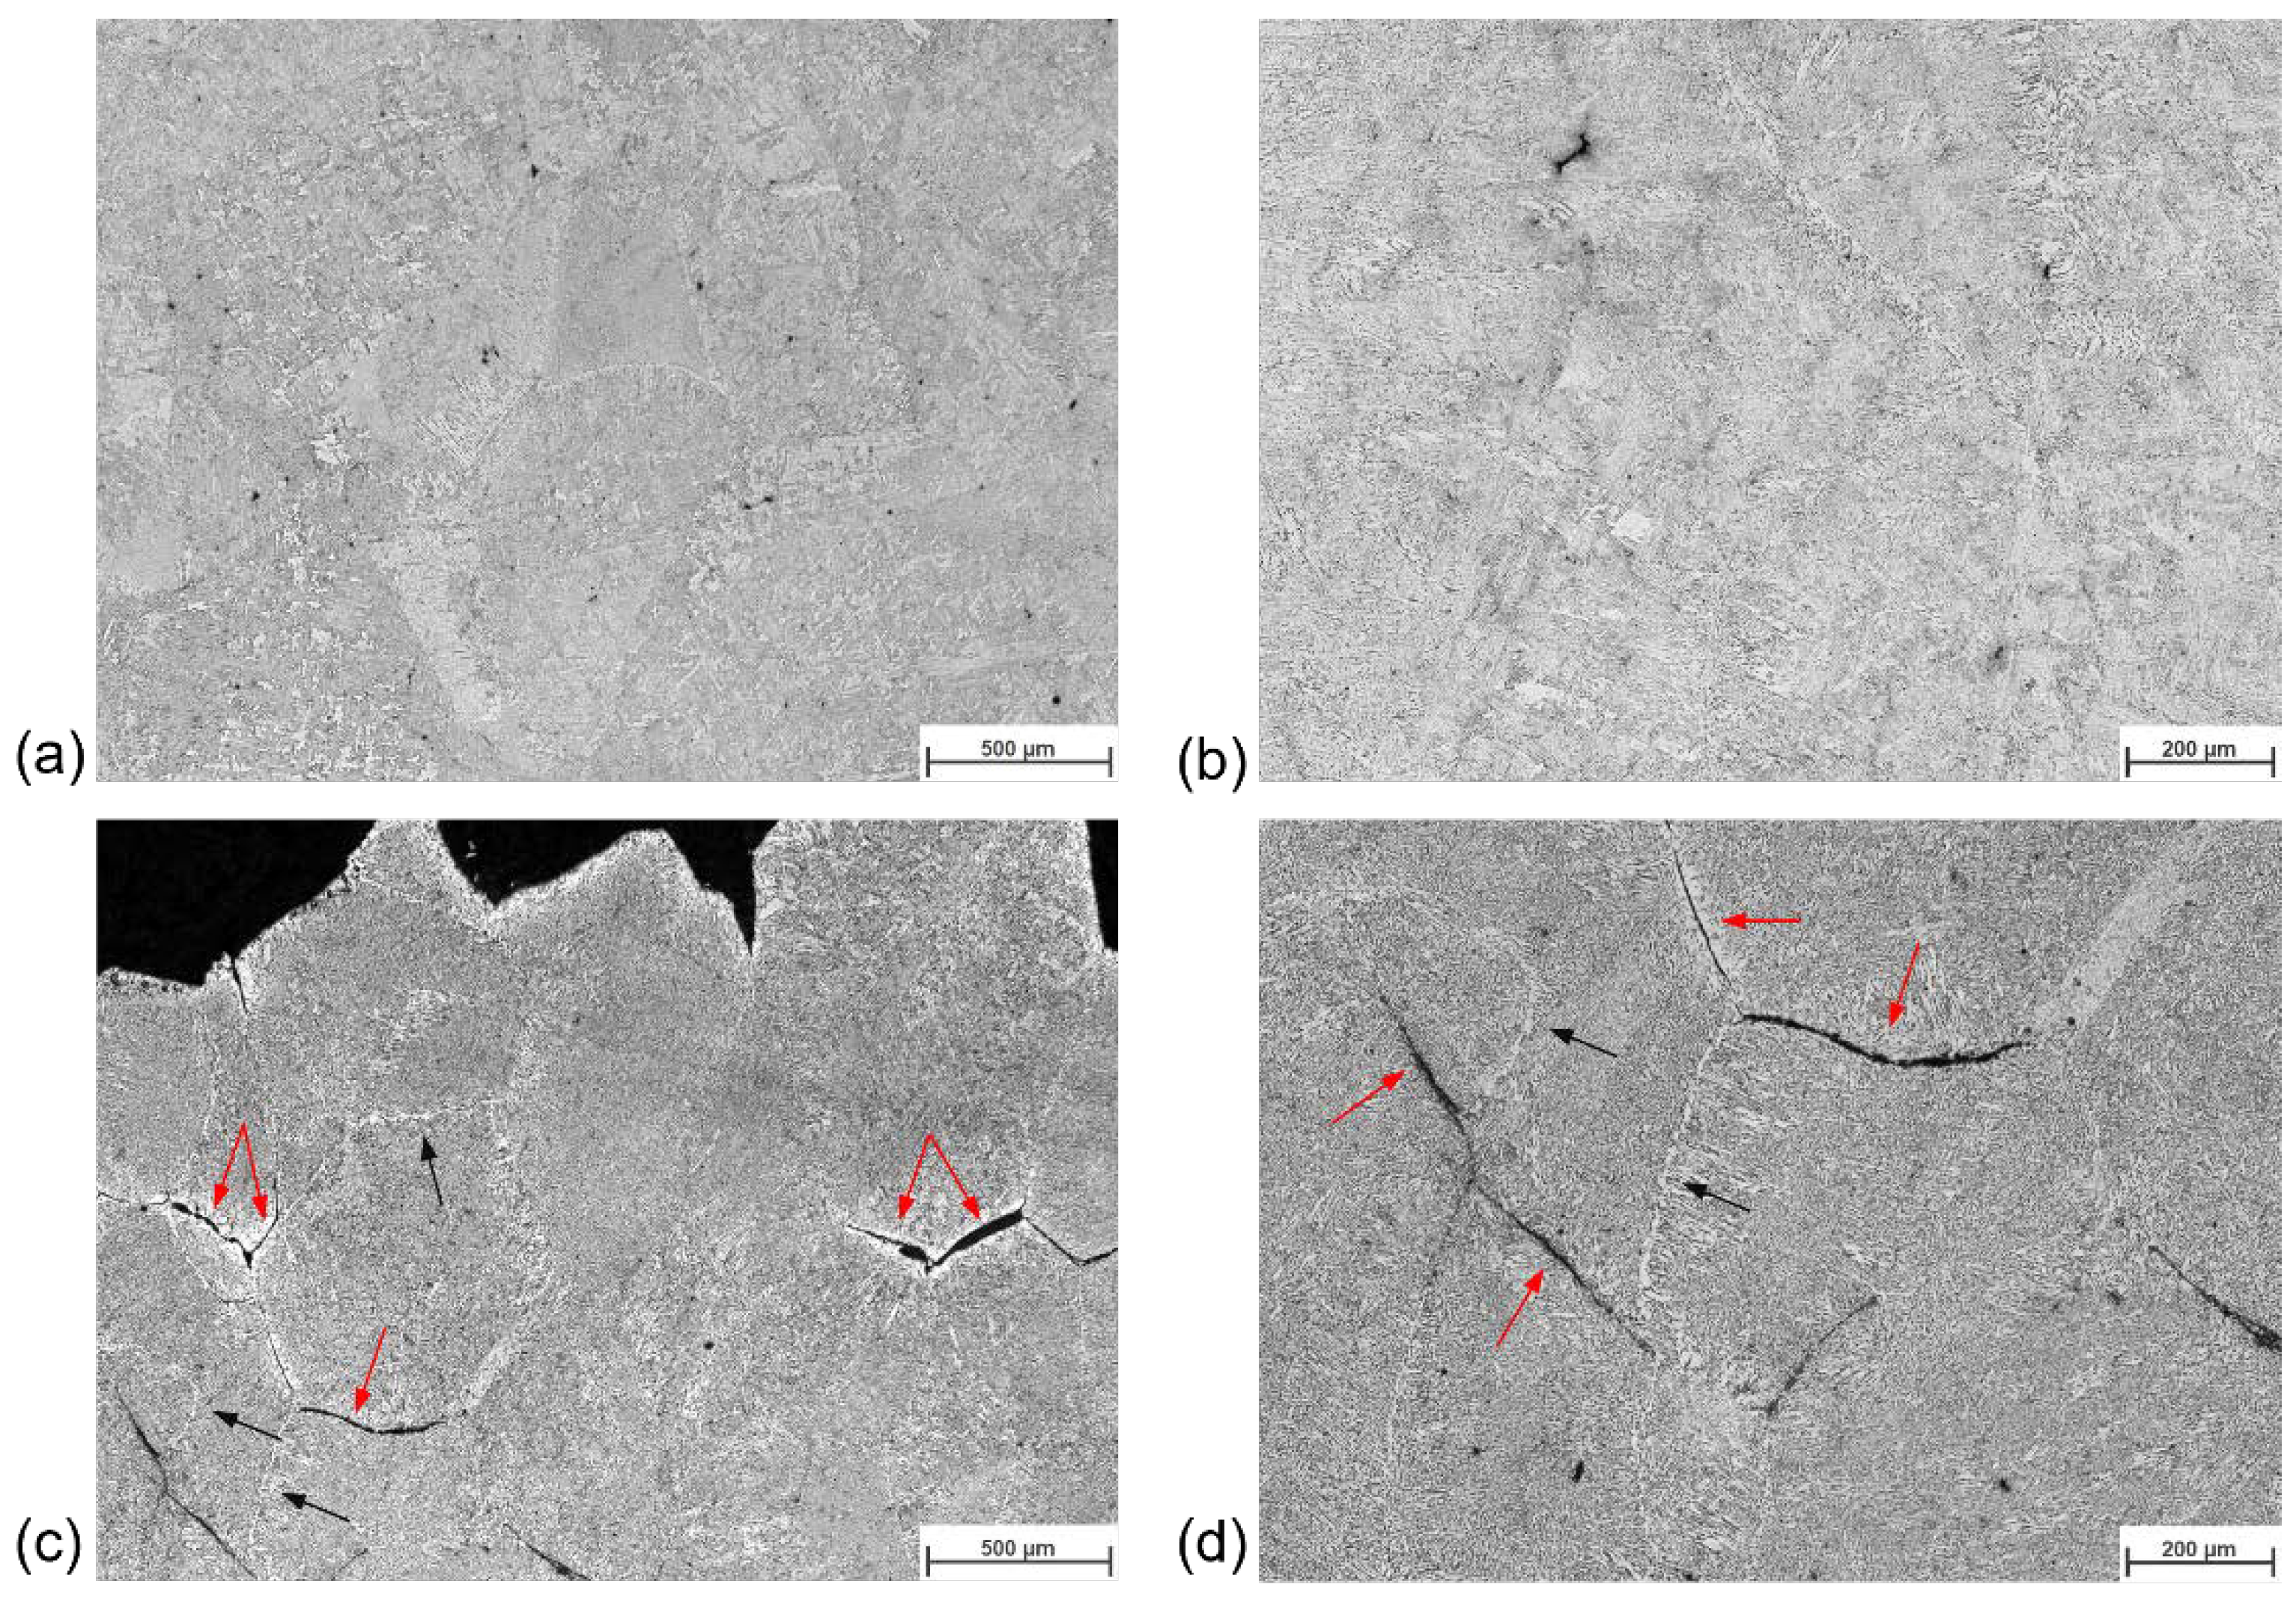
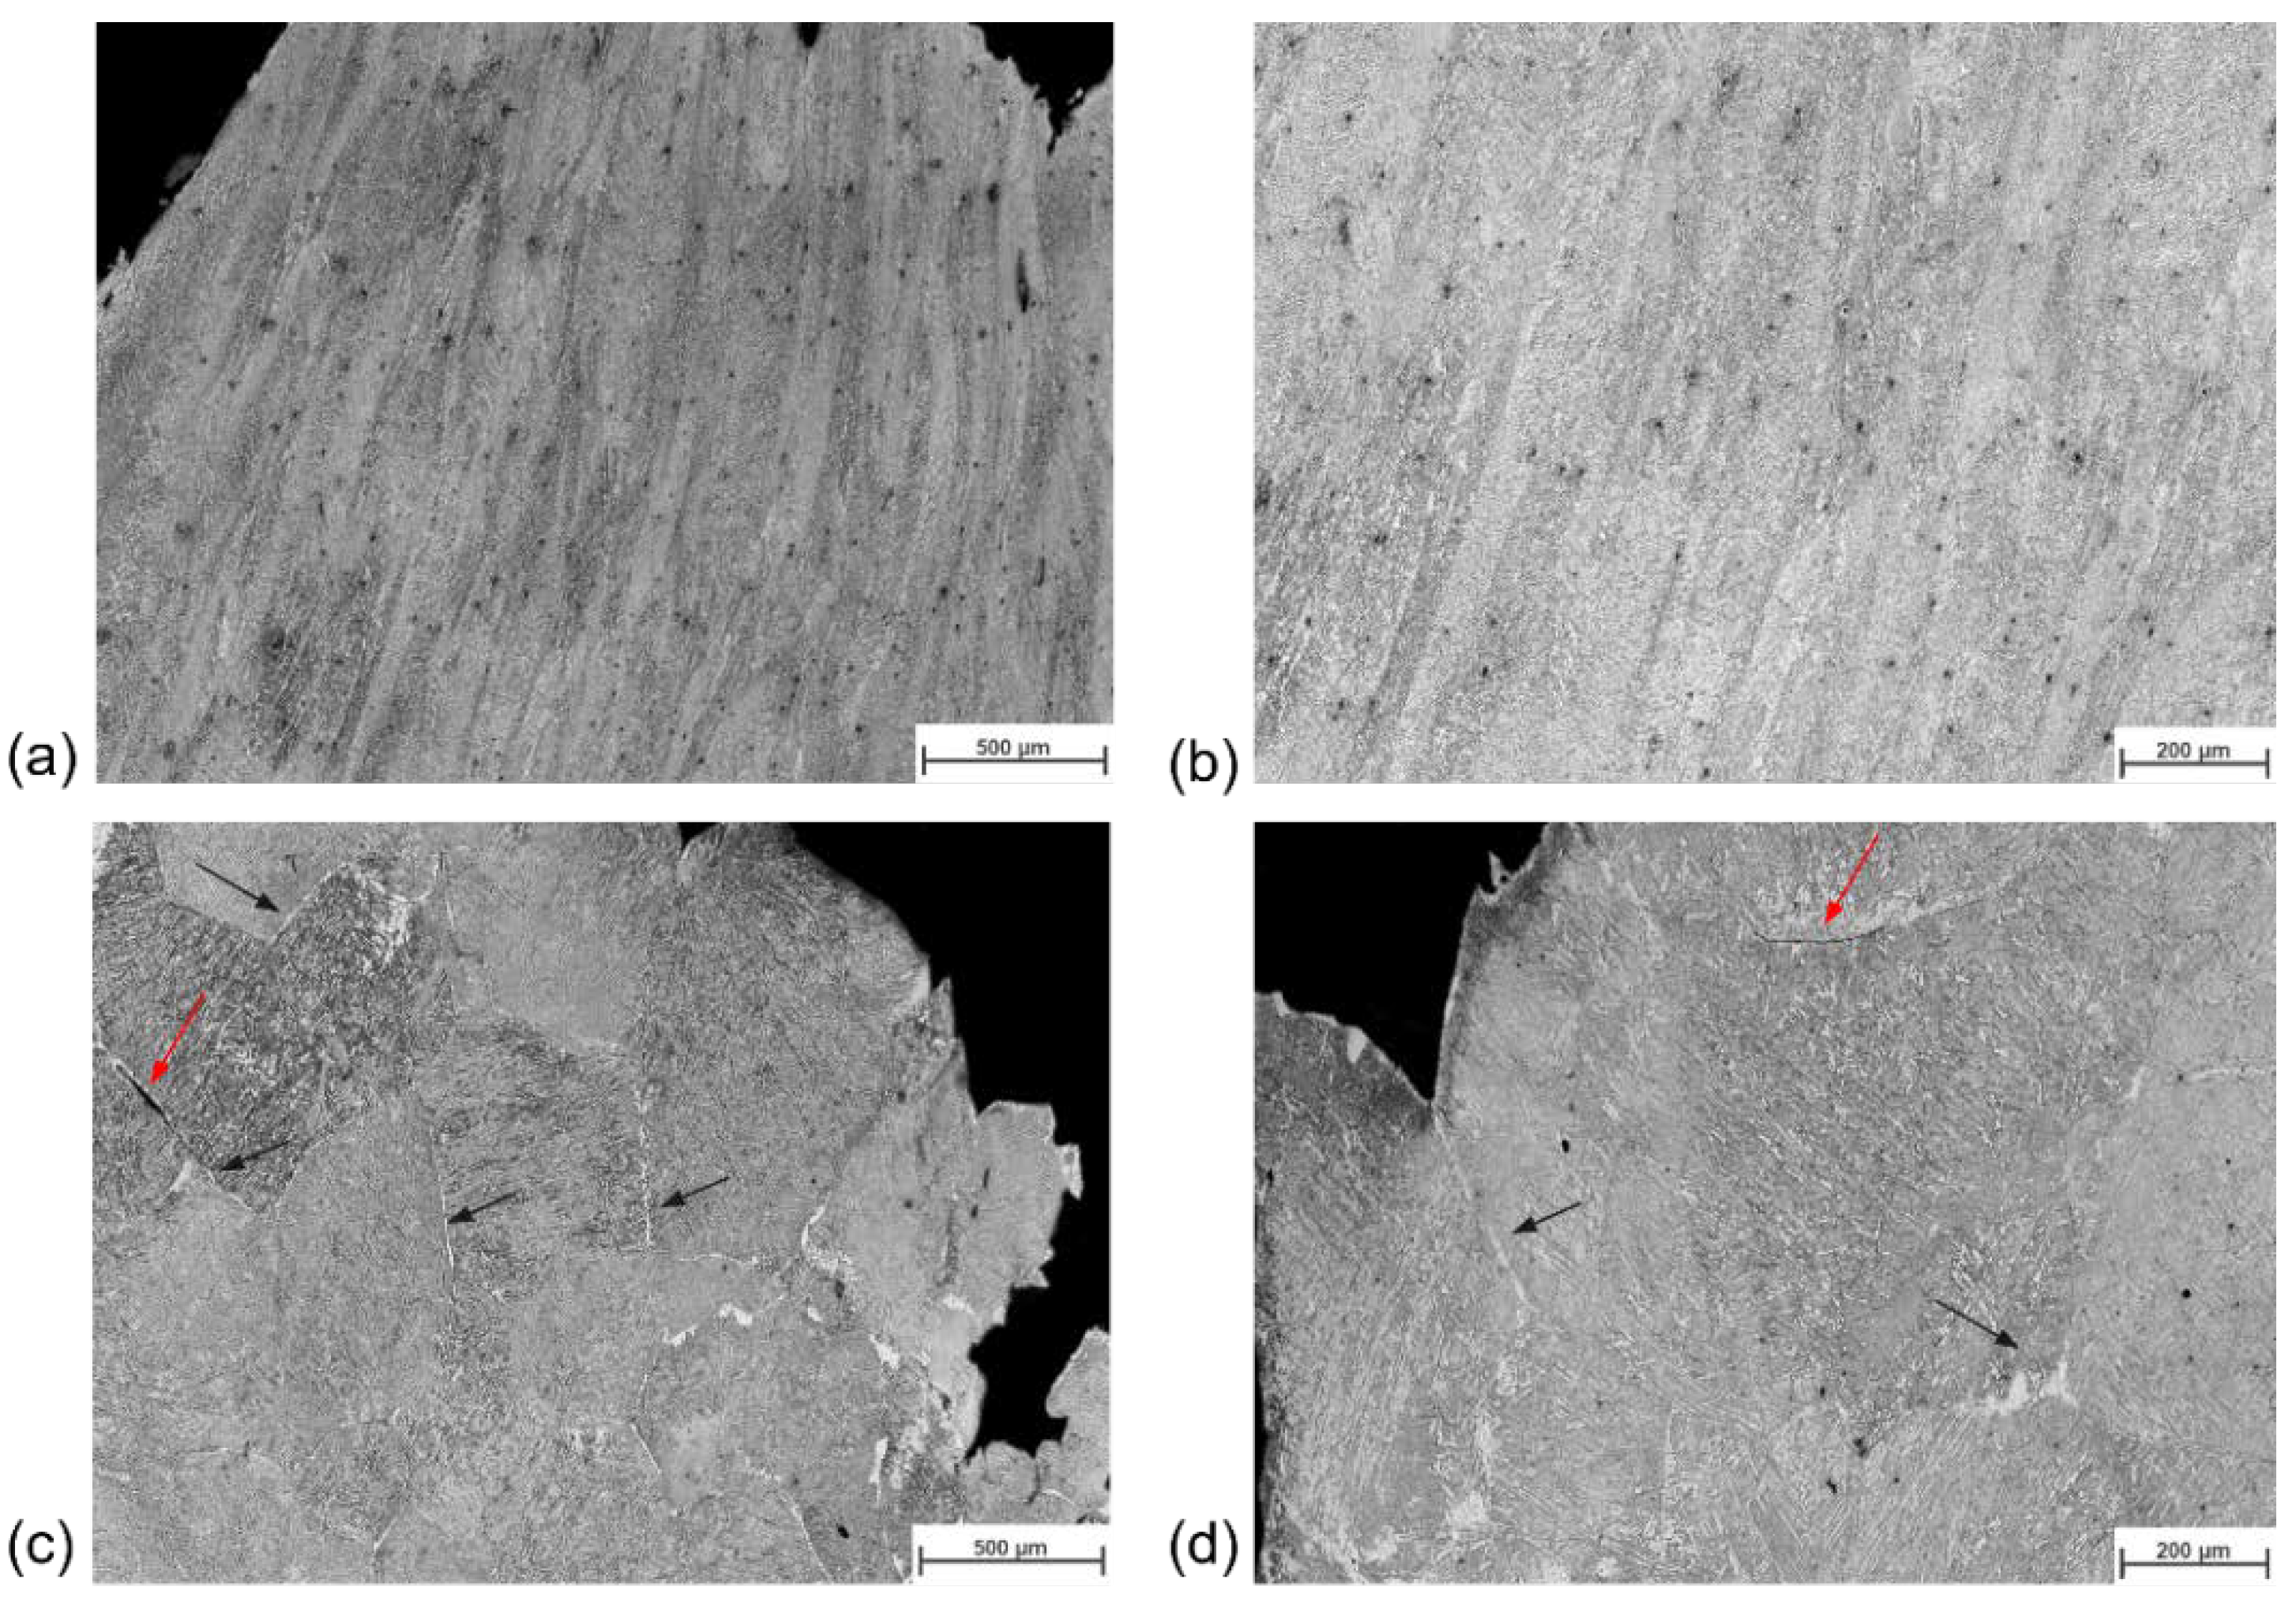
3.1. Hot Ductility Behavior

The first information needed regarding the hot ductility behavior of the microalloyed steels is the ductility curve determined from the RA values calculated after testing at the strain rate of 10−3 s−1. The resulting hot ductility curves for both steels tested at the strain rate of 10−3 s−1 were shown in a previous publication [26]. From the results, it is possible to see that steel A has a clear ductility minimum between 700 and 850 °C, evaluated by the values under 40% of RA. Steel B shows better ductility at all temperatures, with all the results above 40%.
Based on these initial results, the critical temperature range was selected so that further analysis of the ductility behavior could be performed, but under different strain rates. For the microalloyed steel A, the temperatures chosen were 750, 850, and 900 °C. As for steel B, the temperatures were 700, 800, and 900 °C. The results obtained are shown in Figure 2.
By observing the curves, it is noticeable that increasing the strain rate resulted in a general improvement of the ductility for both steels. The only exception was steel A at 900 °C, with a strain rate of 10−2 s−1, which showed a drop in ductility when compared to the previous lower strain rate. However, it is still significantly above the 40% line. Better ductility behavior was again seen for steel B for all the different conditions.
At the lower temperature of 750 °C, steel A showed unsatisfactorily ductility at all the strain rates tested, and steel B only at the lowest strain rate at the lowest temperature, 700 °C. Additionally, this was the only point on the curve at which the second steel showed RA values below 40%. Moreover, for steel A, when the strain rate was 10−4 s−1, the ductility was too low for all the temperatures.
Furthermore, in the curves from steel B, the higher the strain rate, the smaller the difference in RA values between the different temperatures tested. At a strain rate of 10−2 s−1, if the standard deviation of the values is considered, there is almost no significant difference between the results.
The images of the fracture surfaces of the samples were taken with the SEM and are shown in Figure 3 and Figure 4 for steel A and B, respectively, at different temperatures and strain rates.
In the case of steel A, the images show clear intergranular fracture for all the strain rates at 750 °C and all temperatures at the strain rate of 10−4 s−1 strain rate, which correlates to the lower ductility seen previously at these conditions (Figure 2A). At 850 °C and 10−3 s−1 (Figure 3), a mixed structure is seen, with clear flat grain surfaces but also ductile fracture in some areas, marked by the dimples formed. This matches the RA value seen at this point (Figure 2), which is around 40%, where the ductility starts to improve but is still not ideal. The other three images show a clear ductile fracture, forming a honeycomb-type structure, expected when the ductility is good, as seen for these points in the curves shown in Figure 2 for steel A.
The fracture surface of steel B also corresponded to the curves from Figure 2. Steel B had better ductility than steel A at almost all conditions, consistent with the predominantly ductile fracture features in Figure 4. The only exception was at 700 °C using a strain rate of 10−4 s−1. At this point, the reduction in the area was below 40%, and this is reflected in the brittle fracture appearance. Moreover, at 800 °C with the lowest strain rate, a mixed structure can be seen, with dimples that would characterize a ductile fracture but also some flat grain surfaces typical of an intergranular brittle fracture. This is again what was seen at 850 °C when tested at a strain rate of 10−3 s−1 when the RA value was close to the 40% line; therefore, it did not show a completely brittle behavior and did not give a very good ductility.
After the preparation of the samples and etching with 3% Nital, the microstructure could also be evaluated, and the reasons for the hot ductility behavior better understood. As an example, for the extreme behaviors (very good and very bad ductility), the microstructure of samples from steel A tested at 850 °C with 10−2 and 10−4 s−1 strain rates are shown in Figure 5. Figure 5a,b are from the sample that presented a very good hot ductility behavior, and Figure 5c,d are from the sample with a very low RA value. In Figure 5a,b, the grain boundaries are hard to distinguish, even with the higher magnification, and no cracks are seen in the interior. On the other hand, Figure 5c,d show the mechanism of crack initiation and growth along the ferrite films formed along the grain boundaries. The cracks are indicated by the red arrows, and the ferrite at the grain boundaries (still without cracks) is indicated by the black arrows.
Two example images from steel B are shown in Figure 6. As shown in the curves from Figure 2, this steel has better ductility under all conditions but one, when the test was at 700 °C and at the lowest strain rate, 10−4 s−1. The microstructure of this sample is shown in Figure 6c,d, where the presence of some ferrite films at grain boundaries can be seen (black arrows), as well as a crack forming in one of these locations (red arrow). Figure 6a,b exemplify the microstructure seen when the RA values were higher, with elongated grains and no signs of ferrite films at the grain boundaries.

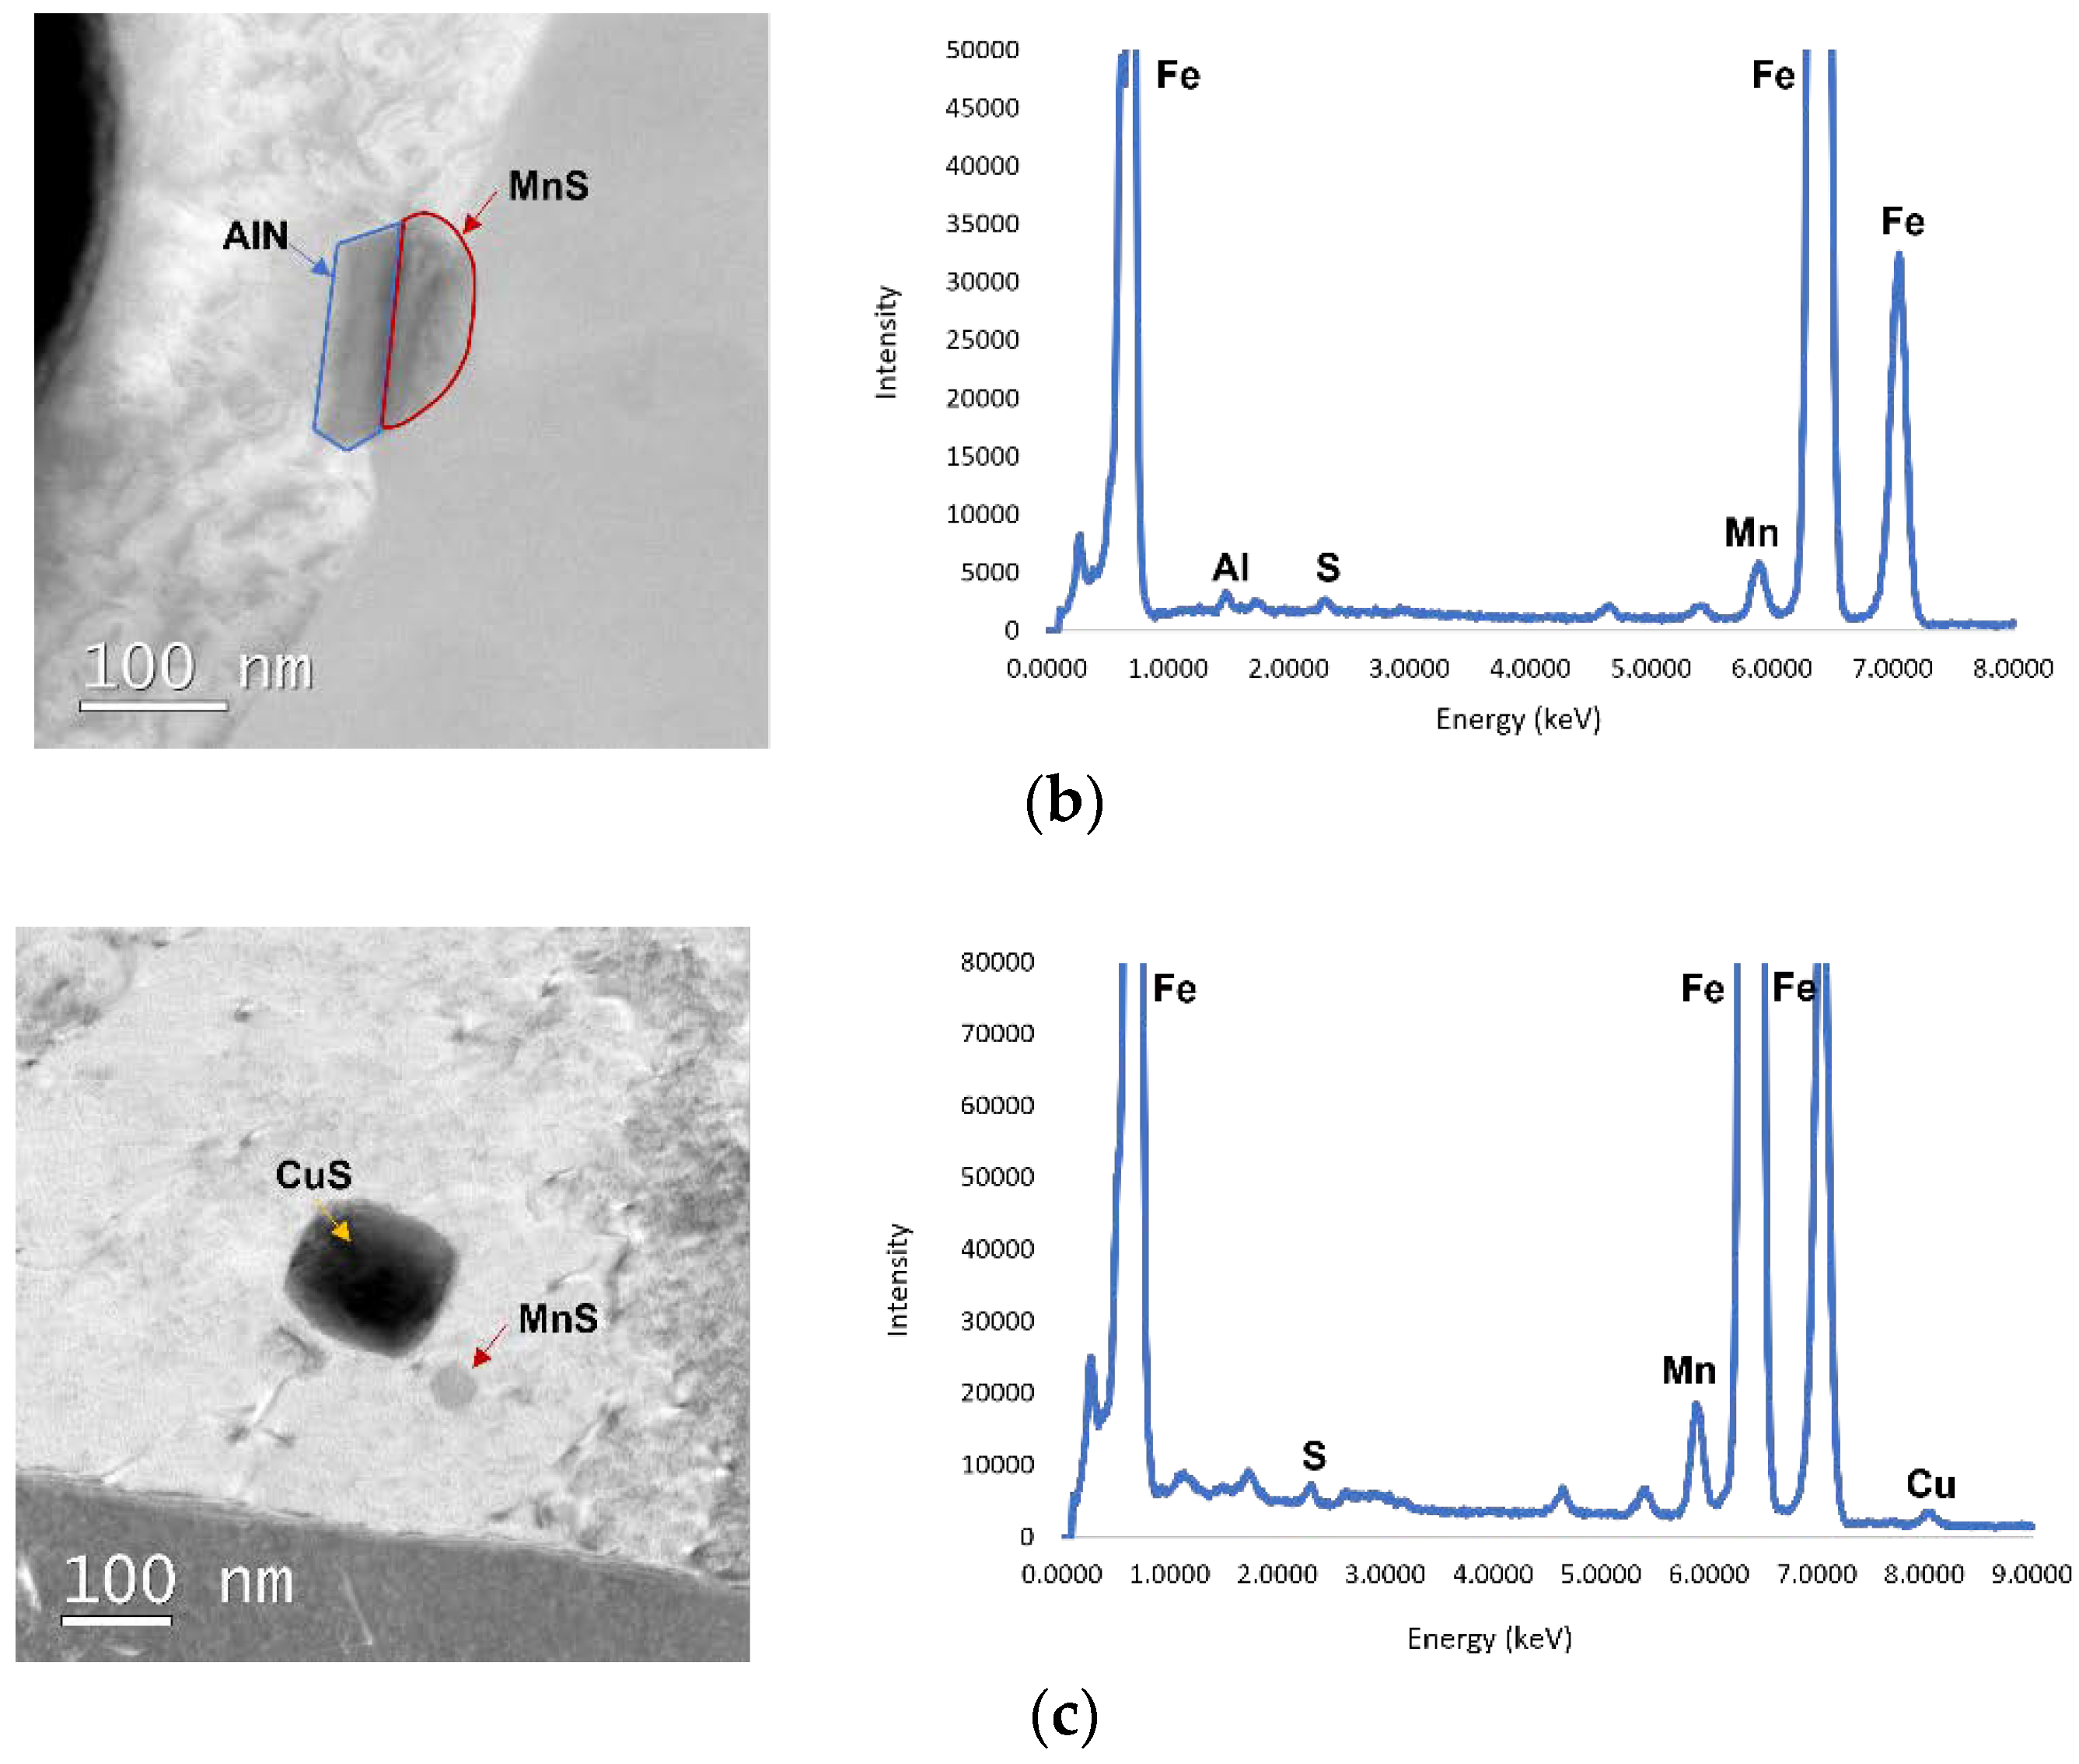
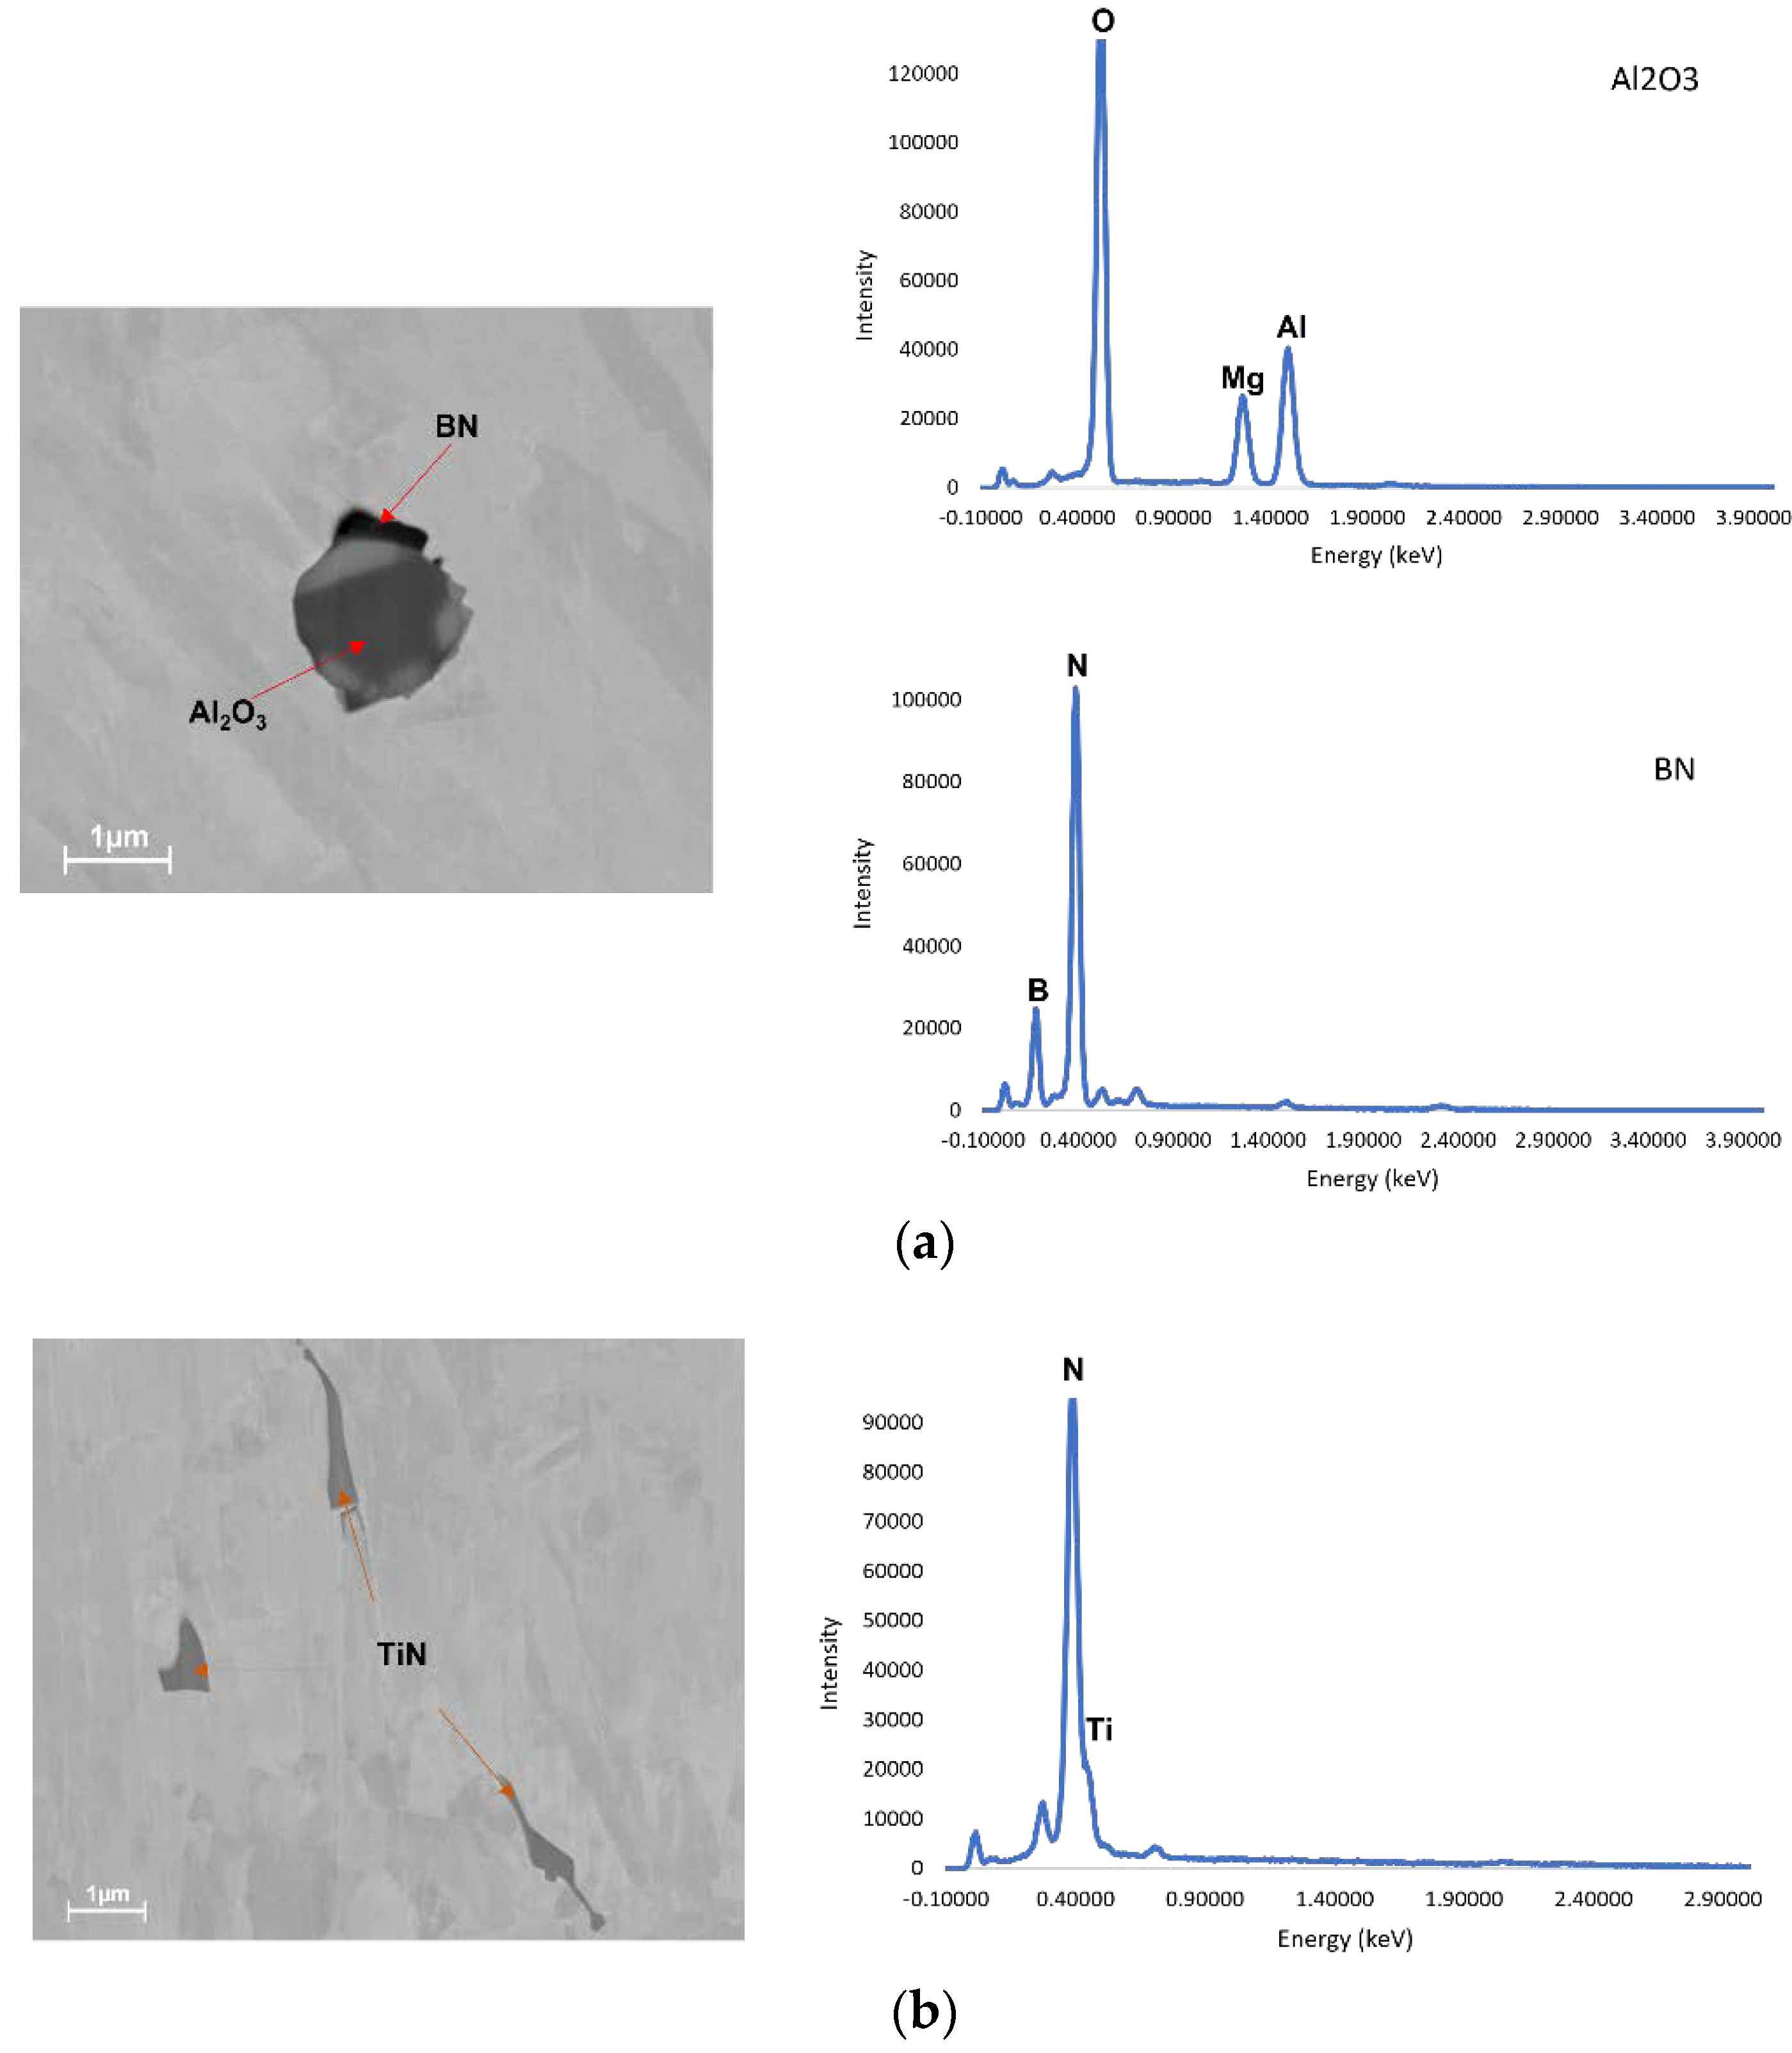
3.2. Precipitation Behavior

The investigation of the precipitates was carried out following both simulation and experimental approaches. The simulations were performed with varied parameters, enabling the evaluation of the precipitate size and phase volume fraction at different strain rates and temperatures, as presented in the results of Table 2 and Table 3. The results from the standard condition (10−3 s−1 strain rate) were shown in a previous publication and were repeated in the following tables for completeness [26].
On comparing the results for both steels, it can firstly be noted that the simulations resulted in larger precipitates, with a higher phase fraction for steel B. For example, when comparing the AlN coprecipitation with MnS for steel A at 10−2 s−1 with the BN from steel B at the same test condition, the mean radius of the second was seen to be approx. 1000× larger, and its phase fraction is approx. 14× higher. For both steels, the increase in temperature lowered the phase fraction for all precipitates and coarsened TiN and MnS. In addition, steel A and B have in common a lower fraction of precipitates at the grain boundaries than in the matrix.
Precipitation in steel A showed to be more strongly influenced by the changes in strain rate, behavior similar to that shown in the ductility curves. Higher strain rates, where the ductility was improved, were seen to decrease the phase fraction and mean radius of precipitates, especially for AlN (from 1 to 17× larger and approximately 10× higher fraction at the lower strain rate). Additionally, even though AlN showed generally larger mean radius results when compared to MnS (from 3 to 5× larger depending on the condition), they also had a lower phase fraction (from 10 to 105× lower).
For steel B, the changes in the precipitation kinetics were less pronounced with the change in strain rate. However, there is still a reduction in phase fraction for all precipitates with the increase in strain rate, as seen for steel A. BN and TiN at grain boundaries showed a lower phase fraction but a greater mean radius. Moreover, BN at grain boundaries, at the higher temperature, are predicted to be smaller at all strain rates, a result that was not seen for the TiN.
In addition to the precipitation kinetics simulations, TEM analyses of the samples from the experiments performed with the BETA 250-5 machine were also conducted for a comparison with the simulations and a better understanding of the hot ductility behavior of both microalloyed steels.
In the samples from steel A, the presence of MnS and AlN could be confirmed, and in addition, some CuS were spotted, which were not expected from the simulations. Some of the images of the precipitates found are shown in Figure 7. For this steel, the precipitates seen were very small and could not be identified at the grain boundaries. The estimated size of the precipitates was approx. 300 nm for the larger isolated MnS, and approx. 150 nm for each of the AlN and MnS co-precipitates. The size of the CuS precipitates is projected to be the same size as the 150 nm2 dark region in the HAADF image (Figure 7c); however, due to the sample preparation of the electrochemical jet polishing, the precipitate was preferentially etched, leaving only the small remnant in the center of the hole. Additionally, more MnS were seen, and no free-standing AlN was identified, only at the co-precipitation.
The investigations in steel B also confirmed the presence of the precipitates predicted by the MatCalc simulations, TiN and BN, but also some very fine complex precipitates identified as (TiV)N, also shown by Pandit et al. [36]. The size of these complex precipitates was measured to be approx. 10 nm, and TiN were between approx. 150 and 250 nm at the grain boundaries, which is approximately in the same range as reported by Poths et al. [37] and around 1 µm in the matrix. The BN identified were approximately 800 nm in size, similar to the results obtained by Denés et al. [38]. BN were much more difficult to be found due to the low atomic mass of B, a problem known and reported by other authors [38,39]. With a low acceleration voltage and beam energy, some of these precipitates could be identified, and example images are shown in Figure 8. From the analysis, it can be said that there were many more TiN precipitates present in the steel compared to BN precipitates and that at the grain boundaries, only TiN were present. Moreover, BN seen in the matrix were all at the pockets of Al2O3 inclusions, as shown in Figure 8a.

3.3. Grain Size Analysis

One of the methods chosen for the PAG investigation was the reconstruction using the MTEX toolbox from the EBSD scans of the samples. The goal was to achieve an automatic grain size evaluation for a more precise measurement of the parent grain sizes.
An example of a reconstruction of parent austenite grains from martensite for steel A tested at 900 °C (without deformation) is shown in Figure 9a. Every individual-colored grain is a reconstructed PAG. Evidently, regions closer to the bottom-left corner in Figure 9a show a population of finer parent grains with uneven boundary characteristics, which is expectedly due to mis-indexing nearer finer martensite units.
The child (martensite) and parent (austenite) boundary misorientation are demonstrated in Figure 9b, wherein the misorientations closer to 5 degrees (shown in the corresponding color legend) indicate the presence of PAG boundaries [34]. The same corner region mentioned previously shows a pronounced clustering of PAG boundaries, ultimately resulting in ambiguous parent grain reconstruction within such regions. The measurements from well-defined reconstruction regions revealed an average PAG size of 93 ± 8 µm.
As a means of trying to achieve better results, a second attempt was made with specific chemical etching, and the results are shown in Figure 9c for the same steel and test condition as a comparison. The boundaries are clearer, and more grains can be identified for measurement. The dark spots in the figure are a result of using this type of etchant.
The results from the measurement of the size of the PAG revealed by the etching were seen to be in good agreement with the ones from the MTEX reconstruction when comparing the samples from the same steel and test condition, revealing an average grain size in this case of 91 ± 16 µm. Therefore, it was decided to go further with the chemical etching of the samples once this allowed for easily taking of multiple images from different areas, leading to a better average and more precise boundaries, and resulting in similar size values.
Steel A showed a more homogeneous microstructure through the temperatures, and this allowed the grain size to be measured more easily. Examples of this are shown in Figure 10 for different temperatures. From the linear intercept measurements carried out according to the ASTM E112 standard [35], it can be seen that the mean grain diameter does not show a significant change through the different temperatures, with values ranging from around 100 to 120 µm. The grains presented differences in their shape, however, even when they were of a similar size. By comparing, for example, the structure from the 750 °C sample and the 1000 °C, it can be inferred that at the higher temperature, the grains are recrystallized due to their angular shape, whereas the ones from the lower temperature are rounder.
The grain structure seen for steel B, however, was not homogeneous enough for the determination of an average. Examples of the revelation of the grains through the chemical etching at different temperatures are shown in Figure 11. From the images, it can be seen that at 700 °C, there is incomplete recrystallization of the grains, which seem fully recrystallized at 800 °C. At 900 °C, due to the higher temperature, the start of abnormal grain growth is seen, and when the temperature is 1000 °C, this is even more markedly seen.
Due to this large difference in the size of the grains of the samples, measuring and calculating an average of the sizes would not give an accurate estimate. The only sample that has a homogeneous enough microstructure for the PAG measurement and average is the one tested at 800 °C, which presented grains of around 35 µm diameter.

4. Discussion

The experimental results shown presented different aspects of the influencing parameters on the hot ductility behavior of the microalloyed steels investigated. The first and more general observation is that steel B has an overall better ductility than steel A, as seen in Figure 2. The reasons for the different responses seen are further discussed in this section.
In the curves presented in Figure 2, an improvement of the hot ductility behavior was seen with the increase in the strain rate for both steels, as was expected [1,9,19,20,40]. This change can be associated with three known influencing aspects of hot ductility, shown repeatedly in the literature, which are the nucleation and growth of precipitates, the formation, coalescence, and growth of microvoids, and the formation of deformation-induced ferrite and ferrite films at the austenite grain boundaries [1,9,19,20,40].
On the one hand, the lower the strain rate, the longer the time available for nucleation and growth of precipitates, which can be sites for the initiation of cracks. After the formation of the cracks, there is also enough time for their propagation along the grain boundaries when the strain rate is too low. On the other hand, lower strain rates also allow more time for deformation-induced ferrite to be formed at the austenite grain boundaries. For being a softer phase in contrast with austenite, strain concentrates at the ferrite formed and initiates cracks [1,16,19,41].
At lower temperatures, where the phase transformation from austenite to ferrite occurs even without deformation, the improvement in ductility by increasing the strain rate is associated with work hardening occurring in this once softer phase, increasing its strength and reducing the contrast with austenite, allowing a better distribution of the strain improving the ductility [41].
These results were also confirmed by the microstructure findings. In Figure 3, the clear grain surfaces at the fracture on the samples with lower reduction in area values match the assumption that with lower strain rates and, consequently, lower ductility, the cracks are formed and propagate at the grain boundaries. The same was seen in Figure 4 for the lowest temperature and strain rate for steel B.
This was further validated in Figure 5b and Figure 6b, where the etching revealed the formation of cracks along the grain boundaries for both steels where the ferrite films were formed. This condition was observed for the lower strain rate conditions of both microalloyed steels and confirmed this as one of the causes for the low ductility at these points.
Moreover, the precipitation kinetics simulations showed a reduction in the phase fraction of the precipitates with the increase in the strain rate, confirming the insufficient time for nucleation and growth of precipitates at higher strain rates. At the lower temperature, the higher phase fraction of precipitates is a reason for the lower ductility, in addition to the presence of ferrite. As the temperature increases, dissolution is responsible for the reduction in phase fraction. The cause for the 10% higher reduction in area of the samples tested at 900 °C and 10−3 s−1 of steel A was not made clear with either the microstructure evaluations or the precipitation kinetics simulations.
Even though both steels showed the same tendency of improvement in ductility with the increase in strain rate, the behavior of each showed differences when compared. For instance, steel A was seen to be more sensitive to the changes in strain rate than steel B, which presented a bad ductility only at one of the conditions tested (700 °C, 10−4 s−1). The reasons for that rely on the reduced S content and the alloying elements added to steel B, which also influence the phase transformation [1,4,42,43,44].
In steel A, the higher S content favors the formation of MnS, known to be very detrimental to the hot ductility behavior [1,9,33]. Moreover, the MnS is also a site for co-precipitation of AlN, which also has a strong adverse effect on the ductility behavior of steel A [11,45]. This was confirmed by both the MatCalc simulation results as well as the investigations conducted with the SEM and TEM, which registered the presence of both precipitates. The simulations also predicted a higher fraction of MnS, which was also confirmed with the microscopy analysis, where many more MnS were seen, and no free-standing AlN was identified. Moreover, in these samples, no precipitates could be identified at the grain boundaries, matching the results of the simulations that showed a low phase fraction and size at this location.
The additional finding of CuS in steel A is a result of the quenching process. Ishiguro et al. [46] also reported the formation of these precipitates in low-carbon steels during quenching, as free-standing or coating the MnS, as found in the present work. These precipitates are expected to be formed very quickly at lower temperatures (below 750 °C), and this explains why they were not seen in the simulations.
The better ductility behavior of steel B at different temperatures and strain rates can also be explained by the precipitation behavior and phase transformation, which are mainly related to the differences in the chemical composition of this steel. The higher content of Ti and B plays an important role in improving the hot ductility behavior.
The addition of B in low-carbon steels must be considered in sight of two different phenomena: the formation of BN and the segregation of B to the grain boundaries. When many fine BN are formed, the hot ductility deteriorates [6]. However, when B is free to segregate to the grain boundaries, the ductility can be improved by an increase in grain boundary cohesion and/or austenite grain refinement [10,44]. Furthermore, the addition of B can retard the austenite–ferrite transformation and favor the intergranular nucleation of ferrite, reducing the detrimental effect of ferrite when it is in a lower fraction and formed as thin films at the austenite grain boundaries [44,47]. This influence on the ferrite formation could be confirmed with the microstructure investigations, exemplified in Figure 5, where almost no ferrite films were seen at the grain boundaries, even at lower test temperatures, being a strong improving factor to the ductility.
In the case of steel B, the higher Ti content acts protectively to the formation of high amounts of fine BN, blocking its detrimental effect [6,16,48]. This is because TiN forms preferentially, reducing the N available for enough precipitation of BN [48]. Another beneficial effect of the presence of B and Ti is the prevention of AlN formation, which is more detrimental to ductility, as seen in steel A [6,33,49].
From the simulations and microscopy analyses, it was seen that the BN formed are coarse and dispersed in the matrix and, therefore, not that detrimental to the ductility. Moreover, these coarse BN were spotted in all findings at Al2O3 pockets, a product of the deoxidation process during continuous casting. This is in accordance with what was reported by Zhang et al. [50], which stated that BN could agglomerate at the alumina matrix particles and contribute positively to the ductility of the material, becoming less detrimental than an isolated BN precipitate. This also corroborates the understanding of the better ductility of steel B. Additionally, as was expected, no AlN were seen, contributing even further to the good ductility presented by this steel.
The formation of TiN was seen in the simulation results and from the sample analysis with SEM and TEM. Much more TiN than BN were identified, but these were also much finer than at first seen in the simulations. These TiN were also identified at different points of the grain boundaries but were not associated with any cracks. With TEM, some of the TiN identified with the EDX analysis were also seen to be rich in V. One of the reasons for that is that after TiN are formed, they act as a preferential site for V, forming complex precipitates [36,37]. VN alone, if formed, could be detrimental to the ductility at high temperatures, as well as fine VC, but both precipitates are not present in this range of temperatures when the V content is as low as it is in steel B [45,51].
The lower S content is also an important factor for the improvement of ductility seen for steel B. An S content below 10 ppm was reported to be beneficial to the hot ductility behavior [43]. The improvement is due to the absence of S segregation to grain boundaries and the formation of MnS, which are both detrimental to ductility. Additionally, it was shown that B could segregate even more rapidly to the MnS interface than to the grain boundaries [52]. Therefore, if there is not enough S available for the formation of MnS, which is the case for steel B, the boron can remain available to segregate to the grain boundaries and improve the ductility. The results from the thermokinetic simulations and the microscopy investigations confirmed this, where no MnS precipitation was seen in steel B.
The analysis of the PAG was also sought to investigate whether it exerts a significant effect on the behavior of the steels under study and to observe the influence of the alloying elements in this parameter. Samples tested with Gleeble were used for this, as described, due to the quenching process that allows the formation of a martensitic structure.
The first attempt made with the reconstruction of the prior austenite grains using the MTEX toolbox on the EBSD scan areas did not result in a clear definition of the boundaries.
Heterogeneity in martensitic grain sizes post-quenching often resulted in EBSD scan measurements with limited grain boundaries, which contributed to only partial parent grain reconstruction with relatively smaller scan window sizes and finer step sizes. Consequently, EBSD maps of considerably larger window sizes were collected to fit enough grain boundaries for statistically significant average grain size determination. A step size of 0.75 µm ensured large scan measurements could be completed within a reasonable duration. However, under the selected EBSD scan parameters, certain ambiguity was present in the automatic detection of parent grain boundaries while using MTEX. Inherent heterogeneity in parent grain sizes and the selected step size during large EBSD scans possibly resulted in mis-indexed regions closer to finer martensitic units, whereby automated parent boundary detection was uncertain.
As a result, PAG measurements from the MTEX reconstructed maps were specific to sample conditions that showed well-defined PAG boundaries. This was the case of the samples from the higher test temperature (900 °C) without deformation, once these were mostly austenitic before quenching, resulting in coarser martensite, which is better suited for the reconstruction. Since only a few samples resulted in good options for the reconstructions, additional PAG evaluation methods were necessary.
The second attempt, with the chemical etching, resulted in better identification of the prior austenite grain boundaries. The most pronounced difference between the microalloyed steel A and B is the occurrence of abnormal grain growth in steel B. One of the reasons for that is the presence of AlN in steel A that are more effective in inhibiting the austenite grain growth [53].
Steel A showed well-defined ferrite films at the austenite grain boundaries at 700 °C and a homogeneous grain structure at both 700 and 750 °C, as seen in Figure 10. At 800 °C, partial recrystallization of the grains is seen, which is higher at 1000 °C. In the results from steel B, seen in Figure 11, different behavior is observed. An alloy with a similar B-content in the composition to that of steel B was investigated by Haga et al. [54], who reported that the recrystallization start temperature, in this case, was 710 °C, and the final temperature was 780 °C. This result matches the partially recrystallized structure seen for steel B at 700 °C and the almost fully recrystallized at 800 °C. Additionally, at these lower temperatures, the presence of more precipitates can pin the grain boundaries and impede their movement by the so-called Zener pinning effect, inhibiting grain growth and maintaining the homogeneous finer grain structure [55]. For this outcome, nitrides were noted to be more effective than carbides, and Ti is a good microalloying element for this effect.
At 900 °C and even more at 1000 °C, abnormal grain growth takes place in steel B. When more alloying elements are present, as in steel B, their segregation and dissolution of precipitates enable the occurrence of this grain growth at higher temperatures [56,57]. The presence of B, in particular, can reduce the grain growth start temperature and cause the microstructure seen at 900 °C for this steel [53].
By considering the differences between the grain structure of steel A and B, in combination with the different hot ductility behavior as seen in the curves from Figure 2, the austenite grain sizes would appear to have a lesser effect on the ductility than the other factors explored. Therefore, the formation of the ferrite films at the grain boundaries and the precipitates are the cause for the discrepancies seen between both alloys.
These ferrite films in steel A are clearly the initiation site of cracks and the main cause for the ductility drop, as seen in the microstructure images shown. In steel B, the films were not formed due to the segregation of B, which retards the austenite–ferrite transformation and favors the nucleation of intergranular ferrite, improving the ductility of this steel. Furthermore, the AlN and MnS in steel A contribute to poor ductility behavior at lower temperatures and strain rates. The higher Ti content of steel B prevents the formation of a high fraction of fine BN, also bringing benefits to the ductility.

5. Conclusions

By investigating the hot ductility behavior of two different microalloyed steels, it was seen that:
  • The steel containing B and Ti showed a better ductility behavior than the plain C microalloyed steel;
  • The increase in strain rate improves the hot ductility at all temperatures for both steels but less markedly for the steel containing B and Ti;
  • The better ductility was ascribed to the segregation of B to the grain boundaries, increasing its cohesion and preventing the formation of the ferrite films. In addition, TiN prevented the formation of the fine precipitation of BN, which are deleterious to the ductility;
  • Even though the theoretical simulations from MatCalc did not always predict the experimental observations completely, they were close enough to be a very useful tool to avoid having to carry out the expensive and time-consuming microscopical analyses;
  • The prior austenite grain size does not appear to have a strong influence on the ductility of these steels, this being controlled more by the presence or absence of the ferrite films and the degree of segregation and precipitation.

Author Contributions

Conceptualization, M.G., A.C., S.P. and C.S.; methodology, M.G., A.C. and C.S.; validation, M.G., A.C. and R.F.W.; formal analysis, M.G., A.C. and R.F.W.; investigation, M.G., A.C. and R.F.W.; resources, S.I., J.S., S.P. and C.S.; data curation, M.G., A.C. and R.F.W.; writing—original draft preparation, M.G.; writing—review and editing, M.G., A.C., R.F.W., S.I., J.S., S.P. and C.S.; visualization, M.G.; supervision, S.P. and C.S.; project administration, M.G., S.I., S.P. and C.S.; funding acquisition, S.I., J.S. and C.S. All authors have read and agreed to the published version of the manuscript.

Funding

This research was funded by the Austrian Research Promotion Agency, grant number 869295. Open Access Funding by the Graz University of Technology.

Data Availability Statement

The data presented in this study are openly available in FigShare at https://doi.org/10.6084/m9.figshare.21391032.v1.

Acknowledgments

The authors gratefully acknowledge the funding support of K1-MET GmbH, metallurgical competence center. The research program of the K1-MET competence center is supported by COMET (Competence Center for Excellent Technologies), the Austrian program for competence centers. COMET is funded by the Federal Ministry for Climate Action, Environment, Energy, Mobility, Innovation and Technology, the Federal Ministry for Digital and Economic Affairs, the Federal States of Upper Austria, Tyrol, and Styria, as well as the Styrian Business Promotion Agency (SFG) and the Standortagentur Tyrol. Furthermore, the Upper Austrian Research GmbH continuously supports K1-MET. In addition to the public funding from COMET, this research project is partially financed by the scientific partners Graz University of Technology, Montanuniversität Leoben, TU Wien, and the industrial partners Primetals Technologies Austria and voestalpine Stahl. Moreover, the authors acknowledge the facilities and the scientific and technical assistance of Microscopy Australia at the Electron Microscope Unit (EMU) in the Mark Wainwright Analytical Centre (MWAC) at UNSW Sydney and the support by the UNSW School of Materials Science & Engineering. Finally, the authors additionally acknowledge the support from TU Graz Open Access Publishing Fund.

Conflicts of Interest

The authors declare no conflict of interest.

References

  1. Mintz, B.; Yue, S.; Jonas, J.J. Hot ductility of steels and its relationship to the problem of transverse cracking during continuous casting. Int. Mater. Rev. 1991, 36, 187–220. [Google Scholar] [CrossRef]
  2. Ma, F.J.; Wen, G.H.; Tang, P.; Yu, X.; Li, J.Y.; Xu, G.D.; Mei, F. Causes of transverse corner cracks in microalloyed steel in vertical bending continuous slab casters. Ironmak. Steelmak. 2010, 37, 73–79. [Google Scholar] [CrossRef]
  3. Wang, Y.; Ren, Q.; Zhang, L.; Yang, X.; Yang, W.; Ren, Y.; Zhang, H. Formation and control of transverse corner cracks in the continuous casting slab of a microalloyed steel. Steel Res. Int. 2021, 92, 2000649. [Google Scholar] [CrossRef]
  4. Chown, L.H.; Cornish, L.A. Investigation of hot ductility in Al-killed boron steels. Mater. Sci. Eng. A 2008, 494, 263–275. [Google Scholar] [CrossRef]
  5. Mintz, B.; Abushosha, R. Effectiveness of hot tensile test in simulating straightening in continuous casting. Mater. Sci. Technol. 1992, 8, 171–177. [Google Scholar] [CrossRef]
  6. Mintz, B.; Crowther, D.N. Hot ductility of steels and its relationship to the problem of transverse cracking in continuous casting. Int. Mater. Rev. 2010, 55, 168–196. [Google Scholar] [CrossRef]
  7. Banks, K.M.; Tuling, A.; Mintz, B. Improved simulation of continuous casting to predict transverse corner cracking in microalloyed steels. IJMME 2013, 2, 188–197. [Google Scholar] [CrossRef]
  8. Gontijo, M.; Hoflehner, C.; Ilie, S.; Six, J.; Sommitsch, C. Analysis of transverse corner cracks from continuous casting process and comparison to laboratory experiments. Eur. J. Mater. 2022, 2, 222–233. [Google Scholar] [CrossRef]
  9. Abushosha, R.; Ayyad, S.; Mintz, B. Influence of cooling rate and MnS inclusions on hot ductility of steels. Mater. Sci. Technol. 1998, 14, 227–235. [Google Scholar] [CrossRef]
  10. Zarandi, F.; Yue, S. The effect of boron on hot ductility of Nb-microalloyed steels. ISIJ Int. 2006, 46, 591–598. [Google Scholar] [CrossRef]
  11. Crowther, D.N.; Mohamed, Z.; Mintz, B. The relative influence of dynamic and static precipitation on the hot ductility of microalloyed steels. Metall. Trans. A 1987, 18A, 1929–1939. [Google Scholar] [CrossRef]
  12. Wolanska, N.; Lis, A.K.; Lis, J. Microstructure investigation of low carbon steel after hot deformation. J. Achiev. Mater. Manuf. Eng. 2007, 20, 291–294. [Google Scholar]
  13. Gao, Y.-l.; Xue, X.-x.; Yang, H. Influence of boron on initial austenite grain size and hot deformation behavior of boron microalloyed steels. Crystals 2015, 5, 592–607. [Google Scholar] [CrossRef] [Green Version]
  14. Abushosha, R.; Comineli, O.; Mintz, B. Influence of Ti on hot ductility of C-Mn-Al steels. Mater. Sci. Technol. 1999, 15, 278–286. [Google Scholar] [CrossRef]
  15. Mintz, B. The influence of composition on the hot ductility of steels and to the problem of transverse cracking. ISIJ Int. 1999, 39, 833–855. [Google Scholar] [CrossRef]
  16. Banks, K.M.; Tuling, A.; Mintz, B. Influence of thermal history on the hot ductility of steel and its relationship to the problem of cracking in continuous casting. Mater. Sci. Technol. 2012, 28, 536–542. [Google Scholar] [CrossRef]
  17. Maehara, Y.; Nakai, K.; Yasumoto, K.; Mishima, T. Hot cracking of low alloy steels in simulated continuous casting direct rolling process. Trans. ISIJ 1988, 28, 1021–1027. [Google Scholar] [CrossRef]
  18. Gontijo, M.; Hoflehner, C.; Estermann, P.; Ilie, S.; Six, J.; Sommitsch, C. Effect of strain rate on the hot ductility behavior of a continuously cast Ti-Nb microalloyed steel. Steel Res. Int. 2020, 91, 2000222. [Google Scholar] [CrossRef]
  19. Lewis, J.; Jonas, J.J.; Mintz, B. The deformation induced ferrite during mechanical testing. ISIJ Int. 1998, 38, 300–309. [Google Scholar] [CrossRef]
  20. Liu, Y.; Du, L.-X.; Wu, H.-Y.; Devesh Kumar Misra, R. Hot ductility and fracture phenomena of low-carbon V-N-Cr microalloyed steels. Steel Res. Int. 2020, 91, 1900265. [Google Scholar] [CrossRef]
  21. Moon, S.-C.; Dippenaar, R. The effect of austenite grain size on hot ductility of steels. In Proceedings of the MS&T 2004 Conference, New Orleans, LA, USA, 26 September 2004. [Google Scholar]
  22. Back, J.G.; Engberg, G. Investigation of parent austenite from martensite structure using EBSD in a wear resistant steel. Materials 2017, 10, 453. [Google Scholar] [CrossRef] [PubMed] [Green Version]
  23. Su, B.; Lin, H.-P.; Kuo, J.-C.; Pan, Y.-T. EBSD investigation on microstructure transformation in low carbon steel during continuous casting. Can. Metall. Q. 2014, 53, 352–361. [Google Scholar] [CrossRef]
  24. Hata, K.; Wakita, M.; Fujiwara, K.; Kawano, K. Development of a reconstruction method of prior austenite microstructure using EBSD data of martensite. Nippon Steel Tech. Rep. 2017, 114, 26–31. [Google Scholar]
  25. Banks, K.M.; Tuling, A.; Mintz, B. The influence of N on hot ductility of V-, Nb- and Nb-Ti- containing steels using improved thermal simulation of continuous casting. J. S. Afr. Inst. Min. Metall. 2011, 111, 711–716. [Google Scholar]
  26. Gontijo, M.; Hoflehner, C.; Ilie, S.; Six, J.; Sommitsch, C. Comparison of hot ductility behavior of microalloyed steels with different B-, Cr-, Ni- and Ti-content. In Proceedings of the METAL 2021, Brno, Czech Republic, 26 May 2021. [Google Scholar]
  27. Cho, K.; Mun, D.; Kang, M.; Lee, J.; Park, J.; Koo, Y. Effect of thermal cycle and nitrogen content on the hot ductility of boron-bearing steel. ISIJ Int. 2010, 50, 839–846. [Google Scholar] [CrossRef] [Green Version]
  28. Cho, K.; Mun, D.; Kim, J.; Park, J.; Lee, J.; Koo, Y. Effect of boron precipitation behavior on the hot ductility of boron containing steel. Metall. Mater. Trans. A 2010, 41A, 1421–1428. [Google Scholar] [CrossRef] [Green Version]
  29. Liu, W.; Li, J.; Shi, C.-B.; Huo, X.-D. Effect of boron and titanium addition on the hot ductility of low-carbon Nb-containing steel. High Temp. Mat. Proc. 2015, 34, 813–820. [Google Scholar] [CrossRef]
  30. Gontijo, M.; Hoflehner, C.; Ilie, S.; Six, J.; Sommitsch, C. Holding time influence on the hot ductility behavior of a continuously cast low alloy steel. Metals 2021, 11, 64. [Google Scholar] [CrossRef]
  31. Sun, W.P.; Militzer, M.; Jonas, J.J. Strain-induced nucleation of MnS in electrical steels. Metall. Trans. A 1992, 23A, 821–830. [Google Scholar] [CrossRef]
  32. Sun, W.P.; Militzer, M.; Jonas, J.J. Diffusion-controlled growth and coarsening of MnS during hot deformation. Metall. Trans. A 1992, 23A, 3013–3023. [Google Scholar] [CrossRef]
  33. Chen, Y.-L.; Wang, Y.; Zhao, A.-M. Precipitation of AlN and MnS in low carbon aluminium-killed steel. J. Iron Steel Res. Int. 2012, 19, 51–56. [Google Scholar] [CrossRef]
  34. Niessen, F.; Nyyssönen, T.; Gazder, A.A.; Hielscher, R. Parent grain reconstruction from partially or fully transformed microstructures in MTEX. J. Appl. Cryst. 2021, 55, 180–194. [Google Scholar] [CrossRef] [PubMed]
  35. ASTM International. Standard Test Methods for Determining Average Grain Size; E112-10; ASTM: West Conshohocken, PA, USA, 2010. [Google Scholar]
  36. Pandit, A.; Murugaiyan, A.; Saha Podder, A.; Haldar, A.; Bhattacharjee, D.; Chandra, S.; Ray, R.K. Strain induced precipitation of complex carbonitrides in Nb-V and Ti-V microalloyed steels. Scr. Mater. 2005, 53, 1309–1314. [Google Scholar] [CrossRef]
  37. Poths, R.M.; Hinggindon, R.; Palmiere, E. Complex precipitation behaviour in a microalloyed steel. Scr. Mater. 2001, 44, 147–151. [Google Scholar] [CrossRef]
  38. Denes, E.; Toth, A.L.; Fabian, E.-R. Qualitative and quantitative analysis of boron content precipitates by FEG-SEM and EDS methods. MSF 2010, 659, 295–300. [Google Scholar] [CrossRef]
  39. Ingermarsson, L.; Halvarsson, M. SEM/EDX Analysis of Boron, A Case Study; High Temperature Corrosion Centre (HTC), Chalmers University of Technology: Gothenburg, Sweden, 2011; pp. 1–31. [Google Scholar]
  40. Hoflehner, C. Investigation of Second Ductility Minimum of Continuously Cast Microalloyed Steels. Ph.D. Thesis, Graz University of Technology, Graz, Austria, 2021. [Google Scholar]
  41. Mintz, B.; Lewis, J.; Jonas, J.J. Importance of deformation induced ferrite and factors which control its formation. Mater. Sci. Technol. 1997, 13, 379–388. [Google Scholar] [CrossRef]
  42. Abushosha, R.; Vipond, R.; Mintz, B. Influence of titanium on hot ductility of as cast steels. Mater. Sci. Technol. 1991, 7, 613–621. [Google Scholar] [CrossRef]
  43. Nagasaki, C.; Aizawa, A.; Kihara, J. Influence of manganese and sulfur on hot ductility of carbon steels at high strain rate. Trans. ISIJ 1987, 27, 506–512. [Google Scholar] [CrossRef]
  44. López-Chipres, E.; Mejía, I.; Maldonado, C.; Bedolla-Jacuinde, A.; Cabrera, J.M. Hot ductility behavior of boron microalloyed steels. Mater. Sci. Eng. A 2007, 460–461, 464–470. [Google Scholar] [CrossRef]
  45. Mintz, B.; Qaban, A. Understanding the high temperature side of the ductility curve for steels. Mater. Sci. Technol. 2021, 37, 1–13. [Google Scholar] [CrossRef]
  46. Ishiguro, Y.; Sato, K.; Murayama, T. Precipitation of copper sulfide in ultra low carbon steel containing residual level of copper. Mater. Trans. 2005, 46, 769–778. [Google Scholar] [CrossRef] [Green Version]
  47. Kim, S.K.; Kim, J.S.; Kim, N.J. Effect of boron on the hot ductility of Nb-containing steel. Metall. Mater. Trans. A 2002, 33A, 701–704. [Google Scholar] [CrossRef]
  48. Wang, W.S.; Zhu, H.Y.; Sun, J.; Lei, J.L.; Duan, Y.Q.; Wang, Q. Thermodynamic analysis of BN, AlN and TiN precipitation in boron-bearing steel. Metalurgija 2019, 58, 199–202. [Google Scholar]
  49. Wilson, F.G.; Gladman, T. Aluminium nitride in steel. Int. Mater. Rev. 1998, 33, 221–286. [Google Scholar] [CrossRef]
  50. Zhang, G.J.; Yang, J.F.; Ando, M.; Ohji, T.; Kanzaki, S. Reactive synthesis of alumina-boron nitride composites. Acta Mater. 2004, 52, 1823–1835. [Google Scholar] [CrossRef]
  51. Mintz, B.; Abushosha, R. Influence of vanadium on hot ductility of steel. Ironmak. Steelmak. 1993, 20, 445–452. [Google Scholar]
  52. Tanino, M. Precipitation behaviour of complex boron compounds in steel. Nippon Steel Tech. Rep. 1983, 21, 331–337. [Google Scholar]
  53. Bialobrzeska, B. Effect of boron accompanied by chromium, vanadium and titanium on kinetics of austenite grain growth. Ironmak. Steelmak. 2021, 48, 649–676. [Google Scholar] [CrossRef]
  54. Haga, J.; Mizui, N.; Nagamichi, T.; Okamoto, A. Effect of boron on mechanical properties and recrystallization behavior of Ti-added ultra-low carbon cold-rolled steel sheets. ISIJ Int. 1998, 38, 580–586. [Google Scholar] [CrossRef]
  55. Nes, E.; Ryum, N.; Hunderi, O. On the Zener drag. Acta Metall. 1985, 33, 11–22. [Google Scholar] [CrossRef]
  56. Fernández, J.; Illescas, S.; Guilemany, J.M. Effect of microalloying elements on the austenitic grain growth in a low carbon HSLA steel. Mater. Lett. 2007, 61, 2389–2392. [Google Scholar] [CrossRef]
  57. Flores, O.; Martinez, L. Abnormal grain growth of austenite in a V-Nb microalloyed steel. J. Mater. Sci. 1997, 32, 5985–5991. [Google Scholar] [CrossRef]
Figure 1. Sample geometry (a) and schematic assemble of the experiment (b) [30].
Metals 12 01808 g001
Figure 2. Influence of the strain rate on the hot ductility behavior of steel A and B.
Metals 12 01808 g002
Figure 3. Fracture surfaces of steel A samples tested at different temperatures and strain rates.
Metals 12 01808 g003
Figure 4. Fracture surfaces of steel B samples tested at different temperatures and strain rates.
Metals 12 01808 g004
Figure 5. Microstructure images of the samples from steel A tested at 850 °C and (a) 10−2 s−1, 50×; (b) 10−2 s−1, 100×; (c) 10−4 s−1, 50×; and (d) 10−4 s−1, 100×. Black arrows indicate the ferrite films at the grain boundaries and the red arrows indicate the crack formation at the boundaries.
Metals 12 01808 g005
Figure 6. Microstructure images of the samples from steel B tested at 700 °C and (a) 10−2 s−1, 50×; (b) 10−2 s−1, 100×; (c) 10−4 s−1, 50×; and (d) 10−4 s−1, 100×. Black arrows indicate the ferrite films at the grain boundaries and the red arrows indicate the crack formation at the boundaries.
Metals 12 01808 g006
Figure 7. Precipitates in steel A: (a) MnS; (b) AlN at MnS; (c) CuS and MnS.
Metals 12 01808 g007aMetals 12 01808 g007b
Figure 8. Precipitates in steel B: (a) BN at Al2O3; (b) TiN in the matrix; (c) TiN at grain boundary; (d) complex (TiV)N.
Metals 12 01808 g008aMetals 12 01808 g008b
Figure 9. PAG analysis for steel A at 900 °C without deformation via (a) MTEX reconstruction (93 ± 8 µm diameter), (b) exemplified child and parent boundary misorientation and analysis via (c) chemical etching (91 ± 16 µm).
Metals 12 01808 g009
Figure 10. Prior austenite grains from steel A tested with Gleeble at different temperatures without deformation after etching. Size ranging from approx. 100 to 120 µm.
Metals 12 01808 g010
Figure 11. Prior austenite grains from steel B tested with Gleeble at different temperatures without deformation after etching.
Metals 12 01808 g011
Table 1. Chemical composition of the microalloyed steels investigated in wt%.
SteelCMnAlSiNNiVTiBCuS
A0.0791.670.0510.1240.00520.0280.0040.00140.00020.0220.0051
B0.0871.640.0520.0990.00510.4700.1070.02700.00240.0330.0005
Table 2. Simulation results for the precipitation kinetics of steel A.
Steel A
Mean Radius (nm)850 °C900 °C
10−4 s−110−3 s−110−2 s−110−4 s−110−3 s−110−2 s−1
MnSd17.512.59.427.819.49.1
AlNgb87.564.059.412172.658.2
MnS10.23.81.516.73.70.9
Phase fraction850 °C900 °C
10−4 s−110−3 s−110−2 s−110−4 s−110−3 s−110−2 s−1
MnSd1.76 × 10−41.64 × 10−41.33 × 10−41.76 × 10−41.67 × 10−44.02 × 10⁻⁵
AlNgb1.80 × 10−97.03 × 10−105.62 × 10−104.00 × 10−98.68 × 10−104.46 × 10⁻¹⁰
MnS3.21 × 10−54.54 × 10−66.99 × 10−73.63 × 10−51.09 × 10−68.88 × 10⁻¹⁰
Table 3. Simulation results for the precipitation kinetics of steel B.
Steel B
Mean Radius [nm]800 °C900 °C
10−4 s−110−3 s−110−2 s−110−4 s−110−3 s−110−2 s−1
BNgb1156.91155.81151.71148.11155.41148.4
d388.2356.4171.5381.2389.7382.7
TiNgb112.8112.1111.9117.2112.7112.0
d4.22.54.821.114.617.2
Phase fraction800 °C900 °C
10−4 s−110−3 s−110−2 s−110−4 s−110−3 s−110−2 s−1
BNgb1.32 × 10−81.32 × 10−81.30 × 10−81.29 × 10−81.31 × 10−81.29 × 10⁻⁸
d2.47 × 10−42.45 × 10−42.37 × 10−42.36 × 10−42.44 × 10−42.31 × 10⁻⁴
TiNgb2.27 × 10−92.23 × 10−92.22 × 10−92.54 × 10−92.26 × 10−92.22 × 10⁻⁹
d6.25 × 10−54.99 × 10−54.81 × 10−51.81 × 10−45.88 × 10−54.90 × 10⁻⁵
Publisher’s Note: MDPI stays neutral with regard to jurisdictional claims in published maps and institutional affiliations.

