Article

Neutron Imaging of Al6061 Prepared by Solid-State Friction Stir Additive Manufacturing

1
Department of Mechanical and Industrial Engineering, Louisiana State University, Baton Rouge, LA 70803, USA
2
Department of Chemistry, Louisiana State University, Baton Rouge, LA 70803, USA
3
Center for Advanced Microstructures and Devices (CAMD), Louisiana State University, Baton Rouge, LA 70806, USA
4
Materials Science and Technology Division, Oak Ridge National Laboratory, Oak Ridge, TN 37830, USA
5
Department of Mechanical Engineering, Southern University and A&M College, Baton Rouge, LA 70807, USA
6
Neutron Scattering Division, Oak Ridge National Laboratory, Oak Ridge, TN 37830, USA
*
Author to whom correspondence should be addressed.
Metals 2023, 13(2), 188; https://doi.org/10.3390/met13020188
Submission received: 8 December 2022 / Revised: 30 December 2022 / Accepted: 13 January 2023 / Published: 17 January 2023
(This article belongs to the Special Issue Alloy Specific Considerations for Friction Stir Welding)

Abstract

:
Solid-state Friction Stir Additive Manufacturing has recently gained attention as a result of its capacity to fabricate large-scale parts while preserving the mechanical properties of the feedstock material. However, the correlation between the quality of layer-by-layer bonding of the deposited metal and processing parameters has remained unknown. Neutron imaging techniques, with 90% total transmission per cm, are employed for Al6061 parts fabricated by MELD® Technology as a non-destructive evaluation approach for the first time to investigate the layer-by-layer structure of a stadium-shaped ingot in different sections. The post-processed results show the fabricated parts with an optimized set of processing parameters are void-free. However, the hydrocarbon-based feedstock lubricant segregates between the layers, which consequently may lead to non-uniform weaker mechanical properties along the build direction and stimulate crack initiation during mechanical loading. The tensile test results show 14% lower strain-to-failure values in alleged contaminated areas in transmission imaging results. Additionally, layer bonding is significantly impacted by hot-on-hot and hot-on-cold layer deposition schemes, especially for larger layer thicknesses.

1. Introduction

Additive Friction Stir Deposition (AFS-D)—commonly known as the MELD® process—is a solid-state additive manufacturing (AM) technology inspired by the Friction Stir Welding [1] process and capable of fabricating large parts (up to meters) with relatively simple geometries, making it an ideal fabrication method for the aerospace, defense, and turbomachinery industries. This process is based on the plastic flow of the material in elevated temperatures well below the material’s melting point. Therefore, it has the potential to retain the mechanical properties of the feedstock material with the correct set of processing parameters. This capability differentiates AFS-D from many other AM processes, including but not limited to Laser Powder Bed Fusion (LPBF) and Direct Energy Deposition (DED), where the feedstock undergoes a melting process, and the chances of maintaining the feedstock microstructure and mechanical properties are lower. Moreover, it reduces the possibility of common defects of liquid-phase processes such as crack initiation and pore formation [2].
However, finding the optimized set of processing parameters and controlling the uncertainties is a crucial factor in the quality of the fabricated parts. Failing to do so will lead to defective parts and inferior mechanical properties. The ultimate solution to this challenge is to find the correlation between the processing parameters and mechanical properties of the deposited part. Due to the layer-by-layer material deposition procedure in MELD, the quality of the interlayer bonding and the integrity of the fabricated part along the build direction are of interest and need to be investigated.
The AFS-D process has been used for fabricating parts with different types of materials. The focus is mostly on aluminum alloys [2,3,4,5,6,7,8,9] in the literature due to their low melting point. However, other materials including nickel alloys [10,11], titanium alloys [12], magnesium alloys [13], copper [14,15], and steel [16,17] have also been processed. Other than fabricating new parts, AFS-D has been shown to be effective in recycling [12,18] and reparation [9] as well.
Given that the MELD process is quite a new additive manufacturing process, a limited number of papers are available in the literature. To date, researchers have been focusing on fabrication [18,19], microstructure characterization [4,6,15], static strength [6], fatigue strength [7,8,11], thermal analysis [20], and simulation [21]. Among characterization methods, MELD samples have mostly been investigated by Electron Backscatter Diffraction (EBSD) [6,11,22], Scanning Electron Microscope (SEM) [6,11,22], Transmission Electron Microscope (TEM) [22], Energy-Dispersive Spectroscopy (EDX) [6], and X-ray Computed Tomography (XCT) [2,23,24]. However, there is no publication regarding the application of neutron imaging in this field. This paper aims to assess the capabilities of neutron imaging and neutron Computed Tomography (nCT) in the nondestructive evaluation of large parts manufactured using AFS-D method for the first time.
For metal additive manufactured items, a neutron beam, as opposed to X-ray beam, can penetrate deep into most of the high-Z materials and is a suitable choice for the non-destructive evaluation of the internal features of large objects. Since neutrons interact with the nuclei rather than electron cloud [25], their scattering and absorption cross-section is large for chemical elements with low atomic numbers. For example, hydrogen (Z = 1) has a significantly large cross-section and any hydrogen-related contamination (water, hydrocarbons, etc.) can be easily detected in neutron imaging of a metal component. X-rays, on the other hand, interact with the electron cloud and have more interaction with higher atomic number elements such as aluminum and iron (Figure 1). In other words, neutron and X-ray imaging complement each other for the assessment of hydrogen-containing contaminants in aluminum components.
Neutron imaging facilities are rare and quite oversubscribed around the world. The High Flux Isotope Reactor (HFIR) at Oak Ridge National Laboratory (ORNL) is the strongest reactor-based neutron source in the US, and operates at 85 MW and provides a high-flux cold neutron beam from a liquid hydrogen moderator [26]. In addition, the neutron imaging beamline has recently been enhanced with a Talbot–Lau interferometer similar to that developed at the Paul Scherrer Institute [27].
In this paper, we investigated the layering structure of the MELD Al6061 samples in large scale using a neutron beam for the first time. Since neutrons can penetrate deep into aluminum, they are the perfect choice for investigating the internal features of Al6061 MELD samples.

2. Materials and Methods

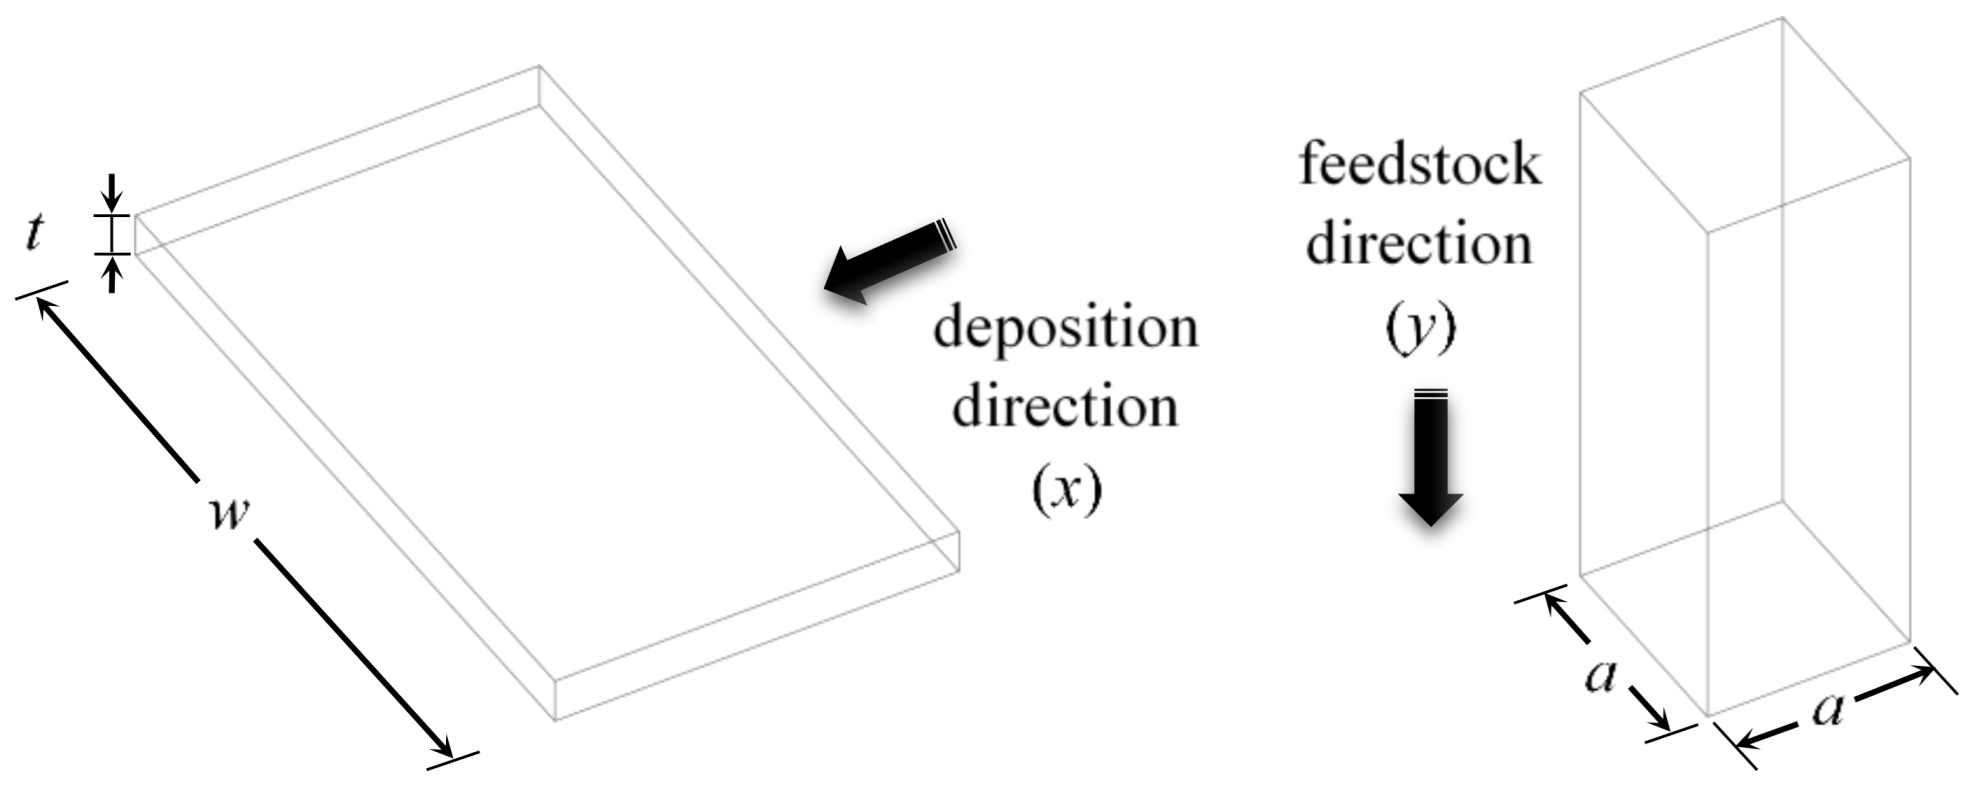
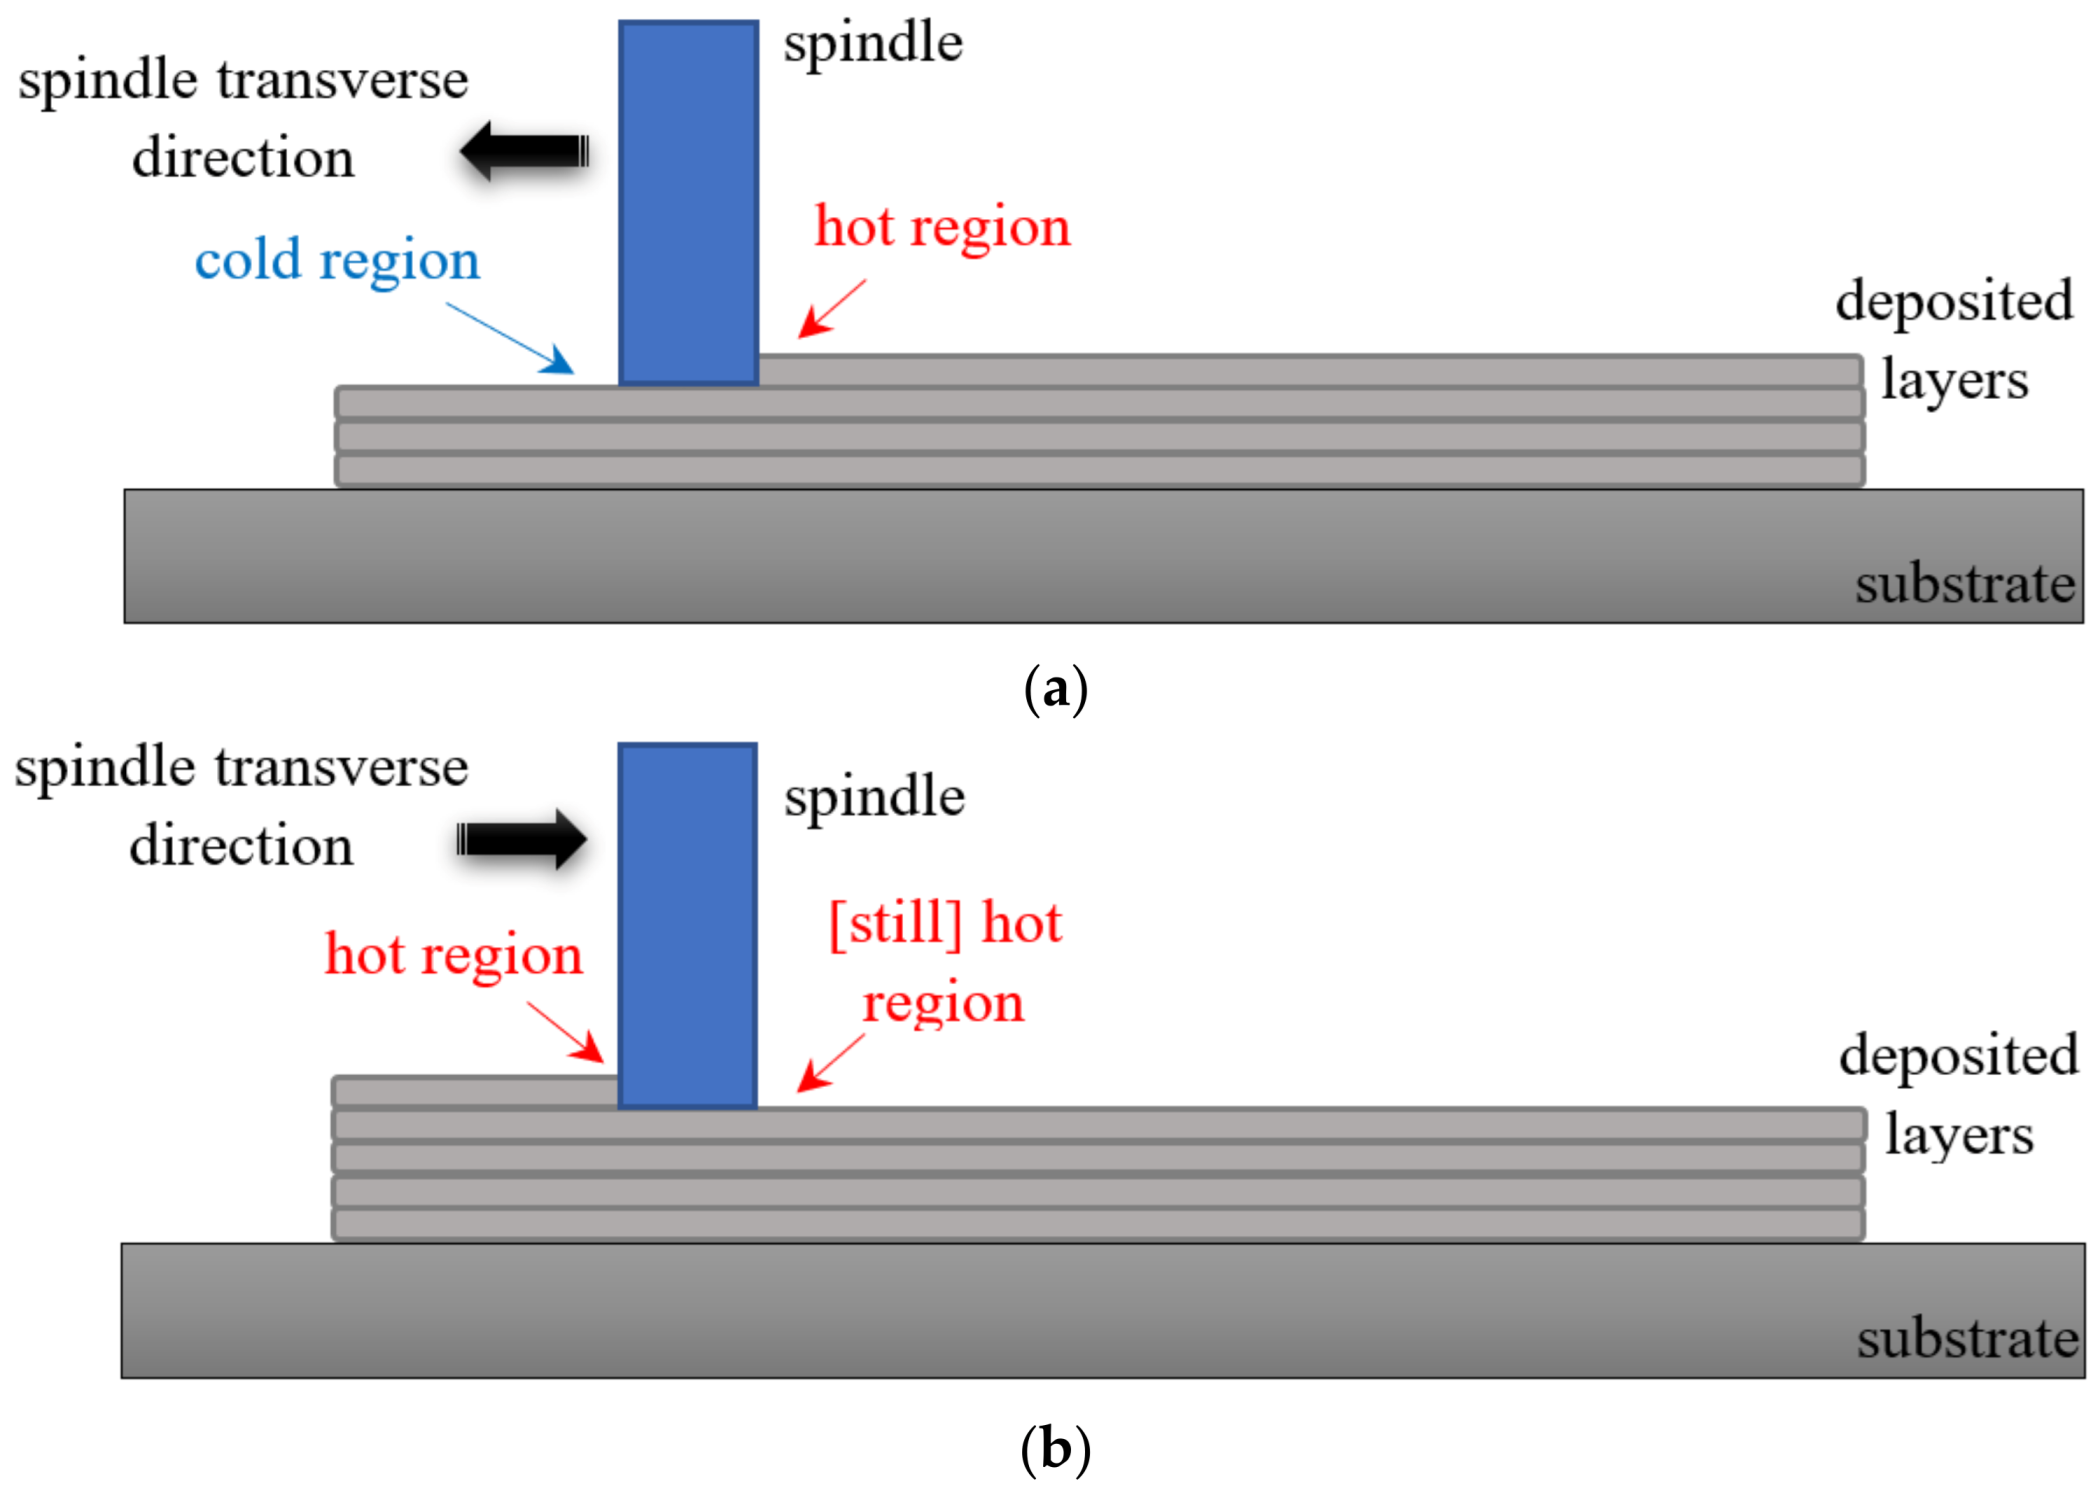
2.1. The AFS-D Process

In the AFS-D process, a feedstock rod enters a rotating hollow shoulder (also known as the spindle) and undergoes plastic deformation due to fiction-induced elevated temperature at the spindle–substrate interface and material–substrate interface. Then, the softened material is deposited on the substrate or the previous deposited layer(s) following the pattern determined by G-code [2]. The continuity equation (conservation of mass) enforces a constraint between layer thickness, part dimensions, feedstock rate, and spindle transverse speed (Figure 2).
Since flow of the mass entering to spindle should be equal to flow of the mass being deposited, we can write:
m ˙ i n = m ˙ o u t
Assuming specific mass remains constant during the process:
ρ V ˙ i n = ρ V ˙ o u t
a 2 y ˙ = w t x ˙
Equation (3) is the constraint enforced to the system by conservation of mass principle, where a is the side of the feedstock rod cross section, w is the deposited layer width, t is the layer thickness, x ˙ is the spindle transverse speed, and y ˙ is the feedstock rate (or actuator speed). This equation specifies the relationships that the processing parameters should maintain to have a continuous material deposition with minimal waste. Any deviation from this constraint will lead to either uneven deposition or waste of material.

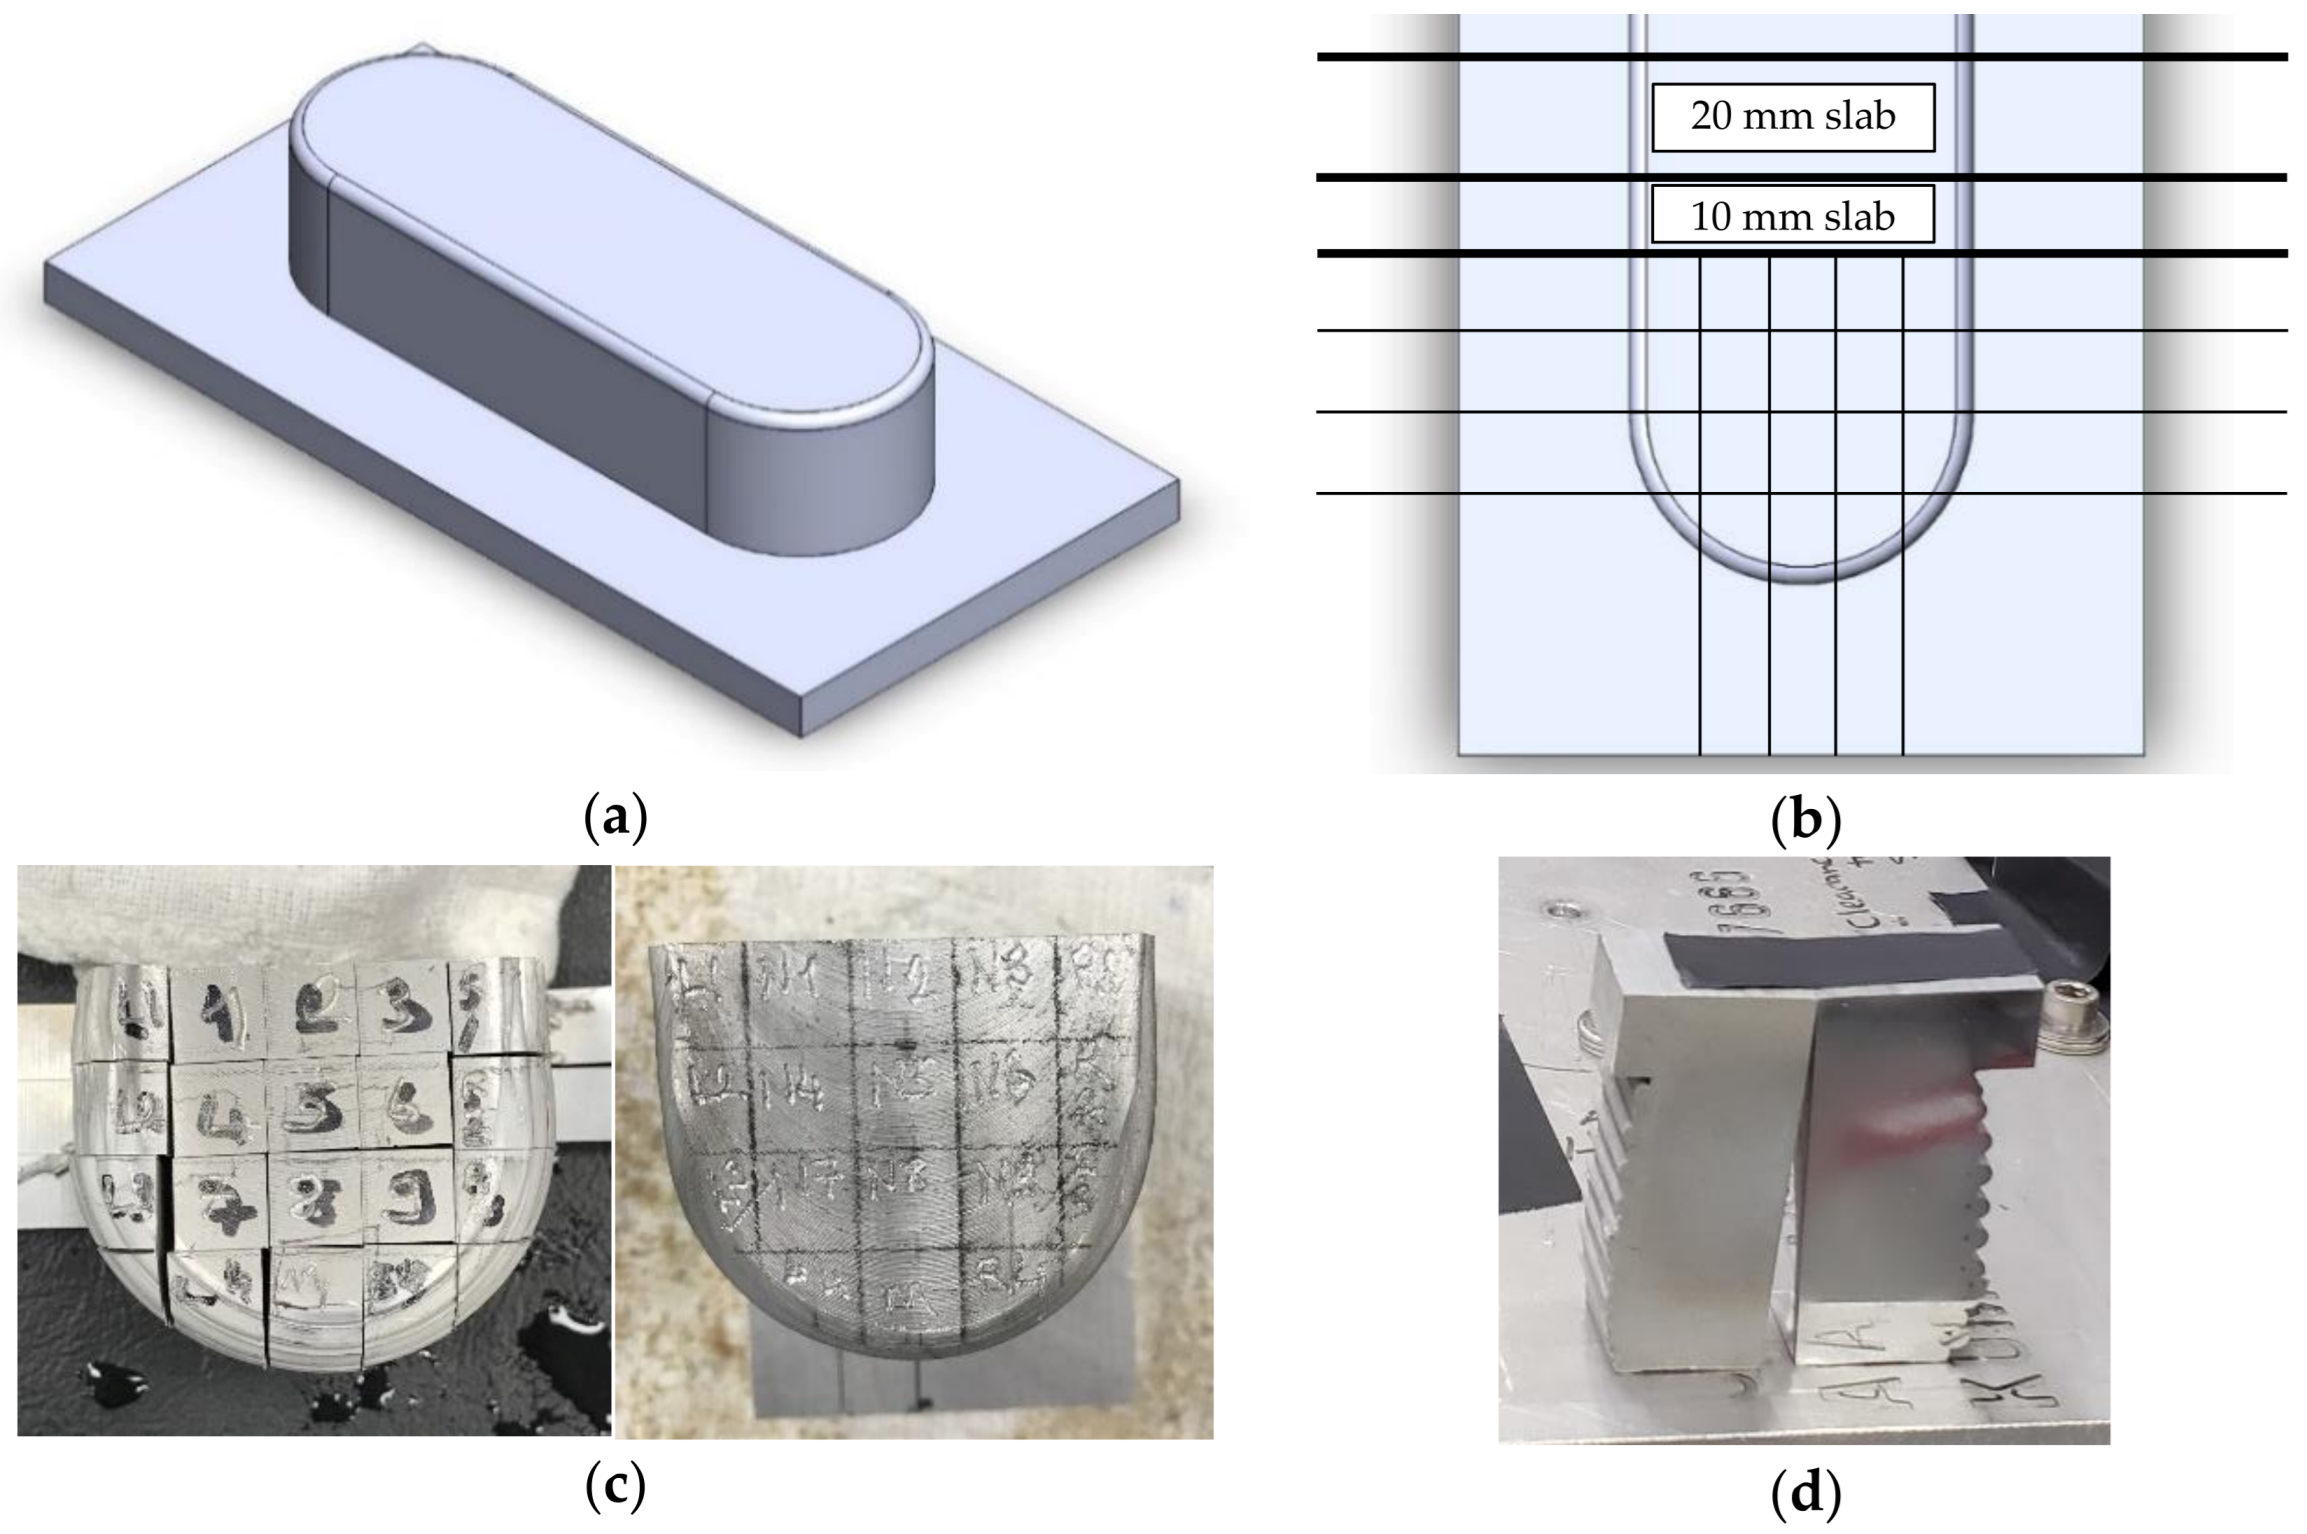
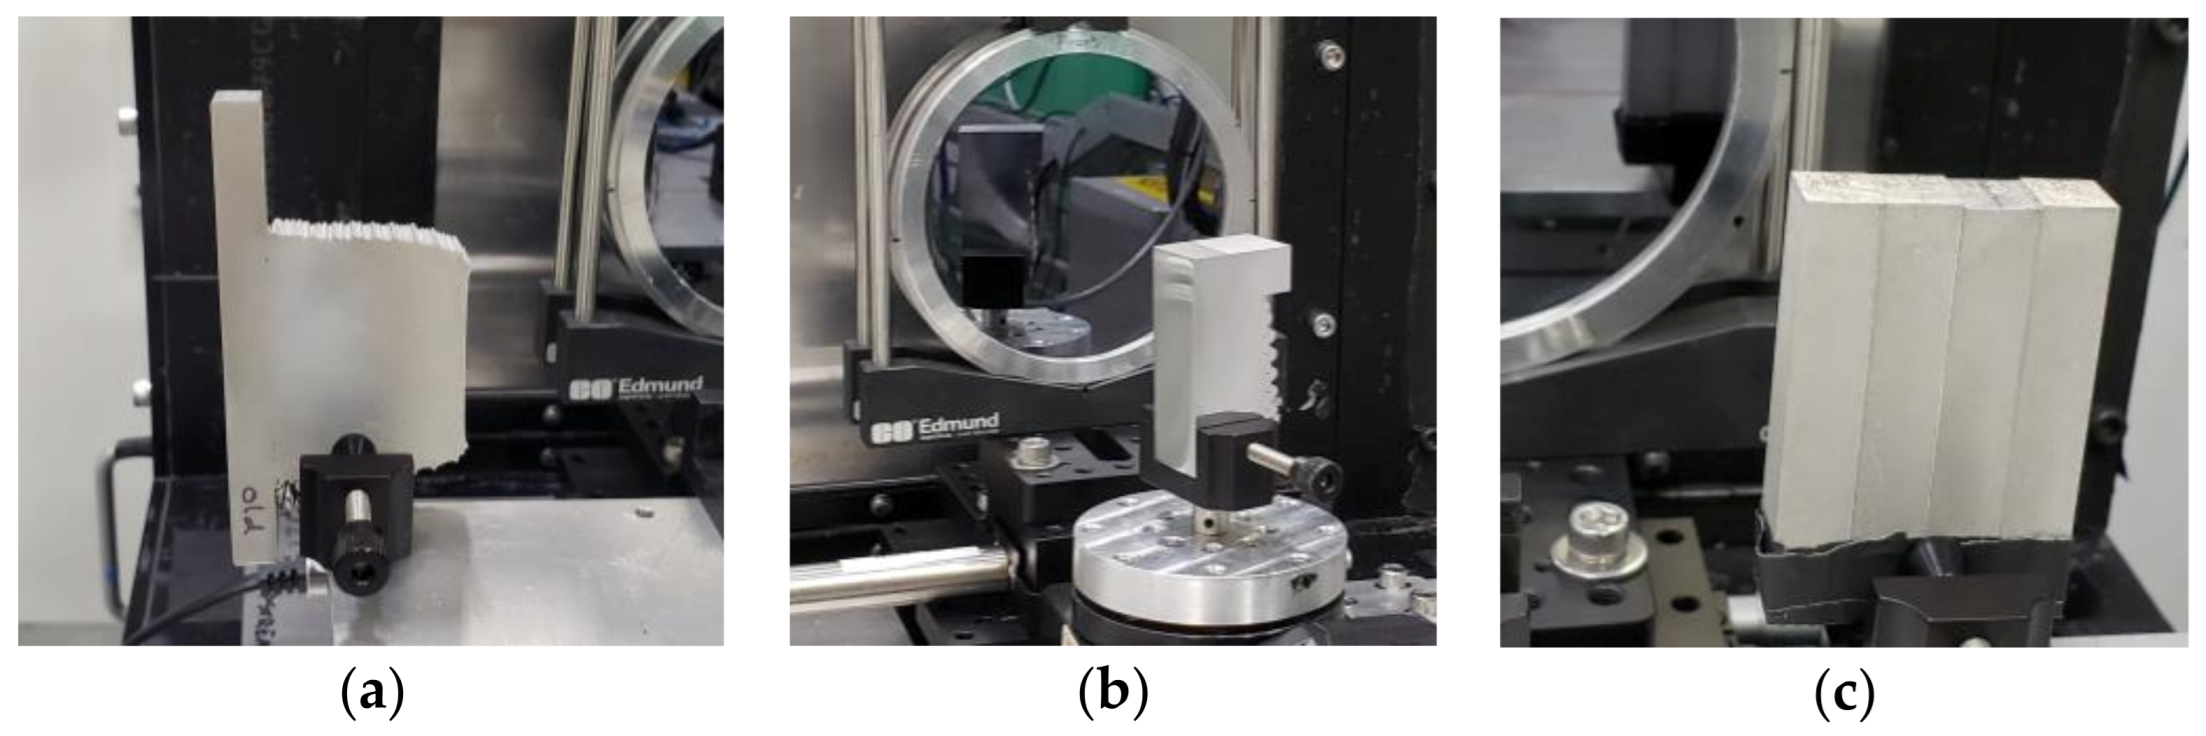
2.2. Sample Preparation

Twenty inch Al6061 bar-shaped feedstock rods with 3/8” by 3/8” square cross sections are used as the raw material. A thin layer of “Dry-film Graphite” lubricant supplied by Zep Inc. (Atlanta, GA, USA) [28] is sprayed on the rods to prevent them from getting stuck in the spindle and help them slide smoothly. The feedstock magazine needs to be manually reloaded once a 20” feedstock rod is consumed.
There are a limited number of processing parameter sets that are within the allowed region dictated by Equation (3). Within this limit, two stadium-shaped ingots (Figure 3a) are fabricated with an L3 machine from MELD Manufacturing Corporation (Christiansburg, VA, USA). Process parameters for each ingot are summarized in Table 1. Ingots A and B are fabricated in such a way that the layer thickness is close to minimum and maximum feasible values.
Each ingot is cut into two slabs with different thicknesses and 20 rods at the circular-shaped end by Wire EDM machine (Figure 3b,c). Rods are numbered and engraved for reliable record keeping. The build plate is kept with the samples to inspect the bonding between the first deposition layer and the cold substrate, if needed. The 20 mm slab is cut in half and the cross-section of one half is fine polished to 1 µm surface roughness finish (Figure 3d). All the samples are inspected using 2D neutron radiography and after the preliminary results, the polished half of the 20 mm is chosen for 3D neutron computed tomography experiment. The samples and the corresponding experiments are summarized in Table 2. Only the polished half of the 20 mm slab from sample B is selected for 3D nCT because of limited beamtime.
The CG-1D beamline at HFIR facilities was used to study the layering structure of AFS-D parts. This beamline is dedicated to many research areas including Additive Manufacturing and can reveal the internal structure and porosity of large and thick parts. The specifications of the CG-1D cold neutron interferometry beamline, as used for the MELD imaging experiments, are summarized in Table 3.
Since MELD process is typically used for fabricating large parts, neutrons are a viable choice for non-destructive evaluation of MELD samples due to their high penetration capability. The penetration depth in aluminum for CG-1D neutron beamline is up to 10 cm, given the wavelength range in Table 3 and NIST Center for Neutron Research database [29]. The ORNL NEUtron Imaging Toolbox (NEUIT) also estimates that a 10 cm Al sample has about 30% transmission at CG-1D beamline [30]. Therefore, the beamline is capable of capturing internal features of samples fabricated by MELD process if there is sufficient neutron contrast.
The schematic view of the neutron interferometer setup at CG-1D beamline is shown in Figure 4. Each of the samples in Table 2 is placed in the experimental setup (Figure 5) and the neutron images taken with the parameters are listed in Table 3.

3. Results and Discussion

The visual inspection of the ingots and the samples cut from them does not show any pores, cracks, or other internal defects. However, cracks may not be easily seen after surface treatments (e.g., grinding or polishing) for aluminum alloys because of their high ductility. Dark-field imaging was employed for void detection, but the experiments were unsuccessful due to low signal-to-noise ratio. Nevertheless, the interferometer showed superior results in transmission imaging for detecting hydrogen contamination. For each image, a set of noise/background removal and contrast adjustment operations is applied to better reveal the internal features of the samples.

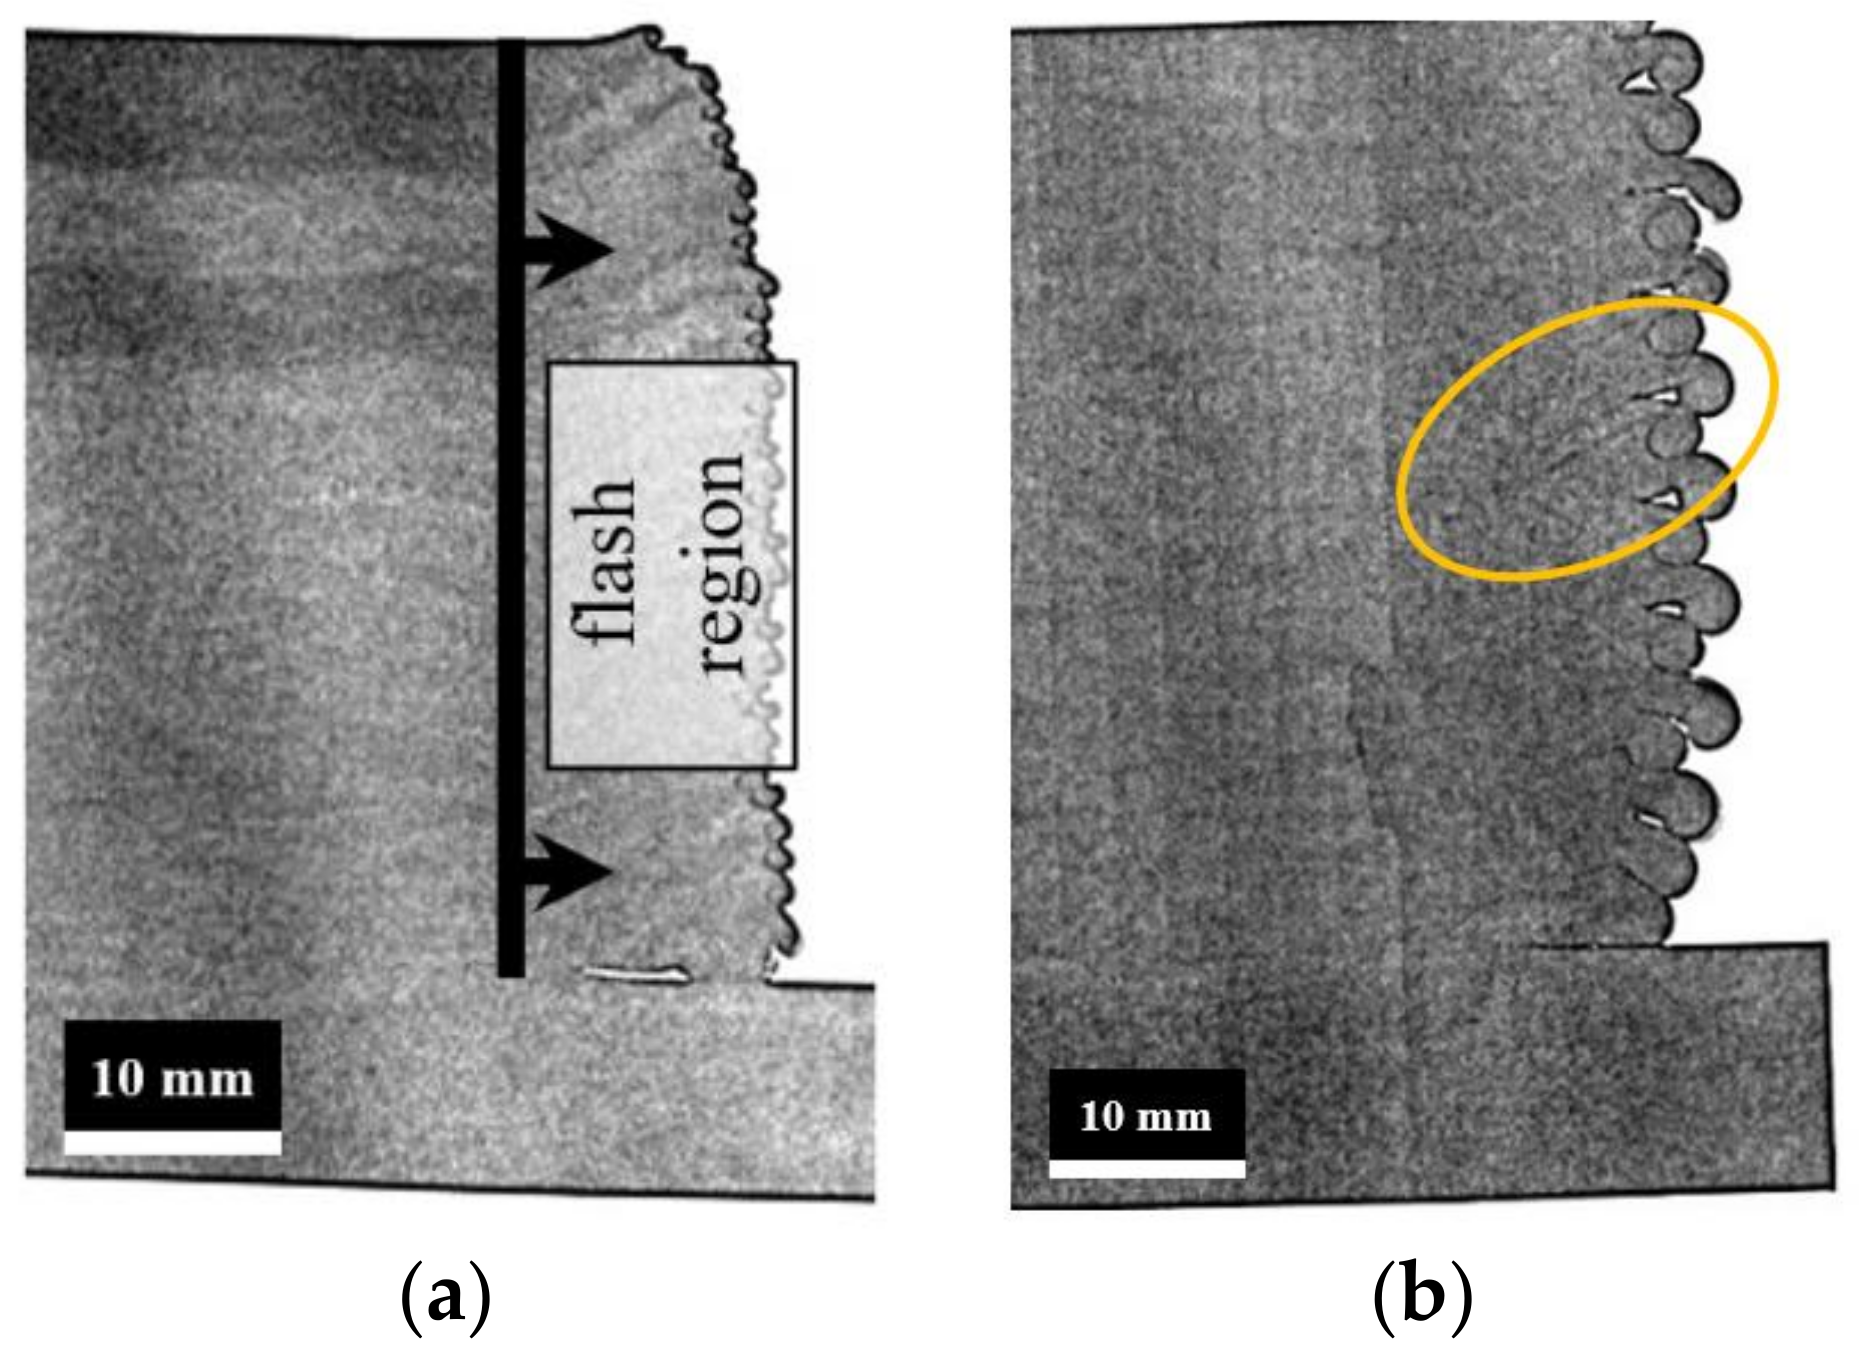
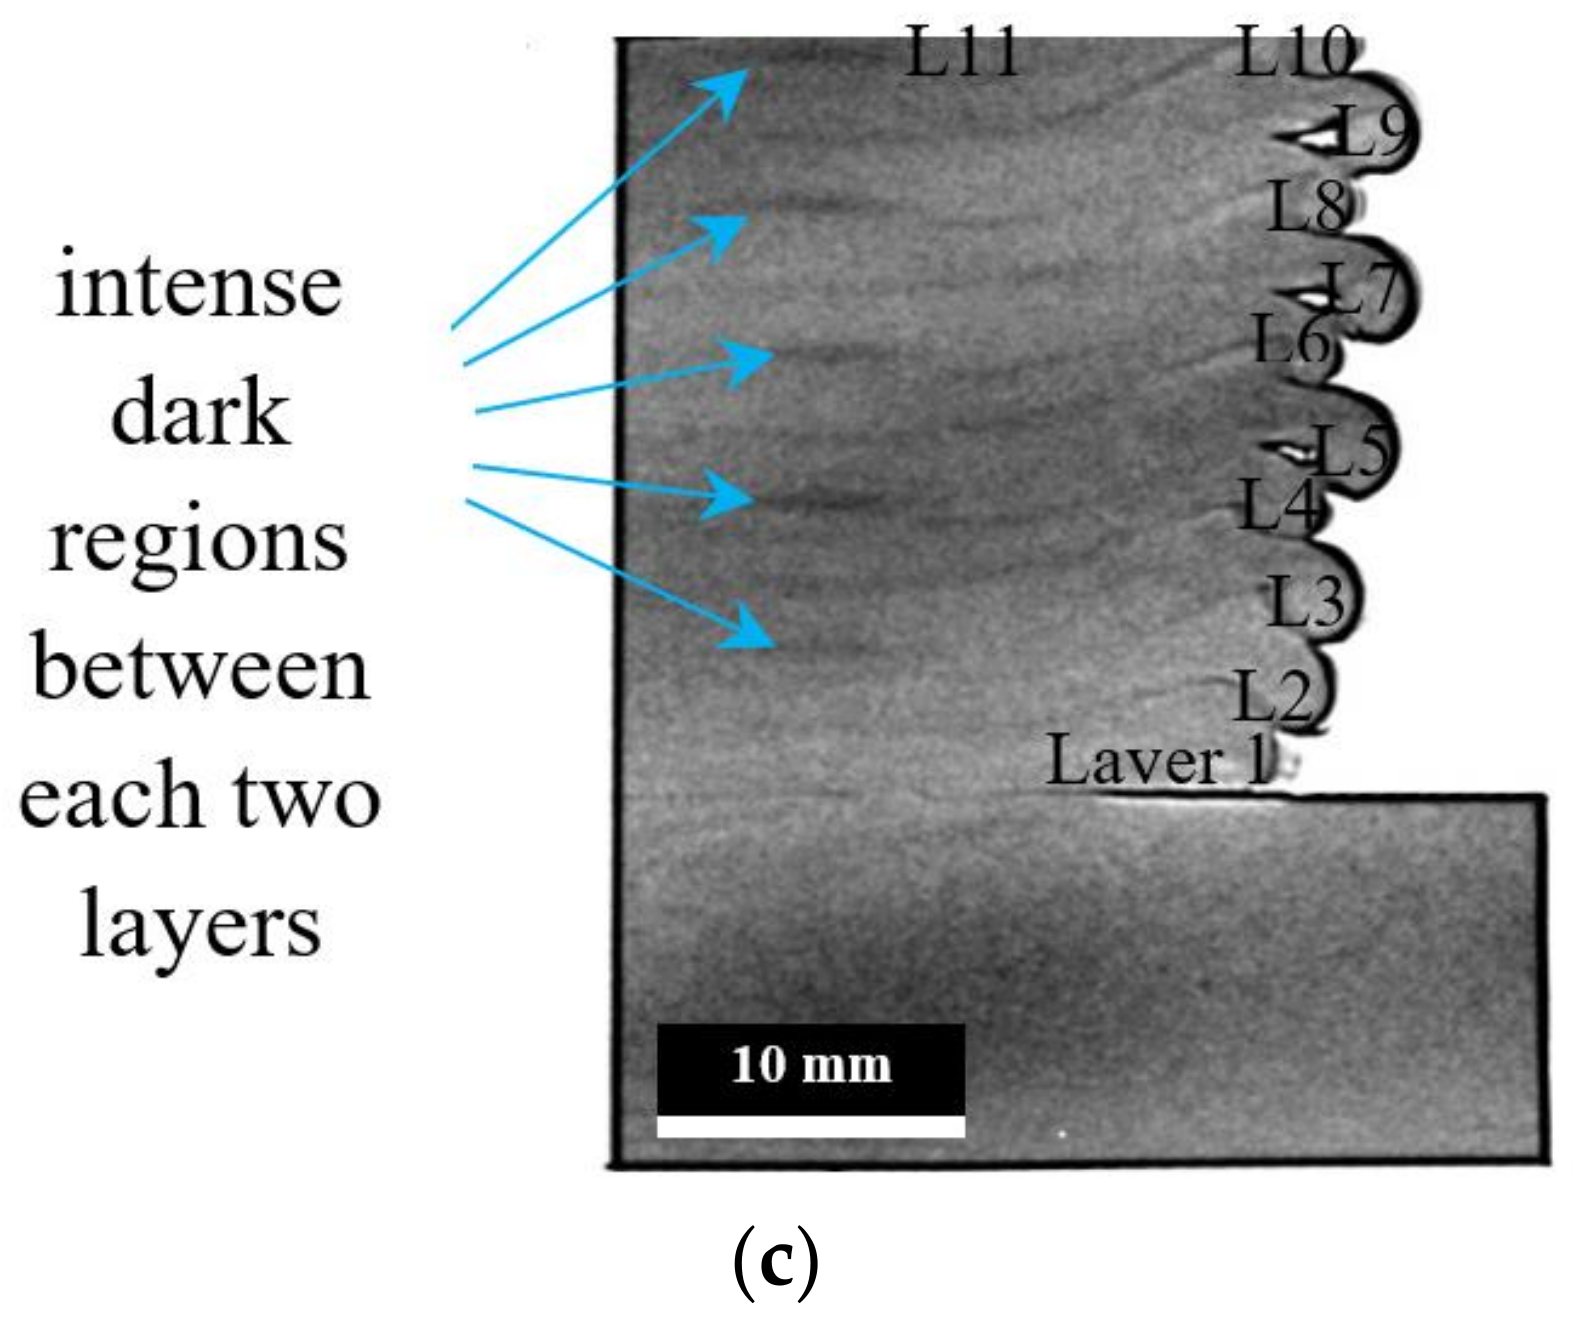
3.1. Ingot A: 10 mm Slab

The transmission image shows two separate sets of darker layers at the top of the print (Figure 6a). In transmission images, darker areas correspond to regions that neutrons could not easily get through (either absorbed or scattered) and the neutron flux attenuation is higher. Assuming that the process parameters were fixed throughout the process, one factor that could be different between the bottom and top layers is the feedstock rod preparation procedure. Since the dry graphite lubricant is manually sprayed on the feedstock rod by an operator, the thickness of the graphite layer can be different each time. However, we have not explored the metallurgical effects of the dry graphite lubricant in the deposited material and its impact on the transmission image so far. The bonding between the printed part and the substrate is incomplete in the flash region, as we expect, mainly because the substrate is at room temperature and the tool does not have contact with it in the flash region to warm it up and make a stronger bond.

3.2. Ingot B: 10 mm Slab

The layering structure is revealed in the transmission image, especially in the flash regions (Figure 6b). The visual inspection of the physical sample confirmed that the vertical line visible in the image is because of a surface defect on the sample as a result of the cutting operation and is not relevant to the internal features.

3.3. Ingot B: 20 mm Slab

The 3D nCT results for this sample are not presented due to the low signal-to-noise ratio. However, in the 2D transmission image, the interlayer regions are more noticeable (Figure 6c). The intensity of dark areas shows two periodic patterns. For each layer, a faint dark line is visible in the interlayer region. More interestingly, the dark regions get more intense (darker) between each two layers (especially under the tool). Since the slabs are cut from one end of the original ingot, the temperature of the layer underneath can be different depending on the spindle transverse direction and its position related to the entire part. In Figure 6c, the dark regions are denoted with arrows. More specifically, these regions are located between Layers 2 and 3, Layers 4 and 5, Layers 6 and 7, Layers 8 and 9, and Layers 10 and 11.
The general overview of layer deposition using AFS-D is illustrated in Figure 7. At the beginning, the spindle deposits a hot layer of material on the cold substrate. In all of our experiments, layers were deposited in a continuous back-and-forth manner. Therefore, once the first layer is deposited, it takes a while for the spindle to come back to the same location and deposit the next layer. This delay gives the previous deposited layer some time to cool down. In this case, a hot-on-cold layer deposition will occur (Figure 7a). The longer the block, the colder the bottom layer will be with the same traverse speed. This temperature difference becomes even larger when the process stops for reloading the feedstock magazine. Subsequently, when the spindle returns, there is not enough time for the previous layer to cool down right at the beginning and the beginning of the return course will be a hot-on-hot layer deposition (Figure 7b). This phenomenon could be one possible explanation for seeing alternating intense dark regions for each two layers in the transmission image.
Another possibility is the lubricant being trapped between the layers. Commercial dry graphite lubricants contain acetone (propanone: C3H6O), hydrocarbon propellant (LPG: C3H8), dimethyl carbonate (C3H6O3), and graphite powder (C) [31]. Despite the commercial name, only 1–5% of the lubricant weight is graphite powder and the rest is hydrocarbon-based compounds. Visual inspections of the lubricant being sprayed on the feedstock rod show that the liquid solvent evaporates when sprayed on a non-absorbent surface, leaving a dark graphite layer on the surface. The evaporation process will occur even faster at elevated temperatures. In the back-and-forth deposition process, some of the hydrocarbon-based content will evaporate before the deposition of the next layer. However, the immediate deposition of the next layer may decrease the time needed for evaporation and entrap the lubricant between the layers. This phenomenon can be vividly detected in the neutron transmission image due to hydrogen’s large cross-section in neutron beams.
Moreover, these intense dark areas exist only under the spindle protrusion structures, which underpins the temperature effect assumption even further. The transmission images taken from the internal rods also support this finding (Figure 8). The dark regions are more visible in rod N3, which is under the spindle protrusion structures.
Comparing Figure 8 and Figure 9a, it can be stated that both bar N3 from ingot B and the Group II tensile test specimen are under the tool protrusion areas and their location relative to the tool is almost the same. The same statement can be repeated for bar N2 and the Group I tensile test specimen. Based on the stress–strain curves shown in Figure 9b, dog bone samples from the flash region (Group III) show the lowest strain-to-failure value, which is in correlation with the presence of dark regions between the deposited layers. The considerable drop in the strain-to-failure value in the Group III region could be a result of being flashed out of underneath the tool and consequently the lack of vertical compressive force during deposition and weak interlayer bonding.
According to Figure 9a, the Group I region is exactly under the spindle axis of rotation and the Group II region is under the protrusion tools. The intense dark regions visible in Figure 6c and Figure 8 are mostly distributed in Group II regions. The mechanical tensile testing results shown in Figure 9b suggests that the dark areas contribute to the lower strain-to-failure values of the regions underneath the protrusions. In particular, the average strain-to-failure value for area II has dropped from 0.31 to 0.26, which indicates a 14% decrease from the central region (area I).
Figure 10 shows the morphology of fracture surfaces after tensile tests for the samples from Groups I, II and III. A larger fracture surface area reduction is observed for the Group I and Group II samples than that in the Group III counterparts (Figure 10a–c), which is in good accordance with the engineering stress–strain curves shown in Figure 9b. The tensile test dog-bone samples from Groups I and II underwent clear necking processes (tensile stress dropping before fracture in Figure 9b), indicating good ductility. However, for Group III samples, the stress–strain curves mainly rose before fracture, which indicates that the samples mainly underwent the strain-hardening process without going deep into the necking process. To gain a better understanding of the tensile behaviors, facture surface morphologies with higher magnification were evaluated, displayed in Figure 10d–f. Compared with the obvious dimple structures observed in the Group I and II samples, the dimples on the facture surfaces of the Group III samples are significantly smaller and their depths are clearly shallower, indicating inferior ductility. With close observation, the dimple structures on the Group I sample fracture surface are slightly larger and deeper than those on the Group II samples, which corresponds to the slightly better ductility for Group I samples shown in Figure 9b.

4. Conclusions

In this paper, neutron imaging is used for the nondestructive evaluation of large Al 6061 samples fabricated using Additive Friction Stir Deposition, commercially known as the MELD process. The following items summarize the outcome of this paper:
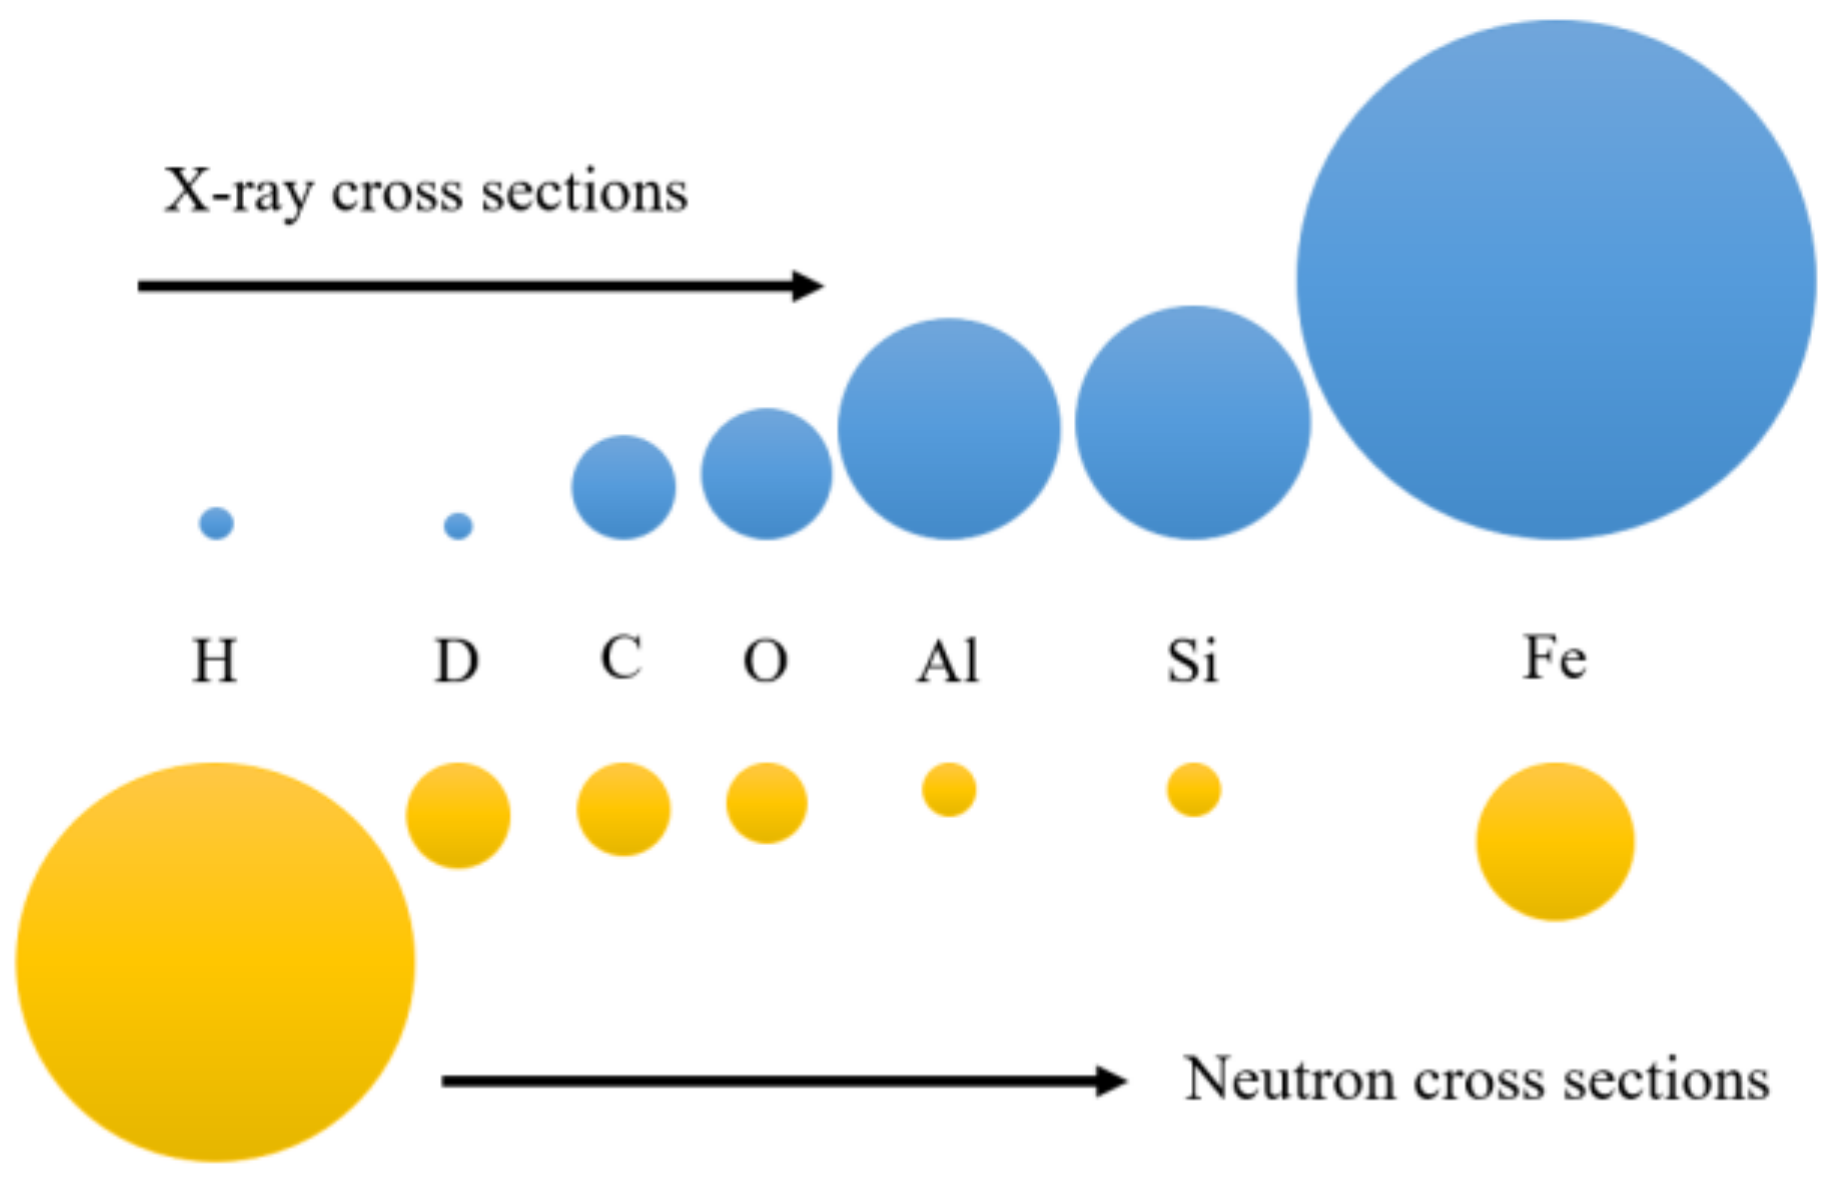
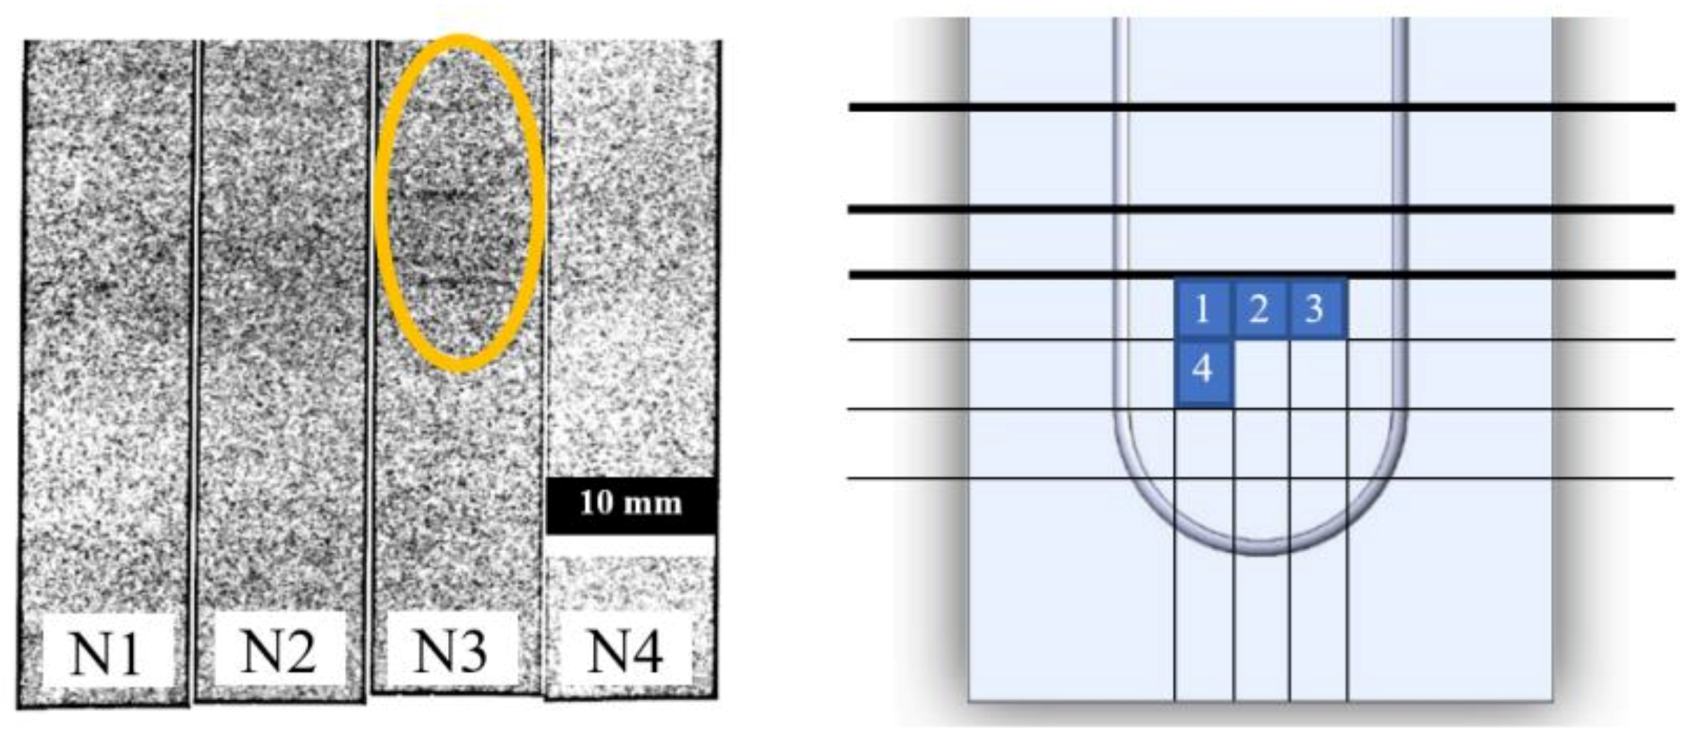
  • The neutron beam proves to be effective in revealing the layering structure due to its high penetration range into aluminum, with 80% total transmission in a 20 mm slab.
  • Signs of hydrogen contamination are observed in the fabricated part, which are most likely due to the hydrocarbon-based lubricant used during the deposition process.
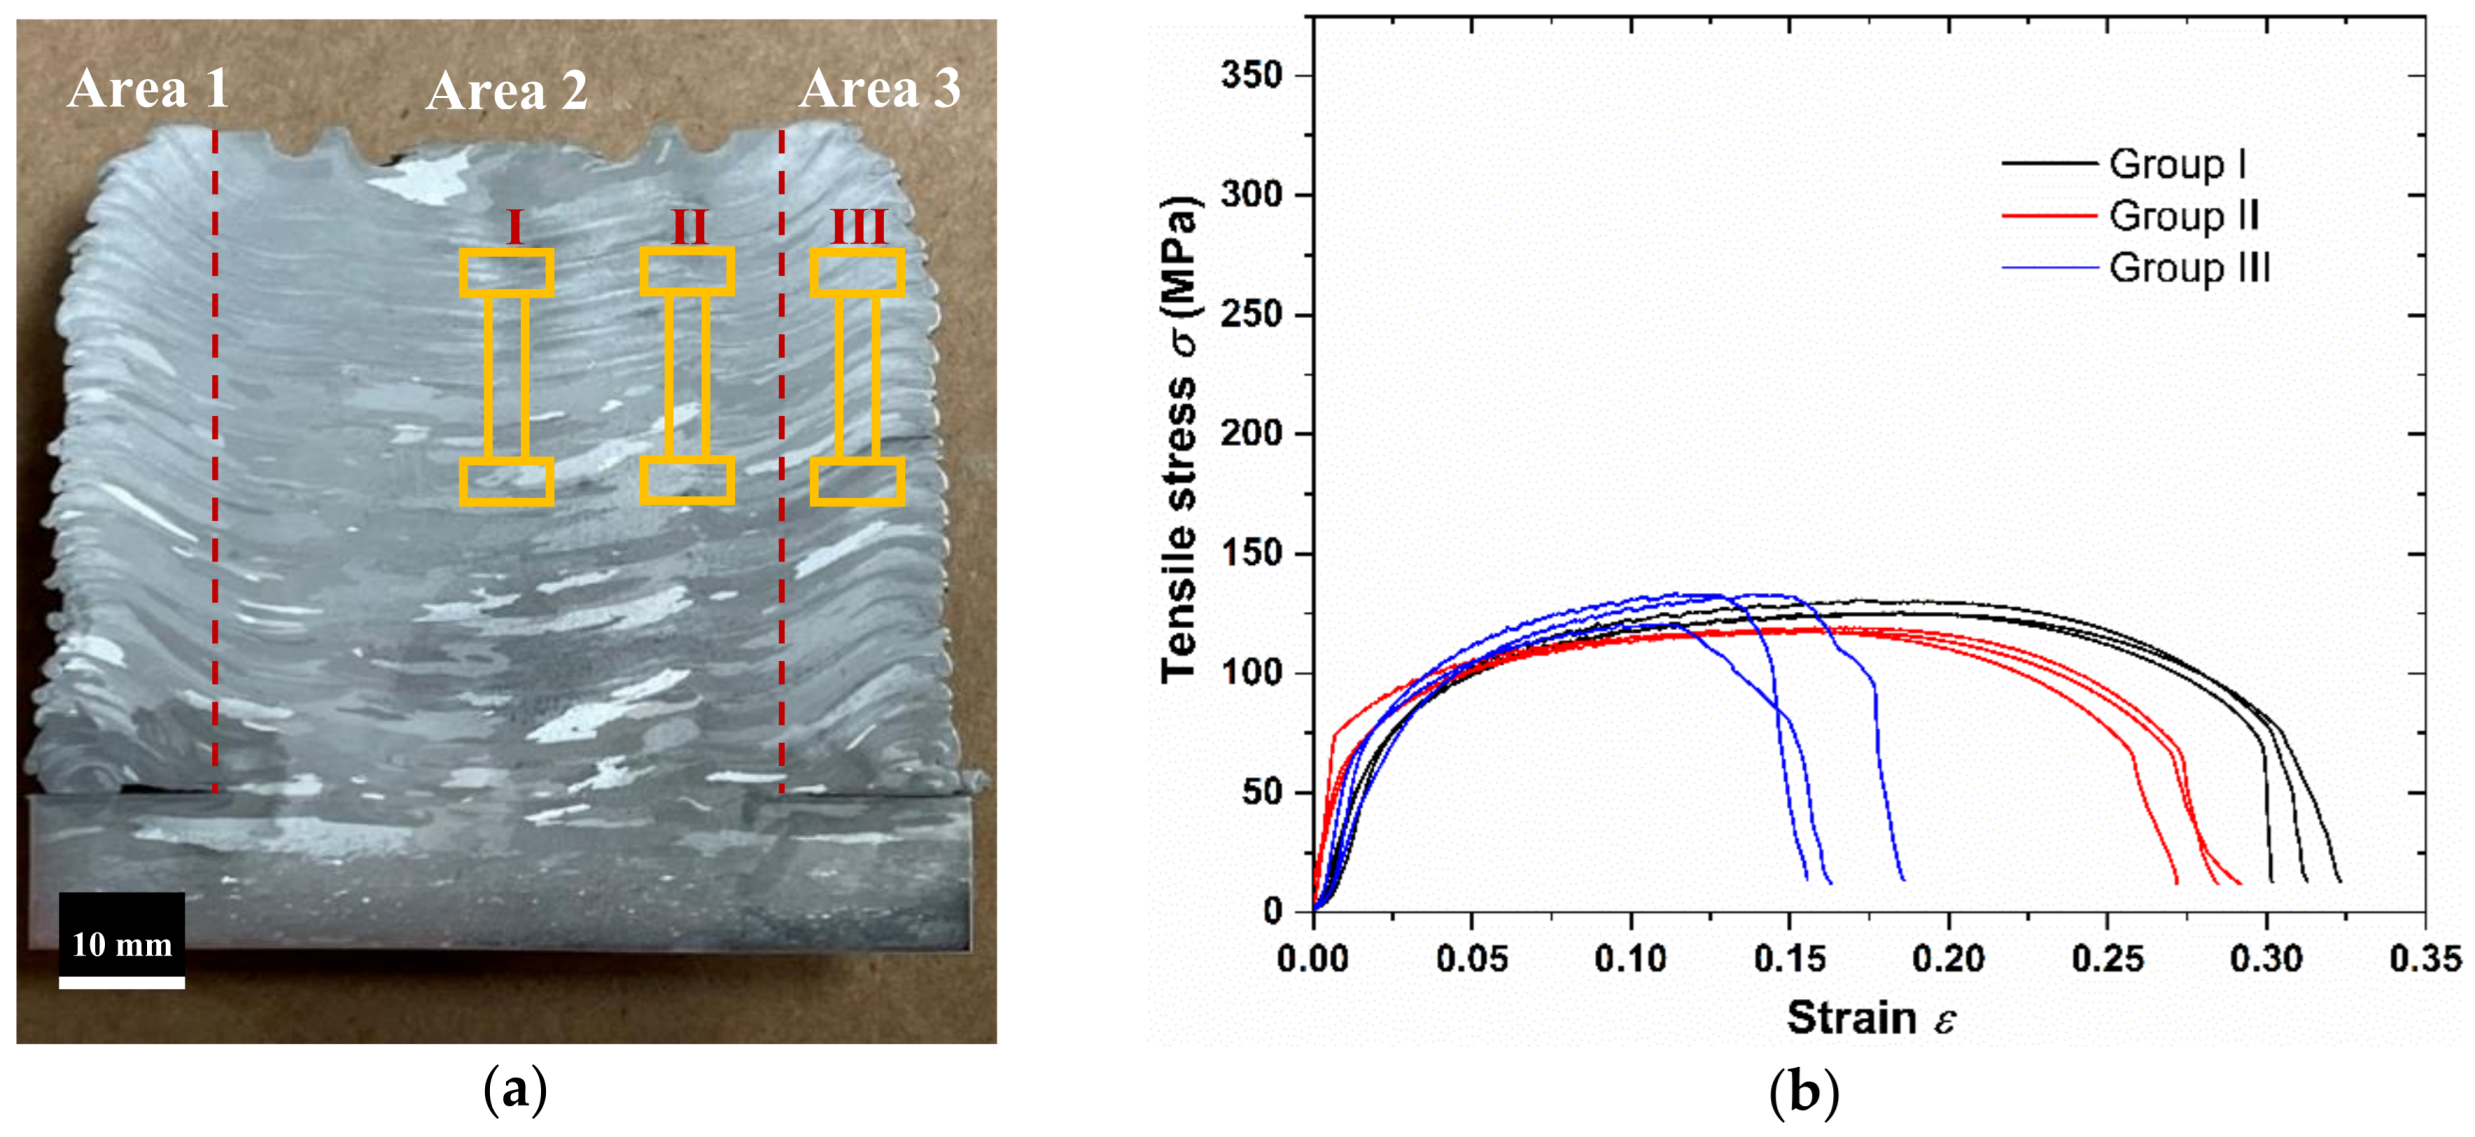
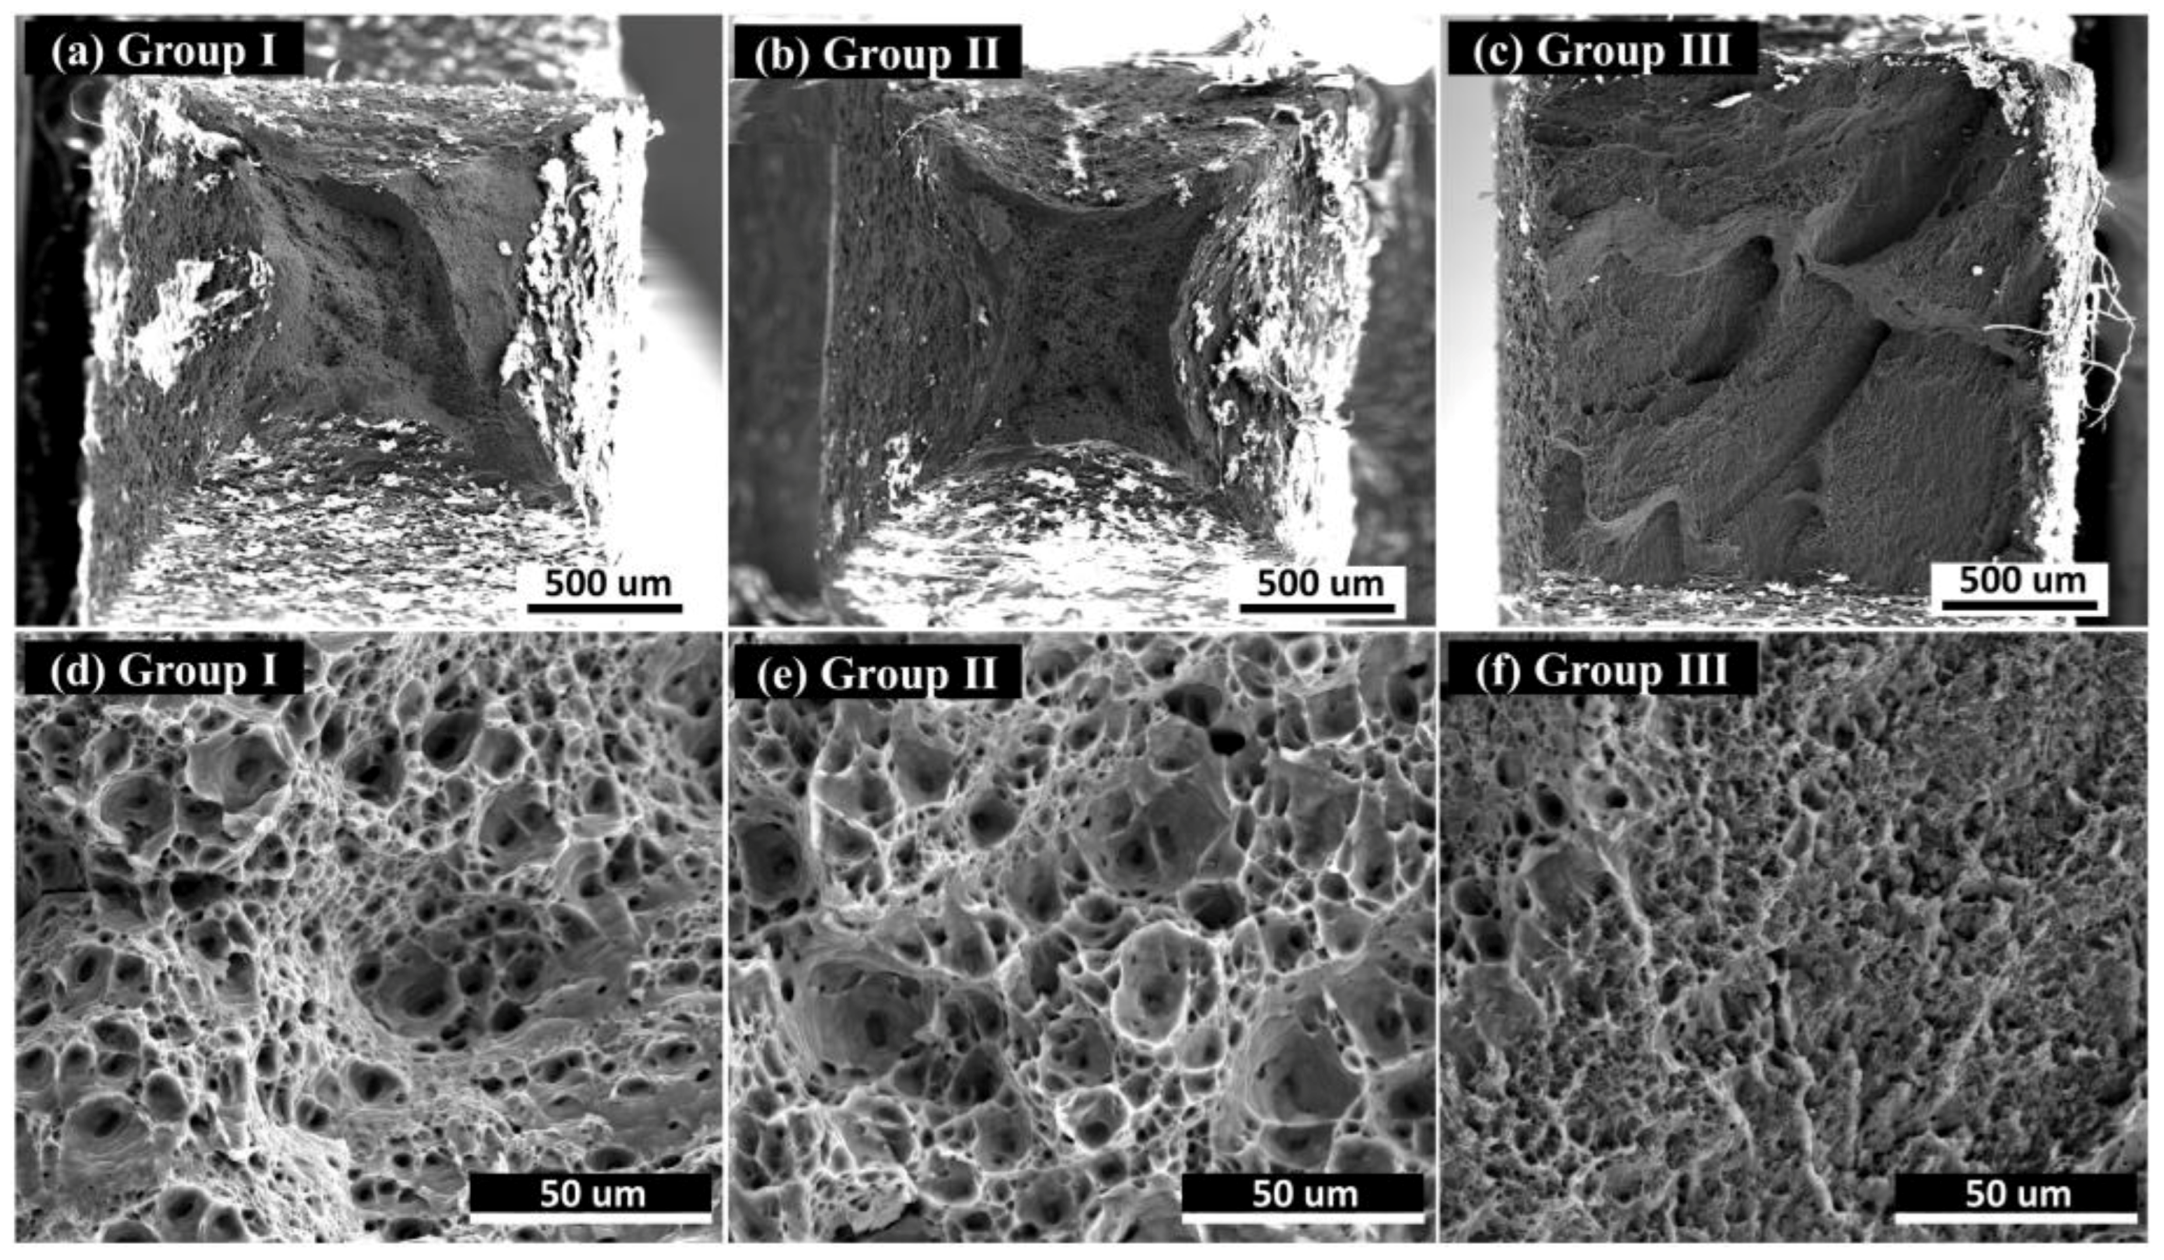
  • These contaminations correlate with the mechanical properties of the as-fabricated part and the areas with higher contamination density show a 14% lower strain-to-failure value in tensile testing experiments.
  • The nature of the contamination and its relationship to the feedstock preparation procedure, processing parameters, and mechanical properties need to be further studied in the future.

Author Contributions

Conceptualization, S.N., L.G.B., C.Z. and S.G.; methodology, S.N., L.G.B., G.L.K. and K.H.; resources, L.G.B., G.L.K., H.G., S.E., Y.Z. and H.B.; data curation and formal analysis and validation, S.N., L.G.B., G.L.K. and K.H.; software, S.N., L.G.B. and K.H., investigation, S.N., L.G.B., G.L.K. and C.Z.; writing—original draft preparation, S.N.; writing—review and editing, L.G.B., G.L.K., K.H., C.Z., S.G. and Y.Z.; visualization, S.N., L.G.B. and K.H.; supervision, L.G.B., C.Z. and S.G.; project administration, L.G.B. and S.G.; funding acquisition, L.G.B. and S.G. All authors have read and agreed to the published version of the manuscript.

Funding

This work is supported by the U.S. National Science Foundation under grant number OIA-1946231 and the Louisiana Board of Regents for the Louisiana Materials Design Alliance (LAMDA). This research used resources at the High Flux Isotope Reactor, a DOE Office of Science User Facility operated by Oak Ridge National Laboratory.

Data Availability Statement

Not applicable.

Conflicts of Interest

The authors declare no conflict of interest.

References

  1. Thomas, W.M.; Nicholas, E.D.; Needham, J.C.; Murch, M.G.; Temple-Smith, P.; Dawes, C.J. Friction Weldin. U.S. Patent 5,460,317, 24 October 1995. [Google Scholar]
  2. Griffiths, R.J.; Perry, M.E.J.; Sietins, J.M.; Zhu, Y.; Hardwick, N.; Cox, C.D.; Rauch, H.A.; Yu, H.Z. A Perspective on Solid-State Additive Manufacturing of Aluminum Matrix Composites Using MELD. J. Mater. Eng. Perform. 2019, 28, 648–656. [Google Scholar] [CrossRef]
  3. Rivera, O.G.; Allison, P.G.; Brewer, L.N.; Rodriguez, O.L.; Jordon, J.B.; Liu, T.; Whittington, W.R.; Martens, R.L.; McClelland, Z.; Mason, C.J.T.; et al. Influence of texture and grain refinement on the mechanical behavior of AA2219 fabricated by high shear solid state material deposition. Mater. Sci. Eng. A 2018, 724, 547–558. [Google Scholar] [CrossRef]
  4. Phillips, B.J.; Avery, D.Z.; Liu, T.; Rodriguez, O.L.; Mason, C.J.T.; Jordon, J.B.; Brewer, L.N.; Allison, P.G. Microstructure-deformation relationship of additive friction stir-deposition Al–Mg–Si. Materialia 2019, 7, 100387. [Google Scholar] [CrossRef]
  5. Griffiths, R.J.; Petersen, D.T.; Garcia, D.; Yu, H.Z. Additive Friction Stir-Enabled Solid-State Additive Manufacturing for the Repair of 7075 Aluminum Alloy. Appl. Sci. 2019, 9, 3486. [Google Scholar] [CrossRef] [Green Version]
  6. Zeng, C.; Ghadimi, H.; Ding, H.; Nemati, S.; Garbie, A.; Raush, J.; Guo, S. Microstructure Evolution of Al6061 Alloy Made by Additive Friction Stir Deposition. Materials 2022, 15, 3676. [Google Scholar] [CrossRef] [PubMed]
  7. Avery, D.Z.; Phillips, B.J.; Mason, C.J.T.; Palermo, M.; Williams, M.B.; Cleek, C.; Rodriguez, O.L.; Allison, P.G.; Jordon, J.B. Influence of Grain Refinement and Microstructure on Fatigue Behavior for Solid-State Additively Manufactured Al-Zn-Mg-Cu Alloy. Metall. Mater. Trans. A 2020, 51, 2778–2795. [Google Scholar] [CrossRef]
  8. Rutherford, B.A.; Avery, D.Z.; Phillips, B.J.; Rao, H.; Doherty, K.J.; Allison, P.G.; Brewer, L.N.; Jordon, J.B. Effect of Thermomechanical Processing on Fatigue Behavior in Solid-State Additive Manufacturing of Al-Mg-Si Alloy. Metals 2020, 10, 947. [Google Scholar] [CrossRef]
  9. Martin, L.P.; Luccitti, A.; Walluk, M.R. Repair of aluminum 6061 plate by additive friction stir deposition. Int. J. Adv. Manuf. Technol. 2021, 118, 759–773. [Google Scholar] [CrossRef]
  10. Rivera, O.G.; Allison, P.G.; Jordon, J.B.; Rodriguez, O.L.; Brewer, L.N.; McClelland, Z.; Whittington, W.R.; Francis, D.; Su, J.; Martens, R.L.; et al. Microstructures and mechanical behavior of Inconel 625 fabricated by solid-state additive manufacturing. Mater. Sci. Eng. A 2017, 694, 1–9. [Google Scholar] [CrossRef]
  11. Avery, D.Z.; Rivera, O.G.; Mason, C.J.T.; Phillips, B.J.; Jordon, J.B.; Su, J.; Hardwick, N.; Allison, P.G. Fatigue Behavior of Solid-State Additive Manufactured Inconel 625. JOM 2018, 70, 2475–2484. [Google Scholar] [CrossRef]
  12. Agrawal, P.; Haridas, R.S.; Yadav, S.; Thapliyal, S.; Gaddam, S.; Verma, R.; Mishra, R.S. Processing-structure-property correlation in additive friction stir deposited Ti-6Al-4V alloy from recycled metal chips. Addit. Manuf. 2021, 47, 102259. [Google Scholar] [CrossRef]
  13. Williams, M.B.; Robinson, T.W.; Williamson, C.; Kinser, R.P.; Ashmore, N.A.; Allison, P.G.; Jordon, J.B. Elucidating the Effect of Additive Friction Stir Deposition on the Resulting Microstructure and Mechanical Properties of Magnesium Alloy WE43. Metals 2021, 11, 1739. [Google Scholar] [CrossRef]
  14. Griffiths, R.J.; Garcia, D.; Song, J.; Vasudevan, V.K.; Steiner, M.A.; Cai, W.; Yu, H.Z. Solid-state additive manufacturing of aluminum and copper using additive friction stir deposition: Process-microstructure linkages. Materialia 2021, 15, 100967. [Google Scholar] [CrossRef]
  15. Priedeman, J.L.; Phillips, B.J.; Lopez, J.J.; Tucker Roper, B.E.; Hornbuckle, B.C.; Darling, K.A.; Jordon, J.B.; Allison, P.G.; Thompson, G.B. Microstructure Development in Additive Friction Stir-Deposited Cu. Metals 2020, 10, 1538. [Google Scholar] [CrossRef]
  16. Chou, K.; Eff, M.; Cox, C.; Saukas, C.; Carroll, J.W. Optical image and Vickers hardness dataset for repair of 1080 steel using additive friction stir deposition of Aermet 100. Data Brief 2022, 41, 107862. [Google Scholar] [CrossRef]
  17. Gotawala, N.; Mishra, N.K.; Shrivastava, A. Microstructure Evolution and Mechanical Properties of Friction Stir Metal Deposited SS304. In TMS 2022 151st Annual Meeting & Exhibition Supplemental Proceedings; The Minerals, Metals & Materials Series; Springer: Cham, Switzerland, 2022; pp. 269–278. [Google Scholar] [CrossRef]
  18. Jordon, J.B.; Allison, P.G.; Phillips, B.J.; Avery, D.Z.; Kinser, R.P.; Brewer, L.N.; Cox, C.; Doherty, K.J. Direct recycling of machine chips through a novel solid-state additive manufacturing process. Mater. Des. 2020, 193, 108850. [Google Scholar] [CrossRef]
  19. Merritt, G.R.; Williams, M.B.; Allison, P.G.; Jordon, J.B.; Rushing, T.W.; Cousin, C.A. Closed-Loop Temperature and Force Control of Additive Friction Stir Deposition. J. Manuf. Mater. Process. 2022, 6, 92. [Google Scholar] [CrossRef]
  20. Garcia, D.; Hartley, W.D.; Rauch, H.A.; Griffiths, R.J.; Wang, R.; Kong, Z.J.; Zhu, Y.; Yu, H.Z. In situ investigation into temperature evolution and heat generation during additive friction stir deposition: A comparative study of Cu and Al-Mg-Si. Addit. Manuf. 2020, 34, 101386. [Google Scholar] [CrossRef]
  21. Stubblefield, G.G.; Fraser, K.; Phillips, B.J.; Jordon, J.B.; Allison, P.G. A meshfree computational framework for the numerical simulation of the solid-state additive manufacturing process, additive friction stir-deposition (AFS-D). Mater. Des. 2021, 202, 109514. [Google Scholar] [CrossRef]
  22. Mason, C.J.T.; Rodriguez, R.I.; Avery, D.Z.; Phillips, B.J.; Bernarding, B.P.; Williams, M.B.; Cobbs, S.D.; Jordon, J.B.; Allison, P.G. Process-structure-property relations for as-deposited solid-state additively manufactured high-strength aluminum alloy. Addit. Manuf. 2021, 40, 101879. [Google Scholar] [CrossRef]
  23. Perry, M.E.J.; Griffiths, R.J.; Garcia, D.; Sietins, J.M.; Zhu, Y.; Yu, H.Z. Morphological and microstructural investigation of the non-planar interface formed in solid-state metal additive manufacturing by additive friction stir deposition. Addit. Manuf. 2020, 35, 101293. [Google Scholar] [CrossRef]
  24. Perry, M.E.J.; Rauch, H.A.; Griffiths, R.J.; Garcia, D.; Sietins, J.M.; Zhu, Y.; Zhu, Y.; Yu, H.Z. Tracing plastic deformation path and concurrent grain refinement during additive friction stir deposition. Materialia 2021, 18, 101159. [Google Scholar] [CrossRef]
  25. Anderson, I.S.; Mcgreevy, R.L.; Bilheux, H.Z. Neutron Imaging and Applications: A Reference for the Imaging Community; Springer: New York, NY, USA, 2019. [Google Scholar]
  26. High Flux Isotope Reactor. Available online: https://neutrons.ornl.gov/hfir (accessed on 14 January 2023).
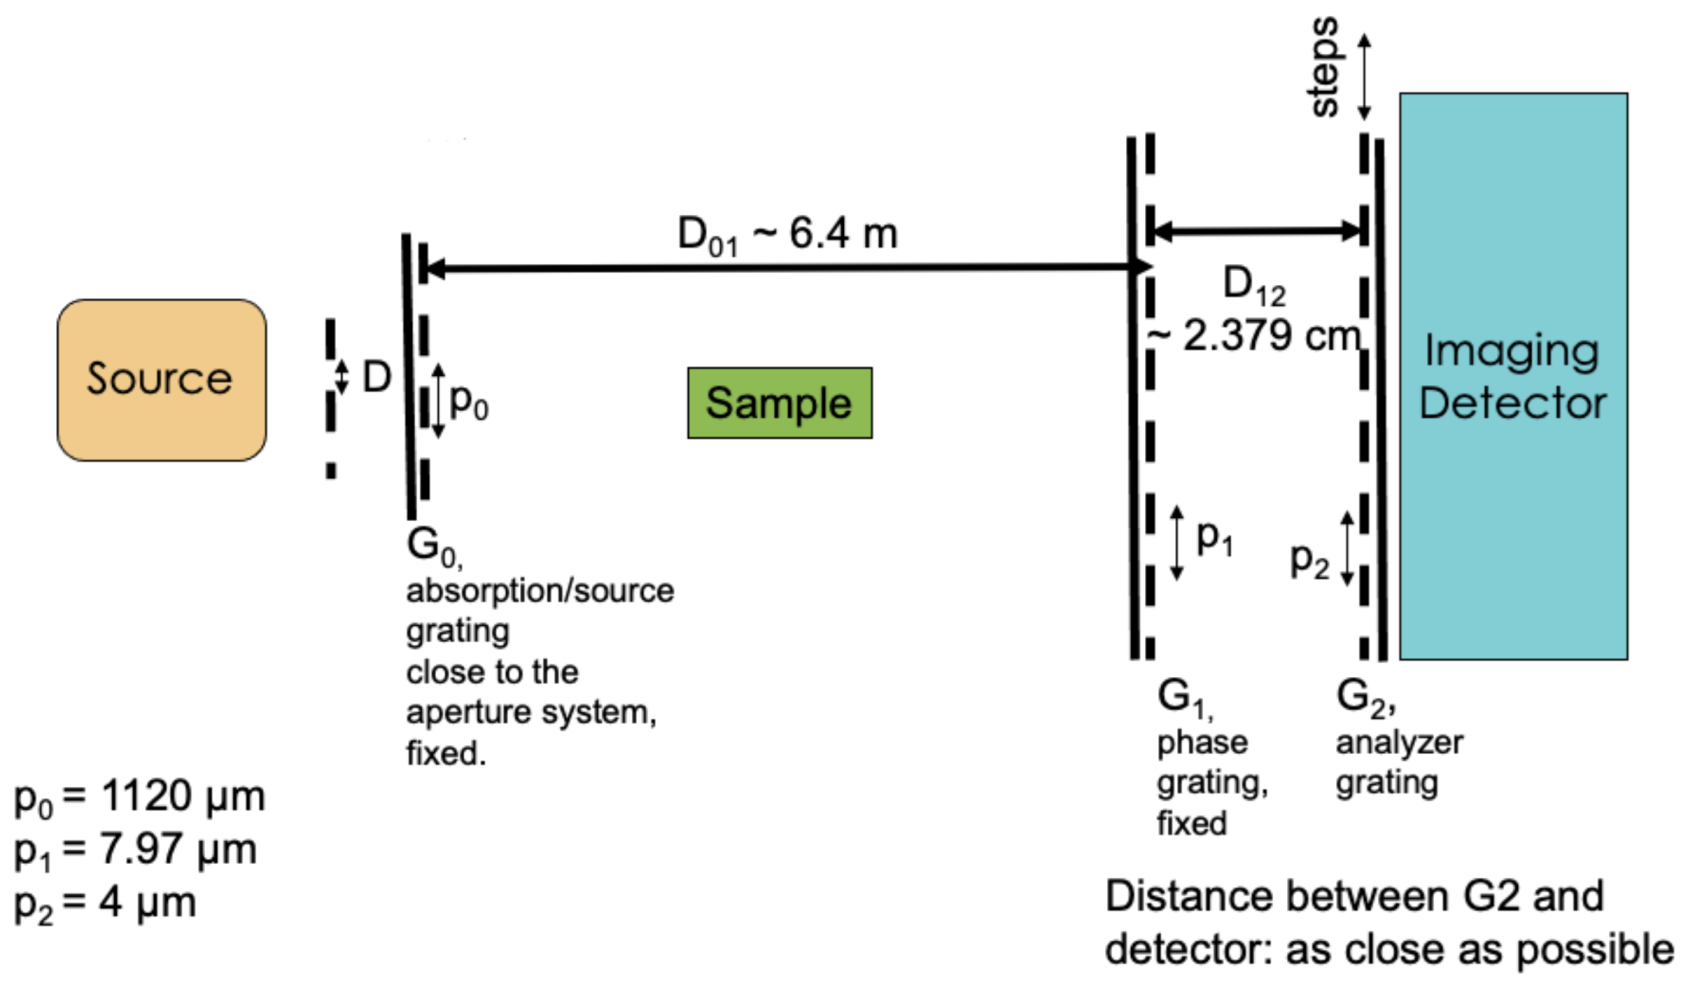
  27. Pfeiffer, F.; Bech, M.; Bunk, O.; Kraft, P.; Eikenberry, E.F.; Brönnimann, C.; Grünzweig, C.; David, C. Hard-X-ray dark-field imaging using a grating interferometer. Nature Materials 2008, 7, 134–137. [Google Scholar] [CrossRef] [PubMed]
  28. Dry Graphite Dry-Film Lubricant. Available online: https://zep.com/products/dry-graphite-lubricant-aerosol-16401 (accessed on 14 January 2023).
  29. Neutron Activation and Scattering Calculator. Available online: https://www.ncnr.nist.gov/resources/activation/ (accessed on 14 January 2023).
  30. NEUtron Imaging Toolbox (NEUIT). Available online: https://neuit.ornl.gov/transmission (accessed on 14 January 2023).
  31. Aervoe. Available online: https://www.aervoe.com/product/dry-graphite-lubricant/ (accessed on 14 January 2023).
Figure 1. Trend of X-ray and neutron cross-section from lighter to heavier atoms [25].
Metals 13 00188 g001
Figure 2. Schematic figure of feedstock rod and deposition plane; the feedstock (in our case, a 20-inch-long bar with 3/8-inch by 3/8-inch cross section) is pushed to the tool with a linear actuator. As the tool moves in traverse direction, it deposits the softened metal layer by layer. The integrity, width, and thickness of the deposited layer are dominated by the processing parameters.
Metals 13 00188 g002
Figure 3. (a) Schematic figure of the stadium-shaped blocks made by MELD method; (b) Wire EDM cutting lines on the original block; (c) Cutting layout of samples; left: sample A, right: sample B; The cross-section of each numbered bar shown is 10 mm by 10 mm; (d) The 20 mm slab from Sample B is cut in half and one of the halves is polished to improve the quality of the neutron interferometry imaging for detecting internal neutron dark-field (scattering) features. The thickness of the build plate is ½ inch.
Metals 13 00188 g003
Figure 4. Neutron interferometer dimensions at ORNL HFIR CG-1D beamline (courtesy of Dr. Hassina Bilheux, ORNL Neutron Sciences Directorate).
Metals 13 00188 g004
Figure 5. Samples mounted on holders in front of the neutron beam; (a) 10 mm slab from ingot A for 2D imaging; (b) 20 mm slab (polished half) from ingot B for 3D imaging; (c) N1, N2, N3, and N4 bars from ingot B.
Metals 13 00188 g005
Figure 6. Interferometry transmission images: (a) 10 mm slab from ingot A; (b) 10 mm slab from ingot B. The vertical feature is the result of surface roughness, not internal defects. Encircled area shows the layering structure; (c) 20 mm slab from ingot B (polished half). The interlayer regions are clearly visible in this image and shown with arrows. This snapshot shows 11 deposited layers, denoted on the image (Layer 1, L2, … L11).
Metals 13 00188 g006aMetals 13 00188 g006b
Figure 7. Layer deposition schematic figure: (a) hot-on-cold deposition, (b) hot-on-hot deposition.
Metals 13 00188 g007
Figure 8. Transmission image of internal rods (ingot B); intense dark regions between every two layers are encircled.
Metals 13 00188 g008
Figure 9. Tensile testing results of a slab from ingot A [6]. (a) position of the dog bone samples in the slab: Group I is in the middle, Group II is under the tool protrusion, and Group III is in the flash region. The gauge cross section of the specimen is 2 mm by 2 mm. (b) Stress–strain curve of each Group.
Metals 13 00188 g009
Figure 10. The SEM images showing the fracture surface morphology of dog-bone samples after tensile tests. (a,d) Group I, (b,e) Group II, (c,f) Group III.
Metals 13 00188 g010
Table 1. Process parameters of MELD samples.
ParameterIngot AIngot B
Spindle speed (RPM)300400
Spindle transverse speed (mm/min)254152.4
Feedstock rate (mm/min)152.4228.6
Layer thickness (mm)12.5
Table 2. Experiments conducted on each specimen.
IngotSpecimen2D Transmission Image2D Dark-Field Image2D Differential Phase Contrast3D Computed Tomography
A10 mm slab
B20 mm slab (polished half)
20 mm slab (unpolished half)
10 mm slab
N1, N2, N3, N4
Table 3. Specifications of HFIR CG-1D beamline at ORNL for these experiments.
Interferometer2.6 Å, 12 to 18 grating steps
Effective pixel size at sample42 µm
L/D600
Exposure time (2D)5 × 60 s (z-filter)
Disclaimer/Publisher’s Note: The statements, opinions and data contained in all publications are solely those of the individual author(s) and contributor(s) and not of MDPI and/or the editor(s). MDPI and/or the editor(s) disclaim responsibility for any injury to people or property resulting from any ideas, methods, instructions or products referred to in the content.

