
Regularities of Changes in the Structure of Different Phases of Deformed Zirconium Alloys as a Result of Raising the Annealing Temperature According to Texture Analysis Data
 ,
, 
Abstract
:1. Introduction
2. Materials and Methods
3. Results
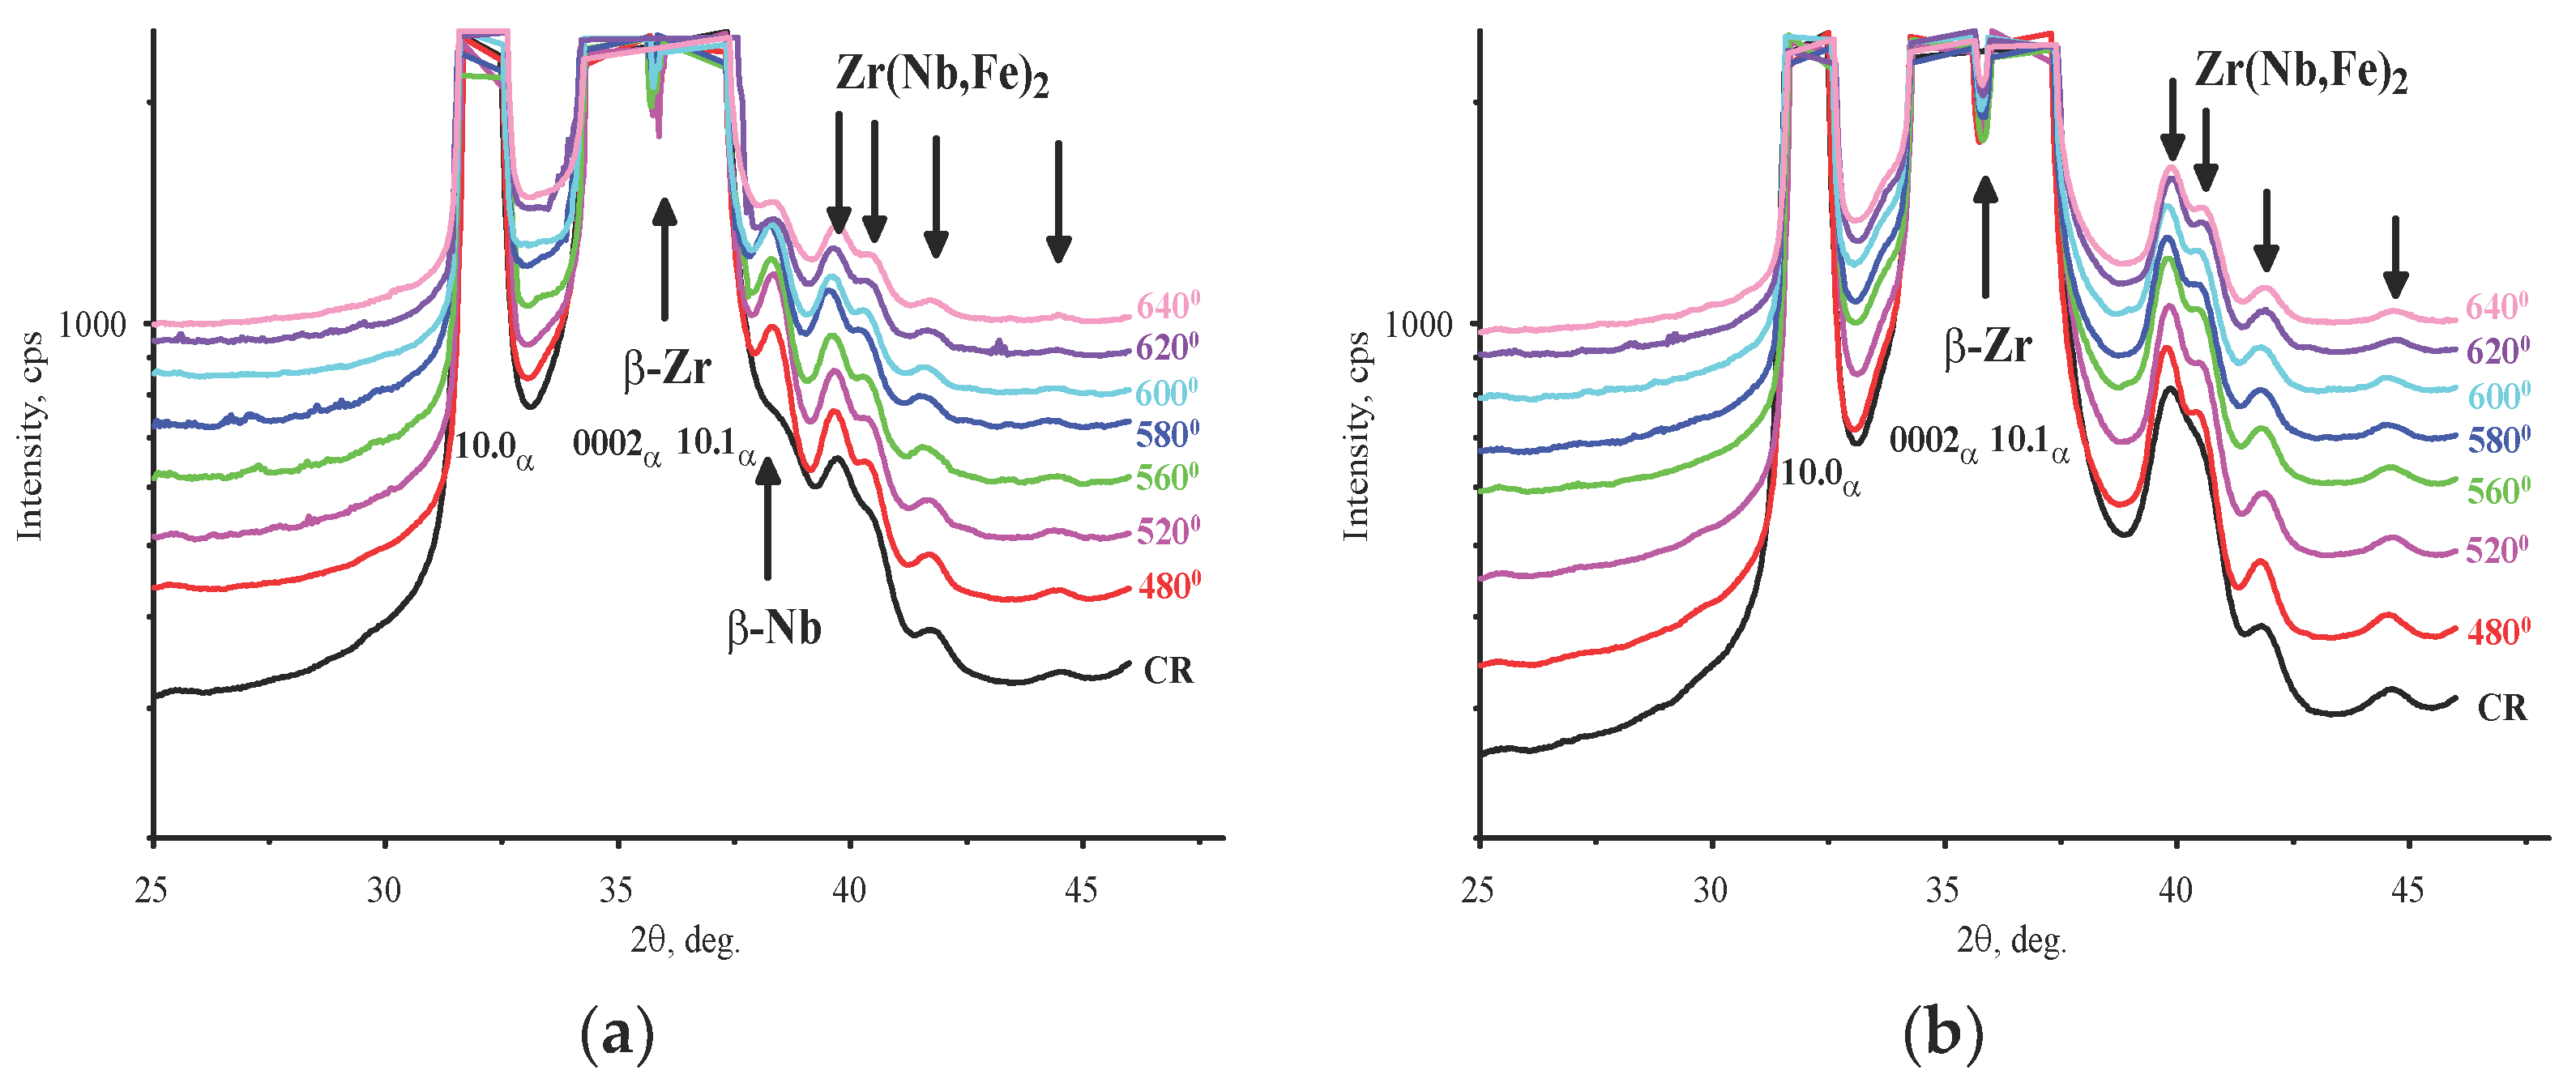
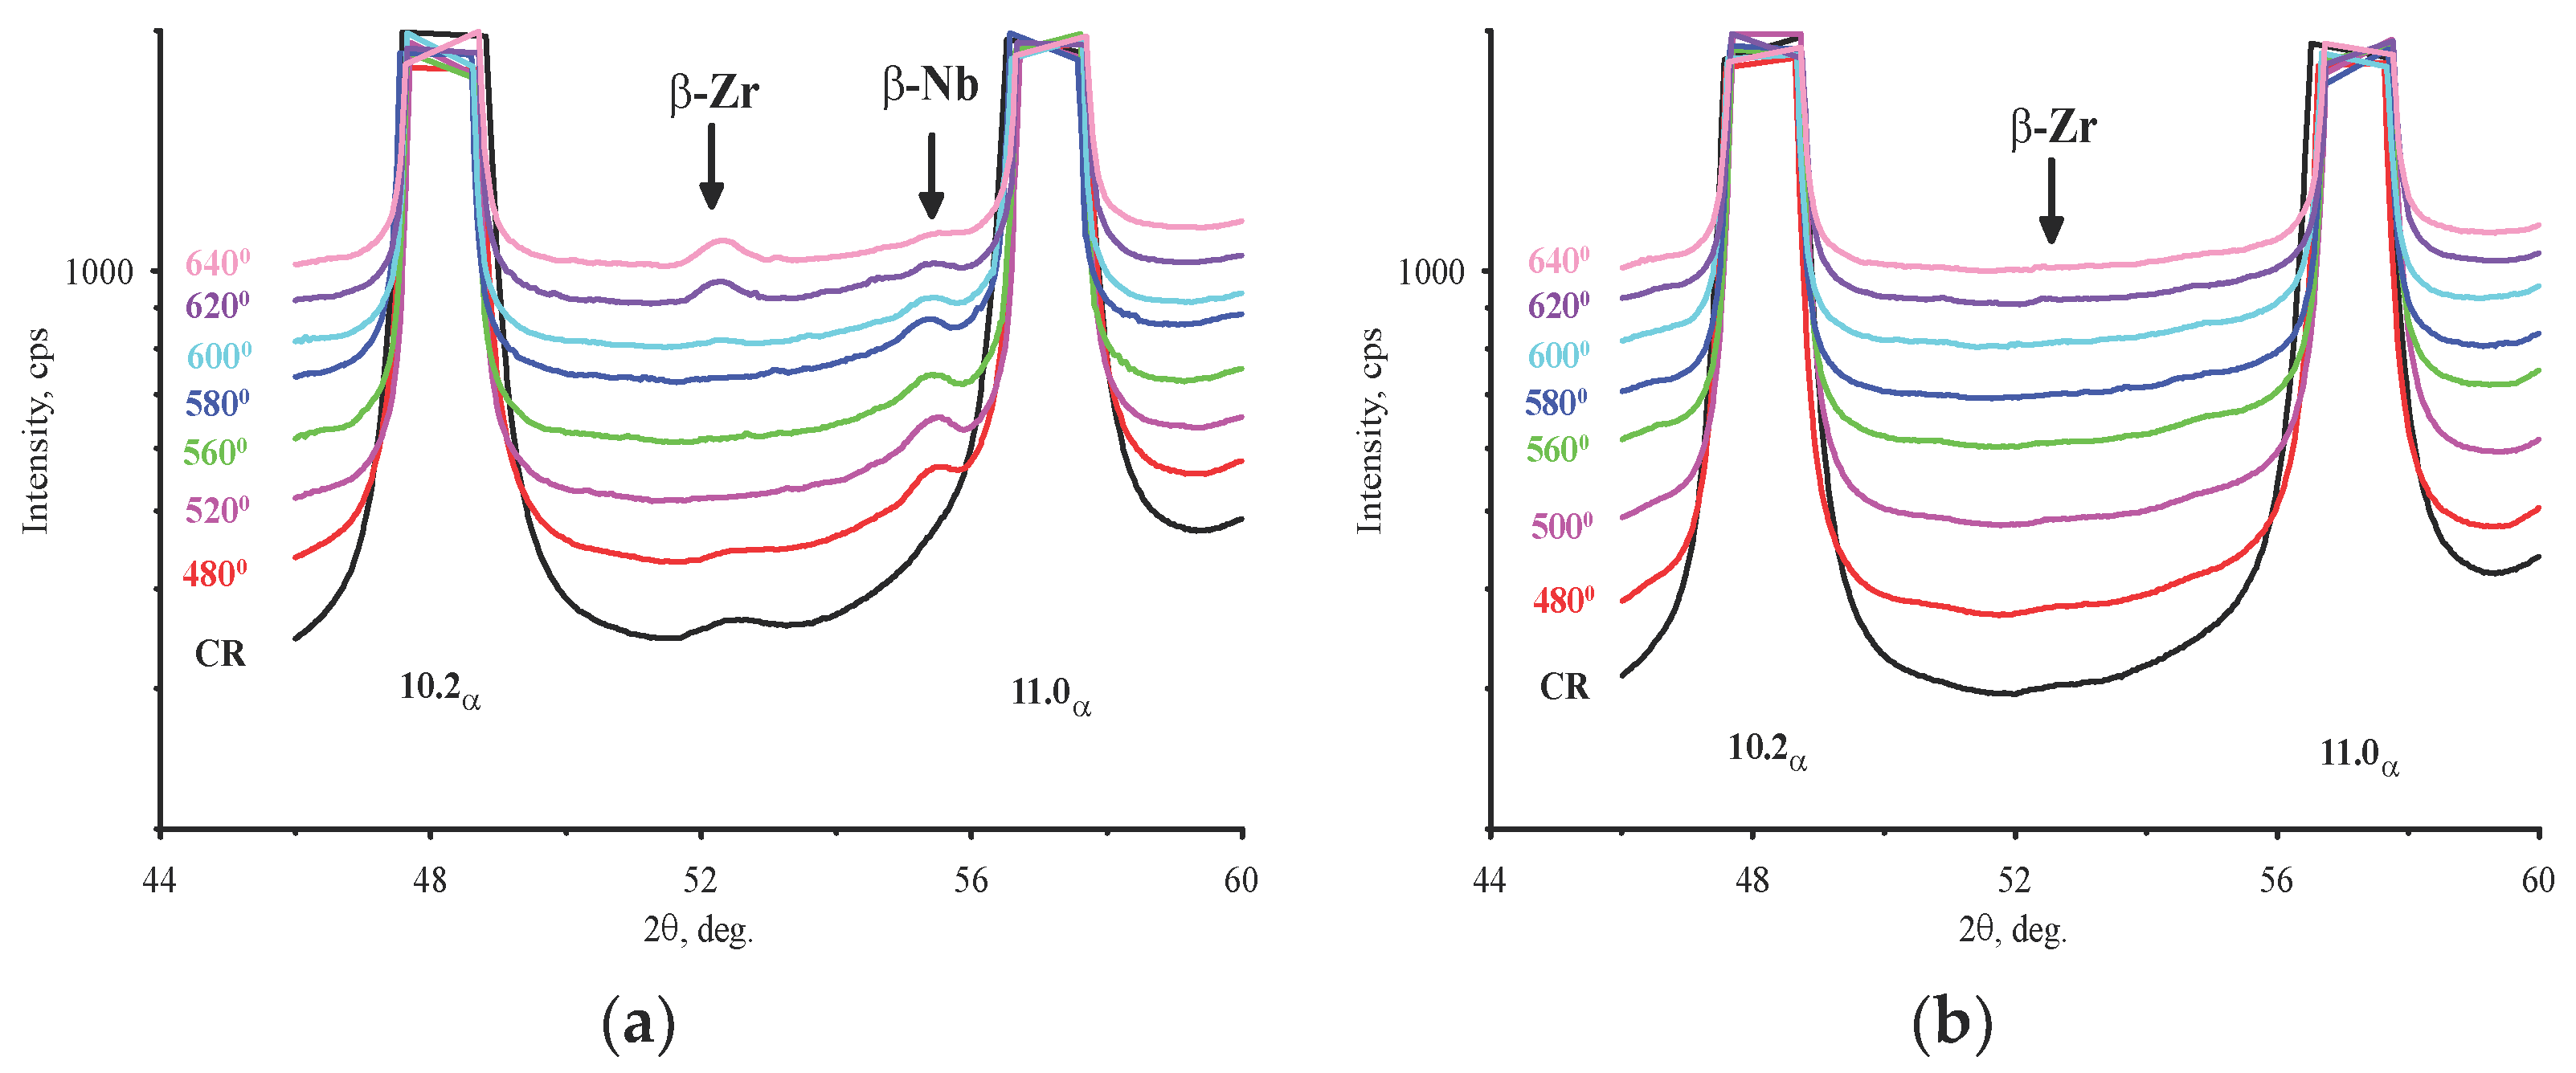
3.1. Phase Analysis
3.2. Texture Analysis
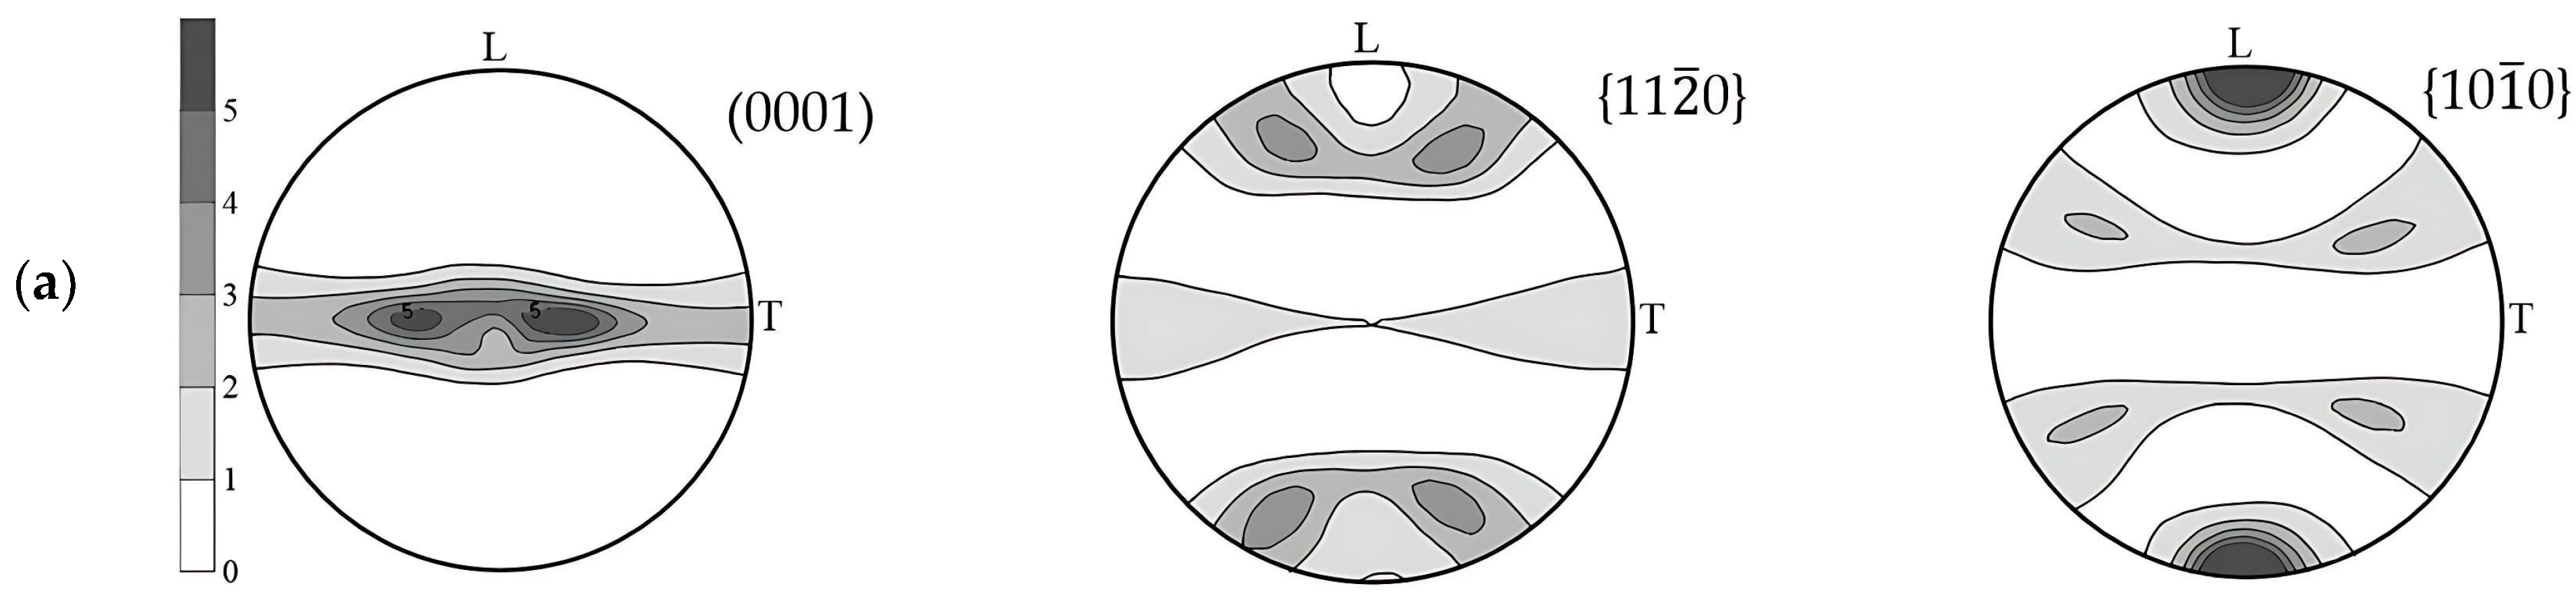
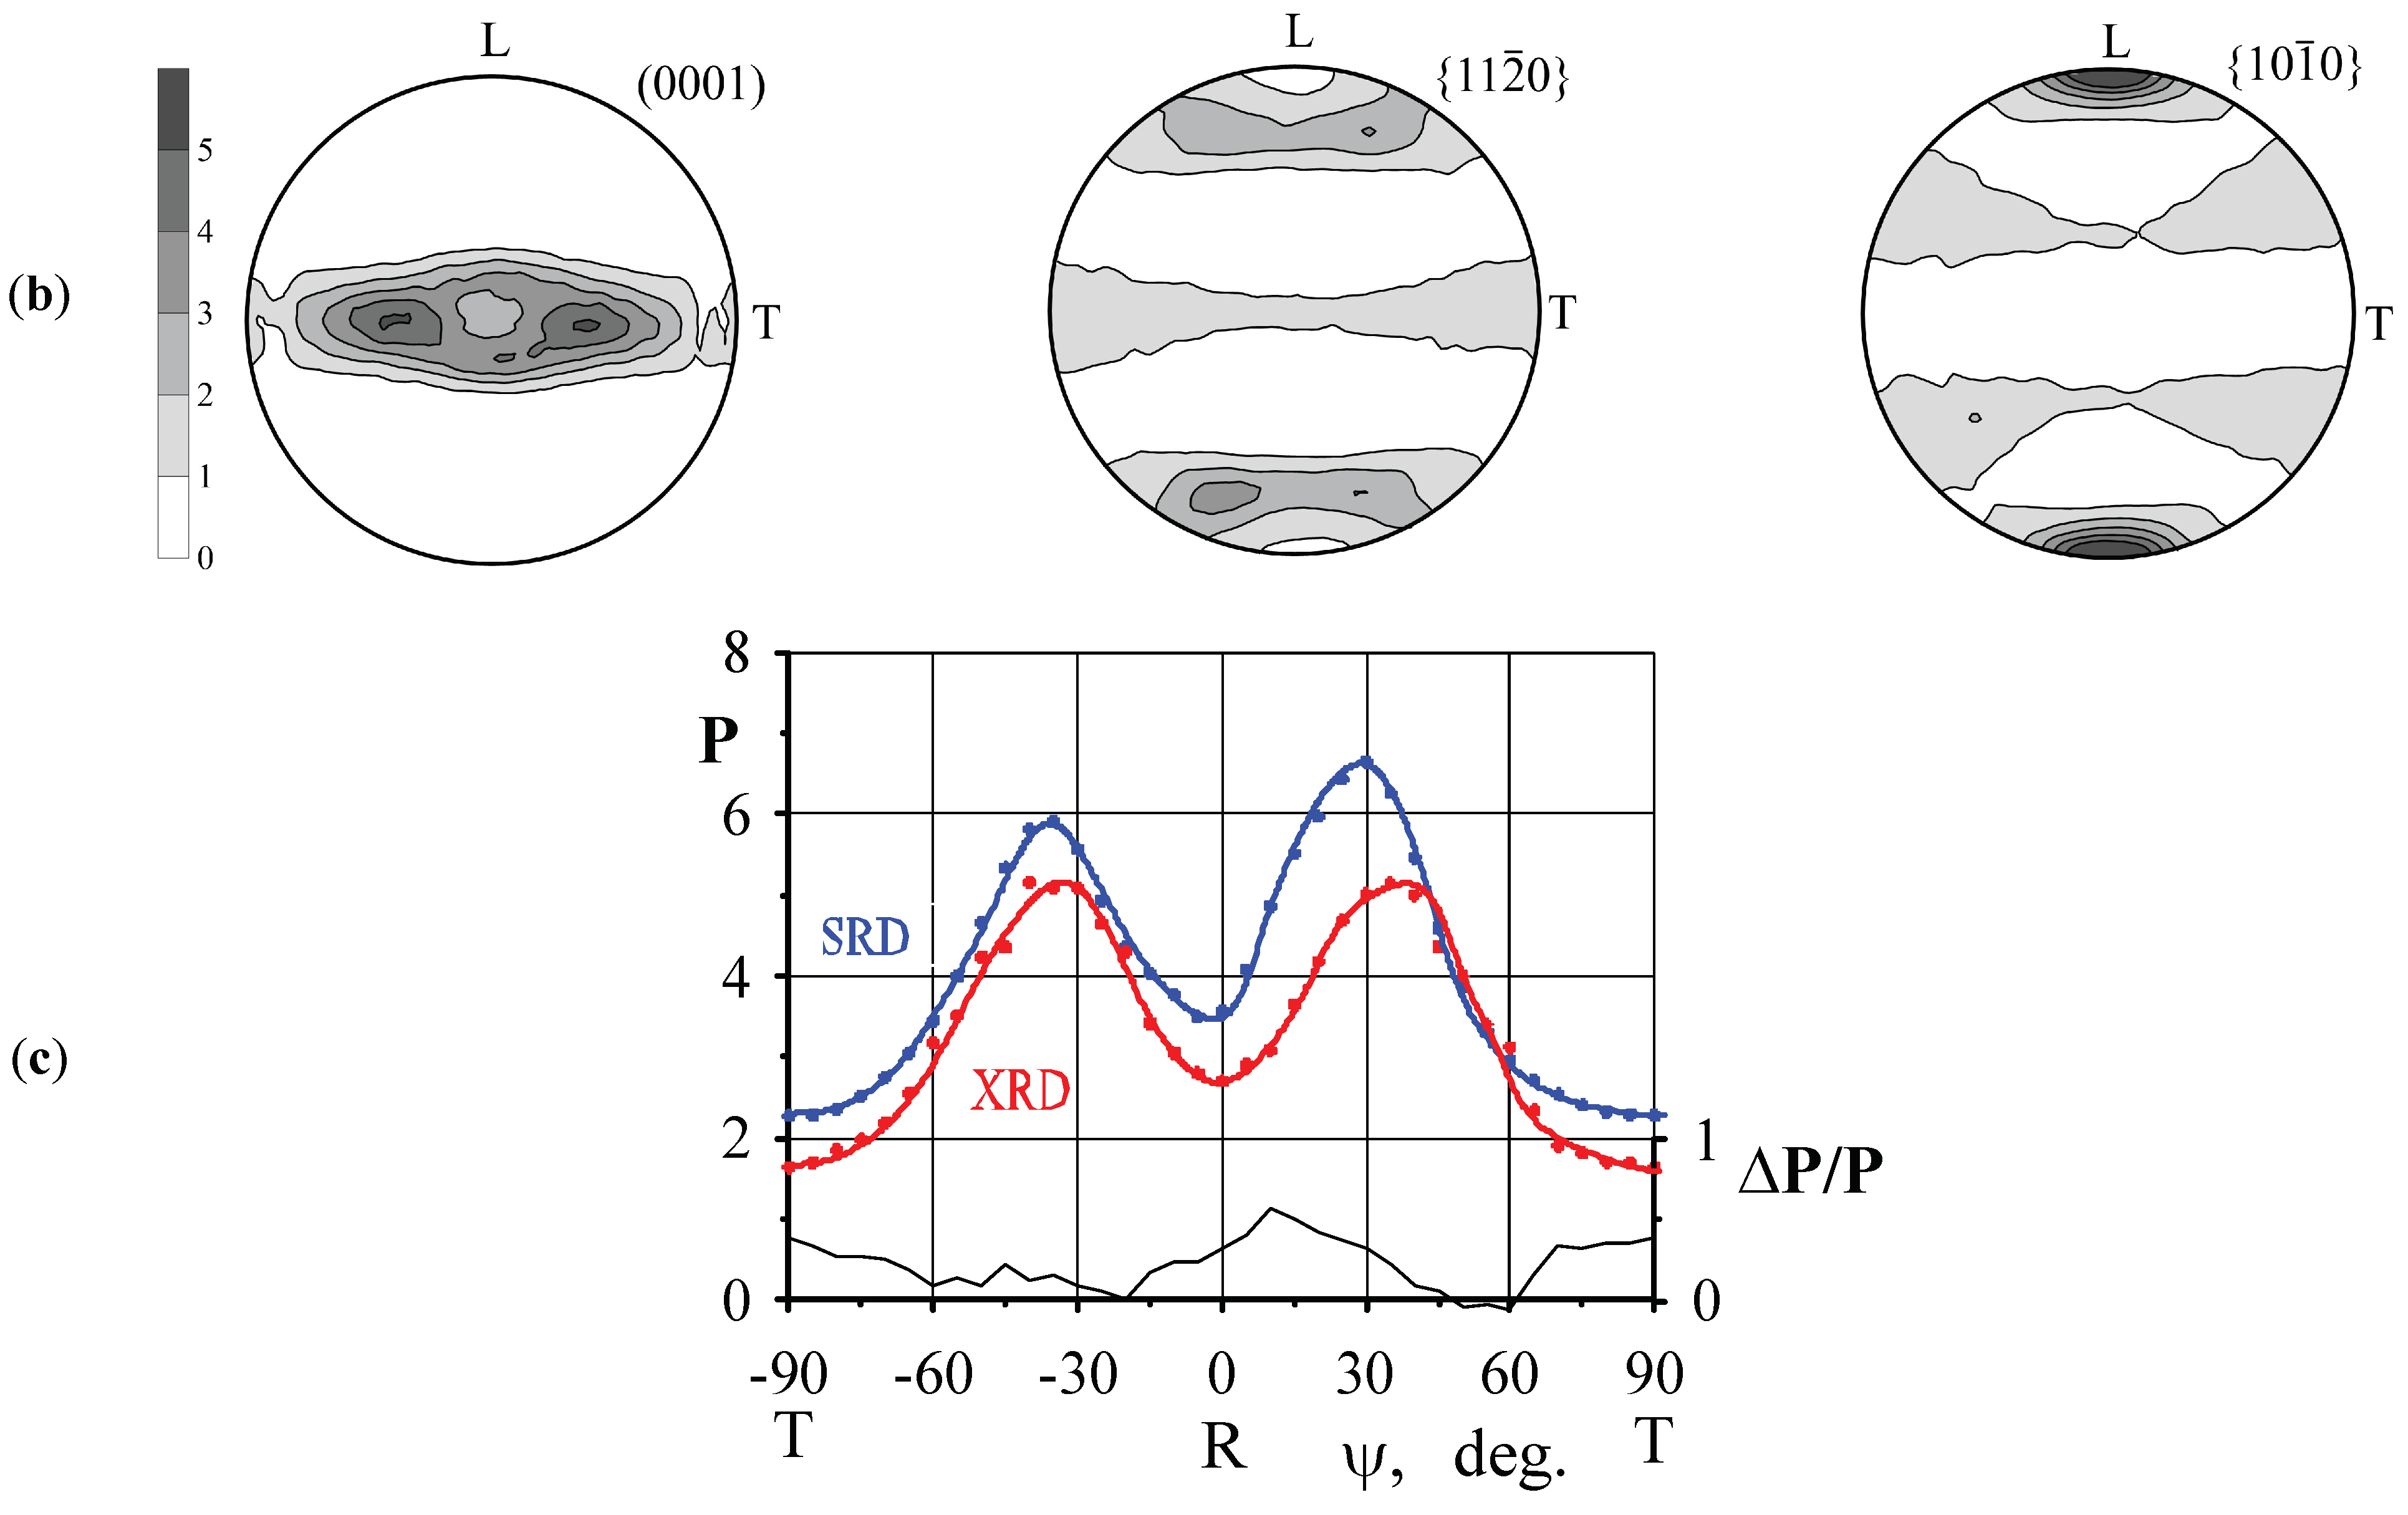
3.2.1. Structure and Texture of the α-Phase
3.2.2. Texture of β-Phase
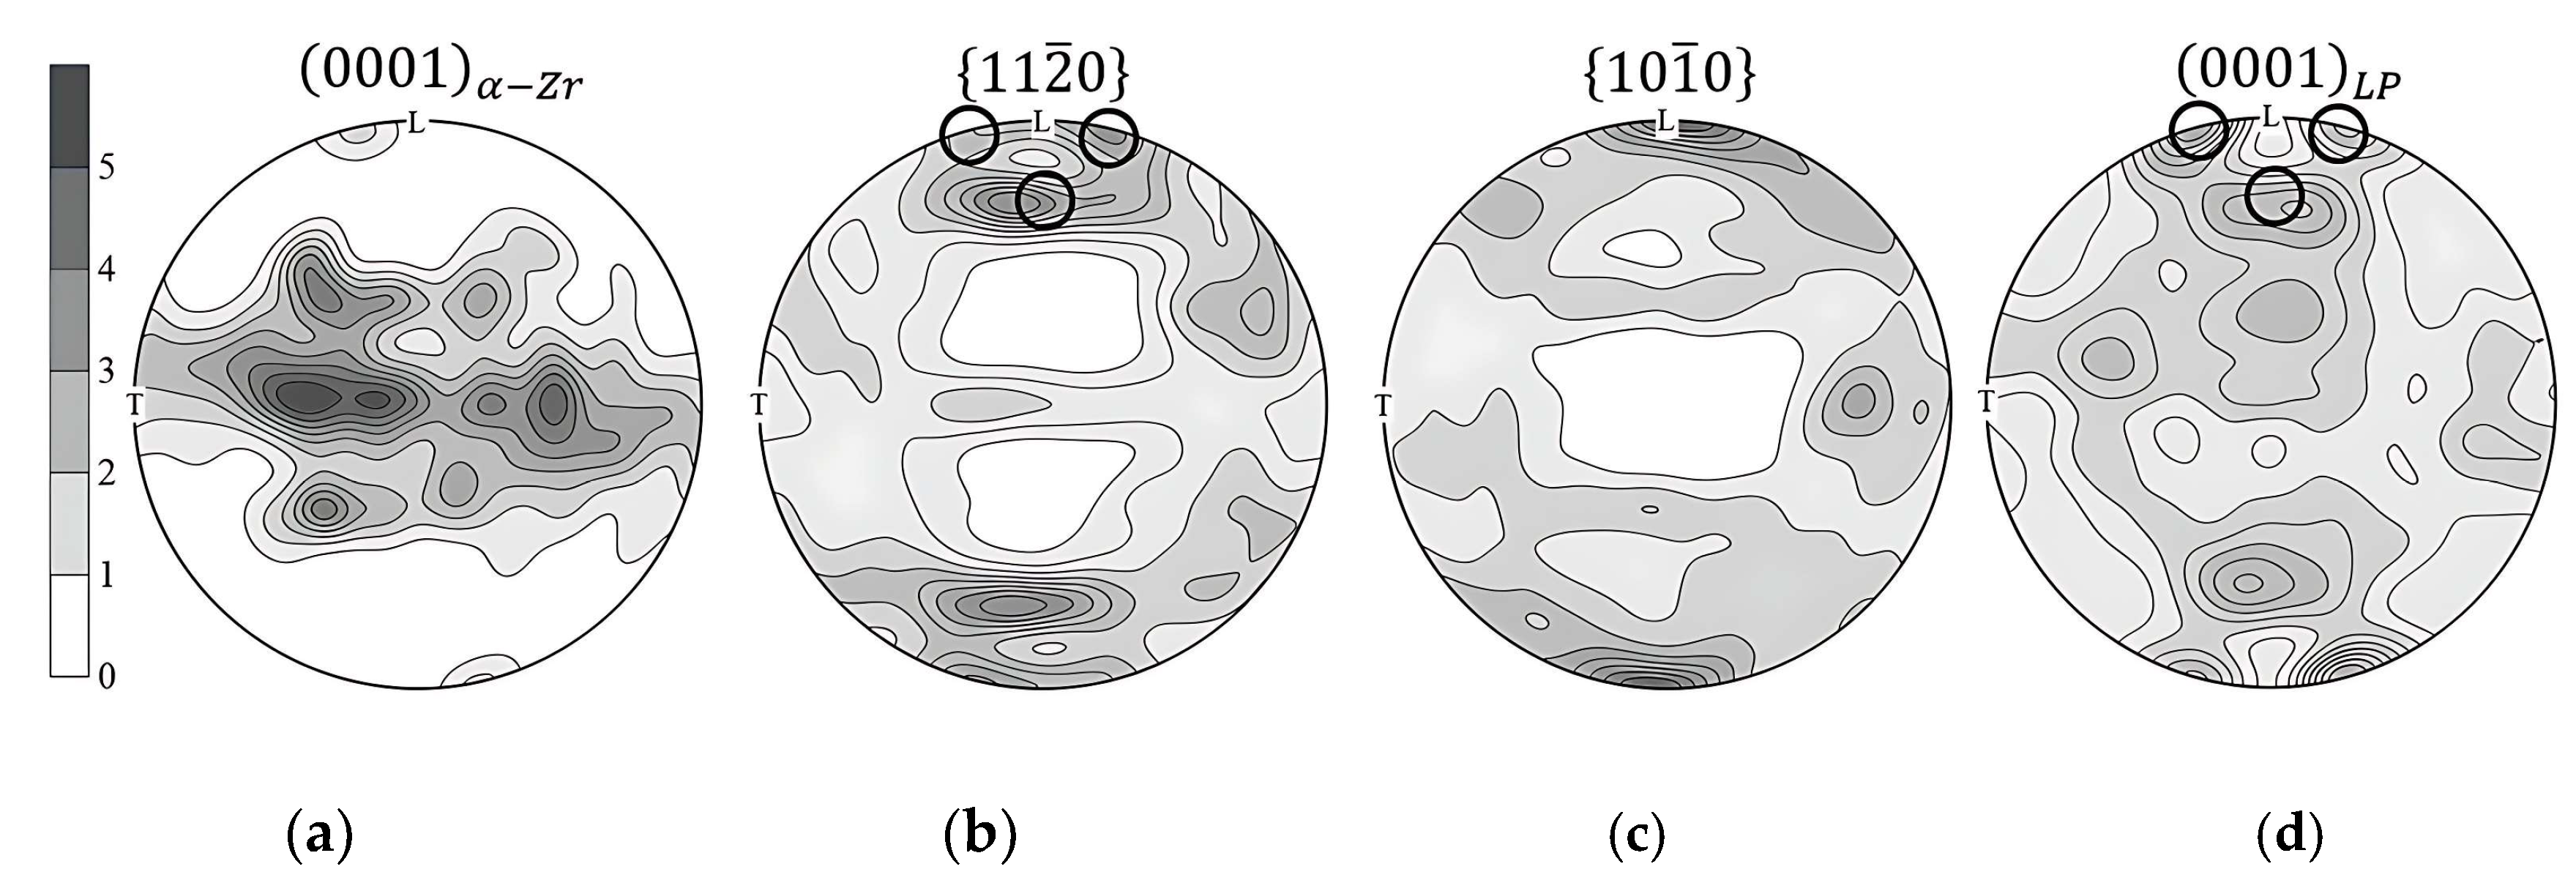
3.2.3. Laves Phase Texture
4. Discussion
4.1. Changes in the Phase Composition during Deformation and Annealing of Tubes
4.2. Changes in the Crystallographic Texture of Different Phases during Deformation and Annealing
4.2.1. Texture α-Zr
4.2.2. Texture of β-Zr and β-Nb
5. Conclusions
- Using data obtained with synchrotron radiation, a phase analysis of deformed and annealed zirconium-based alloys was carried out. The main phase of the investigated alloys was a solid solution of alloying elements in the hcp structure of α-Zr. The Zr-1Nb-1.2Sn-0.35Fe-0.08O alloy, wt.% was characterized by the presence of an additional stable Laves phase ((Zr,Nb)), which retained its structure in the deformed state and during subsequent annealing in the temperature range of 480–640 °C. In the deformed Zr-1.0Nb-0.06Fe-0.08O alloy, additional phases were solid solutions in the bcc structure with different elemental compositions (β-Nb, β-Zr) and the Laves phase. The content of additional phases did not exceed 1.6 wt.%.
- An algorithm for studying the crystallographic texture of materials using Debye rings obtained on synchrotron X-rays when photographing foils up to 120 μm thick were optimized. Orientation grain distribution functions (ODFs) and complete direct pole figures (DPFs) were constructed for the α-phase and for phases present in small amounts in the material for deformed and annealed zirconium alloys.
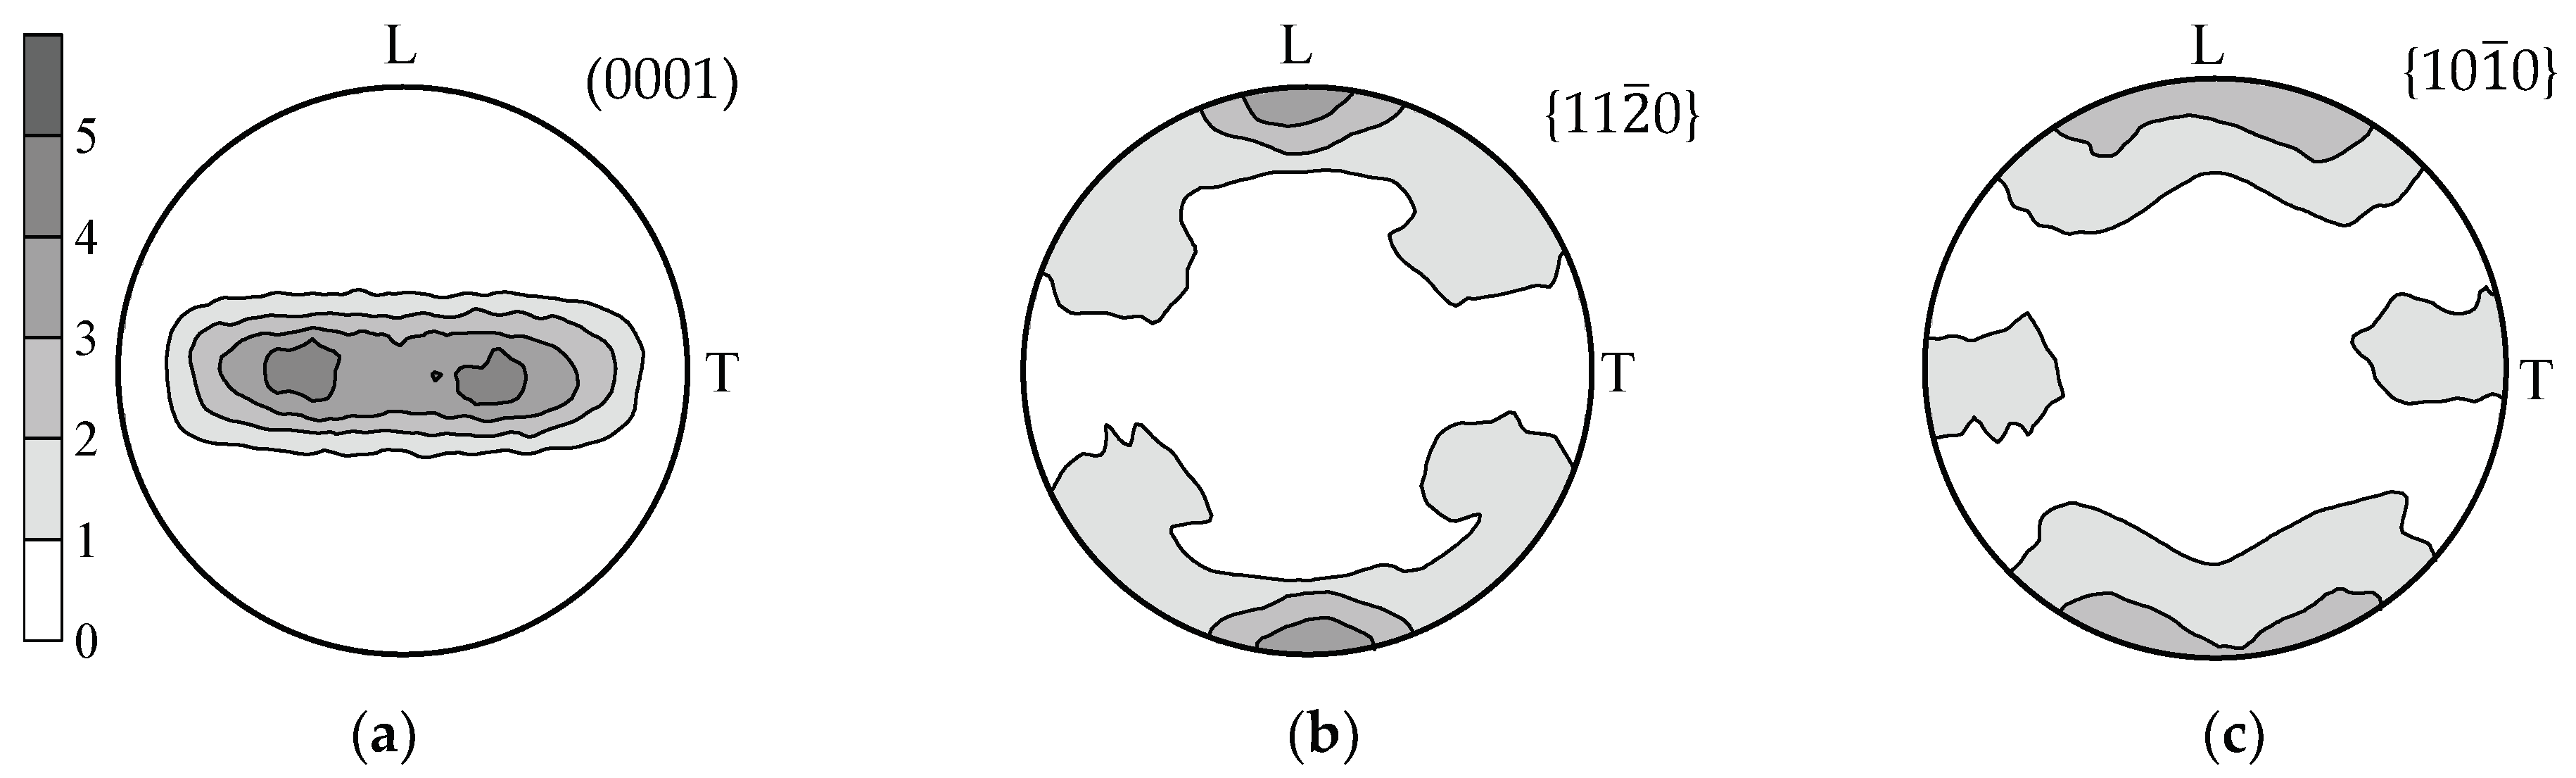
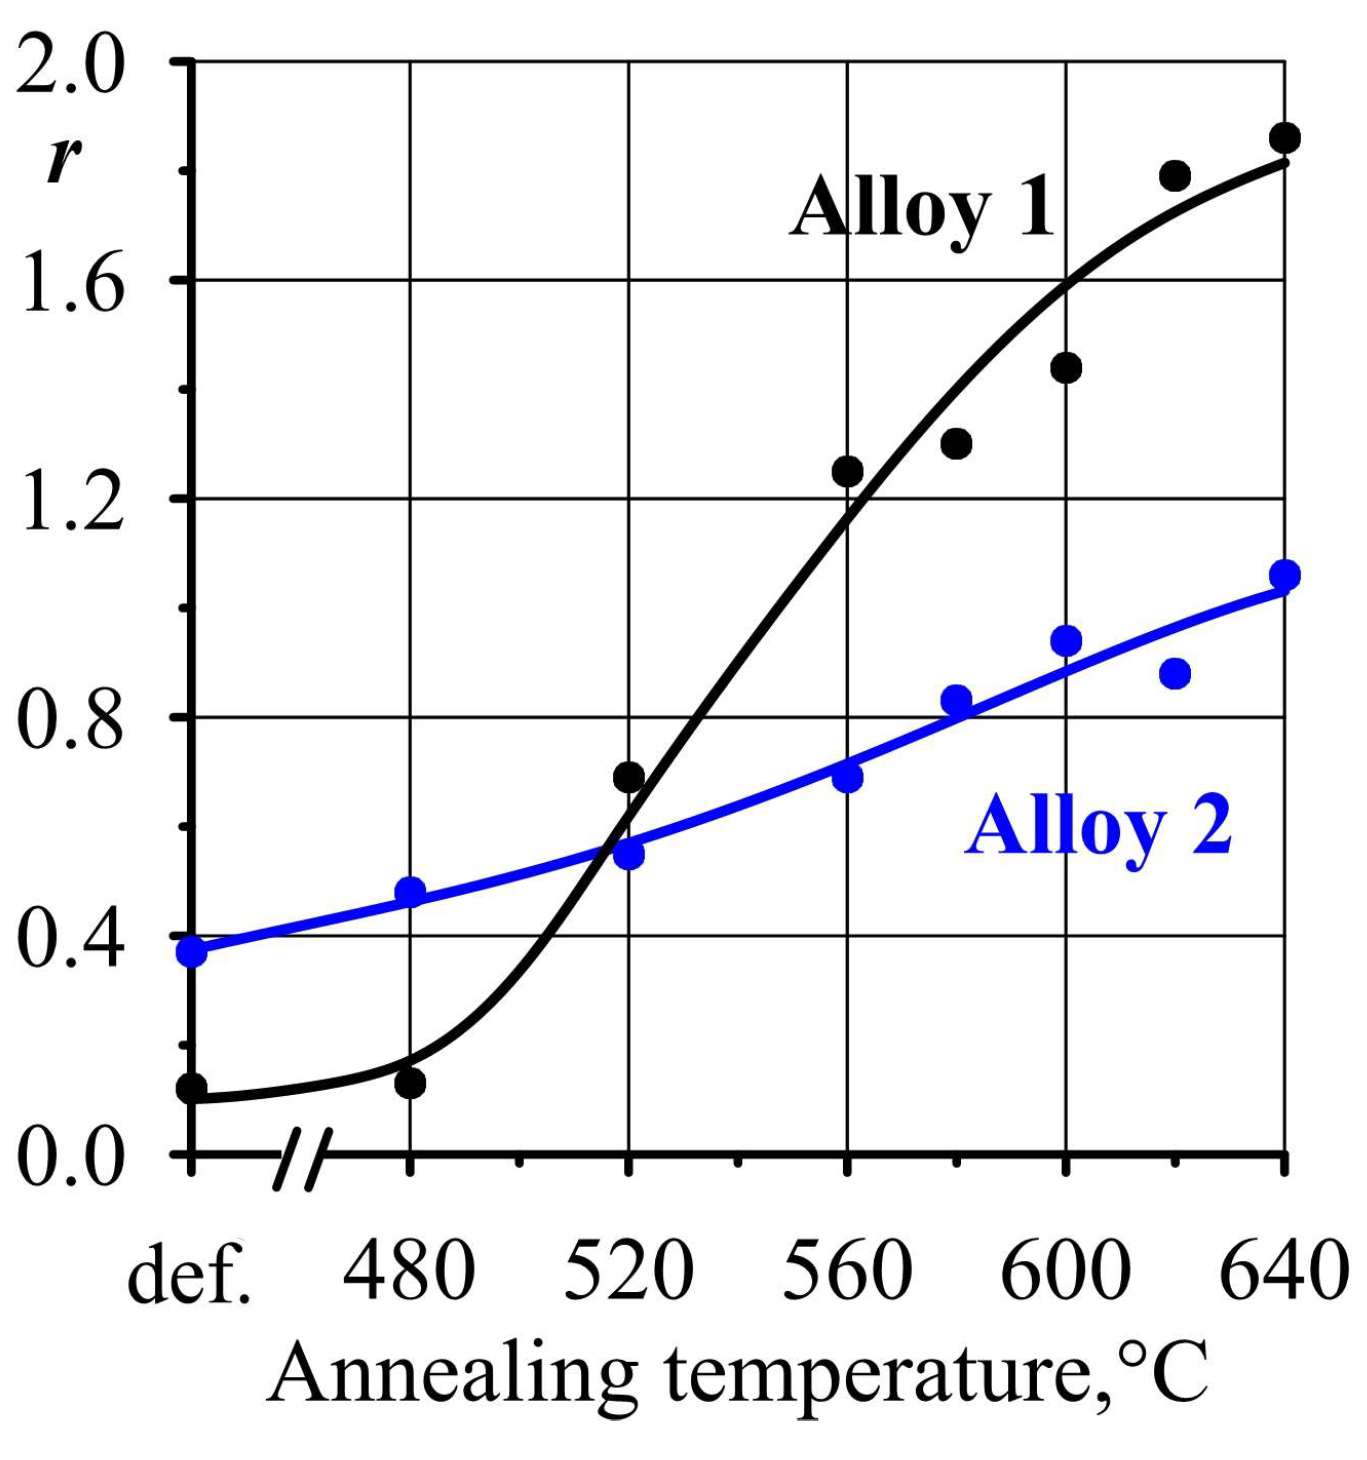
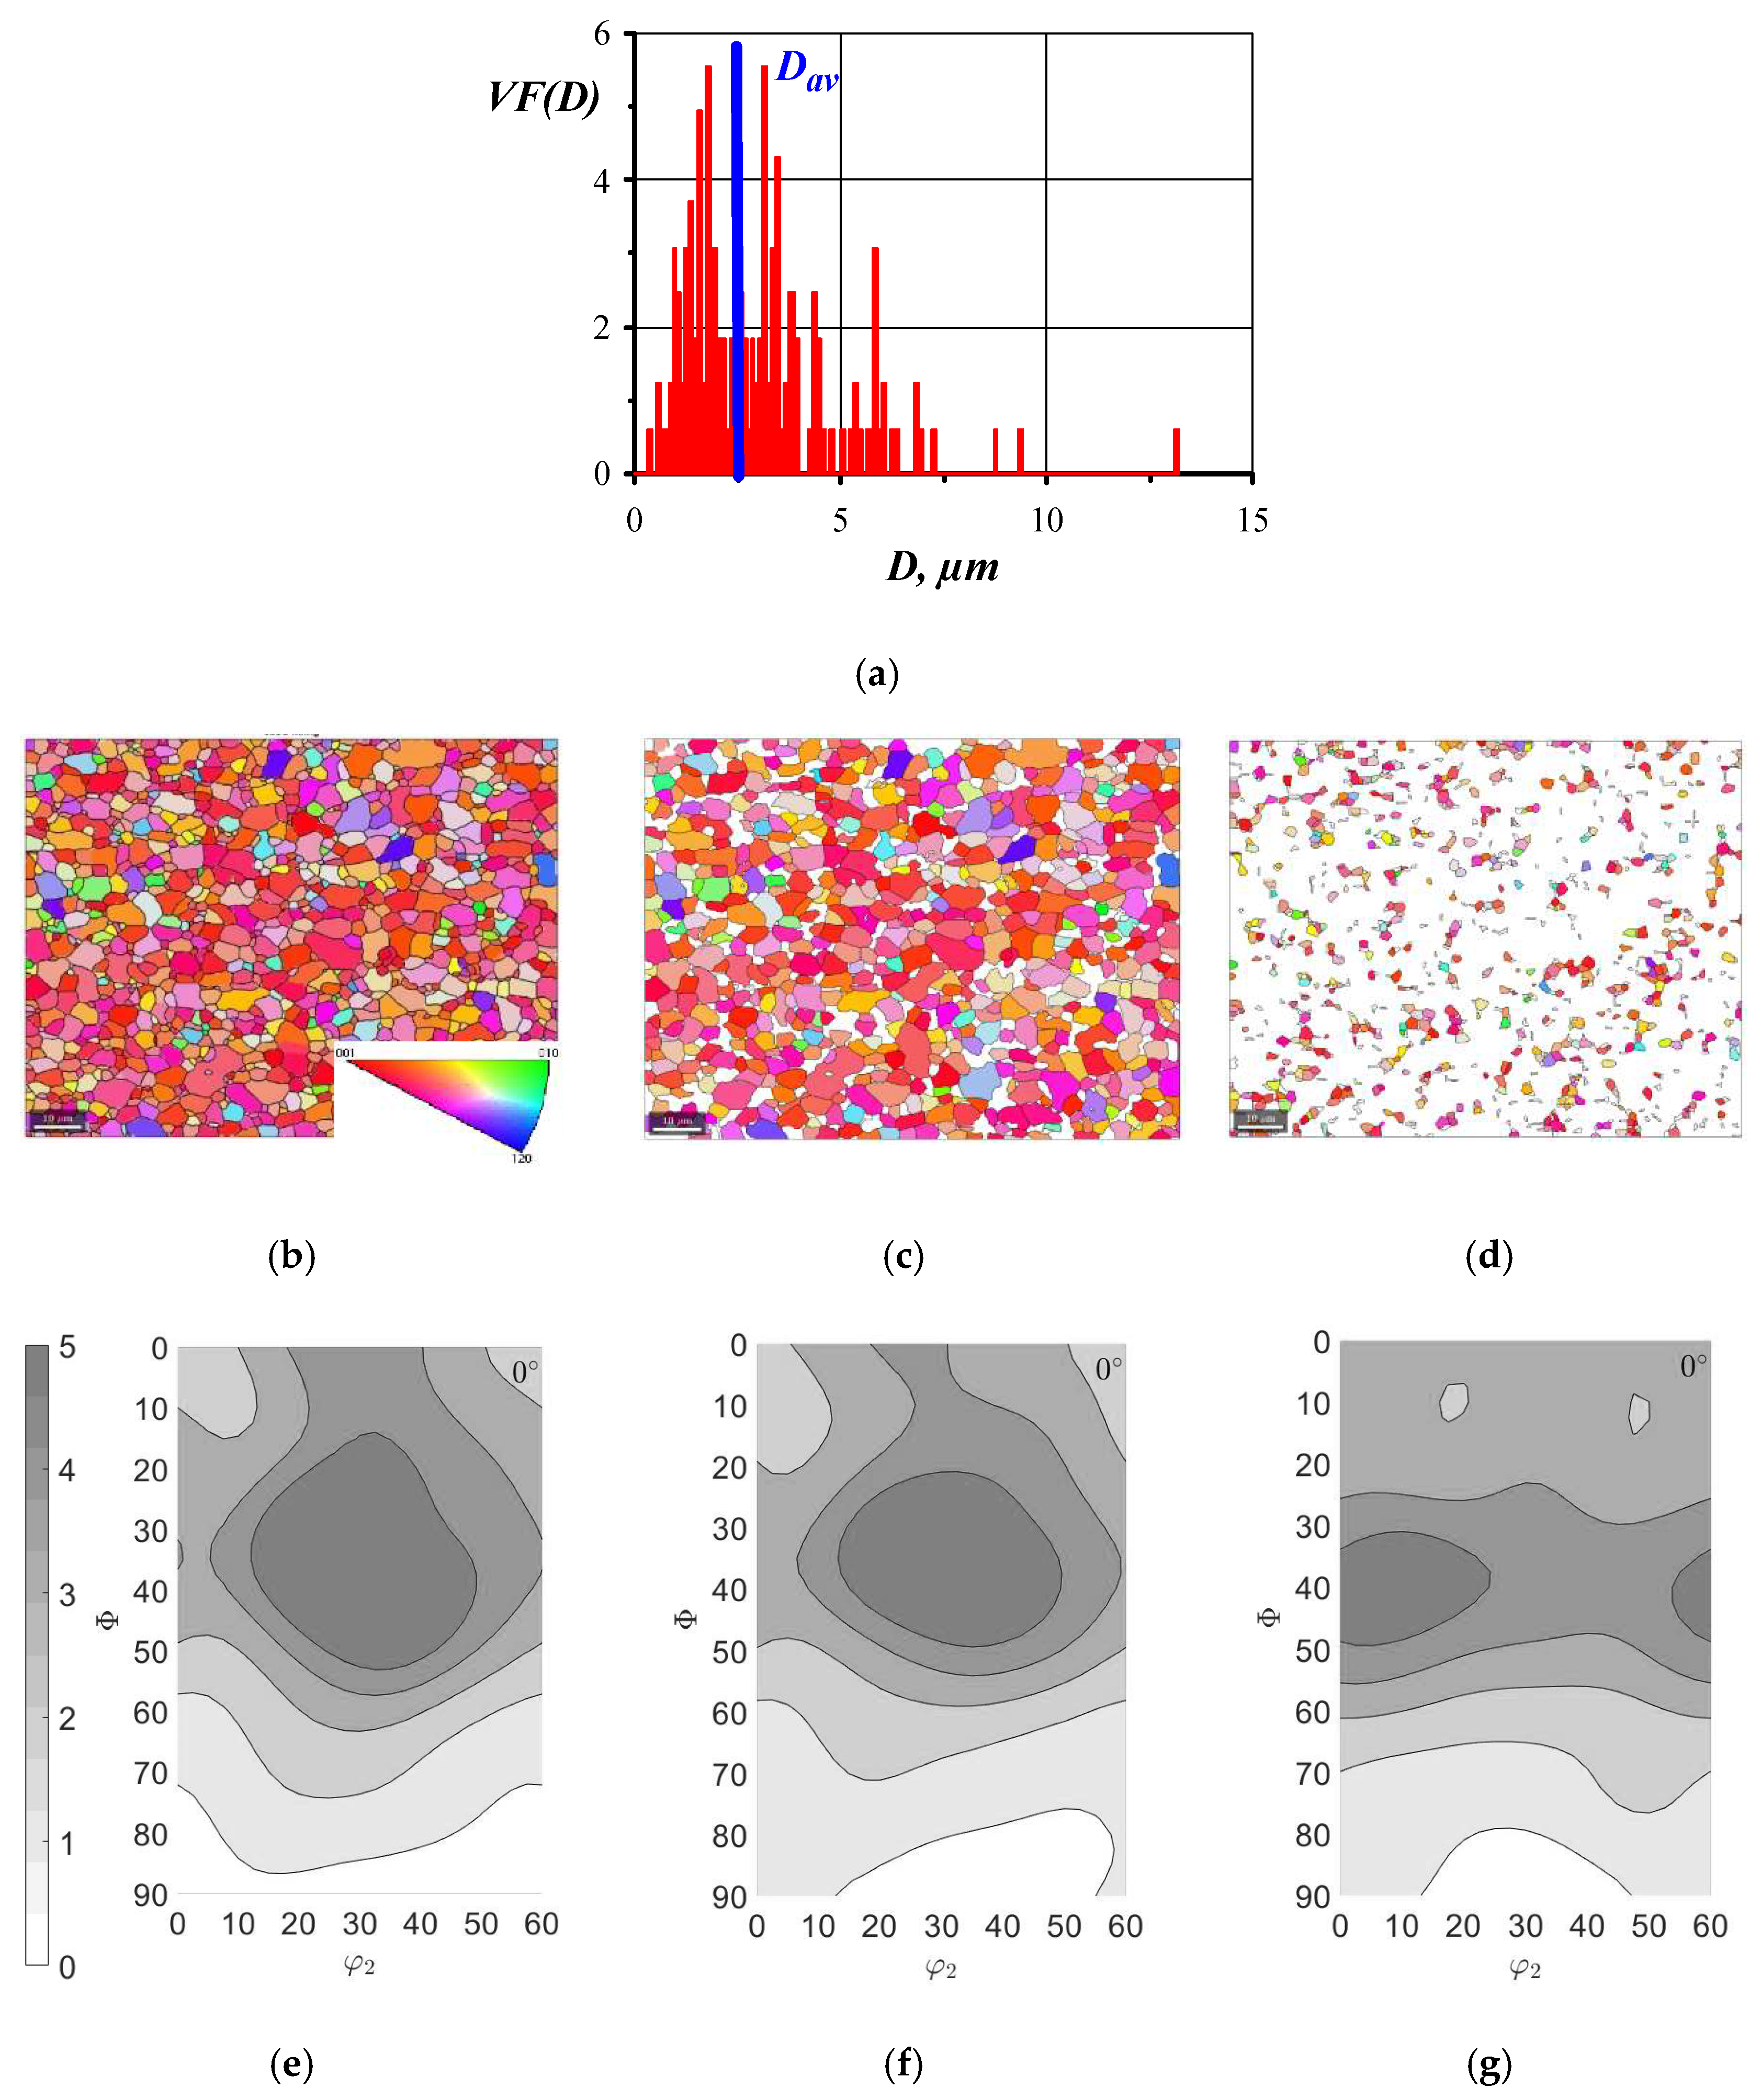
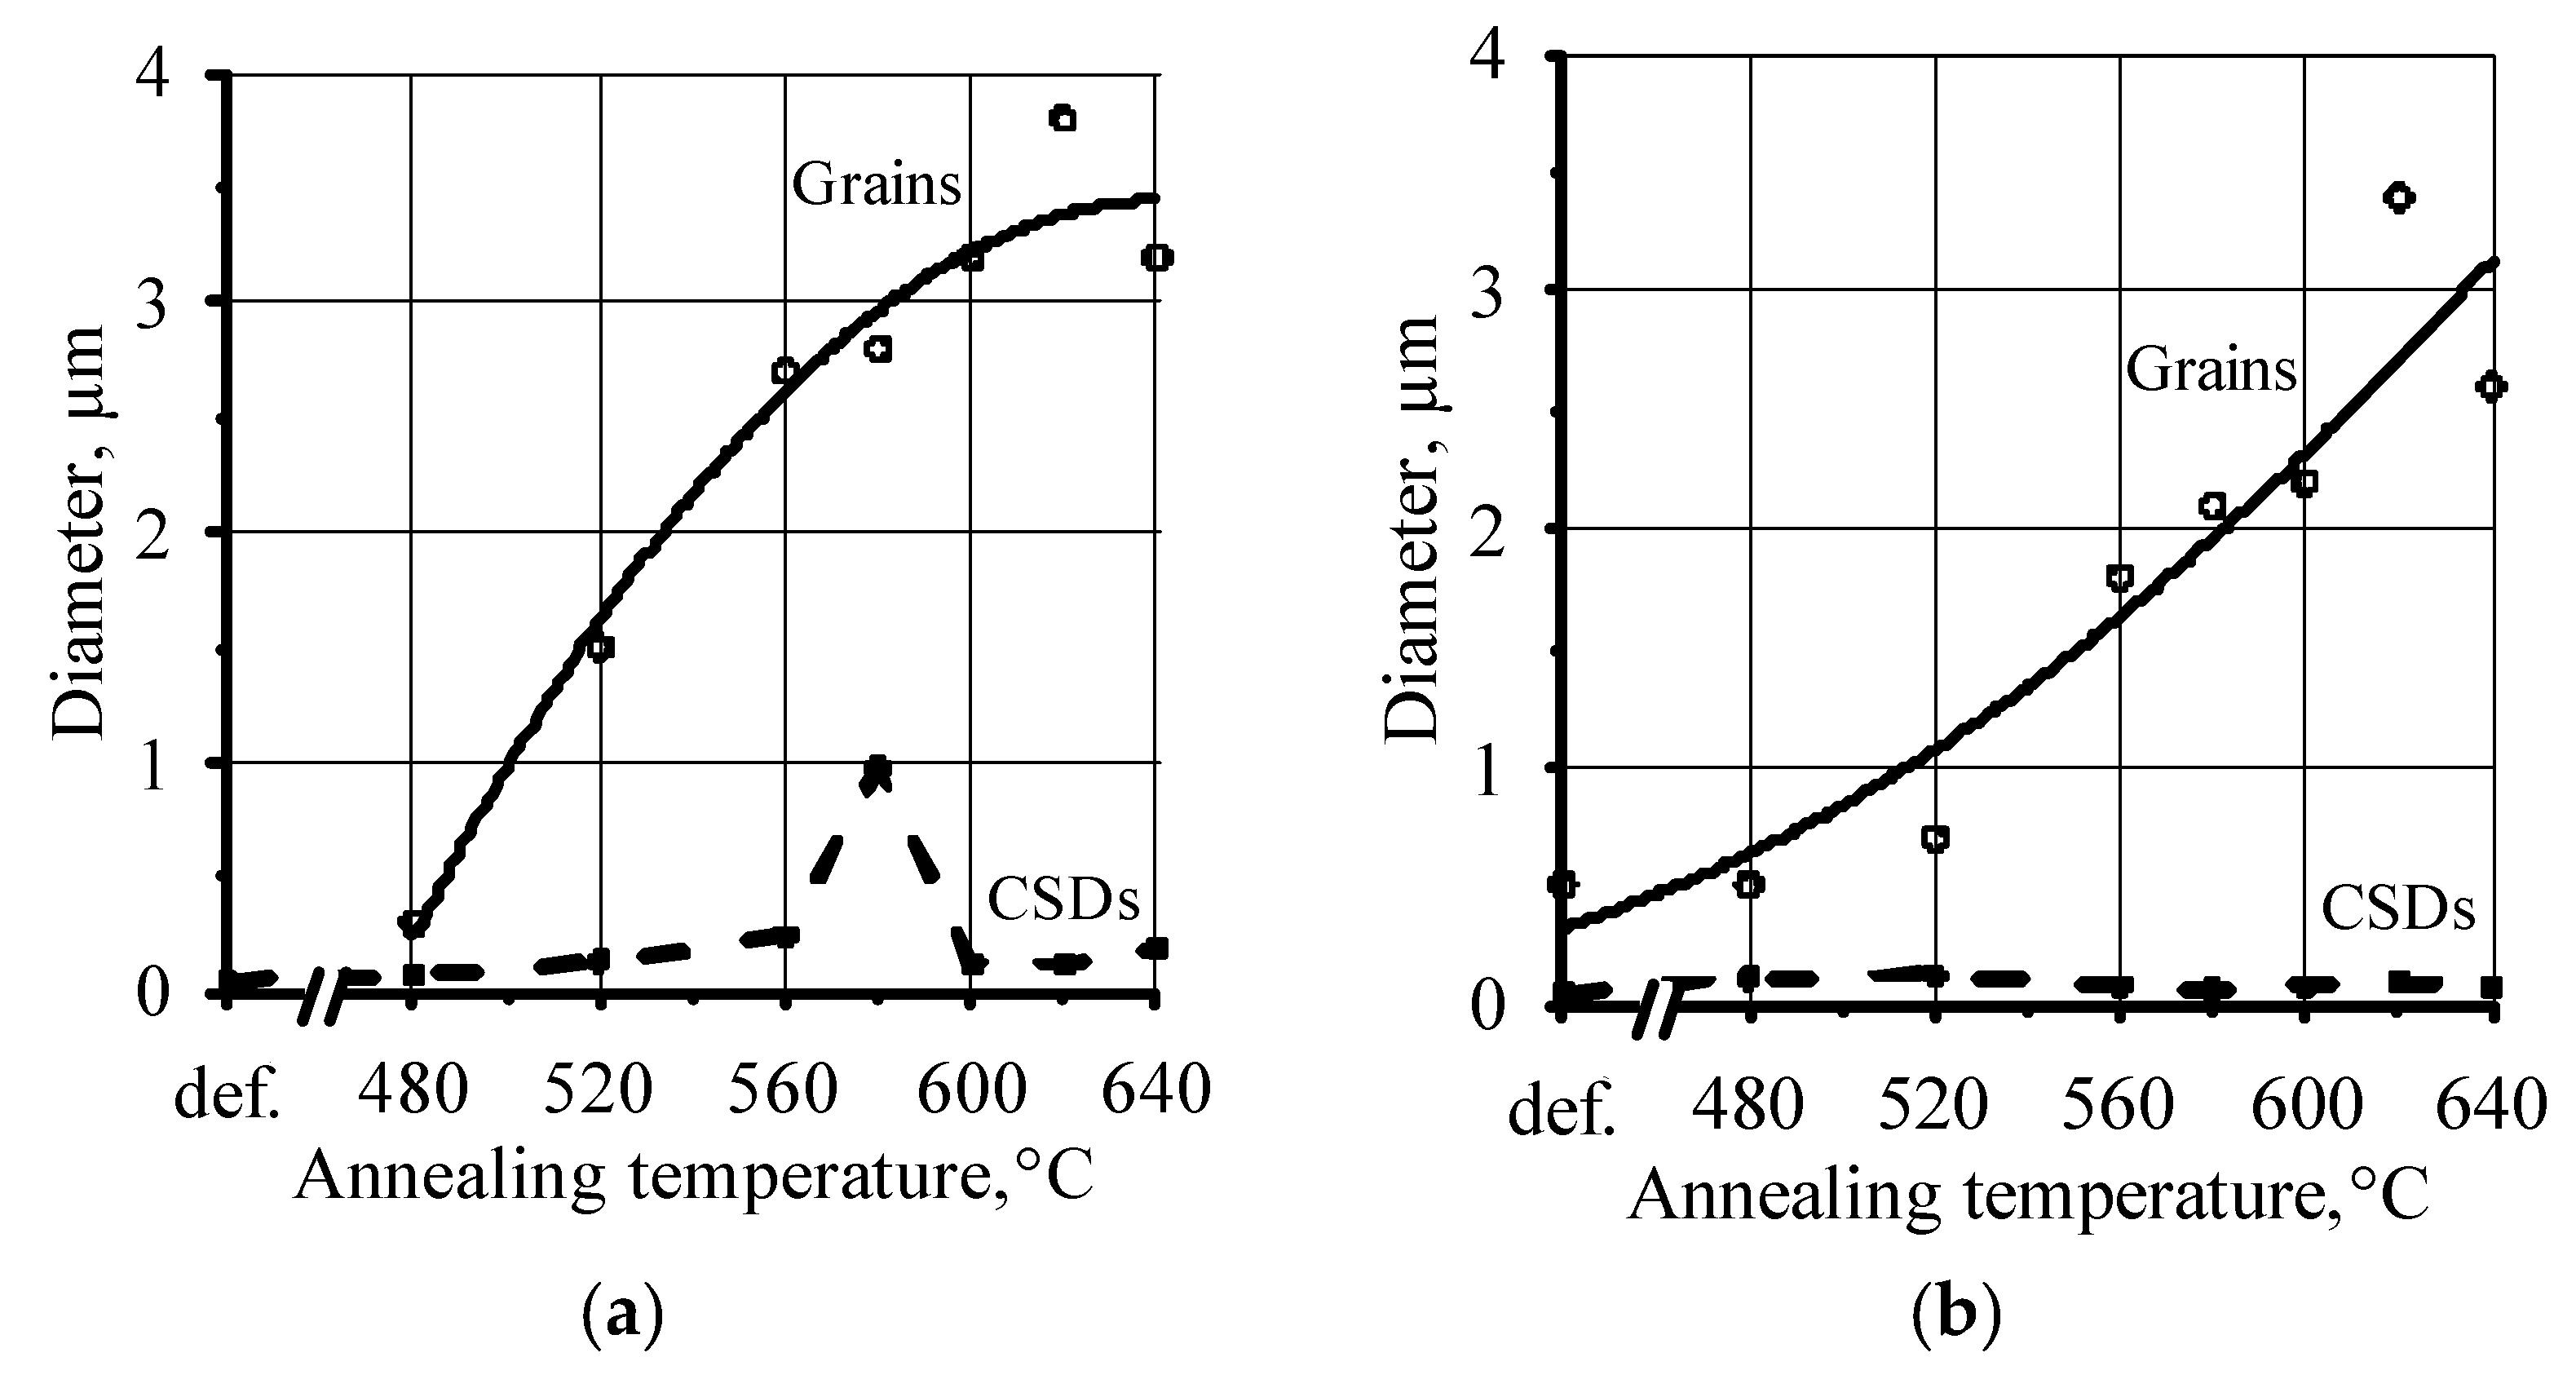
- It was shown that the rolling texture of α-Zr for the inner layers of the material corresponded to that measured earlier for the surface layers using X-ray analysis, namely, the following rolling texture was observed in the volume of the rolled material: (0001) ± 30–45°RD-TD <100>. As a result of recrystallization of α-Zr, the deformation texture was replaced by the recrystallization texture (0001) ± 30–45°RD-TD<110>, which was due to the absorption of the deformed matrix by recrystallized grains misoriented, with respect to the initial grains, by a rotation of 30° around the basal axes. Based on the results of the synchrotron study, dependences of the ratio of the pole densities of the <110> and <100> axes oriented along the tube rolling direction were obtained, characterizing the completeness of the recrystallization at different annealing temperatures. For the Zr-1.0Nb-0.06Fe-0.08O alloy, annealed at a temperature of 580 °C for 3 h, the maximum domain of coherent scattering was found, which is an order of magnitude higher than the domains at other annealing temperatures.
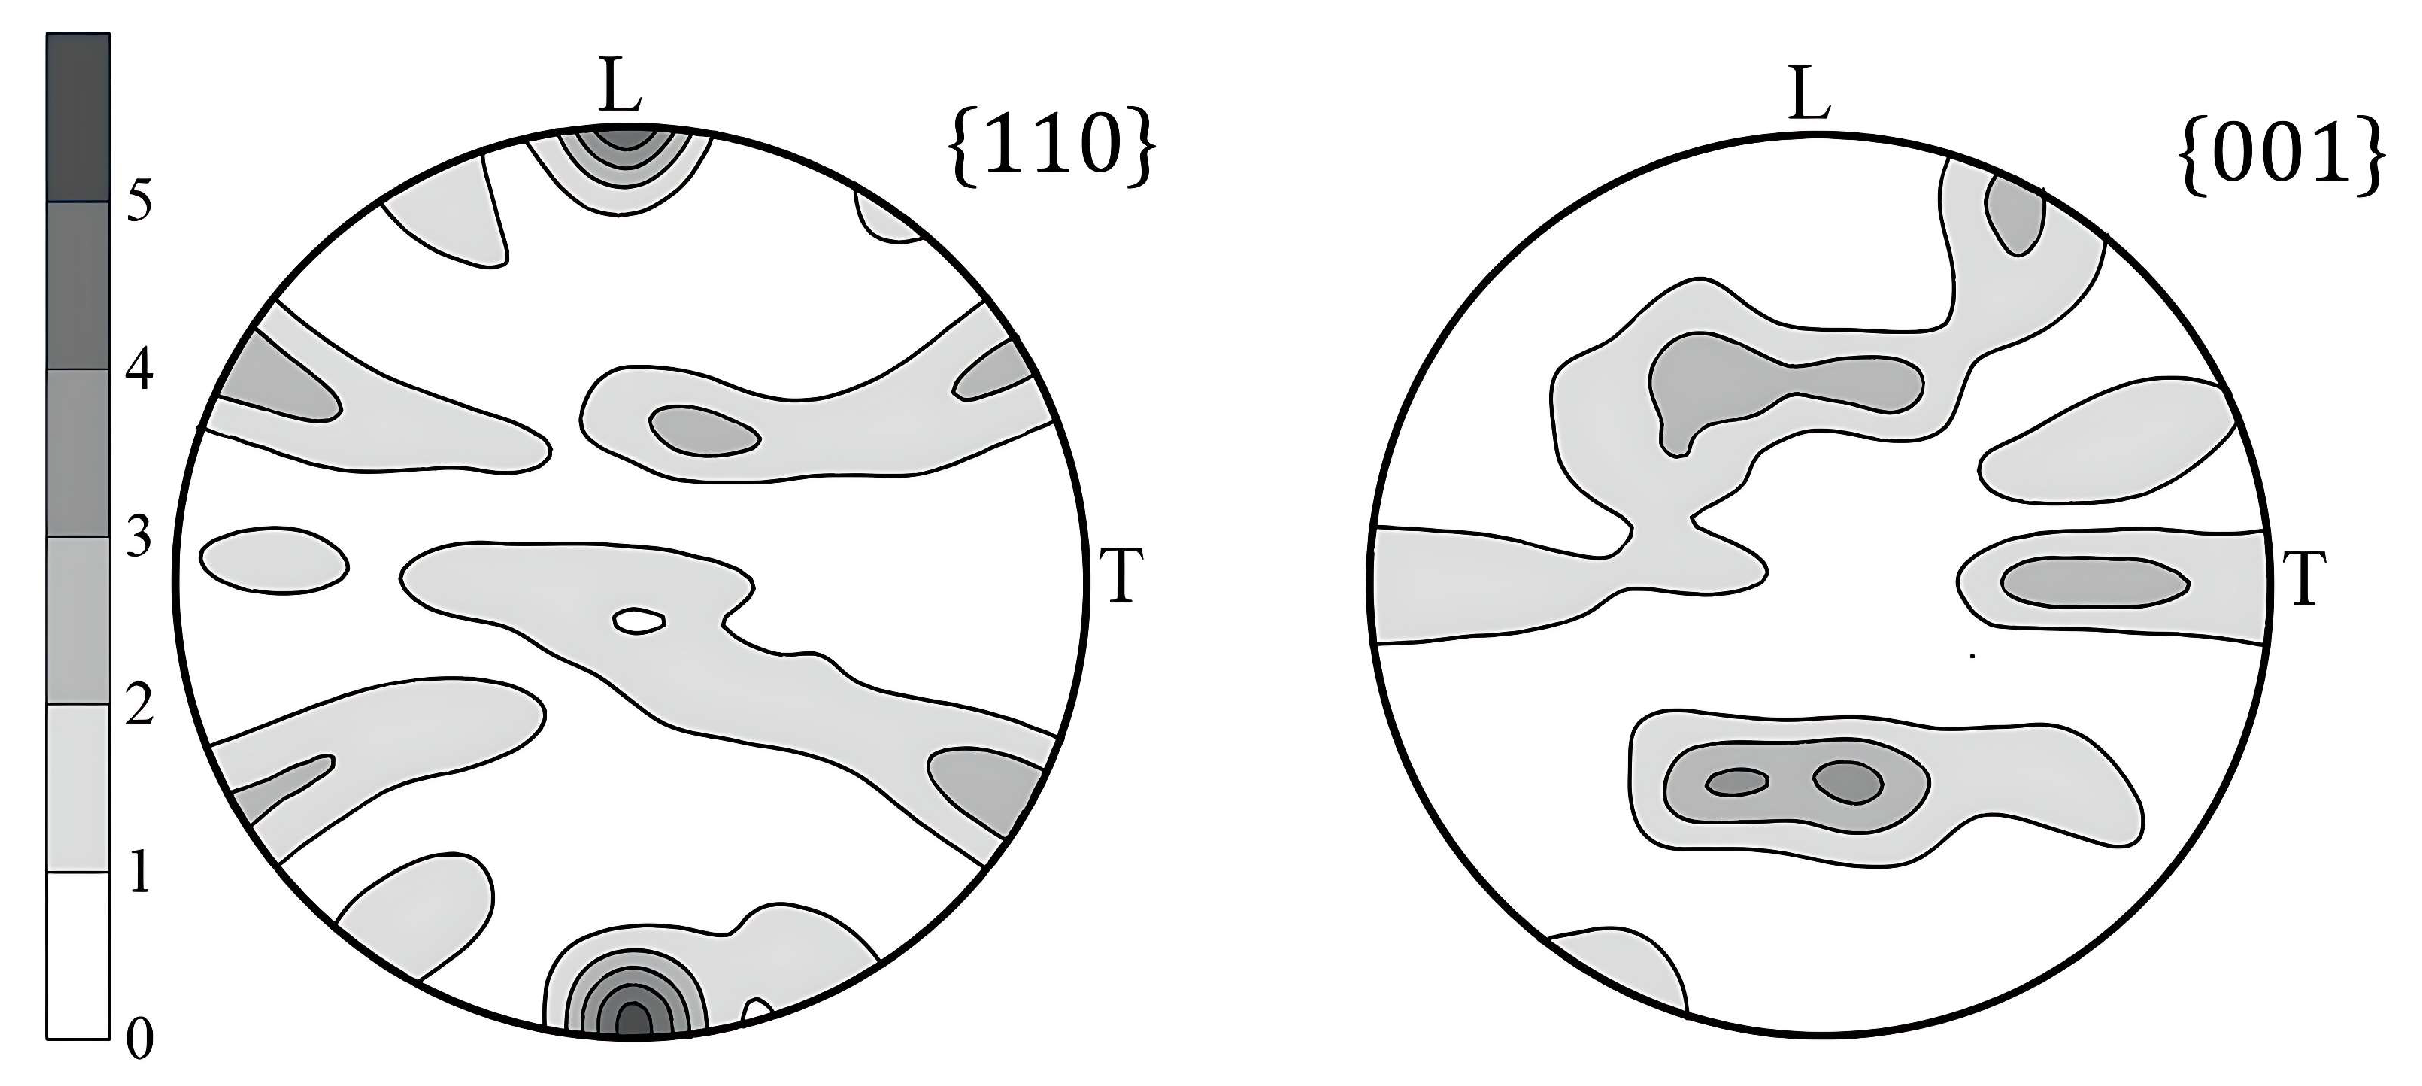
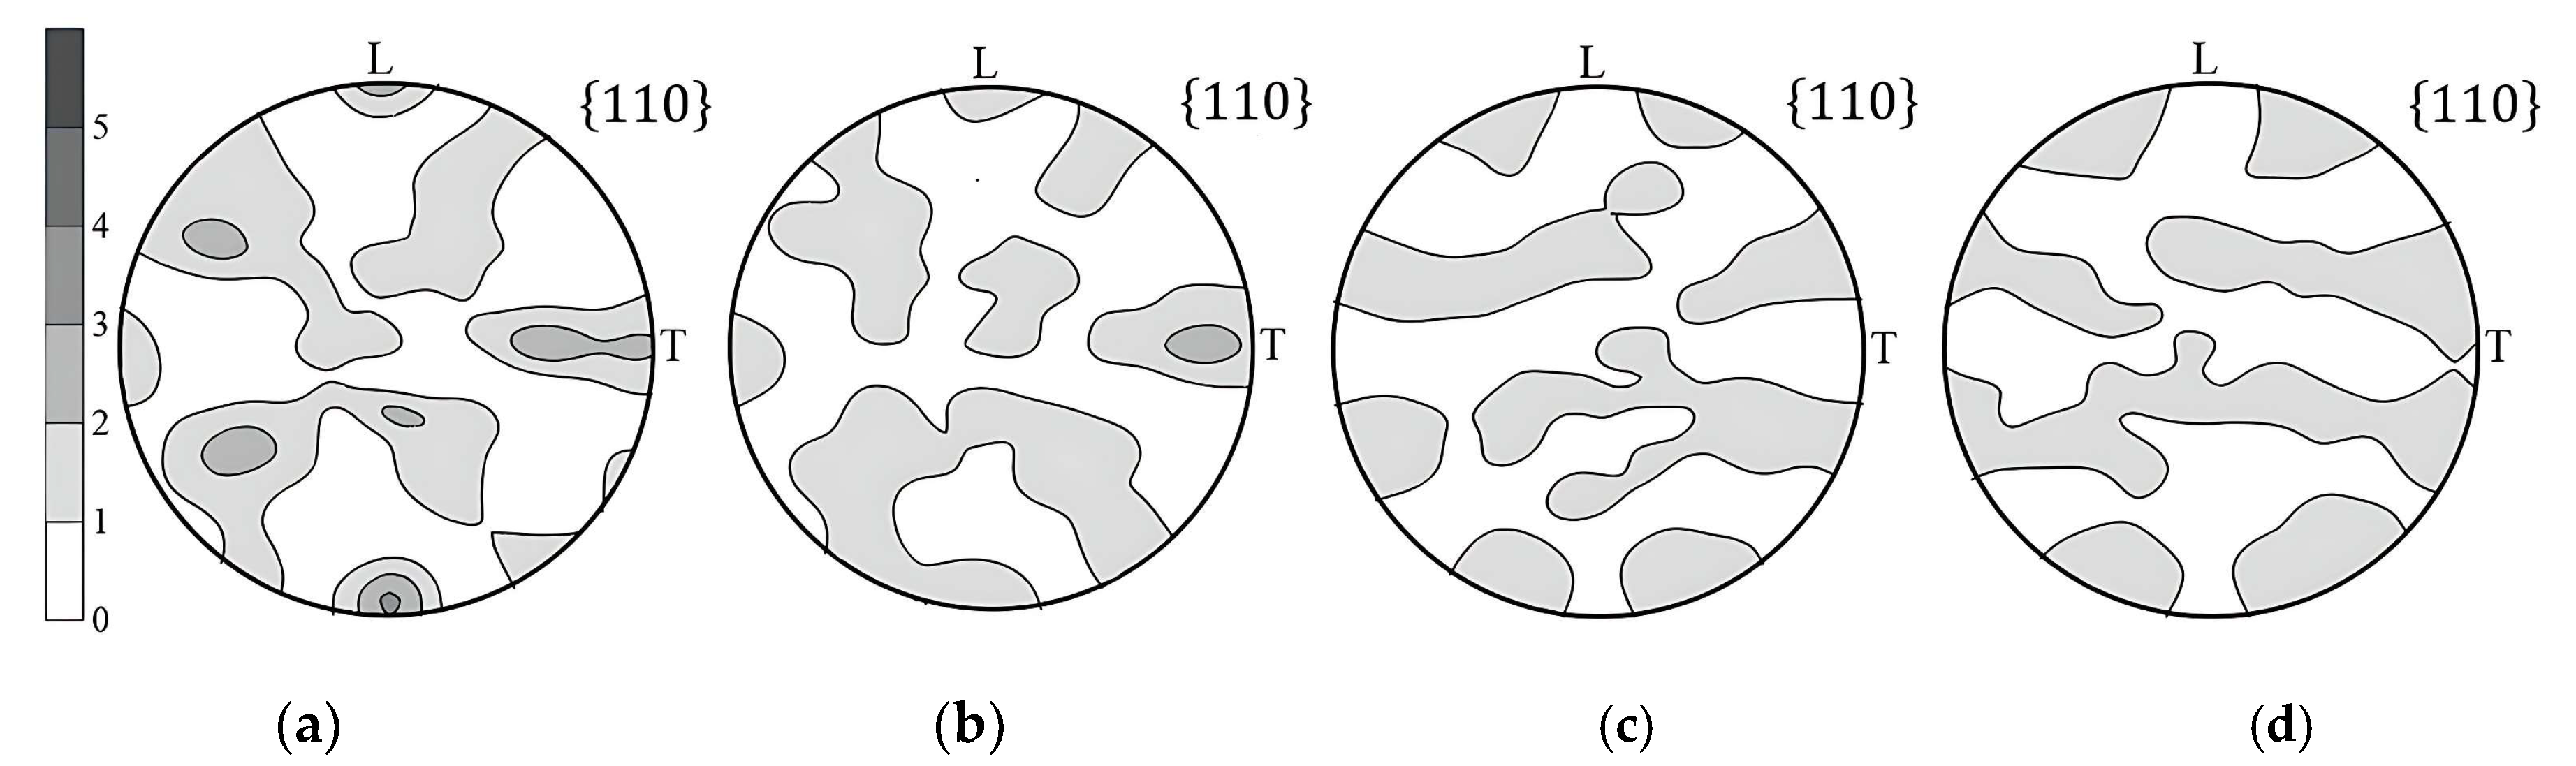
- It has been established that during plastic deformation of the alloy, a dynamic phase transformation β-Nb→α-Zr→β-Zr is observed, as a result of which the content of niobium in the bcc phase changes from 90 to 20% and the formation of a texture of phase transformations in β-Zr is observed.
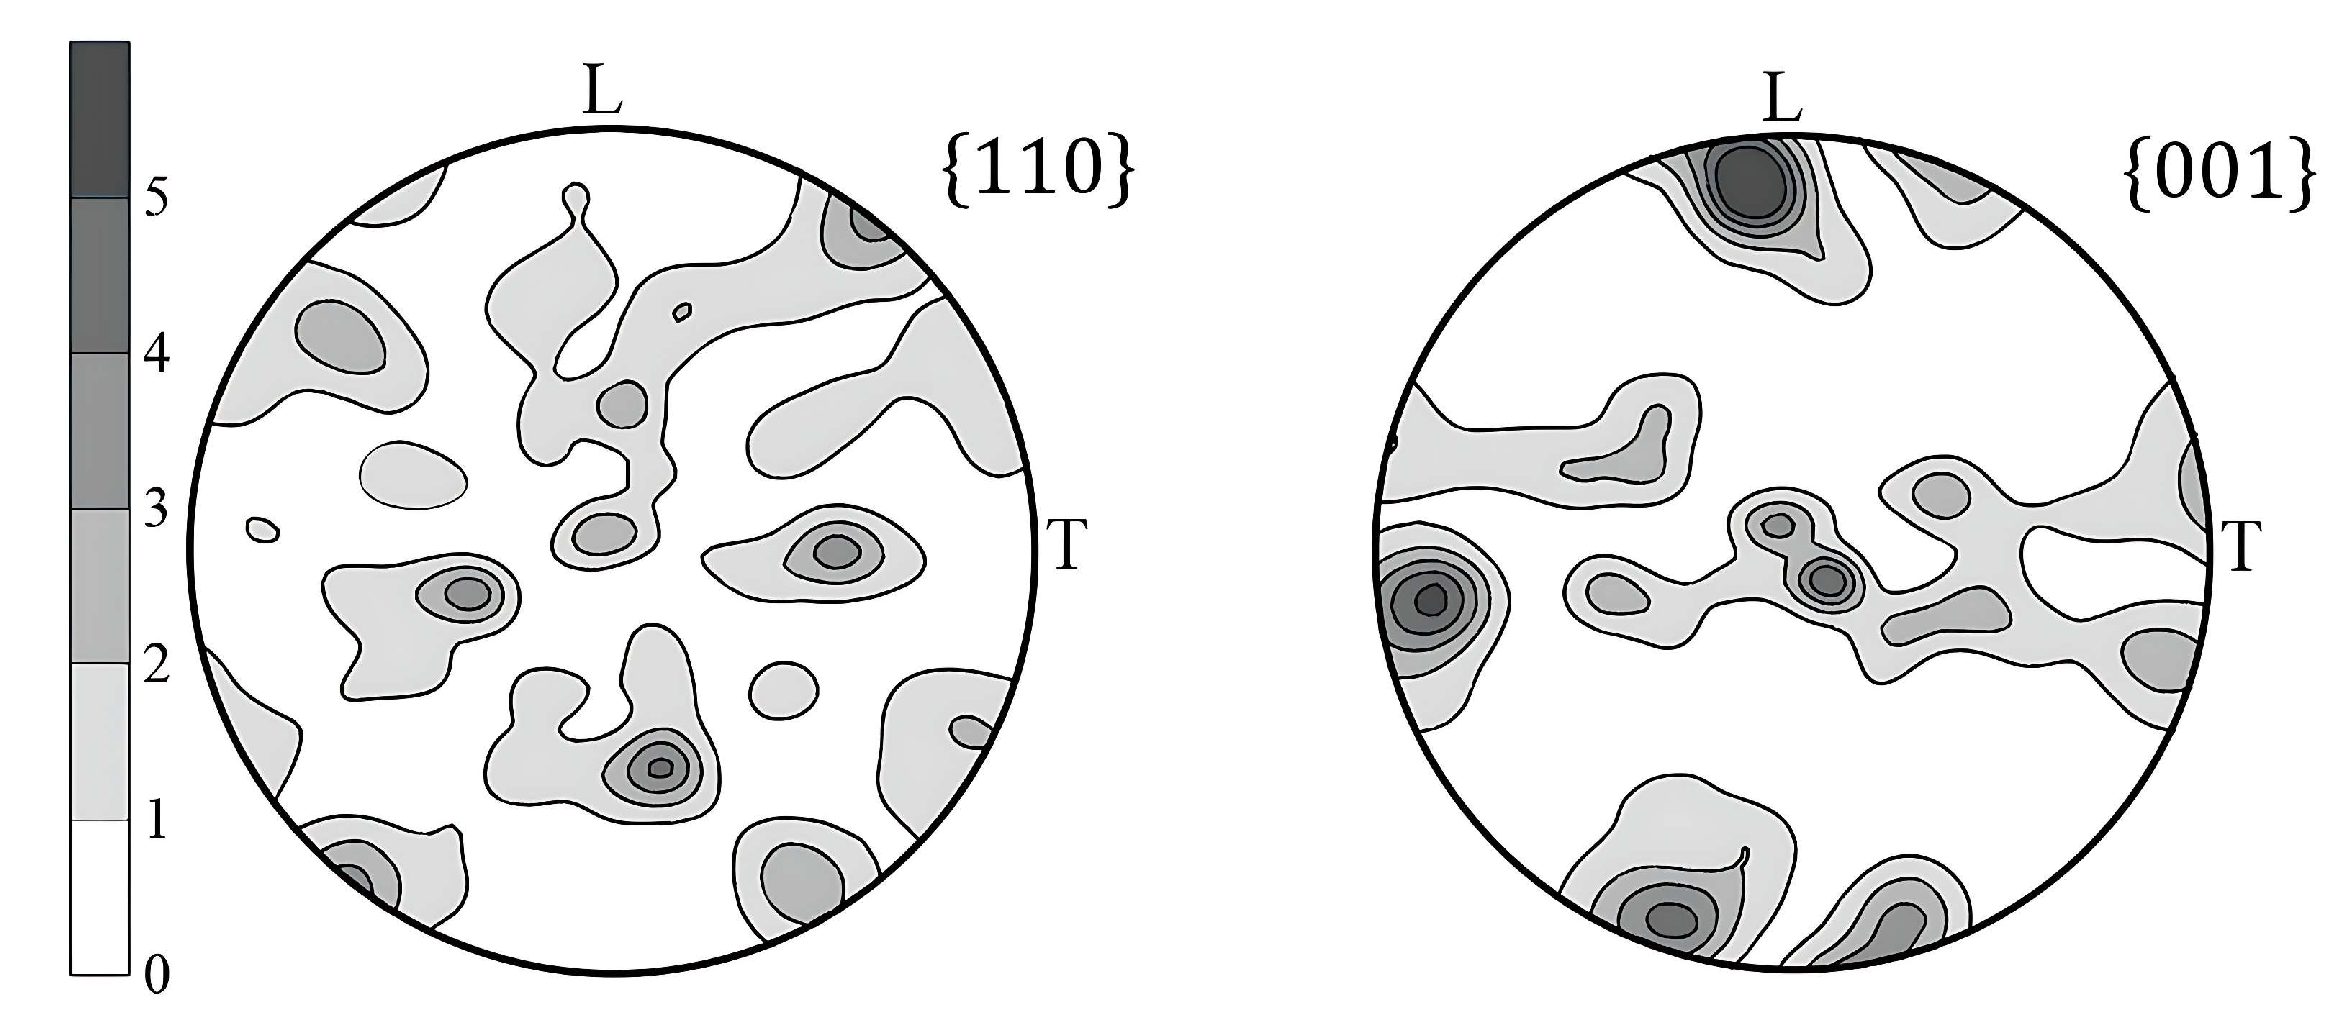
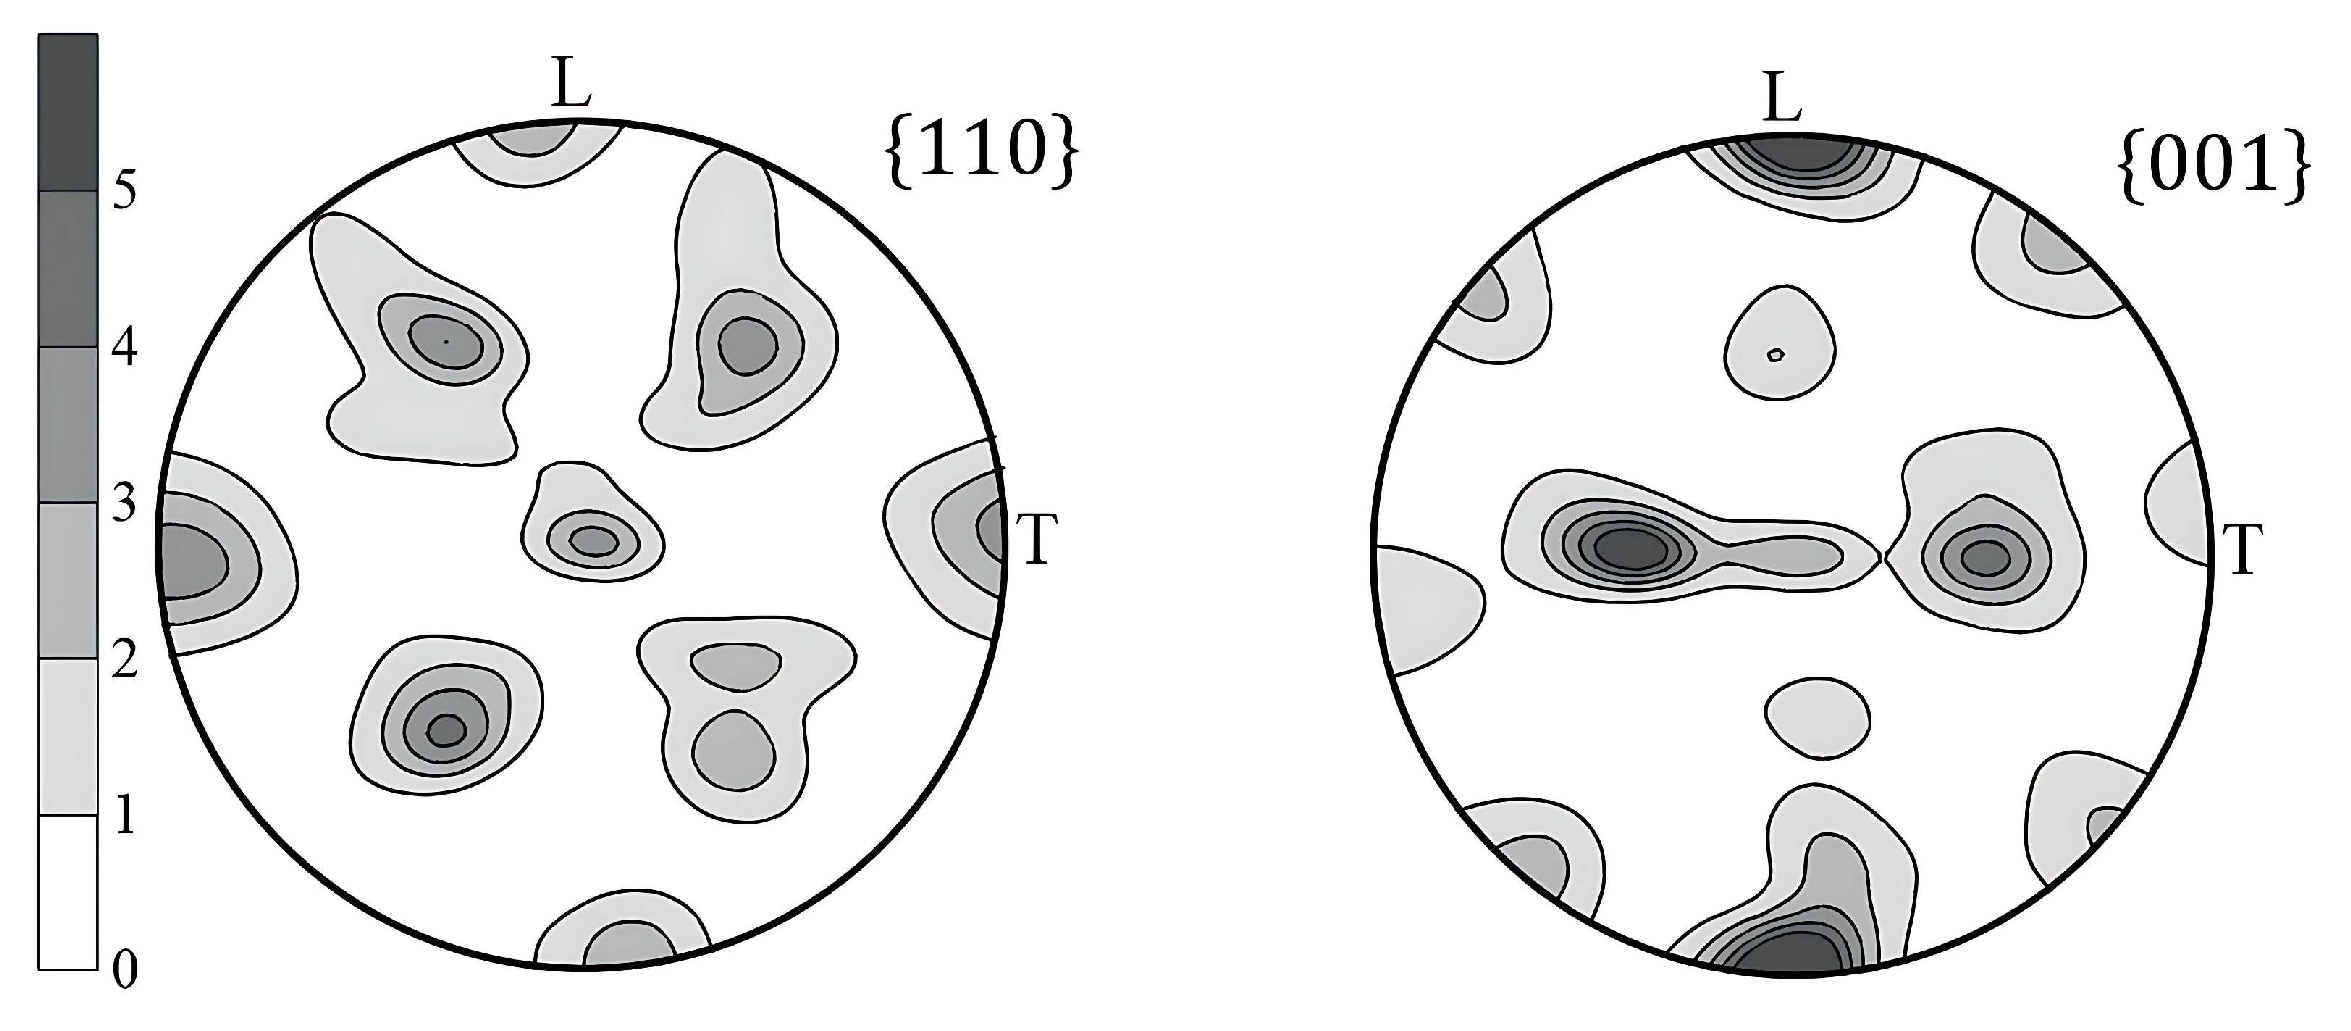
- It was found that at an annealing temperature of 480 ℃ for 3 h, the main texture component {110}<001>, characteristic of the recrystallization of bcc metals, was formed in β-Zr. The observed recrystallization of the finely dispersed β-Zr phase may be due to its constraint in the α-matrix.
- It has been established that the β-Nb phase acquires a predominant orientation, corresponding to the phase transformation in the α-matrix, as a result of annealing the Zr-1.0Nb-0.06Fe-0.08O alloy at a temperature of 480 °C—3 h; the texture component {110}<001> corresponding to the recrystallization texture was weak. As the annealing temperature rises above the monotectic temperature, the β-Zr phase is formed in deformed grains, and the β-Nb phase is formed in recrystallized grains.
- It was shown that the amount, structure, and texture of the intermetallic phase are stable both in deformed alloys and when the annealing temperature is increased to 640 ℃.
Supplementary Materials
Author Contributions
Funding
Data Availability Statement
Acknowledgments
Conflicts of Interest
References
- Kocks, U.F.; Tome, C.N.; Wenk, H.R. Texture and Anisotropy; Cambridge University Press: Cambridge, UK, 1998; 675p. [Google Scholar]
- Vishnyakov, Y.D.; Babareko, A.A.; Vladimirov, S.A.; Egiz, I.V. Theory of Texture Formation in Metals and Alloys; Nauka: Moscow, Russia, 1979; 344p. (In Russian) [Google Scholar]
- Perlovich, Y.; Bunge, H.J.; Isaenkova, M. Structure inhomogeneity of rolled textured niobium. Z. Metallk. Mater. Res. Adv. Tech. 2000, 91, 149–159. [Google Scholar]
- Bolmaro, R.E.; Guerra, F.M.; Kocks, U.F.; Browning, R.V.; Dawson, P.R.; Embury, J.D.; Poole, W. On plastic strain distribution and texture development in fiber composites. Acta Metall. Mater. 1993, 41, 1893–1905. [Google Scholar] [CrossRef]
- Poole, W.J.; Embury, J.D.; Kocks, U.F.; Bolmaro, R.E.; Embury, J.D. Texture Development in Cu-W Composites. In Metal Matrix Composites: Processing, Microstructure and Properties; Hansen, N., Jensen, D., Leffers, T., Lilholt, H., Lorentzen, T., Pedersen, A., Pedersen O., B., Ralph, B., Eds.; Risø National Laboratory: Roskilde, Denmark, 1991; pp. 587–593. [Google Scholar]
- Raabe, D.; Heringhaus, F.; Hangen, U.; Gottstein, G. Investigation of a Cu-20 mass% Nb in situ composite. Z. Metallk. 1995, 86, 405–415. [Google Scholar]
- Biselli, C.; Morris, D.G. Microstucture and strength of Cu-Fe in situ composites after very high drawing strains. Acta Mater. 1996, 44, 493–504. [Google Scholar] [CrossRef]
- Aksyonova, T.D.; Boruta, S.S.; Perlovich, Y.A.; Rusakov, A.A.; Kutepov, V.P.; Sytnikov, V.E.; Shikov A., K.; Vorobushkin, V.A. Formation of the structure of Nb and Nb3Sn in composite wires. Issues Nucl. Sci. Technology. Ser. At. Mater. 1985, 21, 58–62. (In Russian) [Google Scholar]
- Lutjering, G.; Williams, J.C. Titanium; Springer: Heidelberg, Germany, 2007; 442p. [Google Scholar]
- Isaenkova, M.G.; Krymskaya, O.A.; Babich, Y.A.; Medvedev, P.N. Effect of the Crystallographic Texture in the α Phase on the Anisotropy of the Properties of Pseudo-α and (α + β) Titanium Alloy Sheets. Russ. Metall. Met. 2021, 2021, 430–436. [Google Scholar] [CrossRef]
- Isaenkova, M.G.; Petrov, M.I.; Kozlov, I.V.; Bogomolova, A.V. Structural features of hydrogenated E110opt and E635 tubes. Non-Ferr. Met. 2023, 1, 41–48. [Google Scholar] [CrossRef]
- Zaimovsky, A.S.; Nikulina, A.V.; Reshetnikov, N.G. Zirconium Alloys in Nuclear Power Engineering; Energoizdat: Moscow, Russia, 1994; 256p. (In Russian) [Google Scholar]
- Shishov, V.N.; Peregud, M.M.; Nikulina, A.V.; Shebaldov, P.V. Influence of Zirconium Alloy Chemical Composition on Microstructure Formation and Irradiation Growth. In Proceedings of the 13th International Symposium on Zirconium in the Nuclear Industry, Annecy, France, 10–14 June 2001; pp. 758–779. [Google Scholar]
- Shishov, V.N. The Evolution of Microstructure and Deformation Stability in Zr–Nb–(Sn,Fe) Alloys Under Neutron Irradiation. In Proceedings of the Zirconium in the Nuclear Industry: 16th International Symposium, Chengdu, China; 2011; pp. 37–66. [Google Scholar] [CrossRef]
- Alekseeva, Z.M.; Korotkova, N.V. Isothermal phase diagrams of Zr-Nb-Fe in the temperature range 1600–850 °C. Russ. Metall. Met. 1989, 1, 199–205. (In Russian) [Google Scholar]
- Kobylyansky, G.P.; Novoselov, A.E.; Obukhov, A.V.; Ostrovsky, Z.E.; Shishov, V.N.; Nikulina, A.V.; Markelov, V.A. Radiation damage to the Zirconium alloy E635 in structural elements of VVER-1000 fuel assemblies. Inorg. Mater. Appl. Res. 2009, 3, 30–41. (In Russian) [Google Scholar]
- Nikulina, A.V.; Markelov, V.A.; Novikov, V.V.; Peregud, M.M.; Konkov, V.F.; Sablin, M.N.; Mileshkina, O.Y. E110M Zirconium alloy for fuel claddings of VVER-1000 and PWR reactors. VANT Ser. Mater. Sci. New Mater. 2018, 4, 22–29. (In Russian) [Google Scholar]
- Averin, S.; Panchenko, V.; Kozlov, A.; Sinelnikov, L.; Shishov, V.; Nikulina, A. Evolution of Dislocation and Precipitate Structure in Zr Alloys Under Long-Term Irradiation. In Proceedings of the Zirconium in the Nuclear Industry: Twelfth International Symposium ASTM STP, West Conshohocken, PA, USA, January 2000; 2000; Volume 1354, pp. 105–121. [Google Scholar] [CrossRef]
- Averin, S.A.; Panchenko, V.L.; Tsygvintsev, V.A.; Pastukhov, V.I. Evolution of the structure of the Zr-2.5%Nb alloy during long-term low-temperature neutron irradiation. Met. Sci. Heat Treat. Met. 2021, 3, 75–80. (In Russian) [Google Scholar]
- Toffolon, C.; Brachet, J.-C.; Servant, C.; Legras, L.; Charquet, D.; Barberis, P.; Mardon, J. Experimental Study and Preliminary Thermodynamic Calculations of the Pseudo-Ternary Zr-Nb-Fe-(O,Sn) System. In Proceedings of the Zirconium in the Nuclear Industry: Thirteenth International Symposium, ASTM STP; ASTM International: West Conshohocken, PA, USA, 2002; Volume 1423, pp. 361–383. [Google Scholar] [CrossRef]
- Ramos, C.; Saragovi, C.; Granovsky, M.S. Some new experimental results on the Zr–Nb–Fe system. J. Nucl. Mater. 2007, 366, 198–205. [Google Scholar] [CrossRef]
- Isaenkova, M.G.; Krymskaya, O.A.; Klyukova, K.E.; Bogomolova, A.V.; Dzhumaev, P.S.; Kozlov, I.V.; Fesenko, V.A. Comparison of the texture analysis results of zirconium alloys according to the data of backscattered electron diffraction and X-ray radiation of different power. Lett. Mater. 2023, 13(4), 341–346. [Google Scholar]
- Isaenkova, M.; Perlovich, Y.; Fesenko, V. Modern methods of experimental construction of texture complete direct pole figures by using X-ray data. IOP Conf. Ser. Mater. Sci. Eng. 2016, 130, 012055. [Google Scholar] [CrossRef]
- Perlovich, Y.A.; Isaenkova, M.G.; Krymskaya, O.A.; Fesenko, V.A.; Babich, Y.A. Optimization of the procedure for determining integral texture parameters of products from zirconium-based alloys using the orientation distribution function. IOP Conf. Ser. Mater. Sci. Eng. 2016, 130, 012056. [Google Scholar] [CrossRef]
- Pawlik, K. Determination of the orientation distribution function from pole figures in arbitrarily defined cells. Phys. Status Solidi B 1986, 134, 477–483. [Google Scholar] [CrossRef]
- LaboTex. Version 3.0; LaboSoft: Krakow, Poland; Available online: http://www.labosoft.com.pl (accessed on 10 August 2023).
- Lutterotti, L.; Vasin, R.; Wenk, H.-R. Rietveld texture analysis from synchrotron diffraction images. I. Calibration and basic analysis. Powder Diffr. 2014, 29, 76–84. [Google Scholar] [CrossRef]
- Wenk, H.-R.; Lutterotti, L.; Kaercher, P.; Kanitpanyacharoen, W.; Miyagi, L.; Vasin, R. Rietveld texture analysis from synchrotron diffraction images. II. Complex multiphase materials and diamond anvil cell experiments. Powder Diffr. 2014, 29, 220–232. [Google Scholar] [CrossRef]
- Benatti, E.A.; De Vincentis, N.S.; Al-Hamdany, N.; Schell, N.; Brokmeier, H.-G.; Avalos, M.; Bolmaro, R.E. Generalized pole figures from post-processing whole Debye–Scherrer patterns for microstructural analysis on deformed materials. J. Synchrotron Radiat. 2022, 29, 732–748. [Google Scholar] [CrossRef]
- Von Dreele, R.B. Quantitative texture analysis by Rietveld refinement. J. Appl. Crystallogr. 1997, 30, 517–525. [Google Scholar] [CrossRef]
- Saville, A.I.; Creuziger, A.; Mitchell, E.B.; Vogel, S.C.; Benzing, J.T.; Klemm-Toole, J.; Clarke, K.D.; Clarke, A.J. MAUD Rietveld Refinement Software for Neutron Diffraction Texture Studies of Single- and Dual-Phase Materials. Integr. Mater. Manuf. Innov. 2021, 10, 461–487. [Google Scholar] [CrossRef]
- MTEX Software for Analyzing and Modeling Crystallographic Textures by Means of EBSD or Pole Figure Data (TU Chemnitz, Germany). Available online: https://mtex-toolbox.github.io/Documentation (accessed on 10 August 2023).
- Engler, O.; Randle, V. Introduction to Texture Analysis; CRC Press LLC: Boca Raton, FL, USA, 2009; 488p. [Google Scholar] [CrossRef]
- Tsai, S.-P.; Konijnenberg, P.J.; Gonzalez, I.; Hartke, S.; Griffiths, T.A.; Herbig, M.; Kawano-Miyata, K.; Taniyama, A.; Sano, N.; Zaefferer, S. Development of a new, fully automated system for electron backscatter diffraction (EBSD)-based large volume three-dimensional microstructure mapping using serial sectioning by mechanical polishing, and its application to the analysis of special boundaries in 316L stainless steel. Rev. Sci. Instrum. USA 2022, 93, 093707. [Google Scholar] [CrossRef]
- Rietveld, H.M. The Rietveld Method: A Retrospection. Z. Krist. 2010, 225, 545–547. [Google Scholar] [CrossRef]
- Isaenkova, M.G.; Klyukova, K.E.; Krymskaya, O.A.; Fesenko, V.A.; Dzhumaev, P.S. Regularities of changes in the structure and texture of sheets and tubes made of E635 and E110 alloys of modified composition according to the results of X-ray and electron microscopic analysis. VANT Ser. Mater. Sci. New Mater. 2023, 1, 15–33. (In Russian) [Google Scholar]
- Klyukova, K.E.; Isaenkova, M.G.; Krymskaya, O.A.; Fesenko, V.A. Crystallographic texture and structure formed in rolled sheets of zirconium alloys during annealing. Tsvetnye Met. 2022, 10, 19–26. [Google Scholar] [CrossRef]
- Gorelik, S.S. Recrystallization of Metals and Alloys; Metallurgy: Moscow, Russia, 1967; 402p. (In Russian) [Google Scholar]
- Zhu, K.Y.; Bacroix, B.; Chauveau, T.; Chaubet, D.; Castelnau, O. Texture Evolution and Associated Nucleation and Growth Mechanisms during Annealing of a Zr Alloy. Metall. Mater. Trans. A 2009, 40, 2423–2434. [Google Scholar] [CrossRef]
- Jung, T.-S.; Jang, H.; Mok, Y.-K.; Yoo, J.-S. Analysis of EBSD image quality related to microstructure evolution in zirconium–niobium cladding to quantify the degree of recrystallization. J. Nucl. Mater. 2018, 509, 188–197. [Google Scholar] [CrossRef]
- Gerspach, F.; Bozzolo, N.; Wagner, F. About texture stability during primary recrystallization of cold-rolled low alloyed zirconium. Scr. Mater. 2009, 60, 203–206. [Google Scholar] [CrossRef]


Disclaimer/Publisher’s Note: The statements, opinions and data contained in all publications are solely those of the individual author(s) and contributor(s) and not of MDPI and/or the editor(s). MDPI and/or the editor(s) disclaim responsibility for any injury to people or property resulting from any ideas, methods, instructions or products referred to in the content. |
© 2023 by the authors. Licensee MDPI, Basel, Switzerland. This article is an open access article distributed under the terms and conditions of the Creative Commons Attribution (CC BY) license (https://creativecommons.org/licenses/by/4.0/).
Share and Cite
Isaenkova, M.; Krymskaya, O.; Klyukova, K.; Bogomolova, A.; Kozlov, I.; Dzhumaev, P.; Fesenko, V.; Svetogorov, R. Regularities of Changes in the Structure of Different Phases of Deformed Zirconium Alloys as a Result of Raising the Annealing Temperature According to Texture Analysis Data. Metals 2023, 13, 1784. https://doi.org/10.3390/met13101784
Isaenkova M, Krymskaya O, Klyukova K, Bogomolova A, Kozlov I, Dzhumaev P, Fesenko V, Svetogorov R. Regularities of Changes in the Structure of Different Phases of Deformed Zirconium Alloys as a Result of Raising the Annealing Temperature According to Texture Analysis Data. Metals. 2023; 13(10):1784. https://doi.org/10.3390/met13101784
Chicago/Turabian StyleIsaenkova, Margarita, Olga Krymskaya, Kristina Klyukova, Anastasya Bogomolova, Ilya Kozlov, Pavel Dzhumaev, Vladimir Fesenko, and Roman Svetogorov. 2023. "Regularities of Changes in the Structure of Different Phases of Deformed Zirconium Alloys as a Result of Raising the Annealing Temperature According to Texture Analysis Data" Metals 13, no. 10: 1784. https://doi.org/10.3390/met13101784