Article

Sn-0.5Cu(-x)Al Solder Alloys: Microstructure-Related Aspects and Tensile Properties Responses

by
Thiago Soares Lima
1,
Guilherme Lisboa de Gouveia
2,
Rudimylla da Silva Septimio
1,
Clarissa Barros da Cruz
1,
Bismarck Luiz Silva
3,
Crystopher Brito
4,*,
José Eduardo Spinelli
2 and
Noé Cheung
1
1
Department of Manufacturing and Materials Engineering, University of Campinas-UNICAMP, 13083-860 Campinas, Brazil
2
Department of Materials Engineering, Federal University of São Carlos-UFSCar, 13565-905 São Carlos, Brazil
3
Department of Materials Engineering, Federal University of Rio Grande do Norte-UFRN, 59078-970 Natal, Brazil
4
Campus of São João da Boa Vista, São Paulo State University-UNESP, 13876-750 São João da Boa Vista, Brazil
*
Author to whom correspondence should be addressed.
Metals 2019, 9(2), 241; https://doi.org/10.3390/met9020241
Submission received: 31 January 2019 / Revised: 11 February 2019 / Accepted: 12 February 2019 / Published: 17 February 2019

Abstract

:
In this study, experiments were conducted to analyze the effect of 0.05 and 0.1 wt.% Al additions during the unsteady-state growth of the Sn-0.5wt.%Cu solder alloy. Various as-solidified specimens of each alloy were selected so that tensile tests could also be performed. Microstructural aspects such as the dimensions of primary, λ1, and secondary, λ2, dendritic arrays, and intermetallic compounds (IMCs) morphologies were comparatively assessed for the three tested compositions, that is, Sn-0.5wt.%Cu, Sn-0.5wt.%Cu-0.05wt.%Al, and Sn-0.5wt.%Cu-0.1wt.%Al alloys. Al addition affected neither the primary dendritic spacing nor the types of morphologies identified for the Cu6Sn5 IMC, which was found to be either globular or fibrous regardless of the alloy considered. Secondary dendrite arm spacing was found to be enlarged and the eutectic fraction was reduced with an increase in the Al-content. Tensile properties remained unaffected with the addition of Al, except for the improvement in ductility of up to 40% when compared to the Sn-0.5wt.%Cu alloy without Al trace. A smaller λ2 in size was demonstrated to be the prime microstructure parameter associated with the beneficial effect on the strength of the Sn-0.5wt.%Cu(-x)Al alloys.

1. Introduction

Solder alloys play a crucial role in the reliability of electronic systems. Therefore, these alloys must not only provide a set of properties to fulfill both the mechanical and electrical demands, but should also not increase the cost-effective production of electronic assemblies. Traditional Sn–Pb solder alloys have been widely used as they best meet the aforementioned requirements [1]. However, due to the inherent toxicity of lead (Pb), these alloys have been increasingly banned worldwide [2].
Lead free solder alloys have been investigated with the view to replacing Pb containing solders. Among the several candidate alloy systems that have emerged as substitutes, the Sn–Cu system has received significant attention due to its low melting point and low cost [3,4,5]. The demands for the improvement of the mechanical performance of the solder joints has generated the need to optimize the composition and manufacturing processing without compromising other soldering properties such as wettability, solderability, electrical and thermal conductivity. In this context, minor additions of a third element such as Ni, Bi, Co, Zn, Ag, In, and Al have been used to enhance the properties of a Sn–Cu based Pb-free solder [6,7,8,9,10,11,12,13,14]. It is important to stress that each mentioned elements can play a specific role on the resulting solder.
The microstructure of the solder significantly influences its mechanical properties, and consequently, its performance during the service. In this sense, it is important to establish correlations between the microstructural features such as morphology, quantity, size, and the distribution of phases and resulting properties in the pre-programming of the optimized final properties in the solder alloys. Recent studies have stressed that small additions of Al can refine the microstructure, leading to an improvement in the mechanical behavior of solder alloys [15,16,17].
According to Koo et al. [18], remarkable microstructural changes can be achieved in the Sn–Cu solders if a small amount of Al is added. These authors investigated the influence of minor Al additions (0.01 to 0.05 wt.%) in Sn-0.5wt.%Cu and observed the formation of the Cu–Al (δ-Cu33Al17) intermetallic. According to this research, the eutectic β-Sn + Cu6Sn5 structure in the β-Sn matrix was effectively suppressed. As δ-Cu33Al17 was found to be the first phase to solidify, it may act as a nucleation site promoting the refinement of eutectic β-Sn + Cu6Sn5. The correlation between the microstructural features and mechanical properties were not disclosed in this investigation. Yang et al. [7] reported the effect of Al on the microstructure and mechanical properties of Sn-0.7wt.%Cu-xwt.%Al (x = 0–0.075) and found that the microstructure of the Sn–Cu solder alloy was refined and the wettability was improved when this element was added. The alloy containing 0.075wt.%Al demonstrated superior mechanical properties among all of the analyzed compositions. Nevertheless, this study did not address either the solidification mechanism or its influence on the formation of the microstructures. Furthermore, the absence of correlations with the mechanical properties were noticed.
A previous study [19] proposed validating the effect of cellular (λc) spacing on the Sn-0.7wt.%Cu(-xNi) alloy’s strength by modifying the classical Hall–Petch relationship (σ = σ0 + kd−1/2). The mean grain size, d, was replaced with λc. Binary Sn-0.7wt.%Cu alloy samples as well as those containing 500 and 1000 ppm of Ni were generated by solidified casting under a transient cooling condition. High strength was obtained for the samples with finer eutectic cells for both the Sn-0.7wt%Cu-0.05 and 0.1wt%Ni alloys in comparison to the values measured for the binary Sn-0.7wt.%Cu alloy.
Cooling rate is a processing variable of prime importance during soldering operations since it directly affects the microstructure of the alloy, which, in turn, defines the resulting properties [20,21,22]. A number of studies related to the relationship of the microstructure–mechanical properties of solder alloys can be found in the literature [13,23,24], however, studies on the Sn–Cu–Al alloy system reporting on the microstructural development and resulting mechanical properties have not been developed thus far in the literature, especially in the case of high cooling rates. The aim of this investigation was to perform a systematic study to show the connection between cooling rate, microstructure, and the tensile response of the Sn-0.5wt.%Cu-xwt.%Al (x = 0.05 and 0.1 Al) solder alloys obtained through transient directional solidification using a water-cooled directional solidification system. This method allowed for a wide range of cooling rates to be investigated in a single experiment including those typical in soldering practice.

2. Experimental Procedure

In this study, three compositions were tested: Sn-0.5wt.%Cu, Sn-0.5wt.%Cu-0.05wt.%Al, and Sn-0.5wt.%Cu-0.1wt.%Al alloys. Therefore, the modification levels in Al were 500 (0.05 wt.%) and 1000 (0.1 wt.%) ppm. The alloys were prepared using commercial purity elements in a fixed proportion. The composition of each metal used to prepare the alloys is shown in Table 1. These elements were melted in a refractory crucible inside a muffle furnace (Brasimet, Jundiaí, Brazil) heated by Kanthal-A1 heating elements under an argon atmosphere. Sn was melted first, then Cu and Al pieces were added to the molten bath. All metal components were mixed well and re-melted a further three times to guarantee homogenization. The molten alloy was then poured into the casting chamber (AFFIPS, Campinas, Brazil) of the directional solidification apparatus. For each alloy, a cast part was generated. In order to produce them, the alloys were directionally solidified (DS) by using a water-cooled setup. The utilized system allowed for unsteady-state solidification conditions to be attained, which means that the temperature varies with time and position across the casting.
The solidification system was built in such a way that the alloy could be remelted in situ, being heated by radial electrical wiring around a cylindrical stainless steel crucible. The heating stage may be suppressed when the melt temperature achieves 10% above the alloy liquidus temperature. At the same time, the water inlet at the bottom of the crucible may be initiated. After, the variation of temperature is monitored and registered by a set of thermocouples laterally inserted in strategic positions across the length of the casting. Fine type J thermocouples (0.2 mm diameter wire) were used inside the molten material in different positions from the water-cooled surface of the casting. The calculation of the cooling rates (Ṫ), growth rates (V), and thermal gradients (G) was possible thanks to the thermal data associated with the solidification stage. The ternary Sn-0.5wt.%Cu-0.1wt.%Al alloy was also solidified in a stepped copper mold using centrifugal casting under an Ar atmosphere. This alloy was melted in situ and the heating system was power controlled to achieve a desired melting temperature at which the heating system was turned off and the mold rotated, permitting the molten alloy to rapidly solidify by the mold surface.
The microstructures were examined by means of an Olympus inverted metallurgical microscope model 41GX (Olympus Co., Tokyo, Japan) and a scanning electron microscope (EDS/SEM) from Zeiss (Oberkochen, Germany, Auriga 40 model).
The revealed dendritic microstructures allowed for measurements of the primary dendritic spacing (λ1) and the secondary dendrite arm spacing (λ2) by virtue of the triangle and intercept methods, respectively [25] (Figure 1). The spacing between the Cu6Sn5 globules and between the Cu6Sn5 fibers were also experimentally characterized by identifying regions with a predominance of either globular (round) or fibrous shapes.
The instrument used to determine the Cu and Al contents on the longitudinal section of the DS casting was a Rigaku Rix 3100 x-ray fluorescence (XRF) spectrometer. The x-ray diffraction (XRD) patterns for indexing the formed phases were acquired by a Siemens D5000 diffractometer with a 2-theta range from 20° to 90°, CuKα radiation, and a wavelength, λ, of 0.15406 nm. Both devices are from Shimadzu (Kyoto, Japan).
The tensile strengths and elongations of the Sn–Cu–Al solder alloys were investigated using a MTS 810 machine according to the specifications of the ASTM Standard E 8M/04 at a strain rate of 2.5 × 10⁻³ s−1. The tensile samples were machined in a dog-bone shape with a gage length of 30 mm, a width of 4 mm, and thickness of 2 mm.

3. Results and Discussions

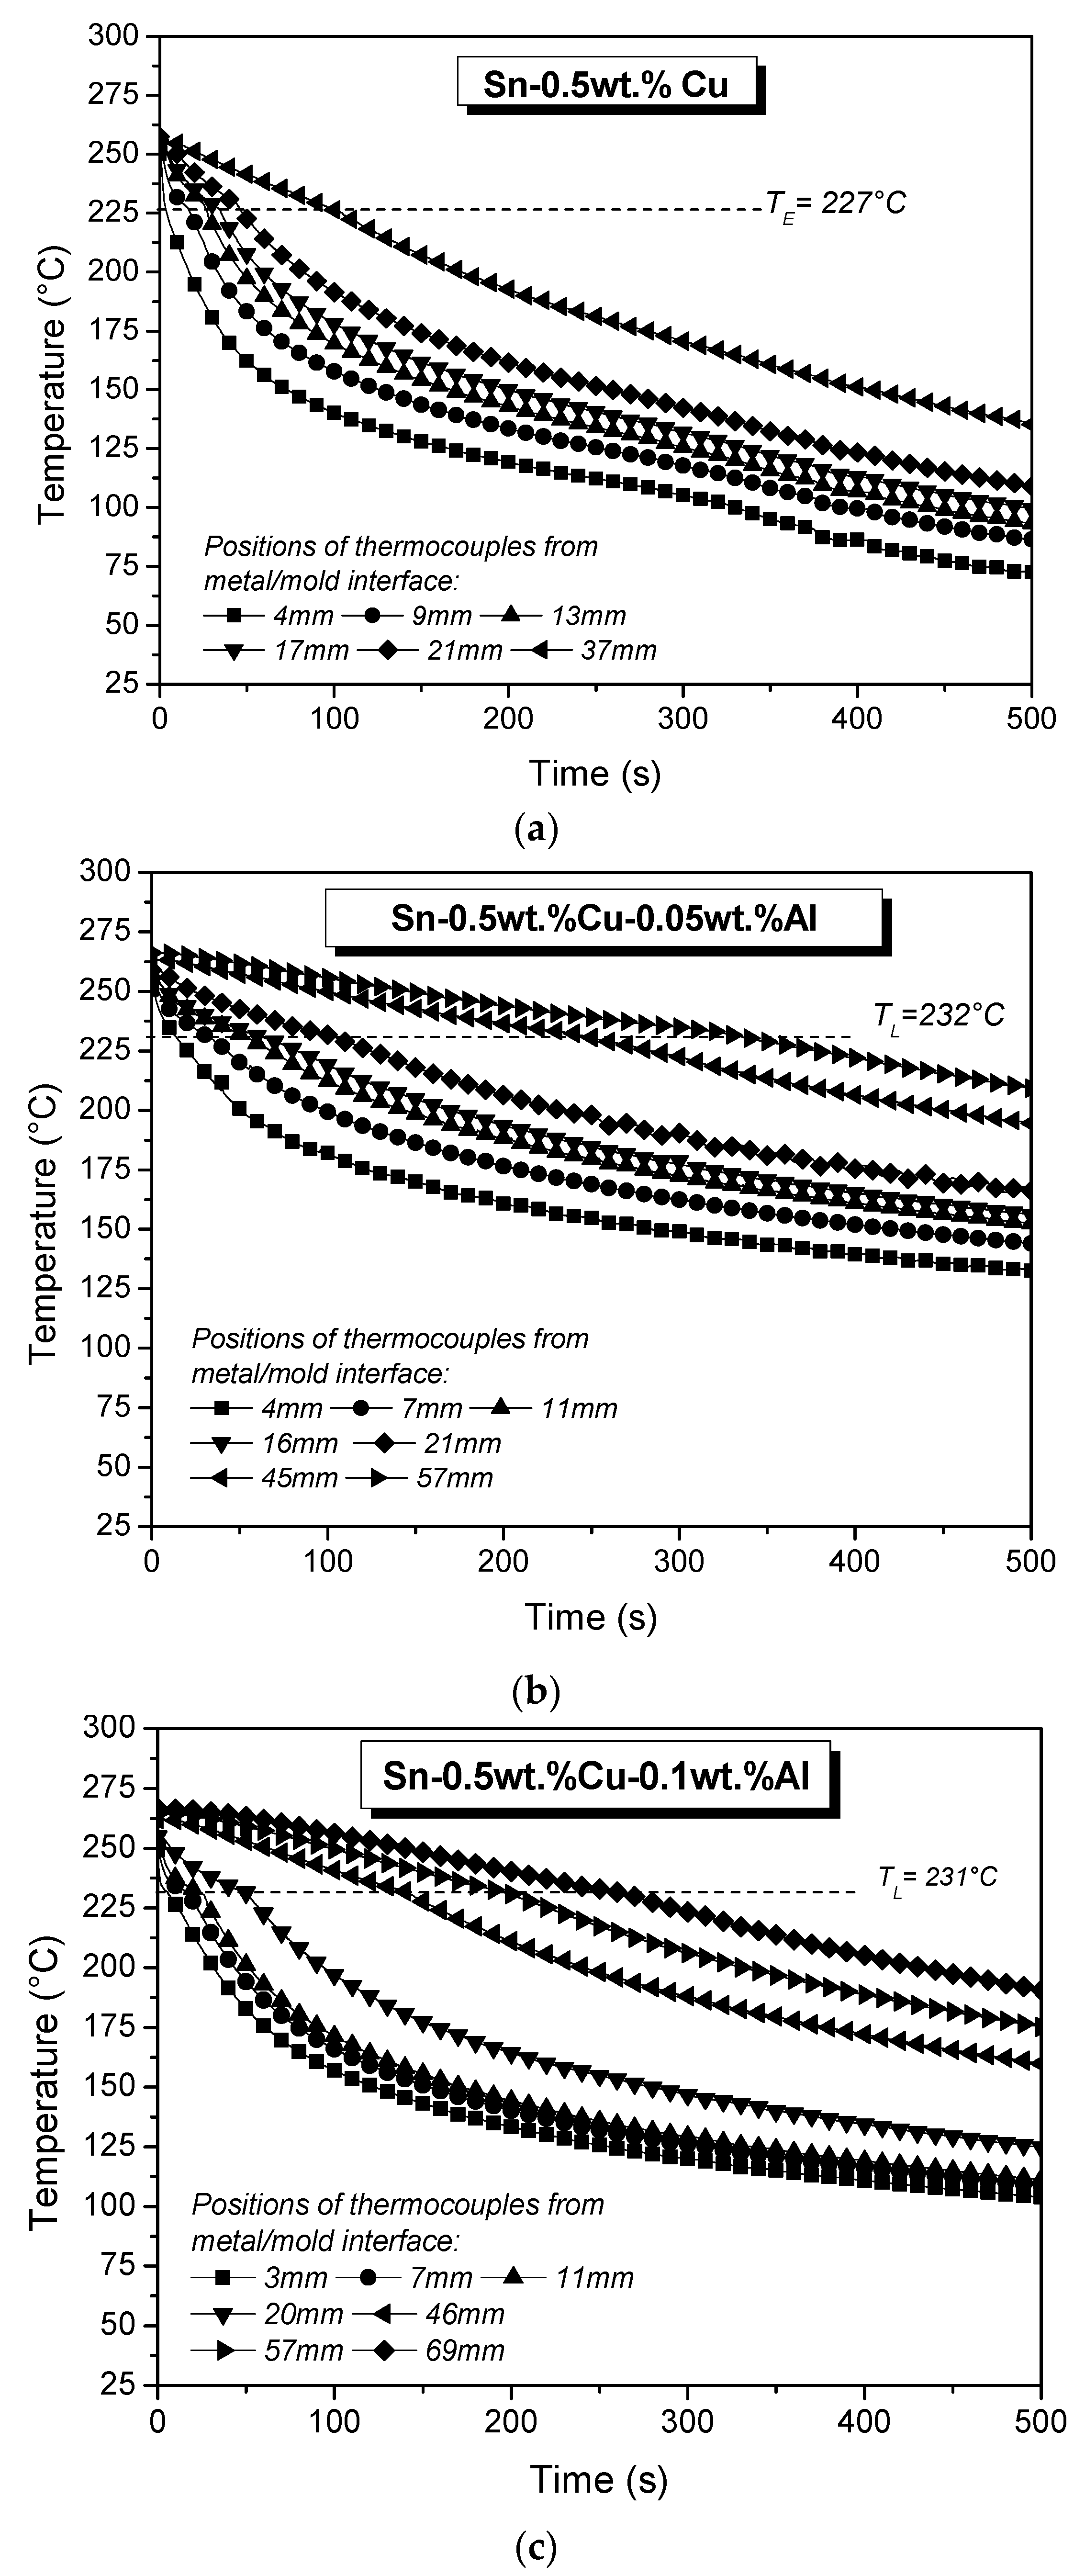
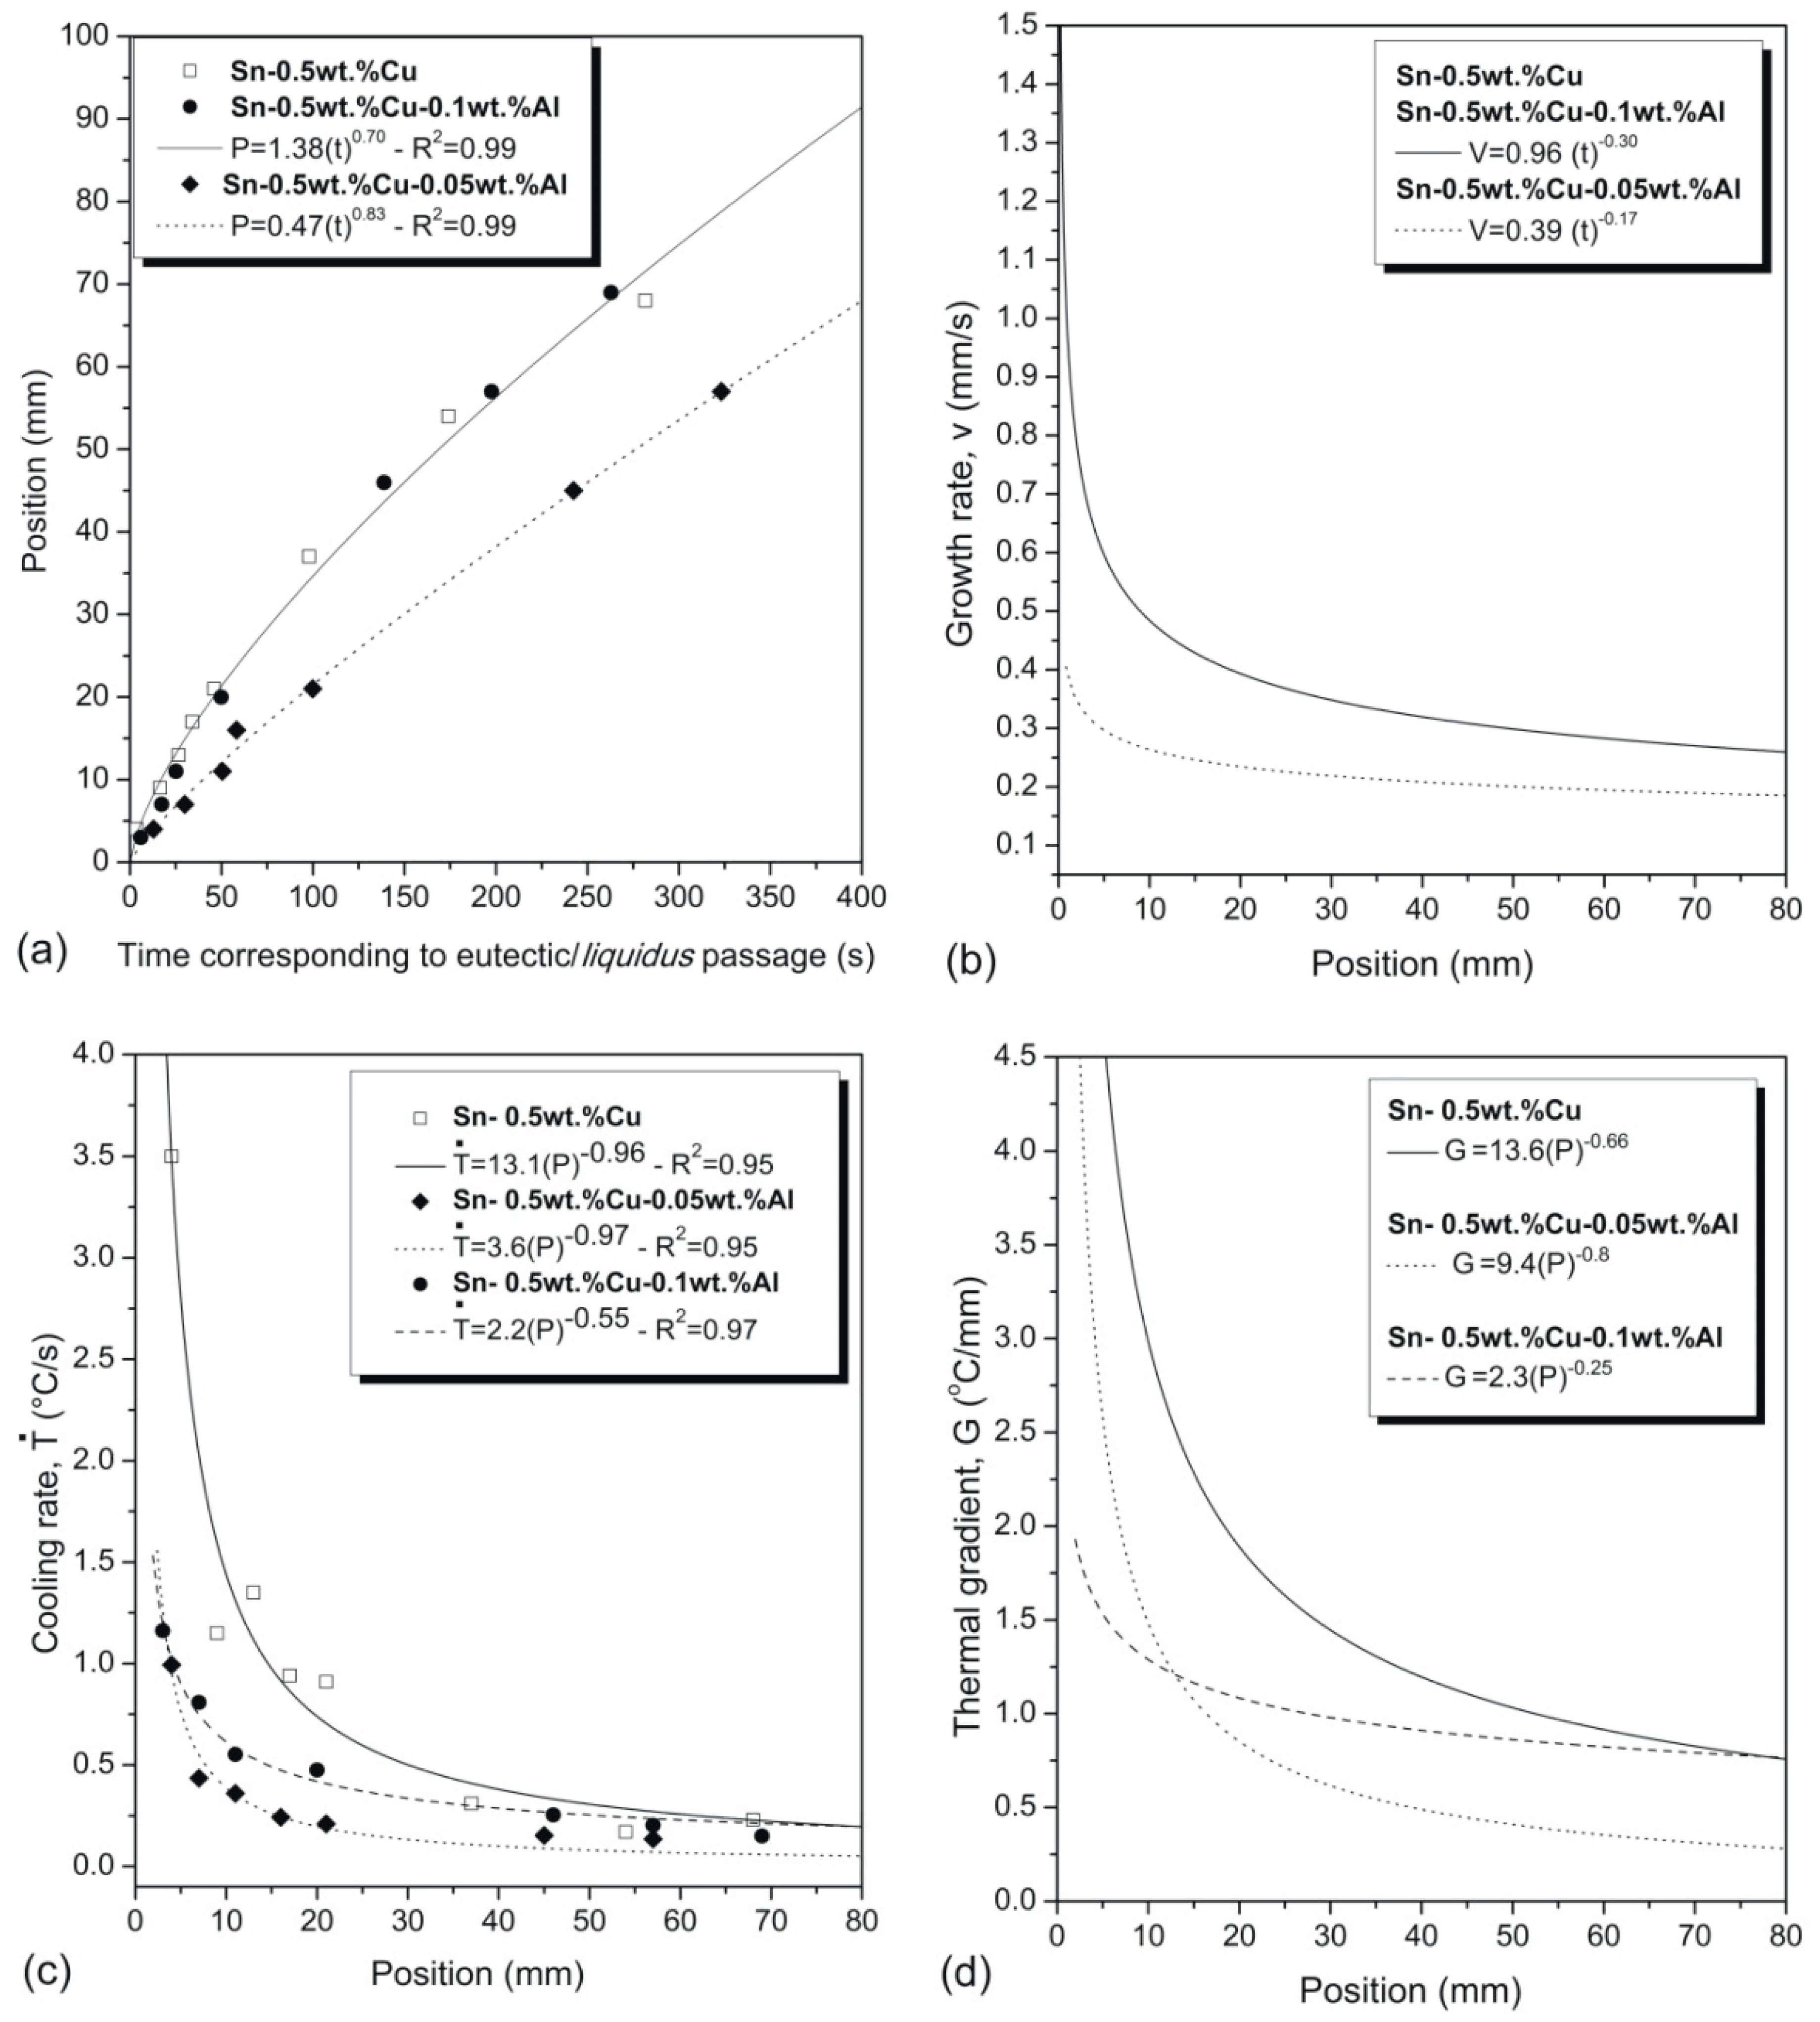
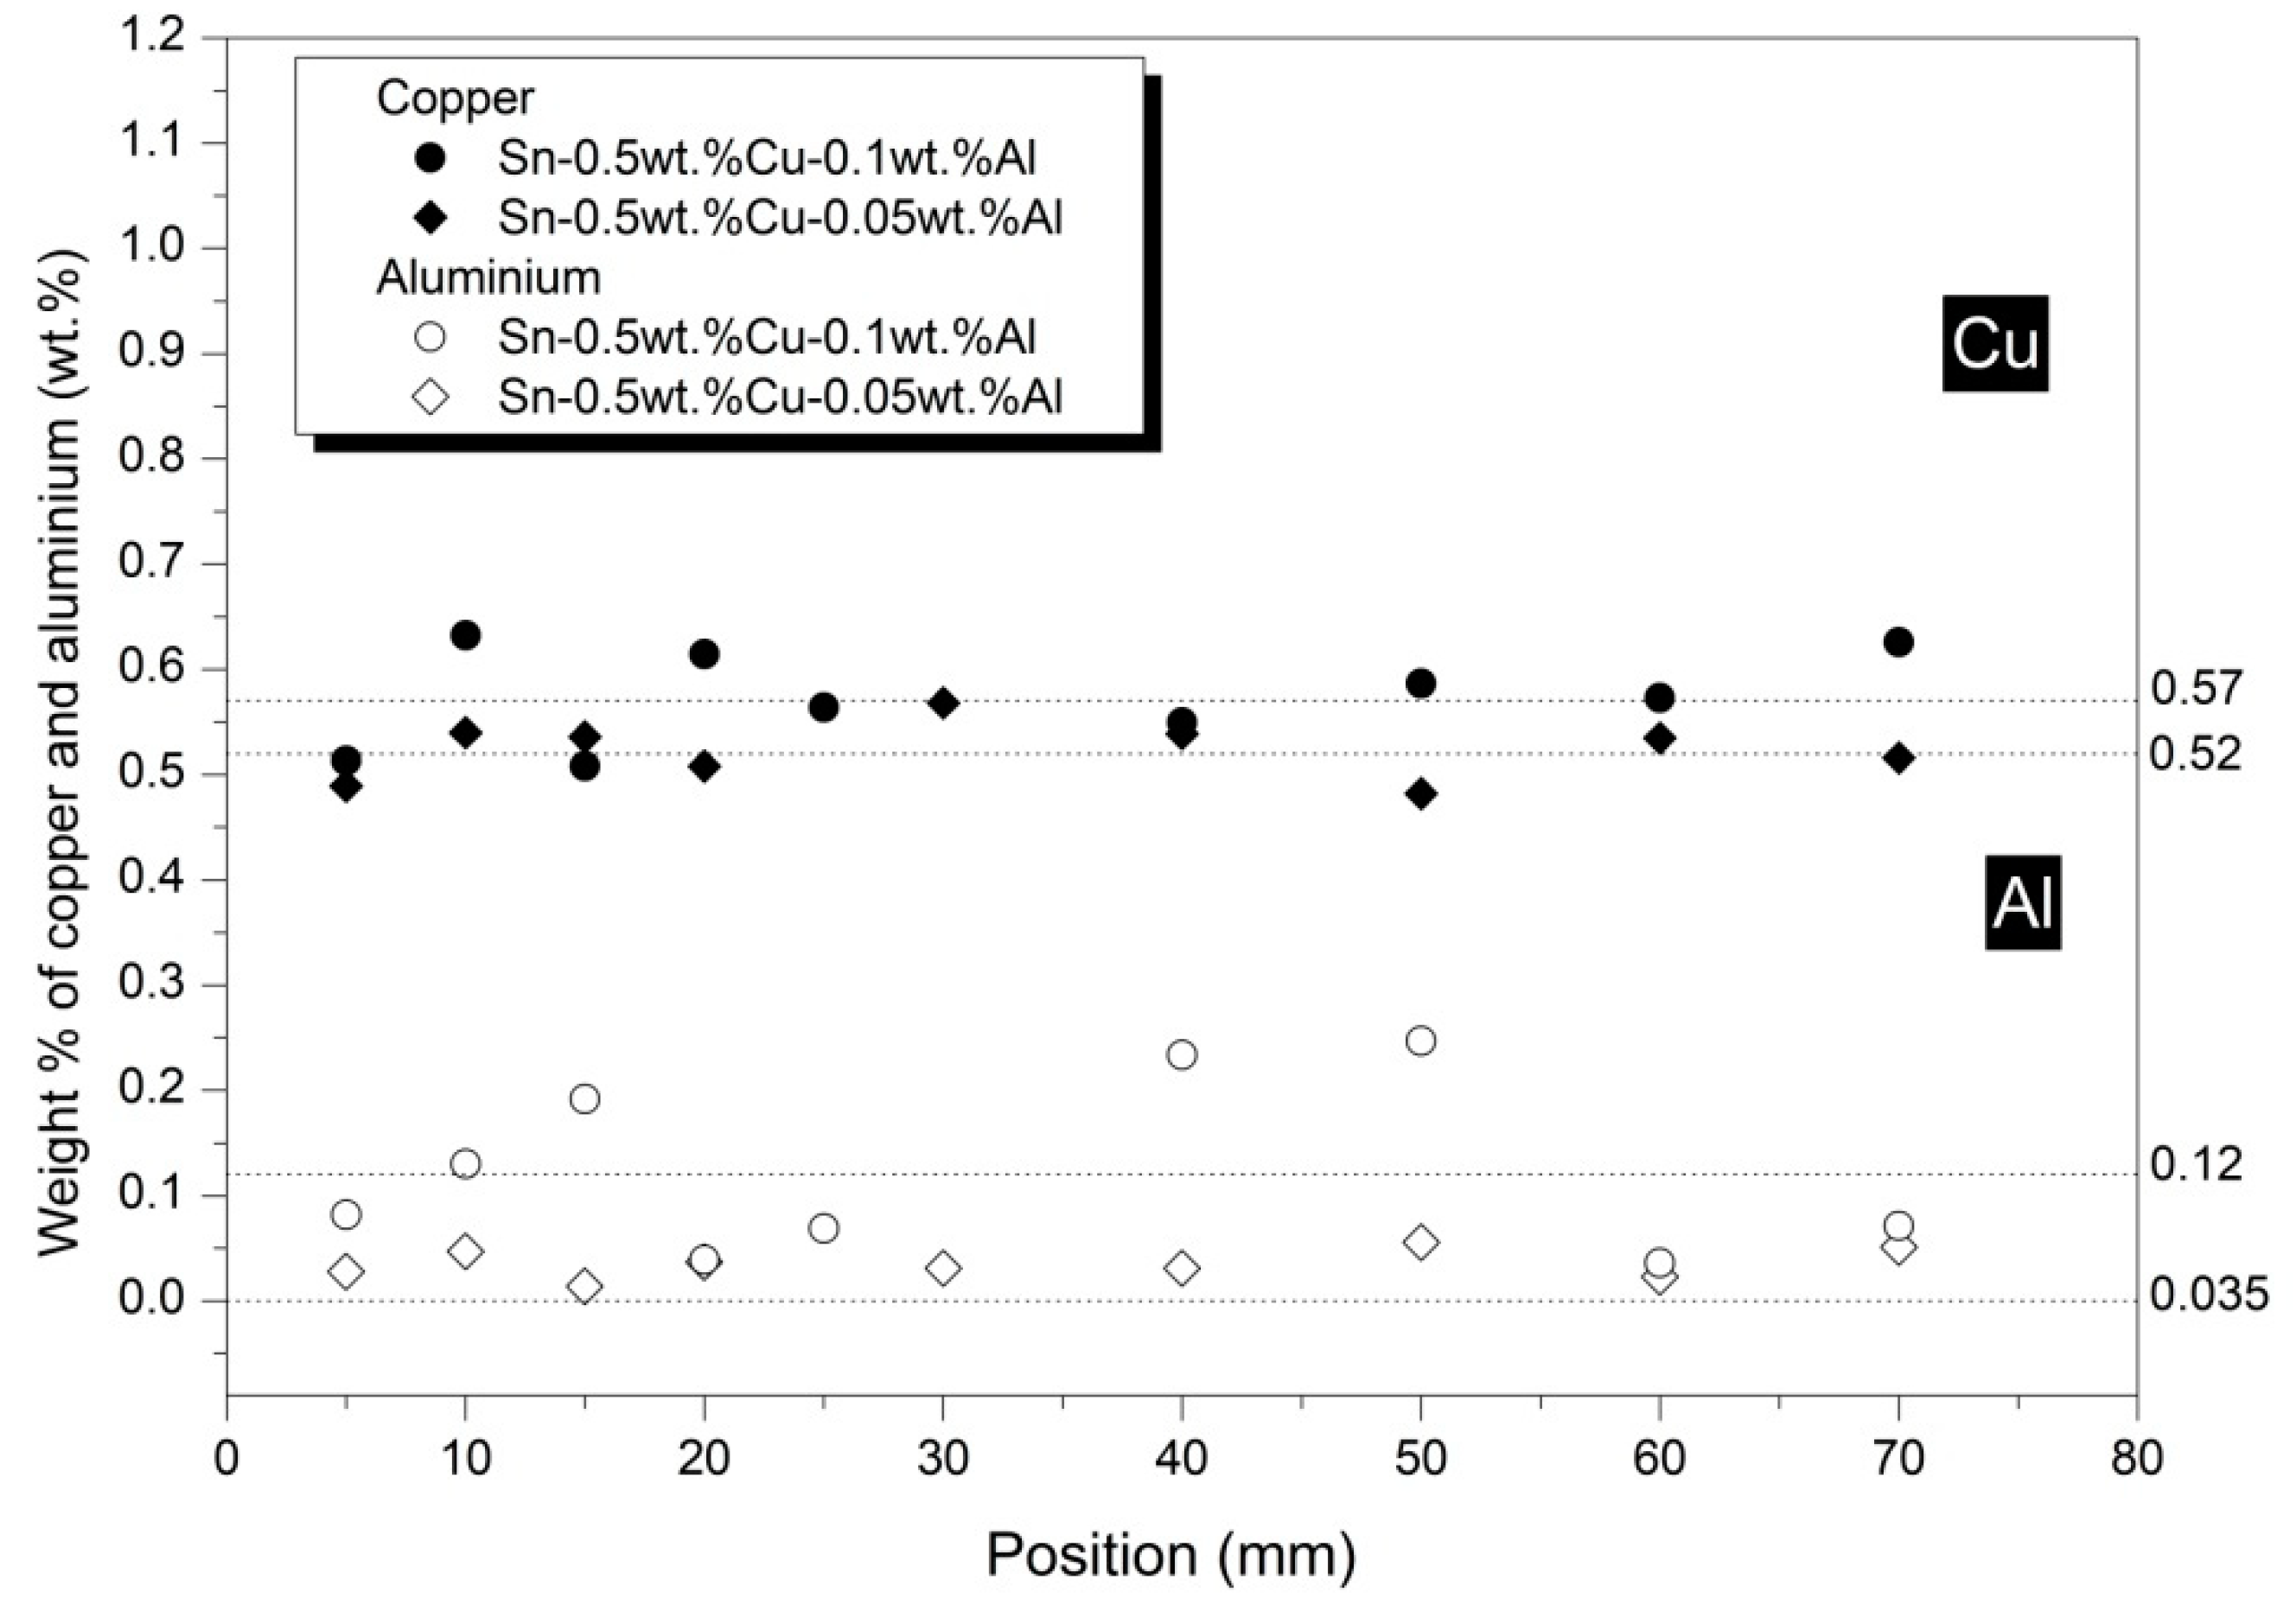
3.1. Solidification Thermal Parameters and Macrosegregation Profiles

The cooling curves acquired during directional solidification of the Sn-0.5wt.%Cu and Sn-0.5wt.%Cu-xwt.%Al (x = 0.05 and 0.1) alloys are shown in Figure 2, which were obtained from a set of thermocouples placed along the centerline of the casting along its length. Thermocouples may have the positions of their tips slightly changed during the assembling procedure into the mold. In this sense, the positions of the thermocouples took their reference from the metal/mold interface obtained from the post mortem longitudinal sections of the solidified ingot containing the thermocouple tip. For positions closer to the cooled bottom of the castings, a sharper drop in the temperature was observed. For other positions, the rate of cooling decreased progressively due to the increase in the thermal resistance associated with the increasing thickness of the solid layer from the heat-extracting base and due to the increase in the metal/mold interface thermal resistance in addition to the metal contraction dynamics along the solidification.
Figure 3a shows the plot of position (P) from the metal/mold interface and the corresponding time (t) of the eutectic/liquidus fronts passing by each thermocouple, concerning the eutectic alloy and the ternary alloys, respectively. A function of type P = atb, with ‘a’ and ‘b’ being constants, was used to fit these experimental points. The derivative of this function with respect to time yielded another function for the tip growth rate (V) (Figure 3b). It can be realized that the addition of 0.1 wt.%Al into the Sn-0.5wt.%Cu alloy did not affect the growth rate, since the binary alloy and this ternary alloy presented the same (V) profile. On the other hand, the addition of 0.05wt.%Al generated a lower (V) profile than the aforementioned one. The cooling rate (Ṫ), as shown in Figure 3c, was determined by computing the time-derivative (dT/dt) of each cooling curve after the passage of the liquidus and eutectic isotherms. In contrast to the (V) profiles, (Ṫ) ones did not follow the same behavior. This can be explained by the definition of the cooling rate, which is the product between the thermal gradient and growth rate, i.e., (Ṫ) = G.V. Although they presented the same (V) profiles, the Sn-0.5wt.%Cu and Sn-0.5wt.%Cu-0.1wt.%Al alloys differed from each other by having distinct thermal gradients (G) (Figure 3d).
Figure 4a–c show that columnar macrostructures prevailed along the entire casting length for all alloy compositions examined. The grains’ growth direction was predominantly parallel to the heat extraction. No evidence of equiaxed grains was observed. Figure 5 shows the Cu and Al contents along the entire DS casting length, obtained by x-ray fluorescence (XRF). The average contents of Cu and Al were close to the nominal composition of the alloys. Although higher fluctuations of the Al content were observed in the Sn-0.5wt.%Cu-0.1wt.%Al alloy, it could not be considered a segregation since there was no tendency of increase or decrease in the Al profile. It is worth noting that Al will be mainly constricted in the Sn-rich primary phase since a very small solidification freezing range and complex dendritic arrangement may avoid this light element being transferred to the open liquid. As such, a prime factor appears to contribute to the observed fluctuations in the Al content demonstrated throughout the macrosegregation profiles. This is the thermal instability induced by the unsteady-state regime of heat flow extraction during the growth of the Sn-rich phase. The Al profiles are mainly a consequence of this unsteadiness, which is inherent in the process.

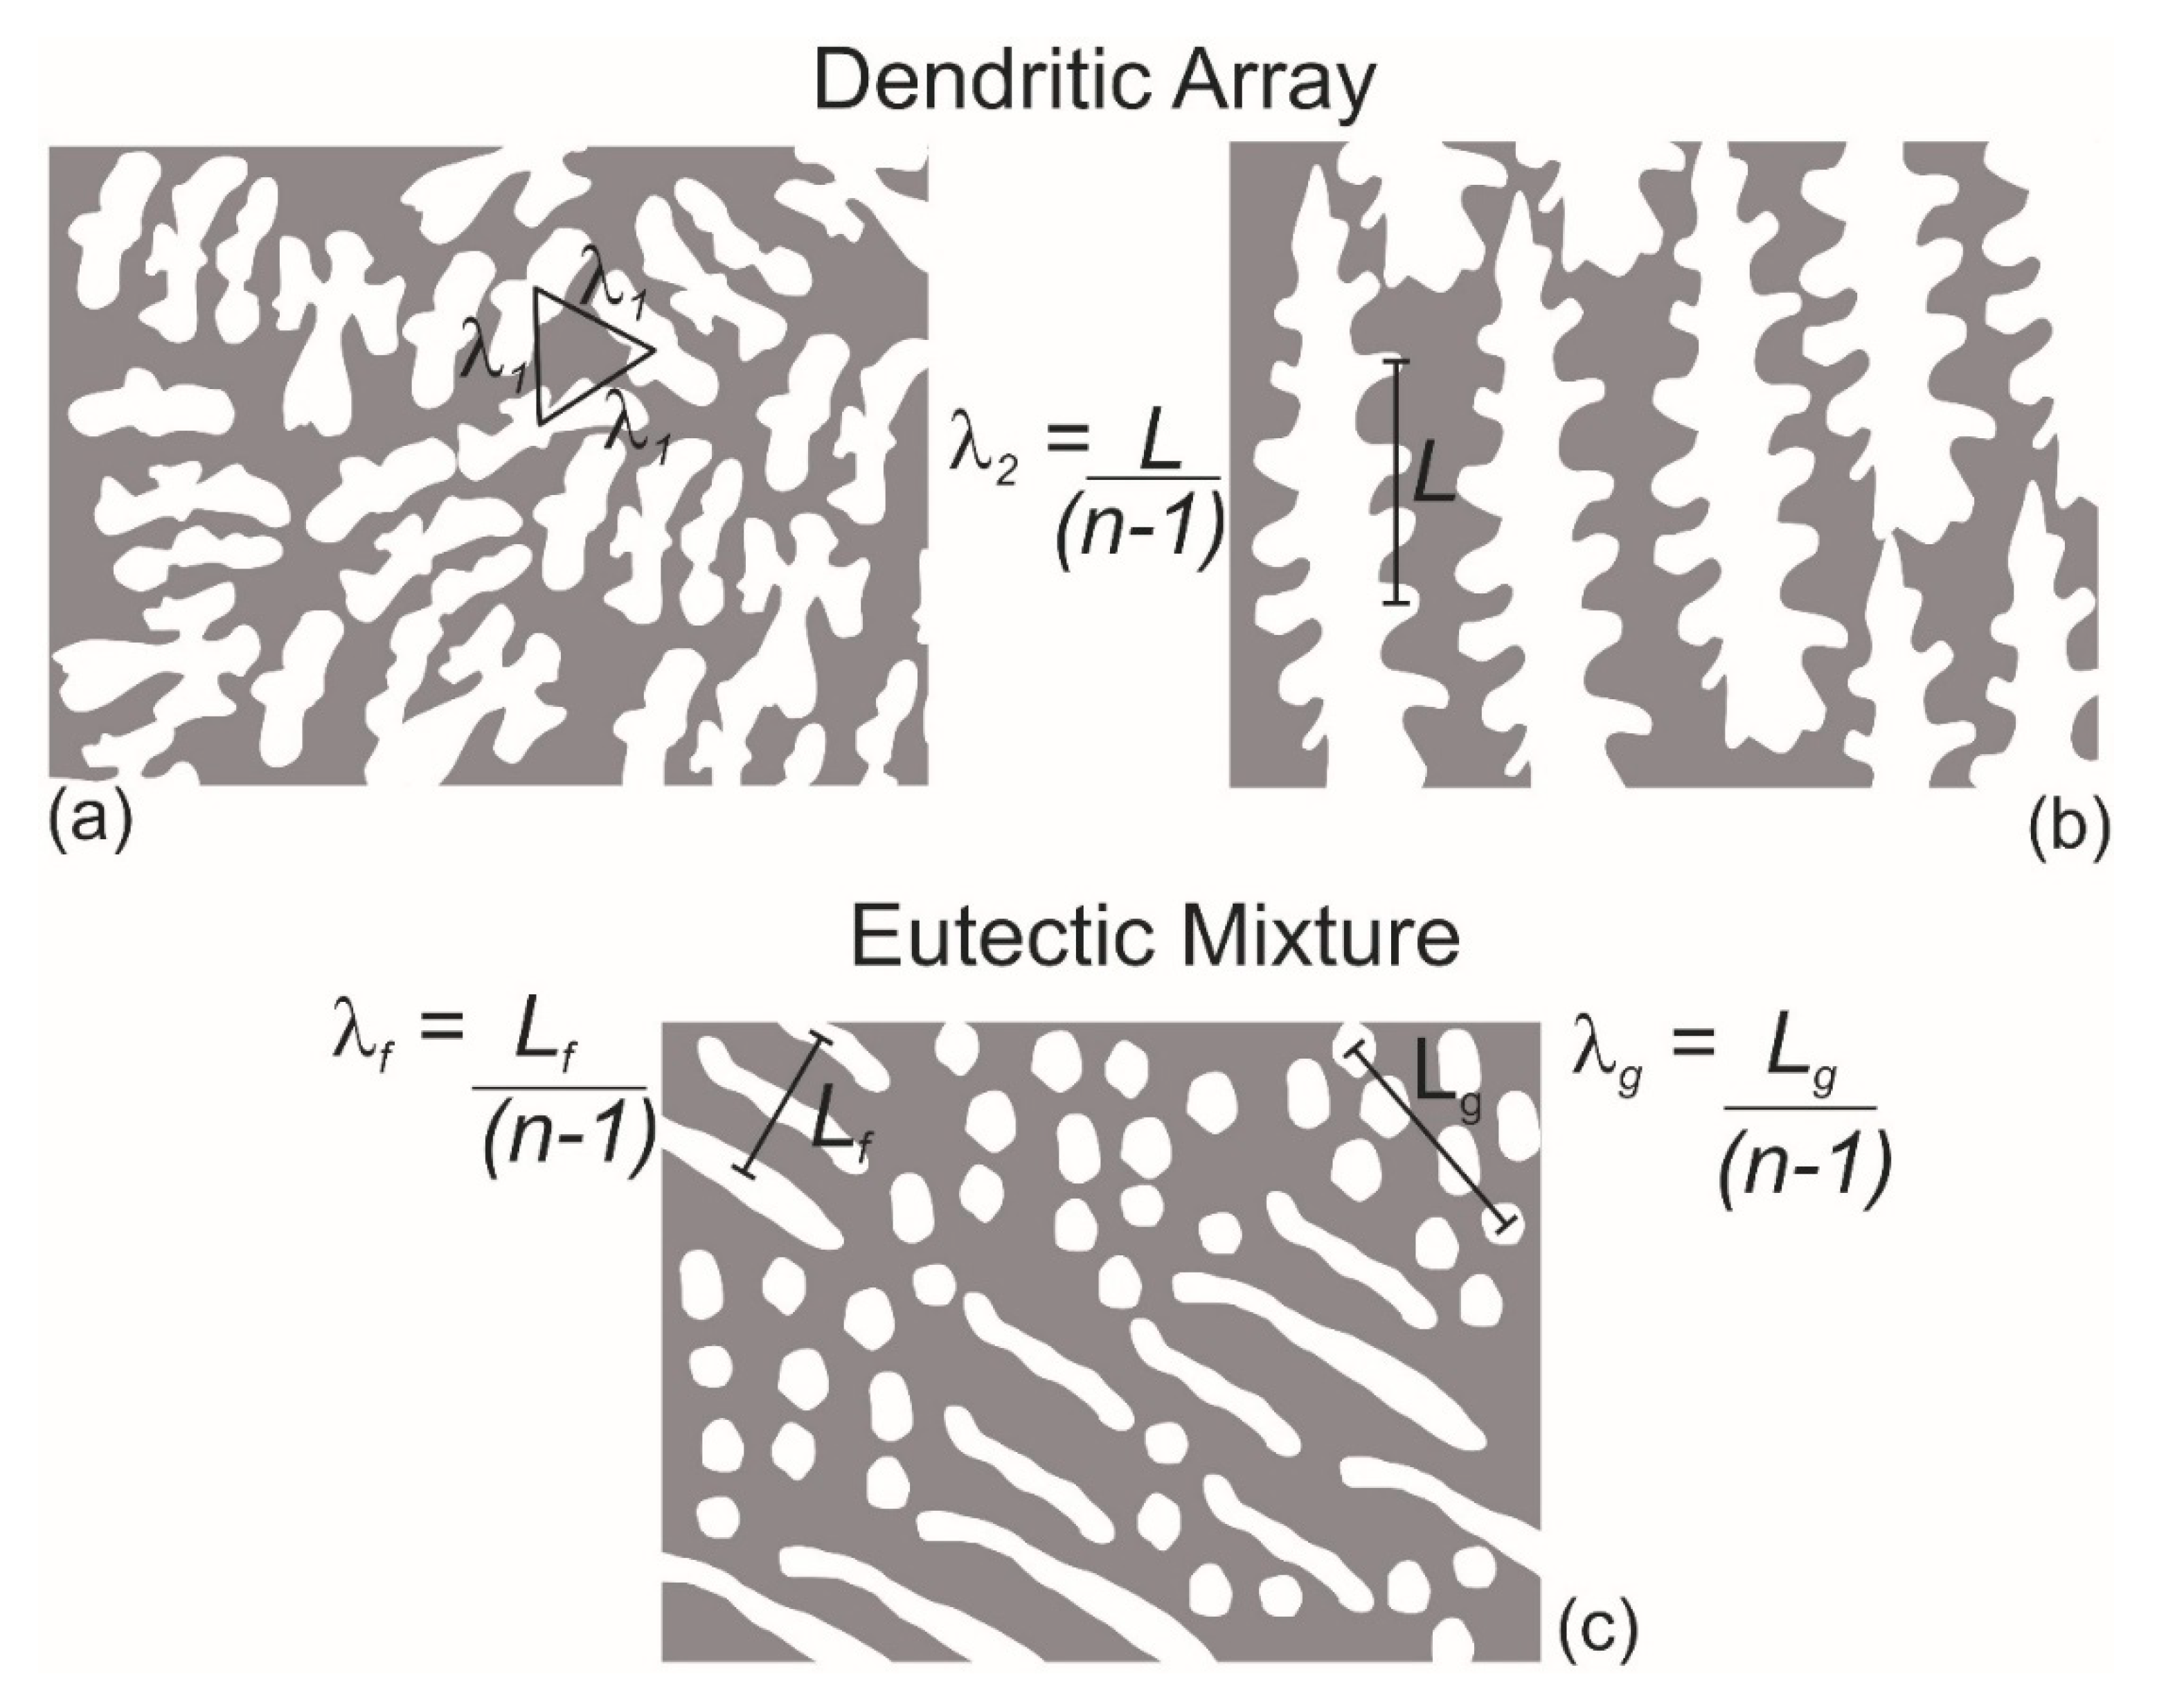
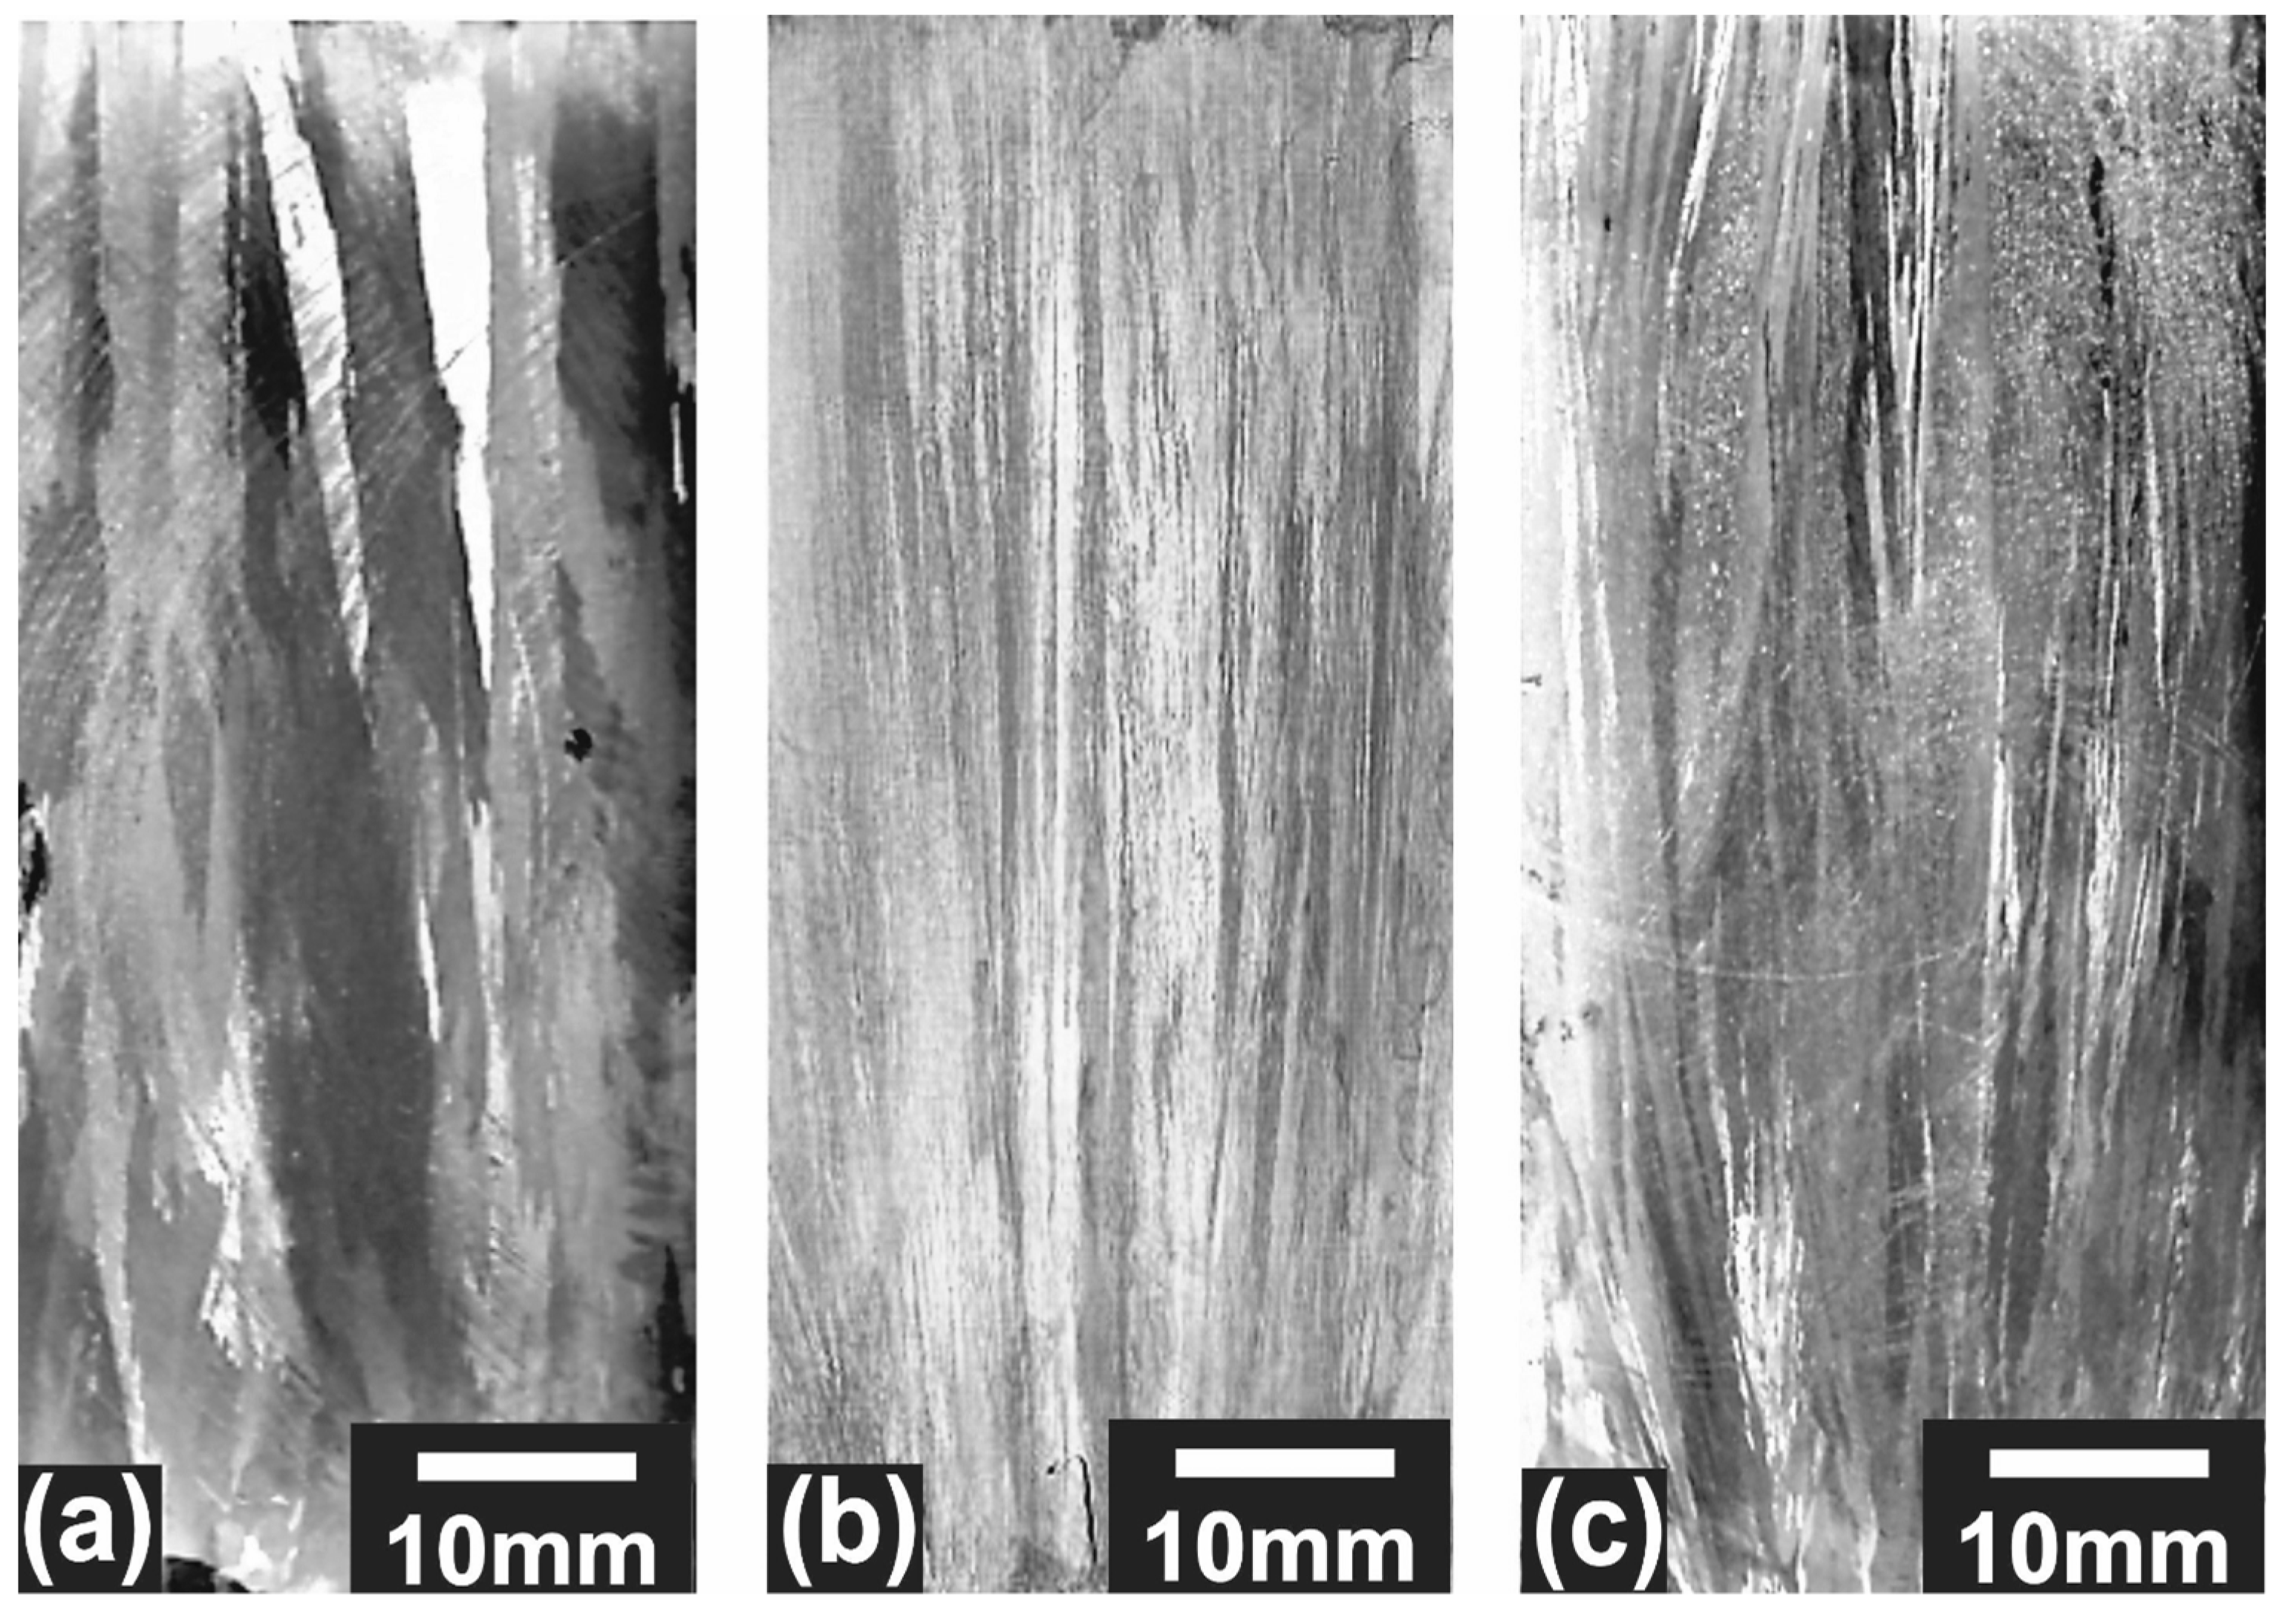
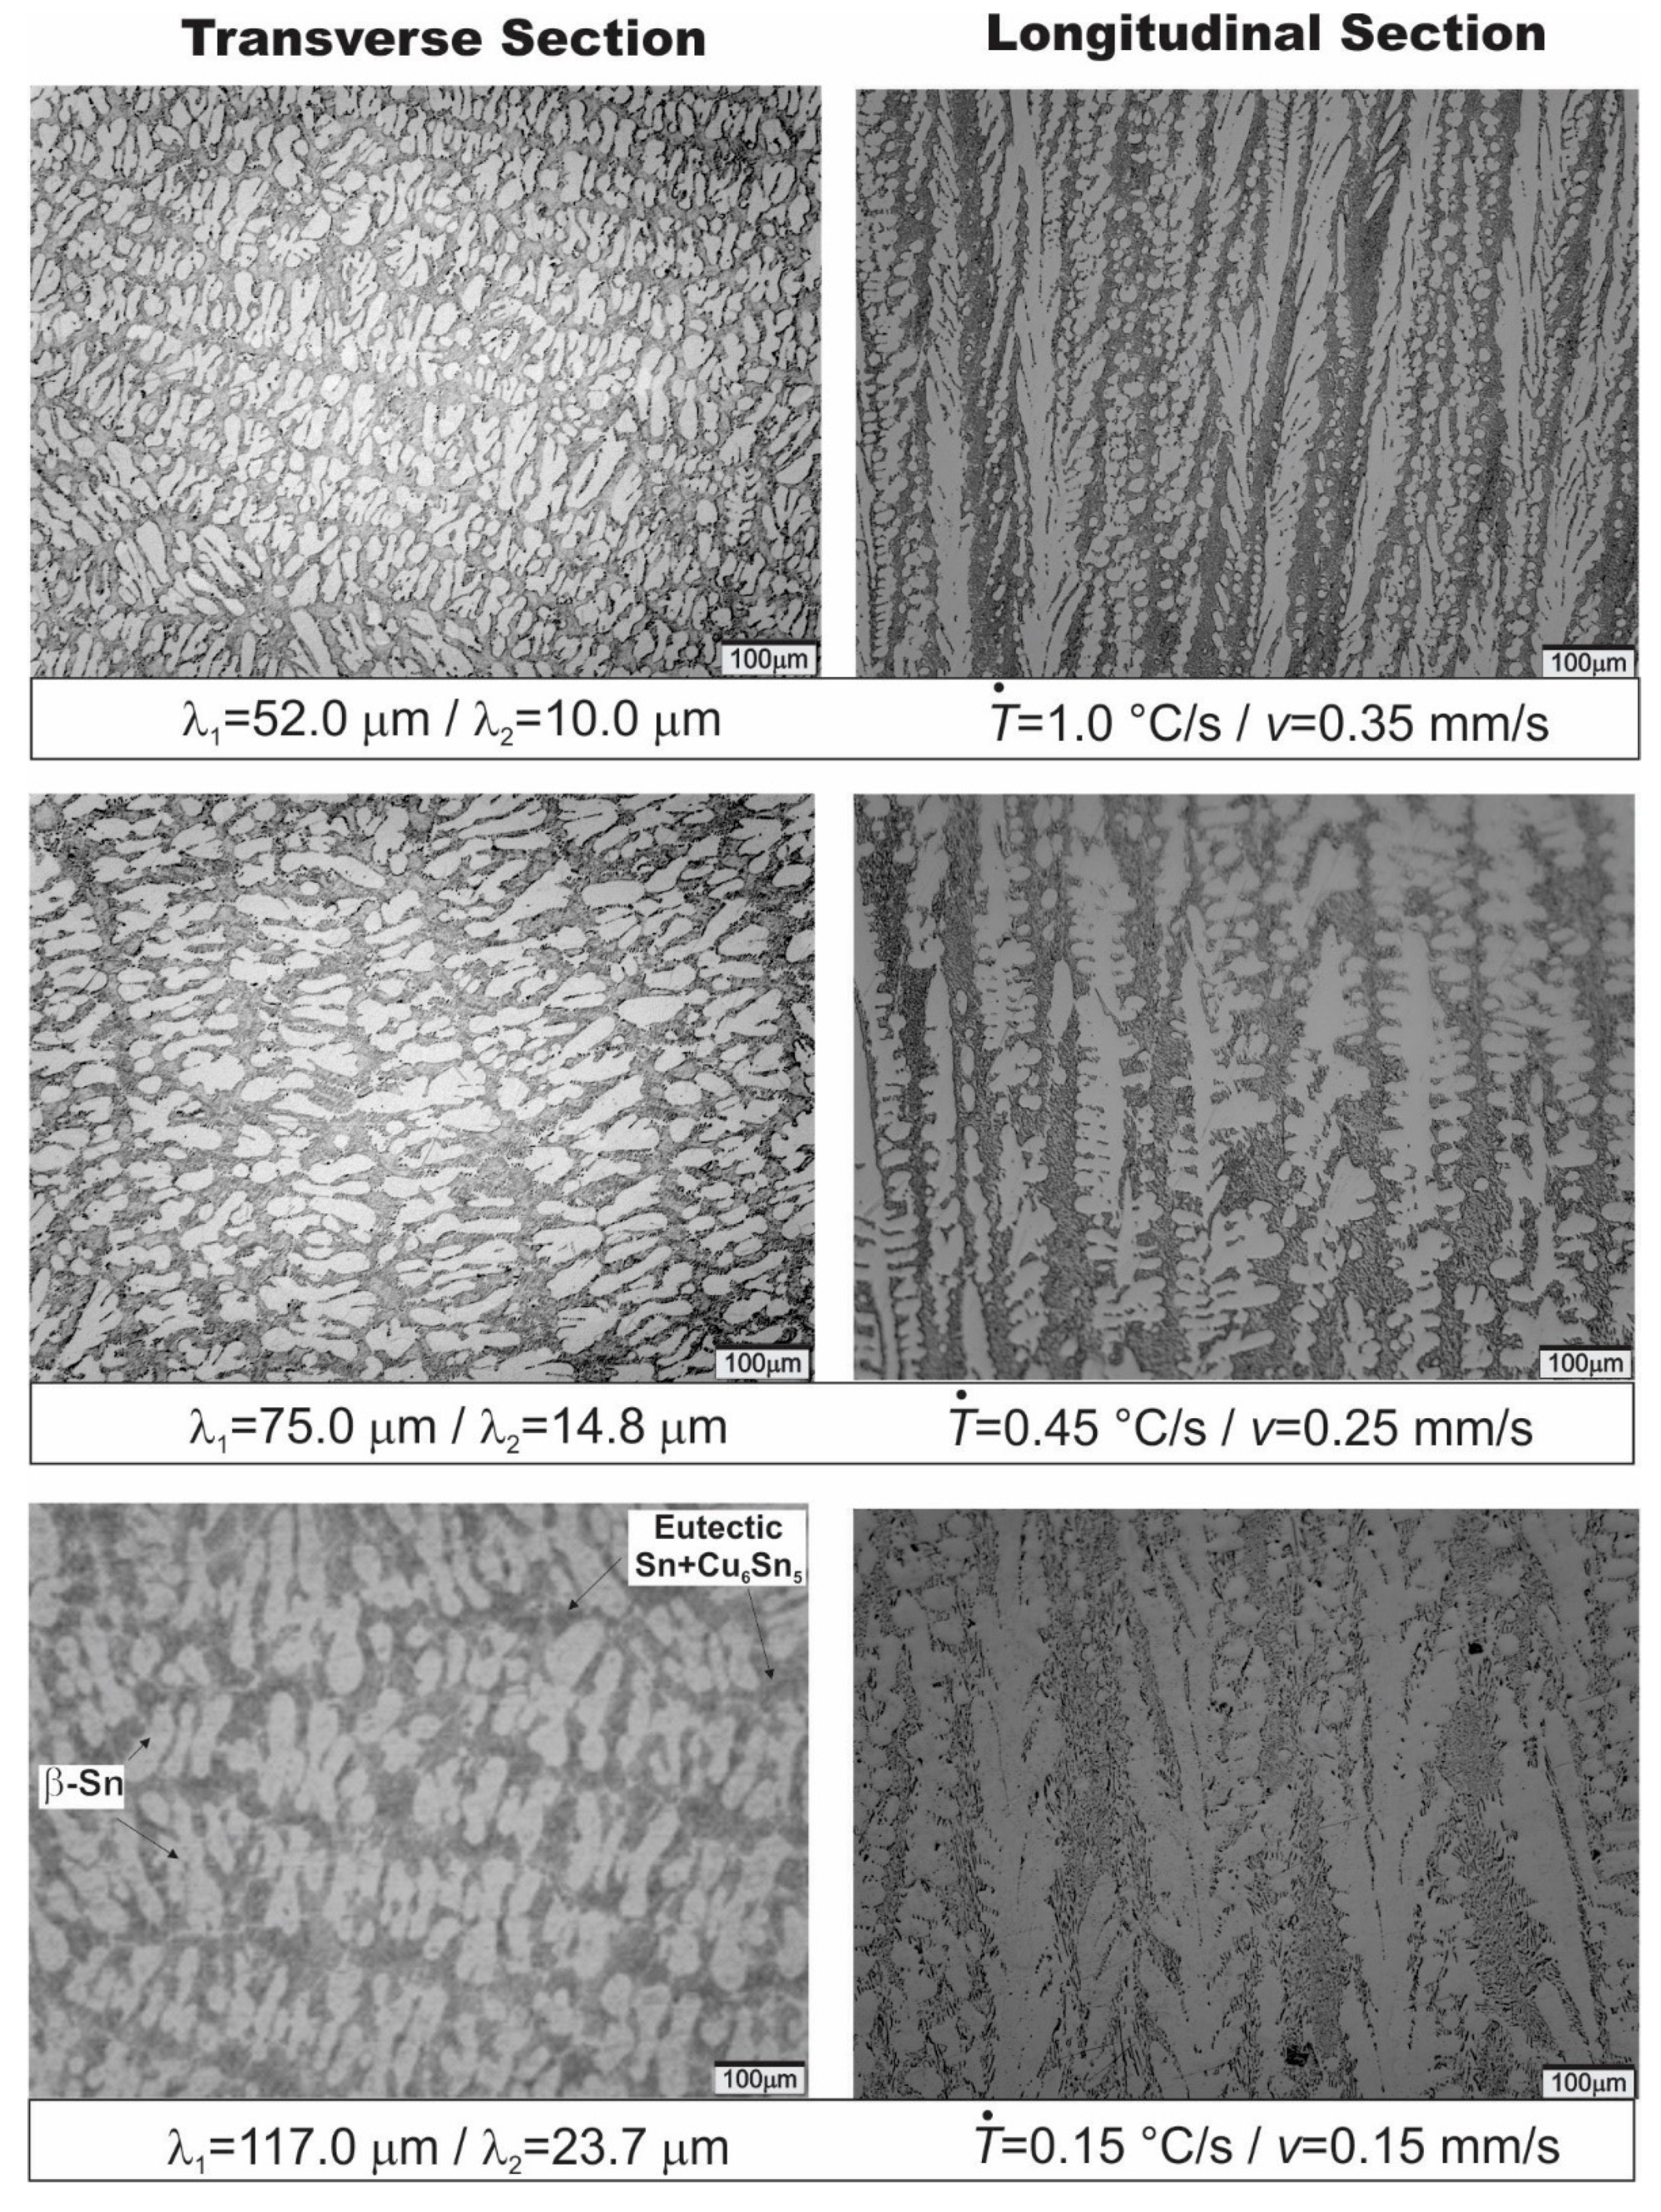
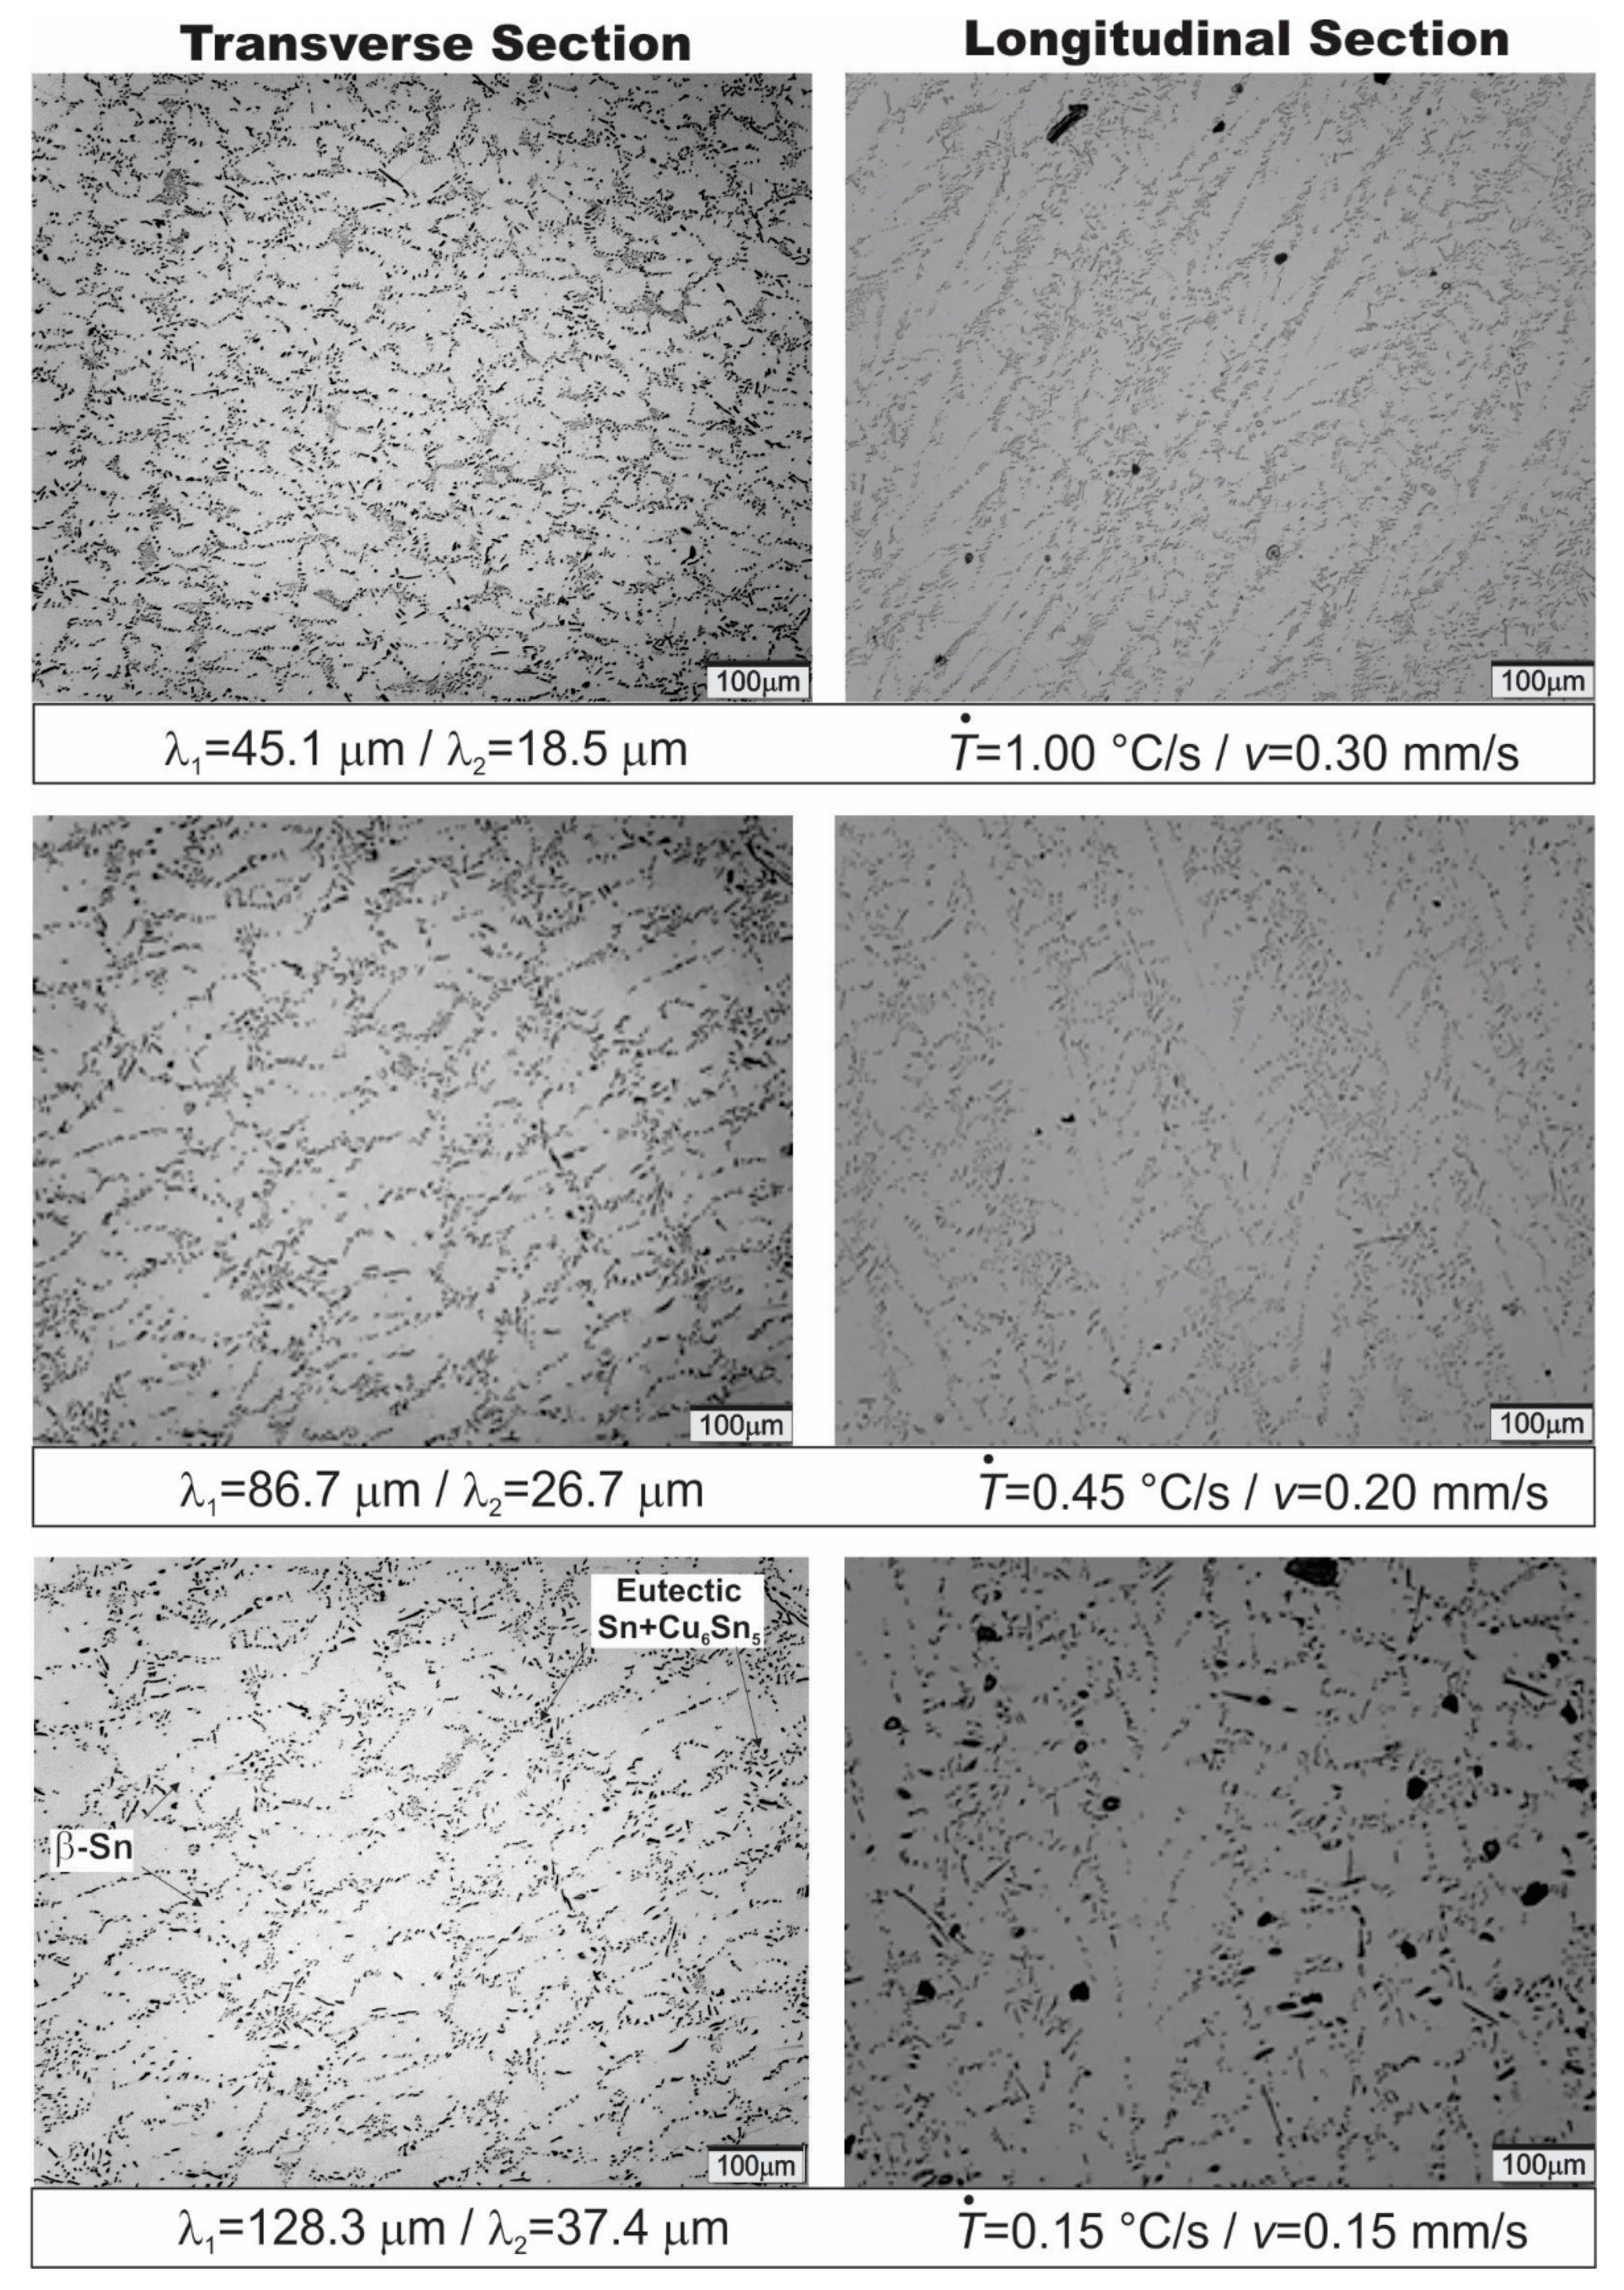
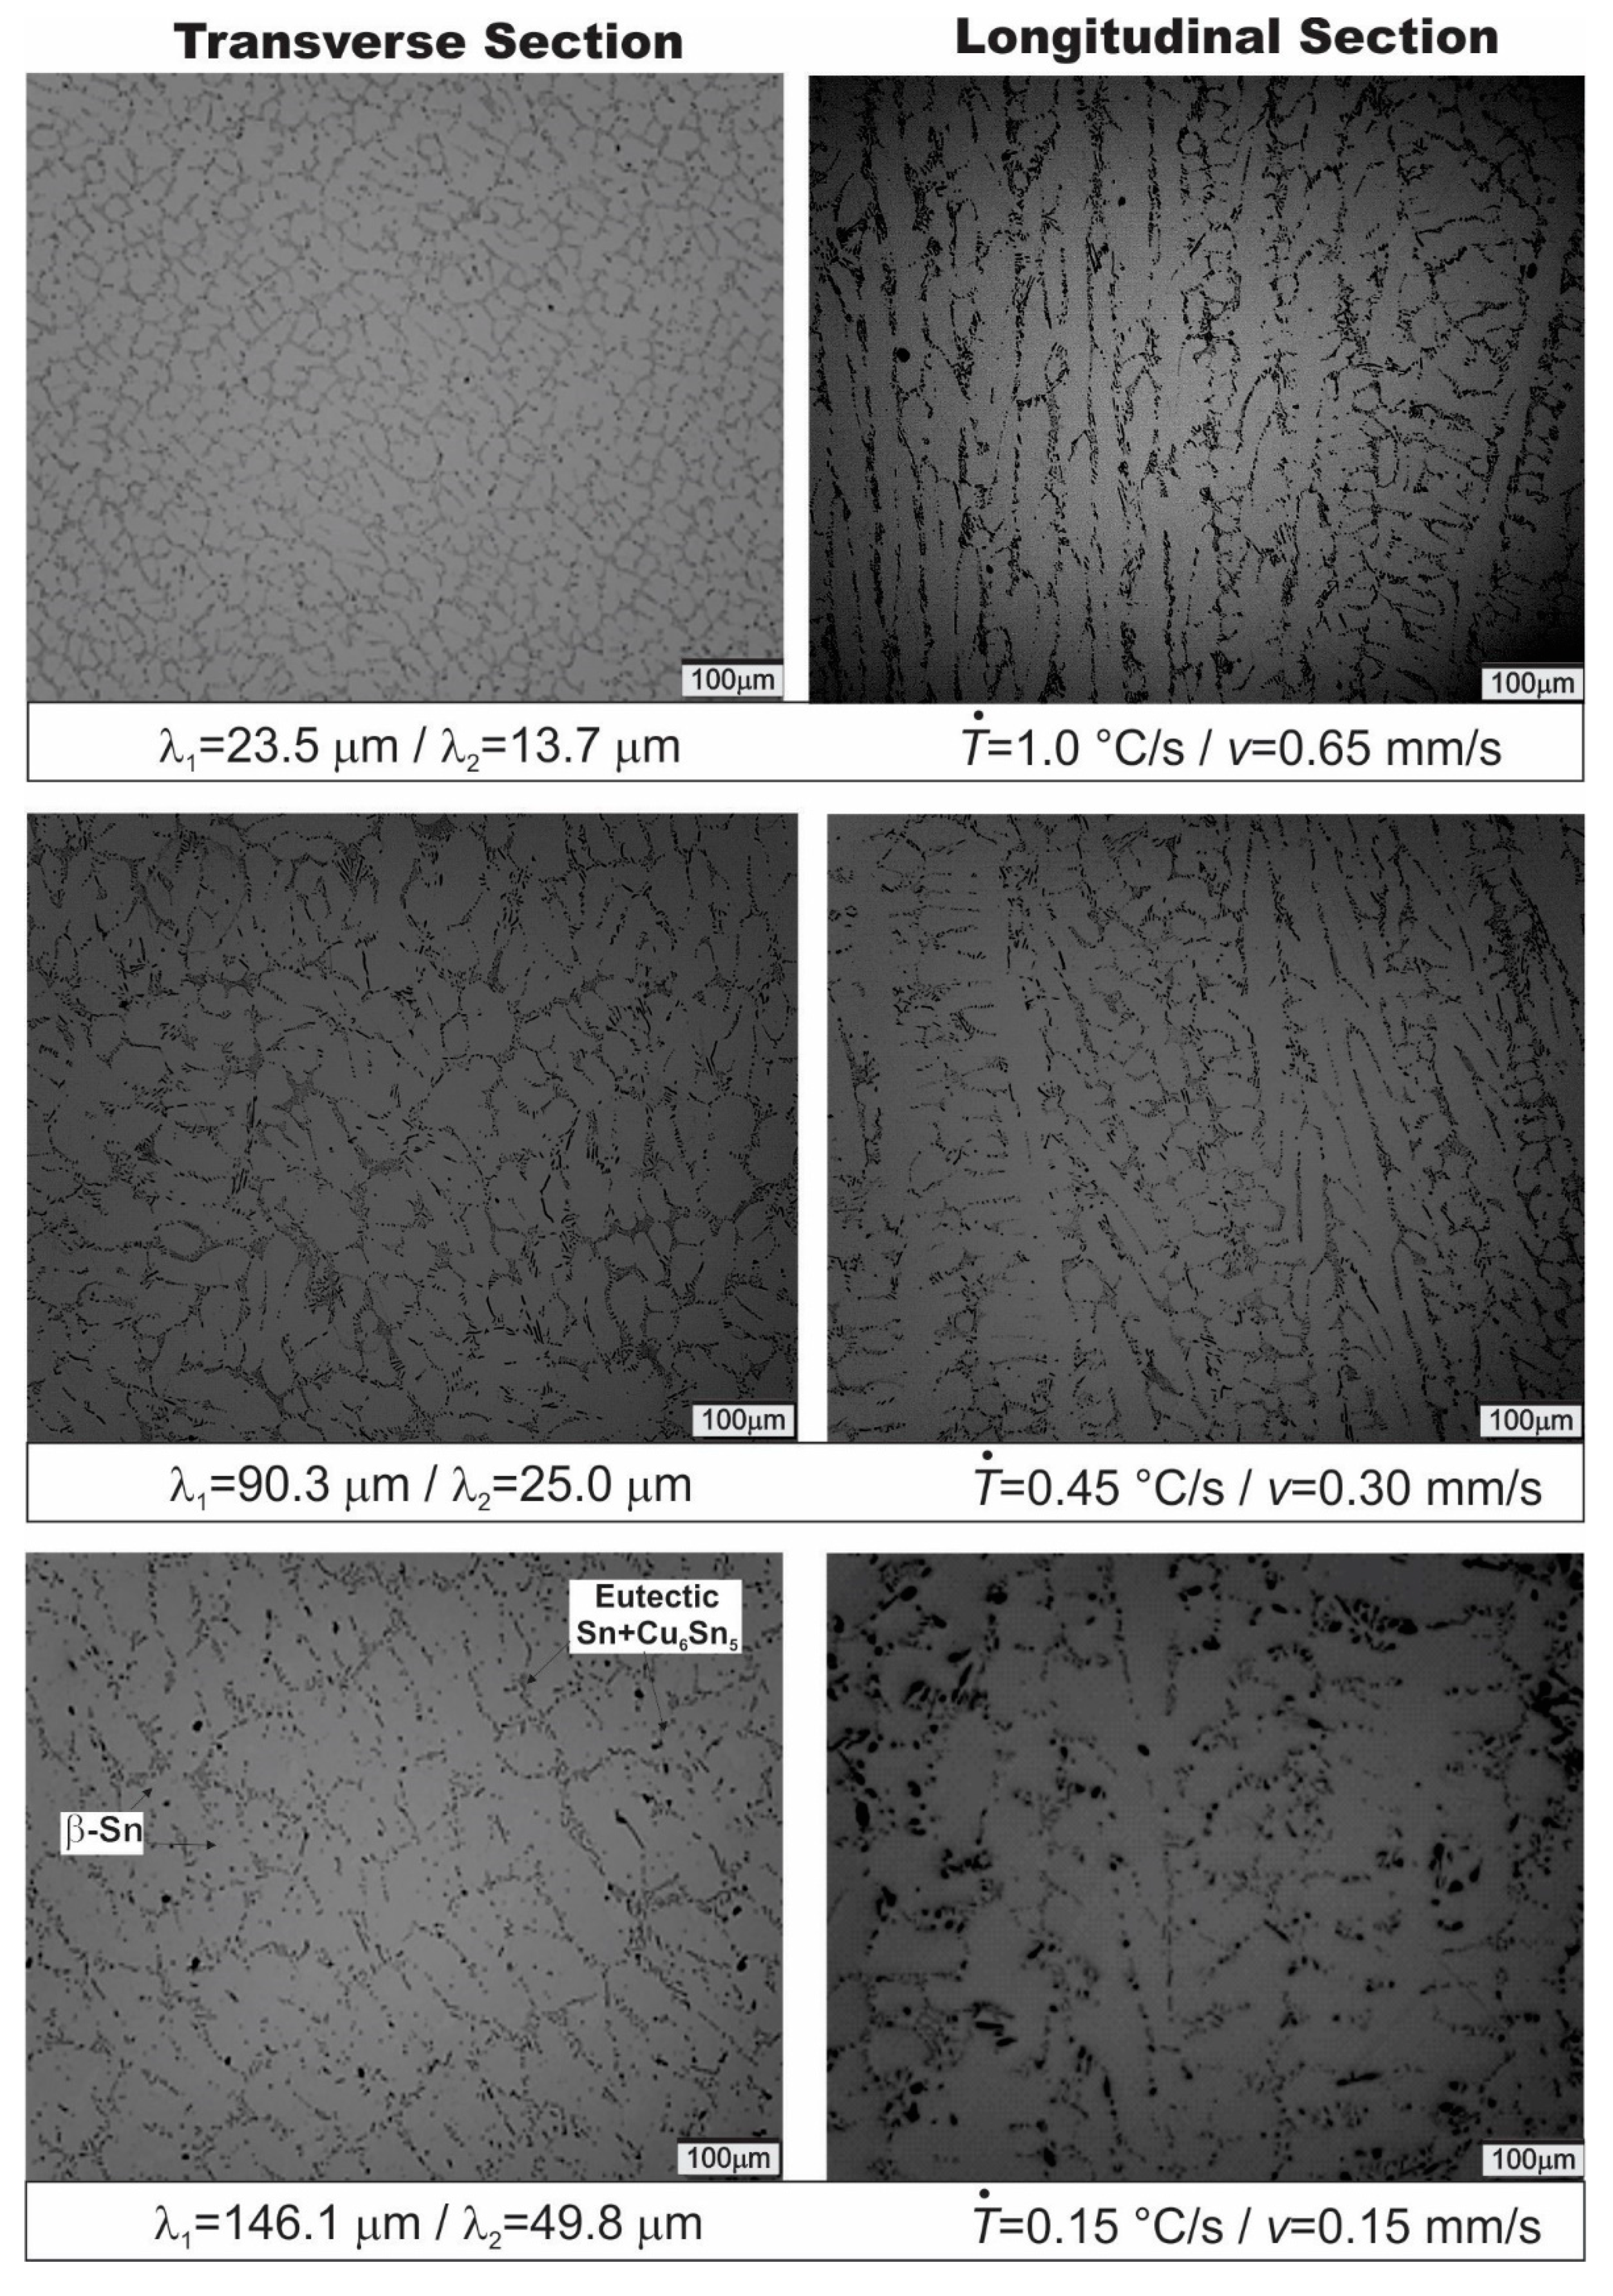
3.2. Dendritic Arrays and Their Evolutions along the Length of the Alloys Castings

The microstructures from optical microscopy, as demonstrated in Figure 6, Figure 7 and Figure 8, were those associated with the samples collected along the length of the castings from the cooled bottom, referring to three different cooling rates for the analyzed alloys (1.0 °C/s, 0.45 °C/s, and 0.15 °C/s). These samples were selected to comparatively visualize the effect of cooling rates on the resulting microstructure. Dendritic growth could be observed for all Sn–Cu alloys composed of β-Sn rich dendrites with the eutectic mixture (β-Sn + Cu6Sn5) forming the interdendritic regions [18]. These phases were identified by the XRD analysis as shown in Figure 9a,b. CuAl IMCs could not be detected. This was in agreement with the results found by Li et al. [26], which demonstrated that such phases could only be clearly detected for Al-contents higher than 1000 ppm.
Regions closer to the cooled surface of the castings were submitted to higher cooling rates (represented by 1 °C/s samples in Figure 6, Figure 7 and Figure 8). Thus, more refined microstructures could be formed, which become gradually coarser for the samples toward the top of the castings at a cooling rate of 0.15 °C/s (Figure 6, Figure 7 and Figure 8). Comparing the microstructures characterizing the three examined alloys, it was noted that the primary dendritic spacing, λ1, for the same range of cooling rate, remained very close for all alloys, indicating that the addition of Al did not affect the growth of the primary dendritic stems. On the other hand, the addition of Al seemed to affect the stability at the solid/liquid interface from the primary branches and later increased the secondary dendritic spacing. Hence, the λ2 tended to increase with the increase in Al content.
Table 2 shows the influence of the Al addition on the eutectic area fraction. The presence of Al appears to have inhibited the eutectic reaction, or, that is to say, to favor the growth of the β-Sn matrix. Such benefits in the growth of β-Sn are mainly translated through the coarsening of the secondary dendritic branches, as clearly seen in Figure 6, Figure 7 and Figure 8. A study performed by Uddin and co-authors [27] described the effect of Al addition (1, 2, and 4 wt.%) on the microstructure of a Sn-8wt.%Zn-3wt.% alloy. The main microstructural change reported by the authors consisted of a decrease in the α-Zn volume fraction with the increasing addition of Al due to high reactivity between the Zn and Al elements.
It is widely accepted that the eutectic Cu6Sn5 IMC size and fraction can be strongly affected by variations in β-Sn undercooling during alloy solidification [28]. It appears that the presence of Al is able to decrease the eutectic area fraction (as shown in Table 2) since it induces a decrease in the β-Sn undercooling at the solidification front. As such, the faster growing β-Sn surrounds the tip of the solidifying eutectic Cu6Sn5, inhibiting its development.
Although there is a good susceptibility of the formation of CuAlx intermetallic compounds (IMCs) in Al-containing Sn-Cu alloys as mentioned in the literature [26], these IMCs can only be significantly detected at higher levels of Al (1000 ppm). The influence (or not) of Al on the formation of CuSn based IMCs will be discussed next.

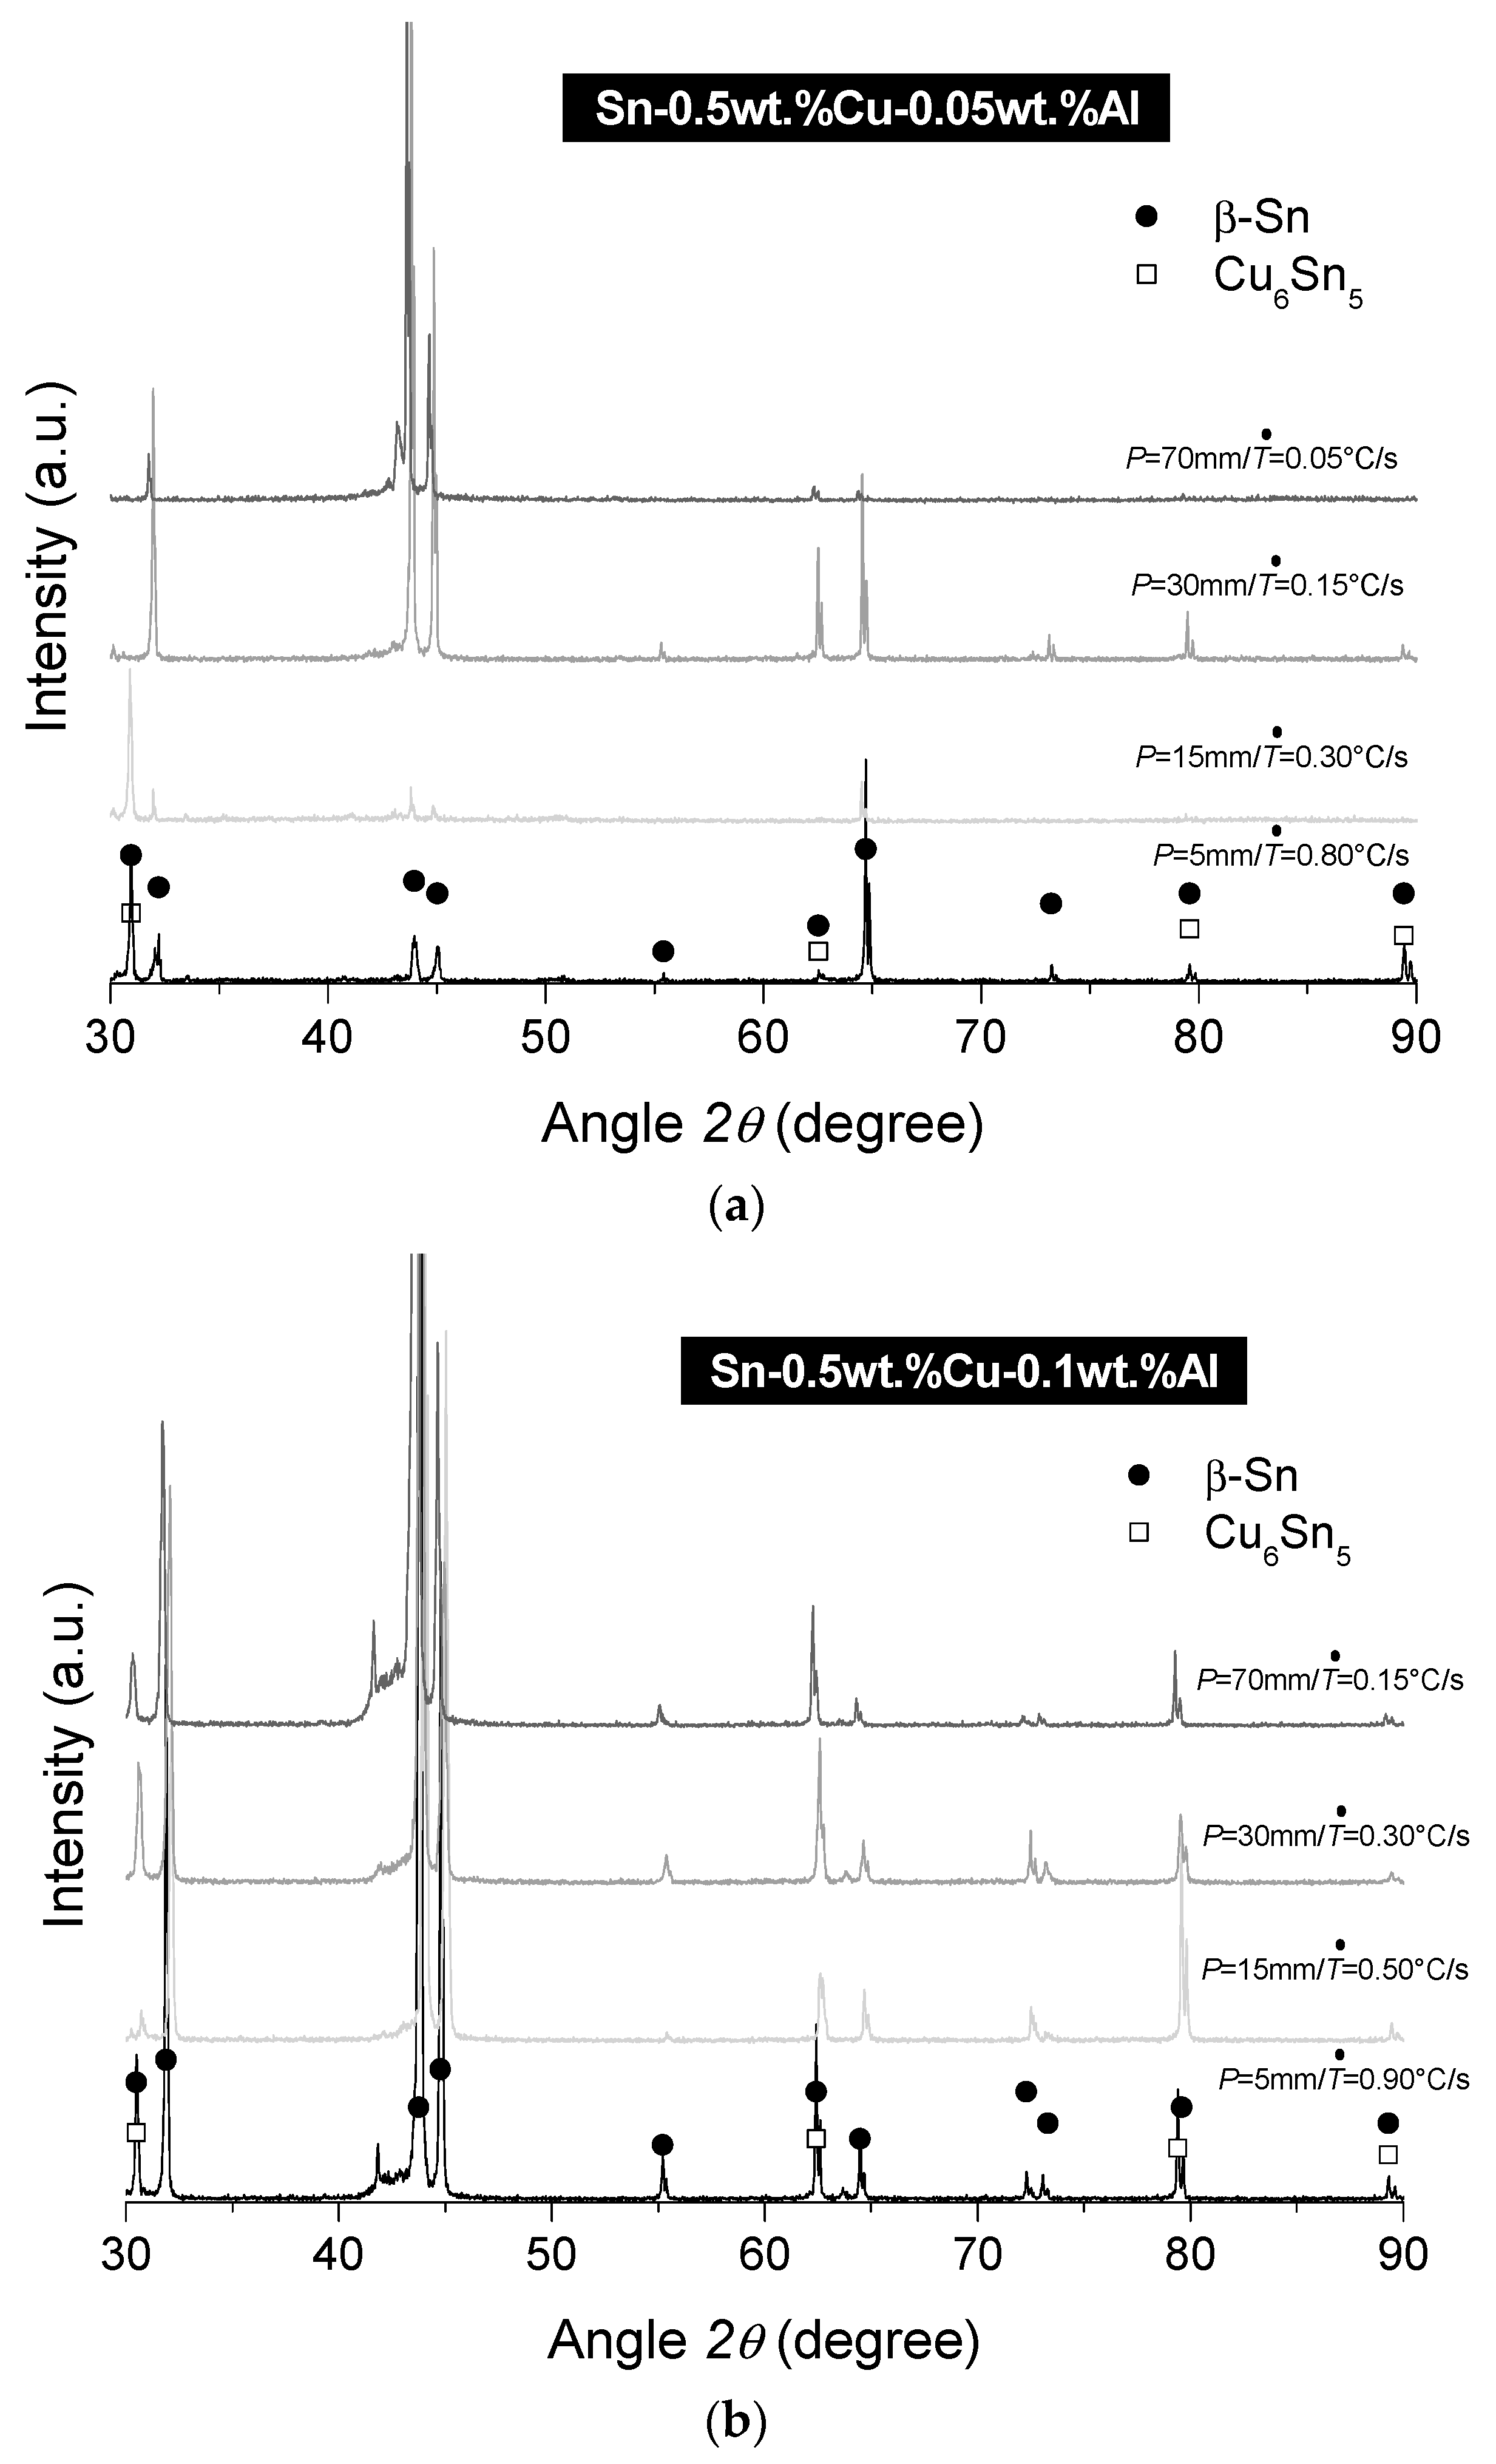
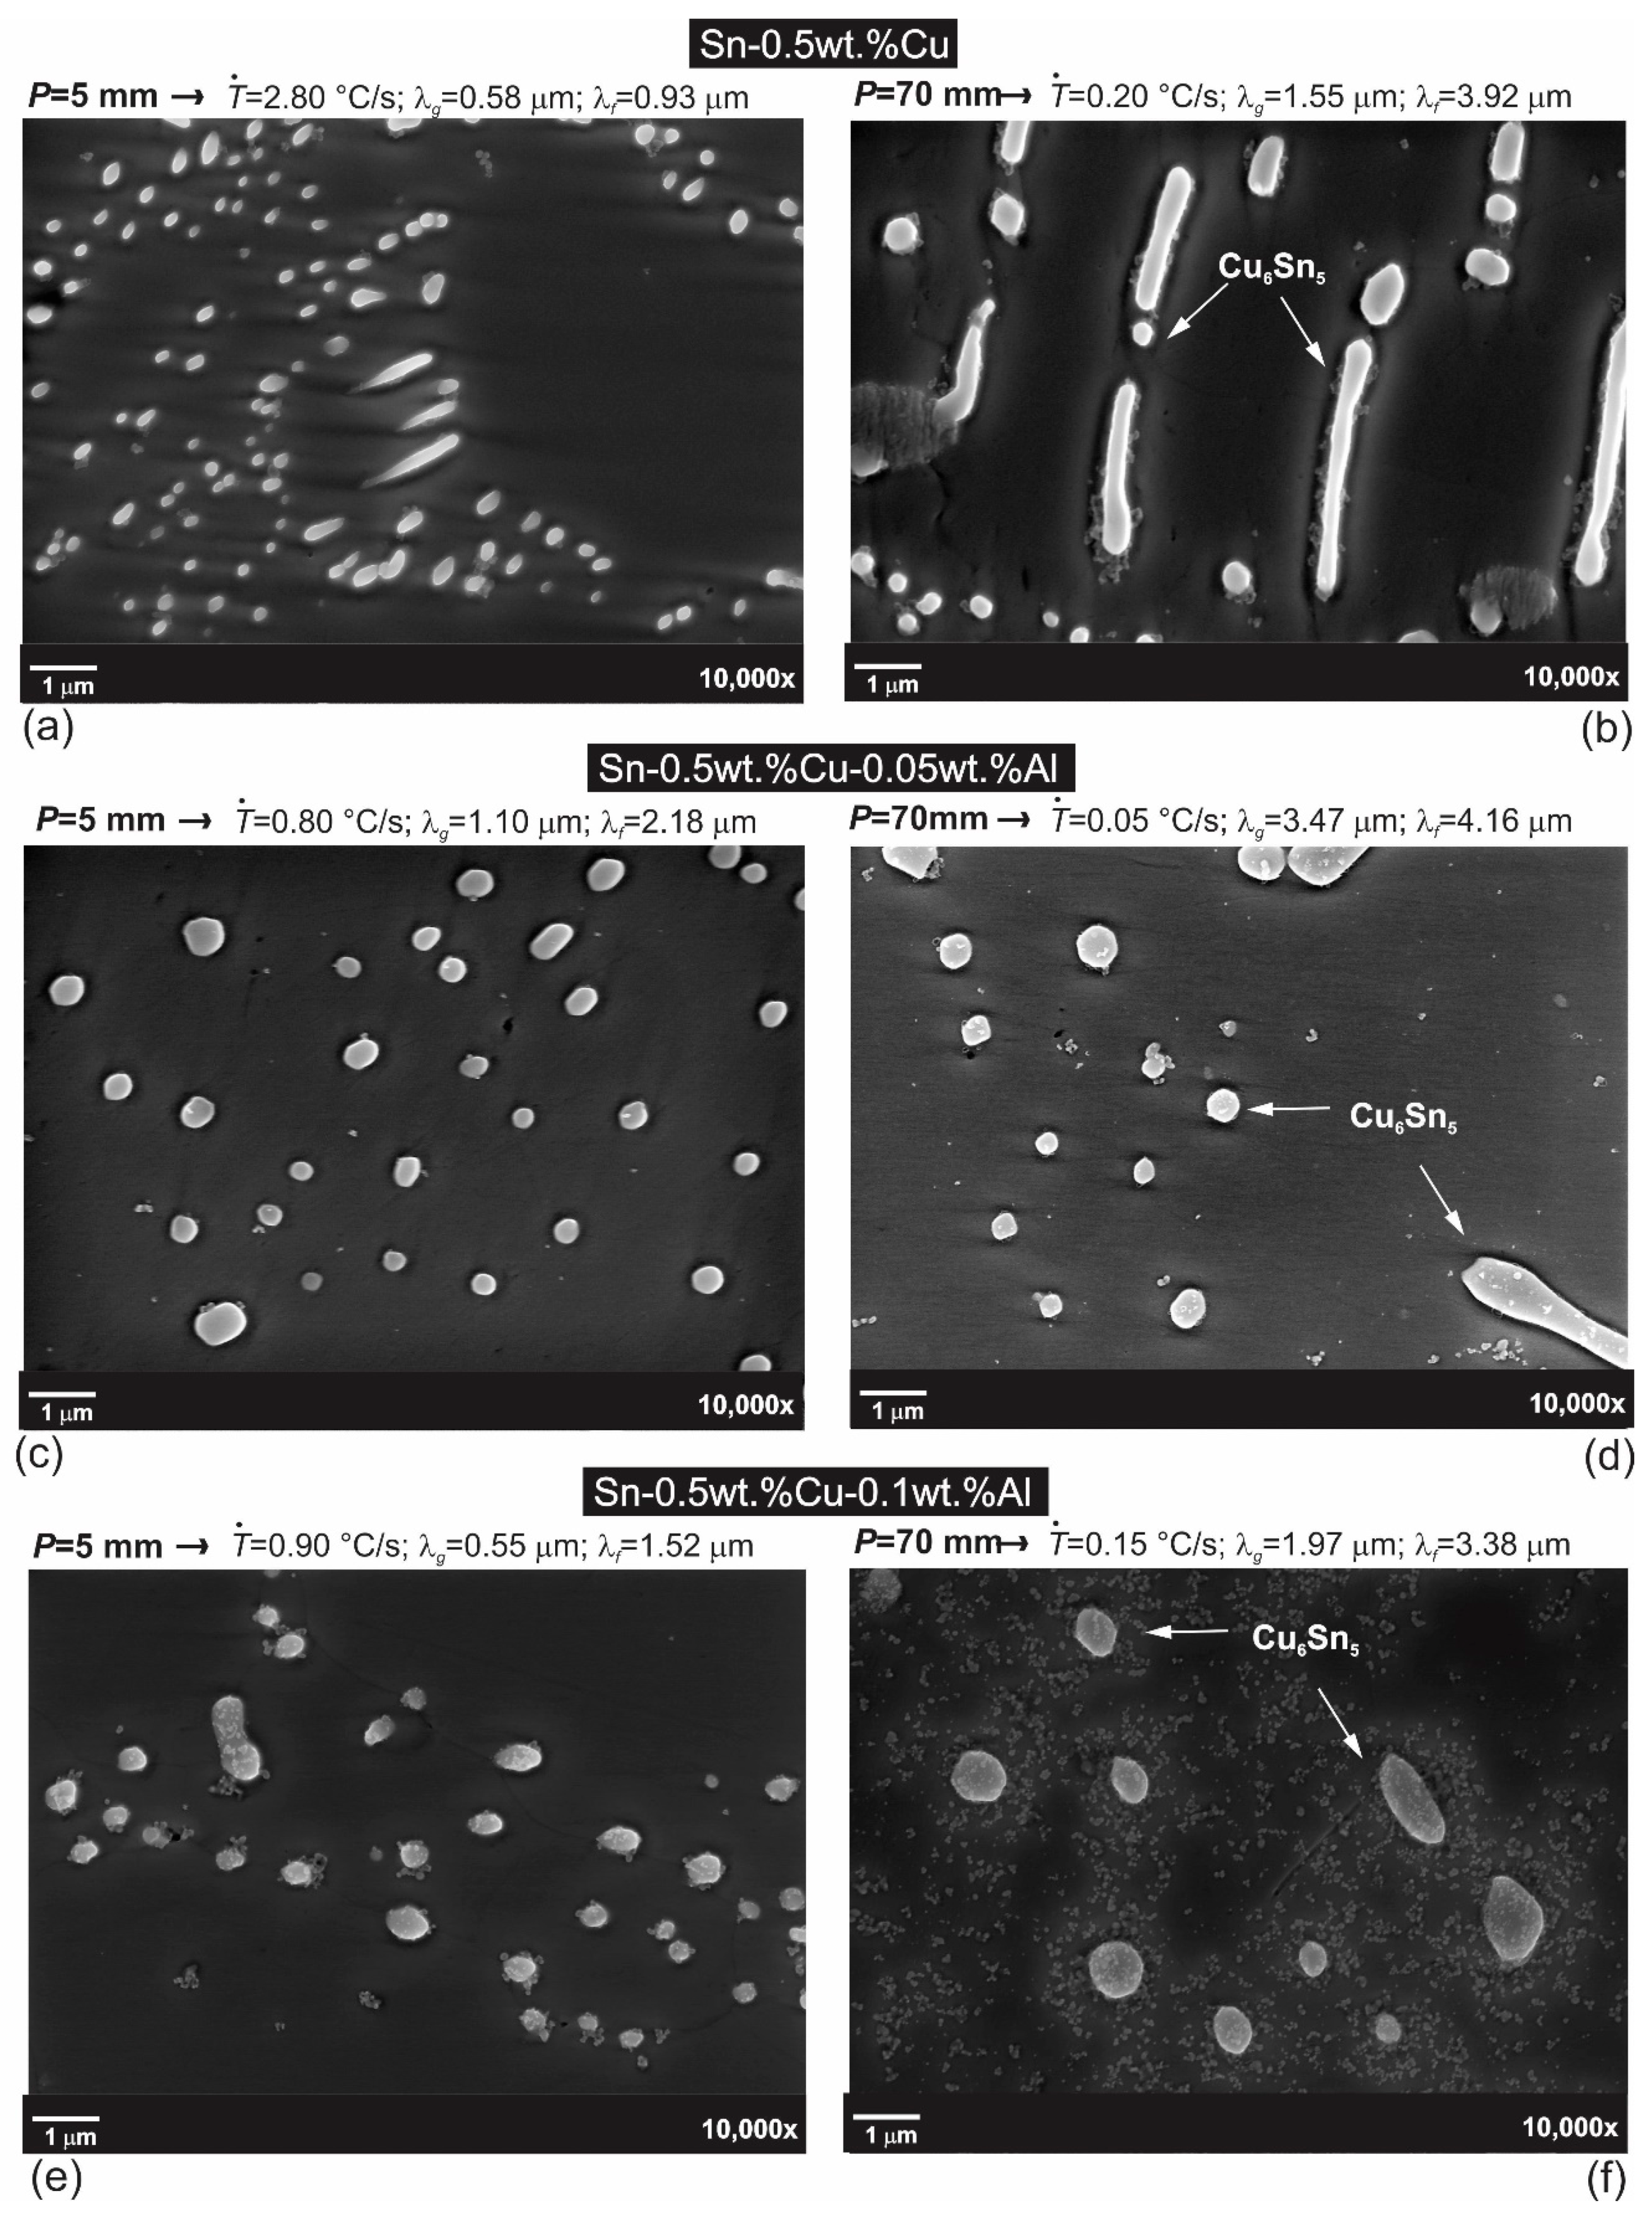
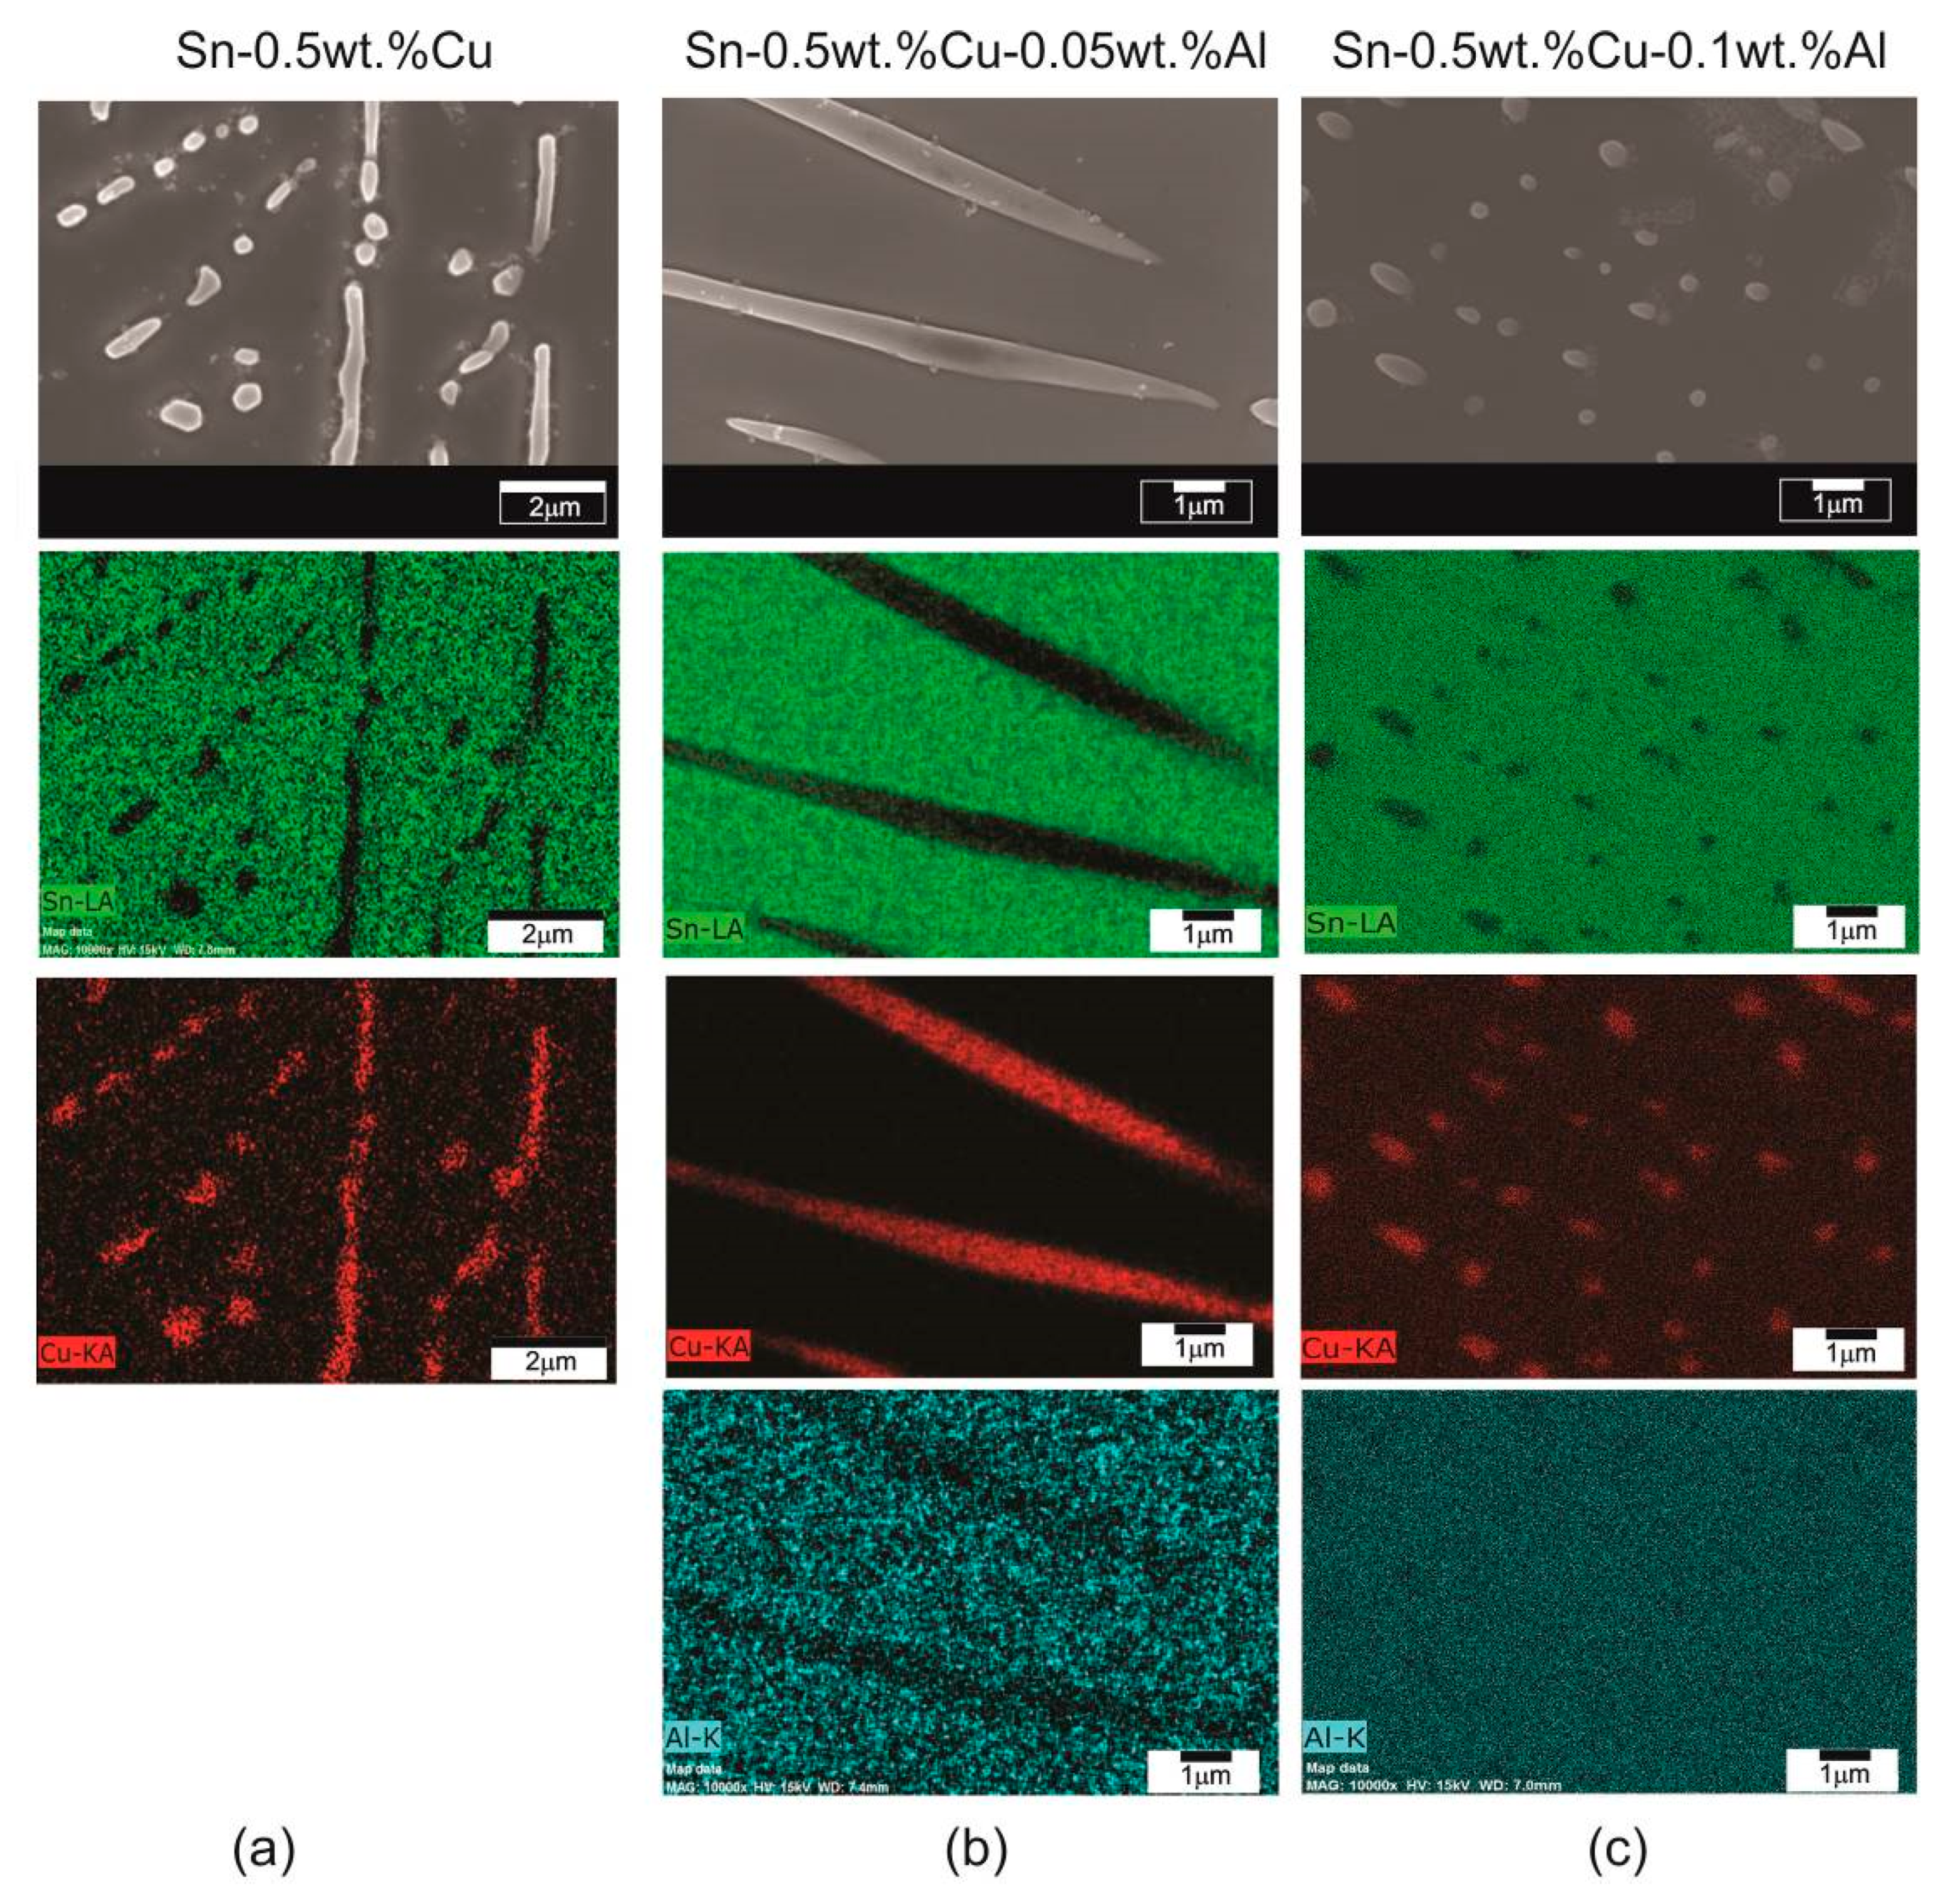
3.3. Cu6Sn5 Morphology

The Sn-rich side of the Sn–Cu alloy system showed a eutectic reaction at 0.7 wt.%Cu and at 227 °C. This eutectic microstructure occurred between the Cu6Sn5 IMC and the Sn phase. Most studies have stated that rod-like Cu6Sn5 particles must form [29]. Minor additions of Al in the Sn–Cu alloys are not expected to suppress or affect such reactions as those seen in Figure 10 by means of detailed SEM microstructures. The demonstrated microstructures refer to the interdendritic regions observed over high magnification.
Modification of the eutectic morphology is widely practiced in other metallic systems whose eutectic reaction predominates. This is the case of the hypoeutectic Al–Si alloys [30], which may result in the leading Si phase transitioning from a plate-like to a fibrous morphology. The control of the Si size and morphology in Al–Si alloys is well known to be essential to meet the progressively increasing demands for automotive and aerospace applications utilizing these alloys [31,32].
Trace concentrations of rare earth elements (that is, Ce and La) have been demonstrated to significantly alter the eutectic microstructure of the Sn-0.7wt.%Cu alloy [33], providing a better distribution of finer particles within the as-solidified alloy. This suggests that microstructural control is possible by utilizing third elements. However, very little attention has been given to the modification of the Cu6Sn5 morphology.
The present results showed that the Cu6Sn5 phase developed mainly as a mixture of fibers and globules. These features could be observed even for the non-modified alloy. Some of the fibers appeared to be broken, as if they were perforated irregularly at different distances along their lengths. Such results bring new debate around the morphology of the Cu6Sn5 phase. This means that a given morphology of Cu6Sn5 does not depend on Al (at least for the tested Al-contents). It is associated, hence, with the solidification progress. The employed unsteady-state solidification conditions, typified in this study by cooling rates altering from 0.05 °C/s to 2.8 °C/s, induce thermal-driven perturbations, which may stimulate an irregular front of solidification [34].
If comparing the SEM microstructures on the left (i.e., fast cooling rate) with those on the right (i.e., slow cooling rate) in Figure 10, larger particle spacing as well as bigger particles can be observed to the right. This is largely due to the reduction of 1 order of magnitude in the cooling rate during the formation of the eutectic microstructure from the left to right in Figure 10.
EDS/SEM analysis of the alloys revealed that Al was concentrated in the Sn-rich phase, probably in solid solution as can be seen in Figure 11. The final distribution of the elements can be seen within the phases. Sn can be seen with high intensity within the Sn-rich matrix whereas Cu predominates, constituting the Cu6Sn5 IMC. These results confirmed those previously demonstrated by utilizing XRD analysis where none of the Al-containing intermetallic was detected.

3.4. Mechanical Properties vs. Secondary Dendrite Arm Spacing

The size of λ2 was shown to change significantly, as demonstrated in Figure 6, Figure 7 and Figure 8. The increase in λ2 was shown to have a deleterious effect on the tensile strength as can be seen in Figure 12, despite having no considerable effect in the elongation of the three tested Sn–Cu alloys. The elongation values remained almost unaltered with λ2. Modified Hall–Petch-type correlations were adopted to represent some of the experimental scatters, which were the σu- ultimate tensile strength, and σy = 0.2- yield strength experimental variations with λ2.
Yang et al. [7,35] reported that the Al-modified Sn-0.7wt.%Cu alloys may exhibit lower tensile strength and higher ductility when compared with the binary Sn-0.7wt.%Cu alloy. Due to the utilization of a massive non-water-cooled mold, σu values changing from 10 MPa to 17 MPa were obtained in the cited study [7]. In addition, the microstructures of all tested specimens were not standardized as accomplished at this point in the present investigation. Hence, a direct comparison was much more sustainable here, since specimens with similar microstructural parameters (i.e., λ2) were tested as plotted in Figure 12. In order to assess the finer secondary dendritic spacing in the specimens for tensile tests, extra rapidly solidified (RS) castings were fabricated and their results plotted in Figure 12.
The Al-containing alloys were characterized by having a lower eutectic fraction than the Sn-0.5wt.%Cu alloy. It is possible to infer that this characteristic may be balanced with the solid solution strengthening induced by the Al. As a result, similar experimental evolutions were attained for σu and σy. Minor additions of Al (considering the ranges adopted in this study) did not affect the alloy’s tensile strength.
Despite non-coincidence of points with the same λ2−1/2, if the results of the alloys are compared to each other, a σu × λ2−1/2 point on the plot of 24.1 MPa × 0.200 µm−1/2 can be noted for the Sn-0.5wt.%Cu-0.05 wt.%Al alloy whereas a point of 24.7 MPa × 0.198 µm−1/2 refers to the Sn-0.5wt.%Cu-0.1 wt.%Al alloy. In view of the measured deviations-from-average of λ2 of about 5–10%, such experimental points can be considered roughly the same. This kind of analysis contributed to the adoption of a single trend representing the variations of either σu or σy with λ2 for the three tested alloys. Additionally, the finer λ2 data from using rapid solidification can be represented by the derived Hall–Petch formulae, which confirmed its usage.
The experimental variations in λ2 were shown to not be significant in changing the strain-to-failure. A slightly larger elongation was observed in the Sn-0.5wt.%Cu-0.1wt.%Al solder alloy, especially if restricted to λ2−1/2 values lower than 0.220. The larger elongation of this alloy can probably be explained by the lower fraction of the brittle Cu6Sn5 IMC composition of the microstructure, compared to that related to the non-modified alloy. This is also reliable for samples related with higher cooling rates (i.e., λ2−1/2 ~0.34) where an average δ value of about 44% was associated with the Sn-0.5wt.%Cu-0.1wt.%Al alloy, in comparison to the 37% obtained for the Sn-0.5wt.%Cu alloy.
Up to now, the methods utilized to examine the formation of microstructures in Al containing Sn–Cu alloys have not permitted the calculation and comparison of cooling rates as well the examination of equivalent samples in terms of λ2 in size. This means that the effects of cooling rate joined with the variations of alloy Al content remain largely unknown in past literature. In the present research, a methodology permitting the microstructure scaling laws of solders to be determined over a wide range of cooling rates has become available.

4. Conclusions

Experiments were conducted to analyze the correlations between the microstructure and tensile properties during directional solidification under unsteady-state cooling conditions of Sn-0.5wt.%Cu xwt.%Al (x = 0, 0.05 and 0.1) alloys. The following conclusions can be drawn:
-
The dendritic matrix β-Sn can be characterized by the primary dendrite arm spacing, λ1, which did not increase with increasing Al; and by the secondary dendrite arm spacing, λ2, which conversely, tended to increase as the Al-content increased.
-
The eutectic Cu6Sn5 phase, which surrounds the dendritic matrix, grew with both fibrous and globular morphologies. It was shown to have its fraction reduced with increasing Al. However, the Cu6Sn5 IMC morphologies were shown to be unaltered if the analyzed Al additions in the Sn-0.5wt.%Cu alloys as well as the experienced transient solidification settings were considered.
-
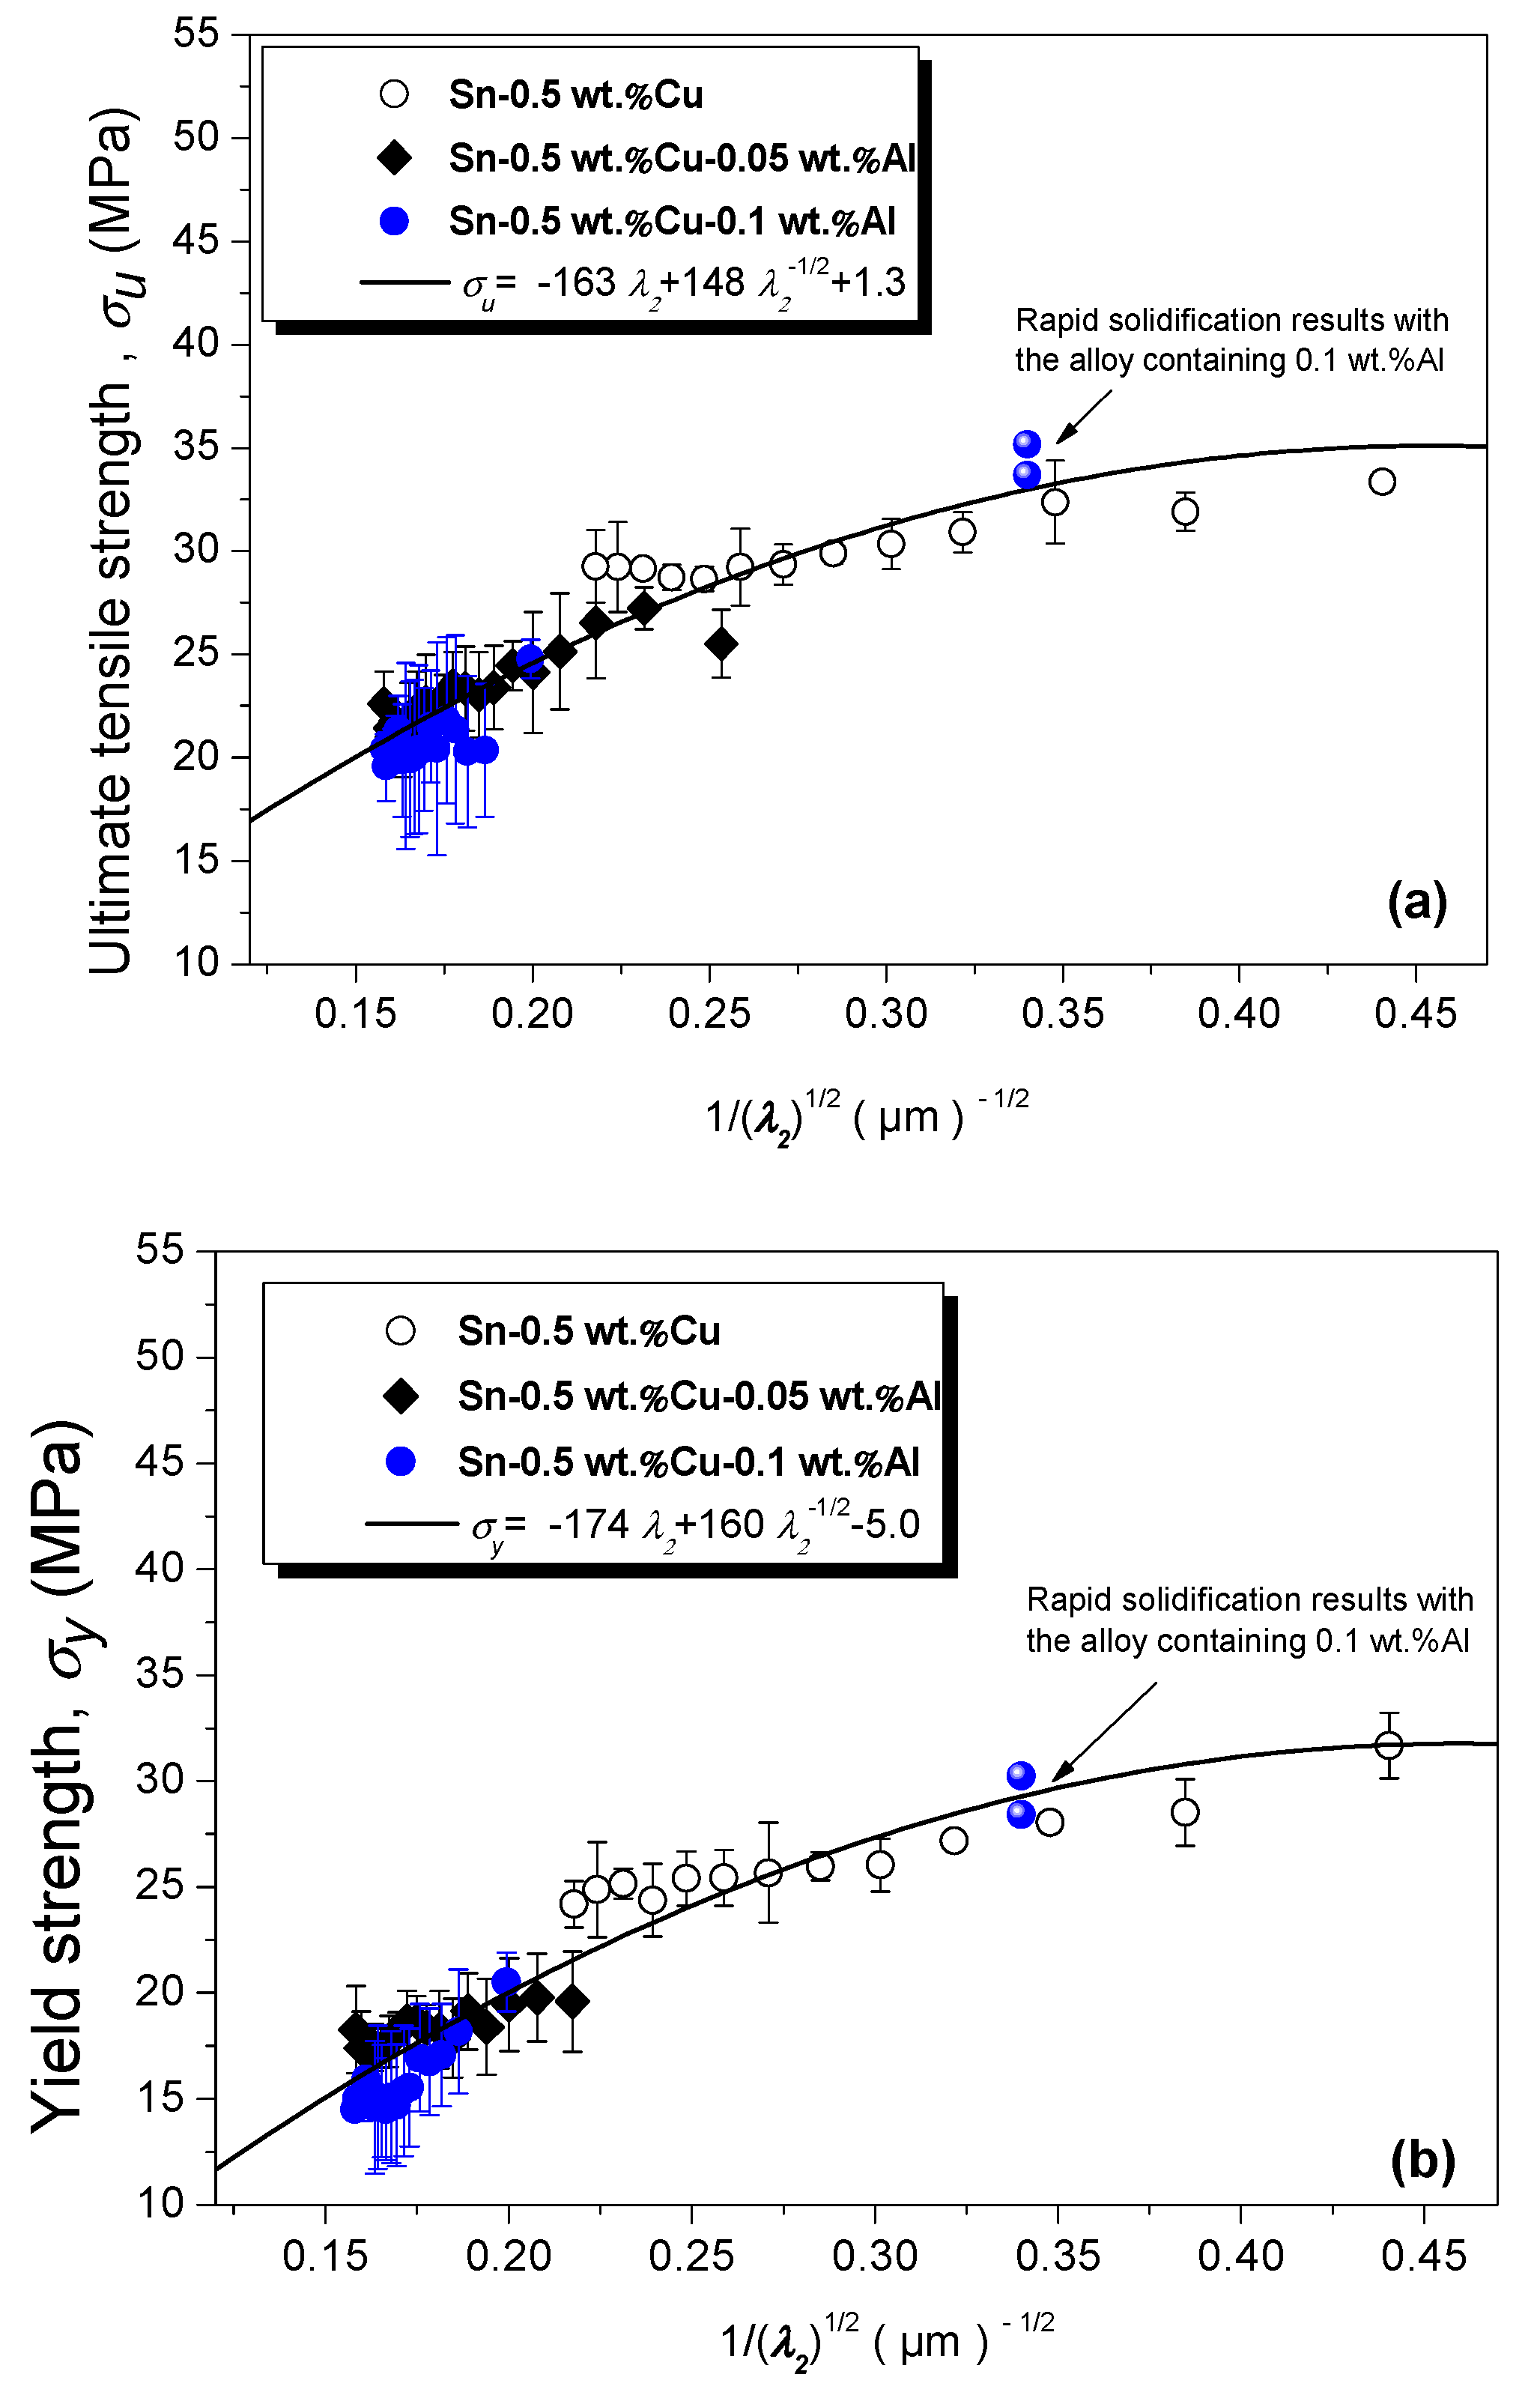
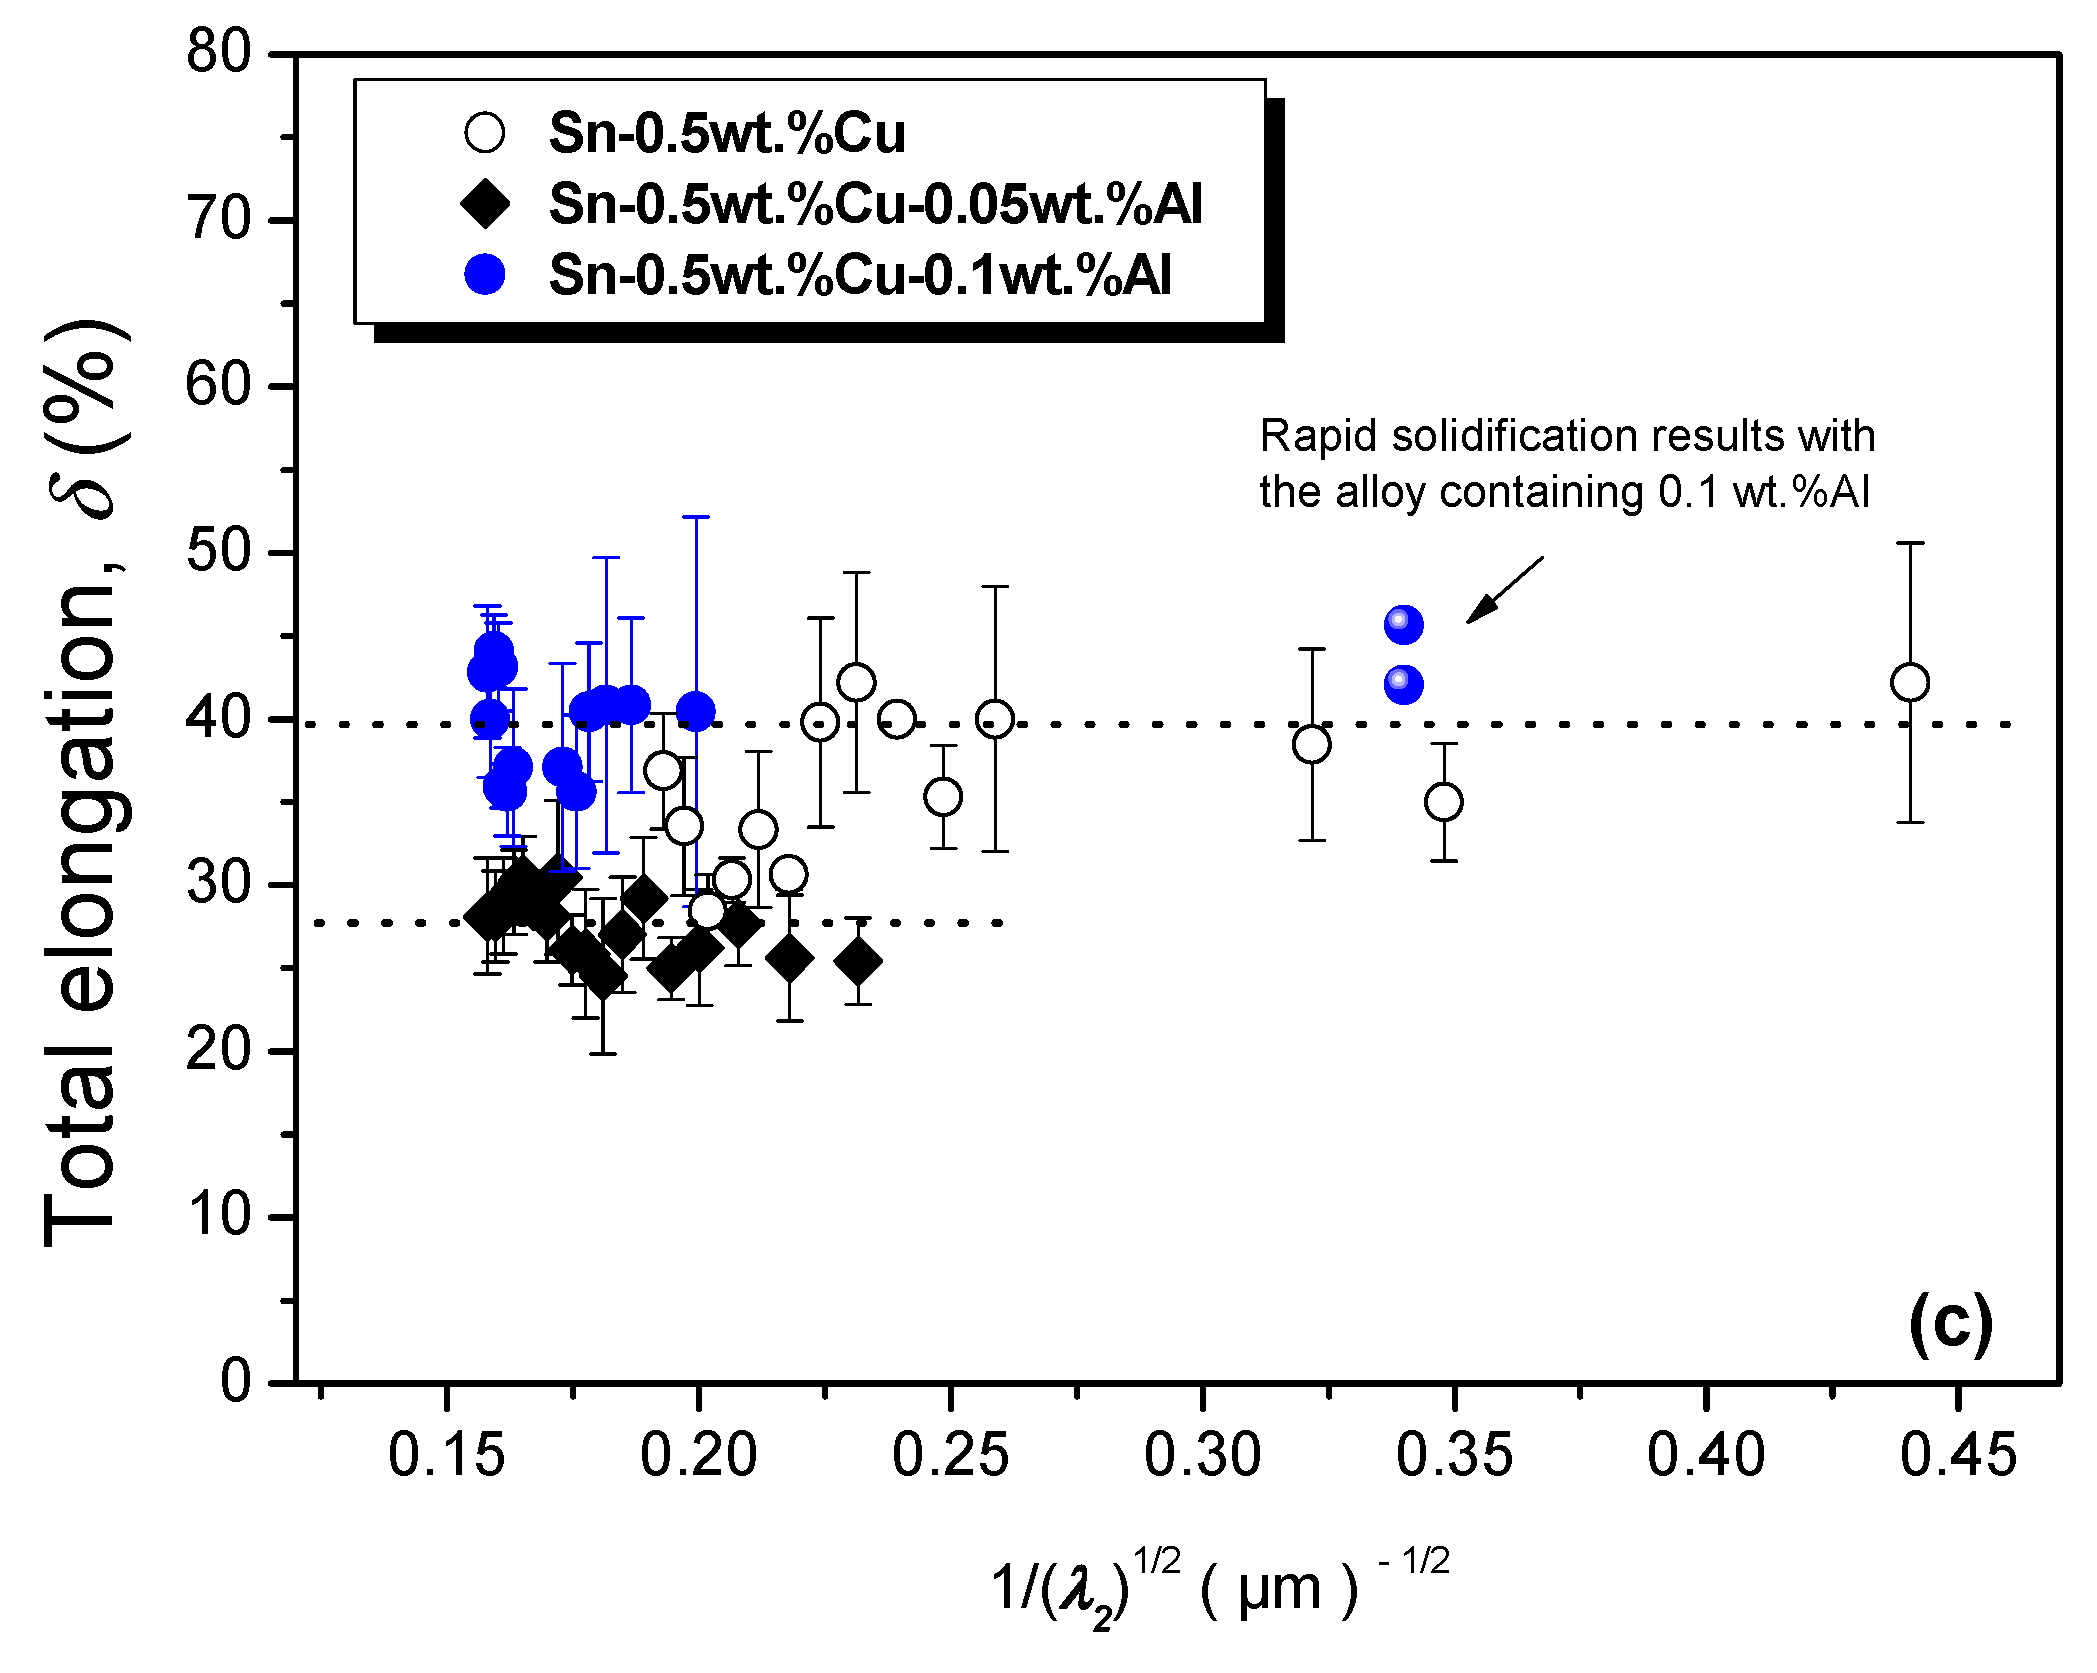
Coarser λ2 in size due to Al addition resulted in a deleterious effect on tensile strength generated through the directional solidification experiments; but had improved ductility when compared to the non-modified Sn-0.5wt.%Cu alloy. A more refined dendritic microstructure was associated with the non-modified DS alloy. However, RS samples of the ternary Sn-0.5wt.%Cu-0.1 wt.%Al alloy resulted in finer λ2 in size with an appreciable regaining in strength. Single Hall–Petch type correlations between σu and λ2 and between σy and λ2 were proposed, which were shown to represent trends encompassing the three tested alloys. As such, if the same λ2 is considered, the effect of Al in the strength of the Sn–Cu alloy can be considered negligible.

Author Contributions

T.S.L. contributed to the optical analysis, XRF and the tensile tests. G.L.d.G. contributed to the rapid solidification experiments. R.d.S.S. contributed to the first draft of the manuscript. C.B.d.C. contributed to the determination of the thermal parameters and XRD analysis. B.L.S. contributed to the SEM analysis. C.B. contributed to the supervision and funding acquisition; and J.E.S. and N.C. contributed to the final analysis of the results and revision of the writing.

Funding

The authors are grateful for the financial support provided by FAPESP (São Paulo Research Foundation, Brazil; Grants 2015/11863-5; 2016/18186-1; 2017/12741-6; CNPq (National Council for Scientific and Technological Development; Grants 407978/2018-6 and 307830/2017-9); FAPEAM (Amazonas State Research Support Foundation) and the Brazilian Nanotechnology National Laboratory—LNNano for providing the X-ray diffractometer.

Conflicts of Interest

The authors declare no conflict of interest.

References

  1. Suganuma, K. Advances in lead-free electronics soldering. Curr. Opin. Solid State Mater. Sci. 2001, 5, 55–64. [Google Scholar] [CrossRef]
  2. Directive 2002/95/EC of the European Parliament and of the Council of 27 January 2003 on the Restriction of the Use of Certain Hazardous Substances in Electrical and Electronic Equipment. Available online: https://eur-lex.europa.eu/legal-content/EN/TXT/?uri=CELEX%3A32002L0095 (accessed on 18 January 2019).
  3. Mookam, N.; Tunthawiroon, P.; Kanlayasiri, K. Effects of copper content in Sn-based solder on the intermetallic phase formation and growth during soldering. IOP Conf. Ser. Mater. Sci. Eng. 2018, 361, 012008. [Google Scholar] [CrossRef]
  4. Huh, S.-H.; Kim, K.-S.; Suganuma, K. Effect of Au addition on microstructural and mechanical properties of Sn-Cu eutectic solder. Mater. Trans. 2002, 43, 239–245. [Google Scholar] [CrossRef]
  5. Spinelli, J.E.; Garcia, A. Microstructural development and mechanical properties of hypereutectic Sn–Cu solder alloys. Mater. Sci. Eng. A 2013, 568, 195–201. [Google Scholar] [CrossRef]
  6. Biocca, P. Tin-Copper Based Solder Options for Lead-Free Assembly. Available online: https://www.yumpu.com/en/document/read/50982768/tin-copper-based-solder-options-for-lead-free-assembly-tin-kester (accessed on 18 January 2019).
  7. Yang, L.; Zhang, Y.; Du, C.; Dai, J.; Zhang, N. Effect of aluminum concentration on the microstructure and mechanical properties of Sn–Cu–Al solder alloy. Microelectron. Reliab. 2015, 55, 596–601. [Google Scholar] [CrossRef]
  8. Piyavatin, P.; Lothongkum, G.; Lohwongwatana, B. Characterization of eutectic Sn-Cu solder alloy properties improved by additions of Ni, Co and In. Mater. Test. 2012, 54, 383–389. [Google Scholar] [CrossRef]
  9. Zeng, G.; Xue, S.; Zhang, L.; Gao, L. Recent advances on Sn–Cu solders with alloying elements: Review. J. Mater. Sci. Mater. Electron. 2011, 22, 565–578. [Google Scholar] [CrossRef]
  10. Zeng, G.; McDonald, S.D.; Gu, Q.; Terada, Y.; Uesugi, K.; Yasuda, H.; Nogita, K. The influence of Ni and Zn additions on microstructure and phase transformations in Sn–0.7Cu/Cu solder joints. Acta Mater. 2015, 83, 357–371. [Google Scholar] [CrossRef]
  11. Nogita, K.; Read, J.; Nishimura, T.; Sweatman, K.; Suenaga, S.; Dahle, A.K. Microstructure control in Sn–0.7 mass%Cu alloys. Mater. Trans. 2005, 46, 2419–2425. [Google Scholar] [CrossRef]
  12. El-Daly, A.A.; Hammad, A.E. Enhancement of creep resistance and thermal behavior of eutectic Sn–Cu lead-free solder alloy by Ag and In-additions. Mater. Des. 2012, 40, 292–298. [Google Scholar] [CrossRef]
  13. El-Daly, A.A.; Hammad, A.E. Development of high strength Sn–0.7Cu solders with the addition of small amount of Ag and In. J. Alloys Compd. 2011, 509, 8554–8560. [Google Scholar] [CrossRef]
  14. Huh, S.-H.; Kim, K.-S.; Suganuma, K. Effect of Ag addition on the microstructural and mechanical properties of Sn-Cu eutectic solder. Mater. Trans. 2001, 42, 739–744. [Google Scholar] [CrossRef]
  15. Leong, Y.; Haseeb, A.S.M.A.; Leong, Y.M.; Haseeb, A.S.M.A. Soldering characteristics and mechanical properties of Sn-1.0Ag-0.5Cu solder with minor aluminum addition. Materials 2016, 9, 522. [Google Scholar] [CrossRef] [PubMed]
  16. Gain, A.K.; Fouzder, T.; Chan, Y.C.; Sharif, A.; Wong, N.B.; Yung, W.K.C. The influence of addition of Al nano-particles on the microstructure and shear strength of eutectic Sn–Ag–Cu solder on Au/Ni metallized Cu pads. J. Alloys Compd. 2010, 506, 216–223. [Google Scholar] [CrossRef]
  17. Sabri, M.F.M.; Shnawah, D.A.; Badruddin, I.A.; Said, S.B.M. Effects of aging on Sn–1Ag–0.5Cu solder alloys containing 0.1 wt.% and 0.5 wt.% Al. J. Alloys Compd. 2014, 582, 437–446. [Google Scholar] [CrossRef]
  18. Koo, J.; Lee, C.; Hong, S.J.; Kim, K.-S.; Lee, H.M. Microstructural discovery of Al addition on Sn–0.5Cu-based Pb-free solder design. J. Alloys Compd. 2015, 650, 106–115. [Google Scholar] [CrossRef]
  19. Silva, B.L.; Cheung, N.; Garcia, A.; Spinelli, J.E. Thermal parameters, microstructure, and mechanical properties of directionally solidified Sn-0.7 wt.%Cu solder alloys containing 0 ppm to 1000 ppm Ni. J. Electron. Mater. 2013, 42, 179–191. [Google Scholar] [CrossRef]
  20. Kang, S.K.; Shih, D.-Y.; Leonard, D.; Henderson, D.W.; Gosselin, T.; Cho, S.; Yu, J.; Choi, W.K. Controlling Ag3Sn plate formation in near-ternary-eutectic Sn-Ag-Cu solder by minor Zn alloying. JOM 2004, 56, 34–38. [Google Scholar] [CrossRef]
  21. Ventura, T.; Terzi, S.; Rappaz, M.; Dahle, A.K. Effects of solidification kinetics on microstructure formation in binary Sn–Cu solder alloys. Acta Mater. 2011, 59, 1651–1658. [Google Scholar] [CrossRef] [Green Version]
  22. Ochoa, F.; Williams, J.J.; Chawla, N. Effects of cooling rate on the microstructure and tensile behavior of a Sn-3.5wt.%Ag solder. J. Electron. Mater. 2003, 32, 1414–1420. [Google Scholar] [CrossRef] [Green Version]
  23. Shnawah, D.A.-A.; Said, S.B.M.; Sabri, M.F.M.; Badruddin, I.A.; Hoe, T.G.; Che, F.X.; Abood, A.N. Microstructure and tensile properties of Sn-1Ag-0.5Cu solder alloy bearing Al for electronics applications. J. Electron. Mater. 2012, 41, 2073–2082. [Google Scholar] [CrossRef]
  24. Neu, R.W.; Scott, D.T.; Woodmansee, M.W. Thermomechanical behavior of 96Sn-4Ag and casting alloy. Trans. ASME 2001, 123, 238–246. [Google Scholar]
  25. Gündüz, M.; Çadırlı, E. Directional solidification of aluminium–copper alloys. Mater. Sci. Eng. A 2002, 327, 167–185. [Google Scholar] [CrossRef]
  26. Li, J.F.; Agyakwa, P.A.; Johnson, C.M. Effect of trace Al on growth rates of intermetallic compound layers between Sn-based solders and Cu substrate. J. Alloys Compd. 2012, 545, 70–79. [Google Scholar] [CrossRef] [Green Version]
  27. Uddin, A.K.M.S.; Ferdousi, H.M.; Gafur, M.A. Effect of Al addition on the microstructural and mechanical behavior of Bi doped Sn-Zn alloy. Mater. Sci. 2014, 4, 1–5. [Google Scholar]
  28. Reeve, K.N.; Choquette, S.M.; Anderson, I.E.; Handwerker, C.A. Rapid solidification of Sn-Cu-Al alloys for high-reliability, lead-free solder: Part II. Intermetallic coarsening behavior of rapidly solidified solders after multiple reflows. Metall. Mater. Trans. A 2016, 47, 6526–6541. [Google Scholar] [CrossRef]
  29. Nogita, K. Stabilisation of Cu6Sn5 by Ni in Sn-0.7Cu-0.05Ni lead-free solder alloys. Intermetallics 2010, 18, 145–149. [Google Scholar] [CrossRef]
  30. Nogita, K.; McDonald, S.; Zindel, J.; Dahle, A. Eutectic solidification mode in sodium modified Al-7 mass%Si-3.5 mass%Cu-0.2 mass%Mg casting alloys. Mater. Trans. 2001, 42, 1981–1986. [Google Scholar] [CrossRef]
  31. Sebaie, O.E.; Samuel, A.M.; Samuel, F.H.; Doty, H.W. The effects of mischmetal, cooling rate and heat treatment on the eutectic Si particle characteristics of A319.1, A356.2 and A413.1 Al–Si casting alloys. Mater. Sci. Eng. A 2008, 480, 342–355. [Google Scholar] [CrossRef]
  32. Spinelli, J.E.; Bogno, A.-A.; Henein, H. Two-zone microstructures in Al-18Si alloy powders. Metall. Mater. Trans. A 2018, 49, 550–562. [Google Scholar] [CrossRef]
  33. Wu, C.M.L.; Yu, D.Q.; Law, C.M.T.; Wang, L. Microstructure and mechanical properties of new lead-free Sn-Cu-RE solder alloys. J. Electron. Mater. 2002, 31, 928–932. [Google Scholar] [CrossRef]
  34. Grugel, R.N.; Lograsso, T.A.; Hellawell, A. The solidification of monotectic alloys—Microstructures and phase spacings. Metall. Mater. Trans. A 1984, 15, 1003–1012. [Google Scholar] [CrossRef]
  35. Yang, L.; Zhang, Y.; Dai, J.; Jing, Y.; Ge, J.; Zhang, N. Microstructure, interfacial IMC and mechanical properties of Sn–0.7Cu–xAl (x = 0–0.075) lead-free solder alloy. Mater. Des. 2015, 67, 209–216. [Google Scholar] [CrossRef]
Figure 1. Graphic representation of (a,c) transverse and (b) longitudinal sections of the DS casting showing the methods used to measure dendritic and eutectic spacing. The intercept method was applied for λ2, λf, and λg, whereas the triangle method was applied for λ1. ‘L, Lf and Lg are the length of lines and ‘n’ is the number of intercepted phases.
Metals 09 00241 g001
Figure 2. Experimental cooling profiles displayed during the unsteady-state directional solidification of the (a) Sn-0.5wt.%Cu; (b) Sn-0.5wt.%Cu-0.05wt.%Al; and (c) Sn-0.5wt.%Cu-0.1wt.%Al alloys.
Metals 09 00241 g002
Figure 3. Experimental plots for the Sn–Cu–Al solder alloys corresponding with (a) position vs. time at which either the liquidus or the eutectic front reaches each thermocouple; (b) growth rate (V) as a function of position; (c) cooling rate (Ṫ) as a function of position (P); and (d) thermal gradient (G) as a function of position (P). R2 is the coefficient of determination.
Metals 09 00241 g003
Figure 4. Directionally solidified macrostructures related to: (a) Sn-0.5wt.%Cu; (b) Sn-0.5wt.%Cu-0.05wt.%Al; and (c) Sn-0.5wt.%Cu-0.1wt.%Al alloys.
Metals 09 00241 g004
Figure 5. Experimental XRF macrosegregation profiles along the length of the (a) Sn-0.5wt.%Cu-0.05wt.%Al and (b) Sn-0.5wt.%Cu-0.1wt.%Al alloy castings. P is the position from the metal/mold interface.
Metals 09 00241 g005
Figure 6. Representative optical microstructures for selected positions along the length of the Sn-0.5wt%Cu solder alloy casting. Additionally, these include the related solidification thermal parameters (Ṫ and v) and primary, λ1, secondary, λ2, and dendrite arm spacing.
Metals 09 00241 g006
Figure 7. Representative optical microstructures associated with different sections along the Sn-0.5wt.%Cu-0.05wt.%Al alloy casting.
Metals 09 00241 g007
Figure 8. Representative optical microstructures associated with different sections along the Sn-0.5wt.%Cu-0.1wt.%Al alloy casting.
Metals 09 00241 g008
Figure 9. X-ray diffraction (XRD) patterns of the (a) Sn-0.5wt.%Cu-0.05wt.%Al and (b) Sn-0.5wt.%Cu-0.1wt.%Al solder alloys for specific positions along the length of the directional castings. P is the position from the metal/mold interface.
Metals 09 00241 g009
Figure 10. SEM microstructures of (a,b) Sn-0.5wt.%Cu, (c,d) Sn-0.5wt.%Cu-0.05 wt.%Al, and (e,f) Sn-0.5wt.%Cu-0.1 wt.%Al alloys considering two levels of cooling rates. P is the position from the cooled surface of the DS casting. λg and λf are the globular and fibrous spacing, respectively.
Metals 09 00241 g010
Figure 11. EDS/SEM charts of the elements related to the phases constituting the microstructures of the transverse specimens of the DS (a) Sn-0.5wt.%Cu (P = 30 mm/0.50 °C/s); (b) Sn-0.5wt.%Cu-0.05wt.%Al (P = 15 mm/0.27 °C/s), and (c) Sn-0.5wt.%Cu-0.1wt.%Al alloys (P = 30 mm/0.33 °C/s).
Metals 09 00241 g011
Figure 12. (a) Ultimate Tensile Strength-σu, (b) Yield Tensile Strength-σy, and (c) Strain-to-failure-δ variations with the secondary dendritic spacing (λ2) for the Sn-0.5wt.%Cu-xAl alloys.
Metals 09 00241 g012aMetals 09 00241 g012b
Table 1. Chemical composition (wt.%) of the metals used to prepare the alloys.
MetalAlFeNiSiCuPbZnBiSn
Albalance0.090.030.060.06----
Cu-0.07--balance0.002---
Sn-0.00250.0001-0.00040.0010.00020.0084balance
Table 2. Eutectic area fractions measured along the length of the DS Sn–Cu–xAl alloy castings.
AlloyCooling Rate (°C/s)Eutectic Area Fraction (%)
Sn-0.5wt.%Cu1.0035.20
0.4535.05
0.1537.60
Sn-0.5wt.%Cu-0.05wt.%Al1.008.45
0.4511.15
0.155.35
Sn-0.5wt.%Cu-0.1wt.%Al1.005.40
0.457.05
0.156.00

