Article

Effect of Surface and Subsurface Defects on Fatigue Behavior of AlSi10Mg Alloy Processed by Laser Powder Bed Fusion (L-PBF)

1
Department of Mechanical Engineering, Politecnico di Milano, 20156 Milan, Italy
2
Rosler Italiana Srl, 20863 Concorezzo, Italy
3
Department of Chemistry, Materials and Chemical Engineering, Politecnico di Milano, 20133 Milan, Italy
4
Aidro S.r.l, 21120 Taino, Italy
*
Author to whom correspondence should be addressed.
Metals 2019, 9(10), 1063; https://doi.org/10.3390/met9101063
Submission received: 28 August 2019 / Revised: 20 September 2019 / Accepted: 22 September 2019 / Published: 29 September 2019

Abstract

:
The fatigue behaviour of an AlSi10Mg alloy processed by laser powder bed fusion (L-PBF) and subjected to different surface finishing processes was investigated paying special attention to the residual defects on the surface and the dominant fatigue failure mechanisms. Roughness measurements and qualitative surface morphology analysis showed smooth surfaces in the case of vibro-finishing and machining followed by polishing. The fatigue performance did not reveal to be directly related to surface roughness, but residual intrusions left on the finished surfaces. Post-mortem analysis showed single- or multiple-crack nucleation from pores opened on the surface, un-melted powders, or spatters considered as typical L-PBF defects. A fatigue limit of 195 MPa for machined and polished samples was obtained by substantial removal of surface and subsurface defects.

Graphical Abstract

1. Introduction

Metal additive manufacturing (AM) enables the fabrication of geometrically complex shapes providing structural parts for various industrial fields such as in medical, automotive, and aerospace sectors. In particular, laser powder bed fusion (L-PBF) is becoming one of the most popular AM technologies, attracting great interest for near-net shape parts and light components. L-PBF allows generating parts by selectively scanning powdered metals with a laser beam, so as to produce layer by layer a solid volume after melting and solidification of the powder [1,2].
The design of structural parts to be produced by AM requires a full knowledge of the static and cyclic behavior of materials. While monotonic properties of additively manufactured parts have been widely investigated and a detailed frame of information is available from open literature, fatigue behavior still deserves research efforts to gain a full understanding about all its variables of influence [1,3,4,5,6,7].
It is well known that fatigue properties are inherently affected by a significant scatter. This statistical variability is amplified in AM products due to the presence of both internal and surface-related defects. Imperfections such as porosity or shrinkage cavities, un-melted powder particles, lack of fusion between adjacent laser tracks and close to large spatters represent the most common bulk defects [3,7,8,9,10]. Moreover, it is to consider that most of these defects form between layers and produce aligned notches parallel to them. As a result, the load-bearing ability of the L-PBF processed materials along the build direction (z direction) is depleted when compared to other orientations, both for static and dynamic conditions. This might be attributed to the anisotropy exhibited in the consolidated parts as a result of the layer by layer manufacturing nature of the L-PBF process [1,3,7].
As-built AM parts possess considerably high surface roughness due to the balling effect, presence of partially melted powder particles, and spatters exposed along their scan boundaries (i.e., the part surfaces) [7,8,9,10,11,12]. Mesoscopic aspects also play a role in surface features when considering the so-called “staircase effect” caused by the stepped approximation formed by the layers on curved and inclined surfaces, especially on overhangs [1,13,14]. A recent study on effects of L-PBF parameters of an IN625 alloy published by Koutiri and co-workers [13] revealed that a large number of factors can affect the surface roughness of parts. Increasing the overall volume energy density (VED) of the process, as a rule leads to more frequent liquid spatter ejections from the melt pool that contaminate the powder bed and favor the sticking of powder particles to the fused walls of the part (hence increases its surface roughness). On the other hand, a simple increase of the laser power also increases the amount of layer re-melting and can result in a smoothing effect, while lower scan speeds promote larger but more turbulent melt pools that are again more prone to the above-mentioned spattering phenomena. Fatigue tests performed by Koutiri and co-workers [13] showed that the estimated fatigue strength was lower than the fatigue data for the same alloy processed by conventional manufacturing routes. In addition, despite the high difference in surface roughness when moving from as-built specimens to polished specimens, the improvement in fatigue strength was limited to about 10%. Indeed, fracture analyses demonstrated that fatigue cracks could nucleate either from surface features or subsurface defects often connected to the overlap between the contour and the core scan strategies. It was speculated that defects coming from the above-mentioned sources were similar in size and led to similar fatigue lives [13]. A corresponding investigation, carried out on L-PBF processed AlSi7Mg alloys, consistently showed that polished samples still containing subsurface defects (deriving from the onset of keyhole melting mode at the contour scans) featured a fatigue behavior very similar to that of samples with as-manufactured surfaces, whereas an improved fatigue limit could only be measured when subsurface defects were fully removed by machining a consistent layer of material from the as-built surfaces (30% improvement) [15]. Aboulkhair et al. [16] achieved consistent results regarding as-built and machined samples with very similar behavior due to the presence of residual subsurface defects after machining.
Bagehorn et al. published a detailed research work on effects of different surface finishing processes on fatigue performance of Ti-6Al-4V alloy fabricated by L-PBF [14]. By considering blasting, vibratory finishing, micro-machining, and milling, they were able to span arithmetical average surface roughness values (Ra) from 17.9 of as-built samples down to 0.3 µm of polished specimens. Additionally, for this investigation it was concluded that there is no simple correlation between fatigue strength and surface roughness. Milled samples showed the most significant improvement of fatigue performance by virtue of the removal of all the surface and subsurface imperfections. In comparison, blasted, vibratory ground, and micro-machined samples, even if they showed an improvement over the as-built samples (around 50%), demonstrated a higher scatter of their fatigue lives and the frequent nucleation of cracks from the deepest defects still present on surfaces, which were not always removed by the finishing operations.
A considerable amount of experimental data is also available in the literature about the fatigue resistance of AlSi10Mg alloy [3,15,16,17,18,19,20,21,22]. It is suggested that not only surface finishing, but also material microstructure, hence static strength and ductility, affect the fatigue behavior. In [17], an AlSi10Mg alloy was subjected to different heat treatments such as stress relieving (300 °C for 2 h), solution treatment (530 °C for 1 h and water quenching), and artificial aging (solution treatment followed by aging at 170 °C for 12 h). The investigation showed that with the increase of the heat treatment temperature, the Si phase originally located as an almost continuous network at cell boundaries changed its morphology into discontinuous particles that were then prone to coarsening. This trend significantly reduced the tensile and fatigue strength with the exception of the solution treated and aged temper, owing to the effect brought about by the additional precipitation of sub-micrometric strengthening particles. Consistently, Aboulkhair et al. [16] and Brandl et al. [3] demonstrated that specific treatments aimed at improving ductility by a solution annealing and tailored aging were able to improve the fatigue behavior of the same alloy with respect to the as-built condition by 40% to the maximum fatigue strength of 165 MPa and 140% to the maximum fatigue strength of 150 MPa respectively.
In this paper, the fatigue behavior of an AlSi10Mg alloy produced by L-PBF after applying different surface finishing processes is investigated. The presented research is particularly focused on the relation between the residual defects existing on the surfaces of sand blasted, vibro-finished, and on machined and polished samples, and the fatigue performance of the materials. The dominant fatigue failure mechanisms detected from fracture analyses and the microstructural sources responsible for the nucleation of the fatigue defects were investigated to improve the knowledge about the fatigue behavior of L-PBF processed Al alloys.

2. Materials and Methods

2.1. L-PBF Processing

The AlSi10Mg alloy samples used for this investigation were produced by an EOS M290 L-PBF system (Krailling, Germany) employing a 400 W continuous Yb-fiber laser in Argon atmosphere. The process parameters reported in Table 1 were selected to produce parts with a high relative density up to 99.85% based on the datasheet provided by the supplier (EOS). The platform temperature was kept at 160 °C during the print process so as to reduce residual stresses and promote precipitation of strengthening phases already in the as-built condition [23]. Samples were produced using a stripe scanning strategy and the scanning direction was rotated by 67° after completion of each layer.

2.2. Microstructure Analysis, Tensile Tests

A Zeiss EVO 50 EP scanning electron microscope (SEM, Zeiss, Oberkochen, Germany) and a Nikon Eclipse LV150NL optical microscope (OM) (Tokyo, Japan) were utilized to evaluate the alloy microstructure after polishing and chemically etching with Keller’s reagent. Sample density was evaluated by Archimedes method employing a high precision balance with a dedicated measurement kit (Precisa 100 A-300 M) having an accuracy of ±0.1 mg. Further evaluation of density was achieved by metallographic analyses on cross-sectioned samples, prepared according to above described metallographic procedures, but without etching.
The tensile strength was evaluated according to EN ISO 6892-1:2016 standard at room temperature, with a crosshead speed of 0.5 mm/min, using an MTS Alliance RT/100 universal testing frame (Minneapolis, MN, USA) equipped with an extensometer. Four specimens having a gauge length of 30 mm and a diameter of 6 mm were tested. The samples had been machined from cylindrical bars printed with their longitudinal axis elongated in the build direction (z direction).
Near-net shape cylindrical specimens were additionally printed for fatigue testing, with their longitudinal axis oriented along the z direction. The specimens featured a gauge diameter of d = 8 mm and a gauge length of Lp = 40 mm, according to the design recommended by ISO 1099:2017 standard for fatigue testing (Figure 1).

2.3. Surface Finishing and Surface Characterization

Three sets of specimens were selected randomly from the total number of as-built specimens and considered for the fatigue investigation. A first condition was obtained after sandblasting (SB), starting from the as-built condition. Manual blasting was carried out in a closed chamber at a pressure of 0.4 MPa with a stand-off distance of 20 cm for the duration of 5 min per specimen using corundum spheres with an average size of 100 µm. This treatment is considered to represent the reference condition for the vast majority of parts that are simply extracted from the build plate and then subjected to the simplest and cheapest surface finishing. A second group of specimens was subjected to vibro-finishing (VF). For this treatment, batches of samples were treated together in a vibratory bowl filled with plastic abrasive cones media having an average size of 20 mm with a vibratory frequency of 50 Hz for 12 h.
A third group of specimens was obtained by machining and polishing (MP). Turning was applied to remove a layer of 0.5 mm from as-built specimen surfaces, in order to ensure the absence of any surface and subsurface defects generated during the L-PBF process. The machined samples were then polished manually with silicon carbide grinding papers up to 4000 grit followed by fine alumina abrasive cloth to a final average roughness amplitude Ra lower than 0.2 µm, keeping a final polishing direction oriented along the longitudinal axis of the specimens. The polishing was performed in a lubricated condition.
Non-contact-based surface texture measurements for all the specimen test groups and as-built surfaces were performed using an Olympus LEXT OLS4100 confocal microscope (Tokyo, Japan) with a lateral resolution of 0.12 µm and a vertical resolution of 10 nm. The specimens were measured with a 10 × 0.3 numerical aperture objective and a 3 mm × 3 mm areal test field. Nine acquisitions, each with dimensions of 1 mm × 1 mm, were collected for each sample and stitched together with 5% overlap. Before calculating any surface parameters, the three axis raw data were subjected to form removal, followed by spatial filtering (median denoising 5 × 5) to remove spurious points. Subsequently, Gaussian convolution F-filter and L-filters were applied to circumvent large and smaller scale waviness wavelength on the surfaces yielding S-L surfaces. These cut-off values were selected based on visual inspection of the analyzed surfaces and are in agreement with those reported in previous literature [24]. The data were then processed using DigitalSurf MountainsMap 7 software (Besançon, France) to obtain the areal surface parameters based on the ISO 25178-2 standard [25].
Nano-indentation measurements were performed employing a MicroMaterials System Nanotest Platform 3 (Wrexham, UK) in order to investigate surface and subsurface hardness profiles along cross-sectioned samples, of each surface condition. These measurements were done at a controlled temperature of 28 °C, using a Berkovich diamond indenter. A maximum load of 5 mN with a loading rate of 0.5 mN/s and an unloading rate of 1 mN/s with a maximum spacing between indentations of 15 µm was used as the indentation protocol. Three arrays, each consisting of 12 indentations were performed for each surface condition to acquire a more statistically reliable trend.

2.4. Fatigue Testing

Uniaxial fatigue tests in load-controlled mode were performed according to ISO 1099:2017 standard by adopting an MTS Servohydraulic testing frame, employing a 100 kN load cell. The fatigue tests were carried out on the above described three sets of samples, with an axial fatigue stress ratio R = 0.1 at ambient temperature. The tests were done at constant maximum stress levels ranging from 85 to 245 MPa, with a test frequency of 30 Hz. Runout of samples was fixed at 5 × 10⁶ cycles. Data were statistically analyzed according to ISO 12107:2012 standard. The fatigue limit was statistically calculated considering at least 12 specimens per batch.
The fracture surfaces of selected broken samples were then analyzed by SEM to identify nucleation sites, extension of the crack growth region, and microstructural mechanisms leading to final fracture.

3. Results

3.1. Microstructure

Representative optical and SEM micrographs of the as-built AlSI10Mg alloy are depicted in Figure 2. From low magnification images (Figure 2a), the distinct tracks of the melt pools are visible, showing the amount of overlapping both along lateral and z directions (vertical direction in Figure 2a). Higher magnification views (Figure 2b,c) reveal the presence of a fine cellular solidification structure consisting in submicrometric primary α-Al cells decorated by a network of Si. Further precipitates, also rich in Si, are detected inside the cells as isolated particles [23]. It is noticed, crossing the boundary of the melt pool, the size of the cells is subjected to a change (Figure 2b) owing to the reheating effects produced by the subsequent passes and to local changes in solidification conditions [8,26]. The observed microstructure is fully consistent with description available from literature [1,27].
Relative density values measured using the Archimedes method are summarized in Table 2. The values range from 99.58% to 99.71%, and reveal a negligible presence of bulk porosity. Slightly (but repeatable) lower density values were systematically detected for the VF samples when compared to SB and MP specimens. However, it should be noted that possible deviations due to surface tension effects in the presence of rough surface cannot be excluded when evaluating the density data.

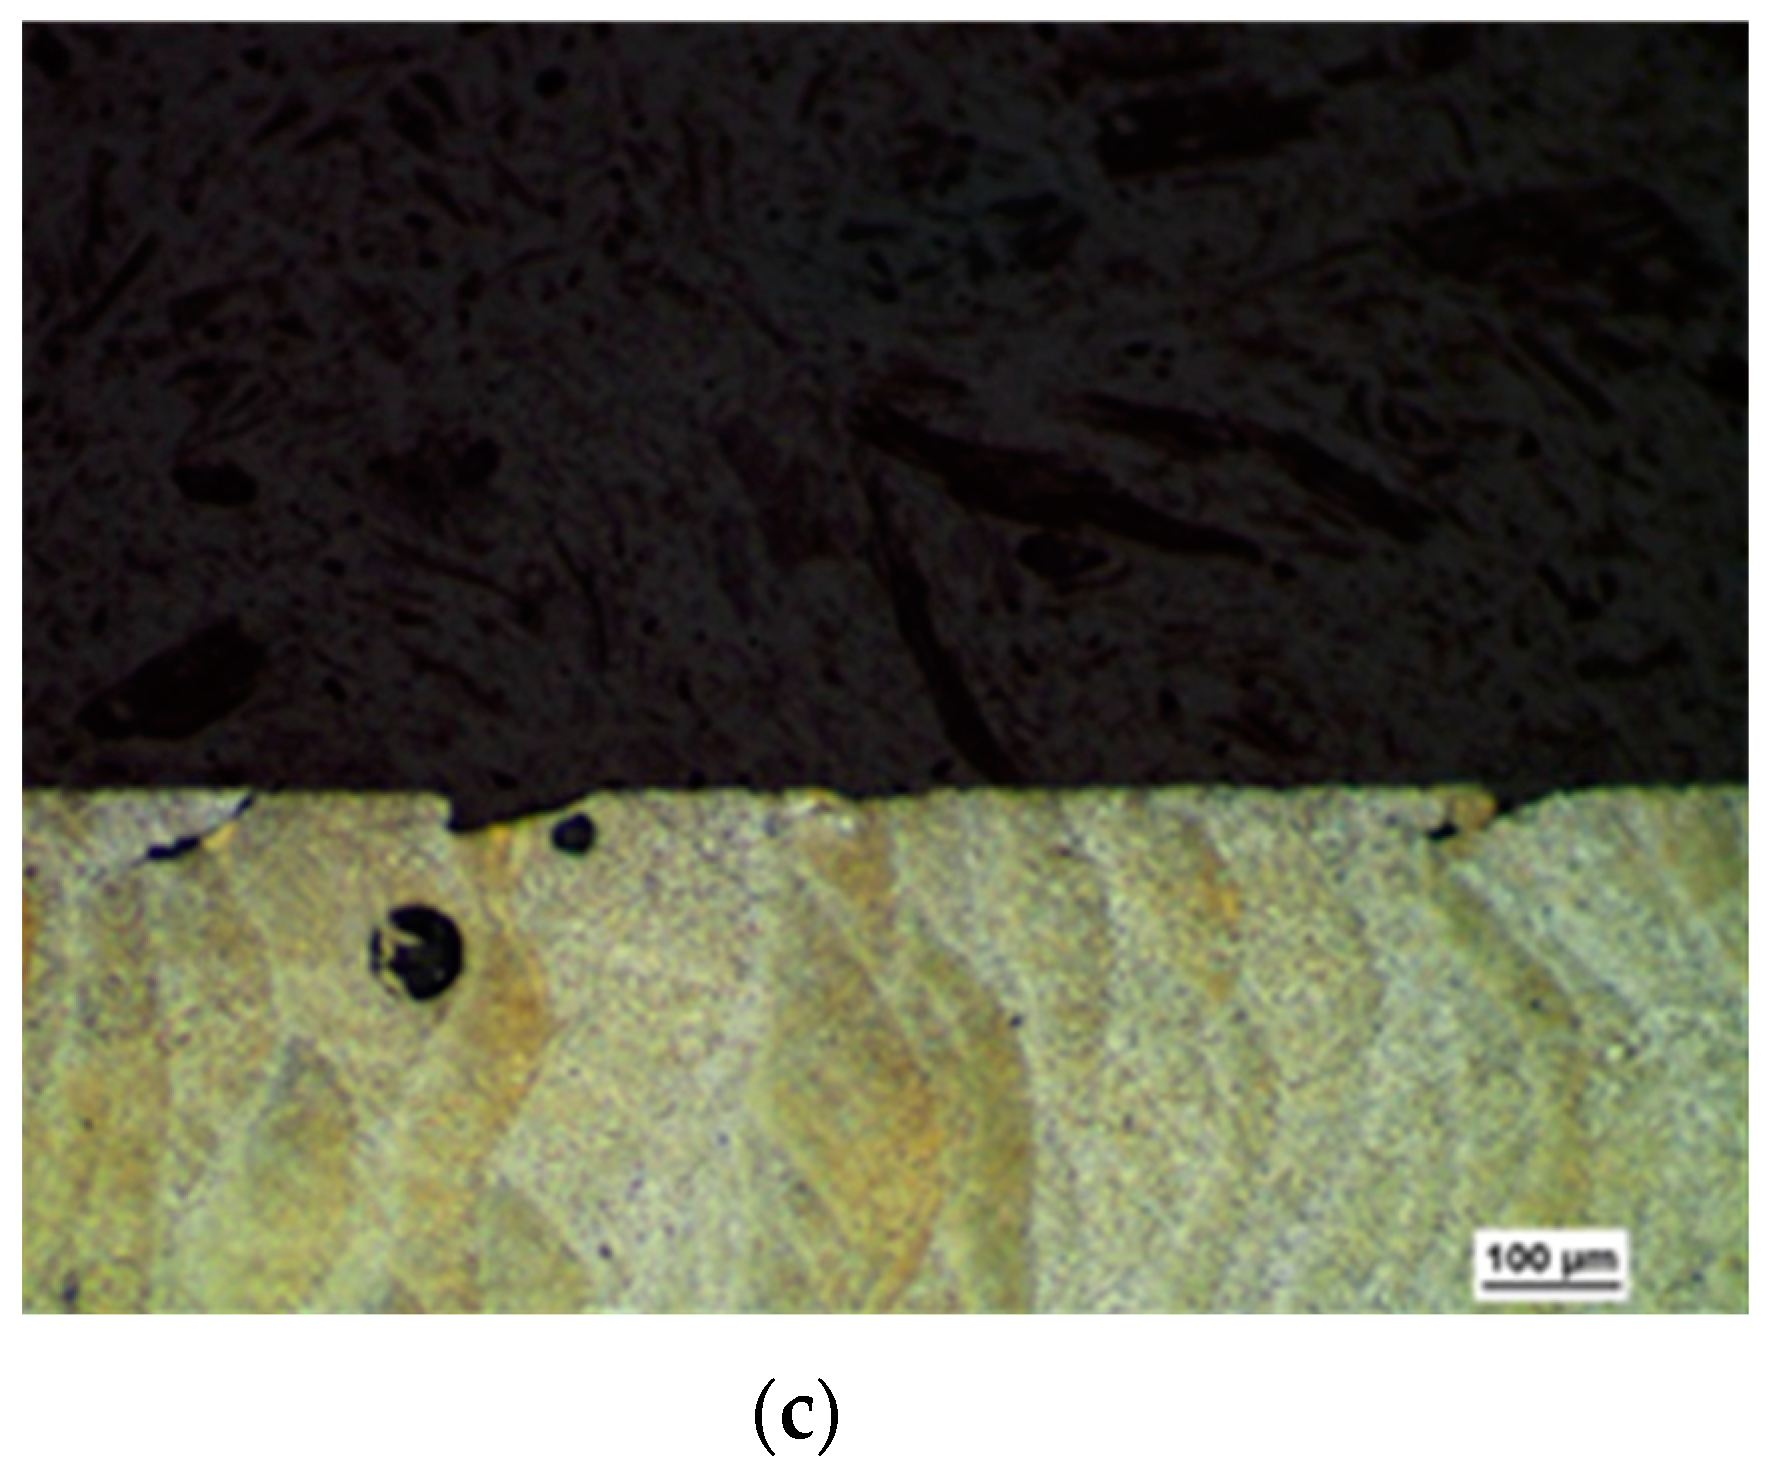
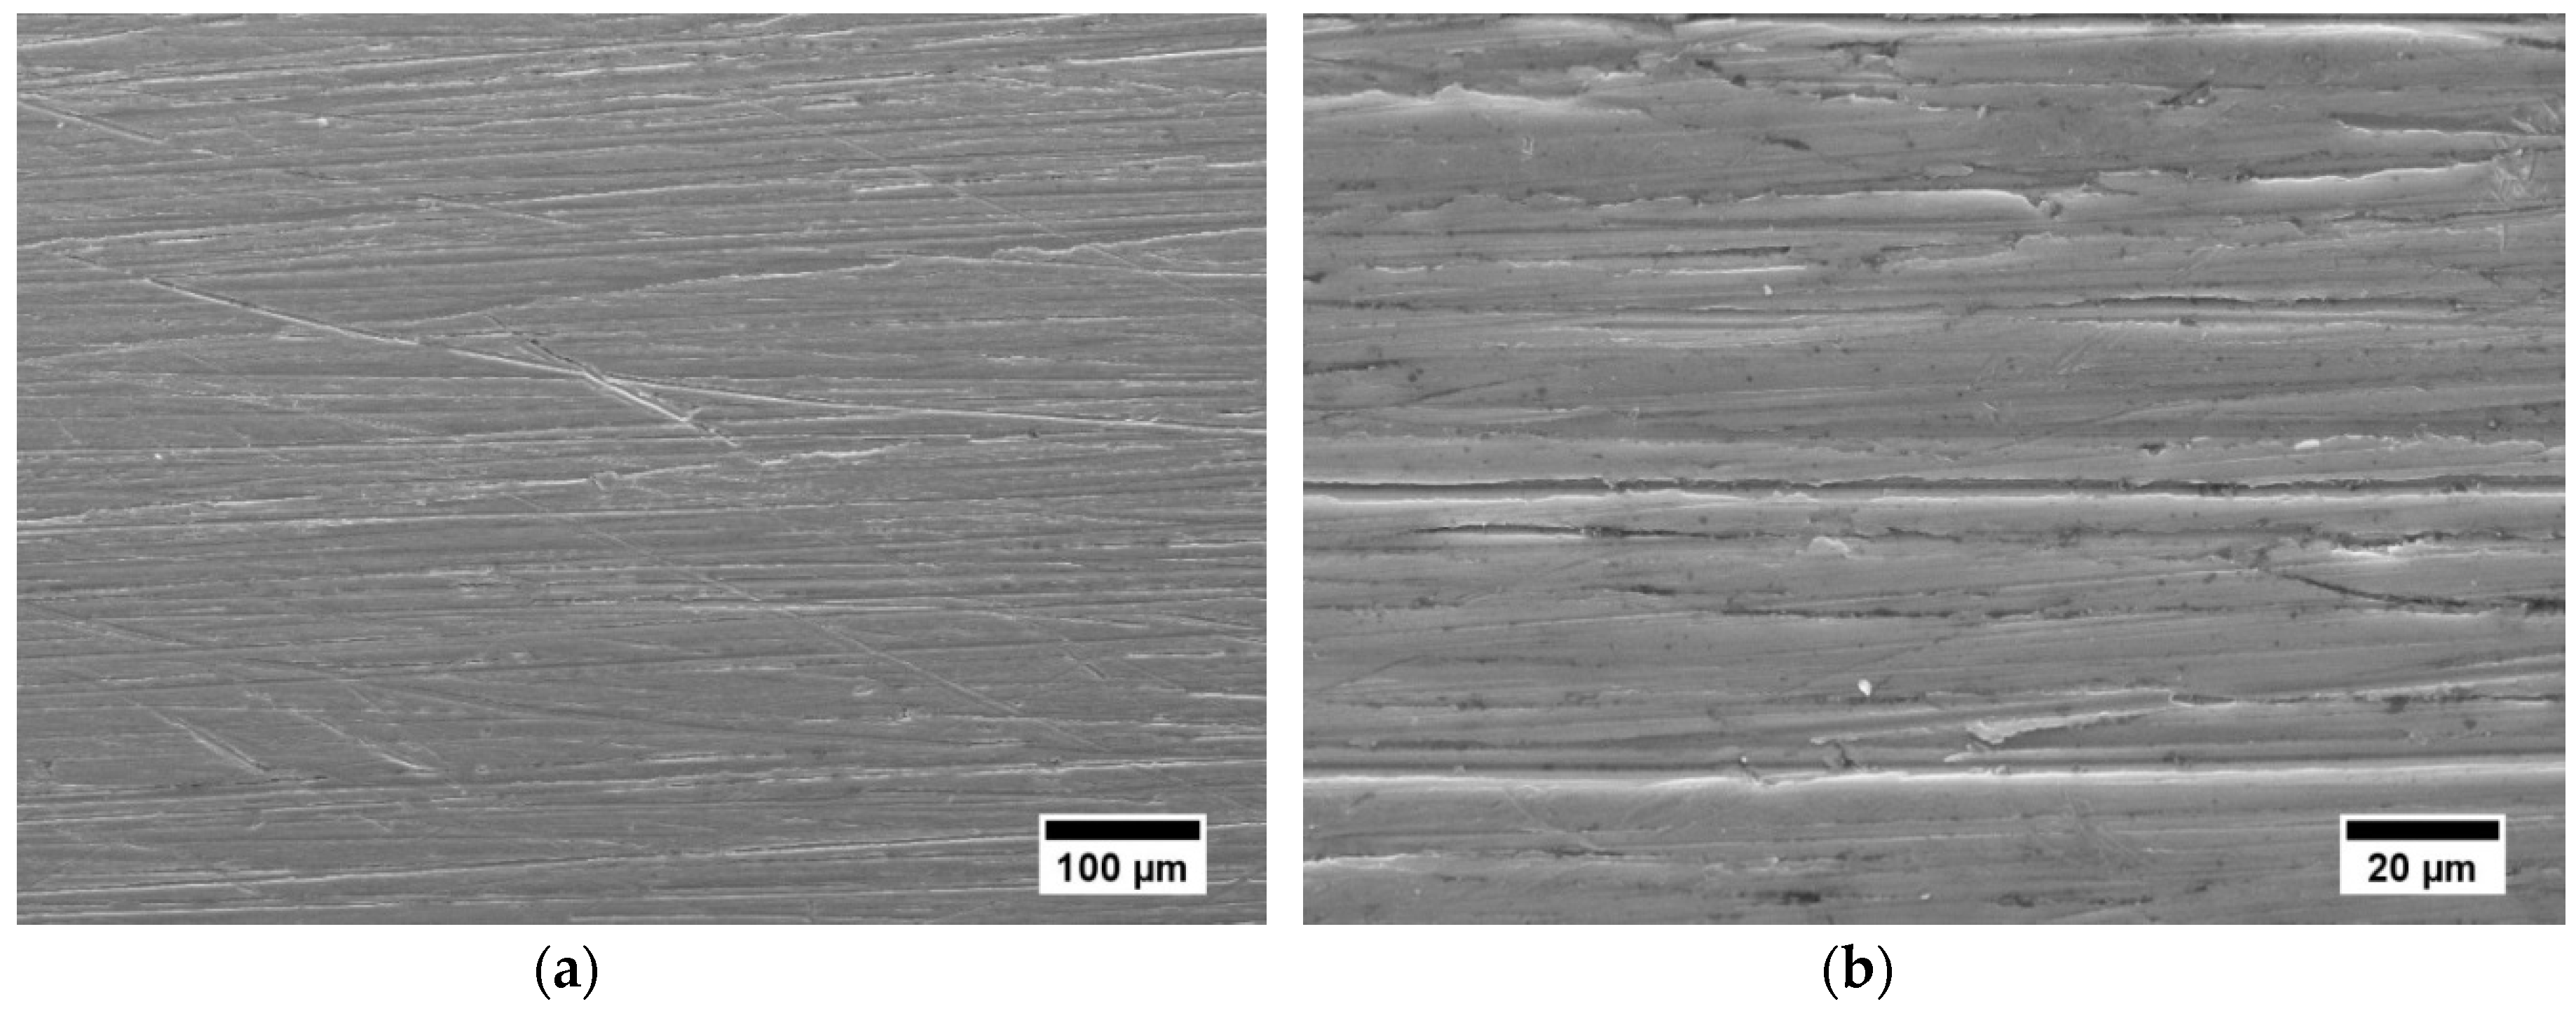
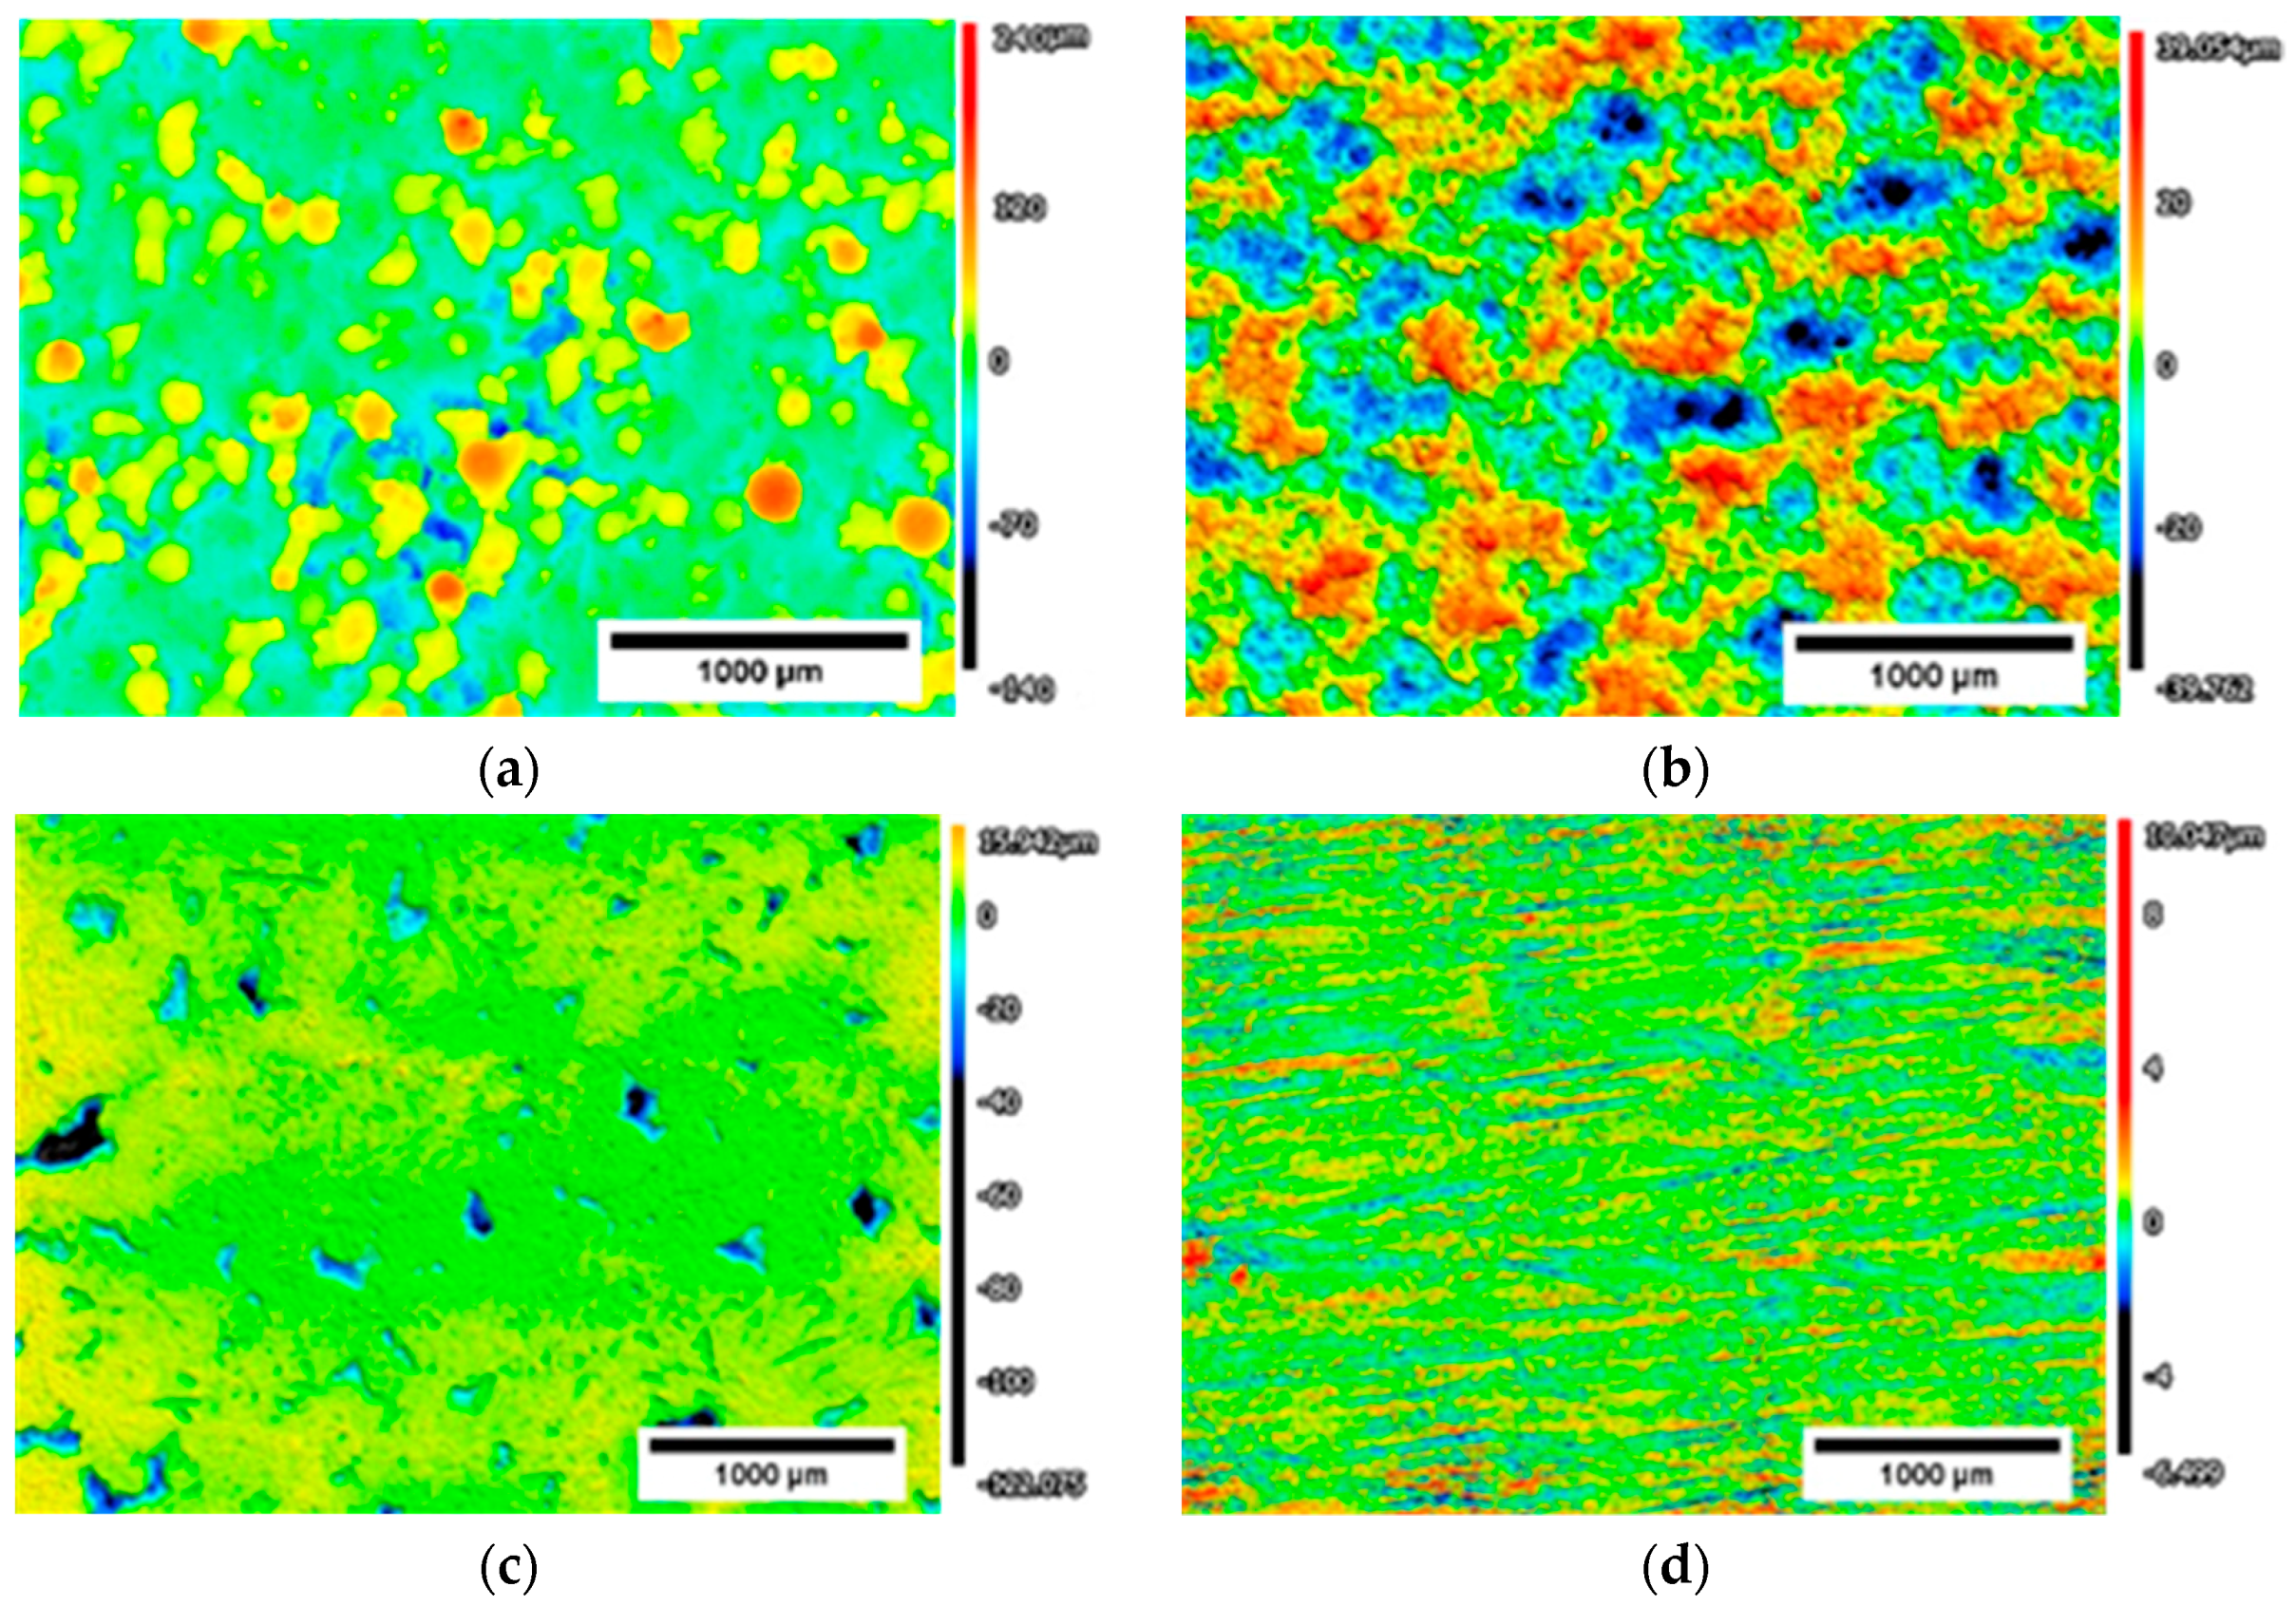
3.2. Surface Morphology and Subsurface Microstructure

The surface appearance of the AlSi10Mg alloy in the as-built condition is depicted in Figure 3. Views of the side surface of printed samples (Figure 3a) reveal the typical features generated during melting of the powder such as a population of spherical particles having a wide range of sizes that have been identified in the literature as partially melted metal powders, ballings, and spatters, depending on the mechanisms of their formation [8,9]. These features are also recognized by the analysis of cross-sectioned samples observed close to the surface profile (Figure 3b) and the confocal microscopy images from the surface presented afterwards.
Similar images collected for the SB, VF, and MP specimens are depicted in Figure 4, Figure 5 and Figure 6, respectively, followed by their height images in Figure 7. Observations of Figure 4 and Figure 7b suggest that the typical surface features of as-built L-PBF samples are replaced in SB specimens by shallower indentation craters of collided particles created during sandblasting. Occasional evidence of fragmented debris of these particles are noticed on the surface (see arrowed fragment in Figure 4b) [28,29]. Cross-sectional profiles (Figure 4c,d) agree with the SEM images exhibiting the waviness as a result of craters and subsurface porosities generated during the sandblasting attributed to the plastic deformation of the surface and closure of the deep valleys in as-built surfaces (see white squared defects in Figure 4c,d).
Figure 5 and Figure 7c represent the surface aspects of samples after vibro-finishing. The original features of the as-built surface and the waviness corresponding to the tracks are gone. However, several open pores can still be identified on the surface profile (see Figure 5c and Figure 7c). These are supposed to be inherited from surface or subsurface defects formed during L-PBF processing and are typically generated due to lack of fusion between adjacent tracks, presence of un-melted or partially melted spatters and gas porosity [1].
Finally, the surface of the machined and polished specimen shown in Figure 6 and Figure 7d reveal the shallow polishing marks oriented along the specimen axis. Any evidence of the original surface features created by the L-PBF process is eliminated by the removal of a layer of 0.5 mm of material by machining [15,22,30].
The roughness parameters (Sa arithmetical mean height, Sv maximum valley depth, and Ssk skewness) measured on the investigated as-built and post processed specimens from each group are reported in the Table 3. In agreement with qualitative observations drawn from above analyses, it is confirmed that sandblasting can only partially reduce surface roughness, whereas vibro-finishing and machining followed by polishing are much more effective in producing smooth surfaces.
Nano-indentation profiles for each surface condition are provided in Figure 8. The hardness value of SB specimens significantly improved due to the strain hardening brought by the sandblasting process at least up to the depth of 175 µm from the surface. No notable difference was observed in the MP and VF surface conditions.

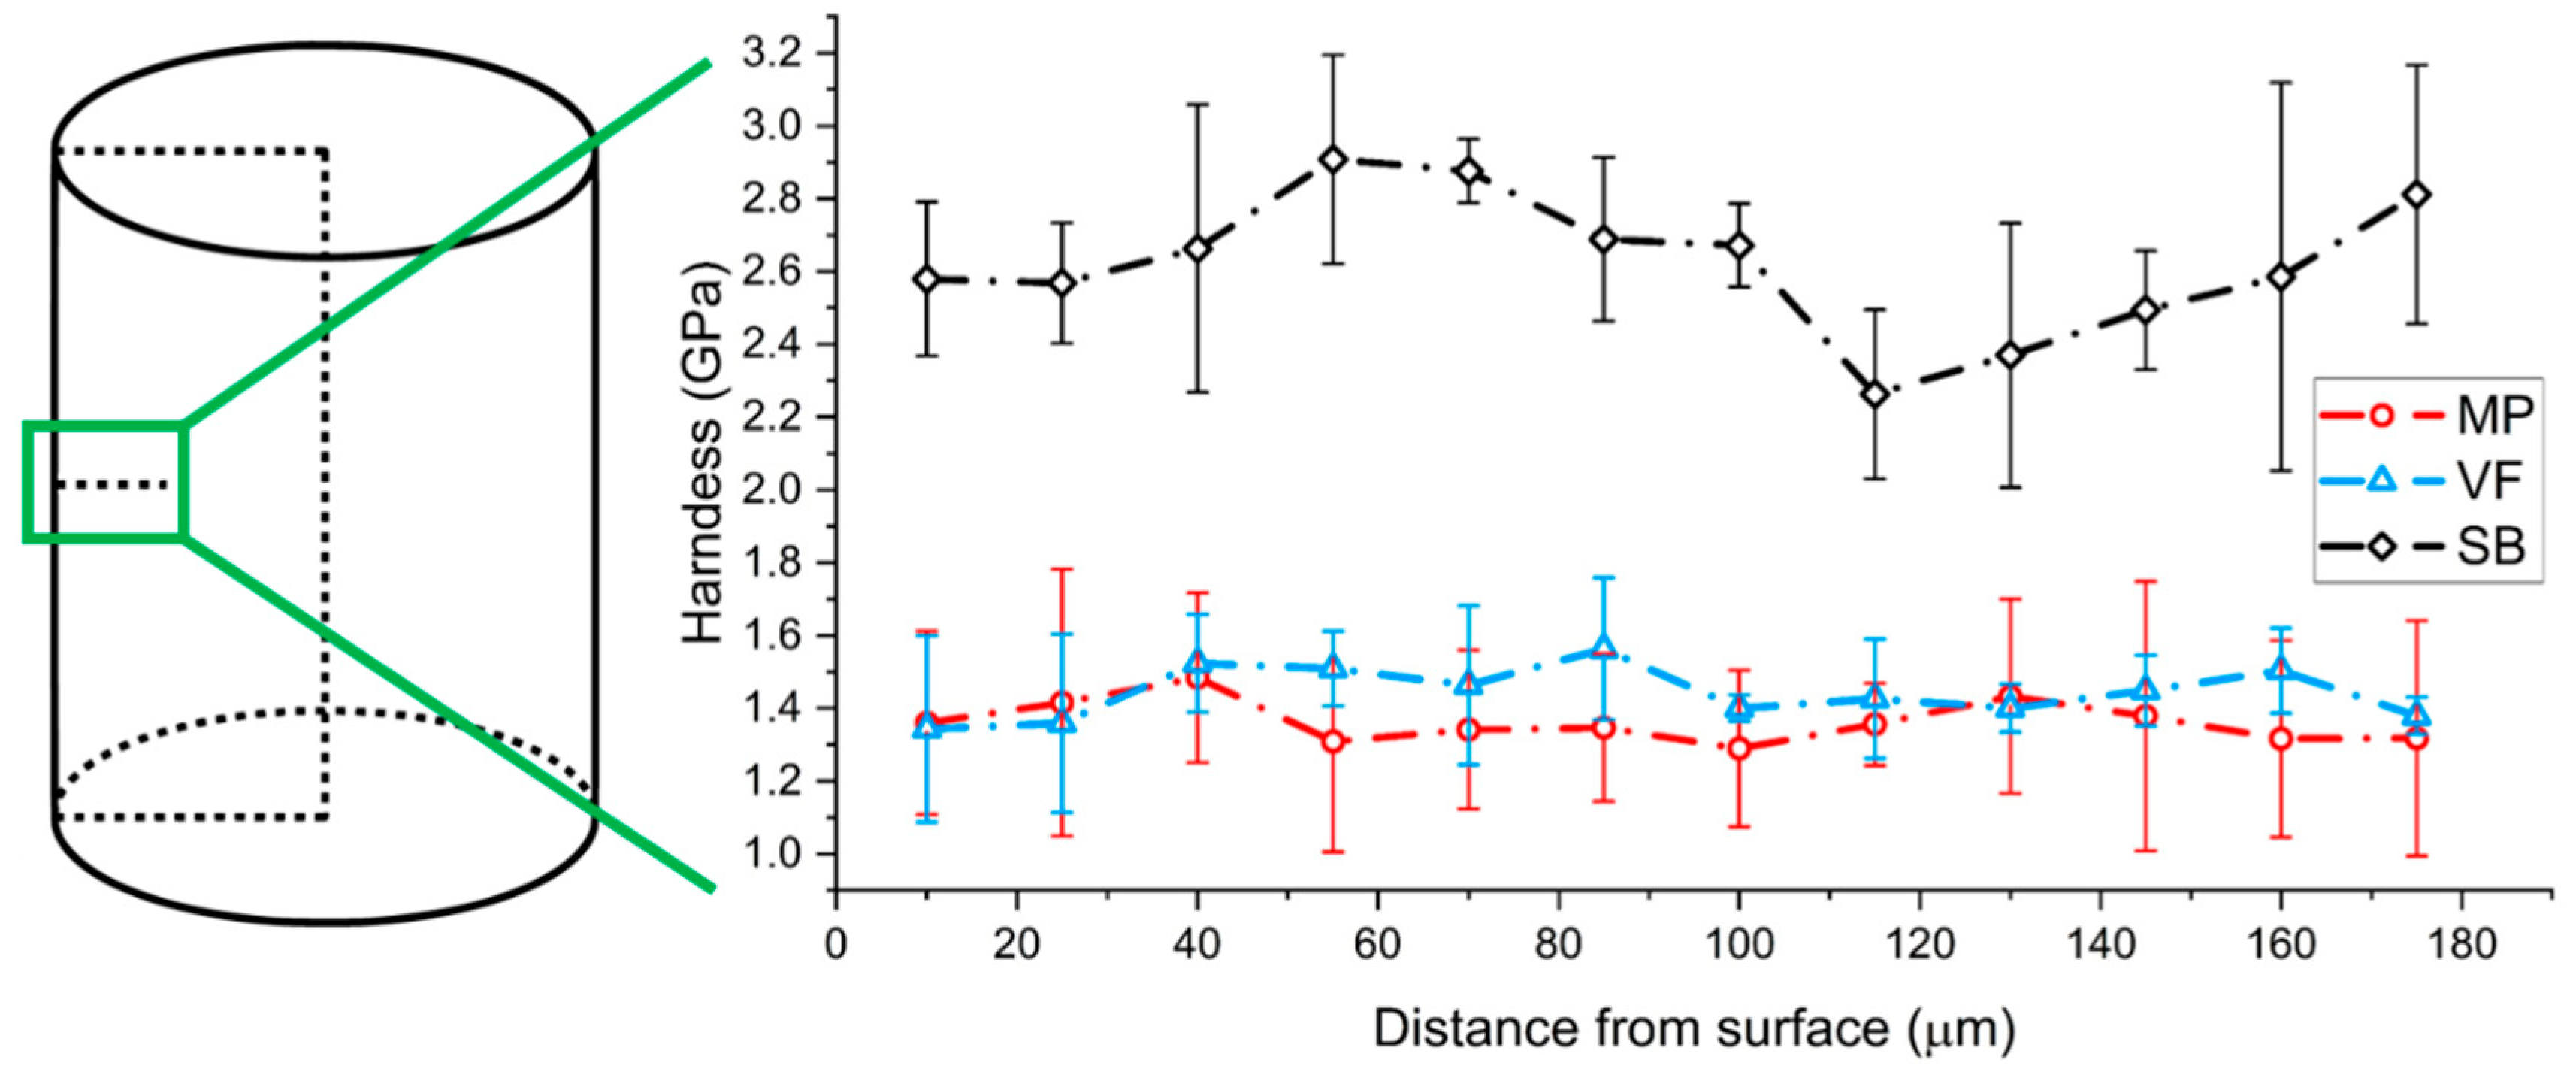
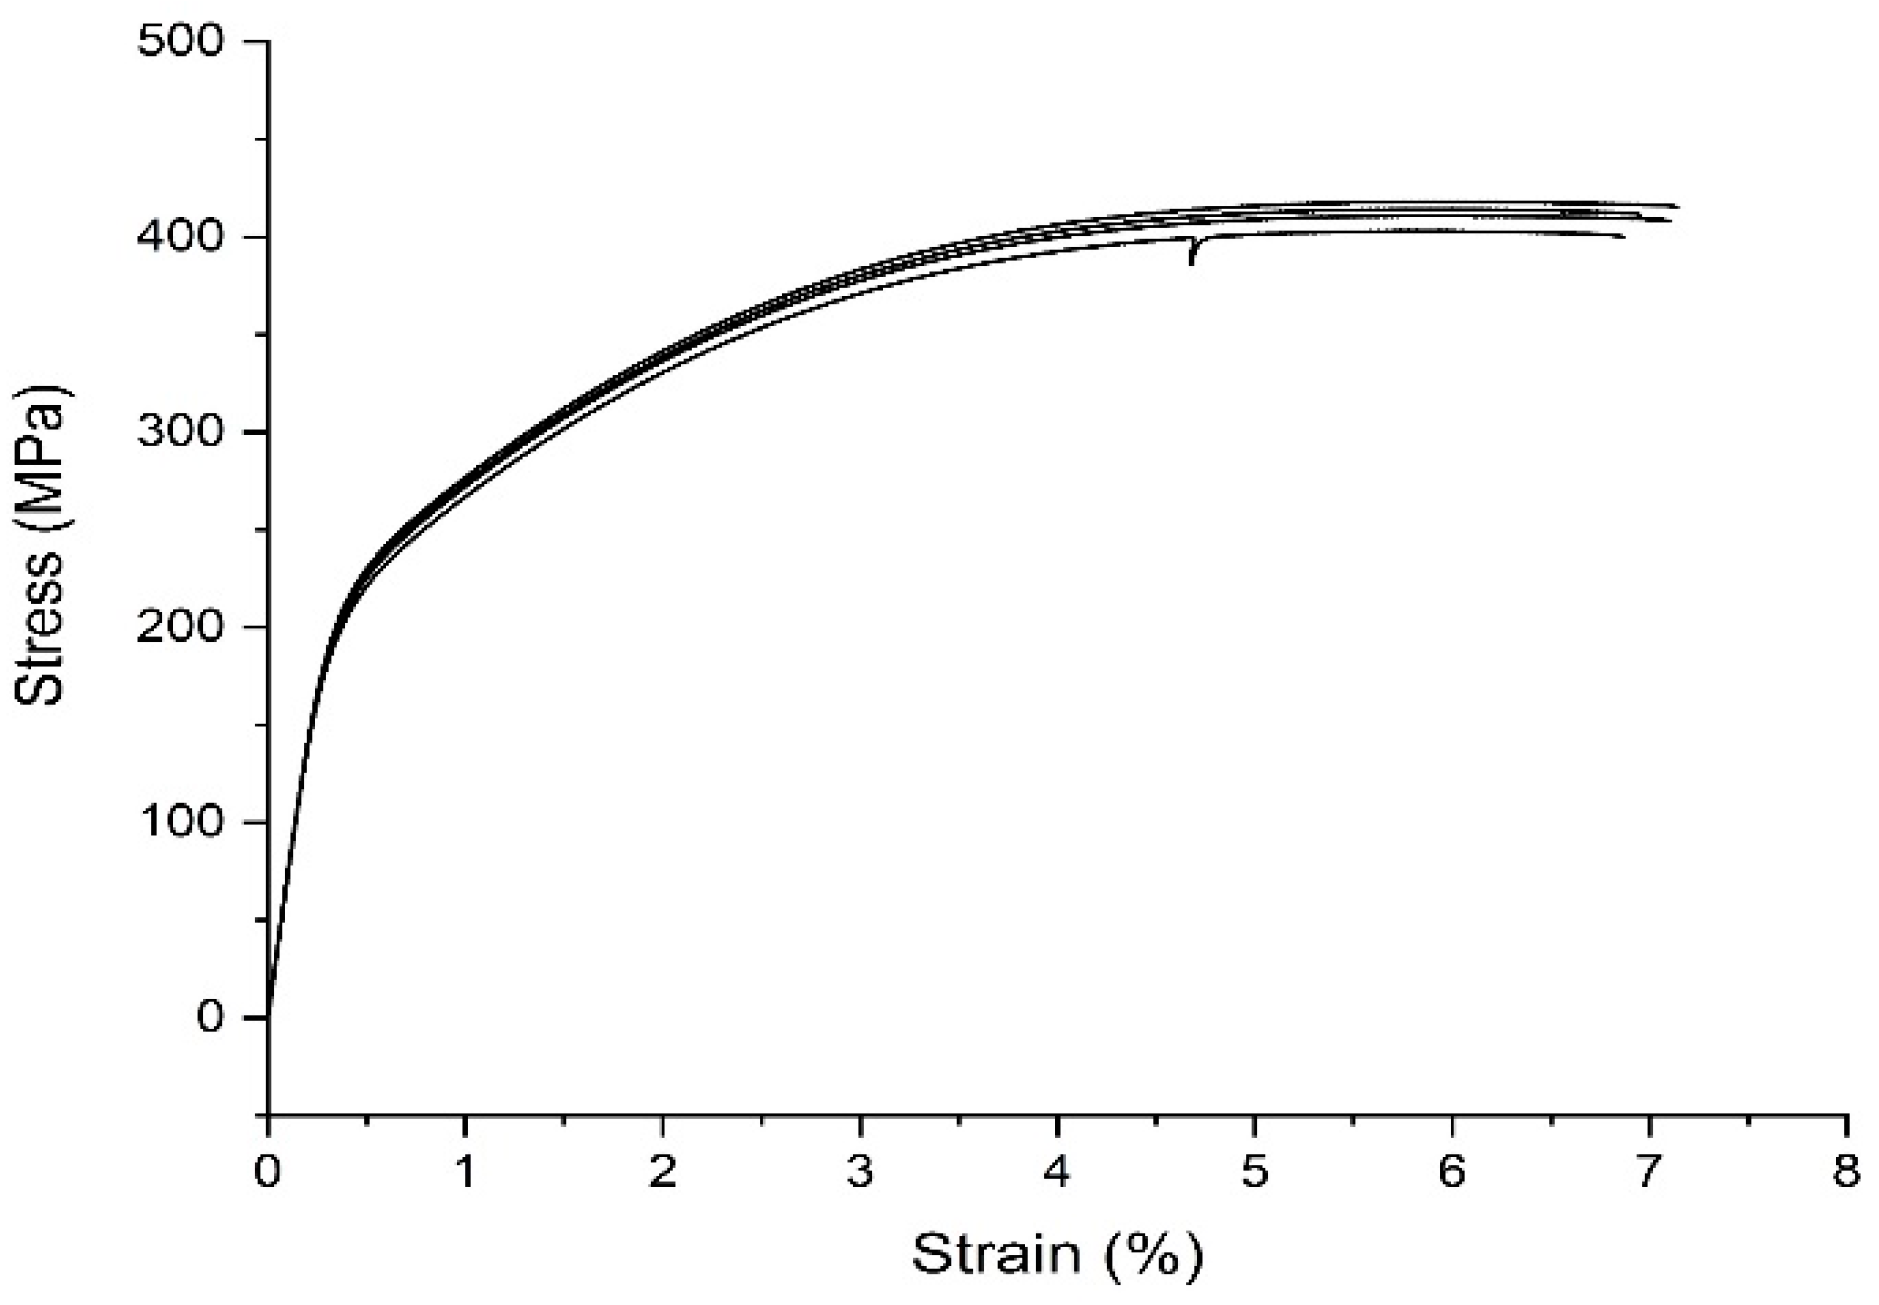
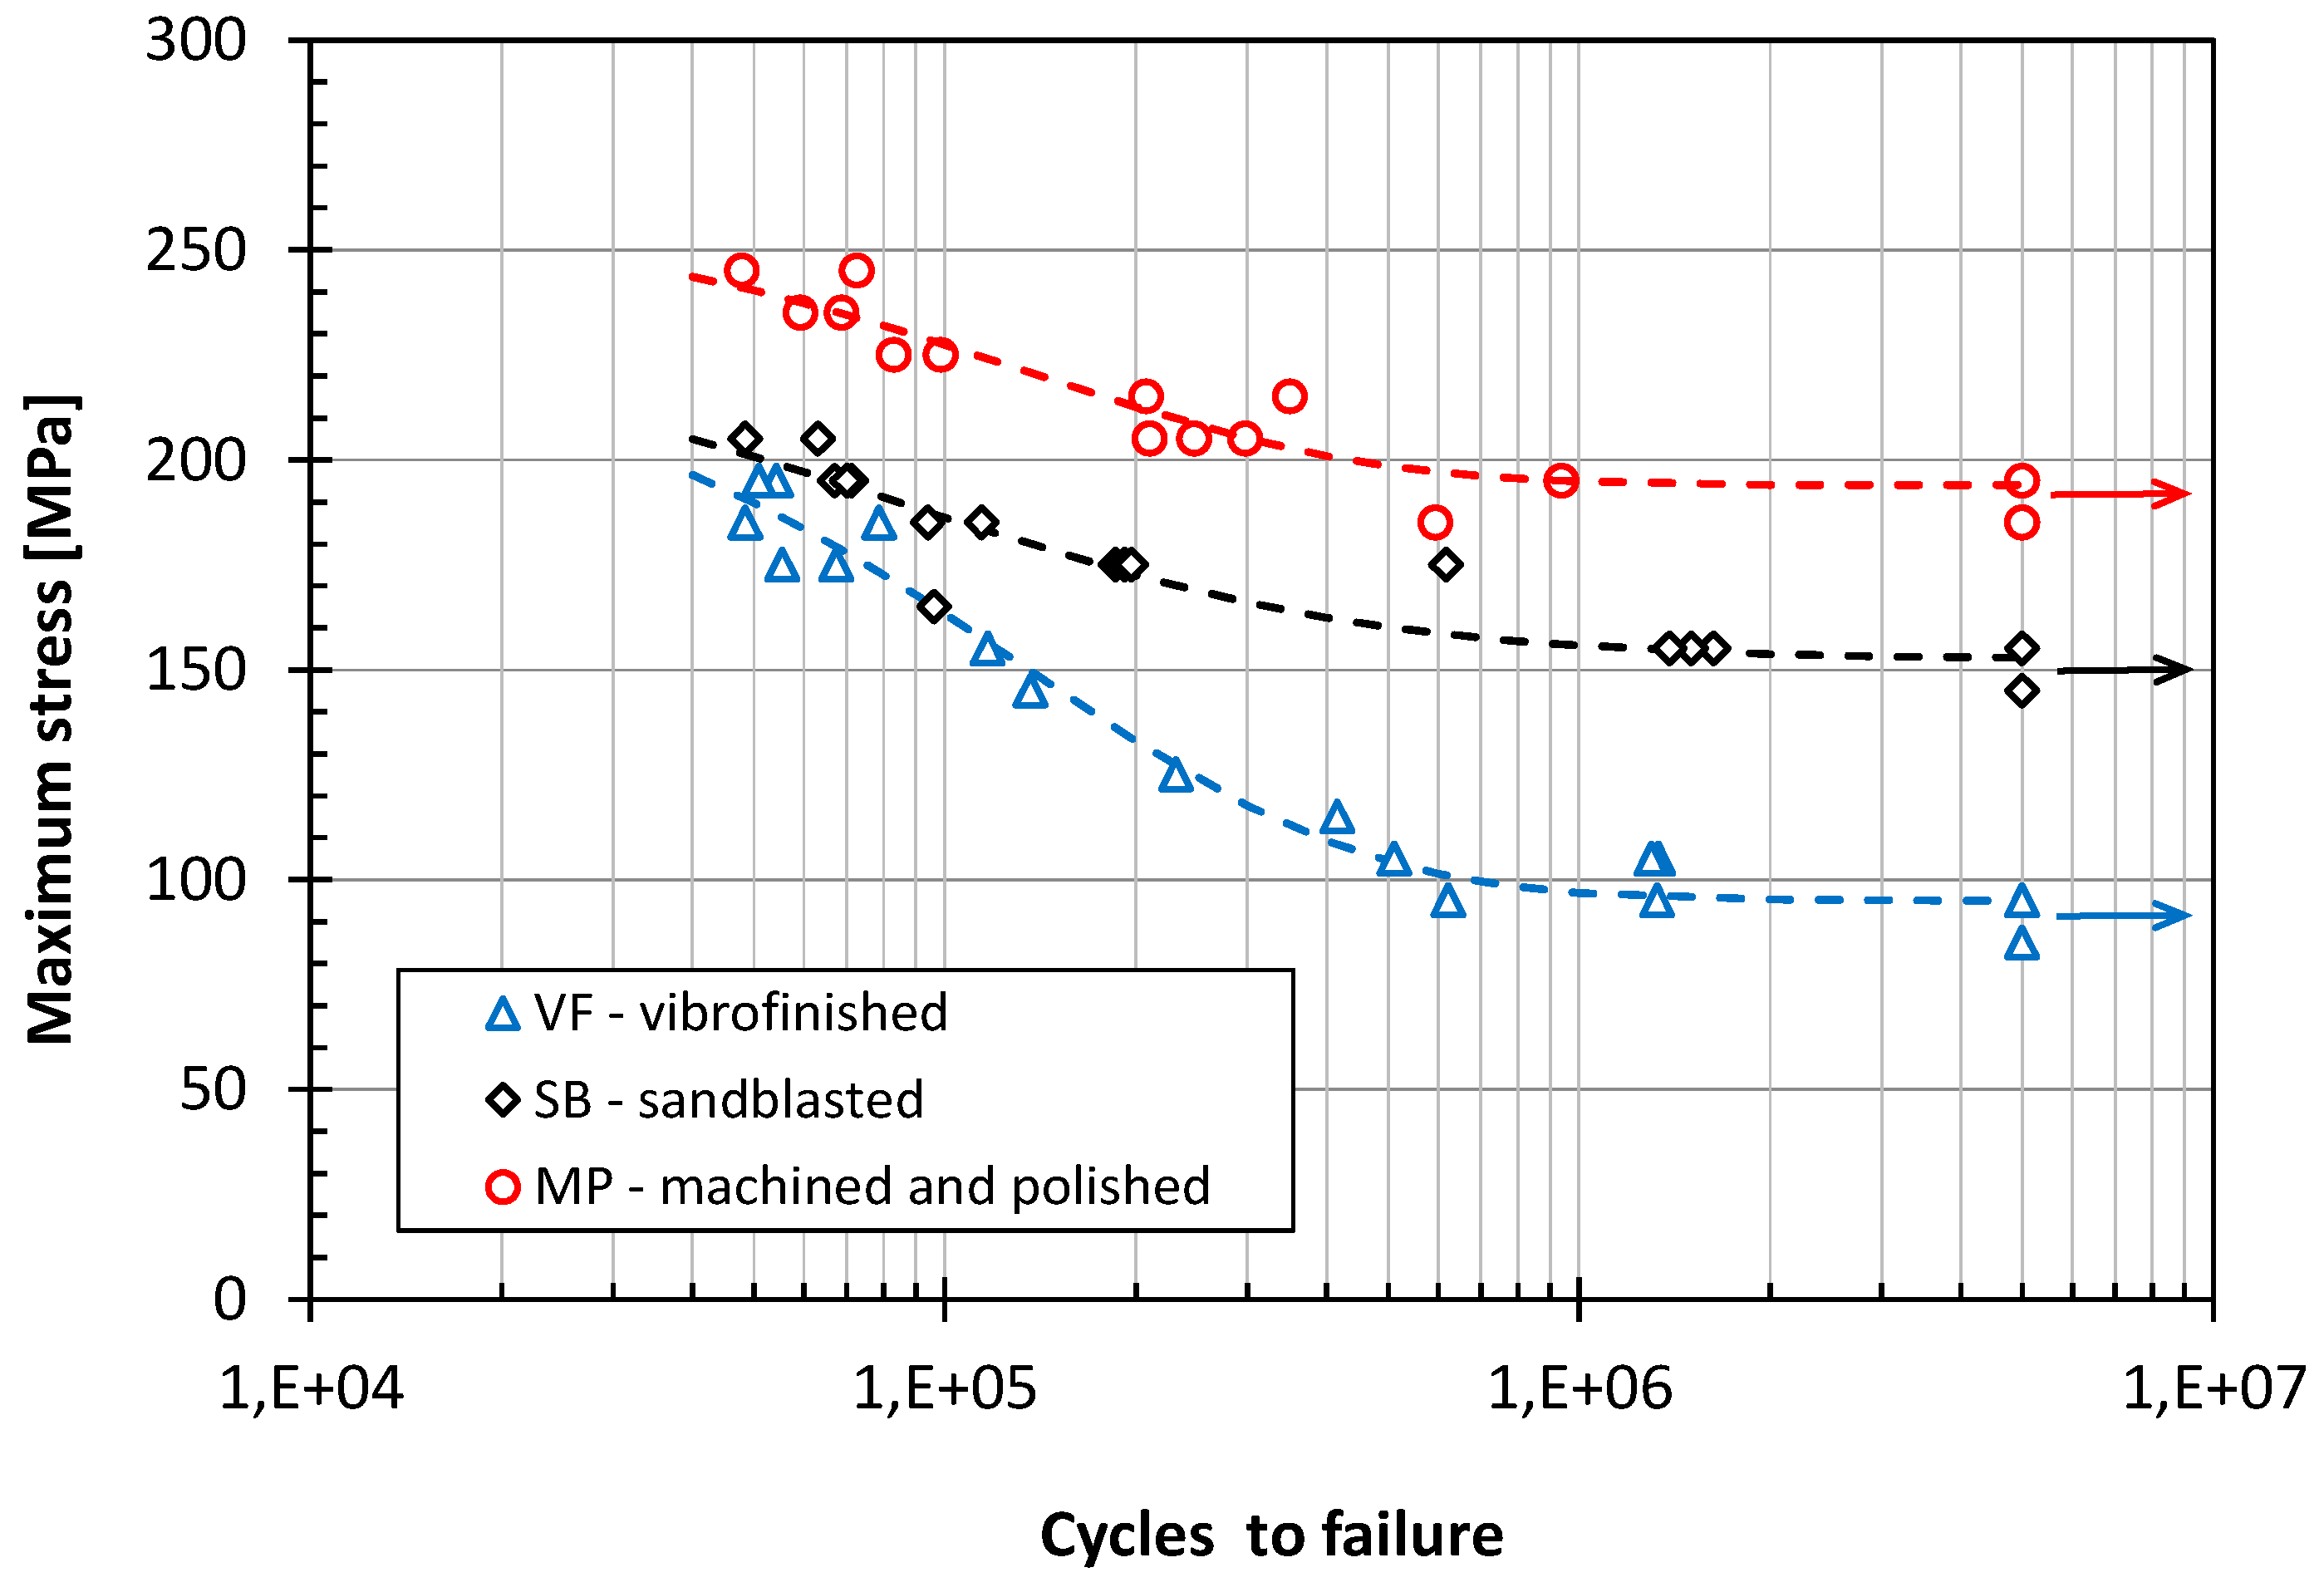
3.3. Tensile and Fatigue Properties
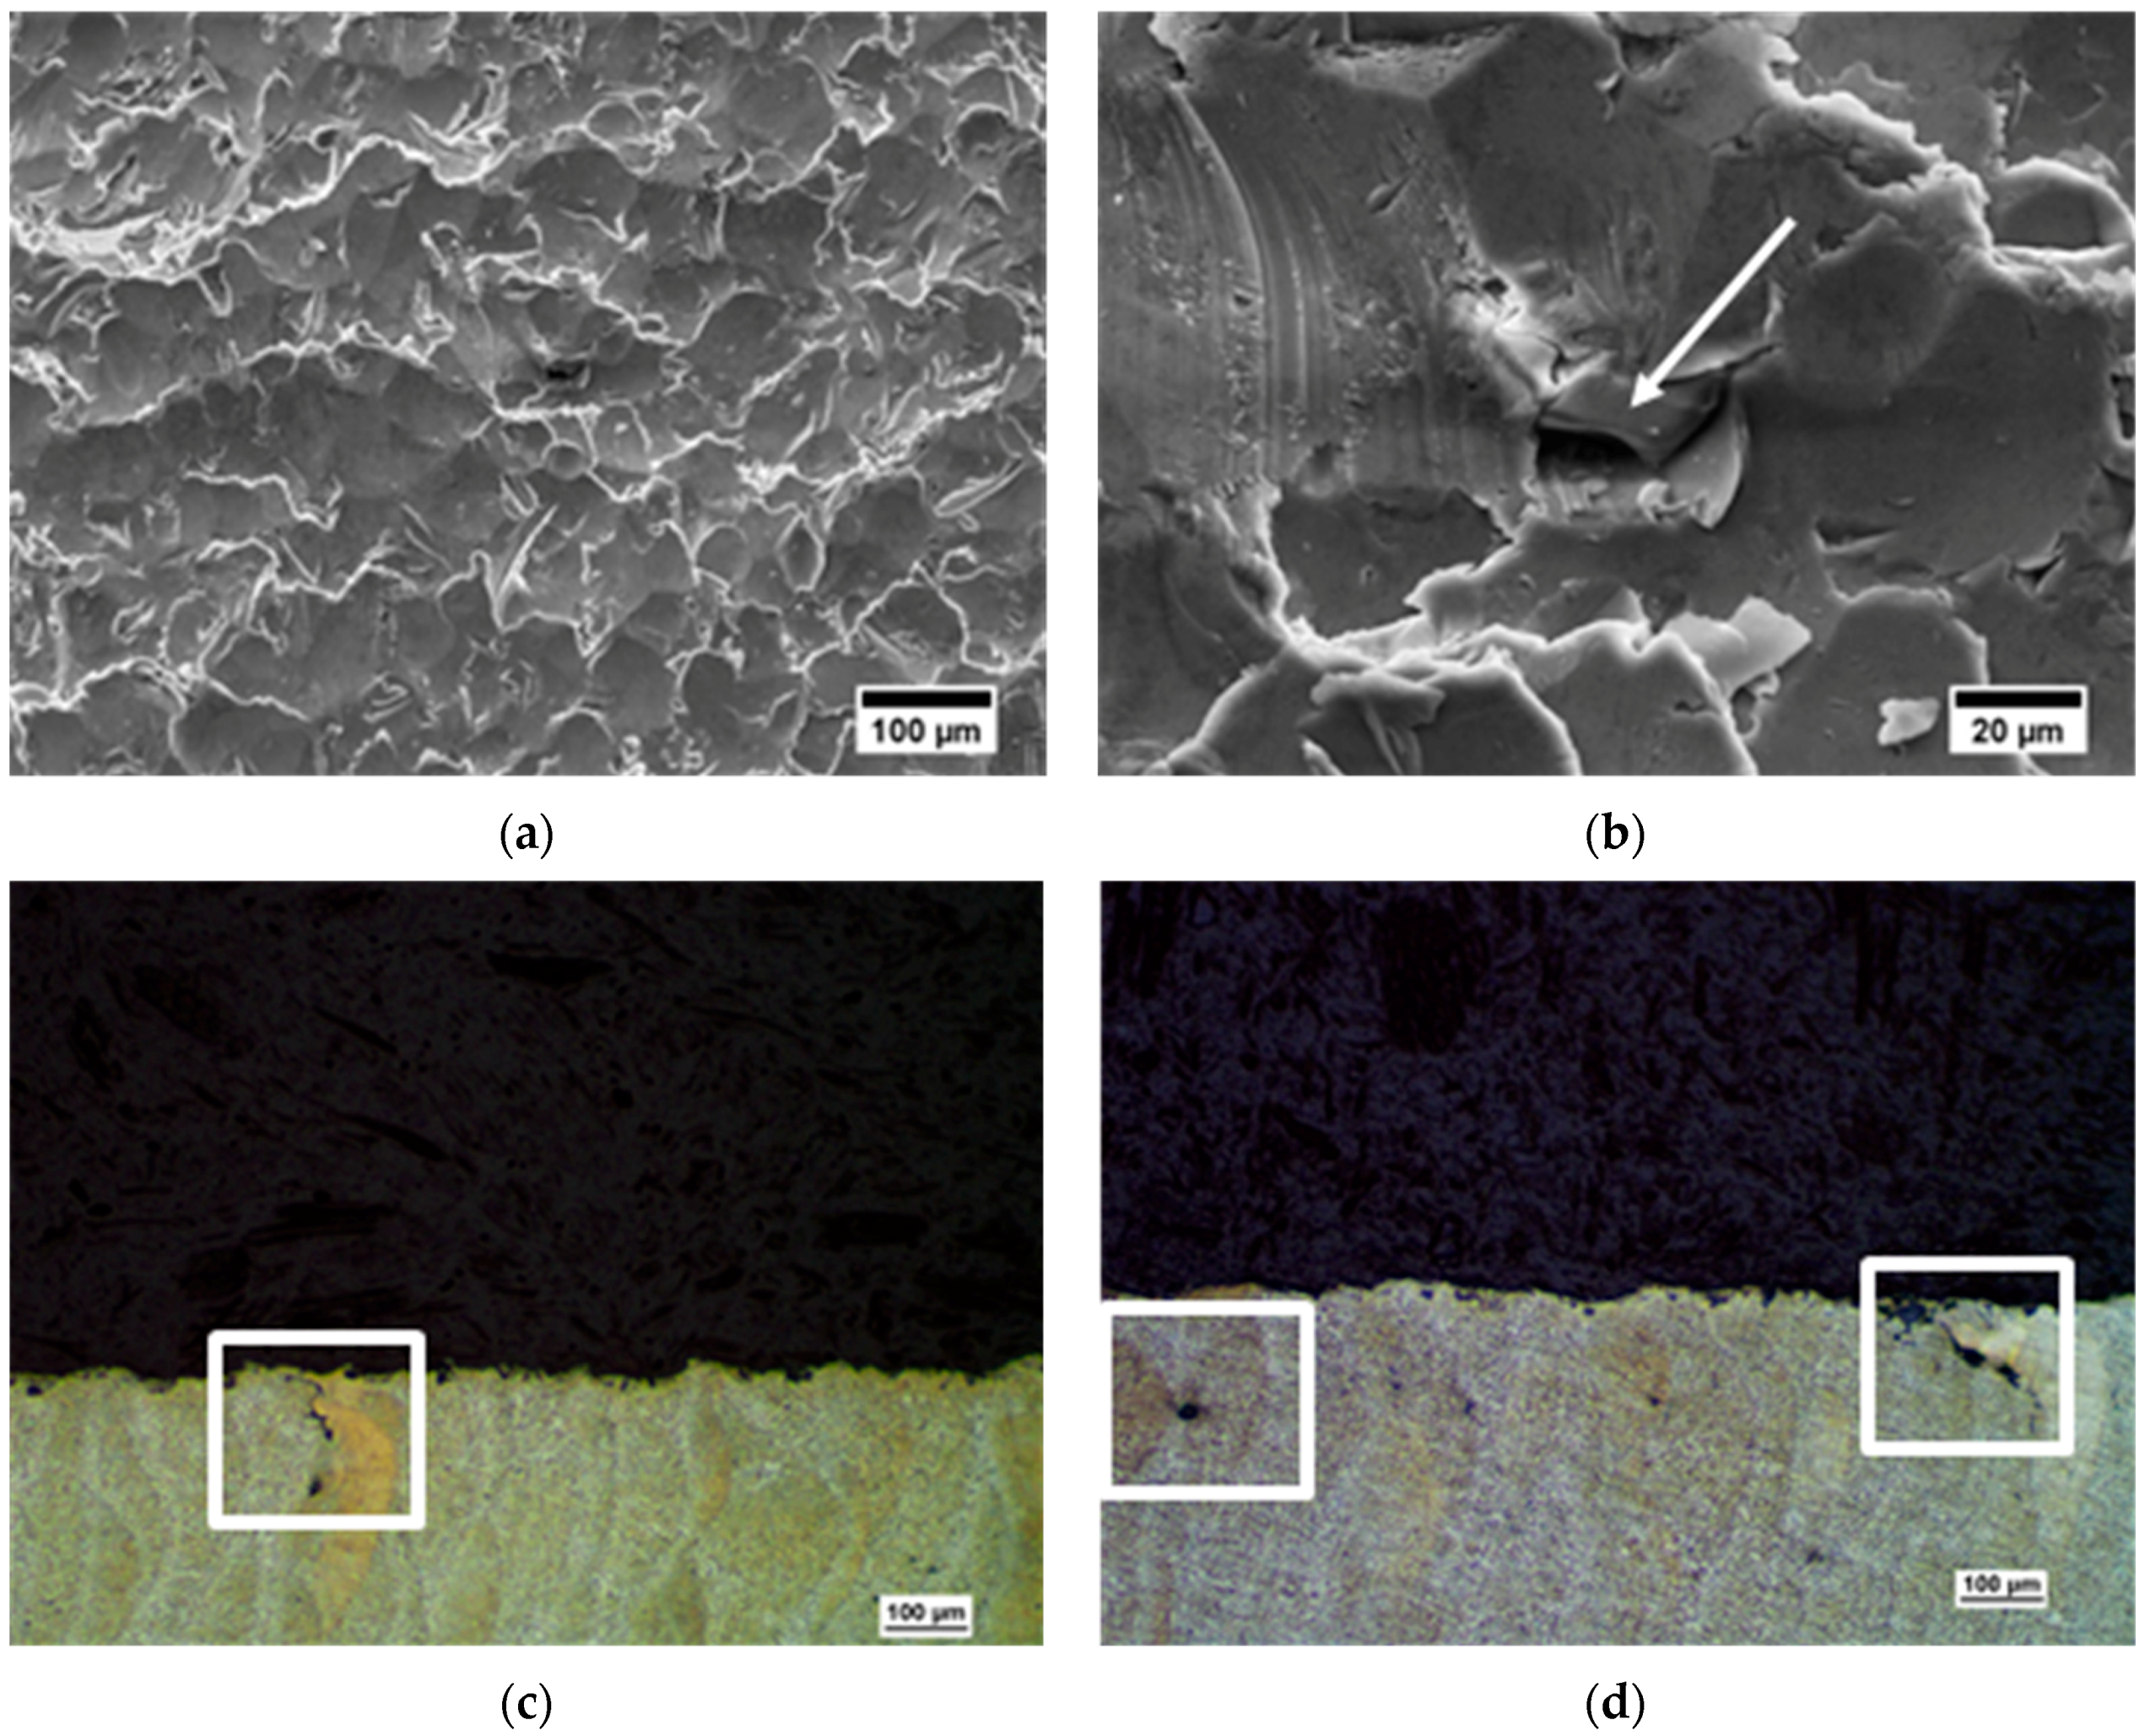
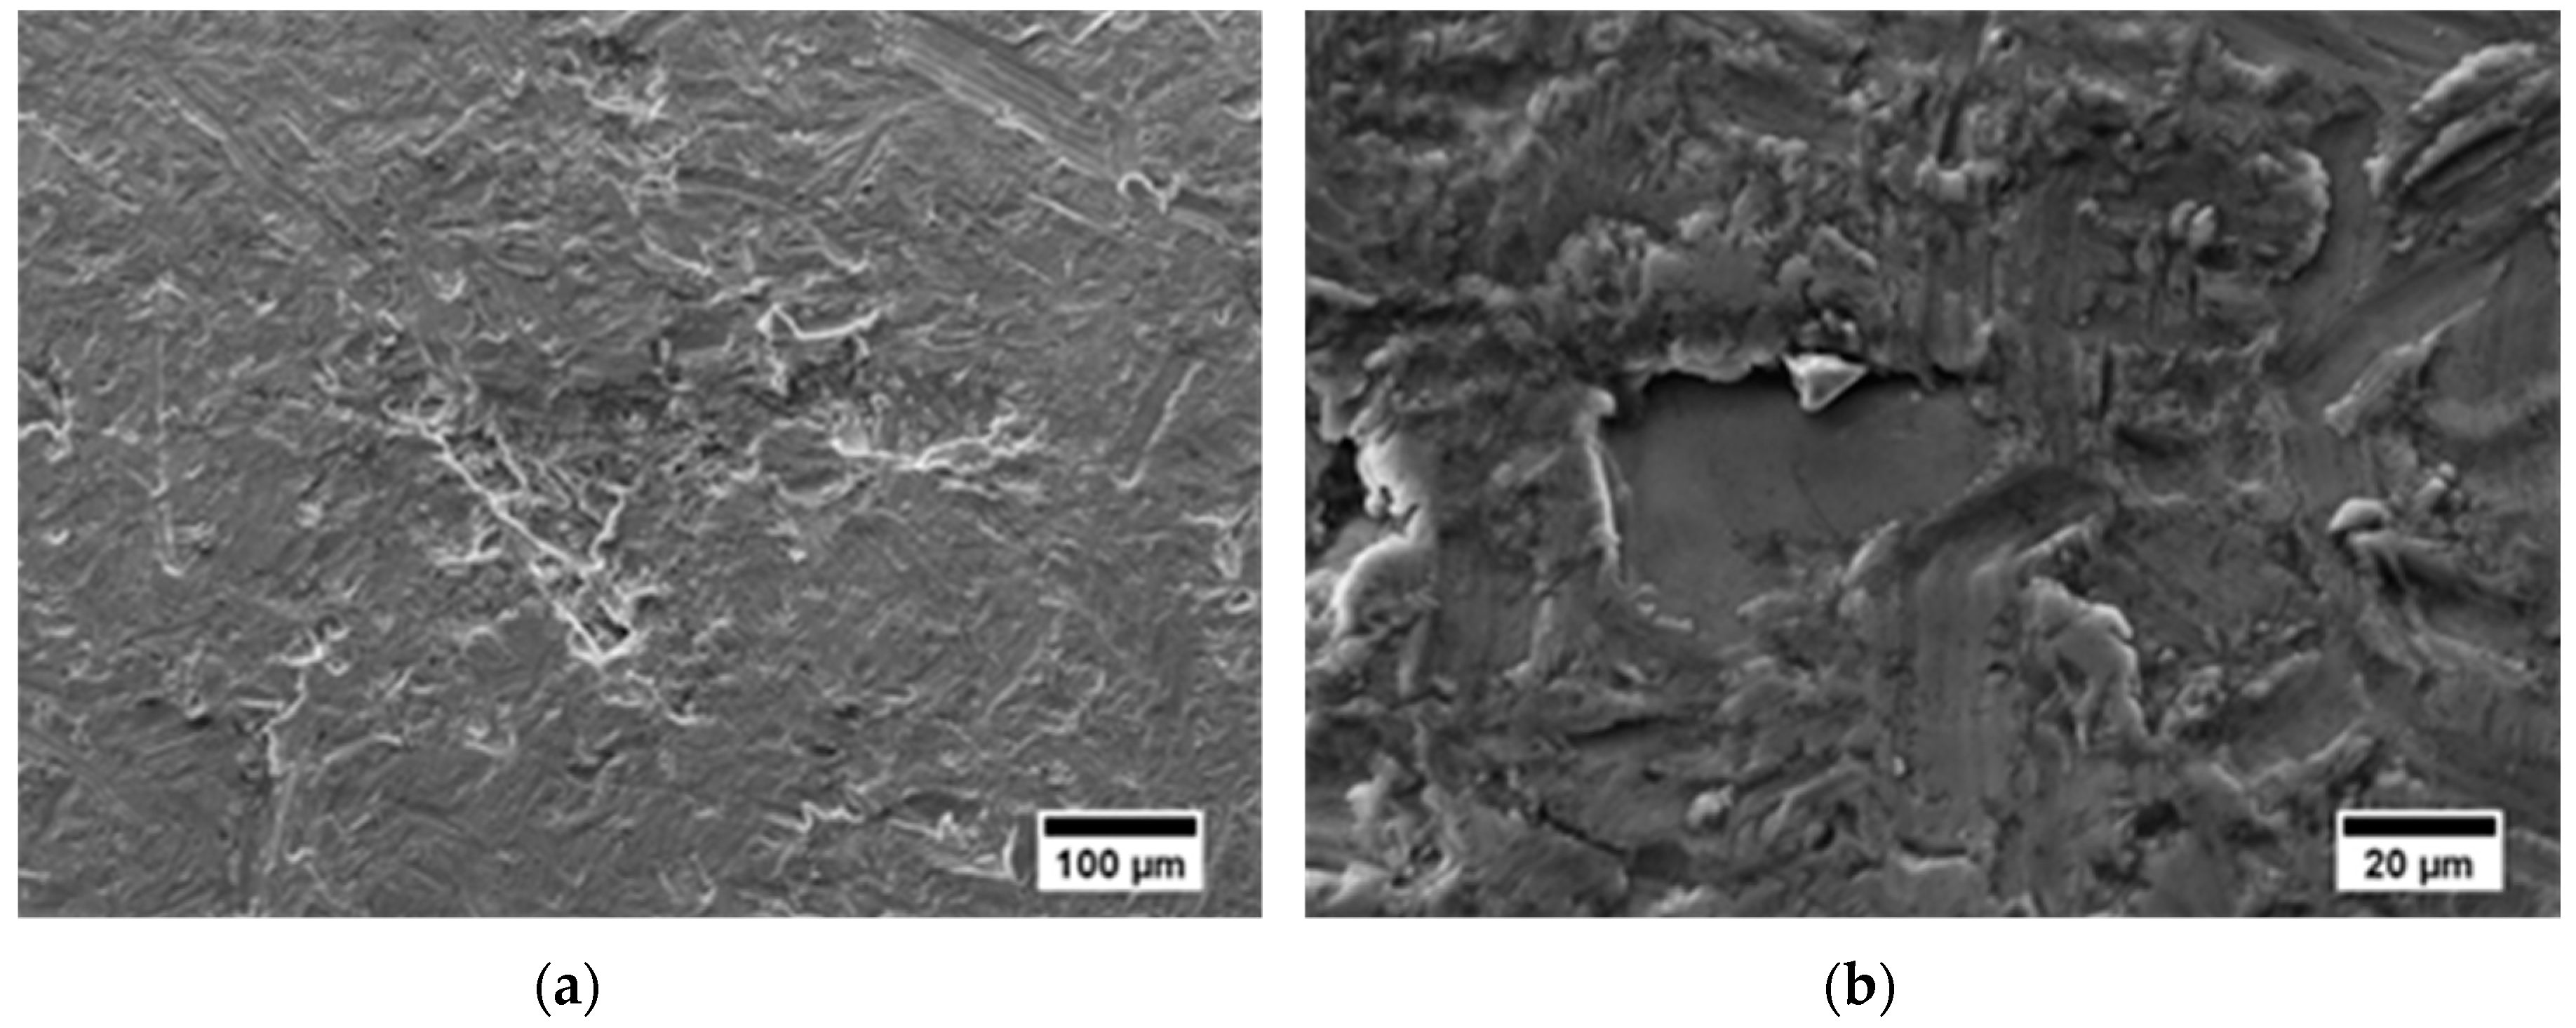
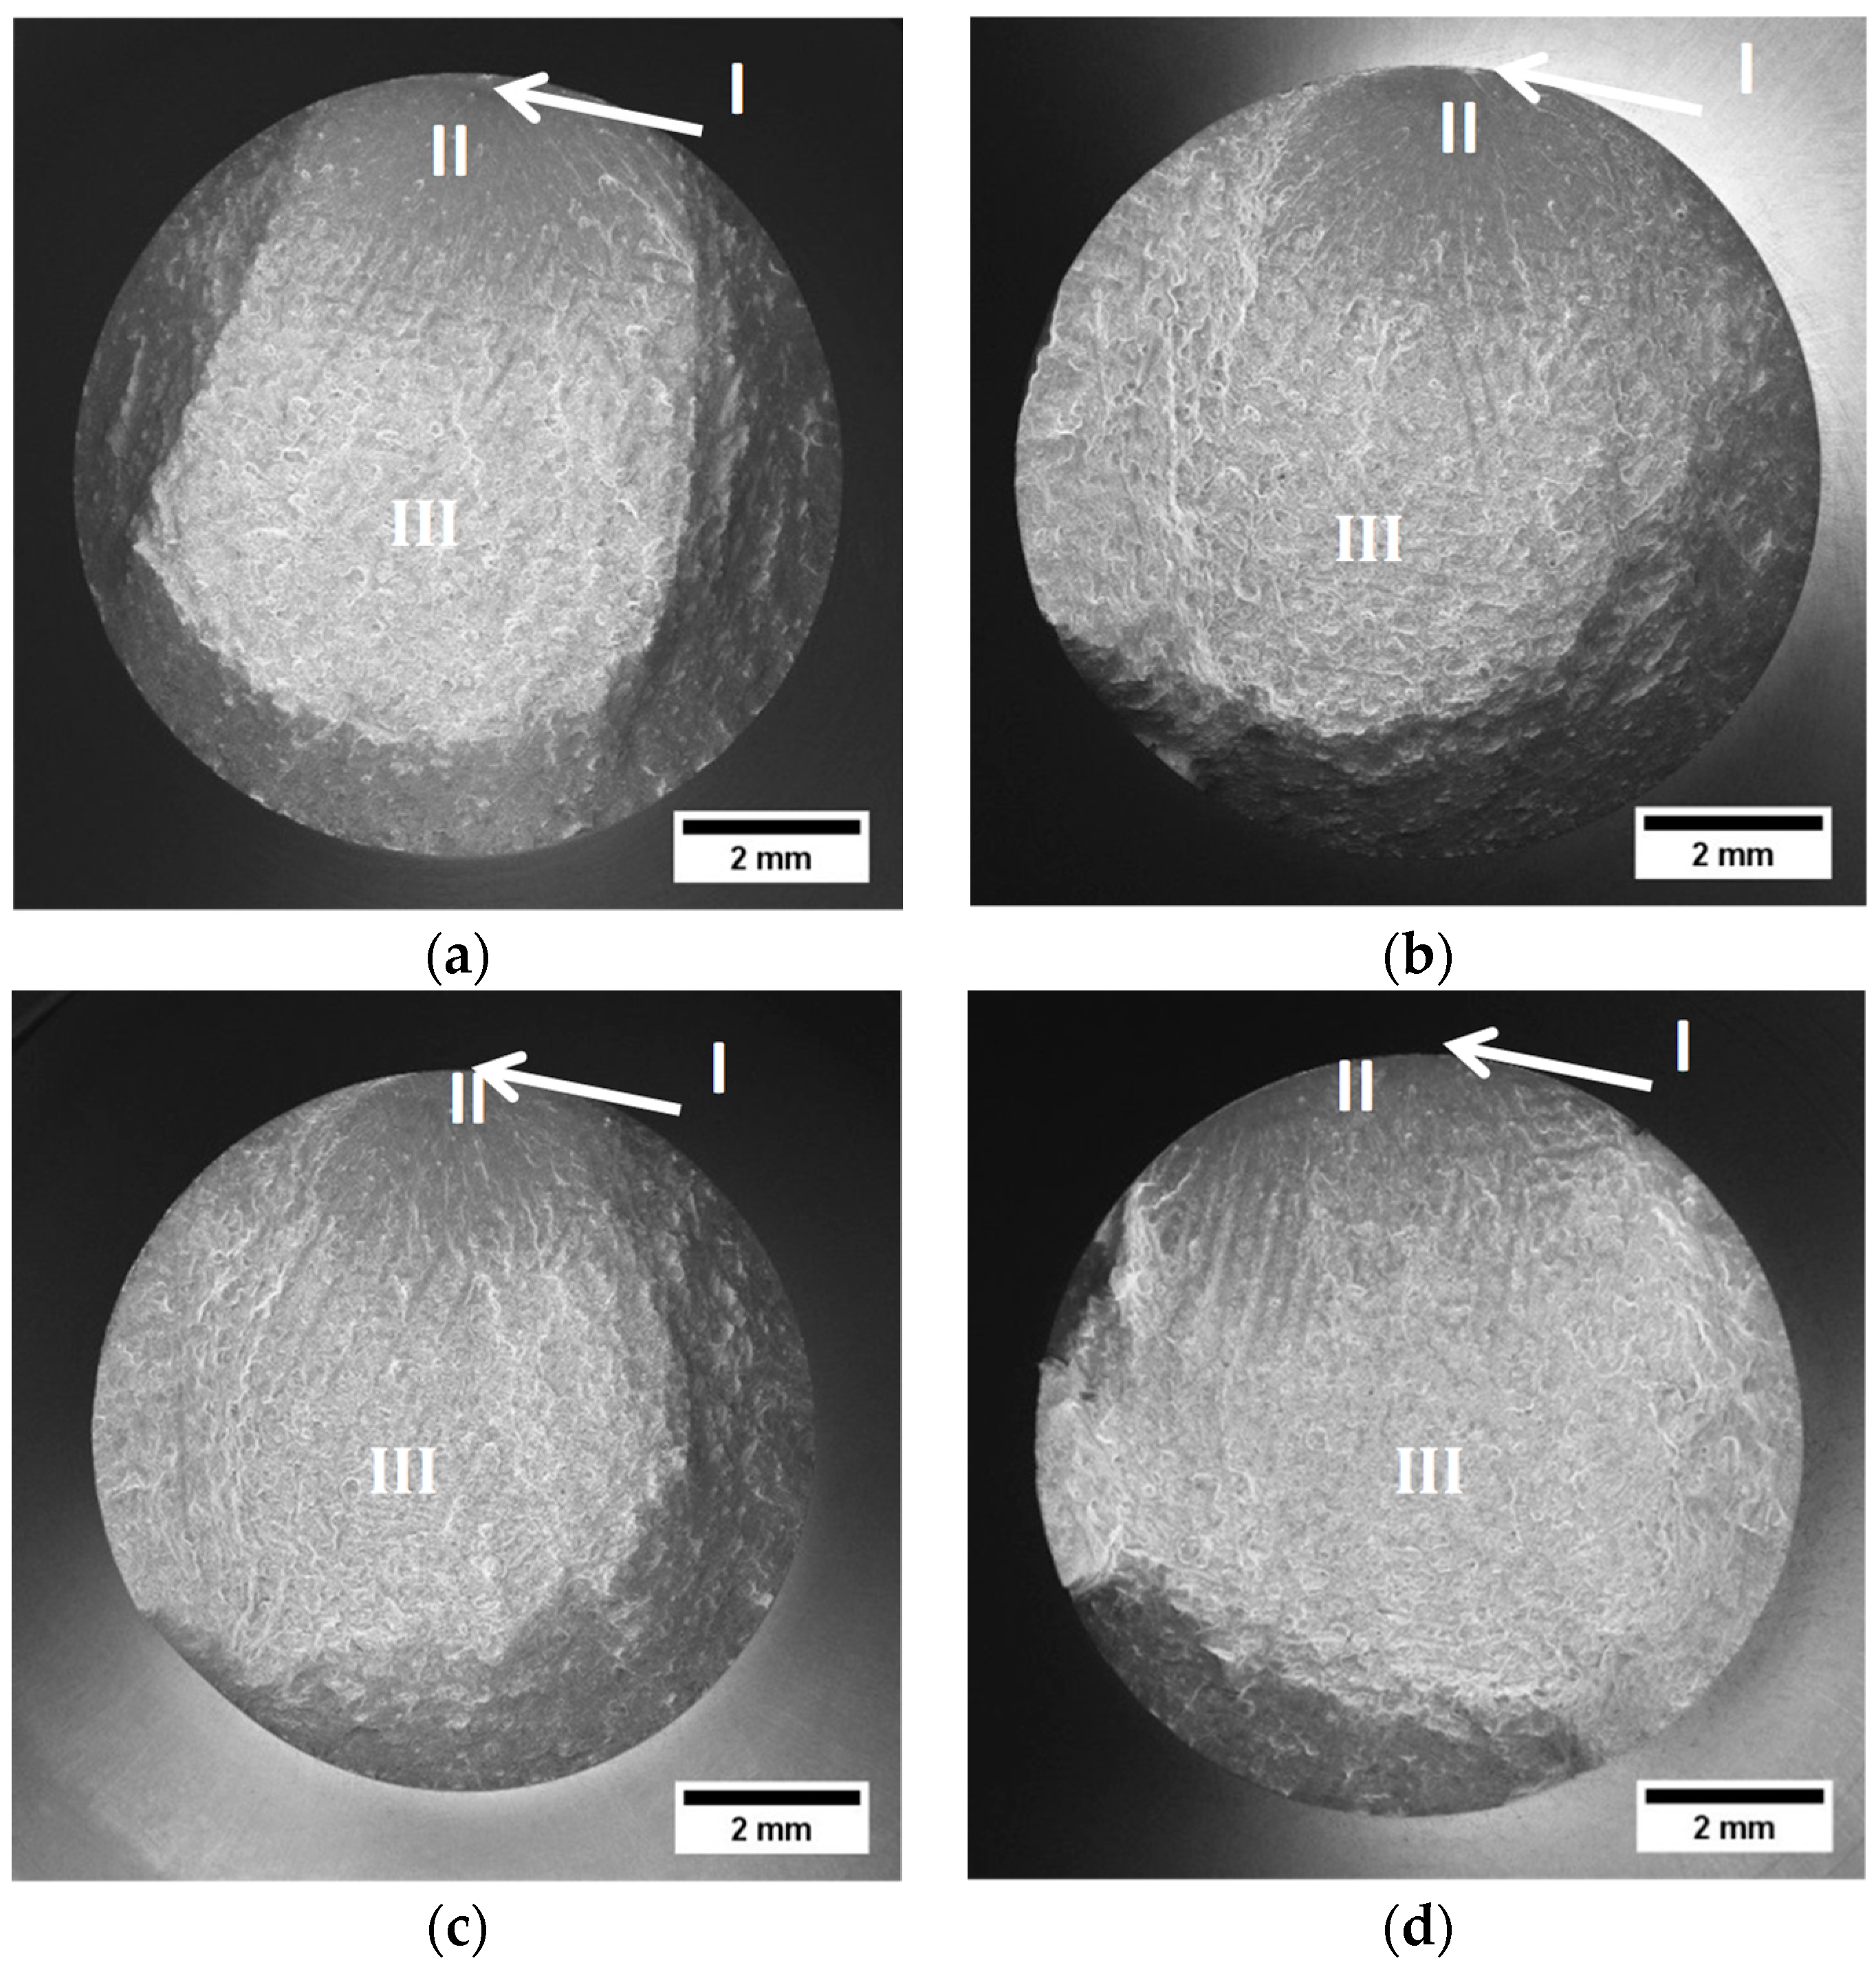
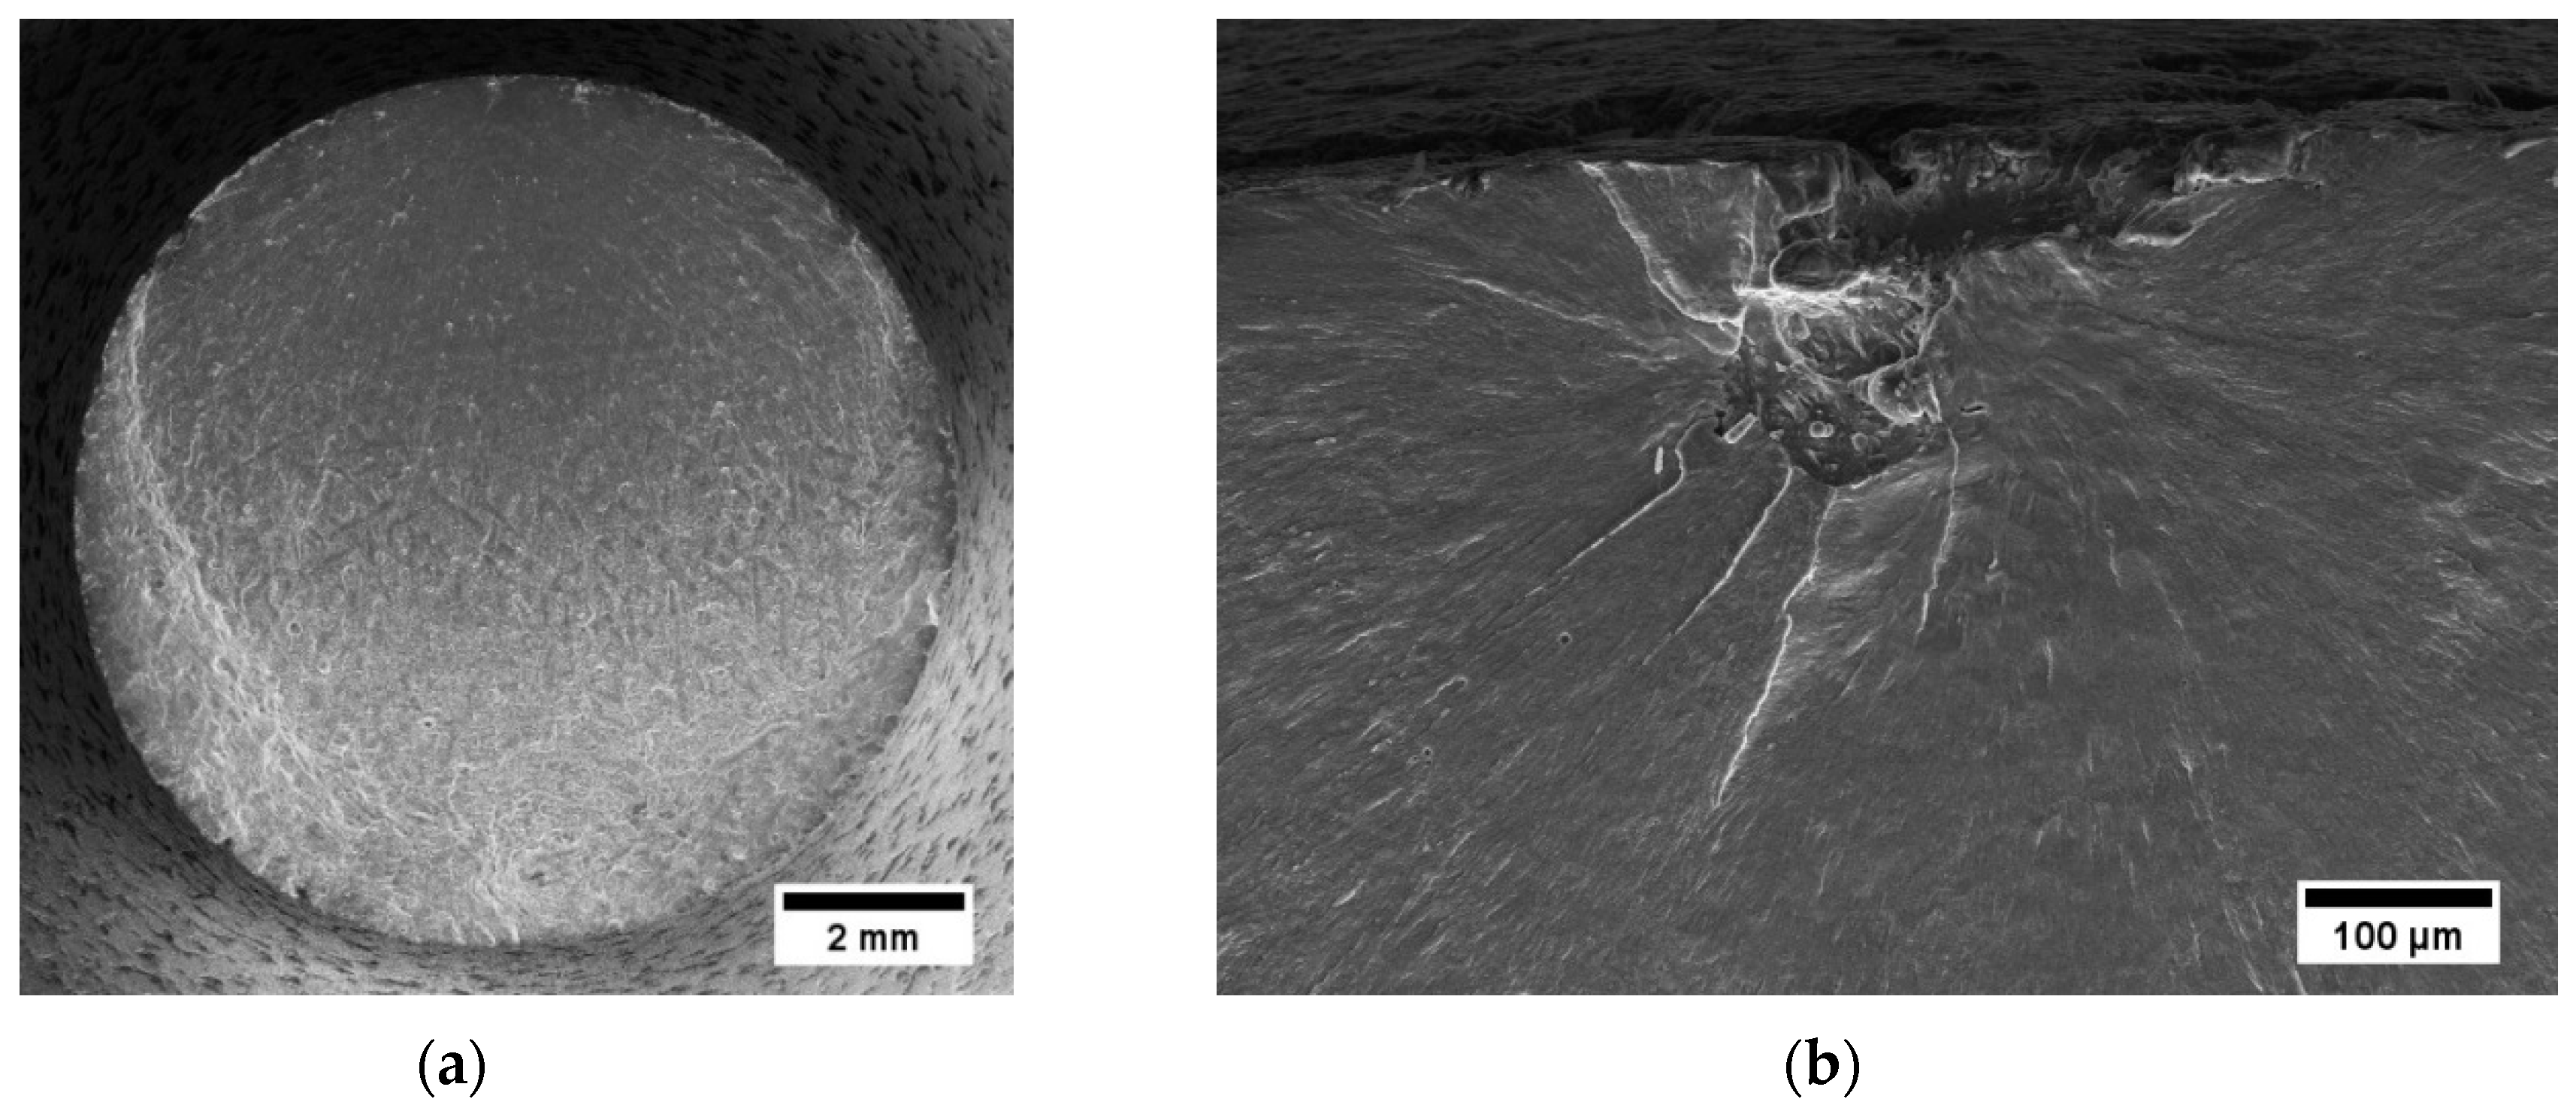
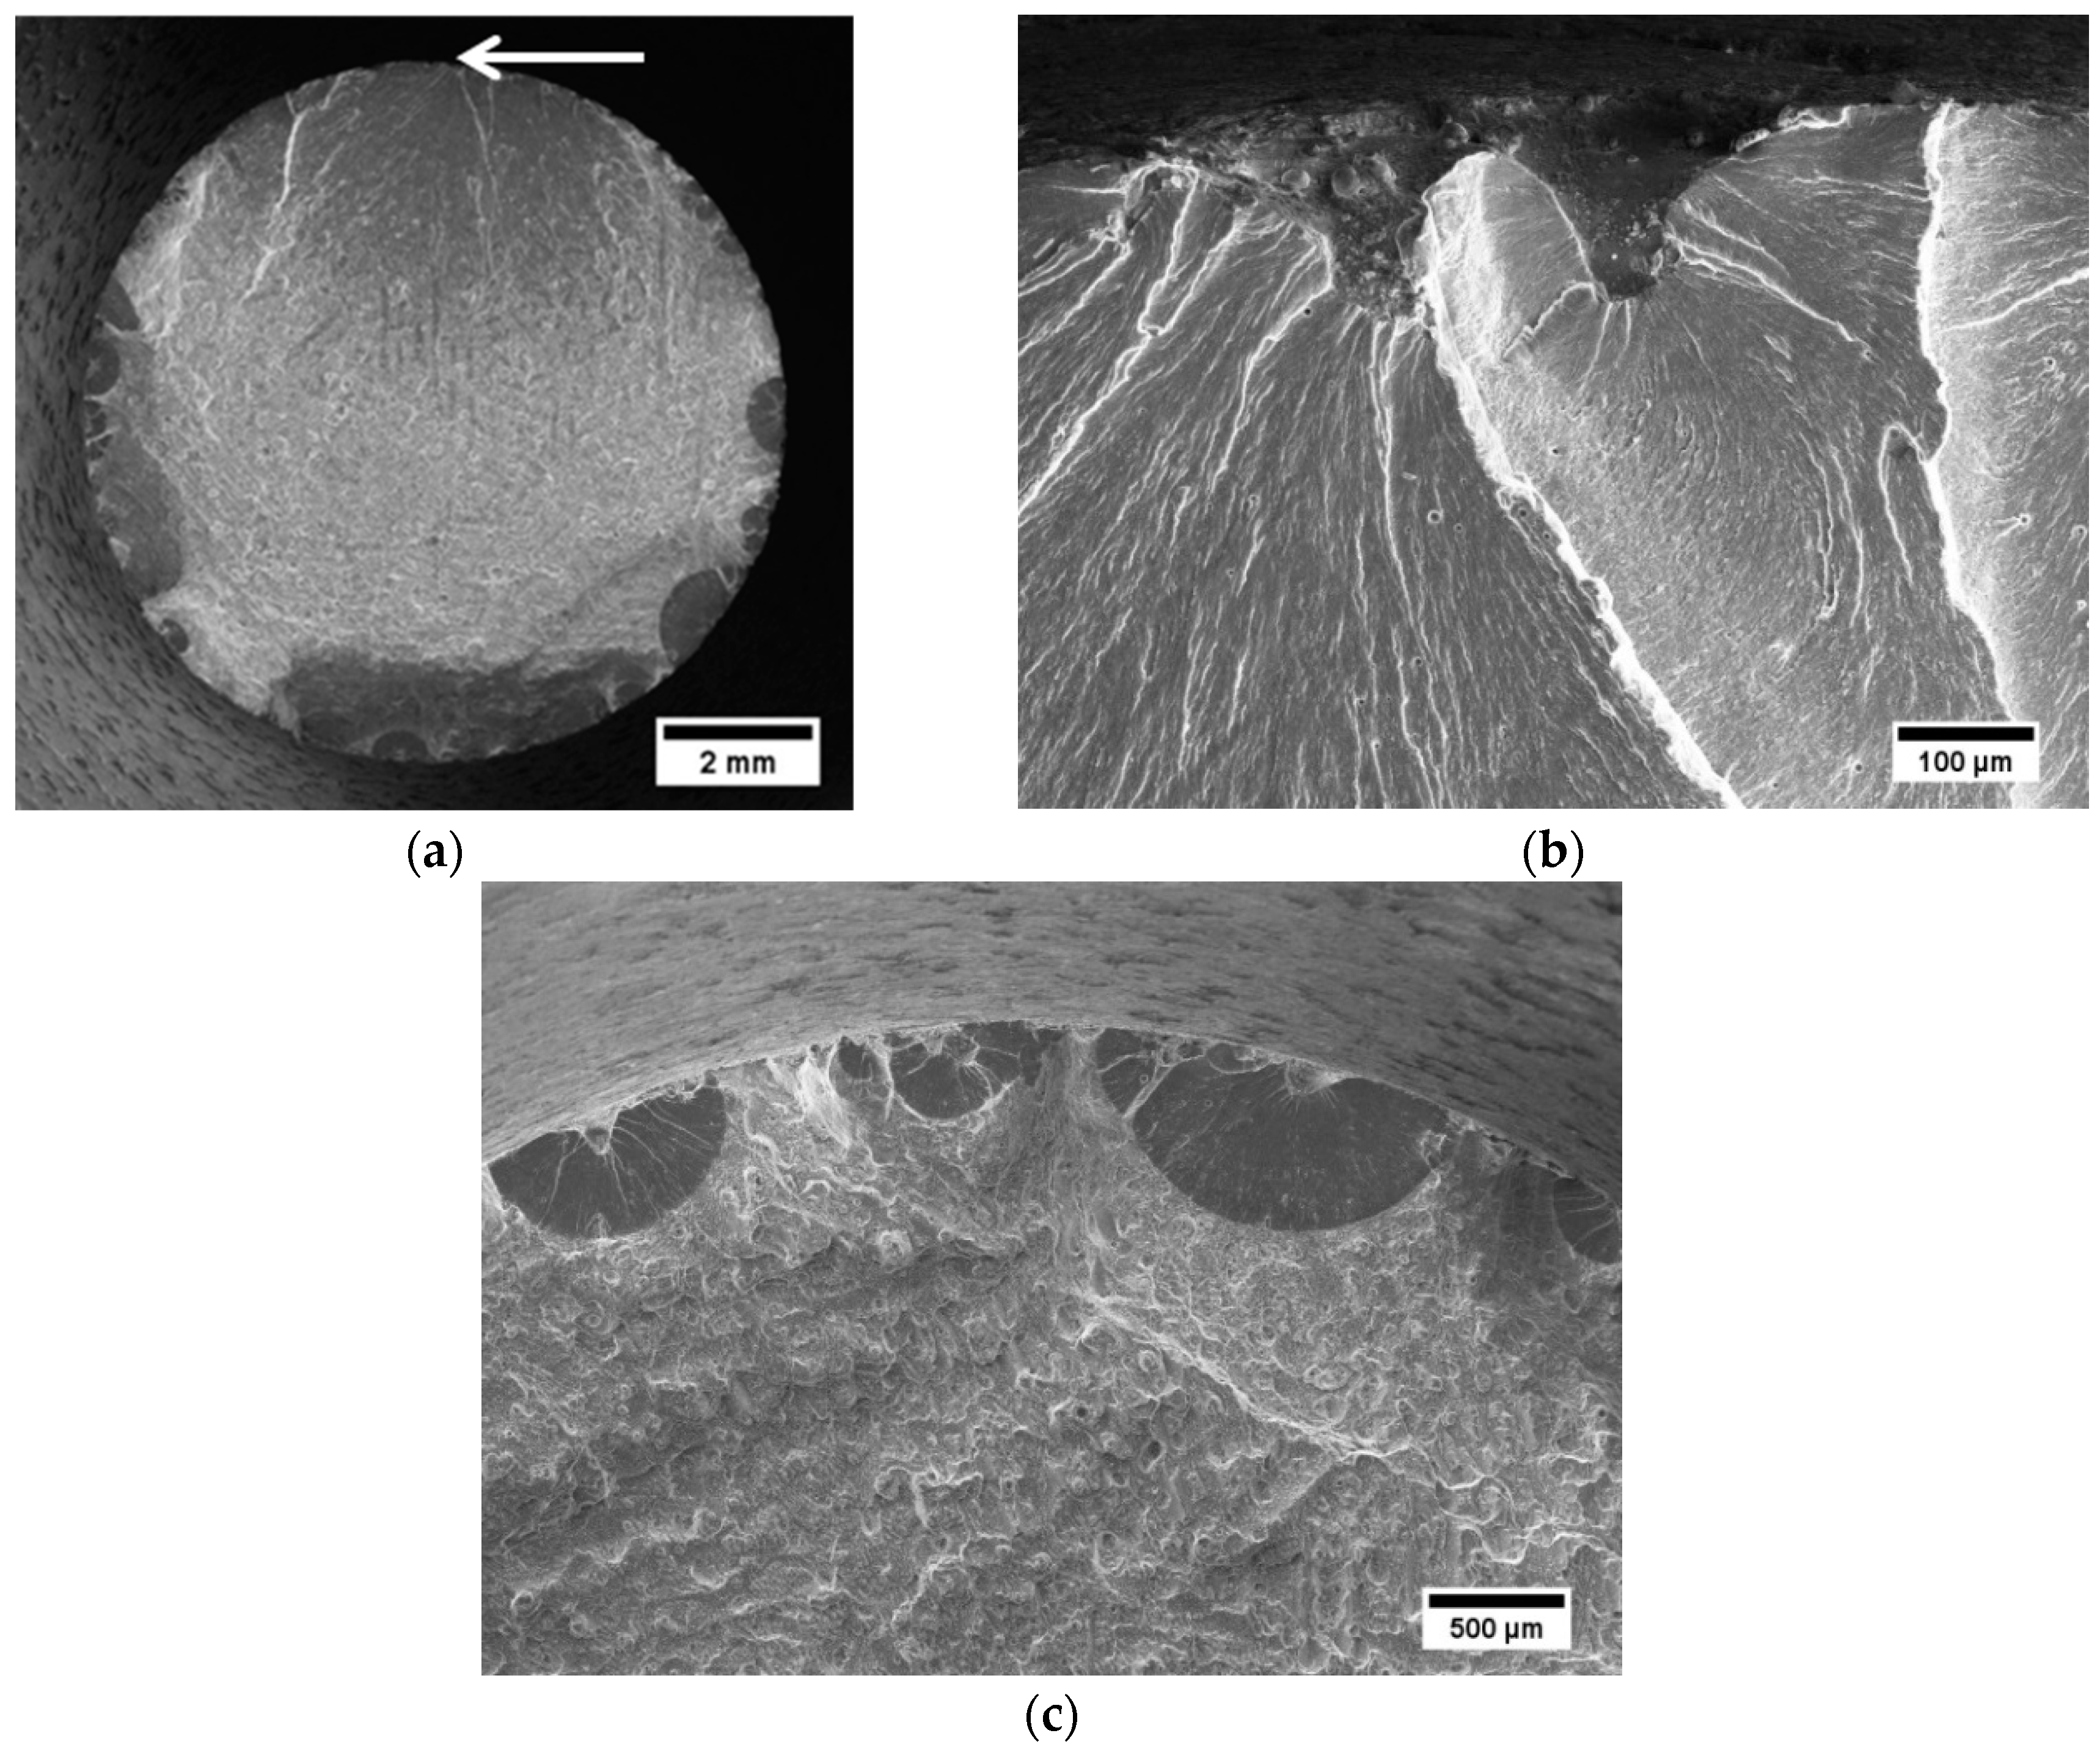
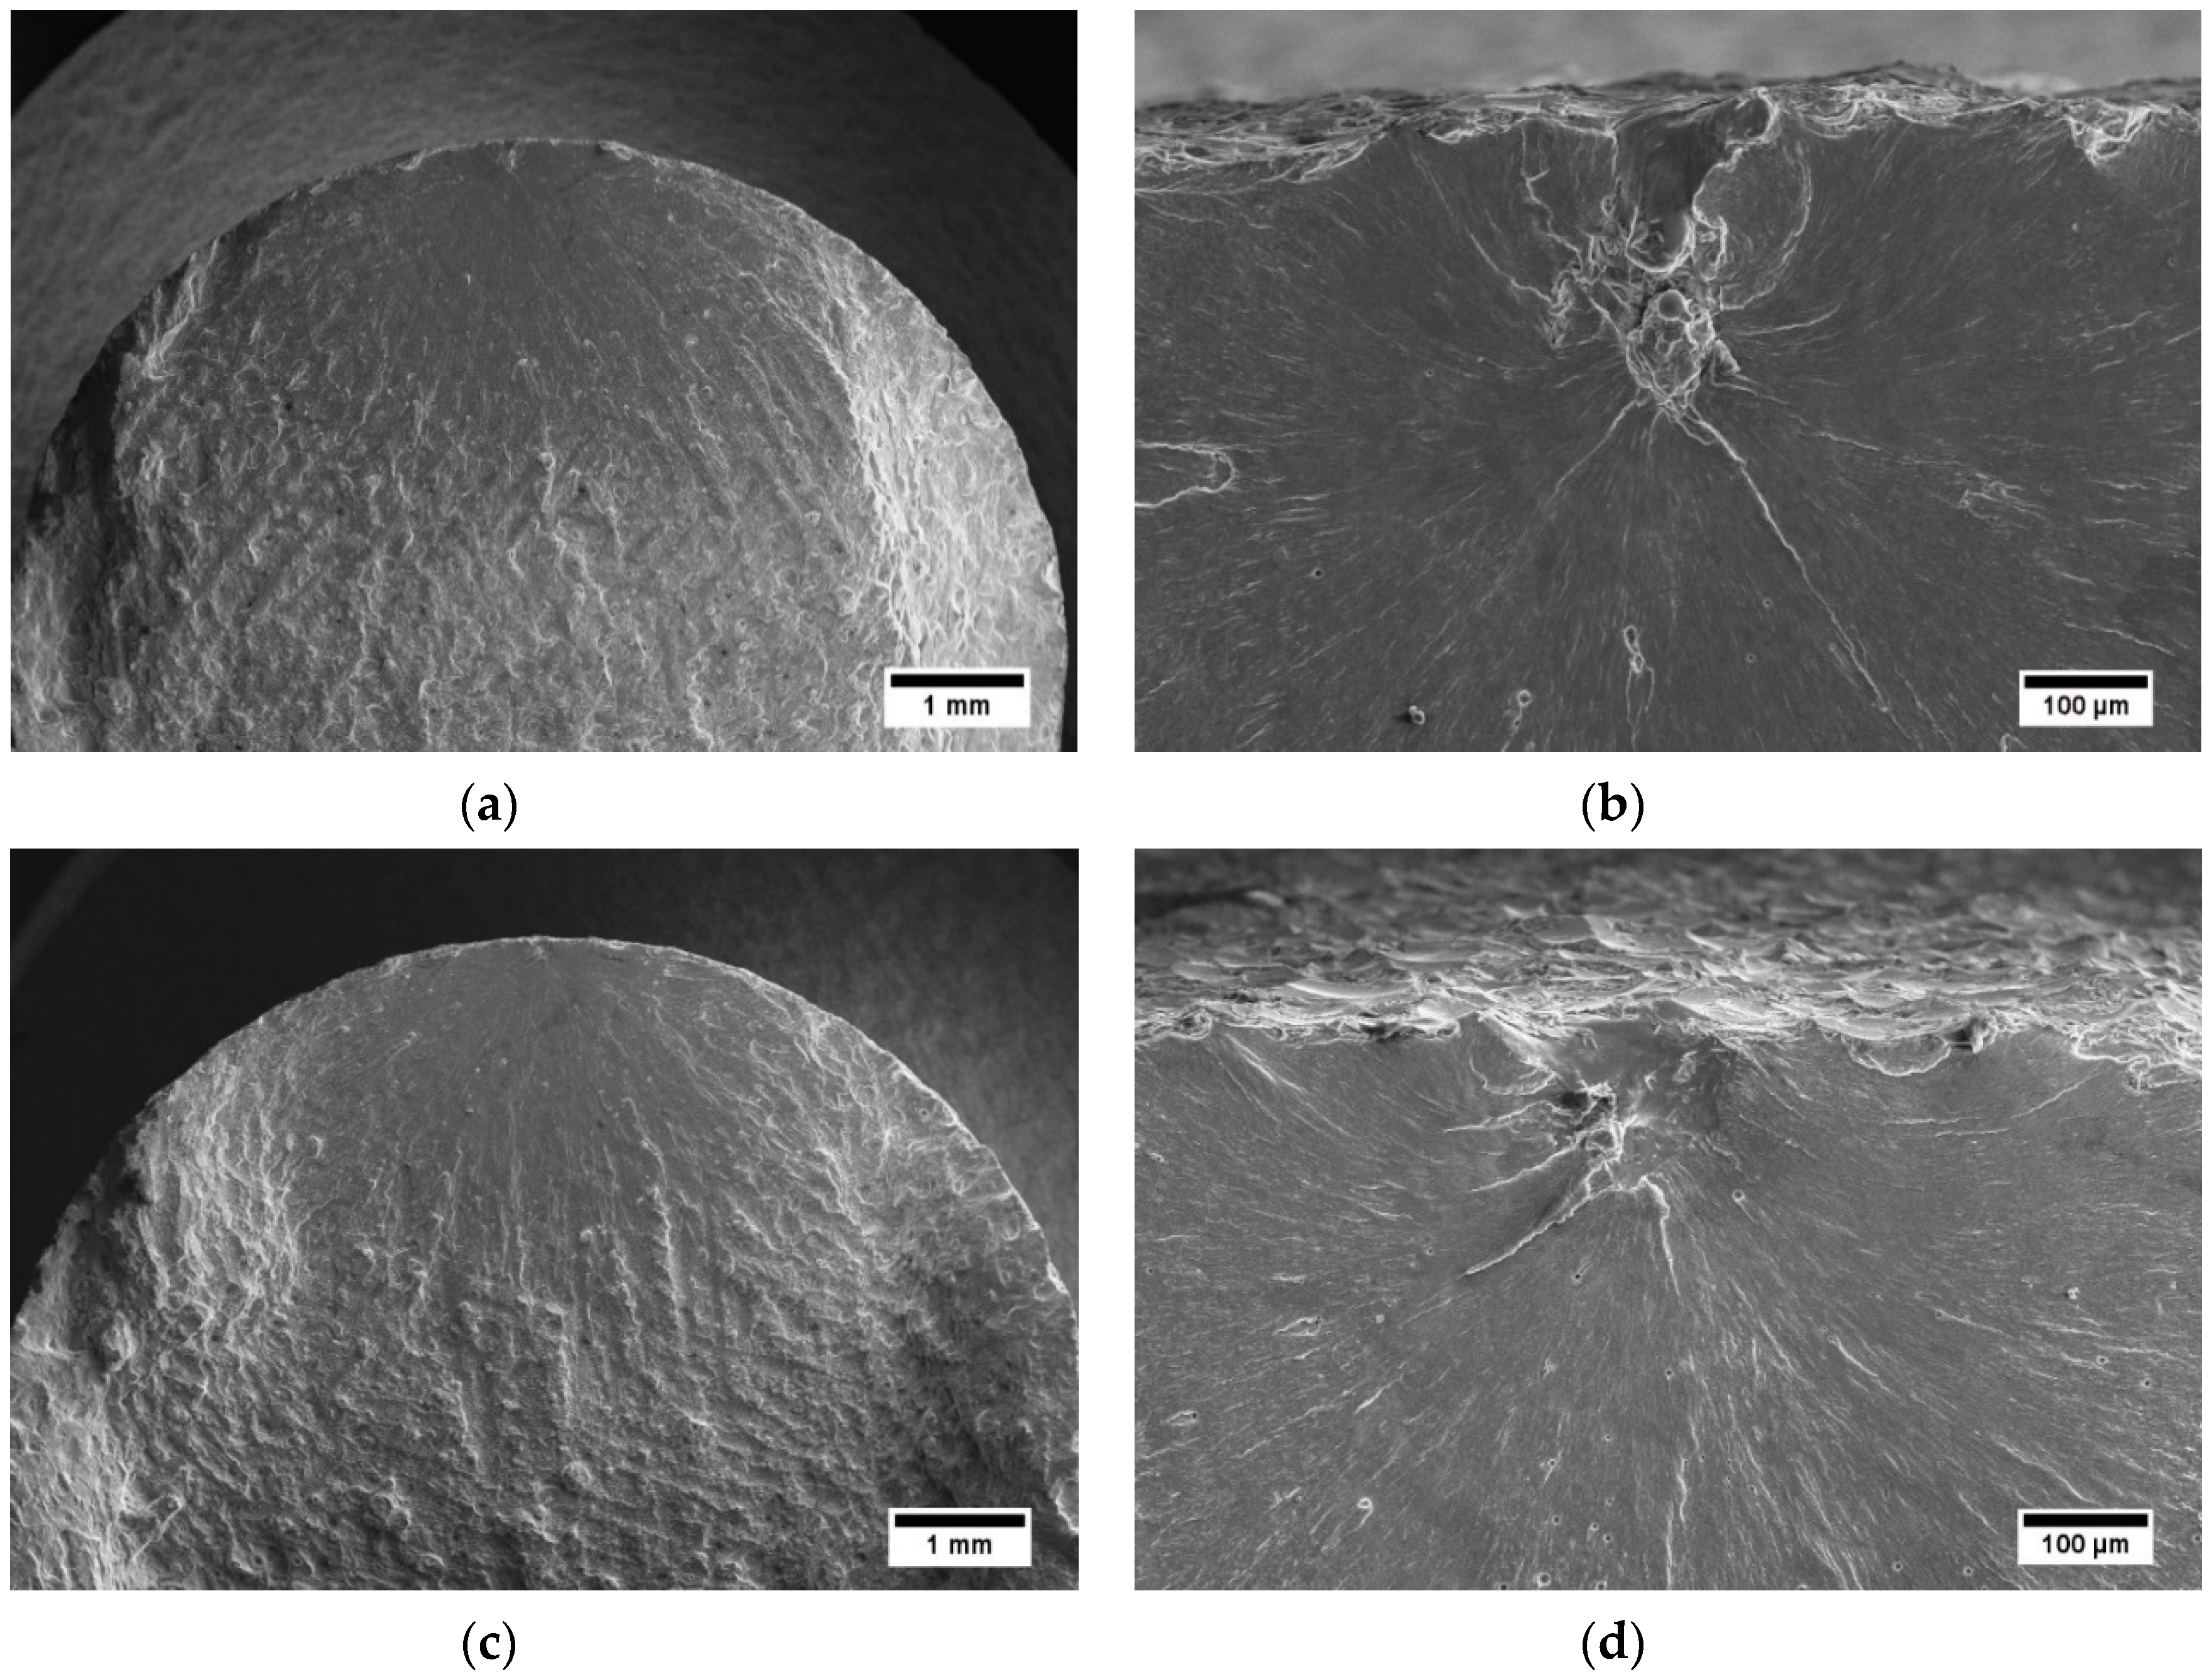
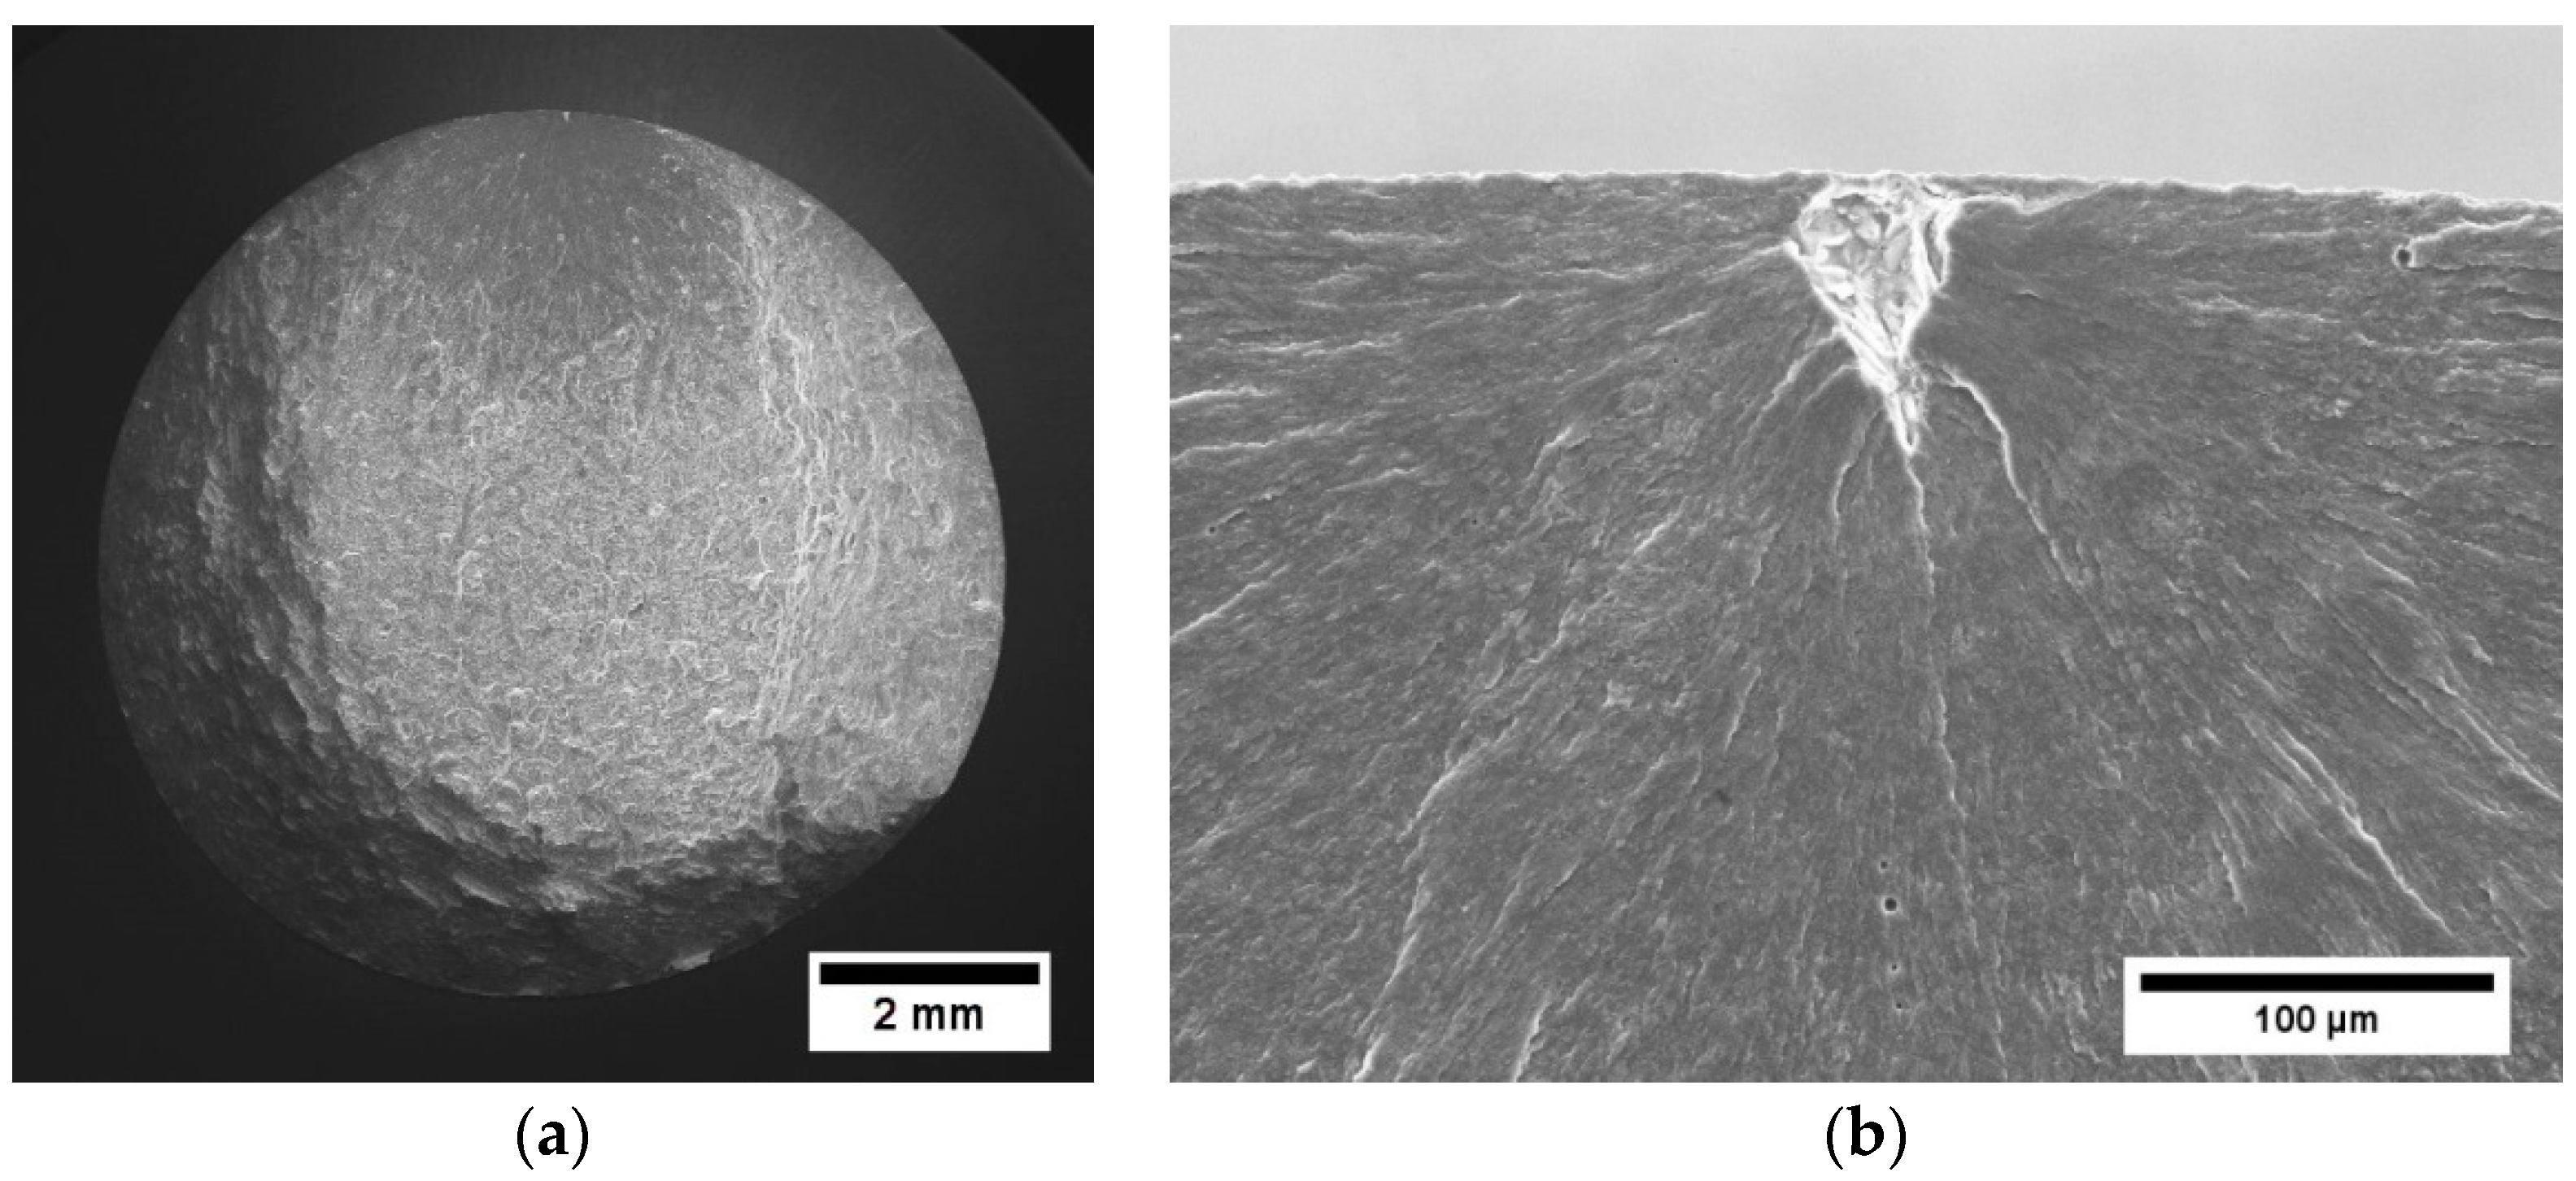
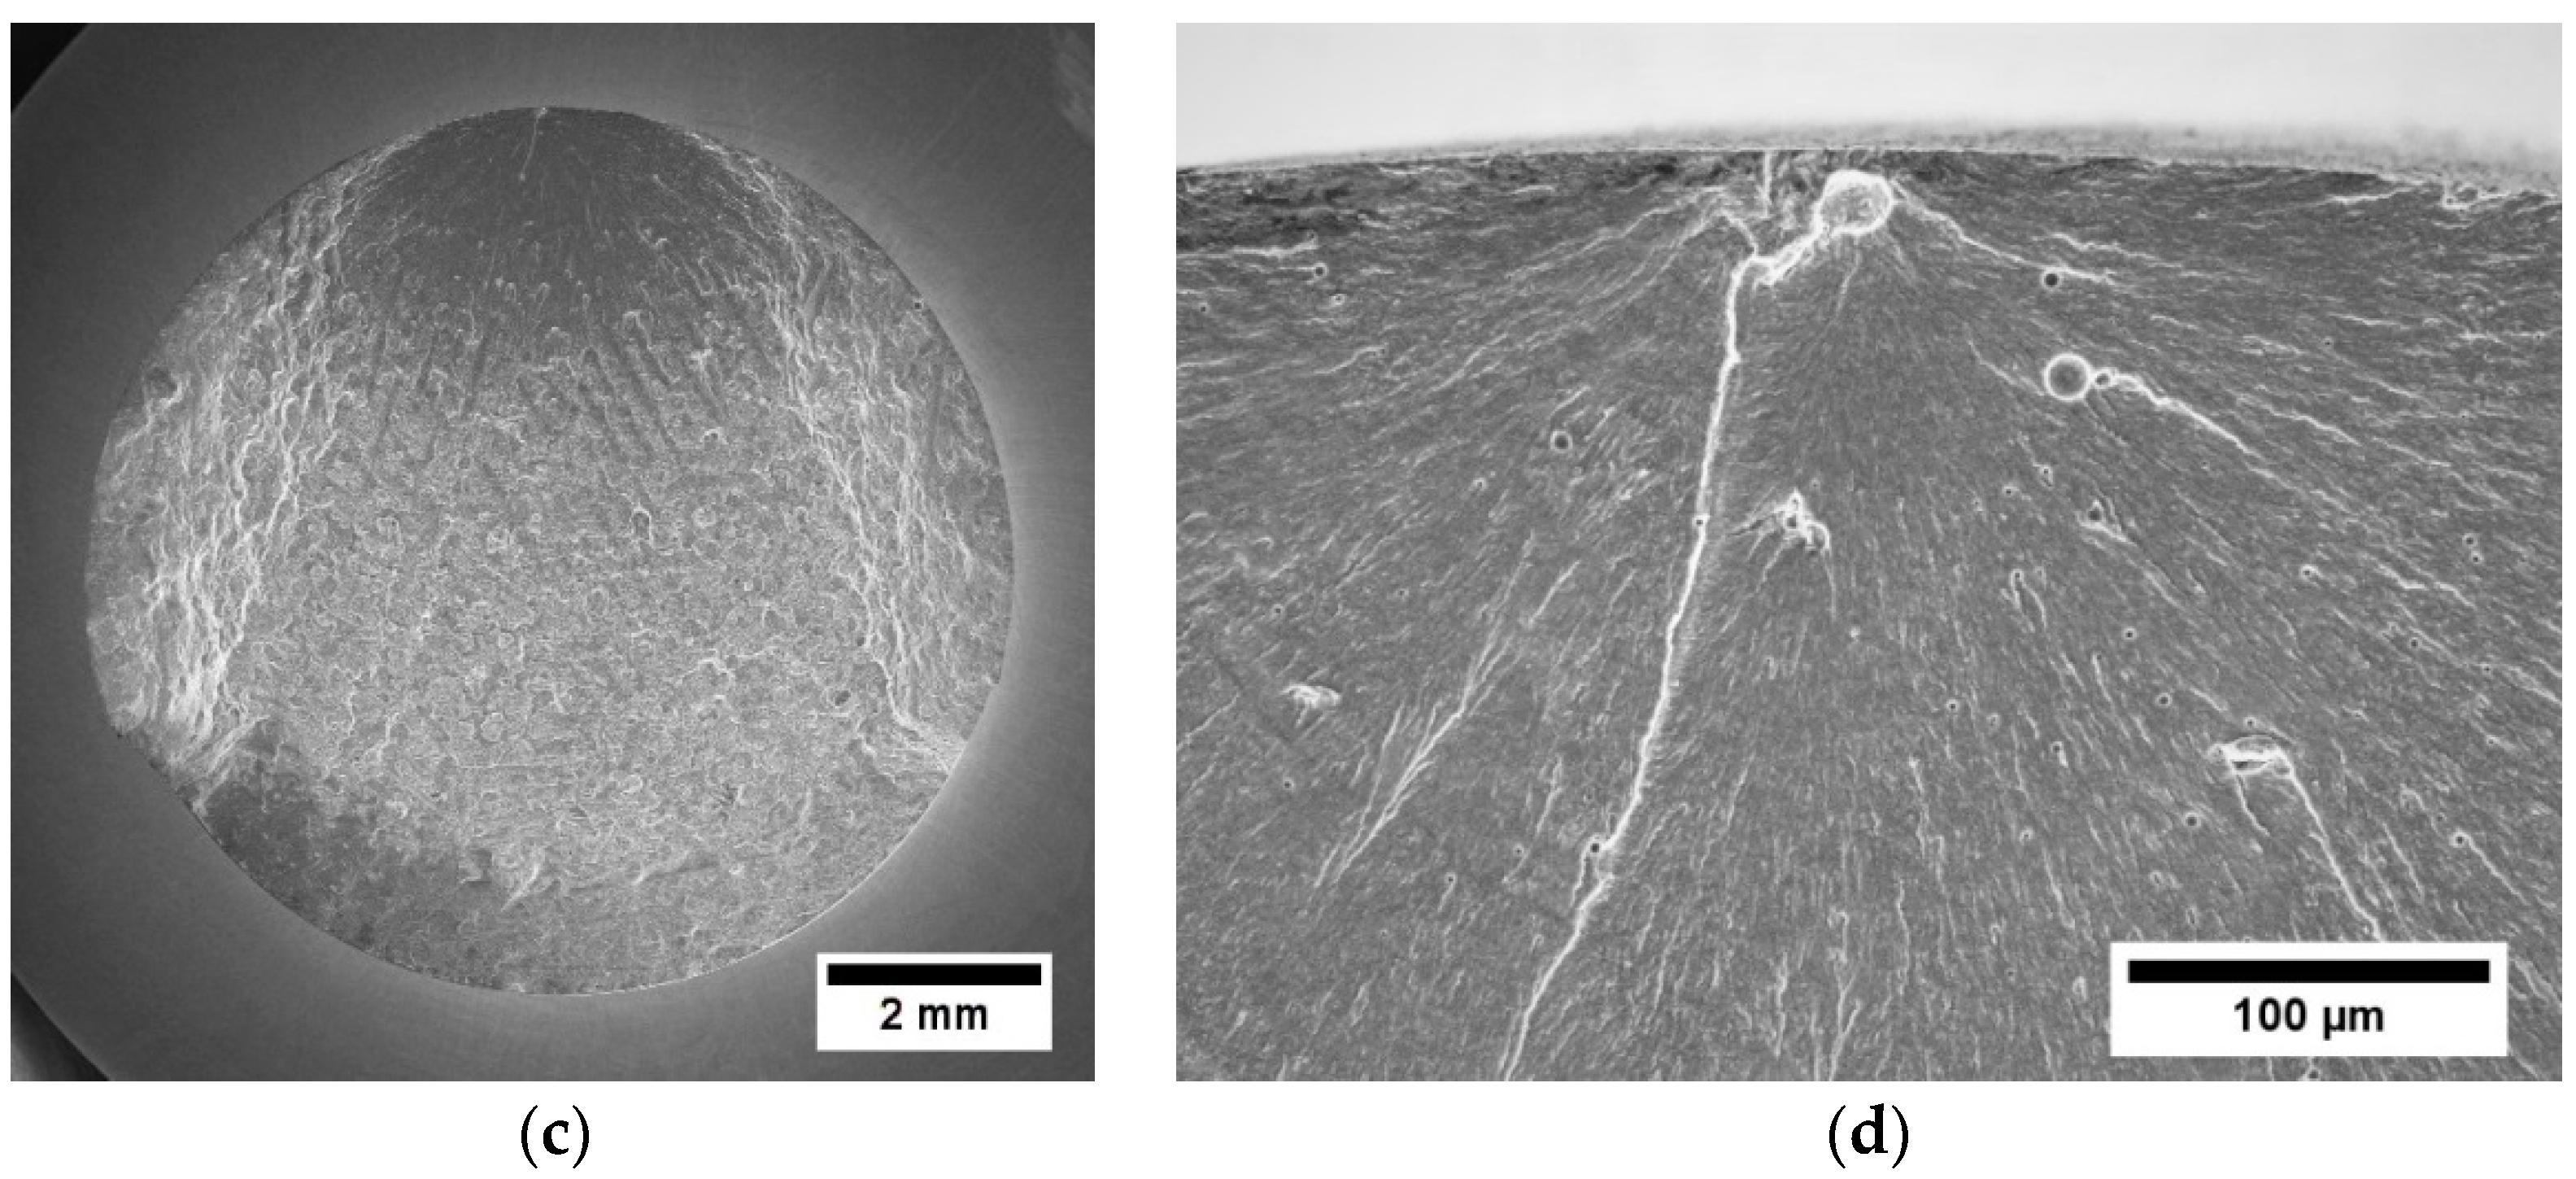
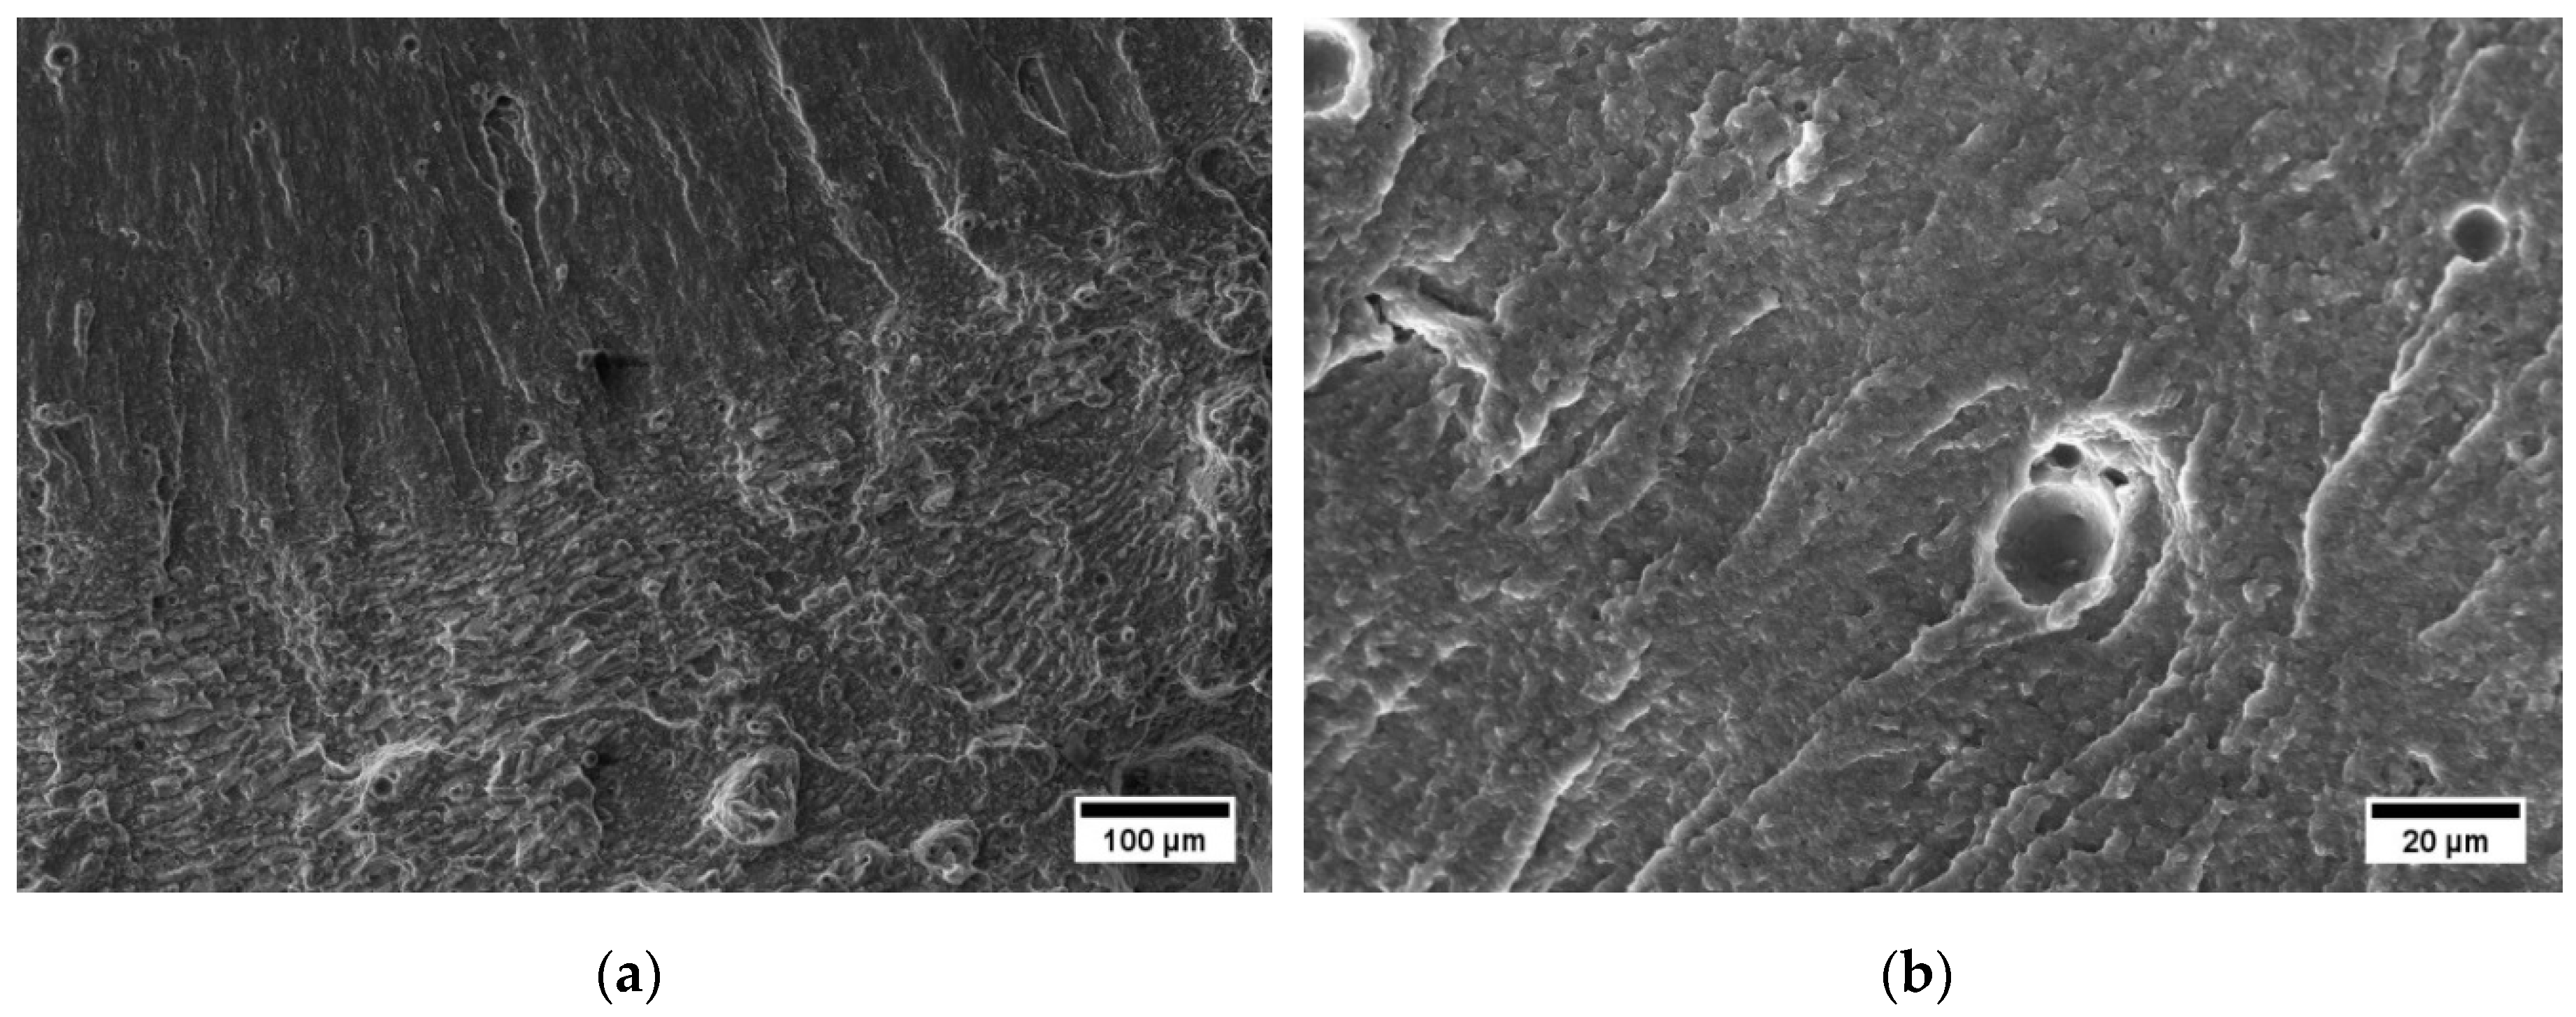
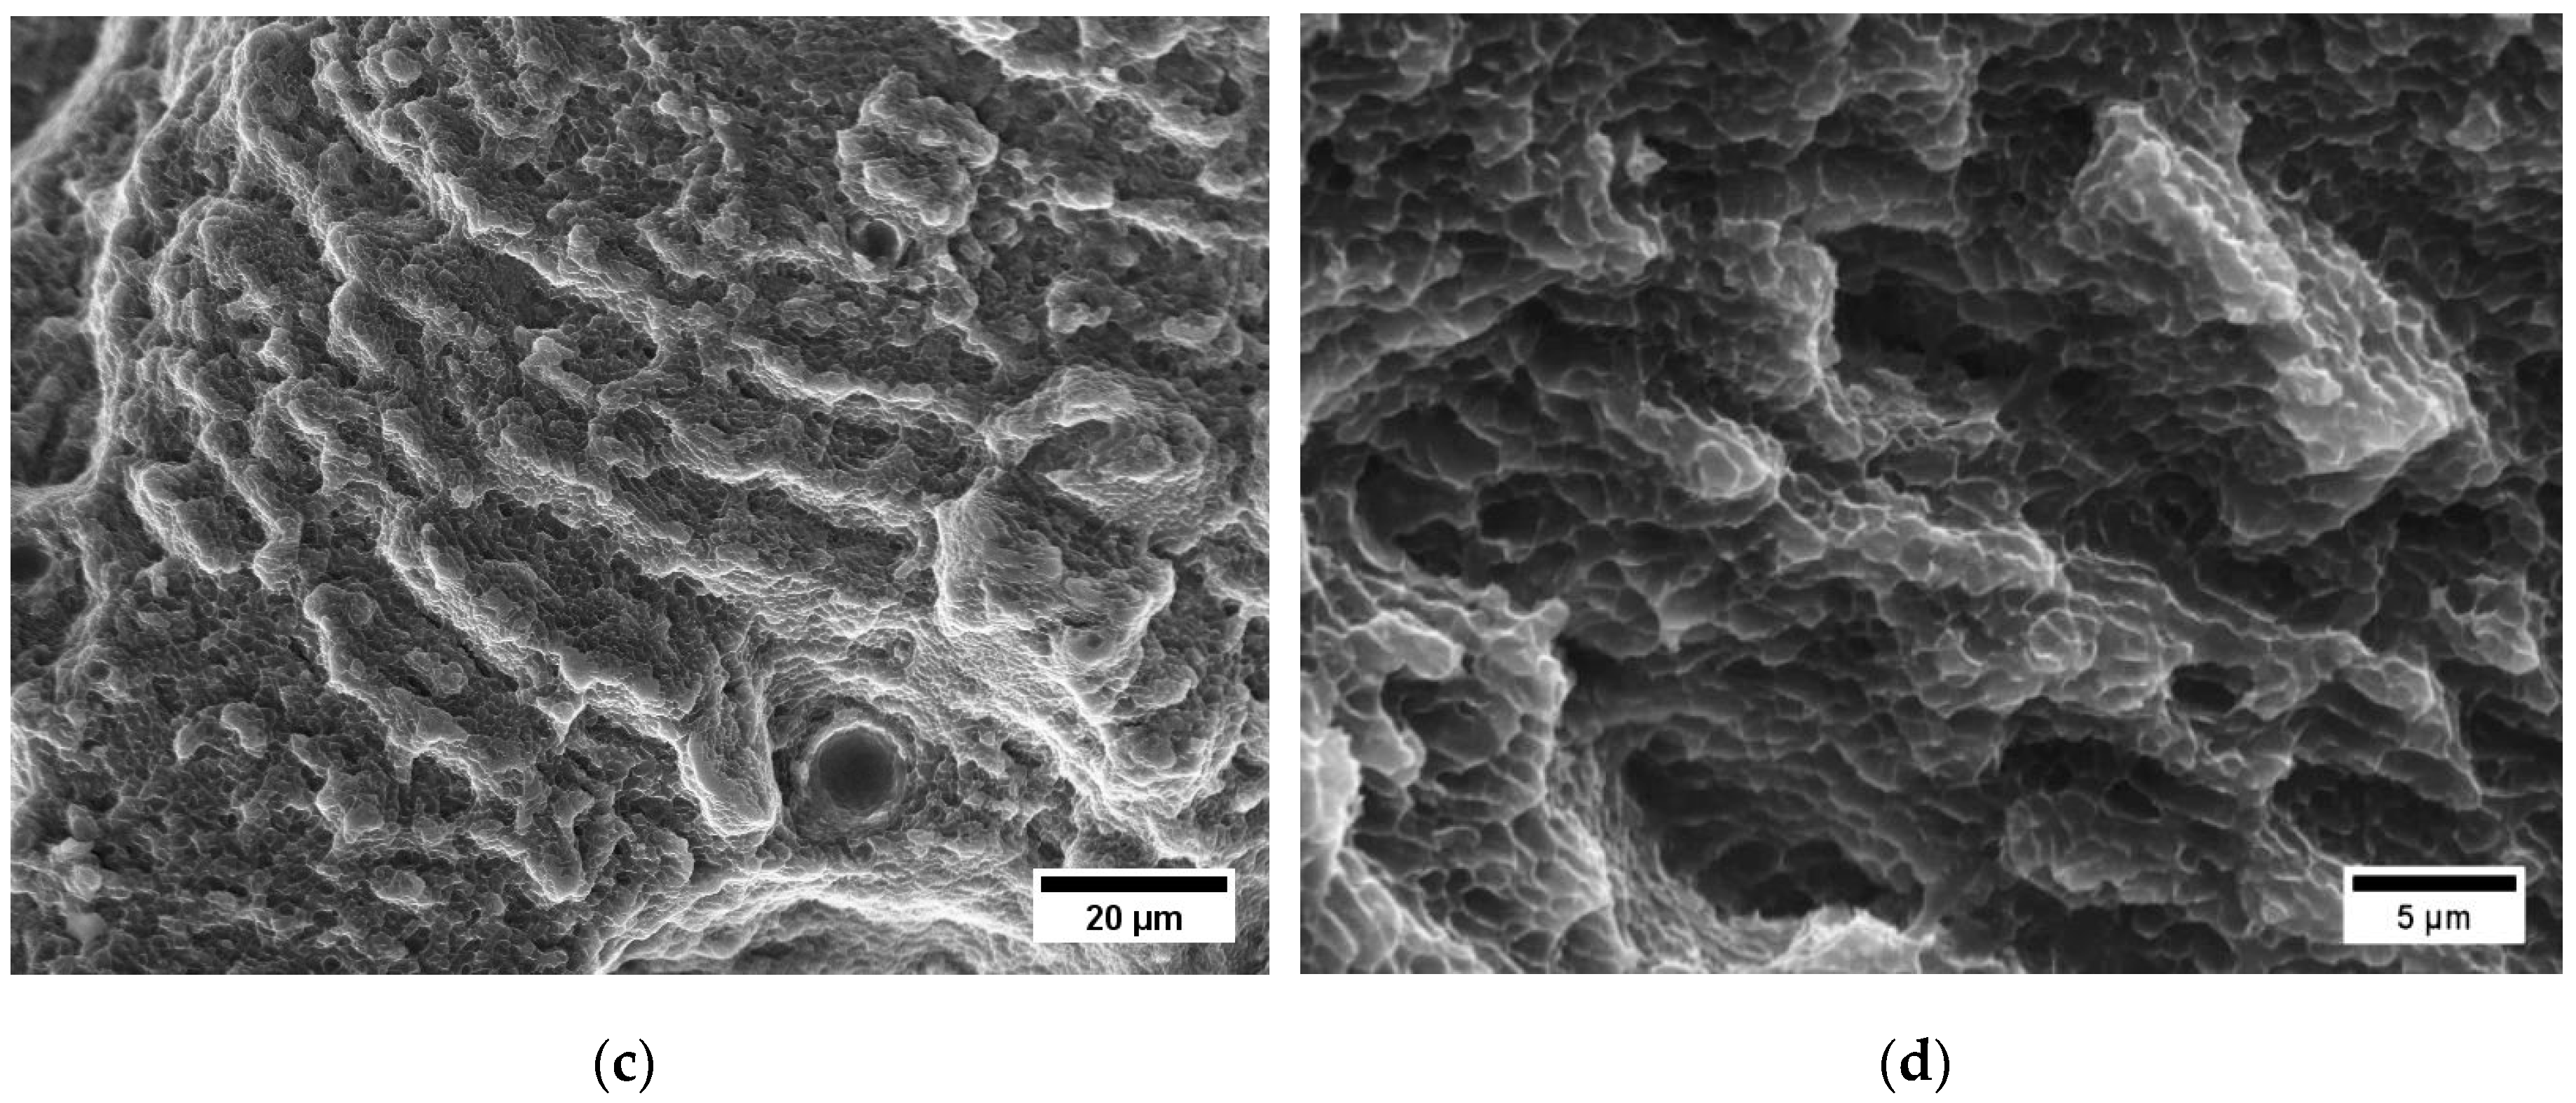
Table 4 summarizes the main tensile properties of the manufactured AlSi10Mg alloy via L-PBF with a platform temperature of 160 °C, while Figure 9 shows the recorded tensile curves. The tensile properties were comparable or even superior to the recorded values in the literature [1], suggesting that the presence of bulk defects is not a concern in this study.
Curves of maximum stress vs. number of cycles to failure for the three surface conditions investigated are presented in Figure 10. A quantitative analysis of the fatigue data was performed by applying the Basquin’s numerical fit to the S-N data plotted in the log-log scale [31]. This is achieved by fitting the stress amplitude (σa) and the number of cycles to failure (Nf) in the form σa = A (Nf)B. The obtained parameters are reported for each surface condition in Table 5. Smaller absolute B values (i.e., reduced slope) represent a higher fatigue performance. The fatigue limits for runouts fixed at 5 × 10⁶ cycles, are also reported in the same table. Additionally, the fatigue limits of the as-built surfaces were added from literature for the sake of comparison.
From the data collected, it is inferred that the VF materials show the lowest fatigue limit (95 MPa), which is attributed to the presence of occasional open surface and subsurface defects. The SB specimens exhibit a higher fatigue limit (152.5 MPa) and improved behavior in the high-cycle fatigue regime. Both these sets of specimens show a similar behavior in the low-cycle range. The MP sample group showed a significant improvement of the fatigue response in the whole range of fatigue cycles, recording a fatigue limit of 194 MPa. In all cases, a substantial improvement in the fatigue limit over as-build surfaces in literature was achieved.

3.4. Fractography

For the analysis of the fatigue mechanisms, the fracture surfaces were ideally divided in their main regions, namely (I) crack initiation, where the crack nucleates and grows slowly in its first stage; (II) steady crack propagation; (III) final overload and fracture of the specimen. The extension of the steady crack growth (II) can roughly be evaluated on the basis of the fracture appearance, as observed from general views (Figure 11) and better defined from more accurate analyses. Region II’s size depends on the applied stress, decreasing it when increasing the applied stress, as observed in Figure 11 for a set of representative MP samples. Here, the crack growth surface area decreases when moving from a maximum stress at failure of 185 MPa (approximate area of region II of 4.9 mm2) to 245 MPa (approximate area of 2.6 mm2).
Figure 12 and Figure 13 depict the fracture surfaces of two VF samples failed at the stress levels of 95 and 175 MPa, respectively. VF samples substantially always failed by crack nucleation from open surface or subsurface defects which are considered to be residuals of the original L-PBF defects. As a rule, VF samples failed by single crack nucleation at lower stress levels (Figure 12) and by multiple crack nucleations at higher stress levels (Figure 13).
Figure 14 collects views of fracture surfaces of the SB samples. SB samples always failed by a single nucleation site, irrespective of applied stress level. Most of these nucleation sites generated by occasional residual subsurface defects found within a thickness of around 200 µm from the specimen surface (refer to Figure 4c,d). In a few instances the failure was due to open pores exposed on the surface. This can be assigned to the nature of the sandblasting process, which plastically deforms the surface, causing the closure of open pores in most of the cases and generating a beneficial compressive stress field on the surface of the treated specimens [14,33]. It is believed that this could be the main reason for the improved fatigue limit shown by SB samples over the VF samples, especially in the high-cycle regime.
Finally, Figure 15 exhibits the fracture surfaces of the MP samples. In these samples the effects of any original L-PBF surface feature were removed by machining and polishing. Specimens generally failed from single defects corresponding to the occasional bulk pores which became exposed on the surface due to the machining operation.
After careful examination of all the fracture surfaces in the three presented cases, no evidence of grain boundary surfaces was detected. Therefore, the possible influence of grain boundaries and other coarse precipitates in the fracture nucleation can be reasonably excluded.
The microscopic features concerned with crack growth in regions II and III of the fatigue process were similar for all the conditions investigated. Crack growth during phase II produced a planar, almost featureless surface showing several shallow ridges. The effects of small pores and inclusions or spatters on the crack growth front were recognized, locally deviating it and changing its growth rate (Figure 16b). In zone III (bottom of Figure 16a,c) deeper ridges and occasional micro-dimples corresponding to the size of the cellular microstructure are observed. A fully dimpled fracture is eventually observed in last stages of crack evolution, suggesting a ductile mechanism of fracture in the overload fracture zone (Figure 16d).

4. Discussion

Surface roughness of structural parts produced by conventional manufacturing routes represents one of the most important variables affecting fatigue properties of metals [34,35,36]. Recently, the study about the effects of roughness on fatigue strength has been naturally extended to L-PBF products, especially considering the peculiar surface features created by the laser processing. There is a substantial consensus in the literature that any kind of roughness parameter alone cannot provide a direct and reliable correlation with fatigue strength [7,14,37].
From the experimental results presented here, it is confirmed that the as-built surface of the investigated AlSi10Mg alloy consists of a number of protruding geometrical features (such as spatters, balling, and partially melted powder particles) that have already been characterized in their morphology, chemistry, microstructure, and mechanisms of formation in the literature [8,9,10,38]. Other studies suggested that by a proper selection of L-PBF process parameters, these features can be reduced in their amount and size [13,39,40], but cannot be fully eliminated, therefore being an unavoidable secondary effect of the laser beam interaction with the matter.
Considering this perspective, it can be suggested from analyses about surface morphologies and cross-sectioned profiles depicted in Figure 3, Figure 4, Figure 5 and Figure 6 that vibro-finishing could appreciably smoothen the surface profile of as-built samples (average roughness height Sa was reduced from 15.4 µm down to 2.3 µm), but a number of deep notches (recesses on the surface) still persisted on surface profiles, promoting easy crack nucleation and reduced fatigue lives. Based on results in Table 3, the maximum height value (Sv) in VF specimens increases from 85 to 121 µm with respect to the as-built surfaces. This is attributed to the insufficient material layer removal which could reach the subsurface pores and reveal them as open pores on the finished VF surfaces. The highly negative skewness value for the VF specimen approve this phenomenon meaning a favorable distribution of the bulk material above the mean line supposing the presence of deep valleys.
A similar effect was produced in MP samples but here, a layer of 0.5 mm of material was cut by machining, substantially removing any intrusion or subsurface defect. The substantial material removal resulted in elimination of almost all of the surface and subsurface defects achieving a significant reduction in maximum height value (Sv) (from 85 to 6 µm). This improvement achieved a notable boost in the fatigue strength of MP samples over the full range of fatigue lives here investigated (see Figure 10) and in the shift from a multiple crack nucleation mode (from surface and subsurface defects) to single crack nucleation starting from formerly bulk defects (porosity) that are exposed on the surface after the layer removal. The skewness value for MP specimens (Ssk = 0) suggests a symmetrical topography with random height distribution being in harmony with microscopical analysis.
Therefore, it can be supposed that vibro-finishing represents an efficient “mechanical” method that can remove most of the protruding particles from surfaces, leading to substantial reduction in roughness and improvement of functional properties of surfaces such as reduction of friction, lower head losses in hydraulic systems, improved adhesion of thin coatings. However, when it comes to fatigue behavior of additively manufactured parts, it has to be considered that the finishing operation should include both the surface and the subsurface layers in order to reduce any sharp intrusions along the surface profile promoting fatigue crack nucleation. The multiple crack nucleation in VF samples is attributed to the abundance of the remaining surface and subsurface defects after the vibro-finishing process.
Sandblasting introduces an additional effect consisting of the build up of a residual stress field through strain hardening of the portion of material close to the surface. Although the direct measurement of residual stress intensity was out of the scope of the present paper, it is recognized in literature that compressive residual stresses are generated during blasting [14,33]. The increased hardness close to surface measured by nanoindentations is also consistent with this hypothesis. The data collected for the SB samples in this study reveal that, although the reduction of average roughness was fairly limited when compared to as-built samples (from 15.4 to 8.3 µm), the achieved fatigue strength was comparable to that of VF series in the low-cycle fatigue (LCF) regime, and superior to it in the high-cycle fatigue HCF regime. This similarity in the LCF region is attributed to higher stress levels resulting in the contribution of plasticity and its dominance over the residual stresses. However, the improvement in the HCF region might be attributed to the significant differences in the maximum height values (Sv) measured by confocal microscopy which is directly related to the induced stress intensity factor. Additionally, it can be supposed that the effect induced by the compression stress field and by the strain hardening brought a net advantage on fatigue performance, even considering the higher roughness measured in the SB samples. Bagherifard et al. [32] and Beevers et al. [41] conducted residual stress measurements for AlSi10Mg alloy manufactured via L-PBF with SB and VF surface conditions, respectively. According to these studies, VF specimens hold lower residual stress values alongside the build direction (also applied load in this study) with respect to the SB specimens, which is consistent with the superior performance of the SB samples over VF samples in the HCF region.
To conclude, the main outcome of this study highlights the importance of correctly evaluating surface and subsurface defects for improved fatigue design of AM parts. Analysis of experimental results suggests that geometrical features such as partially melted particles, spatters, and un-melted powder particles stuck on surface can effectively be eliminated by proper surface finishing operations. Additionally, they do not represent a significant concern for crack nucleation (hence on fatigue performance) as long as they simply extend outward from the engineering part profile. On the contrary, residual intrusions left after the finishing operation, even when not significantly depleting the roughness profile, can act as a sharp stress raiser, reducing fatigue strength.
Therefore, for all the situations where machining operations cannot be conveniently performed on AM parts, the application of defect tolerant design concepts becomes mandatory. This observation is fully consistent with suggestions given by Beretta and co-workers [18,20], who noticed that surface and subsurface defects are more detrimental than internal flaws. This could explain the large variability of published fatigue data for AM materials. Especially, subsurface defects in contact or close to the surface show a larger stress intensity factor that can be estimated through a proper evaluation of the effective defect size and the use of Kitagawa–Takahashi diagrams [20]. According to this view, it was proposed that subsurface pores can be assimilated as 2D cracks with a size proportional to defect depth from surface, and the estimation of fatigue strength is based on the expected size of the largest defect found in a given material volume, according to the concepts dictated by the statistics of extreme values [42,43].

5. Conclusions

The fatigue behavior of an AlSi10Mg alloy produced by L-PBF and subjected to different surface finishing processes was investigated. The relation between the residual defects existing on the surfaces of fatigue samples and the dominant fatigue failure mechanisms was evaluated, leading to the following main outcomes.
(1)
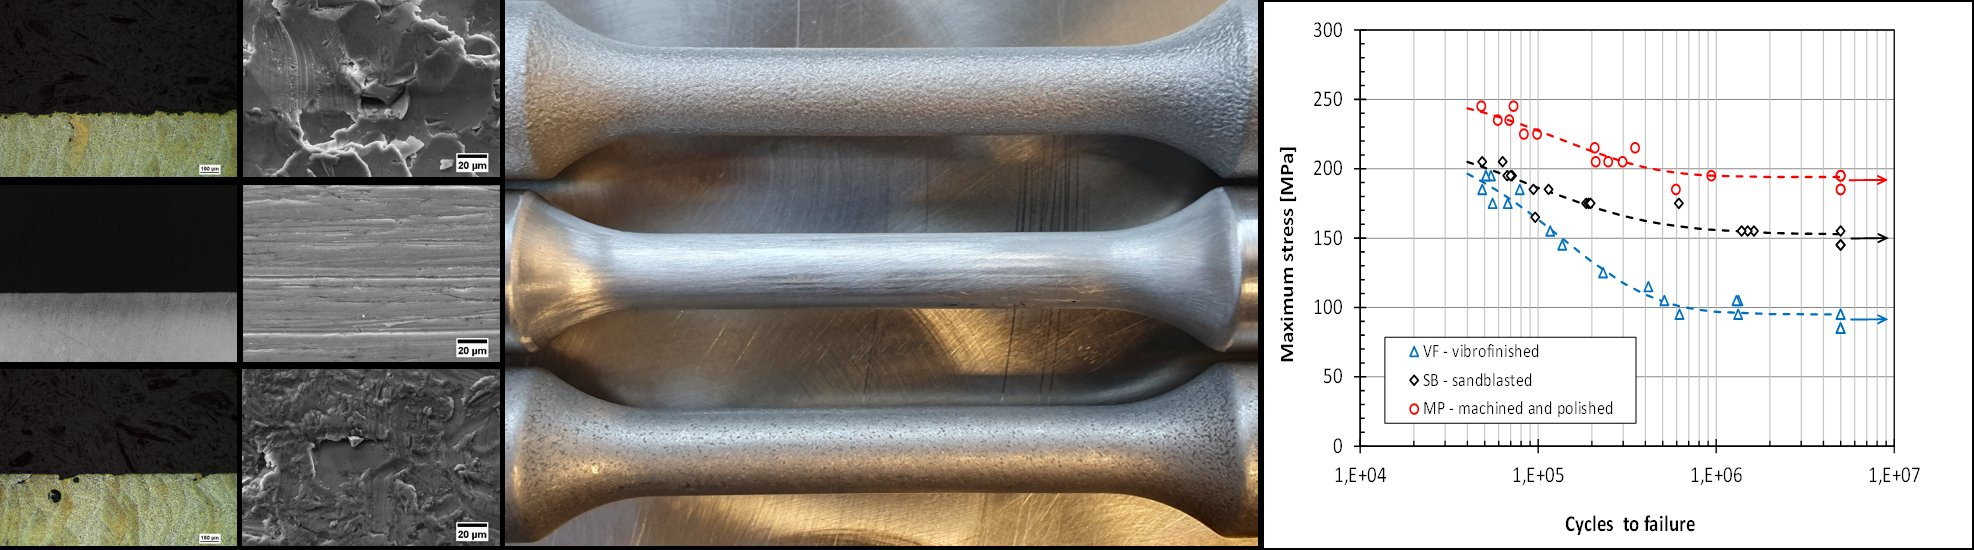
The as-built surfaces of the investigated alloy consisted of a number of protruding geometrical features that could be partially (sand blasting) or fully (vibro-finishing, machining and polishing) removed by the considered surface treatments.
(2)
As a result, the average roughness amplitude (Sa) of the treated samples could be reduced down to 8.3 µm for the sand blasted samples and to 2.3 and 0.5 µm for the vibro-finished and the machined and polished samples, respectively.
(3)
In sandblasted and in vibro-finished samples the obtained fatigue strength revealed to be strongly affected by the population of existing residual subsurface defects and by the residual stress field. A significant improvement of fatigue strength could be achieved after machining and polishing, which allowed by removal of a 0.5 mm layer of material from surfaces and to obtain the lowest value of surface roughness.
(4)
The calculated fatigue limits were 95.0, 152.5, and 194.0 MPa for the vibro-finished, sandblasted, and machined and polished samples, respectively.
(5)
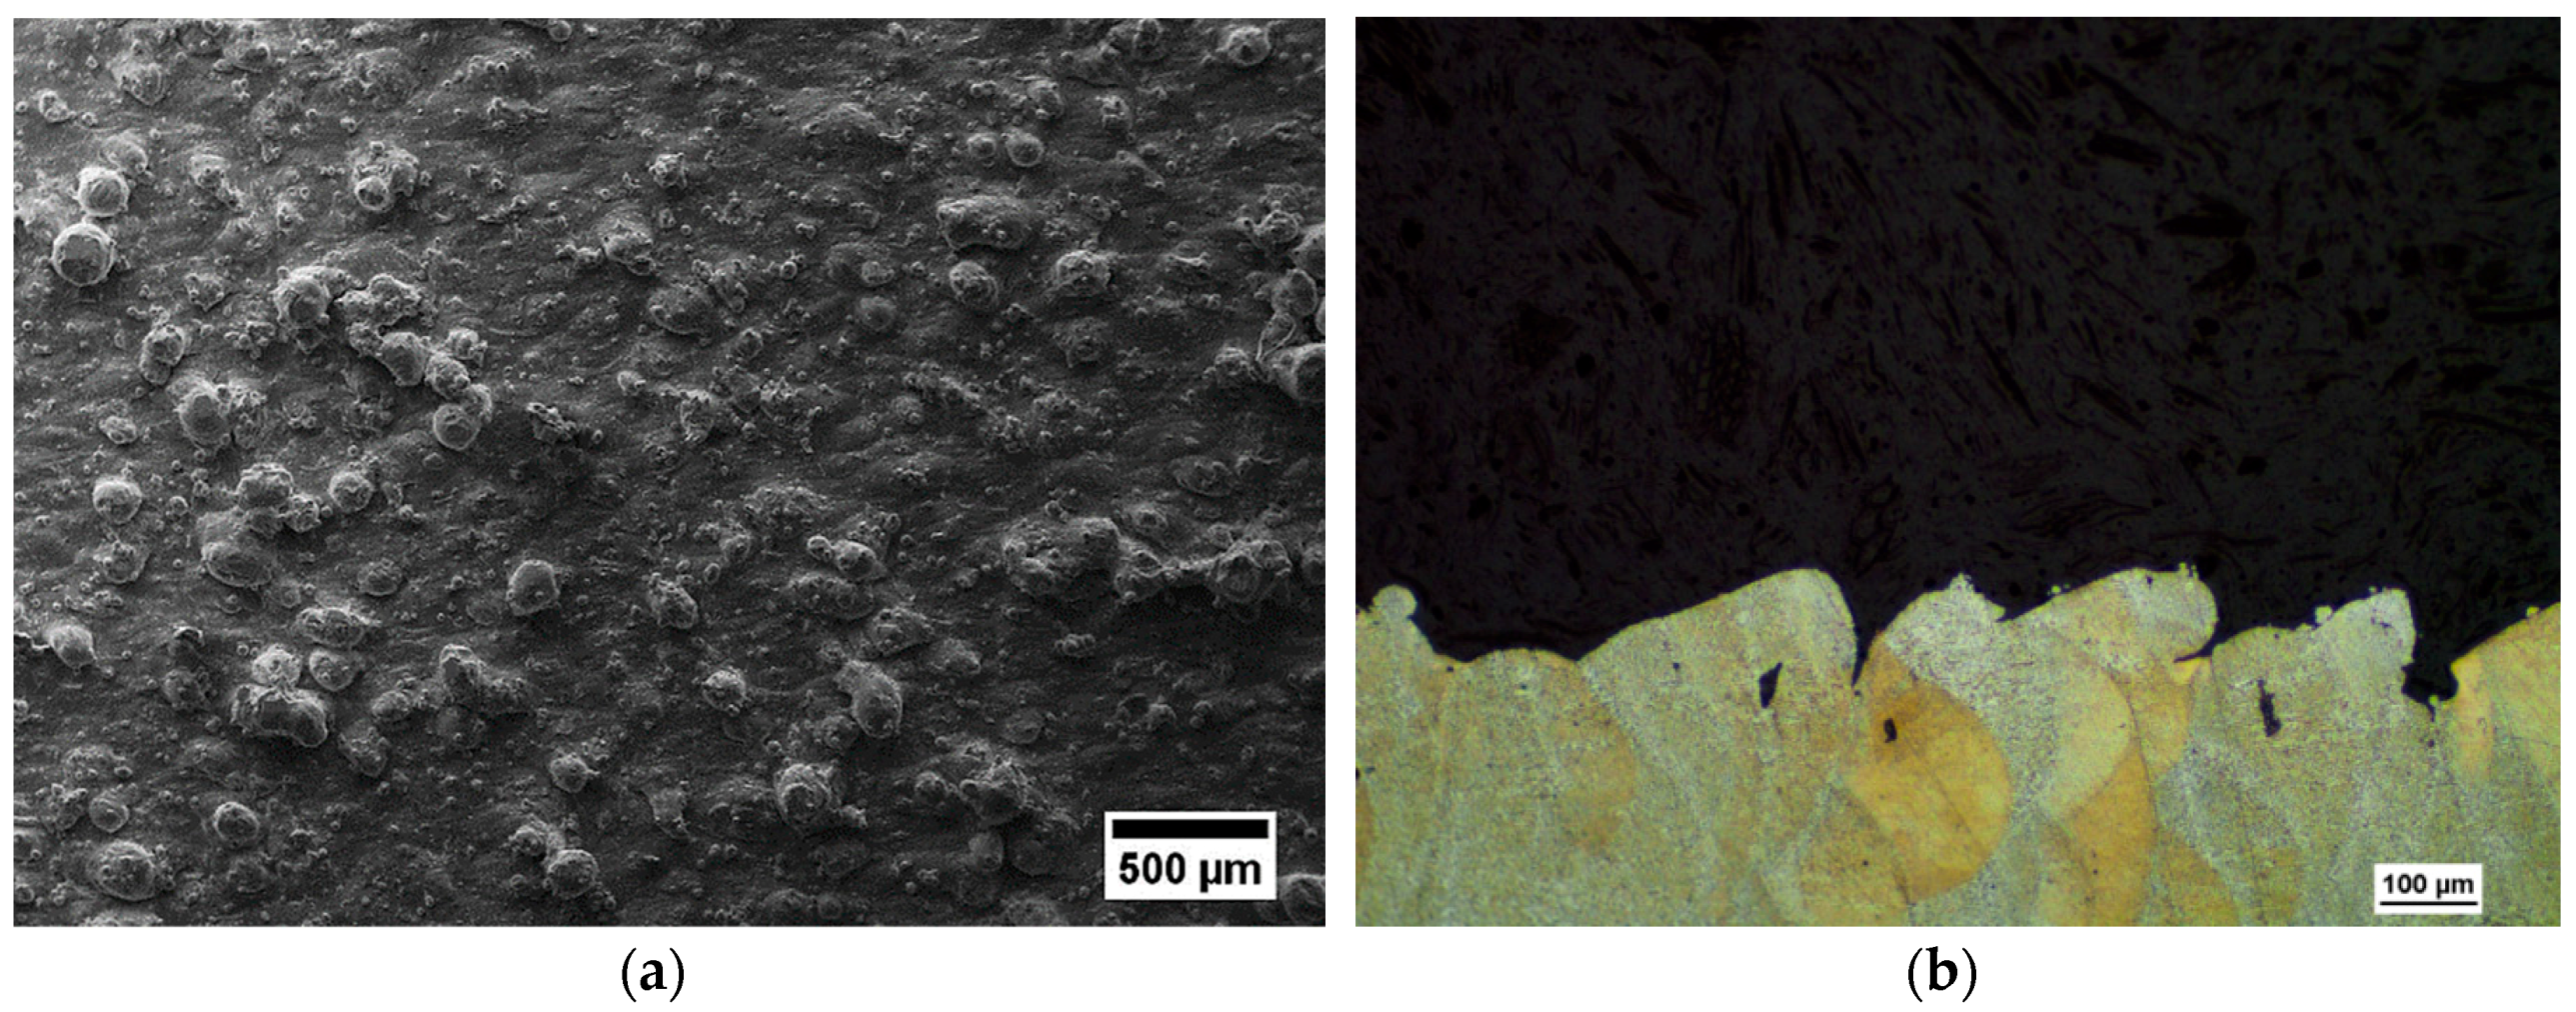
Geometrical features such as partially melted particles, spatters, and un-melted powder particles stuck on surface and extending outward from the engineering part profile can be easily removed by proper surface finishing operations. However, residual intrusions left on finished surfaces, even when not significantly depleting the roughness profile, can act as a sharp stress raiser, reducing fatigue strength.

Author Contributions

Conceptualization, M.H.N. and M.V.; methodology, M.H.N., D.G., M.V. and A.G.; validation, M.H.N., M.V. and A.G.; formal analysis, M.H.N. and M.V.; investigation, M.H.N., M.V.; resources, M.V., D.G., A.G. and V.T.; data curation, M.H.N. and D.G.; writing—original draft preparation, M.H.N. and M.V.; writing—review and editing, M.H.N. and M.V.; supervision, M.V.; project administration, M.V.; funding acquisition, M.V.

Funding

The support by the Italian Ministry for Education, University and Research (MIUR) through the project headed “Department of Excellence LIS4.0” (Integrated Laboratory for Lightweight and Smart Structures) is acknowledged.

Conflicts of Interest

The authors declare no conflict of interest.

References

  1. DebRoy, T.; Wei, H.L.; Zuback, J.S.; Mukherjee, T.; Elmer, J.W.; Milewski, J.O.; Beese, A.M.; Wilson-Heid, A.; De, A.; Zhang, W. Additive Manufacturing of Metallic Components—Process, Structure and Properties. Prog. Mater. Sci. 2018, 112–224. [Google Scholar] [CrossRef]
  2. Sames, W.J.; List, F.A.; Pannala, S.; Dehoff, R.R.; Babu, S.S. The Metallurgy and Processing Science of Metal Additive Manufacturing. Int. Mater. Rev. 2016, 315–360. [Google Scholar] [CrossRef]
  3. Brandl, E.; Heckenberger, U.; Holzinger, V.; Buchbinder, D. Additive manufactured alsi10mg samples using selective laser melting (SLM): Microstructure, high cycle fatigue, and fracture behavior. Mater. Des. 2012, 34, 159–169. [Google Scholar] [CrossRef]
  4. Spierings, A.B.; Starr, T.L.; Wegener, K. Fatigue performance of additive manufactured metallic parts. Rapid Prototyp. J. 2013, 19, 88–94. [Google Scholar] [CrossRef]
  5. Leuders, S.; Lieneke, T.; Lammers, S.; Tröster, T.; Niendorf, T. On the fatigue properties of metals manufactured by selective laser melting—The role of ductility. J. Mater. Res. 2014, 29, 1911–1919. [Google Scholar] [CrossRef]
  6. Mower, T.M.; Long, M.J. Mechanical behavior of additive manufactured, powder-bed laser-fused materials. Mater. Sci. Eng. A 2016, 651, 198–213. [Google Scholar] [CrossRef]
  7. Yadollahi, A.; Shamsaei, N. Additive manufacturing of fatigue resistant materials: Challenges and Opportunities. Int. J. Fatigue 2017, 98, 14–31. [Google Scholar] [CrossRef]
  8. Nasab, M.H.; Gastaldi, D.; Lecis, N.F.; Vedani, M. On morphological surface features of the parts printed by selective laser melting (SLM). Addit. Manuf. 2018, 24, 373–377. [Google Scholar] [CrossRef]
  9. Gasper, A.N.D.; Szost, B.; Wang, X.; Johns, D.; Sharma, S.; Clare, A.T.; Ashcroft, I.A. Spatter and oxide formation in laser powder bed fusion of Inconel 718. Addit. Manuf. 2018, 46, 446–456. [Google Scholar] [CrossRef]
  10. Simonelli, M.; Tuck, C.; Aboulkhair, N.T.; Maskery, I.; Ashcroft, I.; Wildman, R.D.; Hague, R. A Study on the laser spatter and the oxidation reactions during selective laser melting of 316L stainless steel, Al-Si10-Mg, and Ti-6Al-4V. Metall. Mater. Trans. A Phys. Metall. Mater. Sci. 2015, 46, 3842–3851. [Google Scholar] [CrossRef]
  11. Esmaeilizadeh, R.; Ali, U.; Keshavarzkermani, A.; Mahmoodkhani, Y.; Marzbanrad, E.; Toyserkani, E. On the effect of spatter particles distribution on the quality of hastelloy X parts made by laser powder-bed fusion additive manufacturing. J. Manuf. Process. 2019, 37, 11–20. [Google Scholar] [CrossRef]
  12. Ali, U.; Esmaeilizadeh, R.; Ahmed, F.; Sarker, D.; Muhammad, W.; Keshavarzkermani, A.; Mahmoodkhani, Y.; Marzbanrad, E.; Toyserkani, E. Identification and characterization of spatter particles and their effect on surface roughness, density and mechanical response of 17-4 PH stainless steel laser powder-bed fusion parts. Mater. Sci. Eng. A 2019, 756, 95–107. [Google Scholar] [CrossRef]
  13. Koutiri, I.; Pessard, E.; Peyre, P.; Amlou, O.; De Terris, T. Influence of SLM Process Parameters on the surface finish, porosity rate and fatigue behavior of as-built Inconel 625 parts. J. Mater. Process. Technol. 2018, 255, 536–546. [Google Scholar] [CrossRef]
  14. Bagehorn, S.; Wehr, J.; Maier, H.J. Application of mechanical surface finishing processes for roughness reduction and fatigue improvement of additively manufactured Ti-6Al-4V parts. Int. J. Fatigue 2017, 102, 135–142. [Google Scholar] [CrossRef]
  15. Yang, K.V.; Rometsch, P.; Jarvis, T.; Rao, J.; Cao, S.; Davies, C.; Wu, X. Porosity formation mechanisms and fatigue response in Al-Si-Mg alloys made by selective laser melting. Mater. Sci. Eng. A 2018, 712, 166–174. [Google Scholar] [CrossRef]
  16. Aboulkhair, N.T.; Maskery, I.; Tuck, C.; Ashcroft, I.; Everitt, N.M. Improving the fatigue behaviour of a selectively laser melted aluminium alloy: Influence of heat treatment and surface quality. Mater. Des. 2016, 104, 174–182. [Google Scholar] [CrossRef]
  17. Zhang, C.; Zhu, H.; Liao, H.; Cheng, Y.; Hu, Z.; Zeng, X. Effect of heat treatments on fatigue property of selective laser melting AlSi10Mg. Int. J. Fatigue 2018, 116, 513–522. [Google Scholar] [CrossRef]
  18. Romano, S.; Brückner-Foit, A.; Brandão, A.; Gumpinger, J.; Ghidini, T.; Beretta, S. Fatigue properties of AlSi10Mg obtained by additive manufacturing: Defect-based modelling and prediction of fatigue strength. Eng. Fract. Mech. 2018, 187, 165–189. [Google Scholar] [CrossRef]
  19. Tang, M.; Pistorius, P.C. Oxides, porosity and fatigue performance of AlSi10Mg parts produced by selective laser melting. Int. J. Fatigue 2017, 94, 192–201. [Google Scholar] [CrossRef]
  20. Beretta, S.; Romano, S. A Comparison of fatigue strength sensitivity to defects for materials manufactured by AM or traditional processes. Int. J. Fatigue 2017, 94, 178–191. [Google Scholar] [CrossRef]
  21. Uzan, N.E.; Ramati, S.; Shneck, R.; Frage, N.; Yeheskel, O. On the effect of shot-peening on fatigue resistance of AlSi10Mg specimens fabricated by additive manufacturing using selective laser melting (AM-SLM). Addit. Manuf. 2018, 21, 458–464. [Google Scholar] [CrossRef]
  22. Uzan, N.E.; Shneck, R.; Yeheskel, O.; Frage, N. Fatigue of AlSi10Mg specimens fabricated by additive manufacturing selective laser melting (AM-SLM). Mater. Sci. Eng. A 2017, 704, 229–237. [Google Scholar] [CrossRef]
  23. Casati, R.; Nasab, M.H.; Coduri, M.; Tirelli, V.; Vedani, M. Effects of platform pre-heating and thermal-treatment strategies on properties of Alsi10mg alloy processed by selective laser melting. Metals 2018, 8, 954. [Google Scholar] [CrossRef]
  24. Thompson, A.; Senin, N.; Maskery, I.; Körner, L.; Lawes, S.; Leach, R. internal surface measurement of metal powder bed fusion parts. Addit. Manuf. 2018, 20, 126–133. [Google Scholar] [CrossRef]
  25. International Organization for Standardization. ISO 25178-2: Geometrical Product Specifications (GPS)—Surface Texture: Areal Part 2: Terms, Definitions and Surface Texture Parameters; International Organization for Standardization: Geneva, Switzerland, 2007. [Google Scholar]
  26. Thijs, L.; Kempen, K.; Kruth, J.P.; Van Humbeeck, J. Fine-structured aluminium products with controllable texture by selective laser melting of pre-alloyed AlSi10Mg powder. Acta Mater. 2013, 61, 1809–1819. [Google Scholar] [CrossRef] [Green Version]
  27. Zhang, J.; Song, B.; Wei, Q.; Bourell, D.; Shi, Y. A Review of selective laser melting of aluminum alloys: Processing, microstructure, property and developing trends. J. Mater. Sci. Technol. 2019, 35, 270–284. [Google Scholar] [CrossRef]
  28. Bernevig-Sava, M.A.; Stamate, C.; Lohan, N.M.; Baciu, A.M.; Postolache, I.; Baciu, C.; Baciu, E.R. Considerations on the Surface Roughness of SLM Processed Metal Parts and the Effects of Subsequent Sandblasting. In IOP Conference Series: Materials Science and Engineering; IOP Publishing: Bristol, UK, 2019. [Google Scholar]
  29. Fathi, P.; Mohammadi, M.; Duan, X.; Nasiri, A.M. Effects of Surface Finishing Procedures on Corrosion Behavior of DMLS-AlSi10Mg_200C Alloy Versus Die-Cast A360.1 Aluminum. JOM 2019, 71, 1748–1759. [Google Scholar] [CrossRef]
  30. Summerscales, J. Composites Manufacturing for Marine Structures; Woodhead Publishing: Cambridge, UK, 2015. [Google Scholar]
  31. Santecchia, E.; Hamouda, A.M.S.; Musharavati, F.; Zalnezhad, E.; Cabibbo, M.; El Mehtedi, M.; Spigarelli, S. A Review on fatigue life prediction methods for metals. Adv. Mater. Sci. Eng. 2016. [Google Scholar] [CrossRef]
  32. Bagherifard, S.; Beretta, N.; Monti, S.; Riccio, M.; Bandini, M.; Guagliano, M. On the fatigue strength enhancement of additive manufactured AlSi10Mg parts by mechanical and thermal post-processing. Mater. Des. 2018, 145, 28–41. [Google Scholar] [CrossRef]
  33. AlMangour, B.; Yang, J.M. Improving the surface quality and mechanical properties by shot-peening of 17-4 stainless steel fabricated by additive manufacturing. Mater. Des. 2016, 110, 914–924. [Google Scholar] [CrossRef]
  34. Bayoumi, M.R.; Abdellatif, A.K. Effect of surface finish on fatigue strength. Eng. Fract. Mech. 1995, 51, 861–870. [Google Scholar] [CrossRef]
  35. Moussaoui, K.; Mousseigne, M.; Senatore, J.; Chieragatti, R. The effect of roughness and residual stresses on fatigue life time of an alloy of titanium. Int. J. Adv. Manuf. Technol. 2015, 78, 557–563. [Google Scholar] [CrossRef]
  36. Tardi, D.; Gli, Y.; Chan, K.H.K.; Blunt, L.; Bache, M.R. Surface topography and the impact on fatigue performance. Surf. Topogr. Metrol. Prop. 2015, 3, 015007. [Google Scholar]
  37. Townsend, A.; Senin, N.; Blunt, L.; Leach, R.K.; Taylor, J.S. Surface Texture Metrology for Metal Additive Manufacturing: A Review. Precis. Eng. 2016, 46, 34–47. [Google Scholar] [CrossRef]
  38. Khairallah, S.A.; Anderson, A.T.; Rubenchik, A.M.; King, W.E. Laser powder-bed fusion additive manufacturing: Physics of complex melt flow and formation mechanisms of pores, spatter, and denudation zones. Acta Mater. 2017, 108, 36–45. [Google Scholar] [CrossRef]
  39. Taheri Andani, M.; Dehghani, R.; Karamooz-Ravari, M.R.; Mirzaeifar, R.; Ni, J. A study on the effect of energy input on spatter particles creation during selective laser melting process. Addit. Manuf. 2018, 20, 33–34. [Google Scholar] [CrossRef]
  40. Bidare, P.; Bitharas, I.; Ward, R.M.; Attallah, M.M.; Moore, A.J. Fluid and particle dynamics in laser powder bed fusion. Acta Mater. 2018, 142, 107–120. [Google Scholar] [CrossRef]
  41. Beevers, E.; Brandão, A.D.; Gumpinger, J.; Gschweitl, M.; Seyfert, C.; Hofbauer, P.; Rohr, T.; Ghidini, T. Fatigue properties and material characteristics of additively manufactured AlSi10Mg—Effect of the contour parameter on the microstructure, density, residual stress, roughness and mechanical Properties. Int. J. Fatigue 2018, 117, 148–162. [Google Scholar] [CrossRef]
  42. Yamashita, Y.; Murakami, T.; Mihara, R.; Okada, M.; Murakami, Y. Defect analysis and fatigue design basis for Ni-based superalloy 718 manufactured by selective laser melting. Int. J. Fatigue 2018, 117, 485–495. [Google Scholar] [CrossRef]
  43. Beretta, S.; Anderson, C.; Murakami, Y. Extreme value models for the assessment of steels containing multiple types of inclusion. Acta Mater. 2006, 54, 2277–2289. [Google Scholar] [CrossRef]
Figure 1. Technical drawing of the AlSi10Mg tensile and fatigue specimens (ISO 1099:2017).
Metals 09 01063 g001
Figure 2. Microstructure of the investigated AlSi10Mg alloy. (a) Optical image of the melt tracks; (b) scanning electron microscope (SEM) image of the melt pool boundaries, and (c) of the melt pool center.
Metals 09 01063 g002
Figure 3. Surface morphology of the as-built AlSi10Mg specimens. (a) SEM view of side surface; (b) optical micrograph of a cross-sectioned sample showing a view of surface profile; the build direction (z-axis) is horizontal.
Metals 09 01063 g003
Figure 4. Surface morphology of the sandblasted (SB) specimens. (a,b) SEM views of the top surface; (c,d) optical micrographs of a cross-sectioned sample showing a view of the surface profile.
Metals 09 01063 g004
Figure 5. Surface morphology of the vibro-finished (VF) specimens. (a,b) SEM views of the top surface; (c) optical micrograph of a cross-sectioned sample showing a view of the surface profile.
Metals 09 01063 g005aMetals 09 01063 g005b
Figure 6. Surface morphology of the machined and polished (MP) specimens. (a,b) SEM views of the top surface.
Metals 09 01063 g006
Figure 7. Topographies of the specimens measured by the confocal microscopy: (a) as-built; (b) SB; (c) VF; (d) MP.
Metals 09 01063 g007
Figure 8. Nano-indentation profiles for the different surface conditions investigated; origin of distance corresponds to the surface of the specimen.
Metals 09 01063 g008
Figure 9. Tensile curves of the L-PBF AlSi10Mg alloy with a platform temperature of 160 °C.
Metals 09 01063 g009
Figure 10. Effect of surface condition on fatigue curves of the L-PBF AlSi10Mg alloy.
Metals 09 01063 g010
Figure 11. Views of fatigue fracture surfaces of MP samples loaded at a maximum stress of (a) 185 MPa, (b) 205 MPa, (c) 225 MPa, and (d) 245 MPa.
Metals 09 01063 g011
Figure 12. Fracture surface of a VF sample failed at the maximum stress of 95 MPa; (a) general view; (b) main crack nucleation site.
Metals 09 01063 g012
Figure 13. Fracture surface of a VF sample failed at a maximum stress of 175 MPa; (a) main crack nucleation site (arrowed); (b,c) secondary multiple crack nucleation sites.
Metals 09 01063 g013
Figure 14. Fracture surfaces of SB samples failed at maximum stress level of 175 MPa; (a,b) the specimen failed by crack nucleation from a subsurface defect; (c,d) the specimen failed by crack nucleation from a surface defect.
Metals 09 01063 g014
Figure 15. Fracture surfaces of the MP samples: (a,b) failed at the maximum stress of 215 MPa; (c,d) failed at the maximum stress of 195 MPa.
Metals 09 01063 g015aMetals 09 01063 g015b
Figure 16. Fracture surface of a SB specimen failed at maximum stress level of 155 MPa. (a) Interface between region II and III of crack propagation; (b) high magnification view of small pores interacting with crack growth front in region II; (c) deeper ridges and (d) micro-dimples detected in region III.
Metals 09 01063 g016aMetals 09 01063 g016b
Table 1. Parameters adopted for the laser powder bed fusion (L-PBF) processing of the AlSi10Mg samples.
Power (W)Hatch Distance (mm)Scan Rate (mm/s)Layer Thickness (mm)Platform Temp. (°C)
3400.213000.03160
Table 2. Relative density of the investigated AlSi10Mg specimens processed by L-PBF after various surface finishes.
Relative DensityVibro-Finished (VF)Sandblasted (SB)Machined and Polished (MP)
Density (%)99.58 ± 0.0299.71 ± 0.0199.71 ± 0.01
Table 3. Areal surface roughness values of the investigated alloy after the different surface finishing methods.
Surface ConditionSa (µm)Sv (µm)Ssk
As-Built15.4850.74
SB8.340−0.13
VF2.3121−7.31
MP0.560.05
Table 4. Tensile properties of the L-PBF processed AlSi10Mg alloy.
UTS (N/mm2)0.2 YS (N/mm2)Strain at Fracture (%)
412 ± 5.5228 ± 4.17.0 ± 0.1
UTS: ultimate tensile strength, YS: 0.2% offset yield strength.
Table 5. Calculated fatigue limits and fitting parameters according to Basquin’s equation for the different surface conditions of the L-PBF AlSi10Mg alloy.
Surface ConditionBLog (A)Fatigue Limit (MPa)
As-Build--50–62 [16,22,32]
SB−0.06 ± 0.0062.24 ± 0.03152.5 ± 3.5
VF−0.17 ± 0.012.68 ± 0.0795.0 ± 4.5
MP−0.05 ± 0.0062.24 ± 0.04194.0 ± 10.0

