Hot Deformation Behavior and Mechanistic Understanding of New TF400 Titanium Alloy

1
Tech Institute for Advanced Materials and College of Materials Science and Engineering, Nanjing Tech University, Nanjing 211816, China
2
The Aragon Materials Science Institute, University of Zaragoza, 50009 Zaragoza, Spain
3
Jiangsu Collaborative Innovation Center for Advanced Inorganic Function Composites, Nanjing Tech University, Nanjing 211816, China
*
Authors to whom correspondence should be addressed.
Metals 2019, 9(12), 1277; https://doi.org/10.3390/met9121277
Submission received: 21 October 2019
/
Revised: 21 November 2019
/
Accepted: 25 November 2019
/
Published: 28 November 2019
Abstract
:The isothermal hot compression behavior of new Ti–Fe–B (named as TF400) alloy was investigated in the temperature range of 750–950 °C and strain rate range from 0.01 to 10 s−1 with the maximum height reduction of 60% by using a Gleeble 3800 thermal simulator. By considering the effect of strain via variable material parameters, a modified constitutive model was proposed to accurately predict the flow stress. The predicted results demonstrate that the flow stress decreases with the increase of temperature while it increases as the strain rate increases, in good agreement with the present experimental results. A mechanistic understanding of plastic deformation behavior in the TF400 alloys was developed by inspecting the microstructural characteristics prior to and after deformations. Dynamic recrystallization and dynamic transformation were found to be the dominant restoration mechanism during the hot deformation process.
1. Introduction
Titanium alloys have a wide range of applications owing to its low density, high strength and good corrosion resistance. However, wider applications of titanium alloys have been restricted due to their high cost and poor workability. Much effort has been made to reduce the manufacturing costs of titanium and titanium alloys [1,2,3]. Fe is a cheap and abundant element in the earth’s crust and is among those key alloying elements for efficient solid solution strengthening [4,5,6]. In titanium alloys, Fe could be added as the β stabilizer in order to improve the tensile strength and enhance the workability without clear loss of the fracture toughness [7,8,9,10]. By now, the mechanical properties of Fe–containing Ti alloys, e.g., Ti–6Al–4V–xFe (x = 0.18–0.55%) alloys, were found to meet some important industrial needs [11]. The preliminary work of our research group [12] learned that Ti–Fe alloy could have the similar strength with steel, but possesses much higher corrosion resistance than that of steel. So, it may have potential to replace steel in some industrial and marine fields. However, Ti–based alloys containing Fe as one of the main alloying elements deserve more systematic experimental explorations and mechanistic understandings.
In recent years, the combination of the physical simulation of the Gleeble thermal simulator and the constitutive model has emerged as an efficient tool to investigate the hot deformation behavior of titanium alloys, more specifically, the flow behavior was first measured by the Gleeble thermal simulator, and was then modeled by using the constitutive equation [13,14,15]. By doing this, it allows for the examination of the deformation behavior of Ti alloys to create a knowledge–oriented materials design and optimization of the processing parameters. To describe the flow behavior of different materials, the constitutive equation has been solved in three distinct forms, i.e., physical based constitutive model (PBC) [16,17,18], phenomenological constitutive model (PLC) [19,20,21], and artificial neural network (ANN) [22,23,24]. The PLC constitutive equation is effective in predicting the flow stress [25,26], wherein the Arrhenius model is conventionally used to relate the strain rate to flow stress and temperature [27,28,29,30]. The PLC constitutive equation could be powered by including the contribution of strain in the Arrhenius model to predict the flow behavior of such alloy systems as the austenitic stainless [31] and Ti–6Al–4V titanium alloy [32].
In essence, the understanding of the flow behavior of titanium alloys in hot deformation process is not straightforward, which is largely governed and complicated by their microstructure attributes [33,34]. Therefore, inspecting the microstructures prior to and after the deformation for comparison is prerequisite to a full mechanistic understanding of Ti–Fe alloys. It is well known that during the conventional hot deformation process, titanium alloys usually have dynamic recovery (DRV) and dynamic recrystallization (DRX), bringing about the evolution of microstructure of alloys [35,36,37]. Considerable researches were conducted to elaborate the change of flow stress with deformation temperature during DRV and DRX [38,39,40]. Yang et al. [41] investigated the microstructural evolution with different Zener–Hollomon (H–Z) parameters for TiAlNb alloys. Accordingly, the objectives of this paper are to experimentally investigated the hot deformation behavior of new Ti–Fe alloys by the Gleeble physical simulator, and to model the effect of strain rates and temperature on the flow stress by using the modified constitutive equation, and to develop a mechanistic understanding of plastic deformation behavior in Ti–Fe alloys by inspecting the microstructural evolution.
2. Materials and Experimental Procedures
A new alloy with the nominal composition of Ti–3Fe–0.1B (wt.%) was prepared from sponge titanium (grade 0), pure iron (99.8 wt.%), and Fe–B master alloy (99.9 wt.%). Boron was added here for grain refining. The raw ingots of 1 kg were prepared approximately at 1700 °C by vacuum suspension induction melting with a water–cooled copper crucible under the protection of argon gas atmosphere. In order to obtain a homogeneous composition of the alloy, the induction melting was repeated six times. The chemical composition was determined by using inductively coupled plasma atomic emission spectroscopy (Agilent 5110, Santa Clara, CA, USA). The corresponding results are shown in Table 1. The tensile strength of the bulk samples was previously determined to be around 400 MPa, thereafter, the alloy was named as TF400.
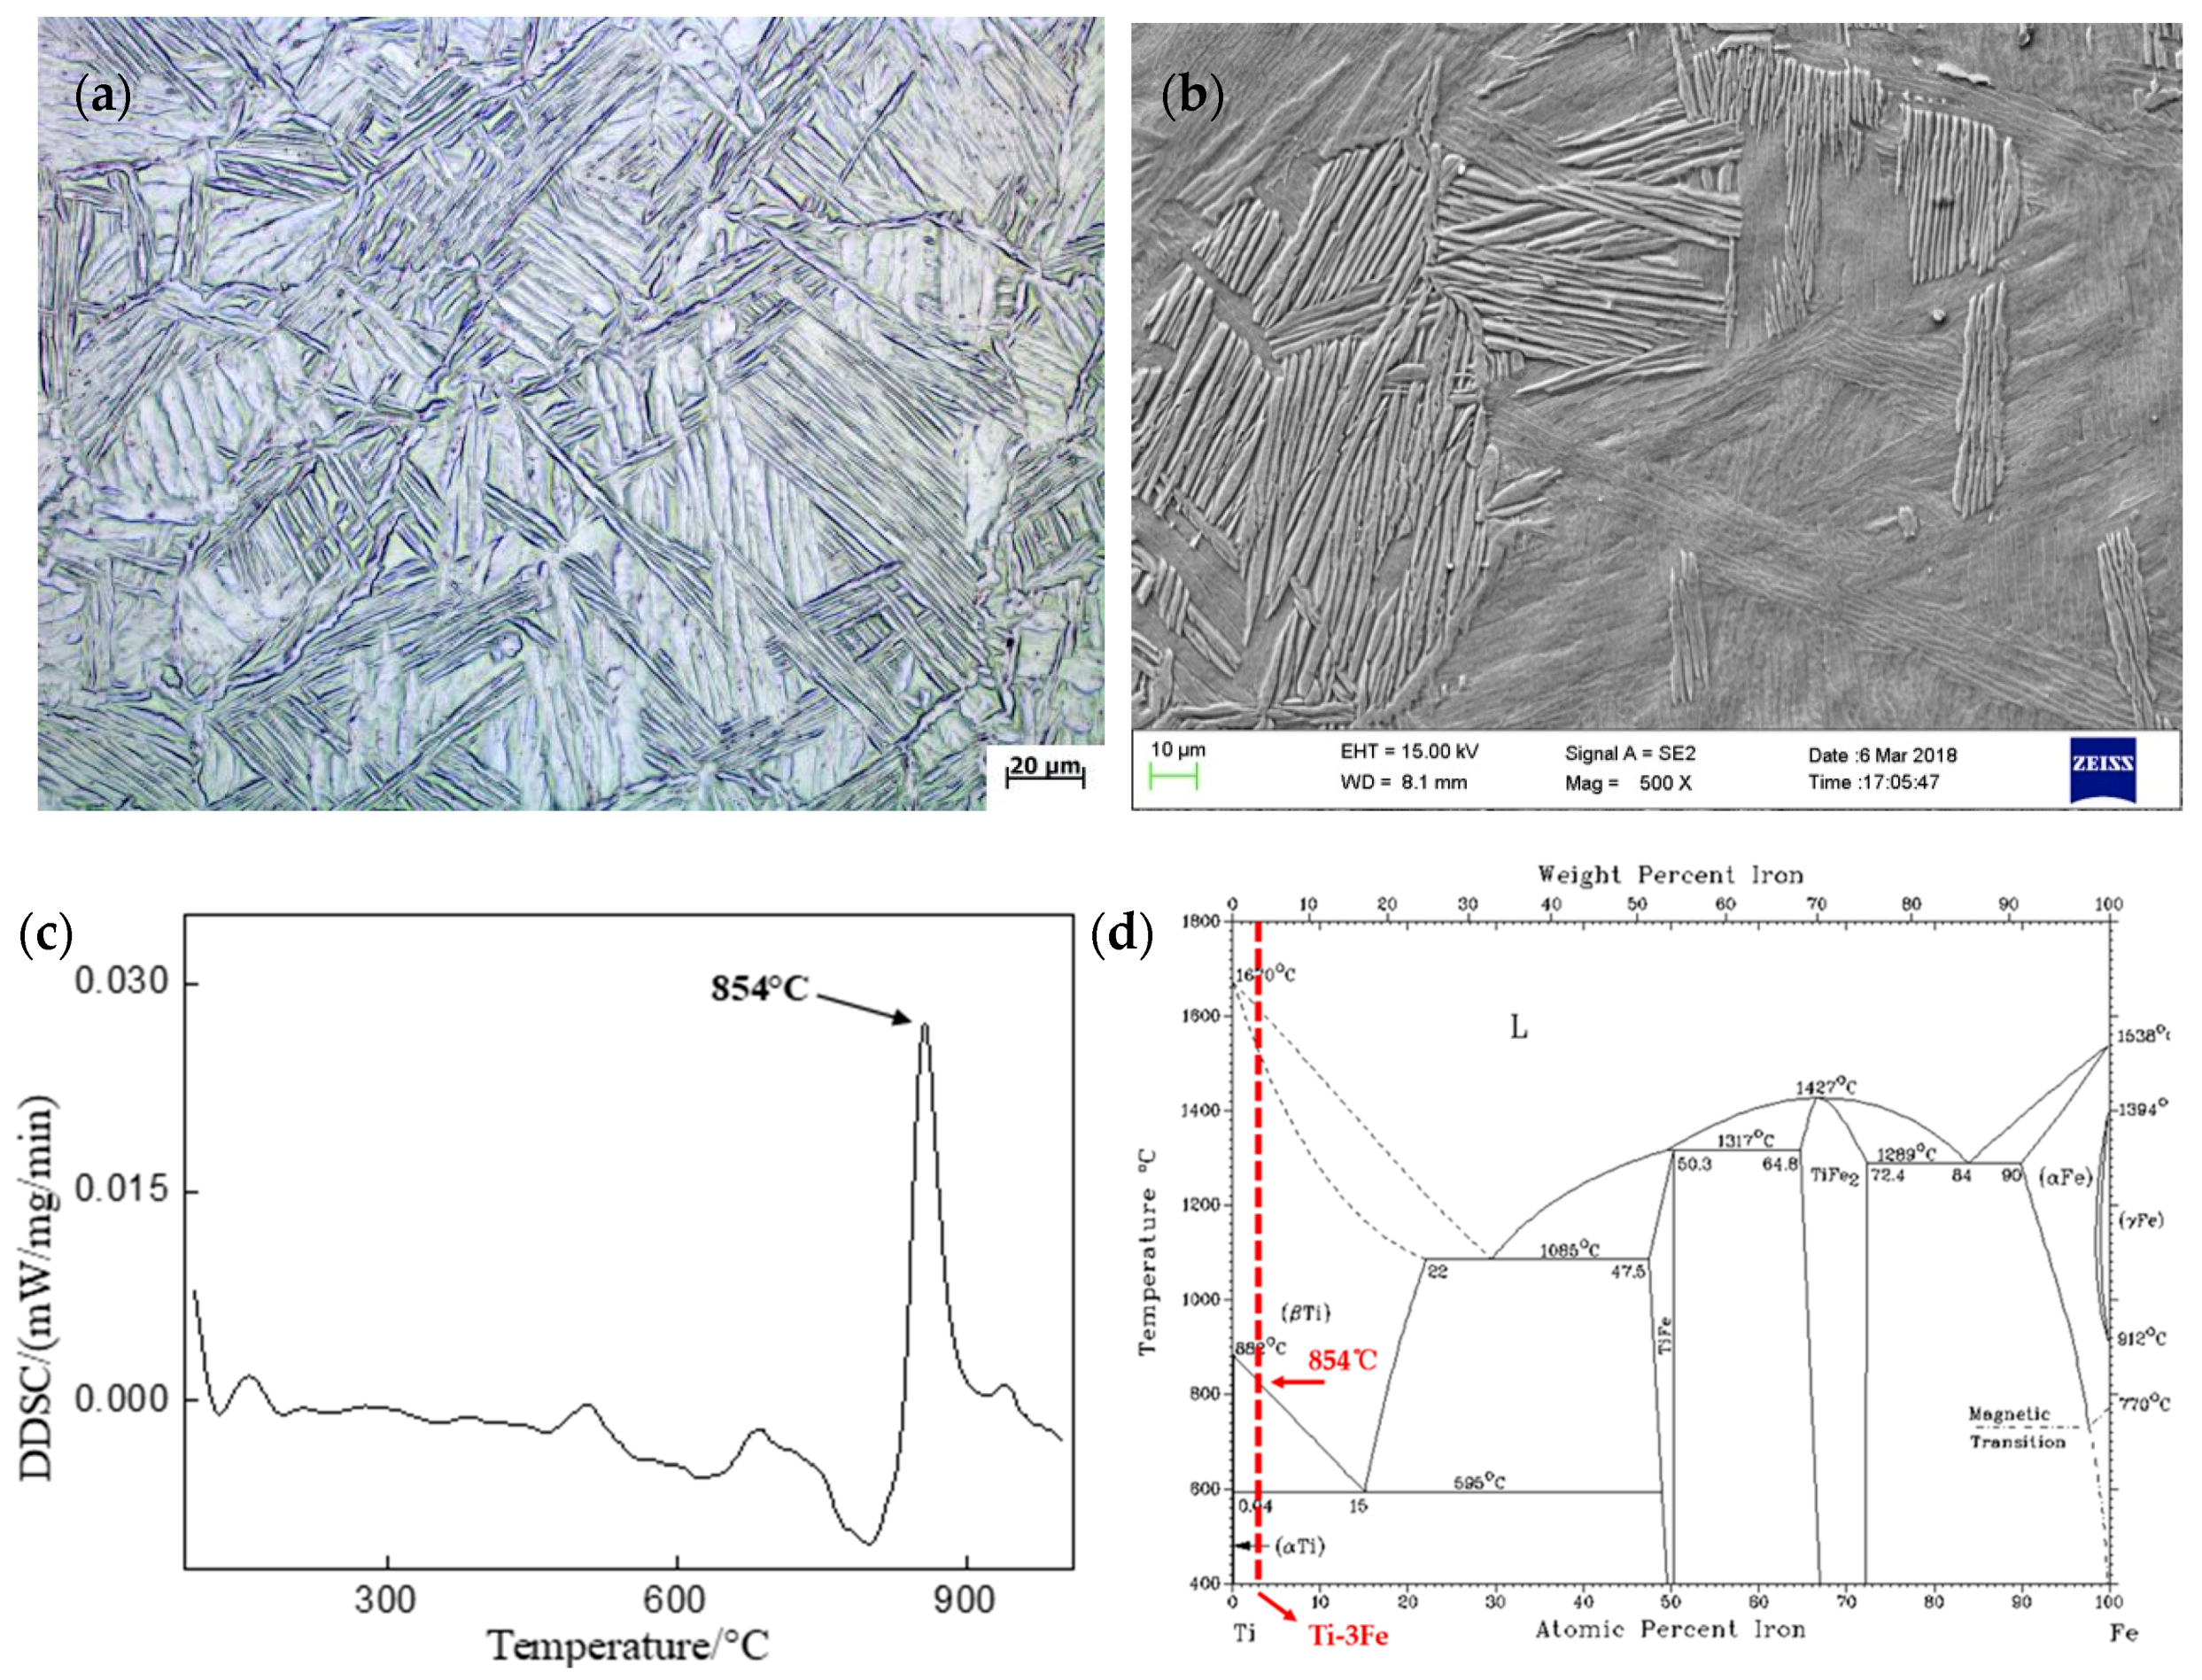
The samples for microstructure observation were prepared by using mechanical polishing and chemical etching in the Kroll’s reagent. The microstructure was examined respectively by optical microscopy (OM: ZEISS, A1M, Jena, Germany), scanning electron microscope (SEM) and transmission electron microscope (TEM: JEM2100F, Jeol, Tokyo, Japan). A twin–jet electrolyzing polisher was used to generate the foil for TEM with 30 mL perchloric acid + 170 mL butanol + 300 mL methanol as the electrolyte. The representative microstructure of cast TF400 alloys is shown in Figure 1a, exhibiting a representative basket–weave or Widmanstätten microstructure. It consists of 80% lamellar α phase and 20% β phase with the average size of lamellar α colony being around 4.2 μm, as shown in Figure 1b. By the different scanning calorimetry test by Netzsch DIL–402C (Selb, Germany) (see Figure 1c), the temperature of β transus was measured to be 854 °C.
Cylindrical samples for hot compression tests were 8.0mm in diameter and 12.0mm in height. The isothermal compression experiments were carried out by the a Gleeble 3800 (Poestenkill, NY, USA) thermal simulator at deformation temperatures from 750 to 950 °C with the interval 50 °C (covering both α+β and β phase field) and strain rates from 0.01 to 10 s−1. According to Figure 1d, the temperature covers both α+β and β phase fields; the composition of this new TF400 alloy is highlighted in red. All specimens were heated up to the corresponding deformation temperature with a heating rate of 10 °C·s−1 and held for 5 min in order to eliminate the effect of local temperature difference before deformation. After hot deformation with height reduction of 70%, the specimens were immediately quenched into water to retain the deformed microstructure at high temperature. Metallographic examination was conducted on the specimens parallel to the compression axis.
3. Results
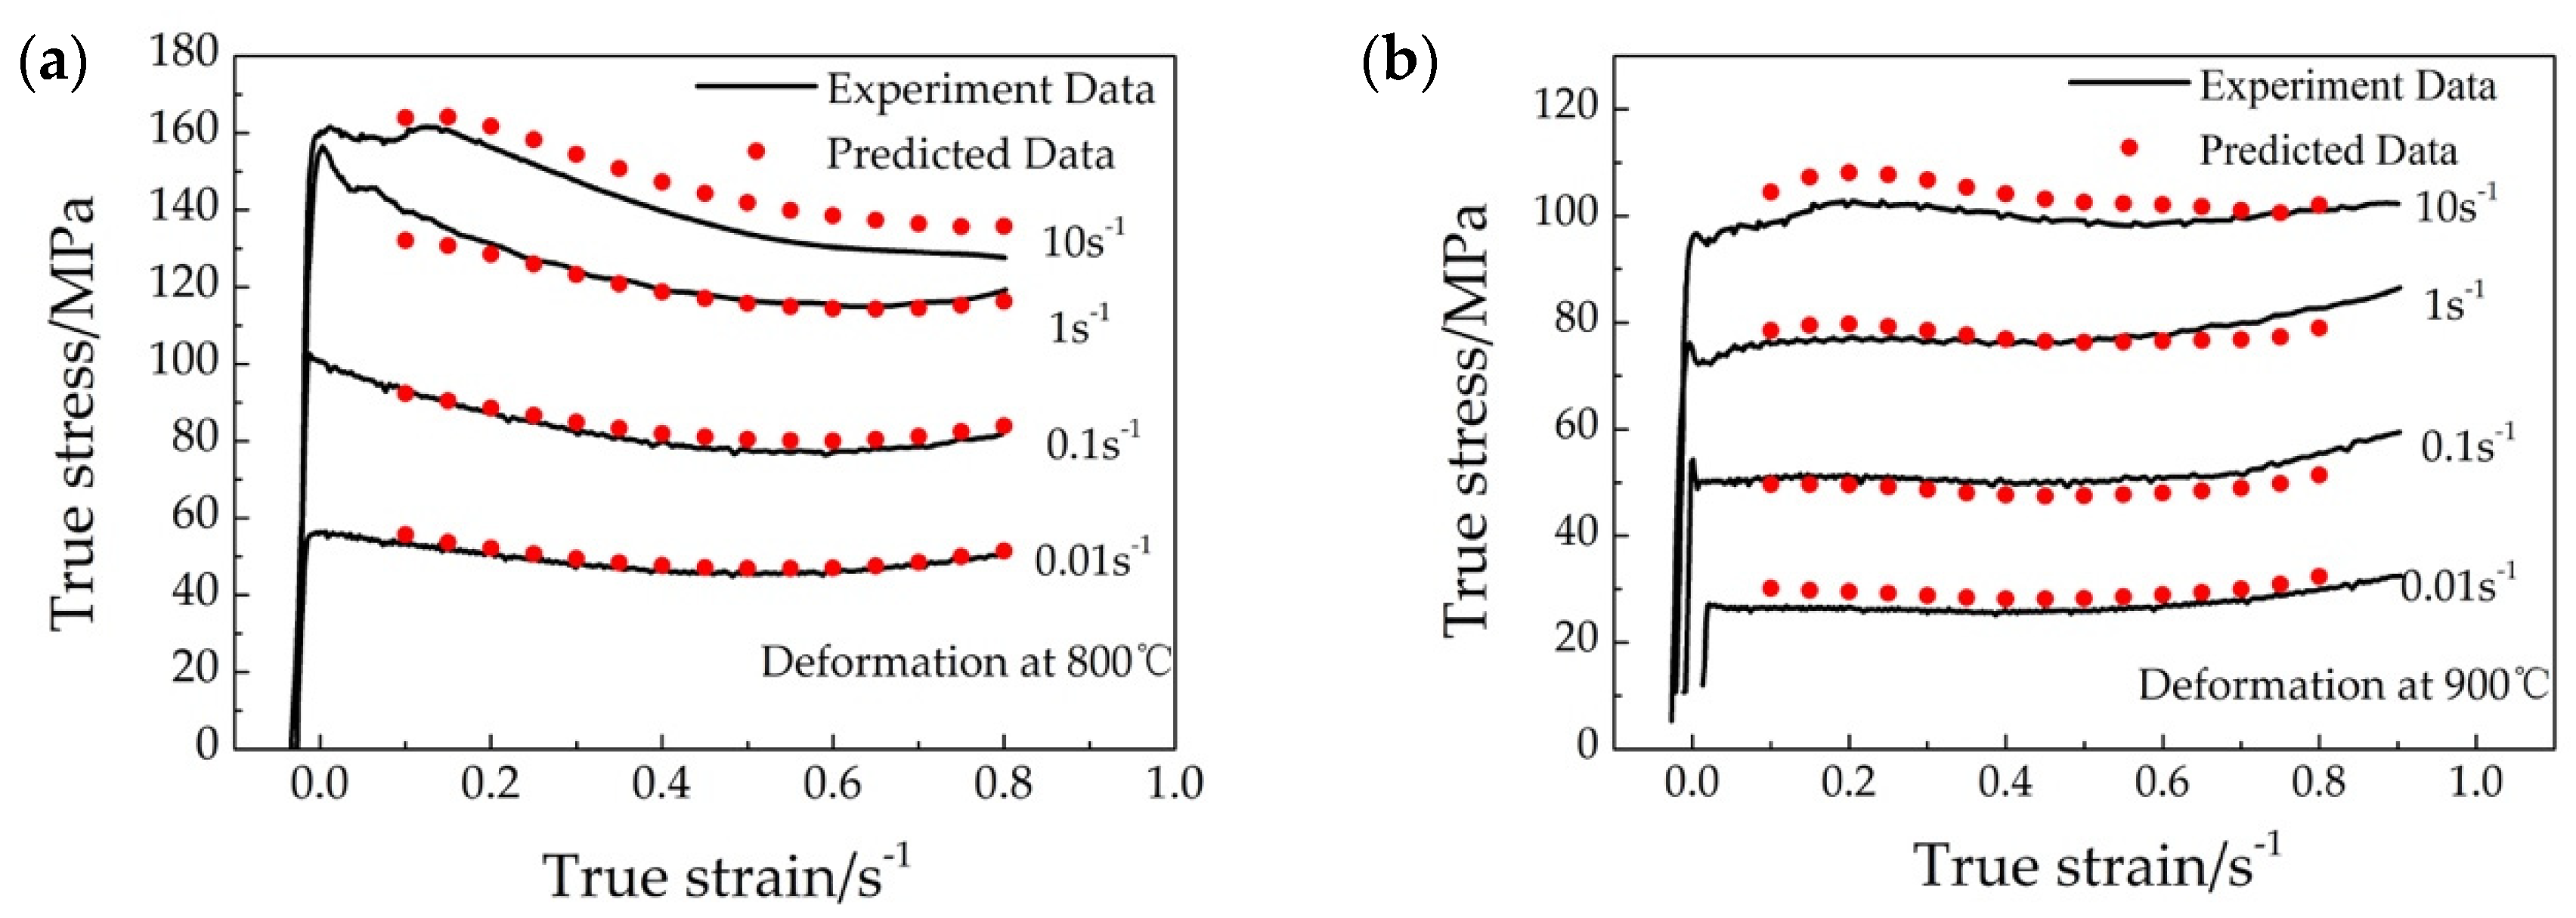
The stress–strain curves of TF400 alloy with the microstructure of α+β phase at 800 °C and single β–phase at 900 °C are shown in Figure 2a,b, respectively, in a signature shape of conventional titanium alloys with basket–weave microstructure.
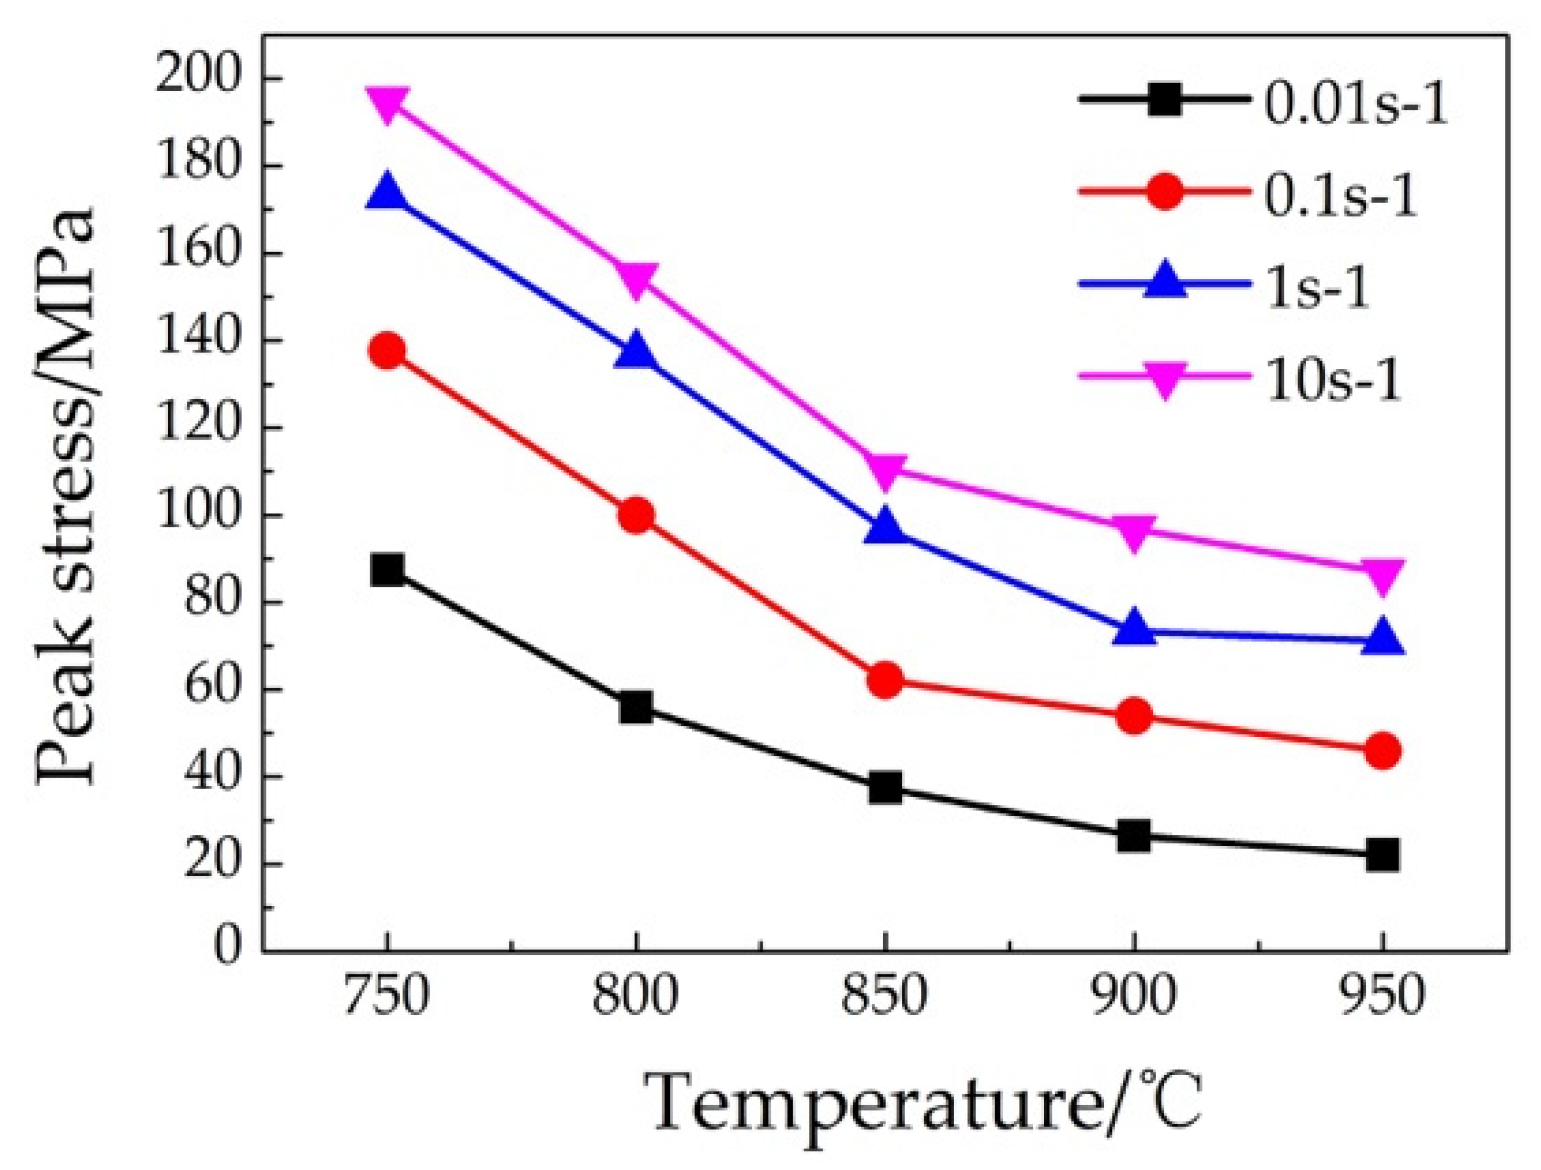
It is noteworthy to mention that a decrease followed the peak of the stress, and it only happened in 800 °C in Figure 2a. This flow softening phenomenon was named as dynamic transformation during the harder α progressively giving its way to the softer β. As pointed out by Koike et al. [42] and Jonas et al. [43], the dynamic transformation took place when the temperature is below the β transus, and the driving force for such transformation is the difference of the flow stress between the work hardened α at the critical stress and the yield stress of the fresh β phase that takes its place [44,45]. It is a different situation for curves under 900 °C, as shown in Figure 2b—the flow stress abruptly increased to the peak stress arising from work hardening, and it was followed by a gradual decrease (i.e., flow softening) due to the dynamic recovery and dynamic recrystallization, and in a final stage, the balance was reached between working hardening and dynamic softening with the large strain that led to a plateau of stress. It is also noticed that the higher temperature or the lower strain rate at which the deformations were performed, lower flow stress occurred, owing to the enhanced movement and annihilation of dislocations by raising the temperature or elongated time for energy accumulation at the low strain rate, respectively. Figure 3 illustrates in detail the decrease of the peak stress of TF400 alloy with increasing the deformation temperatures and decreasing the strain rates, with the largest and smallest peak stresses being 195.3 MPa at 750 °C 10 s−1 and 21.8 MPa at 950 °C 0.01 s−1, respectively.
4. Discussion
4.1. Constitutive Equation with Zener–Hollomon Parameter
The flow behavior during hot deformation processing of TF400 alloy could be described and modeled by the constitutive equation. In the constitutive model, the Zener–Hollomon parameter Z is widely used and expressed in an exponential formula, i.e.,
where R is the gas constant (8.3145 J·mol−1K−1), T is the absolute temperature (K), is the strain rate (s−1), and Q is the activation energy (kJ·mol−1). It hence yields an Arrhenius relation between the temperature, strain rate and flow stress, i.e.,
in which,
where A1, A2, A3, β, n1, n, and α (=β/n1) are material constants. As the extraction of the steady state stress is not straightforward and is subjected to large uncertainty associated with such affecting factors as adiabatic heating, the peak stress σp is chosen is this work. Substituting the peak stress in Equations (3)–(5) and taking it natural logarithm, it reads
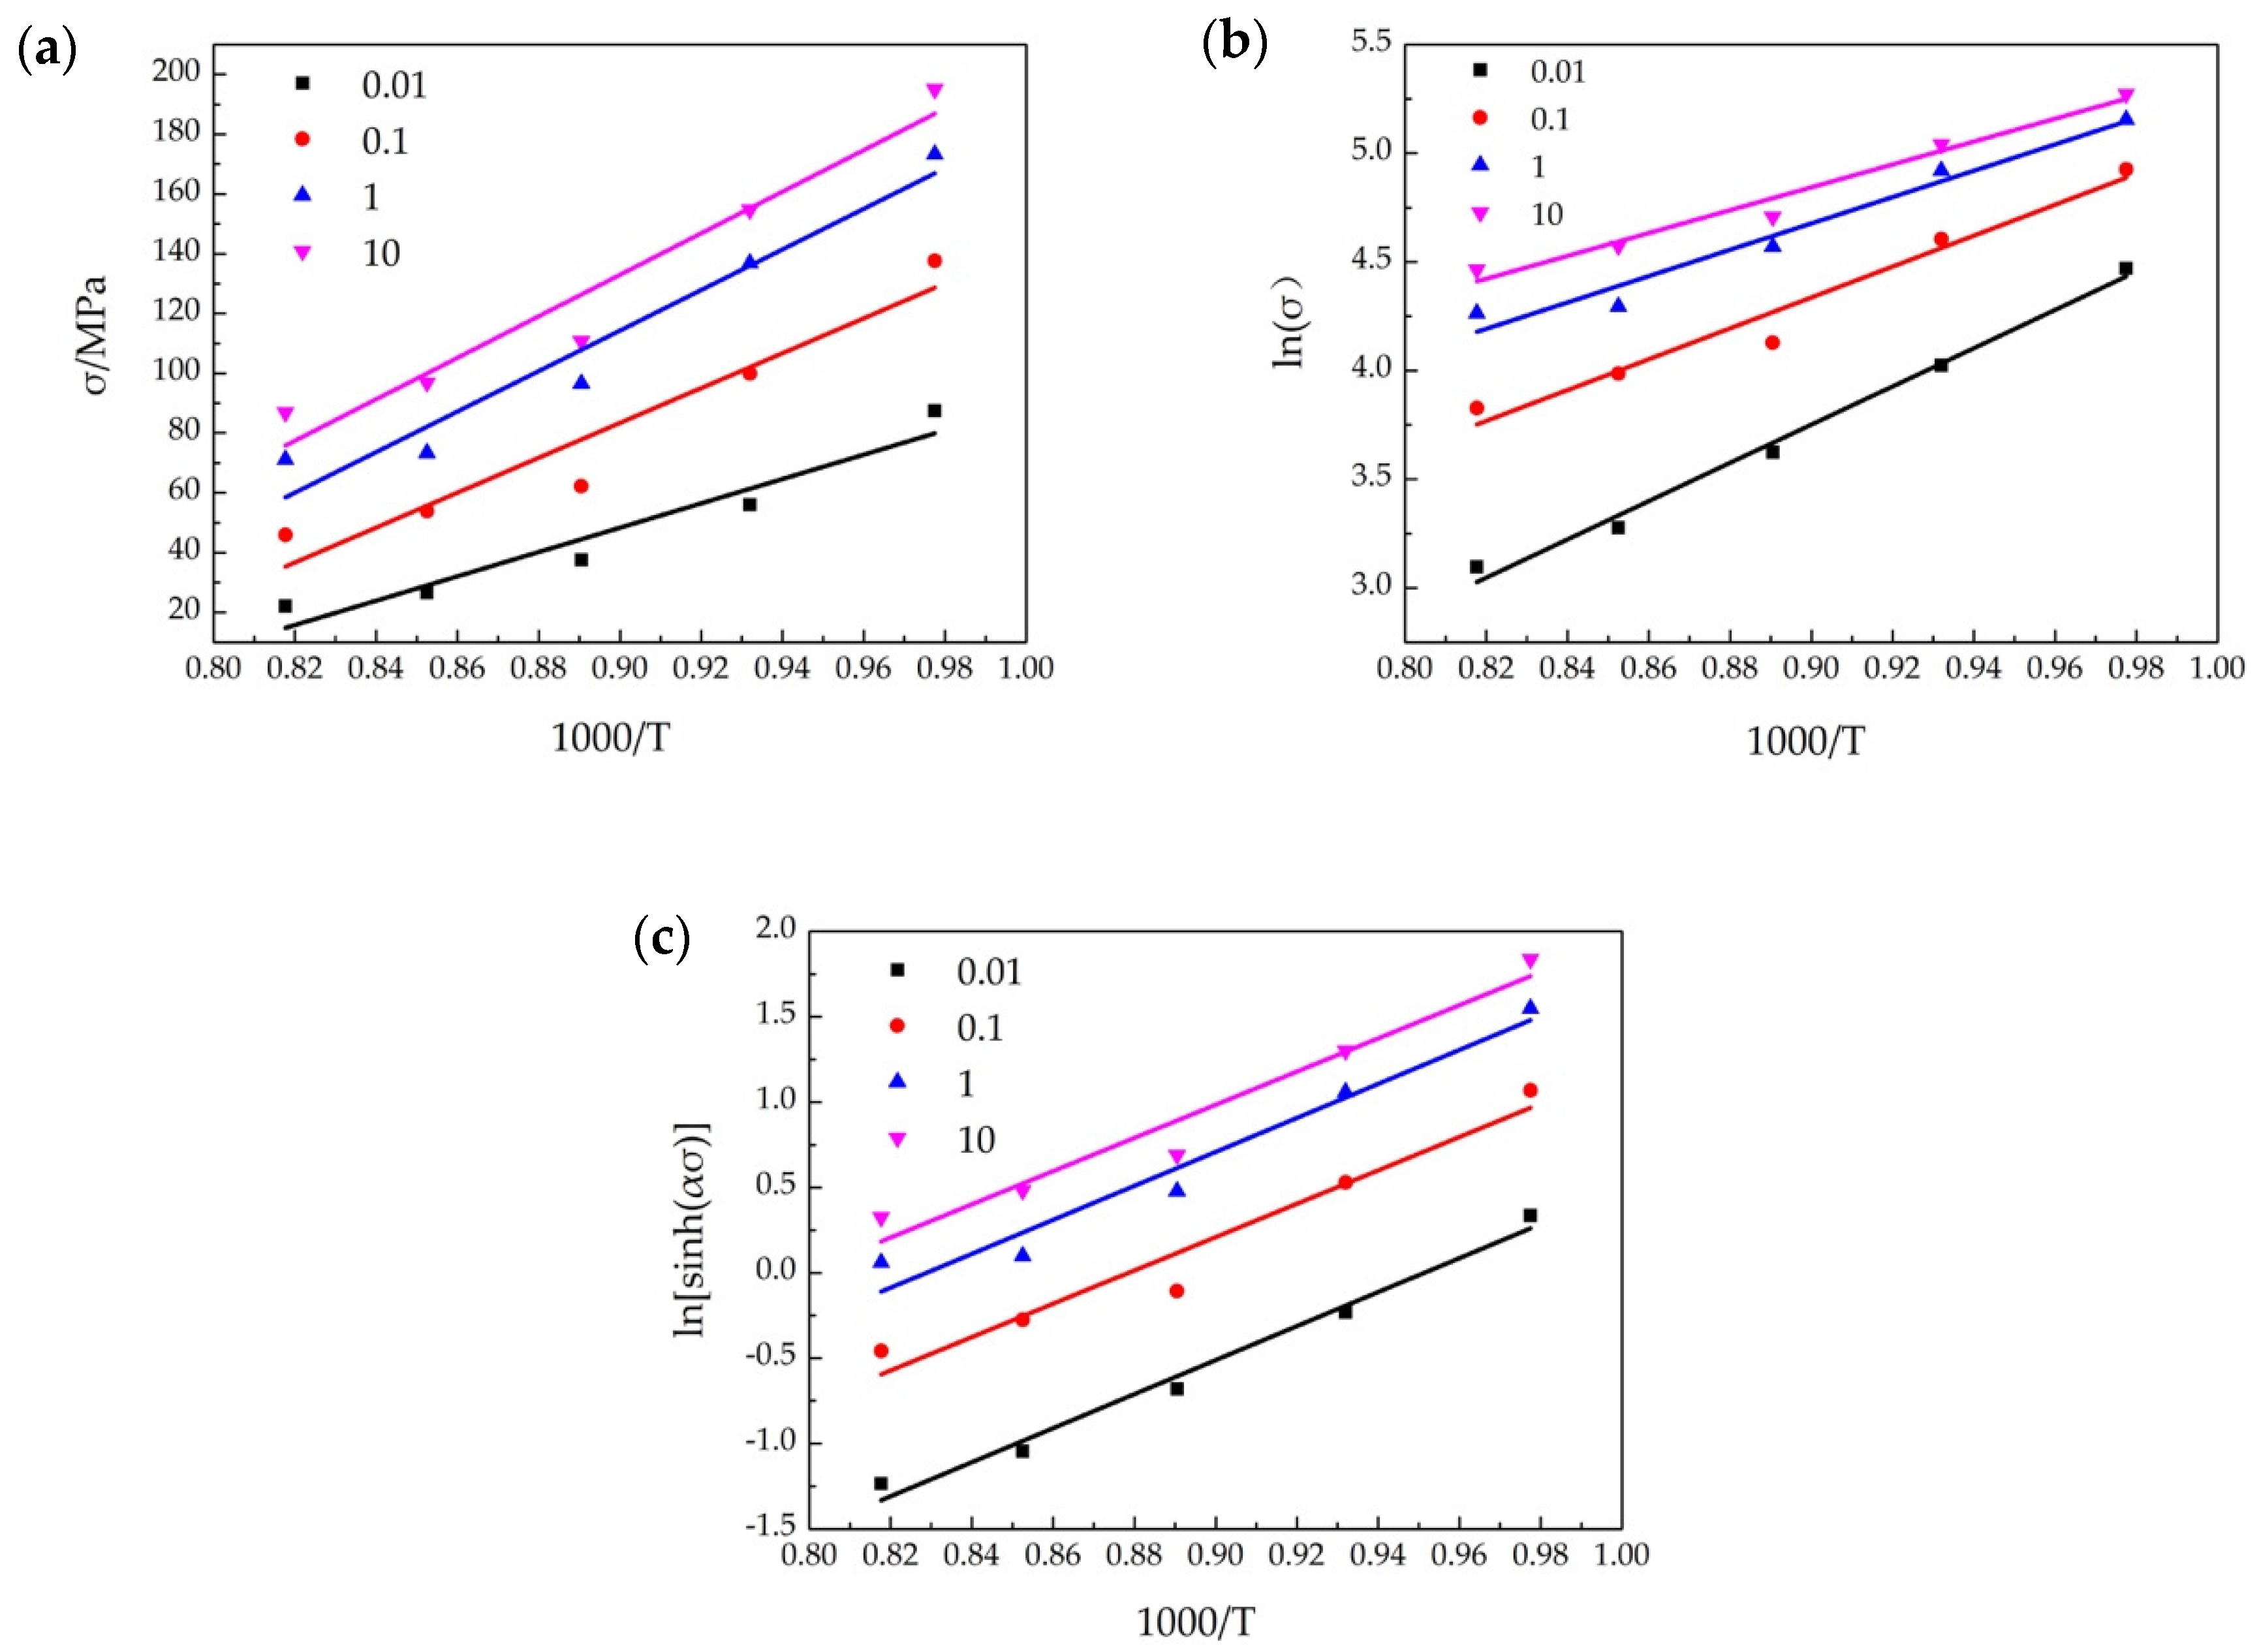
The parameters β and n1 could be obtained by linear regression fitting to the σp− ln έ relation (Equation (6)) and ln σp− ln έ (Equation (7)), respectively, likewise, n and lnA3 are from the fitting to ln[sinh(ασ)] − ln έ (Equation (8)). The fitted line plots are illustrated in Figure 4, indicating that a linear relation of fitting is clearly adequate.
Taking partial derivative to Equations (6)–(8), with respect to the stress while holding the strain constant, it reads
By applying a fitting scheme with the peak stress, Equations (9)–(11) allows the activation energy of deformation Q to be extracted at different temperatures and strain rates [46]; see example plots in Figure 5. It was found that the variation of the extracted activation energies of hot deformation with the conditions is minor, leading to an average Q of 387.77 kJ·mol−1.
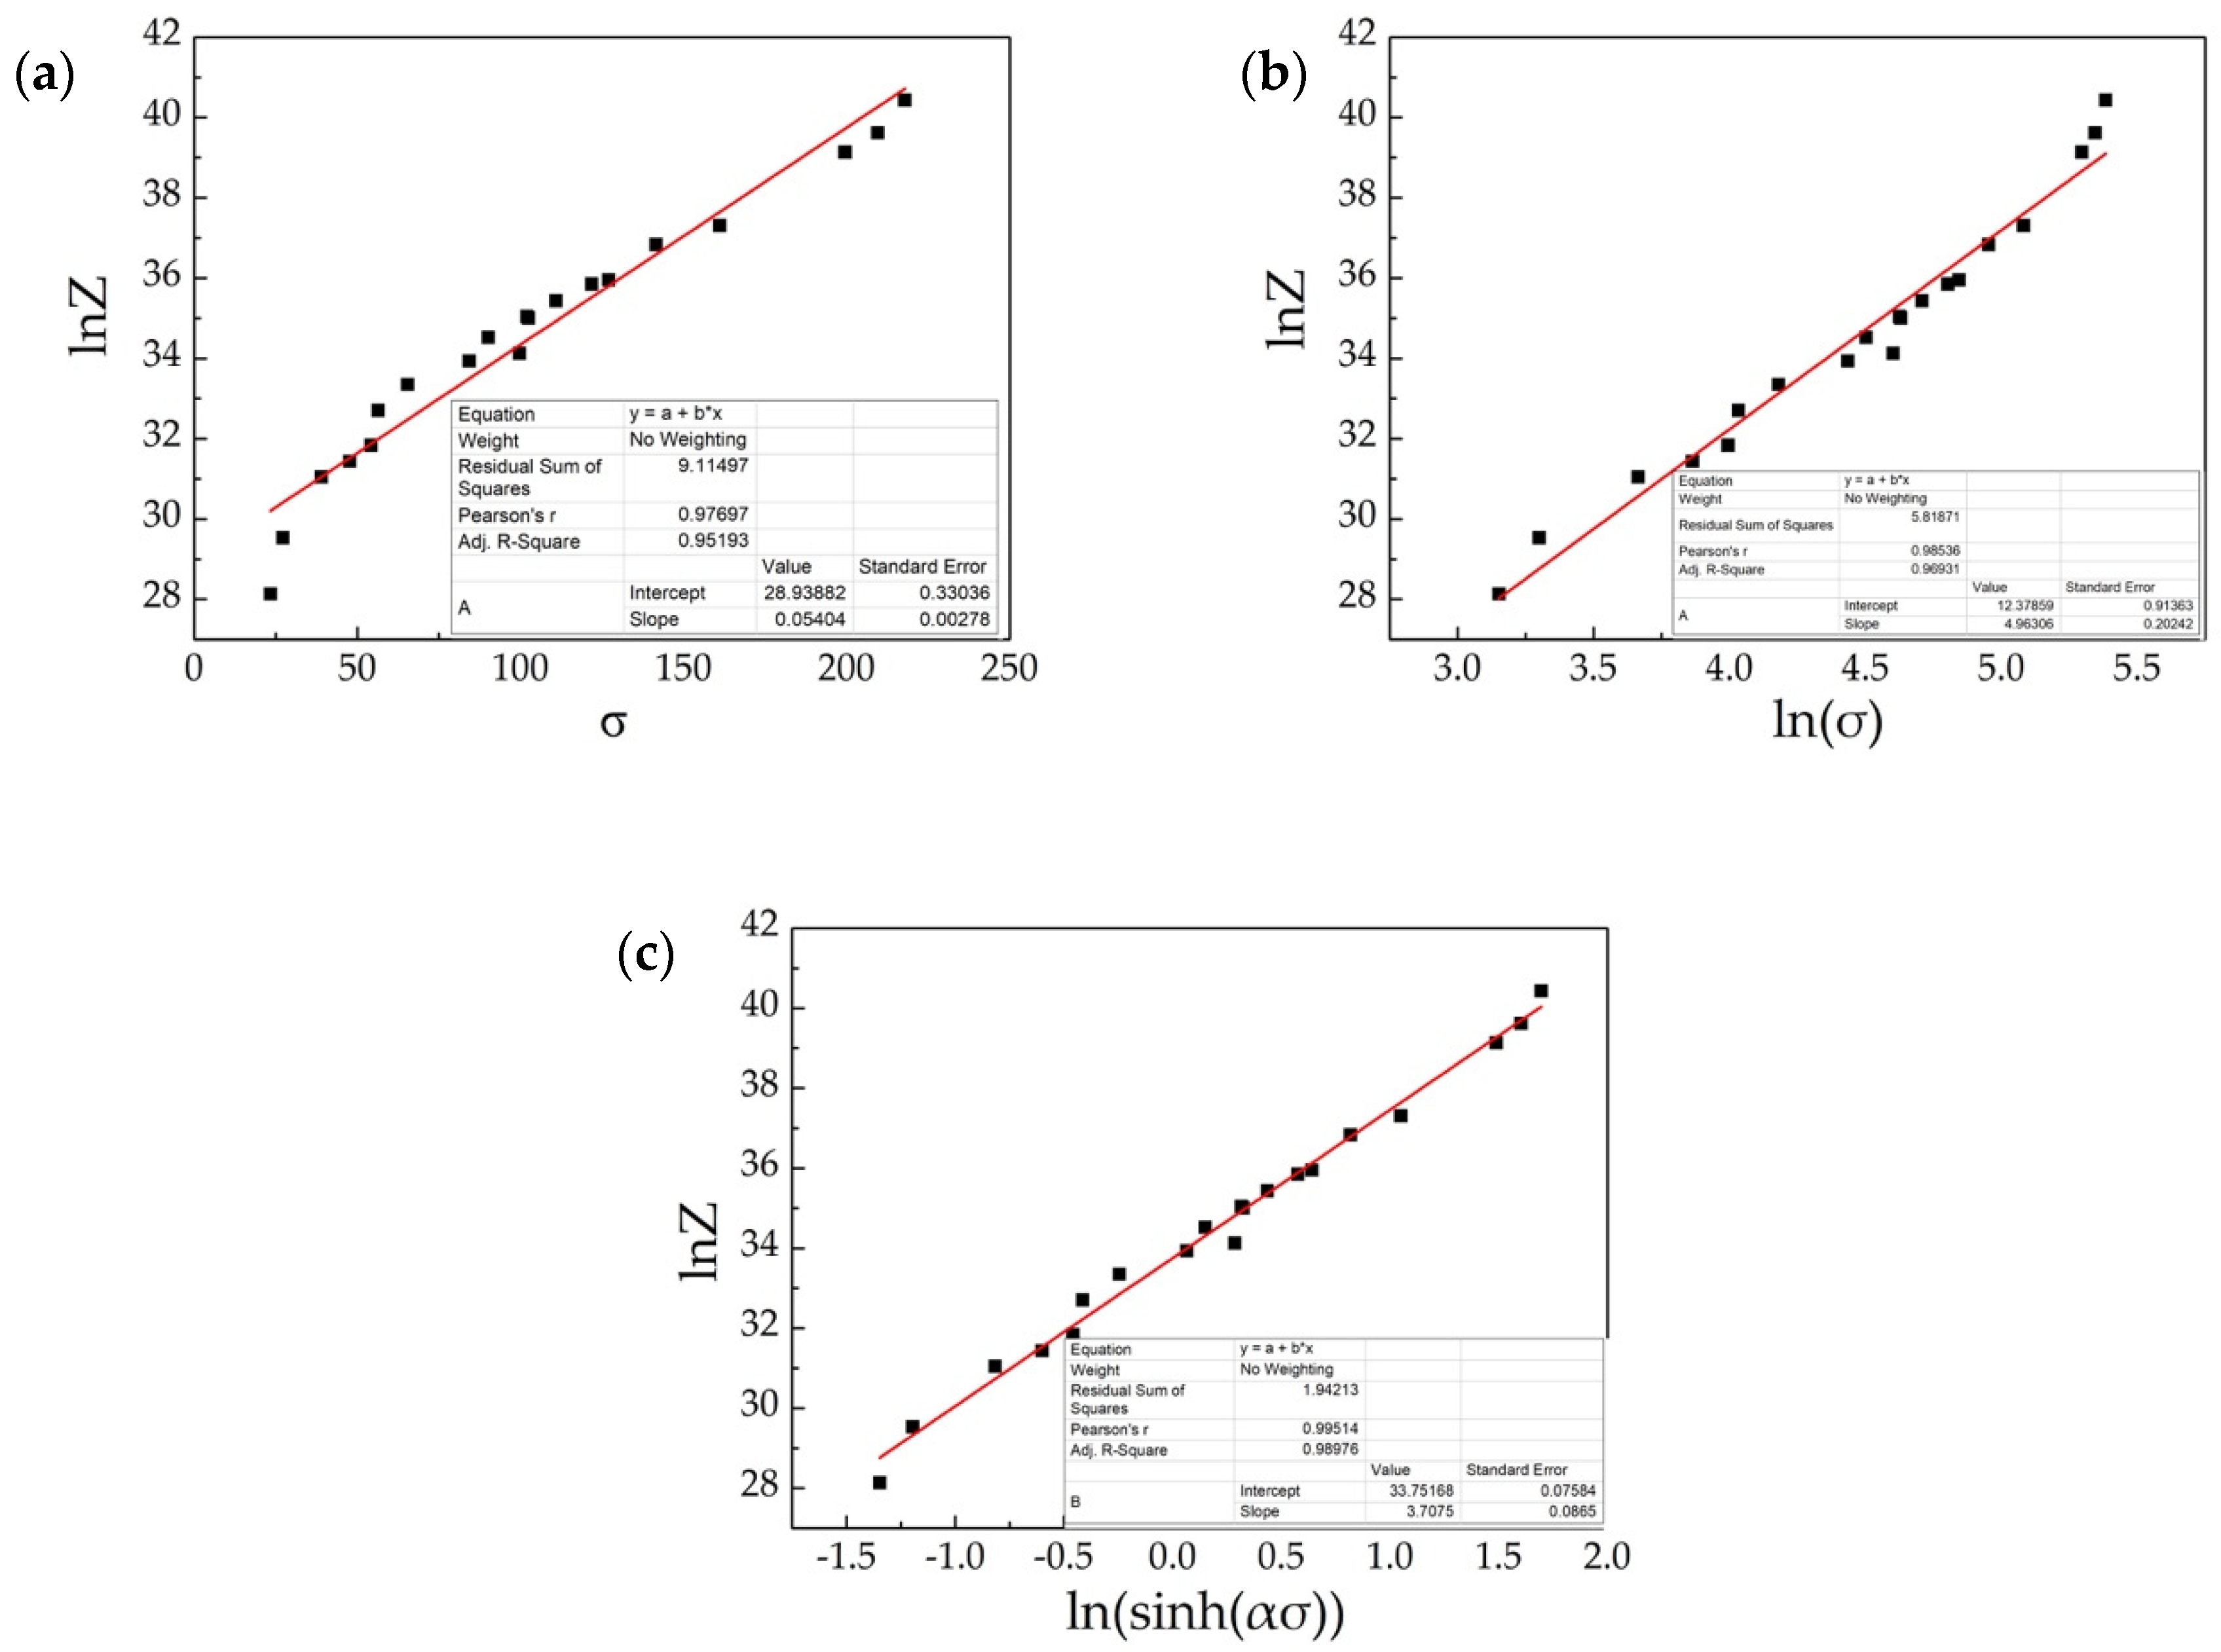
As the activation energy Q of the deformation has been derived from Equations (9)–(11), substituting it to Equation (1) will yield Z. It is in Figure 6 that the curves of lnZ are plotted versus σp, ln σp and ln sinh(ασp), respectively. The solid lines were calculated by using the average Q = 387.77 kJ·mol−1 as the baseline. Figure 6 shows that the hyperbolic sine equation has an appropriate linear relation and the highest adjusted R2, together with the corresponding material constants and the fitted parameters in Table 2, the relation between Z and σp could be derived as
4.2. Variable Material Parameters in Constitutive Equation
As pointed out by Cai et al. [32] and Luo et al. [47] the strain ε could have a significant influence on flow stress at higher temperature as well, it will be thus helpful to consider it in the constitutive equation. As demonstrated in Figure 4 and Figure 5, ln σ − ln έ has a linear relation (Equation (13)) by fixing the deformation temperatures, and lnσ is also linear to 1000/T at the fixed strain rate (Equation (14)). Combining these two equations, it yields a new multivariate relation Equation (15)
Expressing the variable material parameters M, N and P in the seven–degree polynomials in the strain (see Table 3), it enables an excellent description of the material parameters varying with the true strain of the TF400 alloy under all different deformation conditions, as shown in Figure 7.
The modified multivariable constitutive model has been utilized to predict the flow stresses of TF400 alloys with different microstructures, i.e., α+β at 800 °C and β at 900 °C at different strain rates in Figure 8, see the red symbols at different strains during the compression. As can be seen, the agreement between the experimental and predicted stress values is good, especially at low strain rates. In addition, the correlation coefficient (R) and average absolute relative error (AARE) have been applied to describe the error distribution analysis, i.e.,
where Ei is the experimental value and Pi is the predictive values of flow stress, and refer to arithmetic mean of all values of E and P, respectively. Figure 9 shows the correlation between the experimental and predicted flow stress values, where R is 0.983 and AARE is 8.29%, confirming the good agreement between them.
4.3. Processing Map of New TF400 Alloy
The processing map based on dynamic material model (DMM) has been widely constructed to analyze the deformation mechanism and understand the microstructure under different deformation conditions. According to the DMM, the workpiece subjected to thermal deformation is considered as a nonlinear dissipater of power, and the instantaneous power dissipates at a given strain rate consists of two complementary parts: a temperature rise generated by plastic deformation and microstructural change. The strain rate sensitivity of flow stress, a measure of the softening of alloys, can be obtained from the power law and expressed in the following equation,
where m is the rate sensitivity, σ is the flow stress (MPa), έ is the strain rate (s−1), ε is the strain, and the power dissipation efficiency η is a dimensionless parameter, i.e., the ratio of the nonlinear power dissipation to a linear dissipater in the workpiece. The strain rate sensitivity m reaches the maximum in case when the linear dissipator is ideal. The power dissipation map can be thus established by expressing the variation of η with temperature and strain rate. It is in the power dissipation map that different microstructural mechanisms are correlated with different values of η, for specific, the higher value of η of the domains, the more favorable condition for hot deformation.
By contrast, the regime of flow instability could be determined by the Prasad instability criterion. The criterion is expressed by a dimensionless parameter instability ξ(έ), i.e.,
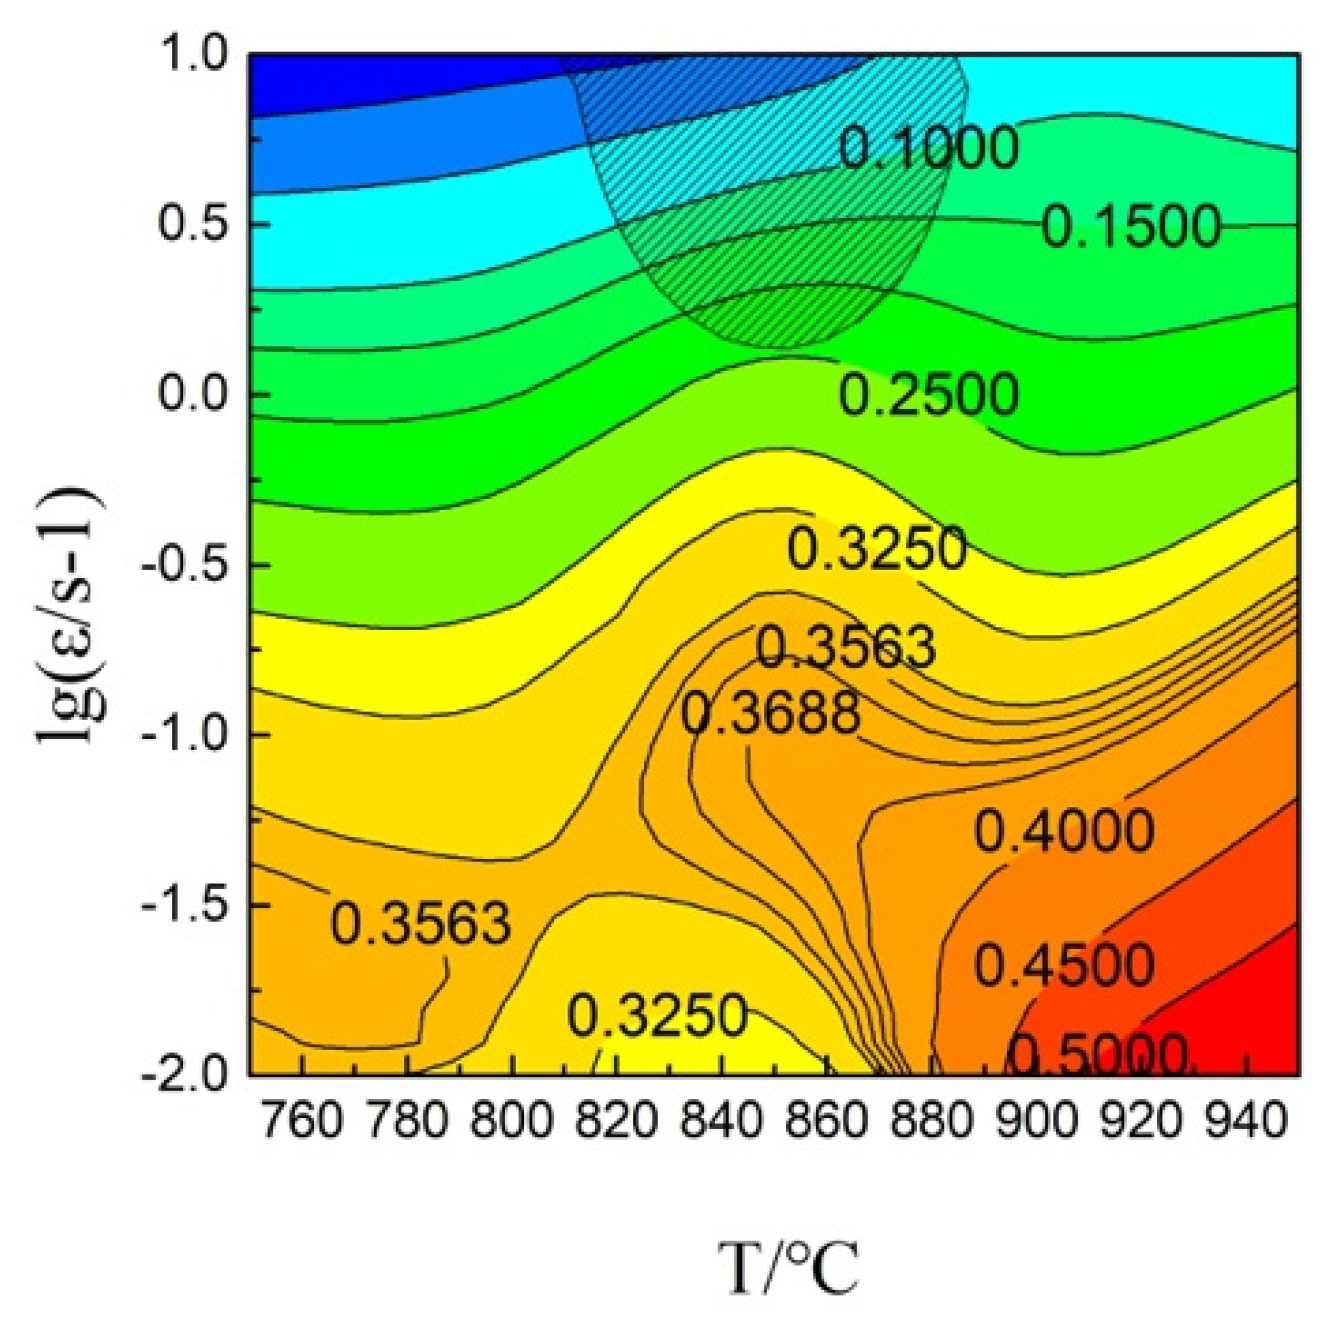
The parameter ξ(έ) generates an instability map, and by superimposing with the power dissipation map, it constitutes the processing map. Consequently, the superimposed processing map allows to classify the safe domain and unsafe domain during hot working. Figure 10 displays the processing map of the TF400 alloy under the temperature range of 750–950 °C and strain rate of 0.01~10 s−1 at the strain of 0.8. The number on the contour represents the efficiency of power dissipation η and the shadow regions are the instability region where the value of ξ is negative. It apparently shows an obvious increase in η from 0.35 to 0.4 at 850 °C, a temperature close to the β transus 854 °C. The map also confirms a domain of β phase microstructure is favorable to hot deformation. This is because the β structures have more slip systems that make the hot deformation easier. It learns from Figure 10 that the safe domain is at strain rate lower than 1 s−1 at all the temperatures tested in this work. The stability domain with the maximum η value of TF400 alloy occurs at temperature range of 895–950 °C and the strain rate range of 0.01–0.03 s−1, that provides the preferential processing parameters in the working process. One small shaded domain was noticed at the region of 820–880 °C and 1–10 s−1 to meet the instability processing condition.
4.4. Microstructure Evolution
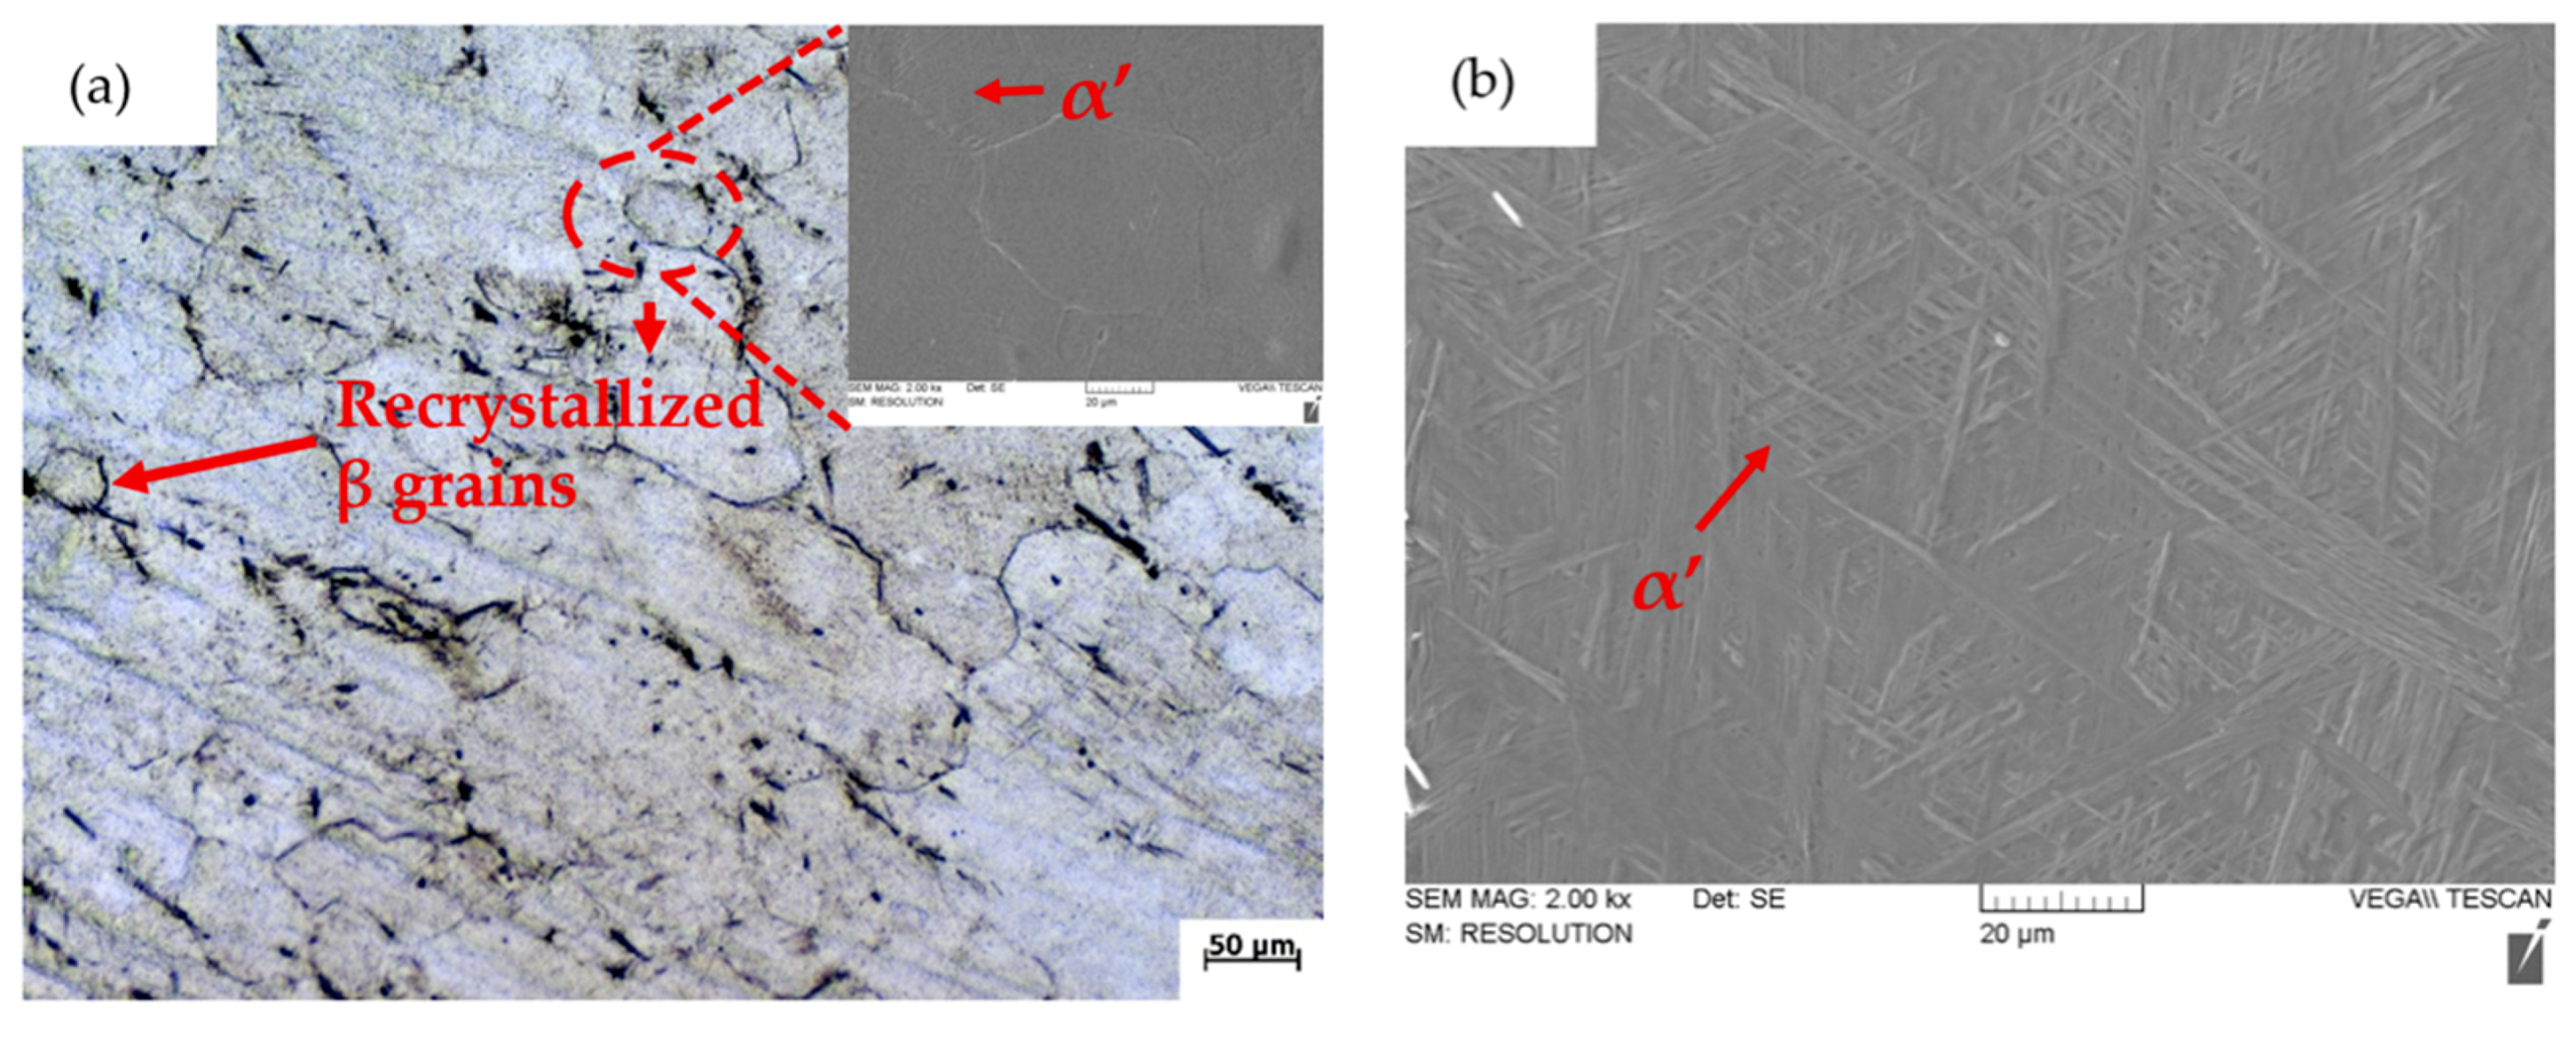
As shown in Figure 11, the microstructures of the deformed TF400 samples were composed of a large amount of recrystallized β grains with the average size about 50 μm, and the inset shows martensite α’ in β. In Figure 11b, a great number of acicular martensite α’ were formed, where the original coarse β grain boundaries were remarkably broken by the deformation and the original lamellar α phases disappeared.
The TEM graphs of the α+β two–phase structures are shown in Figure 12a,b. High density of dislocation pile–up and tangles was shown in these images, and the evolution of dislocation substructures can be identified as: high density dislocation→ subgrain→ DRX grain. Once dislocations accumulate and reach a certain extent (as called the critical strain), the nucleation and growth of DRX nucleus will occur. Moreover, with the increasing strain, the increased deformation storage energy provides larger driving force for the movement of dislocation and the migration of boundaries, leading to a distinct increase of DRX degree [48,49]. The high density of dislocation tangles can be seen in Figure 12b. It was also observed that there are some subgrain boundaries, where the dislocation climbing and sliding was created up the dislocation walls. In addition, Lin et al. [50] found the subgrain boundaries can absorb dislocations and lead the low–angle grain boundaries, transforming into the high–angle grain boundaries.
Figure 12c,d show the TEM micrograph of the deformed TF400 in the single β–phase. Due to the higher deformation temperature, it was easier for the dislocations to cross grain boundaries, thus leading to more nucleation [51]. In addition, the critical strain for the operation of DRX decreases with increasing temperature, so DRX nucleation took place more readily and the amount of DRX increased as well. As seen in Figure 12d, the DRX grain size tended to increase, which was attributed to the enhanced grain boundary mobility from a decreasing solute–element drag effect [52]. Moreover, almost no DRV was found during the whole process. By thoroughly inspecting and comparing the microstructures prior to and after the deformation, it can be concluded that the dynamic recrystallization is the main restoration mechanism of flow softening during the entire deformation process.
5. Conclusions
The hot deformation behavior of the TF400 alloy was investigated in the temperature range of 750–950 °C and the strain rate range of 0.01–10 s−1 by using Gleeble 3800 thermal simulator, and the corresponding microstructures prior to and after the deformations were characterized. The following conclusions were drawn:
- The flow stress of the TF400 alloys was proven to be sensitive to the deformation temperature and the strain rate. Representative features of work hardening at small strain and flow softening rates were exhibited at all the stress–strain curves. The flow stress decreases with the increase of temperature and increases as the strain rate increases.
- The stress–strain curves under distinct experimental conditions were modelled by using the constitutive equation. To allow the material variables M, N and P changing with the strain, the constitutive equation was modified to represent the observed effect of strain rates and temperature on the flow stress. The deformation activation energy Q was 387.77 kJ/mol.
- The processing map was constructed, indicating that the safe domain occurs at the temperature range of 895–950 °C and strain rate range of 0.01–0.03 s−1 and the instability domain locates at 820–880 °C and 1–10 s−1. It also confirms a preferential domain with the β microstructure for hot deformation, which was largely stabilized by the alloying element Fe in the TF400 alloy.
- A mechanistic understanding of plastic deformation behavior in the TF400 alloys was enriched by thoroughly inspecting the microstructural characteristics prior to and after deformations. High–density dislocation pile–up and tangles were observed at α+β phase regions; however, the dislocation density, as well as the flow stress, decreased as the temperature raised to a single β–phase region. High dislocation density was also observed in the low temperature and high strain rate domain, resulting in high flow stress. It is believed that the dynamic recrystallization and dynamic transformation were the main restoration mechanisms of flow softening during the entire deformation process.
Author Contributions
Conceptualization and methodology, H.C., L.Z. and Y.C.; experimental investigation, calculation, writing—original draft preparation and editing, G.D.; data curation, G.D., D.Z. and Y.G.; writing—review and final version, project administration, funding acquisition, Y.C.; supervision, H.C. and Y.C.
Funding
This research was funded by the Defense Industrial Technology Development Program of China [No. JCKY2018414C020], and Jiangsu Collaborative Innovation Center for Advanced Inorganic Function Composites, Nanjing Tech University.
Conflicts of Interest
The authors declare no conflicts of interest.
References
- Seshacharyulu, T.; Medeiros, S.C.; Frazier, W.G.; Prasad, Y.V.R.K. Hot working of commercial Ti–6Al–4V with an equiaxed α–β microstructure: materials modeling considerations. Mater. Sci. Eng. A Struct. 2000, 284, 184–194. [Google Scholar] [CrossRef]
- Zhu, W.G.; Li, P.; Sun, X.; Chen, W.; Zhang, H.L.; Sun, Q.Y.; Liu, B.; Xia, L.; Sun, J. Precipitation response and hardening behaviors of Fe–modified Ti5553 alloy. Trans. Nonferrous Met. Soc. 2019, 29, 1242–1251. [Google Scholar] [CrossRef]
- Park, C.H.; Ko, Y.G.; Park, J.W.; Lee, C.S. Enhanced superplasticity utilizing dynamic globularization of Ti–6Al–4V alloy. Mater. Sci. Eng. A Struct. 2008, 496, 150–158. [Google Scholar] [CrossRef]
- Kanou, O.; Fukada, N.; Hayakawa, M. The Effect of Fe Addition on the Mechanical Properties of Ti–6Al–4V Alloys Produced by the Prealloyed Powder Method. Mater. Trans. 2016, 57, 681–685. [Google Scholar] [CrossRef]
- Prasad, Y.V.R.K.; Seshacharyulu, T. Processing maps for hot working of titanium alloys. Mater. Sci. Eng. A Struct. 1998, 243, 82–88. [Google Scholar] [CrossRef]
- Peng, X.N.; Guo, H.Z.; Shi, Z.F.; Qin, C.; Zhao, Z.L. Constitutive equations for high temperature flow stress of TC4–DT alloy incorporating strain, strain rate and temperature. Mater. Des. 2013, 50, 198–206. [Google Scholar] [CrossRef]
- Liao, H.C.; Wu, Y.N.; Zhou, K.X.; Yang, J. Hot deformation behavior and processing map of Al–Si–Mg alloys containing different amount of silicon based on Gleebe–3500 hot compression simulation. Mater. Des. 2015, 65, 1091–1099. [Google Scholar] [CrossRef]
- Ning, Y.; Fu, M.; Hou, H.; Yao, Z.; Guo, H. Hot deformation behavior of Ti–5.0 Al–2.40 Sn–2.02 Zr–3.86 Mo–3.91 Cr alloy with an initial lamellar microstructure in the α+ β phase field. Mater. Sci. Eng. A 2011, 528, 1812–1818. [Google Scholar] [CrossRef]
- Peng, X.N.; Guo, H.Z.; Shi, Z.F.; Qin, C.; Zhao, Z.L.; Yao, Z.K. Study on the hot deformation behavior of TC4–DT alloy with equiaxed α+ β starting structure based on processing map. Mater. Sci. Eng. A 2014, 605, 80–88. [Google Scholar] [CrossRef]
- Wu, D.; Zhang, L.G.; Liu, L.B.; Bai, W.M.; Zeng, L.J. Effect of Fe content on microstructures and properties of Ti6Al4V alloy with combinatorial approach. Trans. Nonferrous Met. Soc. 2018, 28, 1714–1723. [Google Scholar] [CrossRef]
- Peng, X.N.; Guo, H.Z.; Wang, T.; Yao, Z.K. Effects of β treatments on microstructures and mechanical properties of TC4–DT titanium alloy. Mater. Sci. Eng. A 2012, 533, 55–63. [Google Scholar] [CrossRef]
- Zhang, Y.; Chang, H.; Li, G.; Dong, Y.; Cui, Y.; Zhou, L. Effect of Fe Content on Microstructure Evolution and Mechanical Properties of as–cast Ti–xFe–B Alloy. Rare Met. Mater. Eng. 2017, 46, 180–184. [Google Scholar]
- Shao, L.; Wu, S.; Zhao, S.; Ketkaew, J.; Zhao, H.; Ye, F.; Schroers, J. Evolution of microstructure and microhardness of the weld simulated heat–affected zone of Ti–22Al–25Nb (at.%) alloy with continuous cooling rate. J. Alloy. Compd. 2018, 744, 487–492. [Google Scholar] [CrossRef]
- Li, X.; Lu, S.; Fu, M.; Wang, K.; Dong, X. The optimal determination of forging process parameters for Ti–6.5 Al–3.5 Mo–1.5 Zr–0.3 Si alloy with thick lamellar microstructure in two phase field based on P–map. J. Mater. Process. Tech. 2010, 210, 370–377. [Google Scholar] [CrossRef]
- Dan, W.; Zhang, W.; Li, S.; Lin, Z. A model for strain–induced martensitic transformation of TRIP steel with strain rate. Comput. Mater. Sci 2007, 40, 101–107. [Google Scholar] [CrossRef]
- Sommitsch, C.; Sievert, R.; Wlanis, T.; Günther, B.; Wieser, V. Modelling of creep–fatigue in containers during aluminium and copper extrusion. Comput. Mater. Sci 2007, 39, 55–64. [Google Scholar] [CrossRef]
- Berbenni, S.; Favier, V.; Berveiller, M. Micro–macro modelling of the effects of the grain size distribution on the plastic flow stress of heterogeneous materials. Comput. Mater Sci 2007, 39, 96–105. [Google Scholar] [CrossRef]
- Lin, Y.C.; Chen, X.M. A critical review of experimental results and constitutive descriptions for metals and alloys in hot working. Mater. Des. 2011, 32, 1733–1759. [Google Scholar] [CrossRef]
- McQueen, H.J.; Ryan, N. Constitutive analysis in hot working. Mater. Sci. Eng. A 2002, 322, 43–63. [Google Scholar] [CrossRef]
- Saadatkia, S.; Mirzadeh, H.; Cabrera, J.M. Hot deformation behavior, dynamic recrystallization, and physically–based constitutive modeling of plain carbon steels. Mater. Sci. Eng. A 2015, 636, 196–202. [Google Scholar] [CrossRef]
- Souza, P.M.; Beladi, H.; Singh, R.; Rolfe, B.; Hodgson, P.D. Constitutive analysis of hot deformation behavior of a Ti6Al4V alloy using physical based model. Mater. Sci. Eng. A 2015, 648, 265–273. [Google Scholar] [CrossRef]
- Peng, W.; Zeng, W.; Wang, Q.; Yu, H. Characterization of high–temperature deformation behavior of as–cast Ti60 titanium alloy using processing map. Mater. Sci. Eng. A 2013, 571, 116–122. [Google Scholar] [CrossRef]
- Peng, W.; Zeng, W.; Wang, Q.; Yu, H. Comparative study on constitutive relationship of as–cast Ti60 titanium alloy during hot deformation based on Arrhenius–type and artificial neural network models. Mater. Des. 2013, 51, 95–104. [Google Scholar] [CrossRef]
- Zhao, J.; Ding, H.; Zhao, W.; Huang, M.; Wei, D.; Jiang, Z. Modelling of the hot deformation behaviour of a titanium alloy using constitutive equations and artificial neural network. Comput. Mater. Sci 2014, 92, 47–56. [Google Scholar] [CrossRef]
- Zhou, M.; Lin, Y.; Deng, J.; Jiang, Y.Q. Hot tensile deformation behaviors and constitutive model of an Al–Zn–Mg–Cu alloy. Mater. Des. 2014, 59, 141–150. [Google Scholar] [CrossRef]
- Lin, Y.C.; Liu, G. A new mathematical model for predicting flow stress of typical high–strength alloy steel at elevated high temperature. Comput. Mater. Sci 2010, 48, 54–58. [Google Scholar] [CrossRef]
- Mirzadeh, H.; Cabrera, J.M.; Najafizadeh, A. Constitutive relationships for hot deformation of austenite. Acta Mater. 2011, 59, 6441–6448. [Google Scholar] [CrossRef]
- Kai, X.; Chen, C.; Sun, X.; Wang, C.; Zhao, Y. Hot deformation behavior and optimization of processing parameters of a typical high–strength Al–Mg–Si alloy. Mater. Des. 2016, 90, 1151–1158. [Google Scholar] [CrossRef]
- Xu, T.; Peng, X.; Qin, J.; Chen, Y.; Yang, Y.; Wei, G. Dynamic recrystallization behavior of Mg–Li–Al–Nd duplex alloy during hot compression. J. Alloy. Compd. 2015, 639, 79–88. [Google Scholar] [CrossRef]
- Li, C.; Zhang, X.–Y.; Li, Z.–Y.; Zhou, K.–C. Hot deformation of Ti–5Al–5Mo–5 V–1Cr–1Fe near β titanium alloys containing thin and thick lamellar α phase. Mater. Sci. Eng. A 2013, 573, 75–83. [Google Scholar] [CrossRef]
- Mandal, S.; Rakesh, V.; Sivaprasad, P.; Venugopal, S.; Kasiviswanathan, K. Constitutive equations to predict high temperature flow stress in a Ti–modified austenitic stainless steel. Mater. Sci. Eng. A 2009, 500, 114–121. [Google Scholar] [CrossRef]
- Cai, J.; Li, F.; Liu, T.; Chen, B.; He, M. Constitutive equations for elevated temperature flow stress of Ti–6Al–4V alloy considering the effect of strain. Mater. Des. 2011, 32, 1144–1151. [Google Scholar] [CrossRef]
- Qu, F.; Reng, Z.; Ma, R.; Wang, Z.; Chen, D. The research on the constitutive modeling and hot working characteristics of as–cast V–5Cr–5Ti alloy during hot deformation. J. Alloy. Compd. 2016, 663, 552–559. [Google Scholar] [CrossRef]
- Li, A.; Huang, L.; Meng, Q.; Geng, L.; Cui, X. Hot working of Ti–6Al–3Mo–2Zr–0.3 Si alloy with lamellar α+ β starting structure using processing map. Mater. Des. 2009, 30, 1625–1631. [Google Scholar] [CrossRef]
- Zhou, M.; Clode, M. Constitutive equations for modelling flow softening due to dynamic recovery and heat generation during plastic deformation. Mech. Mater. 1998, 27, 63–76. [Google Scholar] [CrossRef]
- Cai, Z.; Chen, F.; Ma, F.; Guo, J. Dynamic recrystallization behavior and hot workability of AZ41M magnesium alloy during hot deformation. J. Alloy. Compd. 2016, 670, 55–63. [Google Scholar] [CrossRef]
- Deng, Y.; Yin, Z.; Huang, J. Hot deformation behavior and microstructural evolution of homogenized 7050 aluminum alloy during compression at elevated temperature. Mater. Sci. Eng. A 2011, 528, 1780–1786. [Google Scholar] [CrossRef]
- Dong, S.; Chen, R.; Guo, J.; Ding, H.; Su, Y.; Fu, H. Deformation behavior and microstructural evolution of directionally solidified TiAlNb–based alloy during thermo–compression at 1373–1573 K. Mater. Des. 2015, 84, 118–132. [Google Scholar] [CrossRef]
- Gupta, R.; Murty, S.N.; Pant, B.; Agarwala, V.; Sinha, P. Hot workability of γ+ α2 titanium aluminide: Development of processing map and constitutive equations. Mater. Sci. Eng. A 2012, 551, 169–186. [Google Scholar] [CrossRef]
- Du, Z.; Jiang, S.; Zhang, K.; Lu, Z.; Li, B.; Zhang, D. The structural design and superplastic forming/diffusion bonding of Ti2AlNb based alloy for four–layer structure. Mater. Des. 2016, 104, 242–250. [Google Scholar] [CrossRef]
- Yang, J.; Wang, G.; Jiao, X.; Li, X.; Yang, C. Hot deformation behavior and microstructural evolution of Ti22Al25Nb1. 0B alloy prepared by elemental powder metallurgy. J. Alloy. Compd. 2017, 695, 1038–1044. [Google Scholar] [CrossRef]
- Koike, J.; Shimoyama, Y.; Ohnuma, I.; Okamura, T.; Kainuma, R.; Ishida, K.; Maruyama, K. Stress–induced phase transformation during superplastic deformation in two–phase Ti–Al–Fe alloy. Acta Mater. 2000, 48, 2059–2069. [Google Scholar] [CrossRef]
- Jonas, J.; Aranas, C.; Fall, A.; Jahazi, M. Transformation softening in three titanium alloys. Mater. Des. 2017, 113, 305–310. [Google Scholar] [CrossRef]
- Foul, A.; Aranas, C.; Guo, B.; Jonas, J. Dynamic transformation of α → β titanium at temperatures below the β–transus in commercially pure titanium. Mater. Sci. Eng. A 2018, 722, 156–159. [Google Scholar] [CrossRef]
- Aranas, C.; Foul, A.; Guo, B.; Fall, A.; Jahazi, M.; Jonas, J. Determination of the critical stress associated with dynamic phase transformation in steels by means of free energy method. Metals 2018, 8, 360. [Google Scholar] [CrossRef] [Green Version]
- Azarbarmas, M.; Aghaie–Khafri, M.; Cabrera, J.; Calvo, J. Microstructural evolution and constitutive equations of Inconel 718 alloy under quasi–static and quasi–dynamic conditions. Mater. Des. 2016, 94, 28–38. [Google Scholar] [CrossRef] [Green Version]
- Luo, J.; Li, M.; Li, H.; Yu, W. Effect of the strain on the deformation behavior of isothermally compressed Ti–6Al–4V alloy. Mater. Sci. Eng. A 2009, 505, 88–95. [Google Scholar] [CrossRef]
- Sakai, T.; Belyakov, A.; Kaibyshev, R.; Miura, H.; Jonas, J.J. Dynamic and post–dynamic recrystallization under hot, cold and severe plastic deformation conditions. Prog. Mater. Sci. 2014, 60, 130–207. [Google Scholar] [CrossRef] [Green Version]
- Wu, Y.; Kou, H.C.; Wu, Z.H.; Tang, B.; Li, J.S. Dynamic recrystallization and texture evolution of Ti–22Al–25Nb alloy during plane–strain compression. J. Alloy. Compd. 2018, 749, 844–852. [Google Scholar] [CrossRef]
- Lin, Y.C.; Huang, J.; He, D.G.; Zhang, X.Y.; Wu, Q.; Wang, L.H.; Chen, C.; Zhou, K.C. Phase transformation and dynamic recrystallization behaviors in a Ti55511 titanium alloy during hot compression. J. Alloy. Compd. 2019, 795, 471–482. [Google Scholar] [CrossRef]
- Veeraraghavan, D.; Wang, P.; Vasudevan, V.K. Nucleation kinetics of the α→ γM massive transformation in a Ti–47.5 at.% Al alloy. Acta Mater. 2003, 51, 1721–1741. [Google Scholar] [CrossRef]
- Yang, J.; Wang, G.; Jiao, X.; Li, Y.; Liu, Q. High–temperature deformation behavior of the extruded Ti–22Al–25Nb alloy fabricated by powder metallurgy. Mater. Charact. 2018, 137, 170–179. [Google Scholar] [CrossRef]
Figure 1.
(a) Optical micrograph and (b) Scanning electron micrograph of TF400 alloy before deformation. (c) The differential scanning calorimetry curve of TF400 alloy. (d) Ti–Fe binary phase diagram.
Figure 1.
(a) Optical micrograph and (b) Scanning electron micrograph of TF400 alloy before deformation. (c) The differential scanning calorimetry curve of TF400 alloy. (d) Ti–Fe binary phase diagram.

Figure 2.
The true stress–strain curves of TF400 alloy at (a) α+β phase field and (b) β phase field.
Figure 2.
The true stress–strain curves of TF400 alloy at (a) α+β phase field and (b) β phase field.

Figure 3.
The peak stress of TF400 alloy at different deformation temperatures and strain rates.

Figure 4.
The relations between (a) σ and ln έ, (b) ln σ and ln έ, (c) ln [sinh(ασ)] and ln έ.

Figure 5.
Linear fitting of (a) σ–1000/T, (b) ln σ–1000/T, (c) ln [sinh(ασ)]–1000/T.

Figure 6.
A linear relation of (a) σ– ln Z, (b) ln σ–ln Z, (c) ln [sinh(ασ)]–lnZ.

Figure 7.
Seven–degree polynomials in the strain of (a) M, (b) N, (c) P.

Figure 8.
Comparison between the experimental and predicted flow stress under, (a) α+β phase field and (b) β microstructures.
Figure 8.
Comparison between the experimental and predicted flow stress under, (a) α+β phase field and (b) β microstructures.

Figure 9.
Correlation between the experimental and predicted flow stress of the modified multivariable constitutive model.
Figure 9.
Correlation between the experimental and predicted flow stress of the modified multivariable constitutive model.

Figure 10.
Processing map of tested TF400 alloy at strain of 0.8.

Figure 11.
Image of hot compressed TF400 alloy at 900 °C·0.1s−1 (a) Optical micrograph, (b) Scanning electron micrograph.
Figure 11.
Image of hot compressed TF400 alloy at 900 °C·0.1s−1 (a) Optical micrograph, (b) Scanning electron micrograph.

Figure 12.
TEM image of hot compressed samples at (a), (b) 800 °C·0.01s−1 and (c), (d) 900 °C·0.01s−1.
Figure 12.
TEM image of hot compressed samples at (a), (b) 800 °C·0.01s−1 and (c), (d) 900 °C·0.01s−1.


Table 1.
Actual composition (wt.%) of the TF400 alloy.
| Nominal Alloy | Fe | B | C | O | N | Ti |
|---|---|---|---|---|---|---|
| TF400 | 3.36 | 0.1 | 0.016 | 0.079 | 0.010 | Bal |
Table 2.
Coefficient of the polynomial for β, n1, A, n, Q and lnA3 for TF400 alloy.
| Parameters | β | n1 | A | n | Q (kJ/mol) | lnA3 |
|---|---|---|---|---|---|---|
| TF400 | 0.085 | 6.514 | 0.013 | 4.6 | 387.77 | 38.99 |
Table 3.
The coefficients of the seven–degree polynomials for the M, N and P parameters.
| M | N | P |
|---|---|---|
| A0 = 0.12201 | B0 = 7.49035 | C0 = −2.1761 |
| A1 = 1.00339 | B1 = −3.98291 | C1 = 4.07024 |
| A2 = −7.80347 | B2 = −27.48437 | C2 = 23.10027 |
| A3 = 33.89276 | B3 = 105.60904 | C3 = −101.06423 |
| A4 = −85.99745 | B4 = 34.63896 | C4 = −3.76124 |
| A5 = 125.46548 | B5 = −676.72122 | C5 = 573.40118 |
| A6 = −97.34893 | B6 = −97.34893 | C6 = −946.80234 |
| A7 = 31.02045 | B7 = −517.52077 | C7 = 465.63388 |
© 2019 by the authors. Licensee MDPI, Basel, Switzerland. This article is an open access article distributed under the terms and conditions of the Creative Commons Attribution (CC BY) license (http://creativecommons.org/licenses/by/4.0/).
Share and Cite
MDPI and ACS Style
Dai, G.; Cui, Y.; Zhou, D.; Guo, Y.; Chang, H.; Zhou, L. Hot Deformation Behavior and Mechanistic Understanding of New TF400 Titanium Alloy. Metals 2019, 9, 1277. https://doi.org/10.3390/met9121277
AMA Style
Dai G, Cui Y, Zhou D, Guo Y, Chang H, Zhou L. Hot Deformation Behavior and Mechanistic Understanding of New TF400 Titanium Alloy. Metals. 2019; 9(12):1277. https://doi.org/10.3390/met9121277
Chicago/Turabian StyleDai, Guoqing, Yuwen Cui, Danying Zhou, Yanhua Guo, Hui Chang, and Lian Zhou. 2019. "Hot Deformation Behavior and Mechanistic Understanding of New TF400 Titanium Alloy" Metals 9, no. 12: 1277. https://doi.org/10.3390/met9121277
Note that from the first issue of 2016, this journal uses article numbers instead of page numbers. See further details here.