A Novel Function of Sphingosine Kinase 2 in the Metabolism of Sphinga-4,14-Diene Lipids

 , , , ,
Abstract
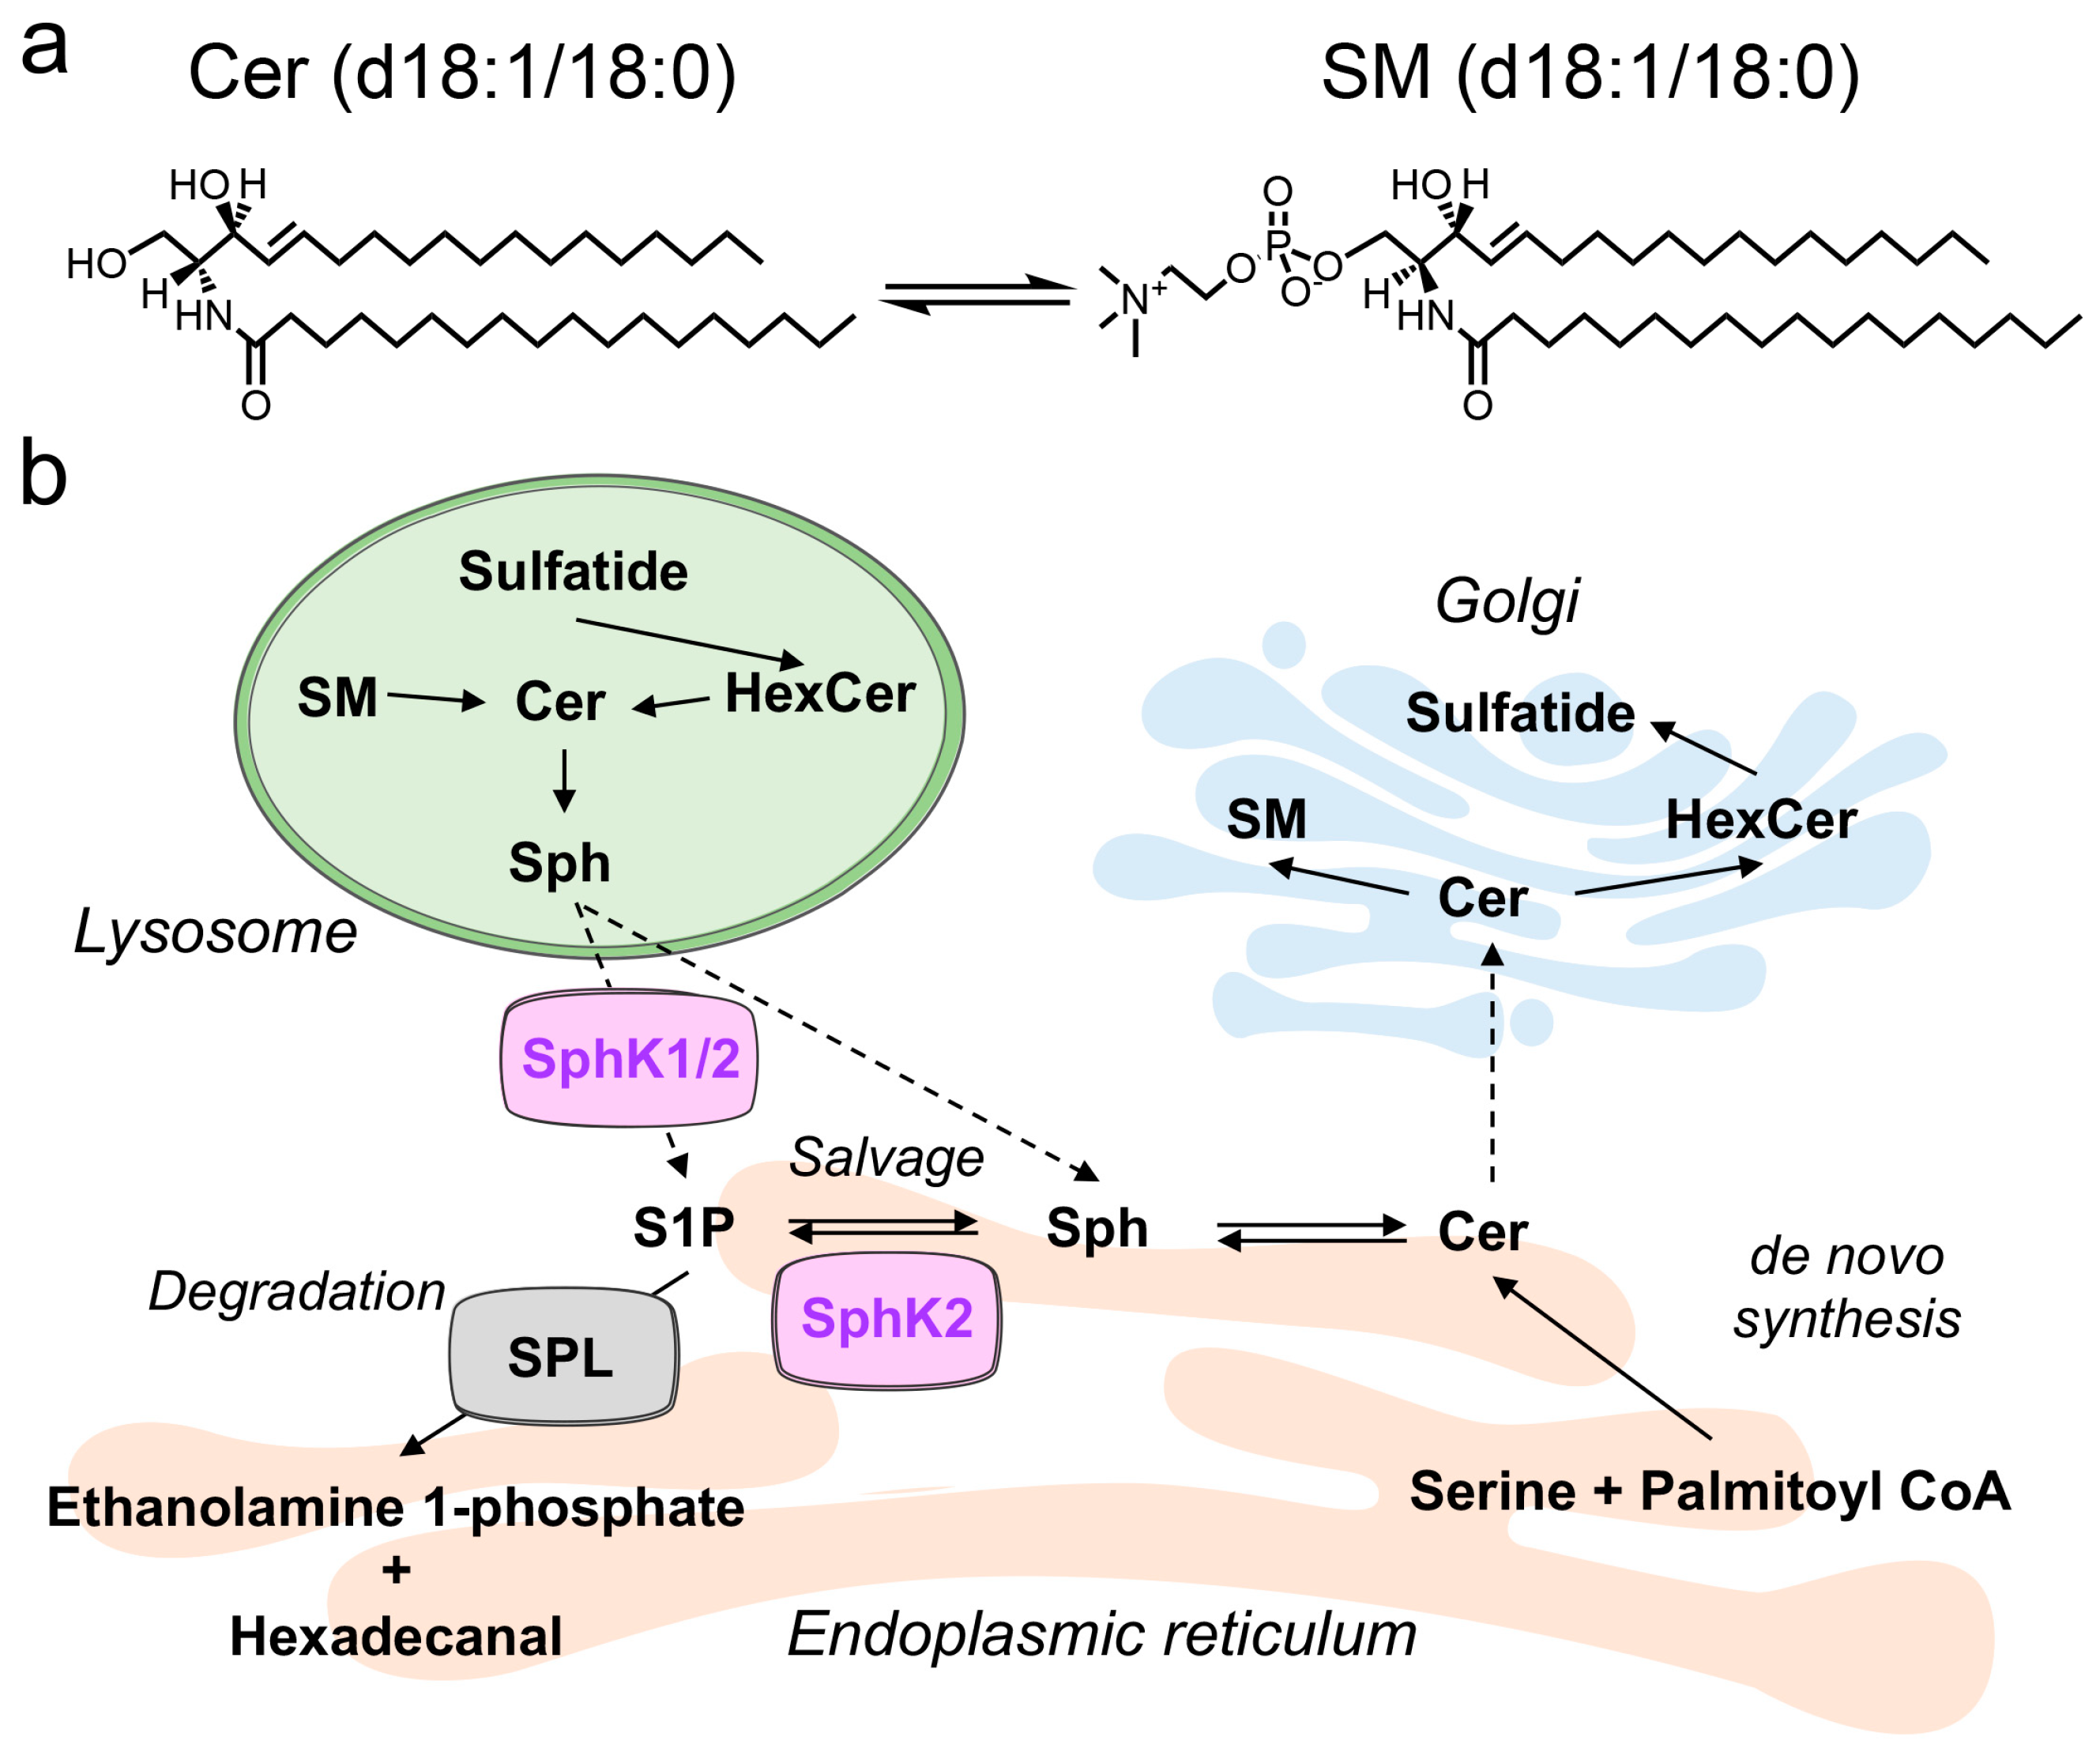
:1. Introduction
2. Results
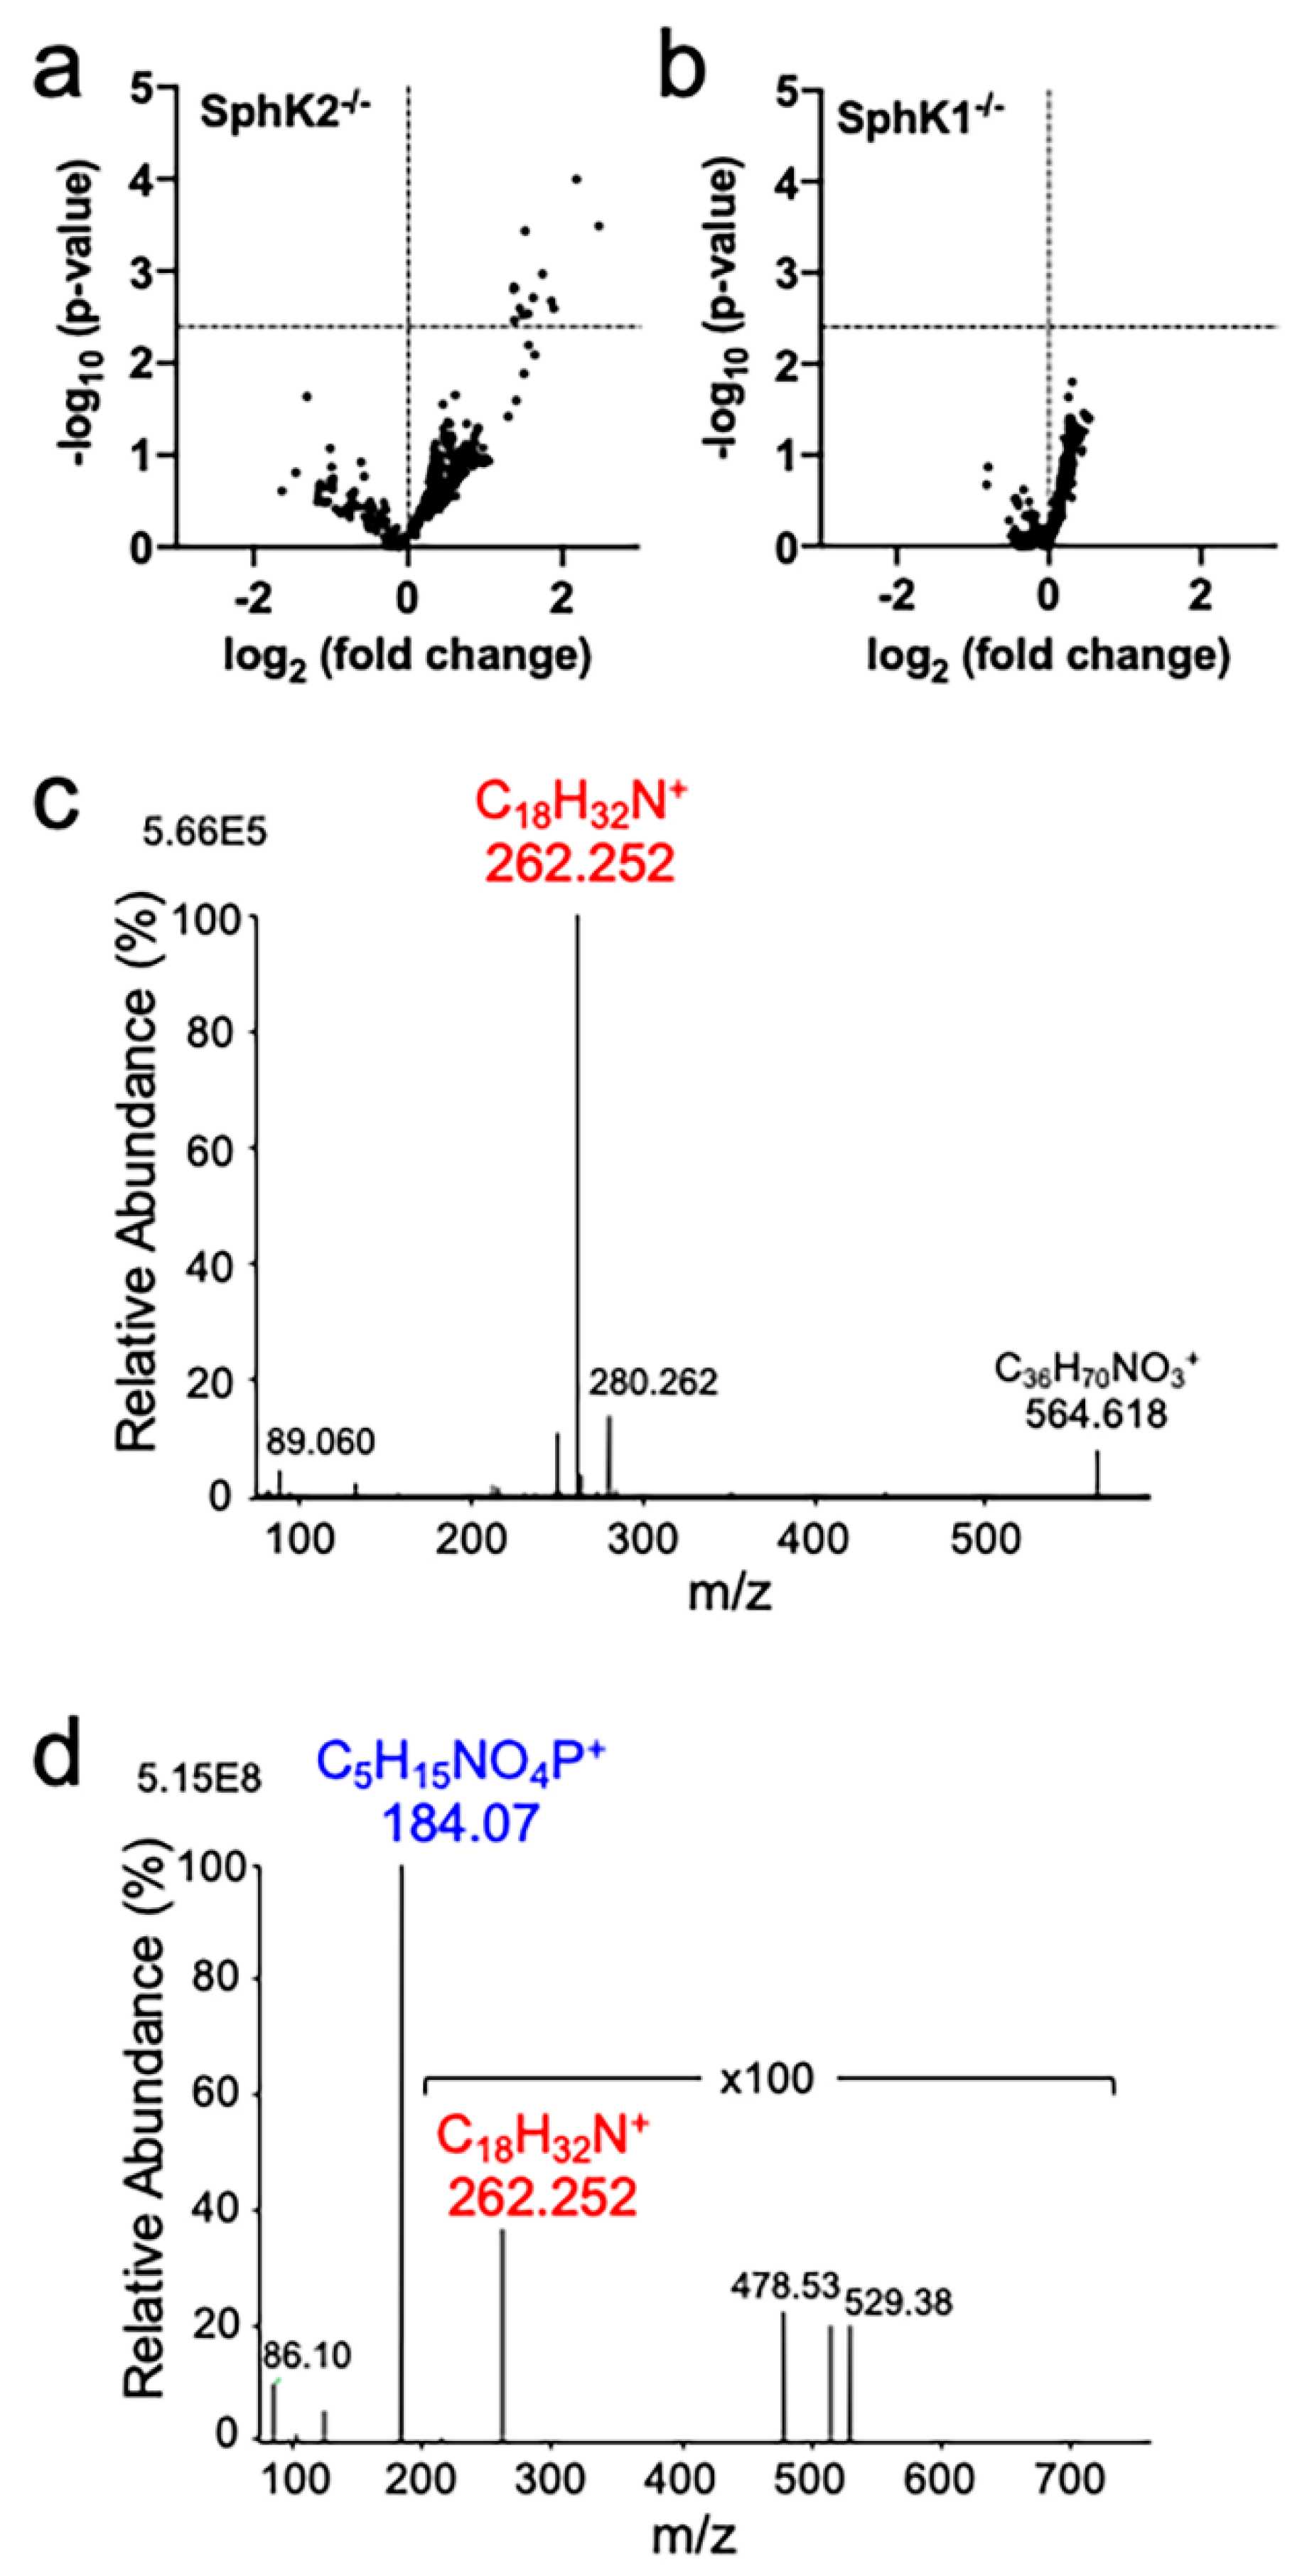
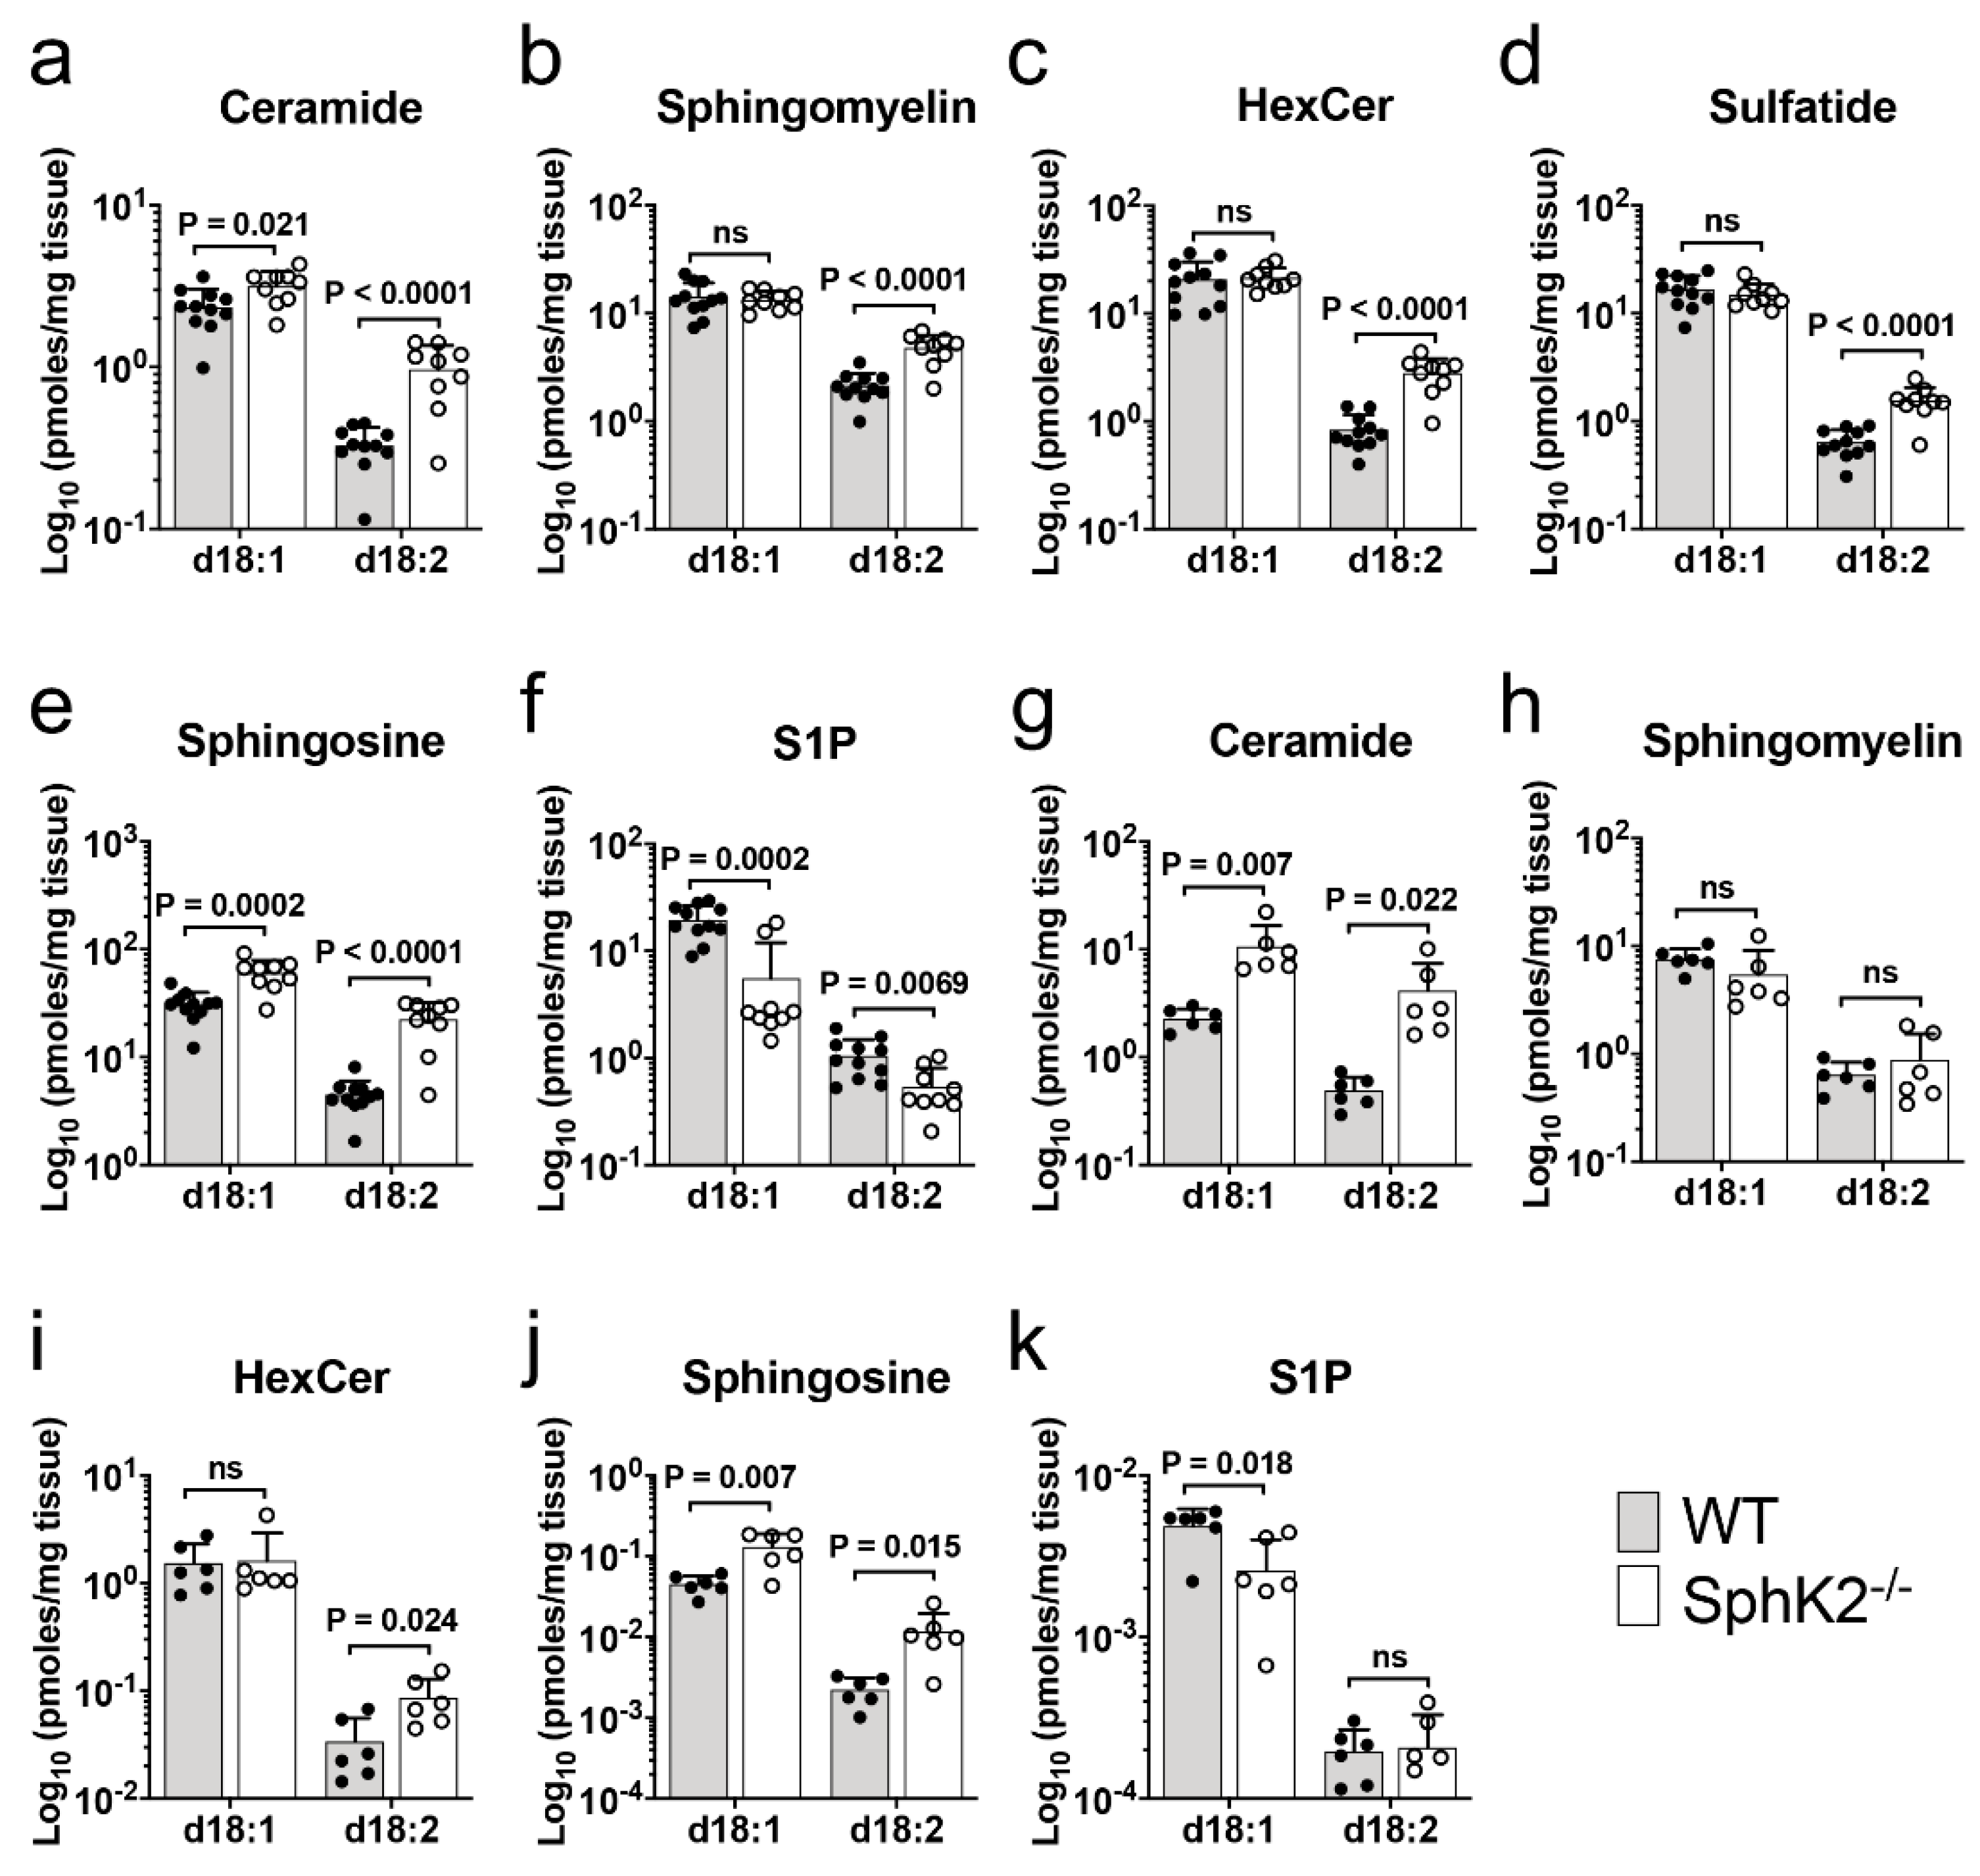
2.1. Accumulation of Sphingadiene Lipids in the Hippocampus of SphK2 Deficient Mice
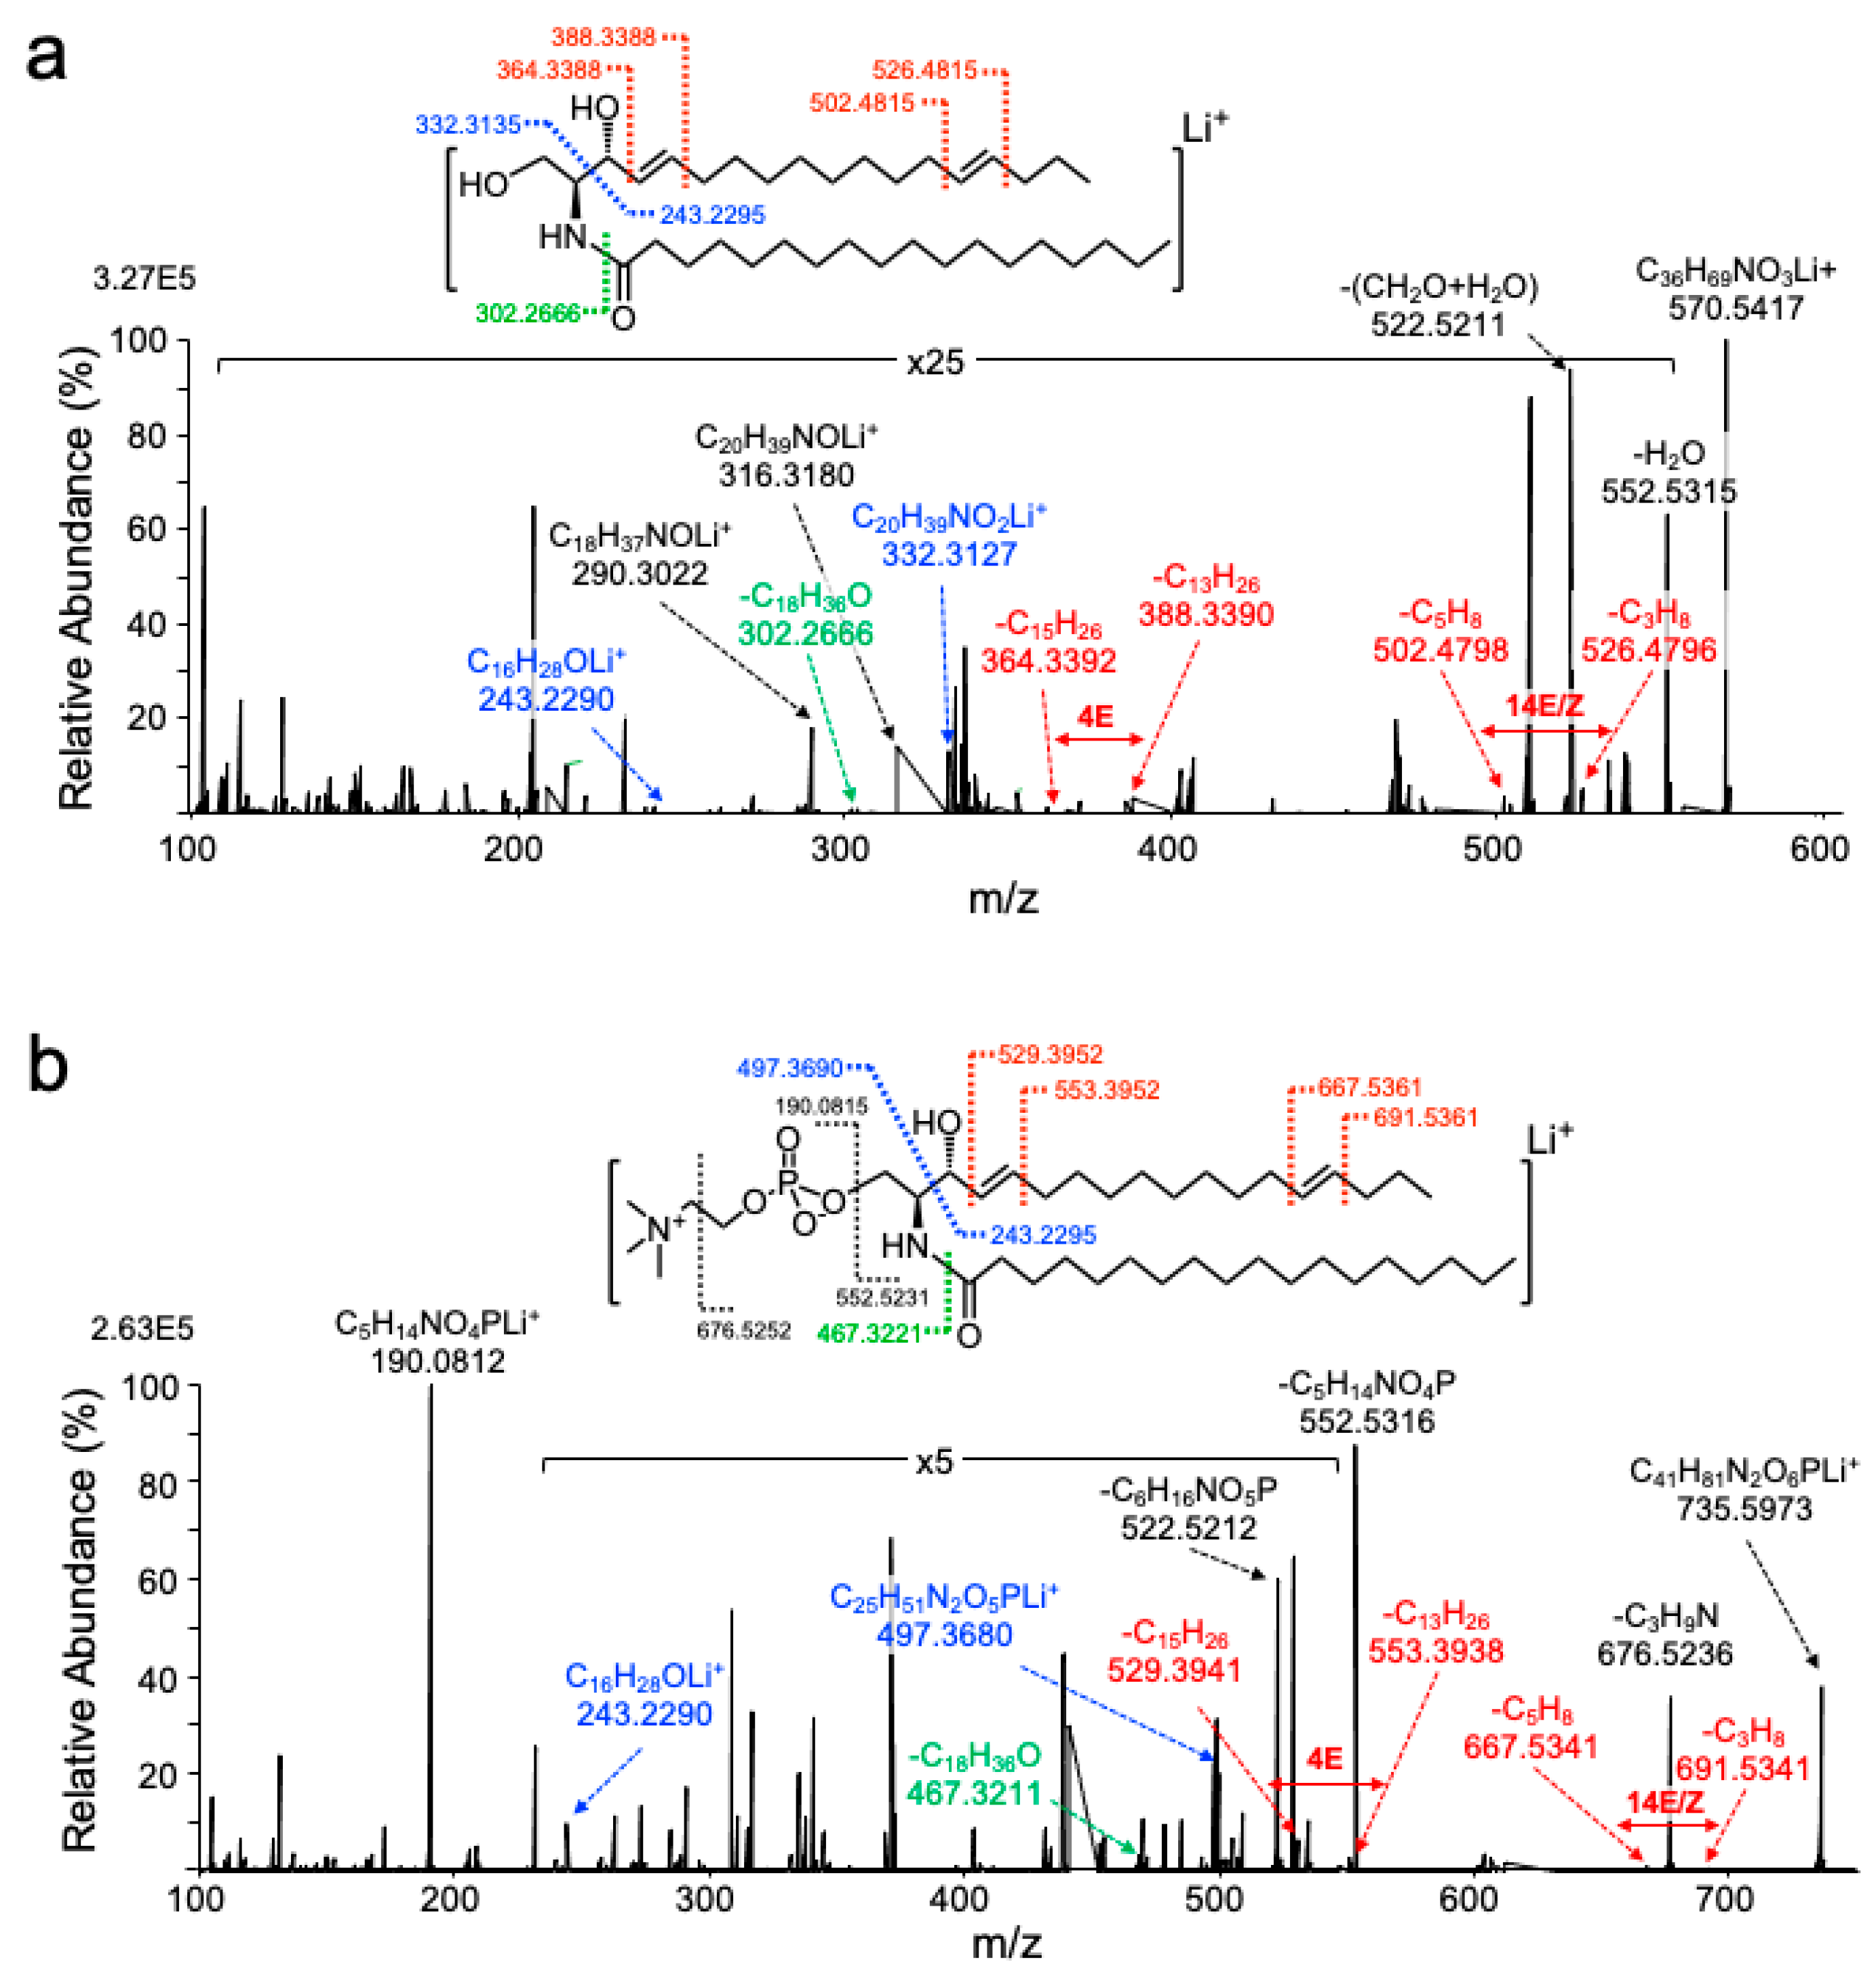
2.2. UVPD-MS/MS Assigns Double Bonds to the C4 and C14 Position of Sphingadiene
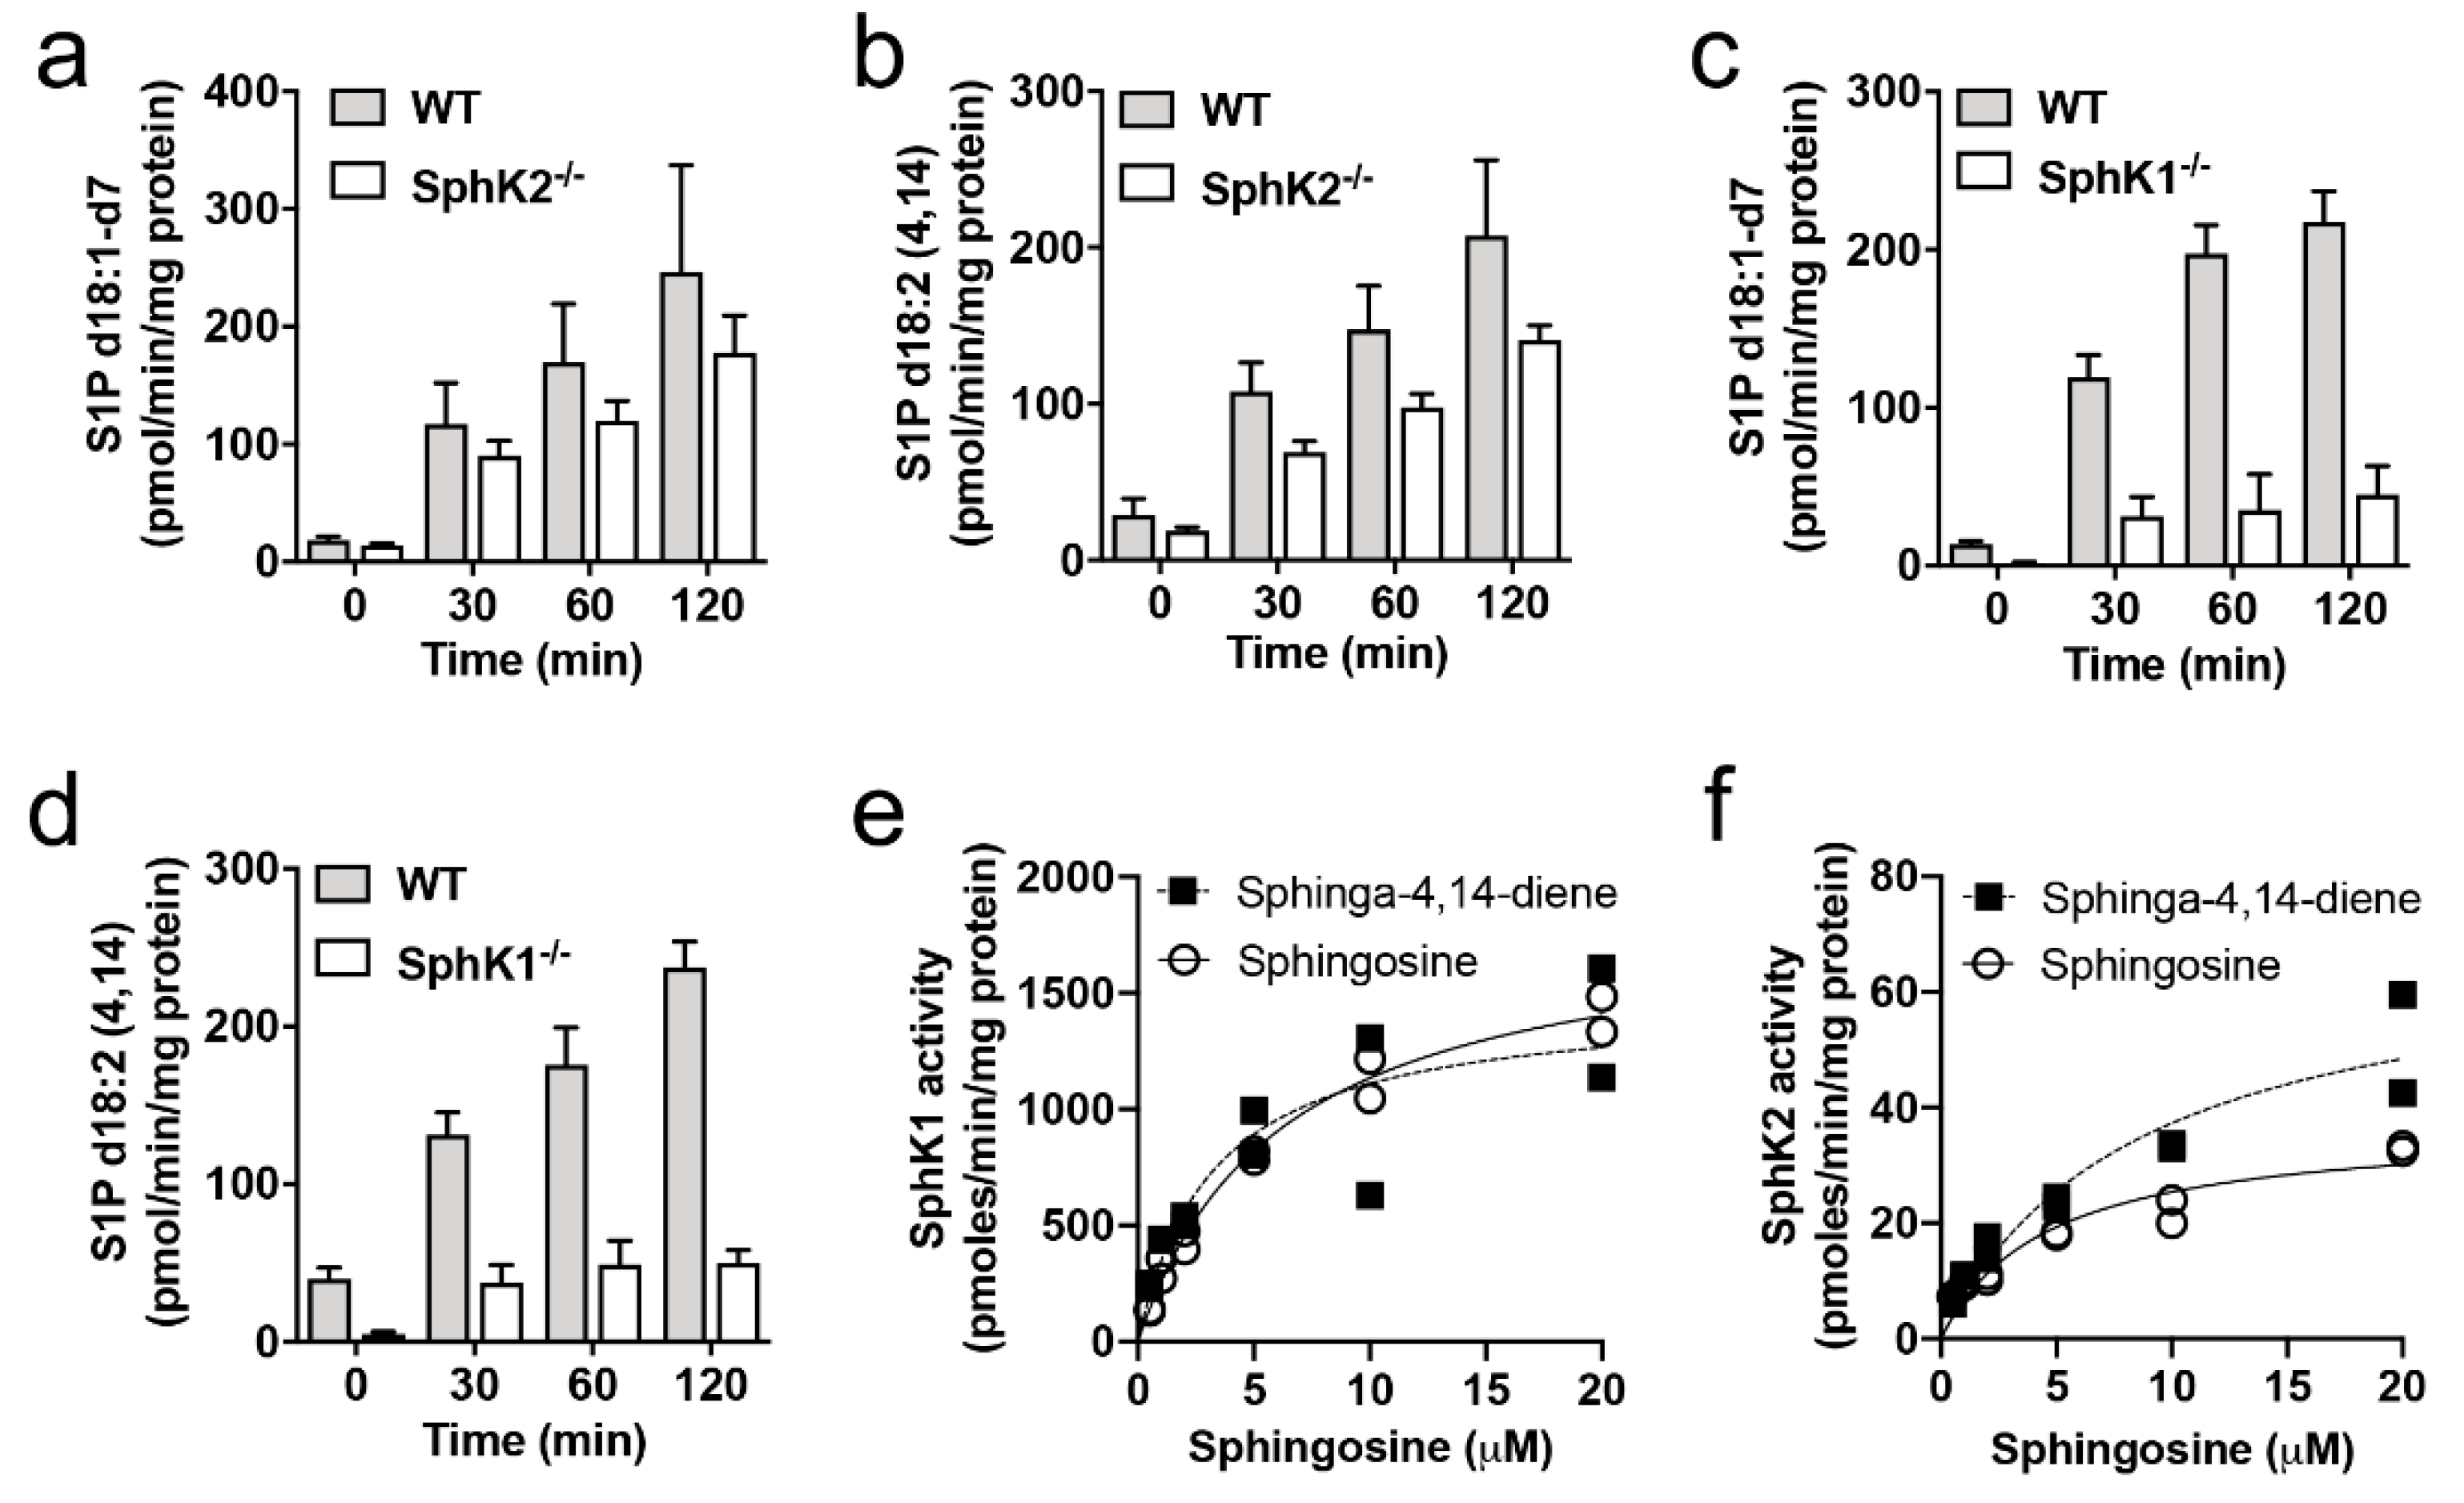
2.3. SphK1 and SphK2 Exhibit Similar Affinity for Sphingosine and Sphinga-4,14-Diene
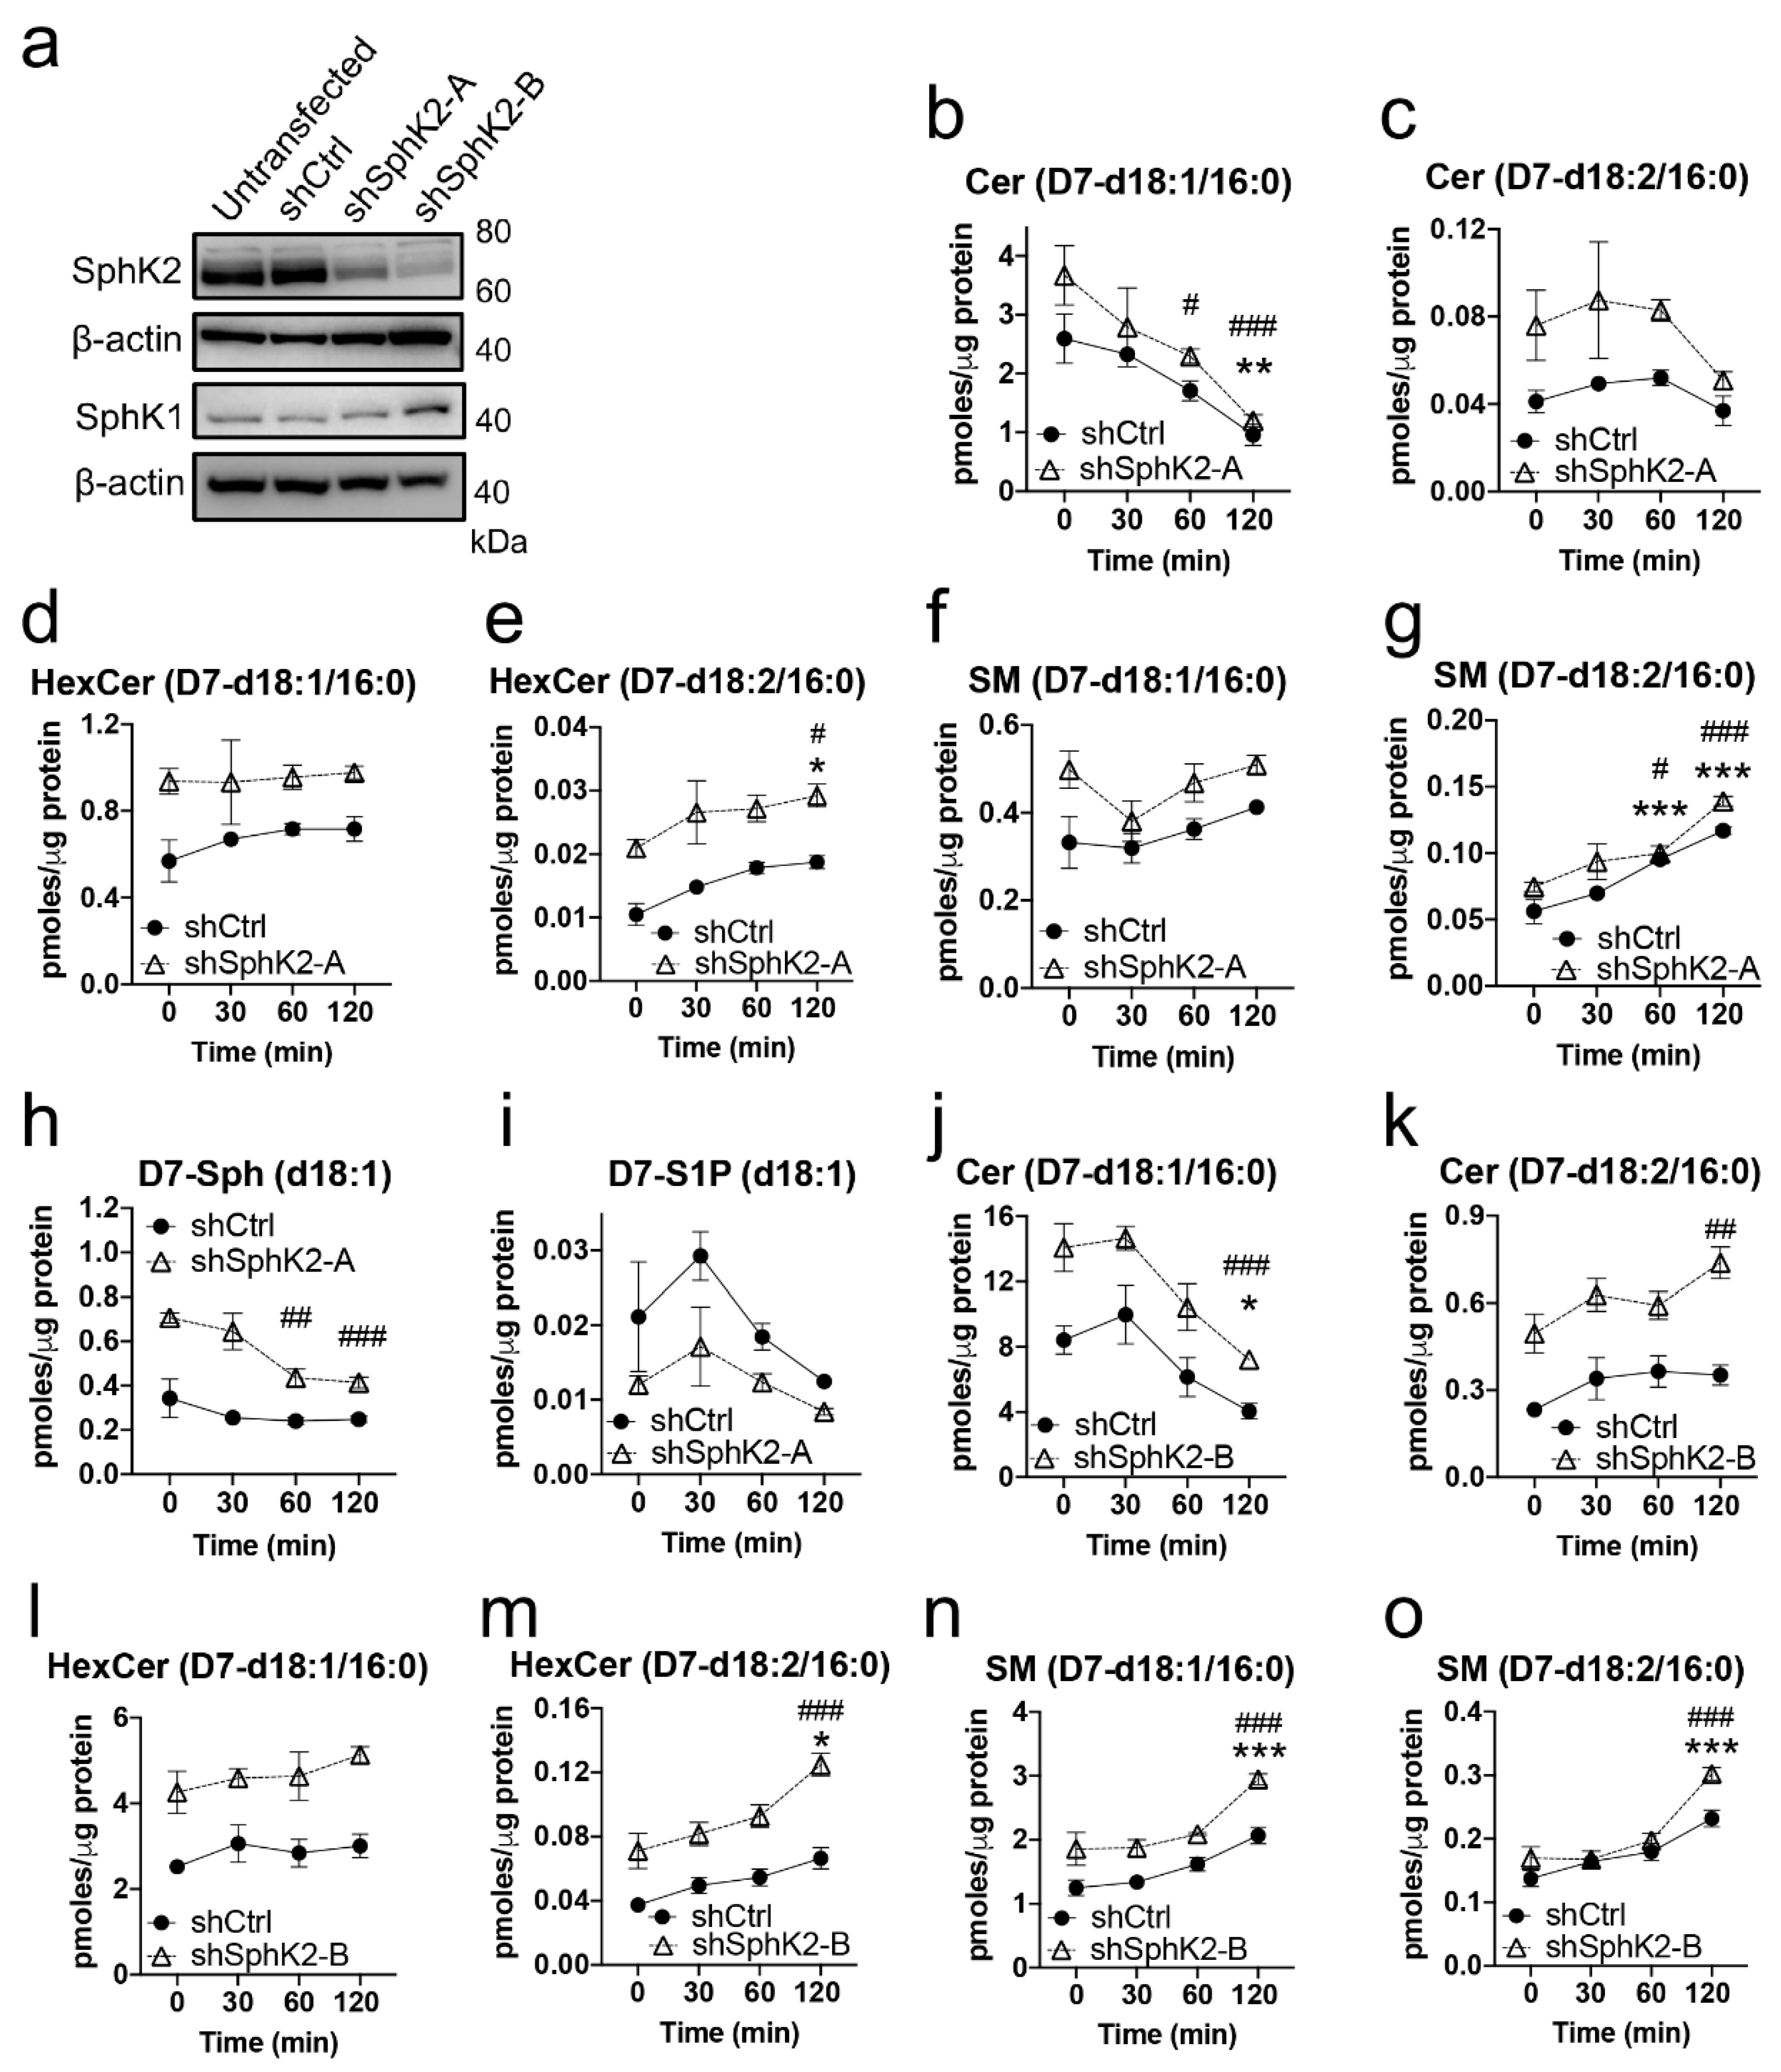
2.4. Sphingadiene (d18:2) Ceramides Are Metabolized More Slowly Than d18:1 Ceramides
3. Discussion
4. Materials and Methods
4.1. Lipid Standards
4.2. Mouse Tissue Samples
4.3. Cell Culture
4.3.1. Stable SphK2 Knock-Down
4.3.2. Metabolic Labelling with D7-Sphingosine
4.4. Lipid Extraction
4.5. Sphingosine Kinase Activity Assays
4.6. Lipid Quantification by LC-MS/MS
4.6.1. Untargeted Lipidomics
4.6.2. Targeted Lipidomics
4.7. Lipid Characterization by 193 nm UVPD-MS/MS
4.8. Western Blotting
4.9. Statistical Analysis
Supplementary Materials
Author Contributions
Funding
Acknowledgments
Conflicts of Interest
References
- Hannun, Y.A.; Obeid, L.M. Sphingolipids and their metabolism in physiology and disease. Nat. Rev. Mol. Cell Biol. 2018, 19, 175–191. [Google Scholar] [CrossRef] [PubMed]
- Merrill, A.H., Jr. Sphingolipid and glycosphingolipid metabolic pathways in the era of sphingolipidomics. Chem. Rev. 2011, 111, 6387–6422. [Google Scholar] [CrossRef] [PubMed]
- Siddique, M.M.; Li, Y.; Wang, L.; Ching, J.; Mal, M.; Ilkayeva, O.; Wu, Y.J.; Bay, B.H.; Summers, S.A. Ablation of dihydroceramide desaturase 1, a therapeutic target for the treatment of metabolic diseases, simultaneously stimulates anabolic and catabolic signaling. Mol. Cell. Biol. 2013, 33, 2353–2369. [Google Scholar] [CrossRef] [PubMed] [Green Version]
- Park, J.W.; Park, W.J.; Futerman, A.H. Ceramide synthases as potential targets for therapeutic intervention in human diseases. Biochim. Biophys. Acta 2014, 1841, 671–681. [Google Scholar] [CrossRef] [PubMed]
- Raichur, S.; Wang, S.T.; Chan, P.W.; Li, Y.; Ching, J.; Chaurasia, B.; Dogra, S.; Ohman, M.K.; Takeda, K.; Sugii, S.; et al. Cers2 haploinsufficiency inhibits beta-oxidation and confers susceptibility to diet-induced steatohepatitis and insulin resistance. Cell Metab. 2014, 20, 687–695. [Google Scholar] [CrossRef] [PubMed] [Green Version]
- Harayama, T.; Riezman, H. Understanding the diversity of membrane lipid composition. Nat. Rev. Mol. Cell Biol. 2018, 19, 281–296. [Google Scholar] [CrossRef]
- Ramstedt, B.; Slotte, J.P. Membrane properties of sphingomyelins. FEBS Lett. 2002, 531, 33–37. [Google Scholar] [CrossRef] [Green Version]
- Klein, D.R.; Brodbelt, J.S. Structural characterization of phosphatidylcholines using 193 nm ultraviolet photodissociation mass spectrometry. Anal. Chem. 2017, 89, 1516–1522. [Google Scholar] [CrossRef] [Green Version]
- Klein, D.R.; Holden, D.D.; Brodbelt, J.S. Shotgun analysis of rough-type lipopolysaccharides using ultraviolet photodissociation mass spectrometry. Anal. Chem. 2016, 88, 1044–1051. [Google Scholar] [CrossRef] [Green Version]
- O’Brien, J.P.; Brodbelt, J.S. Structural characterization of gangliosides and glycolipids via ultraviolet photodissociation mass spectrometry. Anal. Chem. 2013, 85, 10399–10407. [Google Scholar] [CrossRef] [Green Version]
- O’Brien, J.P.; Needham, B.D.; Henderson, J.C.; Nowicki, E.M.; Trent, M.S.; Brodbelt, J.S. 193 nm ultraviolet photodissociation mass spectrometry for the structural elucidation of lipid a compounds in complex mixtures. Anal. Chem. 2014, 86, 2138–2145. [Google Scholar] [CrossRef] [PubMed]
- Ryan, E.; Nguyen, C.Q.N.; Shiea, C.; Reid, G.E. Detailed structural characterization of sphingolipids via 193 nm ultraviolet photodissociation and ultra high resolution tandem mass spectrometry. J. Am. Soc. Mass Spectrom. 2017, 28, 1406–1419. [Google Scholar] [CrossRef] [PubMed]
- Proia, R.L.; Hla, T. Emerging biology of sphingosine-1-phosphate: Its role in pathogenesis and therapy. J. Clin. Investig. 2015, 125, 1379–1387. [Google Scholar] [CrossRef] [PubMed] [Green Version]
- Pruett, S.T.; Bushnev, A.; Hagedorn, K.; Adiga, M.; Haynes, C.A.; Sullards, M.C.; Liotta, D.C.; Merrill, A.H., Jr. Biodiversity of sphingoid bases (“sphingosines”) and related amino alcohols. J. Lipid Res. 2008, 49, 1621–1639. [Google Scholar] [CrossRef] [Green Version]
- Maceyka, M.; Harikumar, K.B.; Milstien, S.; Spiegel, S. Sphingosine-1-phosphate signaling and its role in disease. Trends Cell Biol. 2012, 22, 50–60. [Google Scholar] [CrossRef] [Green Version]
- Hait, N.C.; Allegood, J.; Maceyka, M.; Strub, G.M.; Harikumar, K.B.; Singh, S.K.; Luo, C.; Marmorstein, R.; Kordula, T.; Milstien, S.; et al. Regulation of histone acetylation in the nucleus by sphingosine-1-phosphate. Science 2009, 325, 1254–1257. [Google Scholar] [CrossRef] [Green Version]
- Prasad, R.; Hadjidemetriou, I.; Maharaj, A.; Meimaridou, E.; Buonocore, F.; Saleem, M.; Hurcombe, J.; Bierzynska, A.; Barbagelata, E.; Bergada, I.; et al. Sphingosine-1-phosphate lyase mutations cause primary adrenal insufficiency and steroid-resistant nephrotic syndrome. J. Clin. Investig. 2017, 127, 942–953. [Google Scholar] [CrossRef] [Green Version]
- Schmahl, J.; Raymond, C.S.; Soriano, P. Pdgf signaling specificity is mediated through multiple immediate early genes. Nat. Genet. 2007, 39, 52–60. [Google Scholar] [CrossRef]
- Hagen, N.; Van Veldhoven, P.P.; Proia, R.L.; Park, H.; Merrill, A.H., Jr.; van Echten-Deckert, G. Subcellular origin of sphingosine 1-phosphate is essential for its toxic effect in lyase-deficient neurons. J. Biol. Chem. 2009, 284, 11346–11353. [Google Scholar] [CrossRef] [Green Version]
- Bektas, M.; Allende, M.L.; Lee, B.G.; Chen, W.; Amar, M.J.; Remaley, A.T.; Saba, J.D.; Proia, R.L. Sphingosine 1-phosphate lyase deficiency disrupts lipid homeostasis in liver. J. Biol. Chem. 2010, 285, 10880–10889. [Google Scholar] [CrossRef] [Green Version]
- Hagen-Euteneuer, N.; Lutjohann, D.; Park, H.; Merrill, A.H., Jr.; van Echten-Deckert, G. Sphingosine 1-phosphate (s1p) lyase deficiency increases sphingolipid formation via recycling at the expense of de novo biosynthesis in neurons. J. Biol. Chem. 2012, 287, 9128–9136. [Google Scholar] [CrossRef] [Green Version]
- Mizugishi, K.; Yamashita, T.; Olivera, A.; Miller, G.F.; Spiegel, S.; Proia, R.L. Essential role for sphingosine kinases in neural and vascular development. Mol. Cell. Biol. 2005, 25, 11113–11121. [Google Scholar] [CrossRef] [PubMed] [Green Version]
- Couttas, T.A.; Kain, N.; Daniels, B.; Lim, X.Y.; Shepherd, C.; Kril, J.; Pickford, R.; Li, H.; Garner, B.; Don, A.S. Loss of the neuroprotective factor sphingosine 1-phosphate early in alzheimer’s disease pathogenesis. Acta Neuropathol. Commun. 2014, 2, 9. [Google Scholar] [CrossRef] [PubMed] [Green Version]
- Lei, M.; Teo, J.D.; Song, H.; McEwen, H.P.; Yup Lee, J.; Couttas, T.A.; Duncan, T.; Chesworth, R.; Bertz, J.; Przybyla, M.; et al. Sphingosine kinase 2 potentiates amyloid deposition but protects against hippocampal volume loss and demyelination in a mouse model of alzheimer’s disease. J. Neurosci. Off. J. Soc. Neurosci. 2019, 39, 9645–9659. [Google Scholar] [CrossRef] [PubMed]
- Lei, M.; Shafique, A.; Shang, K.; Couttas, T.A.; Zhao, H.; Don, A.S.; Karl, T. Contextual fear conditioning is enhanced in mice lacking functional sphingosine kinase 2. Behav. Brain Res. 2017, 333, 9–16. [Google Scholar] [CrossRef] [PubMed]
- Pfeilschifter, W.; Czech-Zechmeister, B.; Sujak, M.; Mirceska, A.; Koch, A.; Rami, A.; Steinmetz, H.; Foerch, C.; Huwiler, A.; Pfeilschifter, J. Activation of sphingosine kinase 2 is an endogenous protective mechanism in cerebral ischemia. Biochem. Biophys. Res. Commun. 2011, 413, 212–217. [Google Scholar] [CrossRef]
- Liu, H.; Sugiura, M.; Nava, V.E.; Edsall, L.C.; Kono, K.; Poulton, S.; Milstien, S.; Kohama, T.; Spiegel, S. Molecular cloning and functional characterization of a novel mammalian sphingosine kinase type 2 isoform. J. Biol. Chem. 2000, 275, 19513–19520. [Google Scholar] [CrossRef] [Green Version]
- Billich, A.; Bornancin, F.; Devay, P.; Mechtcheriakova, D.; Urtz, N.; Baumruker, T. Phosphorylation of the immunomodulatory drug fty720 by sphingosine kinases. J. Biol. Chem. 2003, 278, 47408–47415. [Google Scholar] [CrossRef] [Green Version]
- Lee, J.Y.; Han, S.H.; Park, M.H.; Baek, B.; Song, I.S.; Choi, M.K.; Takuwa, Y.; Ryu, H.; Kim, S.H.; He, X.; et al. Neuronal sphk1 acetylates cox2 and contributes to pathogenesis in a model of alzheimer’s disease. Nat. Commun. 2018, 9, 1479. [Google Scholar] [CrossRef]
- Olivera, A.; Kohama, T.; Tu, Z.; Milstien, S.; Spiegel, S. Purification and characterization of rat kidney sphingosine kinase. J. Biol. Chem. 1998, 273, 12576–12583. [Google Scholar] [CrossRef] [Green Version]
- Pitson, S.M.; D’Andrea, R.J.; Vandeleur, L.; Moretti, P.A.; Xia, P.; Gamble, J.R.; Vadas, M.A.; Wattenberg, B.W. Human sphingosine kinase: Purification, molecular cloning and characterization of the native and recombinant enzymes. Biochem. J. 2000, 350 Pt 2, 429–441. [Google Scholar] [CrossRef]
- Kharel, Y.; Mathews, T.P.; Kennedy, A.J.; Houck, J.D.; Macdonald, T.L.; Lynch, K.R. A rapid assay for assessment of sphingosine kinase inhibitors and substrates. Anal. Biochem. 2011, 411, 230–235. [Google Scholar] [CrossRef] [Green Version]
- Schmitt, S.; Castelvetri, L.C.; Simons, M. Metabolism and functions of lipids in myelin. Biochim. Biophys. Acta 2015, 1851, 999–1005. [Google Scholar] [CrossRef] [PubMed]
- O’Brien, J.S.; Sampson, E.L. Lipid composition of the normal human brain: Gray matter, white matter, and myelin. J. Lipid Res. 1965, 6, 537–544. [Google Scholar] [PubMed]
- Jojima, K.; Edagawa, M.; Sawai, M.; Ohno, Y.; Kihara, A. Biosynthesis of the anti-lipid-microdomain sphingoid base 4,14-sphingadiene by the ceramide desaturase fads3. FASEB J. 2020, 34, 3318–3335. [Google Scholar] [CrossRef] [PubMed]
- Fyrst, H.; Zhang, X.; Herr, D.R.; Byun, H.S.; Bittman, R.; Phan, V.H.; Harris, G.L.; Saba, J.D. Identification and characterization by electrospray mass spectrometry of endogenous drosophila sphingadienes. J. Lipid Res. 2008, 49, 597–606. [Google Scholar] [CrossRef] [Green Version]
- Le Stunff, H.; Giussani, P.; Maceyka, M.; Lepine, S.; Milstien, S.; Spiegel, S. Recycling of sphingosine is regulated by the concerted actions of sphingosine-1-phosphate phosphohydrolase 1 and sphingosine kinase 2. J. Biol. Chem. 2007, 282, 34372–34380. [Google Scholar] [CrossRef] [Green Version]
- Ogawa, C.; Kihara, A.; Gokoh, M.; Igarashi, Y. Identification and characterization of a novel human sphingosine-1-phosphate phosphohydrolase, hspp2. J. Biol. Chem. 2003, 278, 1268–1272. [Google Scholar] [CrossRef] [Green Version]
- Abuhusain, H.J.; Matin, A.; Qiao, Q.; Shen, H.; Kain, N.; Day, B.W.; Stringer, B.W.; Daniels, B.; Laaksonen, M.A.; Teo, C.; et al. A metabolic shift favouring sphingosine 1-phosphate at the expense of ceramide controls glioblastoma angiogenesis. J. Biol. Chem. 2013, 288, 37355–37364. [Google Scholar] [CrossRef] [Green Version]
- Pham, H.T.; Maccarone, A.T.; Thomas, M.C.; Campbell, J.L.; Mitchell, T.W.; Blanksby, S.J. Structural characterization of glycerophospholipids by combinations of ozone- and collision-induced dissociation mass spectrometry: The next step towards “top-down” lipidomics. Analyst 2014, 139, 204–214. [Google Scholar] [CrossRef]
- Thomas, M.C.; Mitchell, T.W.; Harman, D.G.; Deeley, J.M.; Nealon, J.R.; Blanksby, S.J. Ozone-induced dissociation: Elucidation of double bond position within mass-selected lipid ions. Anal. Chem. 2008, 80, 303–311. [Google Scholar] [CrossRef] [PubMed] [Green Version]
- Brown, S.H.; Mitchell, T.W.; Blanksby, S.J. Analysis of unsaturated lipids by ozone-induced dissociation. Biochim. Biophys. Acta 2011, 1811, 807–817. [Google Scholar] [CrossRef] [PubMed]
- Baba, T.; Campbell, J.L.; Le Blanc, J.C.Y.; Baker, P.R.S.; Ikeda, K. Quantitative structural multiclass lipidomics using differential mobility: Electron impact excitation of ions from organics (EIEIO) mass spectrometry. J. Lipid Res. 2018, 59, 910–919. [Google Scholar] [CrossRef] [PubMed] [Green Version]
- Campbell, J.L.; Baba, T. Near-complete structural characterization of phosphatidylcholines using electron impact excitation of ions from organics. Anal. Chem. 2015, 87, 5837–5845. [Google Scholar] [CrossRef] [PubMed]
- Renkonen, O.; Hirvisalo, E.L. Structure of plasma sphingadienine. J. Lipid Res. 1969, 10, 687–693. [Google Scholar]
- Polito, A.J.; Akita, T.; Sweeley, C.C. Gas chromatography and mass spectrometry of sphingolipid bases. Characterization of sphinga-4,14-dienine from plasma sphingomyelin. Biochemistry 1968, 7, 2609–2614. [Google Scholar] [CrossRef]
- Panganamala, R.V.; Geer, J.C.; Cornwell, D.G. Long-chain bases in the sphingolipids of atherosclerotic human aorta. J. Lipid Res. 1969, 10, 445–455. [Google Scholar]
- Karsai, G.; Lone, M.; Kutalik, Z.; Brenna, J.T.; Li, H.; Pan, D.; von Eckardstein, A.; Hornemann, T. Fads3 is a delta14z sphingoid base desaturase that contributes to gender differences in the human plasma sphingolipidome. J. Biol. Chem. 2020, 295, 1889–1897. [Google Scholar] [CrossRef] [Green Version]
- Sullards, M.C.; Lynch, D.V.; Merrill, A.H., Jr.; Adams, J. Structure determination of soybean and wheat glucosylceramides by tandem mass spectrometry. J. Mass Spectrom. 2000, 35, 347–353. [Google Scholar] [CrossRef]
- Aida, K.; Kinoshita, M.; Tanji, M.; Sugawara, T.; Tamura, M.; Ono, J.; Ueno, N.; Ohnishi, M. Prevention of aberrant crypt foci formation by dietary maize and yeast cerebrosides in 1,2-dimethylhydrazine-treated mice. J. Oleo Sci. 2005, 54, 45–49. [Google Scholar] [CrossRef]
- Kumar, A.; Pandurangan, A.K.; Lu, F.; Fyrst, H.; Zhang, M.; Byun, H.S.; Bittman, R.; Saba, J.D. Chemopreventive sphingadienes downregulate wnt signaling via a pp2a/akt/gsk3beta pathway in colon cancer. Carcinogenesis 2012, 33, 1726–1735. [Google Scholar] [CrossRef] [PubMed] [Green Version]
- Fyrst, H.; Oskouian, B.; Bandhuvula, P.; Gong, Y.; Byun, H.S.; Bittman, R.; Lee, A.R.; Saba, J.D. Natural sphingadienes inhibit akt-dependent signaling and prevent intestinal tumorigenesis. Cancer Res. 2009, 69, 9457–9464. [Google Scholar] [CrossRef] [PubMed] [Green Version]
- Zhao, P.; Aguilar, A.E.; Lee, J.Y.; Paul, L.A.; Suh, J.H.; Puri, L.; Zhang, M.; Beckstead, J.; Witkowski, A.; Ryan, R.O.; et al. Sphingadienes show therapeutic efficacy in neuroblastoma in vitro and in vivo by targeting the akt signaling pathway. Investig. New Drugs 2018, 36, 743–754. [Google Scholar] [CrossRef] [PubMed]
- Ternes, P.; Franke, S.; Zahringer, U.; Sperling, P.; Heinz, E. Identification and characterization of a sphingolipid delta 4-desaturase family. J. Biol. Chem. 2002, 277, 25512–25518. [Google Scholar] [CrossRef] [Green Version]
- Zhang, J.Y.; Qin, X.; Liang, A.; Kim, E.; Lawrence, P.; Park, W.J.; Kothapalli, K.S.D.; Brenna, J.T. Fads3 modulates docosahexaenoic acid in liver and brain. Prostaglandins Leukot Essent. Fat. Acids 2017, 123, 25–32. [Google Scholar] [CrossRef]
- Skarnes, W.C.; Rosen, B.; West, A.P.; Koutsourakis, M.; Bushell, W.; Iyer, V.; Mujica, A.O.; Thomas, M.; Harrow, J.; Cox, T.; et al. A conditional knockout resource for the genome-wide study of mouse gene function. Nature 2011, 474, 337–342. [Google Scholar] [CrossRef] [Green Version]
- Zhang, T.; Barclay, L.; Walensky, L.D.; Saghatelian, A. Regulation of mitochondrial ceramide distribution by members of the bcl-2 family. J. Lipid Res. 2015, 56, 1501–1510. [Google Scholar] [CrossRef] [Green Version]
- Emery, B.; Dugas, J.C. Purification of oligodendrocyte lineage cells from mouse cortices by immunopanning. Cold Spring Harb. Protoc. 2013, 2013, 854–868. [Google Scholar] [CrossRef]
- Dull, T.; Zufferey, R.; Kelly, M.; Mandel, R.J.; Nguyen, M.; Trono, D.; Naldini, L. A third-generation lentivirus vector with a conditional packaging system. J. Virol. 1998, 72, 8463–8471. [Google Scholar] [CrossRef] [Green Version]
- Matyash, V.; Liebisch, G.; Kurzchalia, T.V.; Shevchenko, A.; Schwudke, D. Lipid extraction by methyl-tert-butyl ether for high-throughput lipidomics. J. Lipid Res. 2008, 49, 1137–1146. [Google Scholar] [CrossRef] [Green Version]
- Turner, N.; Lim, X.Y.; Toop, H.D.; Osborne, B.; Brandon, A.E.; Taylor, E.N.; Fiveash, C.E.; Govindaraju, H.; Teo, J.D.; McEwen, H.P.; et al. A selective inhibitor of ceramide synthase 1 reveals a novel role in fat metabolism. Nat. Commun. 2018, 9, 3165. [Google Scholar] [CrossRef] [PubMed]
- Hejazi, L.; Wong, J.W.; Cheng, D.; Proschogo, N.; Ebrahimi, D.; Garner, B.; Don, A.S. Mass and relative elution time profiling: Two-dimensional analysis of sphingolipids in alzheimer’s disease brains. Biochem. J. 2011, 438, 165–175. [Google Scholar] [CrossRef] [PubMed] [Green Version]


| Lipid | MW | Cal. m/z | Obs. m/z | Ion | WT Mean ± SD 1 | SphK2−/− Mean ± SD 1 | p Value 2 | Q Value 3 |
|---|---|---|---|---|---|---|---|---|
| Cer(d18:2/18:0) | 563.5277 | 564.5350 | 564.5343 | H+ | 0.943 ± 0.410 | 4.558 ± 1.649 | 0.0001 | 0.0381 |
| HexCer(d18:2/21:0-OH) | 783.6224 | 784.6297 | 784.6297 | H+ | 0.010 ± 0.006 | 0.064 ± 0.038 | 0.0003 | 0.0466 |
| Cer(d18:2/22:0) | 619.5903 | 620.5976 | 620.5953 | H+ | 0.005 ± 0.002 | 0.016 ± 0.003 | 0.0004 | 0.0466 |
| Cer(d18:2/22:1) | 617.5747 | 618.5820 | 618.5818 | H+ | 0.042 ± 0.028 | 0.152 ± 0.062 | 0.0011 | 0.0954 |
| SM(d38:2) | 756.6145 | 757.6218 | 757.6210 | H+ | 0.049 ± 0.015 | 0.139 ± 0.060 | 0.0015 | 0.0954 |
| SM(d36:2) | 728.5832 | 729.5905 | 729.5903 | H+ | 2.643 ± 1.259 | 7.277 ± 2.998 | 0.0016 | 0.0954 |
| HexCer(d18:2/18:0) | 725.5805 | 726.5878 | 726.5870 | H+ | 0.028 ± 0.016 | 0.096 ± 0.050 | 0.0020 | 0.0954 |
| Cer(d18:2/24:1) | 645.6060 | 646.6133 | 646.6132 | H+ | 0.008 ± 0.006 | 0.030 ± 0.013 | 0.0021 | 0.0954 |
| HexCer(d18:2/18:0-OH) | 741.5755 | 742.5828 | 742.5820 | H+ | 0.031 ± 0.018 | 0.095 ± 0.057 | 0.0025 | 0.0954 |
| HexCer(d18:2/20:0-OH) | 769.6068 | 770.6141 | 770.6111 | H+ | 0.045 ± 0.027 | 0.197 ± 0.129 | 0.0025 | 0.0954 |
| Cer(d18:2/23:1) | 631.5898 | 632.5976 | 632.5975 | H+ | 0.018 ± 0.013 | 0.053 ± 0.019 | 0.0029 | 0.0954 |
| Cer(d18:2/22:0-OH) | 635.5853 | 636.5925 | 636.5922 | H+ | 0.014 ± 0.010 | 0.042 ± 0.017 | 0.0030 | 0.0954 |
| Cer(d18:2/24:2) | 643.5903 | 644.5976 | 644.5974 | H+ | 0.019 ± 0.012 | 0.052 ± 0.023 | 0.0034 | 0.0999 |
© 2020 by the authors. Licensee MDPI, Basel, Switzerland. This article is an open access article distributed under the terms and conditions of the Creative Commons Attribution (CC BY) license (http://creativecommons.org/licenses/by/4.0/).
Share and Cite
Couttas, T.A.; Rustam, Y.H.; Song, H.; Qi, Y.; Teo, J.D.; Chen, J.; Reid, G.E.; Don, A.S. A Novel Function of Sphingosine Kinase 2 in the Metabolism of Sphinga-4,14-Diene Lipids. Metabolites 2020, 10, 236. https://doi.org/10.3390/metabo10060236
Couttas TA, Rustam YH, Song H, Qi Y, Teo JD, Chen J, Reid GE, Don AS. A Novel Function of Sphingosine Kinase 2 in the Metabolism of Sphinga-4,14-Diene Lipids. Metabolites. 2020; 10(6):236. https://doi.org/10.3390/metabo10060236
Chicago/Turabian StyleCouttas, Timothy Andrew, Yepy Hardi Rustam, Huitong Song, Yanfei Qi, Jonathan David Teo, Jinbiao Chen, Gavin Edmund Reid, and Anthony Simon Don. 2020. "A Novel Function of Sphingosine Kinase 2 in the Metabolism of Sphinga-4,14-Diene Lipids" Metabolites 10, no. 6: 236. https://doi.org/10.3390/metabo10060236