Article

Cascading Effects of Root Microbial Symbiosis on the Development and Metabolome of the Insect Herbivore Manduca sexta L.

by
Dimitra Papantoniou
1,2,
Fredd Vergara
1,2,
Alexander Weinhold
1,2,
Teresa Quijano
3,
Bekzod Khakimov
4,
David I. Pattison
5,
Søren Bak
5,
Nicole M. van Dam
1,2,*,† and
Ainhoa Martínez-Medina
6,*,†
1
German Centre for Integrative Biodiversity Research (iDiv) Halle-Jena-Leipzig, Puschstrasse 4, 04103 Leipzig, Germany
2
Institute of Biodiversity, Friedrich-Schiller Universität Jena, Dornburger Str. 159, 07743 Jena, Germany
3
Departamento de Ecología Tropical, Campus de Ciencias Biológicas y Agropecuarias, Universidad Autónoma de Yucatán, Apartado Postal 4-116, Itzimná 97000, Mexico
4
Department of Food Science, University of Copenhagen Rolighedsvej 26, 1958 Frederiksberg C, Denmark
5
Department of Plant and Environmental Sciences, Faculty of Science, University of Copenhagen, Thorvaldsensvej 40, 1871 Frederiksberg C, Denmark
6
Plant-Microorganism Interaction, Institute of Natural Resources and Agrobiology of Salamanca, 37008 Salamanca, Spain
*
Authors to whom correspondence should be addressed.
These authors contributed equally.
Metabolites 2021, 11(11), 731; https://doi.org/10.3390/metabo11110731
Submission received: 6 July 2021 / Revised: 6 October 2021 / Accepted: 20 October 2021 / Published: 25 October 2021
(This article belongs to the Special Issue Metabolomics in Chemical Ecology)

Abstract

:
Root mutualistic microbes can modulate the production of plant secondary metabolites affecting plant–herbivore interactions. Still, the main mechanisms underlying the impact of root mutualists on herbivore performance remain ambiguous. In particular, little is known about how changes in the plant metabolome induced by root mutualists affect the insect metabolome and post-larval development. By using bioassays with tomato plants (Solanum lycopersicum), we analyzed the impact of the arbuscular mycorrhizal fungus Rhizophagus irregularis and the growth-promoting fungus Trichoderma harzianum on the plant interaction with the specialist insect herbivore Manduca sexta. We found that root colonization by the mutualistic microbes impaired insect development, including metamorphosis. By using untargeted metabolomics, we found that root colonization by the mutualistic microbes altered the secondary metabolism of tomato shoots, leading to enhanced levels of steroidal glycoalkaloids. Untargeted metabolomics further revealed that root colonization by the mutualists affected the metabolome of the herbivore, leading to an enhanced accumulation of steroidal glycoalkaloids and altered patterns of fatty acid amides and carnitine-derived metabolites. Our results indicate that the changes in the shoot metabolome triggered by root mutualistic microbes can cascade up altering the metabolome of the insects feeding on the colonized plants, thus affecting the insect development.

Graphical Abstract

1. Introduction

Plants are a nutritious food source for insect species that belong to a wide range of taxonomic groups. To defend themselves against phytophagous insects, plants can produce a large range of metabolites that have repellent, anti-nutritive, or toxic effects on herbivores [1]. Commonly, they are secondary plant metabolites, such as alkaloids, benzoxazinoids, glucosinolates, terpenoids, phenolics, non-protein amino acids and cyanogenic glucosides [2,3]. Moreover, plants produce a number of defense proteins that reduce the digestibility of plants, such as protein inhibitors, α-amylase inhibitors, and polyphenol oxidases [4]. These metabolites can be produced constitutively or are induced upon herbivore damage. Many of these metabolites are either toxic or deterrent to herbivores, thereby reducing herbivore damage. In addition, some metabolites can also disrupt molting and other developmental and physiological processes in insects with lethal consequences [5,6,7]. For instance, alkaloids can affect nerve signal transmission in insects by disturbing the cell membrane and the cytoskeletal structure, causing the collapse and leakage of cells [8]. In addition, terpenoids can disturb the nervous system of insects by inhibiting acetylcholinesterase [9]. Furthermore, they can inhibit ATP synthase, the alkylation of nucleophiles and interfere with insect molting [10]. Many herbivores have evolved mechanisms to overcome the negative effects of plant defense metabolites. These include, among others, the rapid excretion and detoxification through conjugation and breakdown [11]. Moreover, specialist herbivores can also sequester some defensive chemicals and use them for self-defense against their own natural enemies [12,13,14]. As a result, specialized herbivores feeding on defended plants can ingest plant-produced toxic metabolites without suffering major consequences. Remarkably, anti-herbivore metabolites that are affecting basic processes, such as molting, are less easy for insect herbivores to adapt to, and therefore can also affect specialists.
In addition to detrimental interactions, mutualistic plant interactions are also frequent in nature [15]. Plants nurture a vast community of mutualistic microbes in their root systems, which provides their host plants with essential functions related to nutrient acquisition and immune system modulation. Among the most abundant and widespread root associated mutualistic microbes are the arbuscular mycorrhizal (AM) and Trichoderma fungi, which establish root symbioses with the majority of land plants [16,17]. Mycorrhizal fungi have co-evolved with plants for 400 million years and form symbiotic interactions with ≈80% of all plant species [18,19,20,21]. Mycorrhizal roots form an extensive network of fungal hyphae, which increases the plant’s exploratory capacity for water and mineral nutrients. Specialized fungal structures, called arbuscules, develop within root cells to facilitate nutrient exchange between the partners [20,21]. Trichoderma fungi are also ubiquitous soil microbes that display relatively low host specificity. In contrast to AM fungi, Trichoderma fungi are highly opportunistic, being capable of colonizing not only plant roots, but also aboveground plant parts and numerous other substrates such as wood and even other fungi [17,22,23,24,25].
Plants colonized by AM or Trichoderma fungi usually benefit from improved water and nutrient uptake, showing increased plant size, vigor, and nutrient levels [19,26,27,28,29]. These traits are important indicators of plant quality for herbivores [30,31,32]. In addition, root colonization by AM and Trichoderma fungi triggers a variety of molecular and biochemical responses in their host plants, including differential expression of defense-related genes and changes in the production of secondary metabolites. For instance, mycorrhizal colonization leads to a higher amount of iridoid glycosides and flavonoids in plantain and white clover leaves, respectively [33,34]. In addition, AM colonization has been shown to upregulate several plant secondary metabolite pathways, such as the carotenoid, the phenylpropanoid, and the antioxidant pathways [35,36], as well as to prime the accumulation of alkaloids and fatty acids upon herbivory [37]. Along the same lines, several studies have revealed that Trichoderma inoculation can trigger a higher accumulation of alkaloids, flavonoids, and phenolics; stress- and defense-related hormones; and transcripts related to different hormonal pathways in different plant species [38,39,40,41,42,43]. As a consequence, root colonization by AM or Trichoderma fungi can affect the performance of insect herbivores, as well as the amount of herbivore damage received by plants. However, the impact of the symbiotic fungi on herbivore performance can range from negative to positive, making the outcome of the symbiosis highly context-dependent [44].
Studies addressing the mechanistic basis of how plant mutualistic microbes affect plant–insect interactions focus specifically on physiological and metabolic changes in the plant. By contrast, how changes in the plant metabolome triggered by plant mutualistic microbes can affect the metabolome of insect herbivores, and thus affect their life cycle, remains obscure. Here, we hypothesize that the impact of root colonization by AM and Trichoderma fungi on the plant metabolome can cascade up, thereby affecting the metabolome of insect herbivores that feed on the leaves of root-colonized plants. We further hypothesize that these changes in the herbivore’s metabolome will affect its life cycle. By using tomato (Solanum lycopersicum) and the specialist chewing insect Manduca sexta as a model system, we found that root colonization by Rhizophagus irregularis or Trichoderma harzianum negatively affected the metamorphosis success of larvae that fed on the leaves of root-colonized plants. We further found that root colonization by the mutualistic fungi significantly affected the metabolome of the leaves as well as that of fat body and guts of larvae feeding on the colonized plants. Overall, our results indicate that the impact of root-mutualistic microbes can cascade up the trophic food chain, affecting the plant metabolome as well as the metabolism and the development of insect herbivores.

2. Results

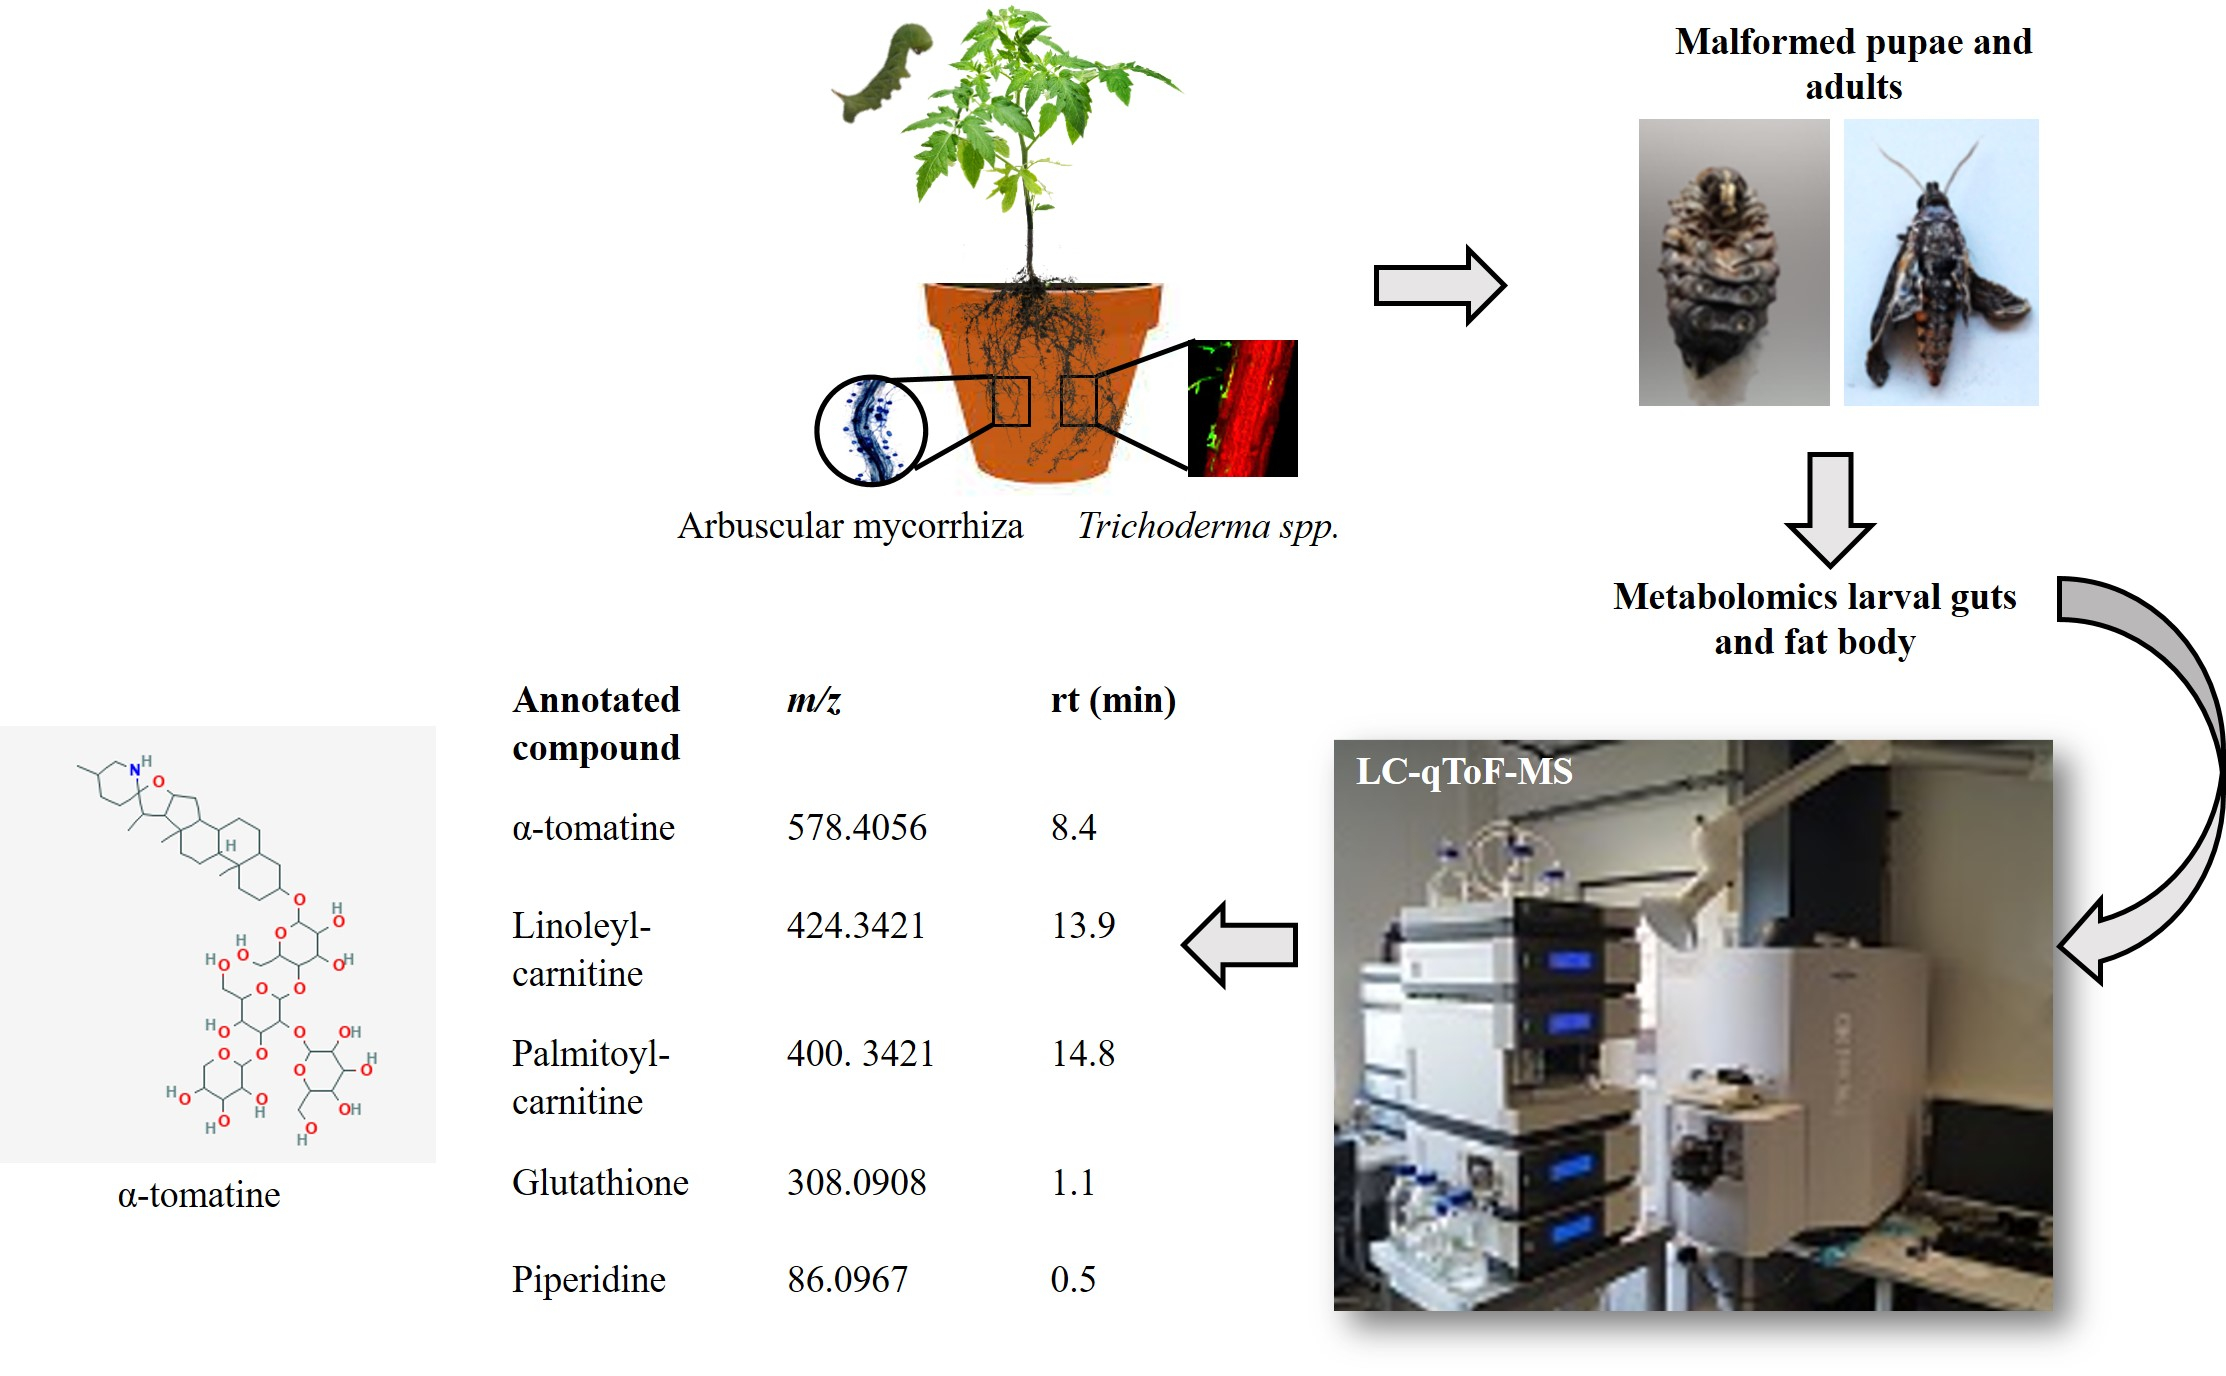
2.1. Root Colonization by Rhizophagus irregularis or Trichoderma harzianum Impaired Pupation and Adult Emergence of Manduca sexta Larvae

We first aimed to assess whether root colonization by R. irregularis and T. harzianum affects the development of M. sexta larvae that fed on leaves of the root-inoculated plants. With this aim, we established a bioassay, in which we inoculated tomato roots with the mutualistic microbes and allowed M. sexta larvae to feed on the inoculated plants during the larval stage. After this, we assessed the impact of the different plant treatments on insect development, pupation, and adult emergence. We observed neither significant differences in the time required for the larvae to enter the pre-pupal stage, nor in the time required to complete the pupation process (Table 1). However, the number of individuals that successfully developed into normal pupae differed among the plant treatments. About 75% of the pupae developed by larvae fed on non-inoculated plants or R. irregularis-inoculated plants looked healthy (Table 1, Figure 1A). By contrast, about 60% of the larvae fed on T. harzianum-inoculated plants formed pupae with an aberrant morphology (Table 1, Figure 1A). Even though there were no significant differences in the pupal weight among the different plant treatments (Table 1), we observed significant differences in the sex ratio of the healthy pupae. Larvae fed on non-inoculated plants showed a female-based sex ratio of 0.69 (Table 1). The sex ratio of pupae emerging on R. irregularis plants was male-based (female: male ratio 0.3), being significantly different from that on control plants (χ2 = 4.196, α = 0.05). On T. harzianum-inoculated plants, the sex ratio was male-based as well, but the low number of healthy pupae recovered was not sufficient to detect statistically significant differences (Table 1). Most of the healthy pupae that were formed by individuals reared on control plants eclosed, and the emerged adults presented a normal morphology (Table 1, Figure 1B). By contrast, fewer healthy adults emerged from the individuals reared on R. irregularis plants and a higher number of adults showed an anomalous morphology, mostly underdeveloped wings (Table 1, Figure 1B). The number of healthy pupae formed by individuals reared on T. harzianum-colonized plants was not enough for detecting differences (Table 1, Figure 1B). In summary, the performance of individuals varied among the different plant treatments. About 53% of the surviving larvae that were reared on non-inoculated plants developed into apparently healthy adults. This percentage was much lower for individuals reared on R. irregularis-(27%) or on T. harzianum (15%)-inoculated plants. Our results thus indicate that root colonization by the mutualistic microbes has a strong effect on the metamorphosis success of M. sexta larvae that had fed on the leaves of the root-inoculated plants.

2.2. Root Colonization by Rhizophagus irregularis or Trichoderma harzianum Altered the Metabolomic Profile of Tomato Leaves

We next reasoned that the significant impact of the beneficial microbes on M. sexta pupation and adult emergence (Table 1) should be associated with changes in the leaf metabolome induced by the mutualistic microbes. To assess this, we performed an experiment, in which tomato plants were root-inoculated with R. irregularis or T. harzianum, and leaf challenged with M. sexta larvae. Three weeks after challenging the plants, we explored the impact of the mutualistic microbes and the herbivore on the constitutive and herbivore-induced leaf metabolome using liquid chromatography–quadrupole time of flight- mass spectrometry (LC-qToF-MS). The comparison between the R. irregularis-inoculated and non-inoculated plants showed that after three weeks of herbivory, the metabolomes of R. irregularis-inoculated and non-inoculated plants greatly overlapped (Figure 2A, dark blue dots vs. pink dots). However, in the absence of herbivory, the leaf metabolome of the R. irregularis-inoculated and non-inoculated plants clearly separated (Figure 2A, light blue dots vs. light green dots). Interestingly, the features that significantly contributed to the separation comprised alkaloids (identification level of confidence 1 according to the Metabolomics Standard Initiative (MSI) [45]). More precisely, the feature m/z = 578.4056, rt = 6.2 min was annotated as α-tomatine and showed its highest qToF intensity in the leaves of R. irregularis-inoculated plants (Figure S1A, Table S1). Similarly, the features m/z = 578.4051, rt = 6.0 min and m/z = 416.3524, rt = 6.0 min were annotated as α-tomatine isomers (level of confidence 1 according to MSI) and displayed their highest qToF intensity in the leaves of R. irregularis-inoculated plants (Figure S1B,C, Table S1). The feature m/z = 576.3898, rt = 5.5 min was annotated as an α-dehydrotomatine isomer (MSI level of confidence 2) and showed its highest qToF intensity in the leaf samples of the non-inoculated plants after herbivory (Figure S1D, Table S1). Moreover, the features m/z = 576.3896, rt = 5.6 min and m/z = 414.3369, rt = 5.6 min were annotated as α-dehydrotomatine isomers (MSI level of confidence 2) and displayed their highest qToF intensity in the leaves of R. irregularis-inoculated and non-inoculated plants under herbivory, but also in the leaves of R. irregularis-inoculated plants in the absence of herbivory (Figure S1E,F, Table S1).
The comparison between the T. harzianum-inoculated and non-inoculated plants showed that three weeks after herbivory, the metabolomes of T. harzianum-inoculated and non-inoculated plants greatly overlapped (Figure 2B, dark blue dots vs. pink dots). In absence of herbivory, a clear separation was observed between the T. harzianum-inoculated and the non-inoculated plants (Figure 2B, light blue dots vs. light green dots). The separation of the different treatments was driven by features such as steroidal glycoalkaloids. The feature m/z = 578.4056, rt = 6.2 min (MSI level of confidence 1) was predicted as α-tomatine and showed its highest qToF intensity in the leaves of T. harzianum-inoculated plants (Figure S2A, Table S2). Likewise, the features m/z = 578.4051, rt = 6.0 min and m/z = 416.3524, rt = 6.0 min were annotated as α-tomatine isomers (MSI level of confidence 1) and displayed their highest qToF intensities in the leaves of the plants inoculated with T. harzianum (Figure S2B,C, Table S2). In addition, the feature m/z = 414.3369, rt = 5.6 min was annotated as an α-dehydrotomatine isomer (MSI level of confidence 2) and showed the highest qToF intensity in the leaves of T. harzianum-inoculated plants (Figure S2D, Table S2). Another α-dehydrotomatine isomer, the feature m/z = 576.3896, rt = 5.6 min (MSI level of confidence 2) showed its highest qToF intensity in the leaves of non-inoculated and T. harzianum-inoculated plants after herbivory, but also in the leaves of T. harzianum-inoculated plants in the absence of herbivory (Figure S2E, Table S2).
Overall, our results indicate that root inoculation with R. irregularis or T. harzianum alters the shoot metabolome of tomato plants, although this effect seems to be overruled by a long period of M. sexta herbivory. Our results further indicate that steroidal glycoalkaloids are prominently present among the leaf metabolites showing the highest variation due to the root-microbial inoculation, and that they accumulated in a greater proportion in the leaves of the root-inoculated plants.

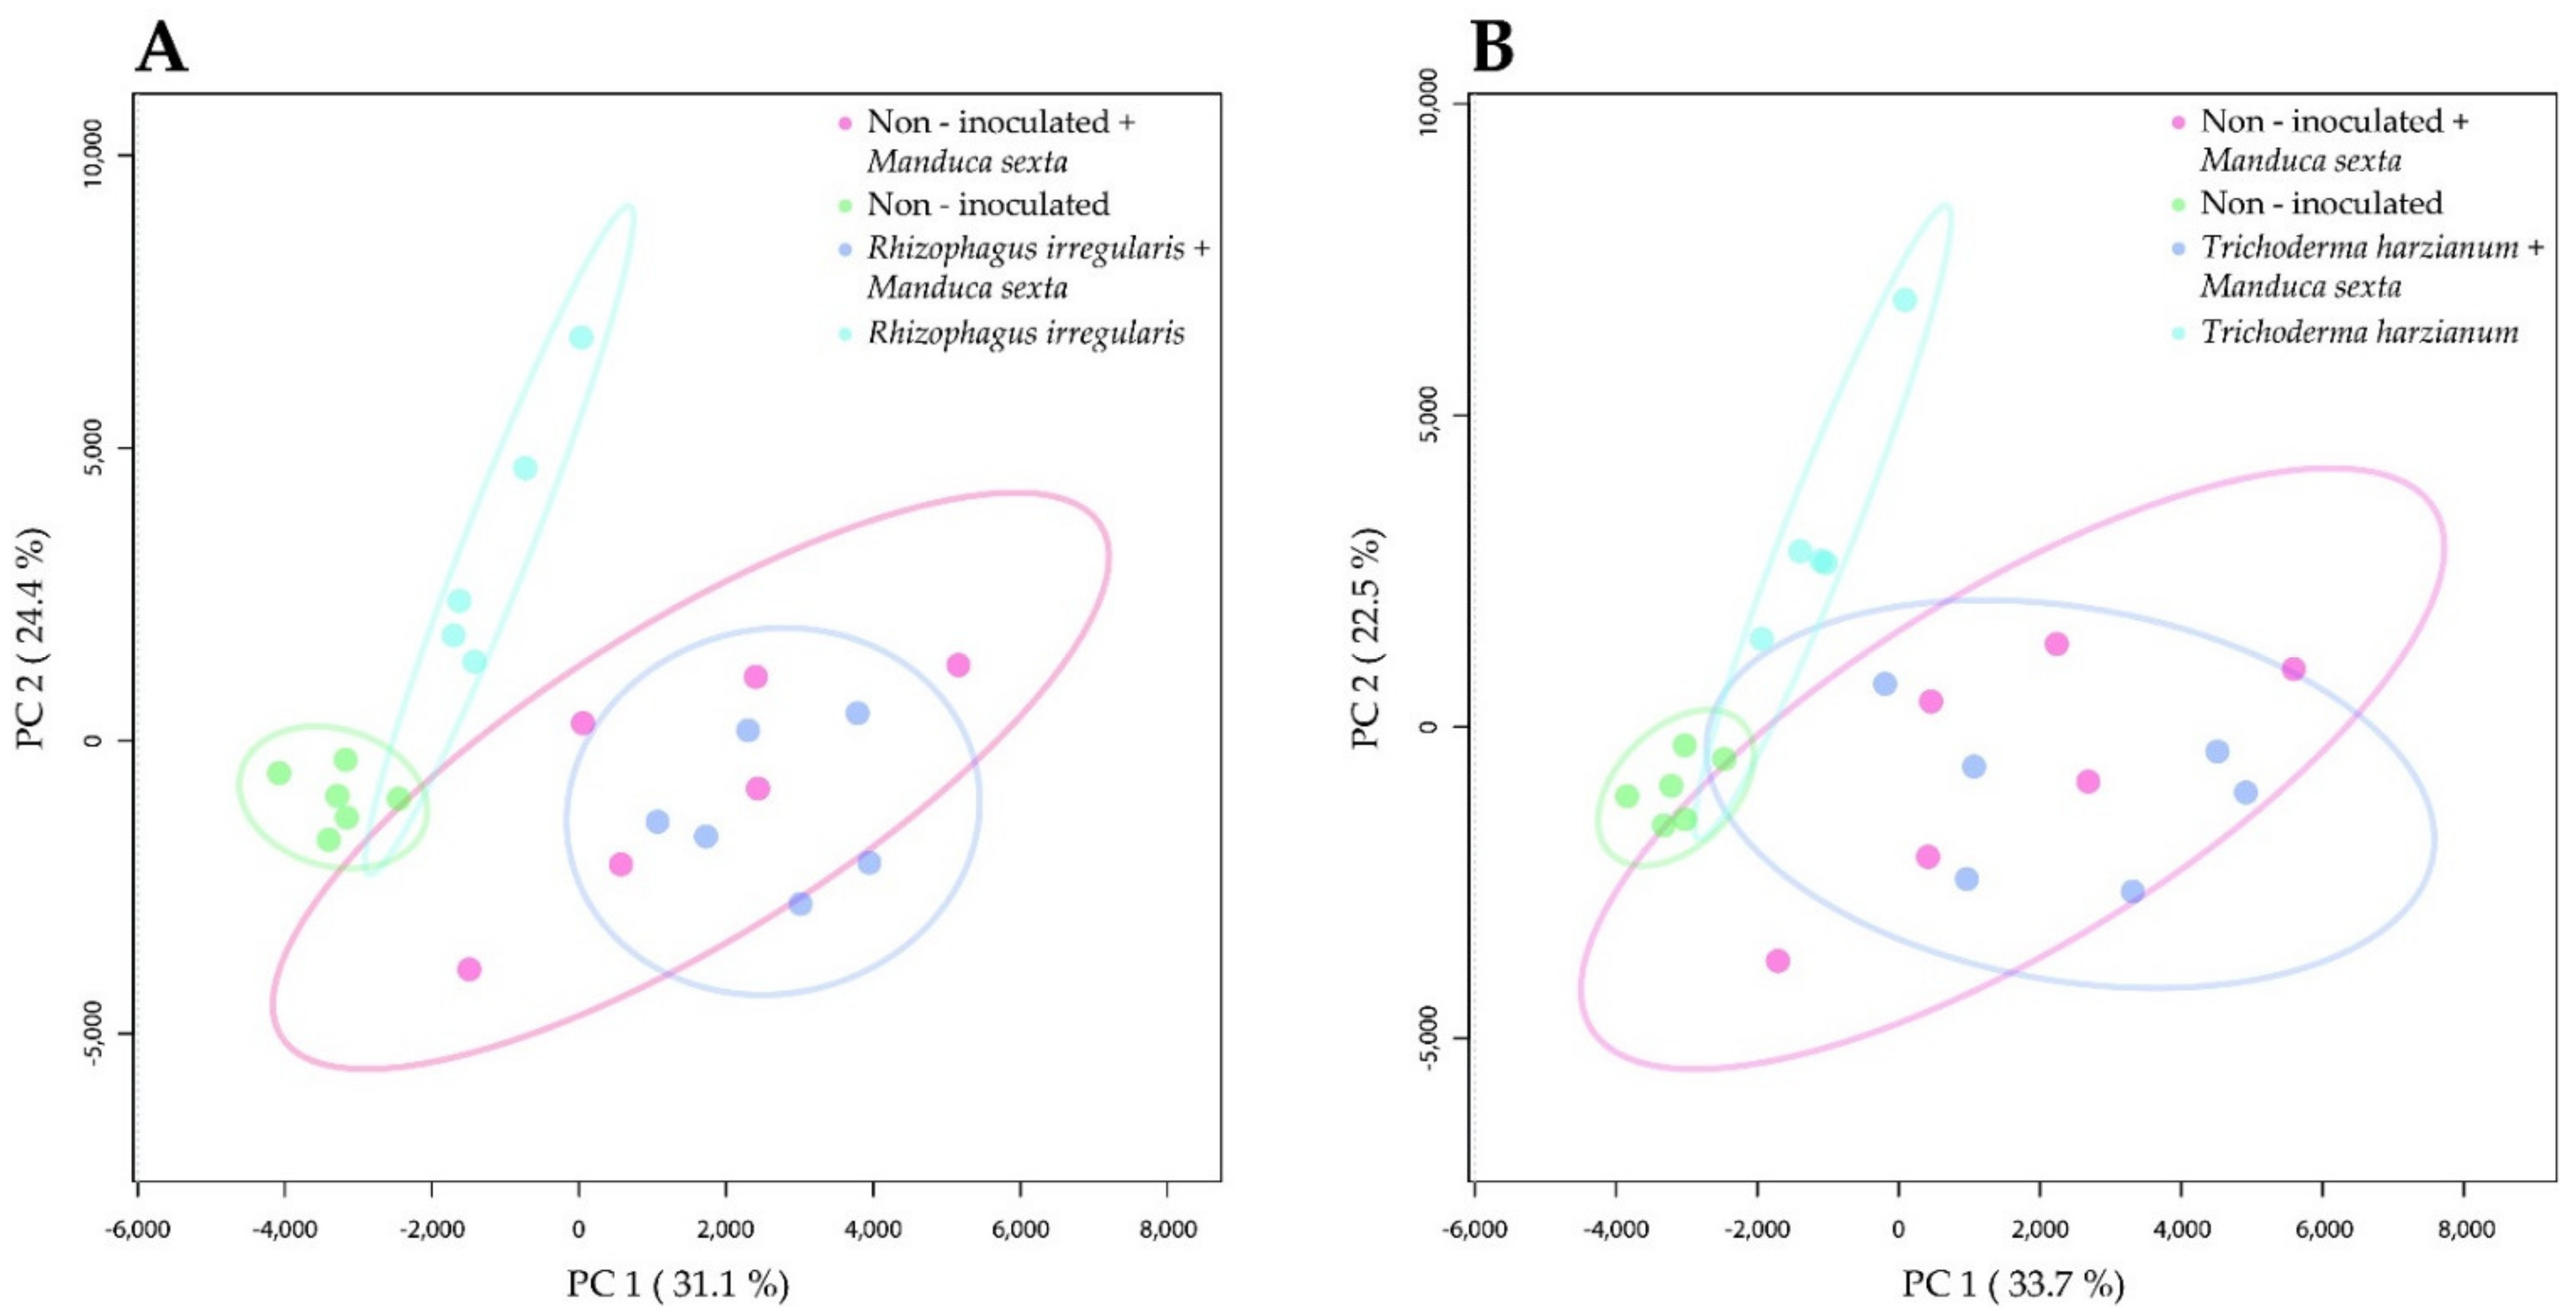
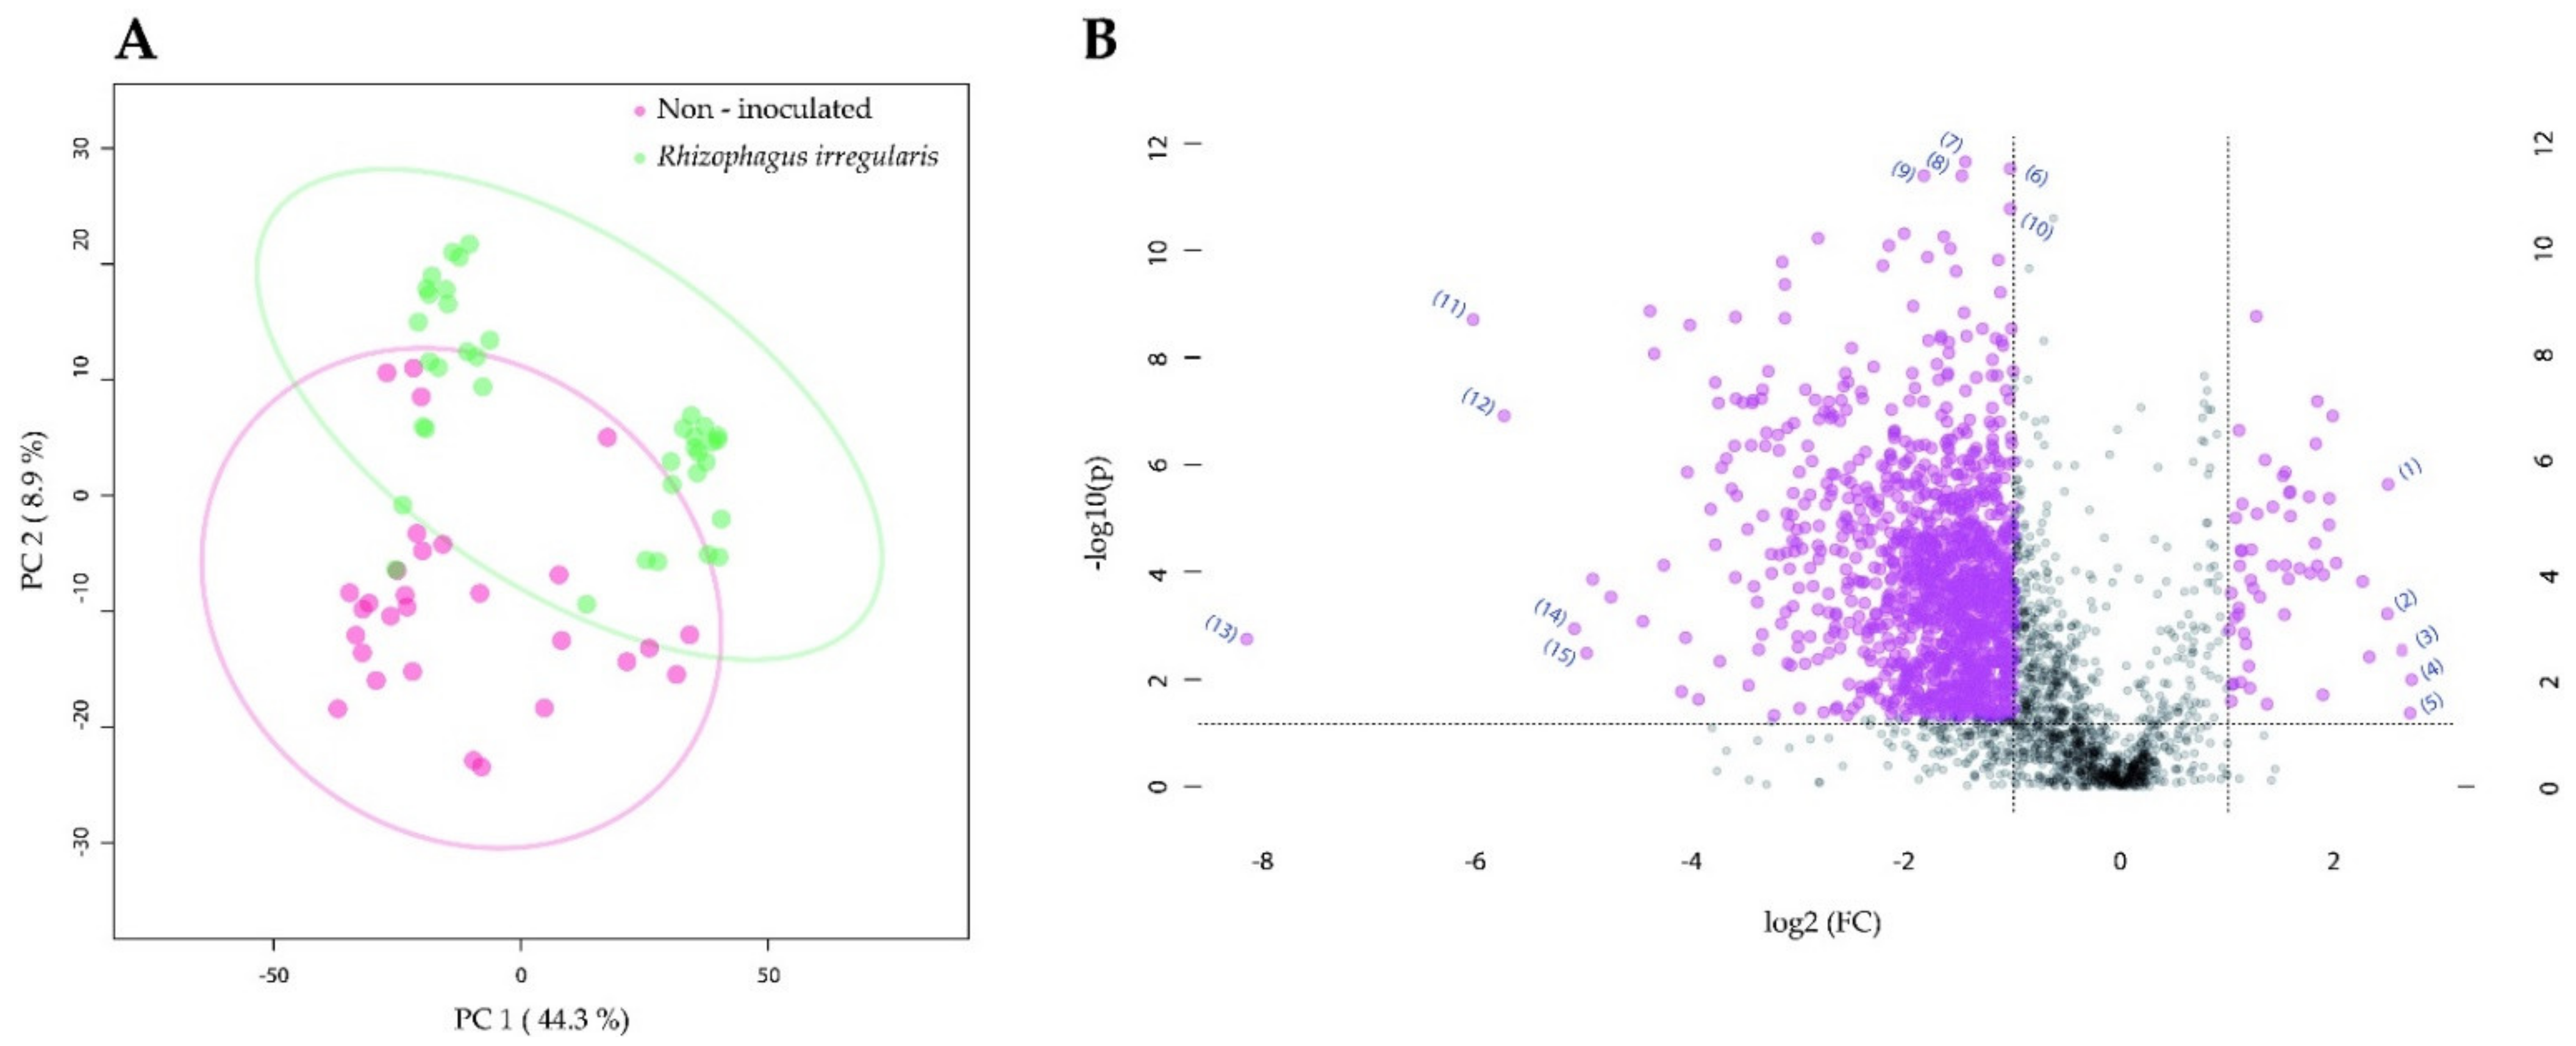
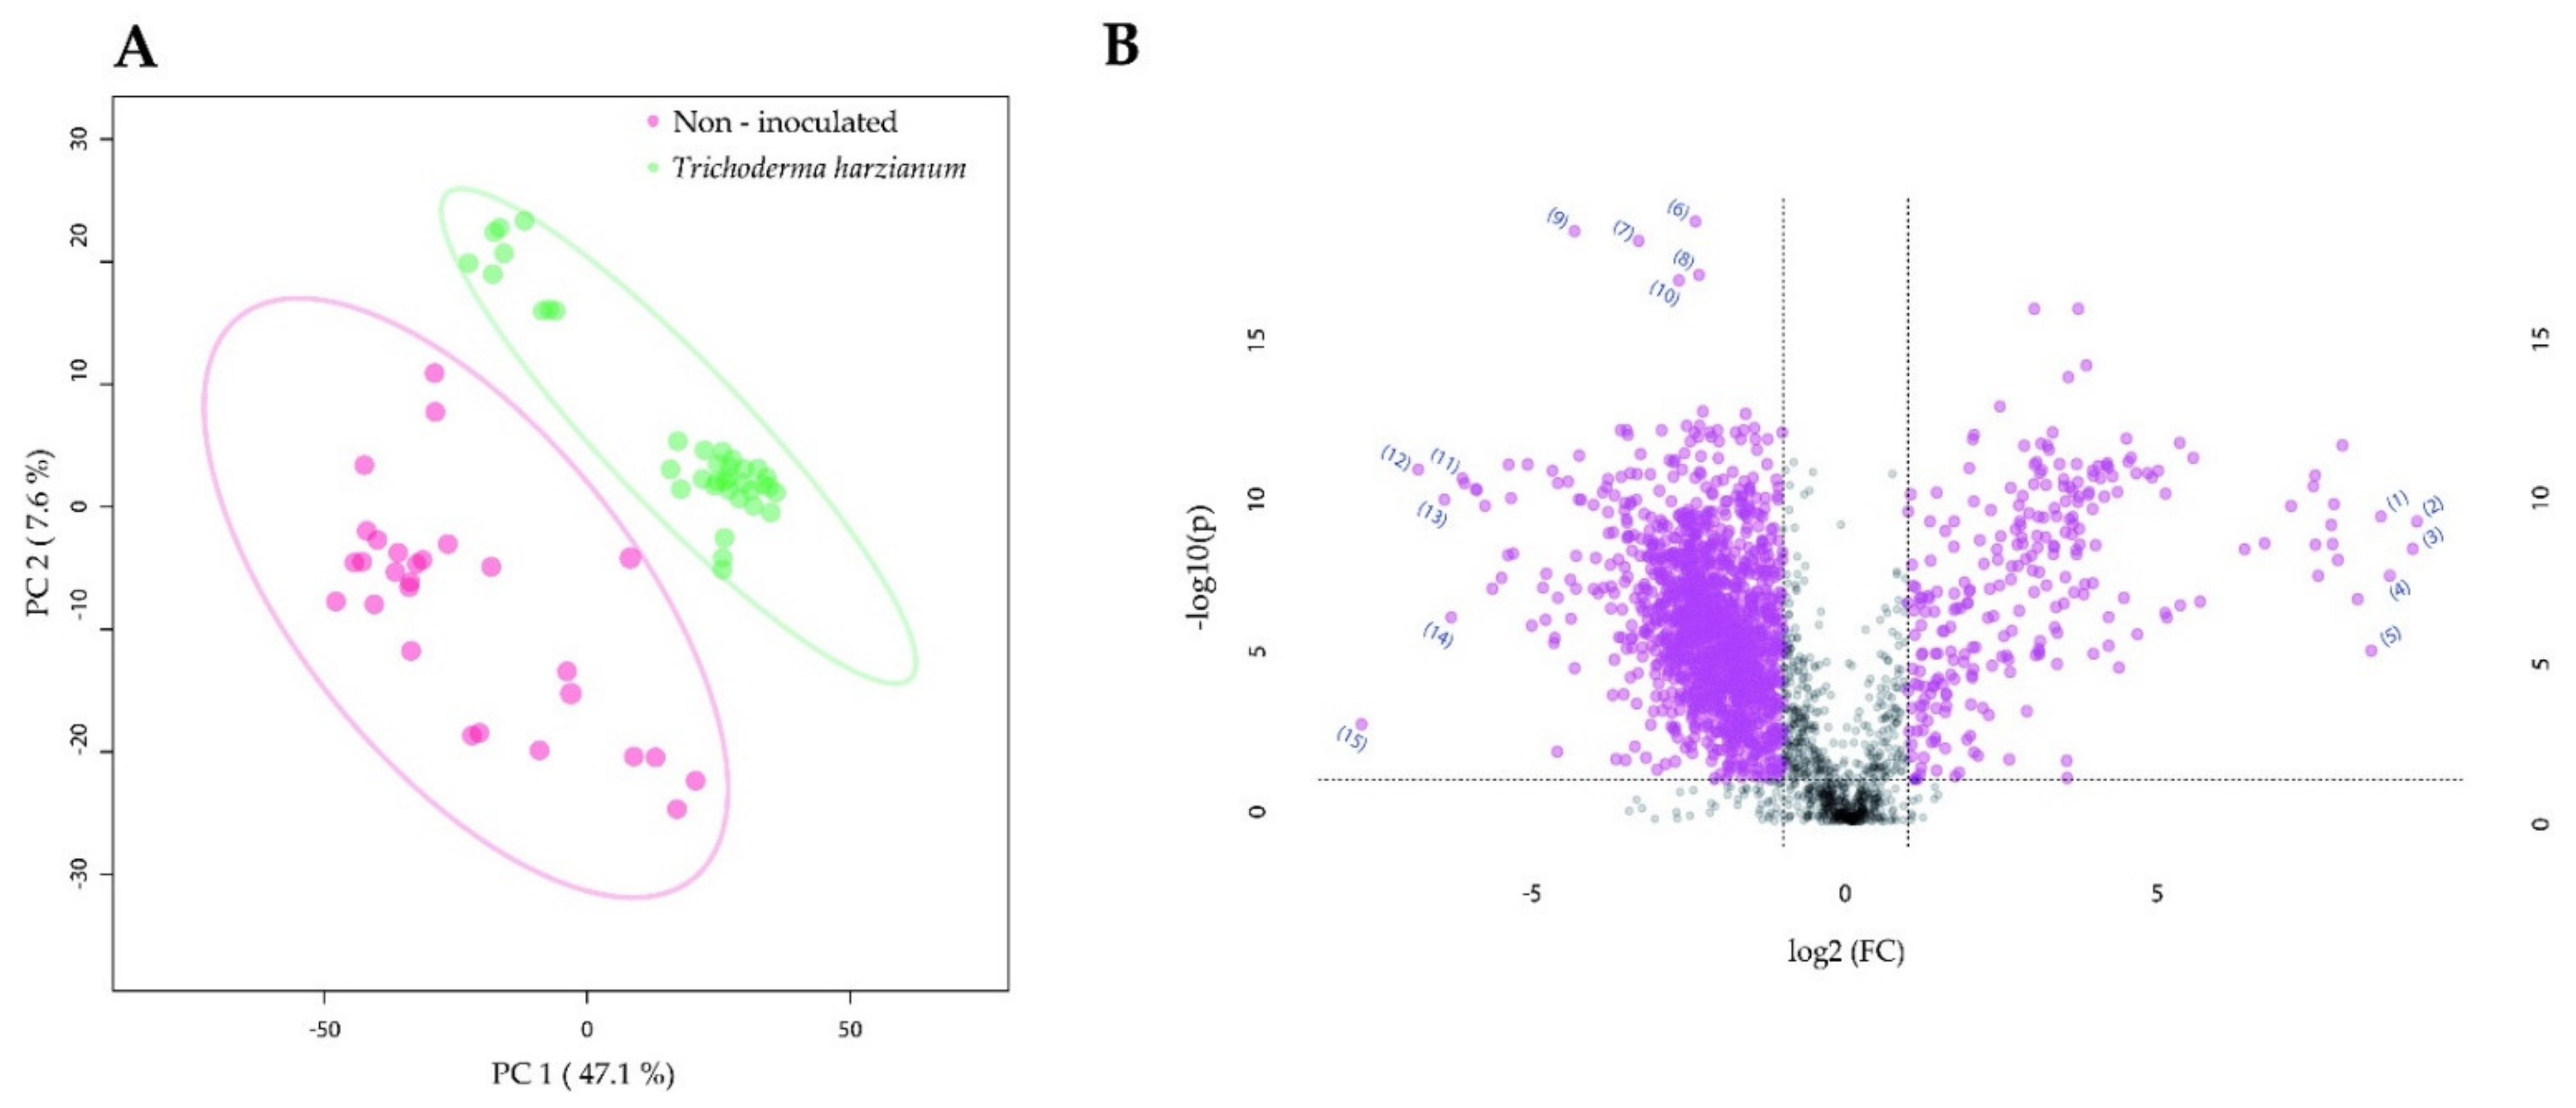
2.3. Root Colonization by Rhizophagus irregularis or Trichoderma harzianum Altered the Metabolic Profile of the Manduca sexta Larval Gut

We next aimed to understand whether the impact of the mutualistic microbes on the leaf metabolome (Figure 2) cascades up, thereby affecting the herbivore’s metabolome. Therefore, we analyzed the metabolome of the caterpillars reared on the root-colonized plants by using ultra high performance liquid chromatography–mass spectrometry (UHPLC-MS). For conducting the analysis, we analyzed the metabolome of the gut and the fat body tissues separately.
When analyzing the gut tissue, we found that the metabolome of the larvae reared on non-inoculated plants did not separate from the metabolome of the larvae reared on R. irregularis-inoculated plants (Figure 3A). Still, we found several features, whose intensity significantly differed between the treatments. Among the annotated features that accumulated to a higher level in the gut tissue of larvae fed on non-inoculated plants, we found acyl-carnitines (m/z = 394.2951, rt = 12 min; m/z = 392.3157, rt = 17.9 min; and m/z = 378.3012, rt = 17.4) and glutathione (m/z = 308.0908, rt =1.1 min) (Figure 3B, Table 2; feature IDs 1, 3, 4, and 2, respectively; level of confidence of 3 for the acyl-carnitines and 2 for glutathione according to MSI). Among the annotated features that were indicated as significantly increased for the R. irregularis-inoculated plants, the amine piperidine (m/z = 86.0967, rt = 0.5 min, MSI level of confidence 2; Figure 3B, Table 2; feature ID 6) was found. In addition, the steroidal glycoalkaloid α-tomatine (m/z = 578.4056, rt = 8.4 min) was also annotated and was accumulated to higher levels in the gut tissue of larvae fed on R. irregularis-inoculated plants (p < 0.001) (Figure S3A; MSI level of confidence 1).
The comparison of the gut metabolome between larvae fed on non-inoculated and T. harzianum-inoculated plants revealed a clear separation between the gut tissues (Figure 4A). The predicted features that were shown as significantly increased for the non-inoculated samples included compounds such as the acyl-carnitines, more precisely linoleyl-carnitine (m/z = 424.3421, rt = 13.9 min) and γ-linolenoyl-carnitine (m/z = 422.3274, rt = 13.2 min; MSI level of confidence 2) (Figure 4B, Table 3; feature IDs 2 and 5, respectively). Among the predicted features that were accumulated to a significantly higher level in the T. harzianum-inoculated samples, the acyl-carnitine O-palmitoyl-carnitine (m/z = 400.3421, rt = 14.8 min) was annotated (Figure 4B, Table 3; MSI level of confidence 2; feature ID 14). Moreover, α-tomatine (m/z = 578.4049, rt = 8.4 min) was also annotated and was indicated as significantly more highly accumulated (p <0.001) in the gut of T. harzianum-inoculated larvae (Figure S4A; MSI level of confidence 1).

2.4. Root Colonization by Rhizophagus irregularis or Trichoderma harzianum Altered the Metabolic Profile of the Manduca sexta Larval Fat Body

We found that there was no clear separation between the fat body metabolome of M. sexta larvae reared on non-inoculated plants and that of larvae reared on R. irregularis-inoculated plants (Figure 5A). However, among the features that were found to accumulate to higher levels in the R. irregularis-inoculated samples, the compound (2E)-hexadecenoylcarnitine was annotated (m/z = 398.3265, rt = 13.7 min) (Figure 5B, Table 4; MSI level of confidence 2; feature ID 10). The steroidal glycoalkaloid alpha-tomatine (m/z = 578.4047, rt = 8.4 min) was also annotated, displaying higher levels of accumulation in the R. irregularis-inoculated larvae (p < 0.0001) (Figure S3B; MSI level of confidence 1).
The analysis of the fat body metabolome of the M. sexta larvae revealed a clear separation between the fat body metabolome of the larvae reared on non-inoculated plants and the metabolome of the larvae reared on T. harzianum-inoculated plants (Figure 6A). Among the features that were indicated as significantly higher accumulated for the non-inoculated samples, the compound octadecanamide (m/z = 284.2950, rt = 19.6 min; MSI level of confidence 2; feature ID 4; Figure 6B, Table 5) was annotated. In the T. harzianum-inoculated samples, the metabolomic features annotated as octanoic acid (m/z =145.1222, rt = 8.0 min) and benzamide (m/z = 625.2662, rt = 15.9 min) were accumulated to a higher level (Figure 6B, Table 5; MSI level of confidence 2; feature IDs 12 and 14, respectively). In addition, the steroidal glycoalkaloid α-tomatine (m/z = 578.4047, rt = 8.4 min) was annotated and accumulated in significantly higher levels in the fat body of T. harzianum-inoculated larvae (p < 0.0001; Figure S4B; MSI level of confidence 1).

3. Discussion

Root mutualistic microbes such as mycorrhiza and Trichoderma fungi can modulate the production of plant secondary metabolites and thus affect the performance of the herbivores feeding on the colonized plants [37,43]. Here, we demonstrate that the changes in plant metabolomes induced by root colonizing mutualistic microbes cascade up and modulate the metabolome of the insect herbivores feeding on leaves of root-colonized plants. Our results further indicate that these changes in the insect metabolome can affect the ability of the insect to successfully complete metamorphosis. Indeed, we first observed that root colonization by the mutualistic microbes R. irregularis or T. harzianum leads to the impairment of important stages of the insect metamorphosis process, particularly pupation and adult emergence. Specifically, we found that most of the larvae reared on T. harzianum-inoculated plants developed into abnormal pupae and displayed higher mortality rates. We further found that most of the larvae reared on R. irregularis-inoculated plants developed into moths with anomalous morphologies and did not emerge. Taking into consideration that healthy M. sexta adult females can lay over 200 eggs [46], the impact of the mutualistic microbes on the metamorphosis success is expected to strongly decrease population growth rates. Moreover, we found that herbivores feeding on R. irregularis-colonized plants showed a shift towards a male-biased sex ratio. The sex ratio of lepidopteran insects influences their reproductive potential [47]. In the case of M. sexta, it has been reported that the optimum sex ratio (female to male) that ensures high levels of oviposition, fecundity, and fertility lies between 0.5 and 0.67 [48]. We found that the sex ratio of insects feeding on non-inoculated plants was very similar to the optimal range (0.69), whereas the sex ratio of insects that fed on R. irregularis-colonized plants was much lower (0.3), thereby reducing the reproductive potential of the colony. These results may further indicate that female M. sexta individuals are more sensitive to the shoot alterations triggered by root colonizing microbes, compared to the male individuals. Accordingly, it has been reported that female herbivores are more sensitive to environmental disturbance and host quality compared to male individuals [48,49]. Overall, these results indicate that the impact of beneficial microbes on the performance of insect herbivores goes beyond the larval stage and can affect further stages of the herbivore life cycle, potentially having a strong impact on insect population dynamics.
It has been reported that the cumulative physiological effects experienced by insect herbivores during the larval feeding stages can impair the pupae formation, moths’ emergence, and even sex ratios [48,50,51]. In line with previous studies, our data indicated that root colonization by beneficial microbes altered the metabolome of the shoot of tomato plants [37,43,52]. Interestingly, we found several steroidal glycoalkaloids among the different features contributing strongly to the separation of leaf metabolomes of root-inoculated from non-inoculated plants. The abundance of steroidal glycoalkaloids was higher in leaves of plants inoculated with the mutualistic microbes. Steroidal glycoalkaloids in Solanum species function as prominent defense metabolites against herbivorous insects [53,54,55,56]. There are many reports demonstrating their toxicity and deterrence towards a wide range of herbivores [57,58,59,60,61]. Remarkably, besides affecting feeding and growth, steroidal alkaloids can affect other crucial physiological processes and interfere with insect development. It was suggested that steroidal glycoalkaloids might interact with the endocrine system of pests by interfering with hormone activity [62,63,64]. This is likely due to the fact that steroidal glycoalkaloids are derived from sterols and have similar chemical structures as the insect hormone ecdysone [65,66]. Hence, steroidal glycoalkaloids, through their similarity to sterols, are proposed to affect insect molting and metamorphosis, both processes that are regulated by ecdysone.
In addition to the strong effects of root colonization on herbivore development, we found an accumulation of the steroidal glycoalkaloid α-tomatine in the gut and fat body of herbivores reared on microbe-inoculated plants. It has been described that M. sexta has the ability to detoxify alkaloids, such as nicotine, most likely by degradation and excretion [67,68]. Typically, nicotine and many other alkaloids are absorbed by the midgut, pass into the haemolymph, are reabsorbed by the Malpighian tubules, and are finally excreted with the feces. Depending on the type of alkaloid, between 30 and 83% of them may be metabolized after absorption [68,69]. Although it could be that M. sexta is also able to degrade α-tomatine to some extent, our data indicated that the levels of α-tomatine in the gut and fat body of M. sexta were higher when the larvae were reared on plants that were colonized by the mutualistic microbes. Besides steroidal glycoalkaloids, we found a higher accumulation of piperidine in the gut of the larvae reared on R. irregularis-inoculated plants. Piperidine-containing alkaloids are complex structures that are derived from the amino acid L-lysine [70] and are able to disrupt the central nervous system of insects and mammals. For example, the piperidine alkaloids synthesized by the leguminous plant Prosopis juliflora have been reported to act as acetylcholinesterase inhibitors, butyrylcholinesterase inhibitors with Ca2+ channel blocking activity [71]. It is thus conceivable that enhanced levels of steroidal glycoalkaloids and piperidine alkaloids found in the insects that fed on the microbe-colonized plants might underlie, at least partially, the significant impact of the mutualistic microbes on M. sexta metamorphosis success.
Besides alkaloid-related metabolites, we found a higher accumulation of the metabolite benzamide in the fat bodies of larvae reared on T. harzianum-inoculated plants. Benzamides are amide derivatives of benzoic acid widely used as pesticides [72]. Treatment with benzamide chemicals has been related to an enhanced tissue lipid peroxidation and oxidative damage in juvenile catfish [73] and deformities in zebra fish embryos [74]. Our results thus suggest enhanced oxidative stress in the insects fed on Trichoderma-inoculated plants. Interestingly, we found a reduced accumulation of the metabolite glutathione in the gut of M. sexta larvae fed on microbe-inoculated plants. The primary role of glutathione (GSH) is to detoxify potentially deleterious substances and maintain the redox state in cells [75]. Insect glutathione S-transferases (GSTs) hold a pivotal role in detoxification and cellular antioxidant defense against oxidative stress by conjugating GSH to the electrophilic centers of natural and synthetic exogenous xenobiotics, including insecticides and allelochemicals [76,77]. Therefore, a reduced accumulation of glutathione in M. sexta larvae fed from microbe-inoculated plants might also reflect an enhanced oxidative stress, and thus a decreased fitness of the insects fed from the microbe-inoculated plants.
Our analyses further indicated that root colonization by the mutualistic microbes significantly altered the pattern of fatty acid amides in the gut and fat body of the insect. Although further analyses including standards would be required to unequivocally identify the altered metabolites, several studies indicate that fatty acid amides in the regurgitant of different species of lepidopteran larvae are important elicitors of plant defense responses [78,79,80,81]. The synthesis of fatty acid amides occurs by membrane-bound enzymes in the foregut and anterior midgut of the insect, utilizing insect-derived amino acids and host plant-derived fatty acids [78,82,83]. Even though it was demonstrated that they may play a complex role in nitrogen assimilation in insects [79], their exact physiological roles remain obscure [84]. Remarkably, we found that the root mutualists further triggered changes in insect fatty acids and lipids. For instance, we found a higher accumulation of octanoic acid in the fat body of larvae fed from Trichoderma-inoculated plants. Lipids are essential parts of cell and organelle membranes of insects; serve as important sources of energy; and act as precursors for secondary metabolites, waxes, pheromones, and defensive secretions [85,86,87]. Moreover, the metamorphosis process in Sarcophaga argyrostoma has been associated with specific changes in the profile of fatty acids, including octanoic acid [88]. Although further analysis would be required to establish solid conclusions, the changes in the fatty acid profile of the larvae triggered by the root-mutualistic fungi have the potential for altering the metamorphosis process of M. sexta.
In addition, we were able to predict the metabolite linoleyl-carnitine and other carnitine-derived metabolites in the gut and fat body of M. sexta larvae. It has been reported that carnitine-derived metabolites such as L-carnitine can affect the metabolism of lipids, proteins, and carbohydrates in mammals and zebrafish [89,90,91]. Moreover, carnitine and its acyl derivatives, which are involved in the lipid β-oxidation process, have been involved in the behavioral transition from the gregarious to solitary phase in locusts, possibly through modulating lipid metabolism and influencing the nervous system of the herbivore [92]. Although the ecological consequences of the altered levels of carnitine-derivatives in the body of M. sexta larvae may be different than in locusts, our results point to an important effect of root colonization by the mutualistic microbes on lipid metabolism.
In general, our study demonstrates that root colonization by the mutualistic microbes R. irregularis and T. harzianum impacts the metabolome of tomato shoots. These metabolomic alterations, triggered by the mutualistic microbes, affect the metabolome of M. sexta larvae feeding on the shoots of root-colonized plants. Among the most significant alterations, we found that M. sexta larvae feeding on the leaves of the root-colonized plants contain higher levels of the prominent steroidal glycoalkaloid α-tomatine. Moreover, feeding from microbial-colonized plants also led to changes related to oxidative damage, fatty acid metabolism, and lipid metabolism in the insect. Although further studies would be required to pinpoint the exact mechanism, we speculate that the microbe-triggered alterations in the insect metabolome underlie, at least partially, the impact of the root mutualists on insect metamorphosis.

4. Materials and Methods

4.1. Plant, Fungal, and Insect Material

Tomato (Solanum lycopersicum) cultivar Moneymaker was used in all the bioassays. Tomato seeds were obtained from Intratuin B.V (Woerden, the Netherlands). We used Rhizophagus irregularis as the AM fungus. The R. irregularis solid inoculum (INOQ-Sprint) was purchased from INOQ GmbH, Schnega, Germany (Available online: https://inoq.de/mykorrhiza-produkte/, accessed on 5 May 2021) with 220 mycorrhizal units per milliliter in sand. Trichoderma harzianum isolate T-78 (CECT 20714, Spanish Type Culture Collection) was maintained on potato dextrose agar (PDA, Sifin Diagnostics, Berlin, Germany) plates and regularly sub-cultured. The T. harzianum inoculum was prepared on a solid medium containing commercial oat and vermiculite [93]. Eggs from M. sexta (Lepidoptera, Sphingidae) were obtained from the Max Planck Institute for Chemical Ecology (Jena, Germany). The eggs and larvae were maintained in a plexiglass cage under 27 °C, 16 h light/8 h dark, and 50% relative humidity, and fed with artificial diet [94].

4.2. Plant Growth Conditions and Fungal Inoculation

Tomato seeds were surface-sterilized in 10% (v/v) sodium hypochlorite (NaOCl, 12% ChemSolute, Th. Geyer, Berlin, Germany) for 4 min, then thoroughly rinsed in water. After sterilization, the seeds were placed on fine-grained moist vermiculite and germinated in the dark for 3 days at 28 °C, followed by 7 days in a plant growth chamber at 25 ± 3 °C, 16 h/8 h day: night cycle, 65–70% RH conditions. Ten days after germination, the seedlings were transplanted into 400 mL pots containing a sterile sand/vermiculite mixture (1:1, v/v). Inoculation with R. irregularis was performed by mixing the R. irregularis inoculum with the sand/vermiculite mixture at 10% (v/v) before transplanting [95]. Inoculation with T. harzianum was achieved by mixing the T. harzianum inoculum with the substrate to achieve a final density of 1 × 10⁶ conidia g−1 before transplanting [95]. The plants were then placed in a completely randomized design in controlled climate chambers at 16 h/8 h day/night cycle, 65–70% RH. The plants were watered with tap water every second day, and once per week with Hoagland nutrient solution 50% water diluted [96]. Four weeks after transplanting, plants were used for the experiments. We did not find differences in the shoot biomass of the different treatments, and all the plants appeared similar, with no evident differences between the treatments.

4.3. Rhizophagus irregularis and Trichoderma harzianum Root Colonization

We confirmed that R. irregularis had efficiently colonized tomato roots in all the performed bioassays by incubating washed roots in 10% KOH (≥85% p.a., ROTH, Karlsruhe, Germany) and subsequently staining the fungal structures with 0.05% trypan blue (ROTH) [97]. The percentage of total root colonization was determined by the gridline intersection method [98] using a binocular stereo microscope (Leica DM 4000 B LED). The extent of mycorrhizal colonization was about 30–40% (percentage of total root length colonized by R. irregularis) in all the performed bioassays. We confirmed that T. harzianum had efficiently colonized the potting substrate in all the performed bioassays by using the plate count technique and PDA amended with 50 mg L−1 rose bengal (Applichem, Darmstadt, Germany) and 100 mg L−1 streptomycin sulphate (ROTH) [93]. Plates were incubated at 28 °C in darkness, and colony-forming unite (CFUs) were counted after 5 days. We found that the number of T. harzianum CFU in the potting media was similar to initial inoculation values in all the performed bioassays.

4.4. Bioassay for the Assessment of the Impact of Rhizophagus irregularis and Trichoderma harzianum on Manduca sexta Pupation and Adult Emergence

We placed a total of 25 M. sexta neonates on 5 plants (5 larvae per plant) of every treatment (inoculated with R. irregularis or T. harzianum, or non-inoculated). The larvae were placed on the third and fourth fully expanded leaf (counted from above) of every plant and allowed to feed freely on the entire plant. The plants were covered with fine mesh netting to prevent the escape of the larvae. After 7 days, the larvae were redistributed over different plants within the same treatment group (2 larvae per plant). During the bioassay, plants of the same treatment were exchanged for the damaged plants as needed to allow the larvae to feed ad libitum throughout the experiment. After 3 weeks, the surviving larvae were weighed and placed into plastic pupation boxes filled with vermiculite, which were placed in a growth chamber at 27 ± 3 °C, 16 h/8 h day/night cycle, and 50% RH. There, they were kept until they had reached the pre-pupal stage (approximately 3 days later). In the pupation boxes, the larvae were fed with artificial diet. The time required to reach the pre-pupal stage and the time required to complete the pupation process were recorded. After the pupation process had been completed, we visually checked the morphology of the developed pupae and recorded the number of pupae presenting morphological anomalies. From the pupae presenting a normal morphology, we collected data on pupal weight and sex determination. After the eclosion of the adults, we visually checked the morphology of the moths and recorded the number of moths presenting morphological anomalies. The number of pupae that failed to eclose was also recorded.

4.5. Bioassay for the Assessment of the Impact of Rhizophagus irregularis and Trichoderma harzianum on Tomato Leaf Metabolome

One first-instar M. sexta larva was placed on the apical leaflet of the third fully expanded leaf (counted from above) using a clip cage, which was moved to a new leaf every two days. The plants had been inoculated with R. irregularis or T. harzianum, or were non-inoculated, as described above. Dead M. sexta larvae were immediately replaced by larvae of the same age that had been feeding on plants from the same treatment. Empty clip cages were placed on leaves of non-infested plants. A total of six biological replicates (plants) were used per treatment and time point. Larvae were replaced weekly by new first-instar larvae to avoid consumption of the entire plant. Three weeks after first challenging the plants, the leaf the larvae were actually feeding on was collected, flash-frozen in liquid nitrogen, and stored at −80 °C for metabolomics analyses.

4.6. Bioassay to Assess the Impact of Rhizophagus irregularis and Trichoderma harzianum on the Metabolome of Manduca sexta Gut and Fat Body

We used 45 tomato plants per microbial treatment (inoculated with R. irregularis or T. harzianum or non-inoculated). On each plant, we placed 4 second-instar larvae on the third fully expanded leaf (counted from above) using a clip cage, which was moved to a new leaf every two days. Within the first week, dead larvae were removed and replaced by new ones of the same age. After the first week of herbivory, since the caterpillars had grown too large for the clip cage, we replaced the cage by a net bag wrapped around the plant. During the bioassay, plants of the same treatment were exchanged for the damaged plants as needed to allow the larvae to feed ad libitum throughout the experiment. Three weeks after the start of the experiment, the larvae were collected and kept on ice while transferred to be stored at −20 °C for dissection.

4.7. Leaf Metabolomics

4.7.1. Extraction of Leaf Metabolites

We extracted leaf metabolites from 100 mg (fresh weight) of finely ground leaf material according to Rogachev and Aharoni [99,100], with the following modifications. For the sample extraction solution, high-performance liquid chromatography (HPLC grade, VWR International GmbH, Dresden, Germany) methanol and acetate buffer were used. For the preparation of the acetate buffer, 2.3 mL acetic acid (100% p.a., ROTH) and 3.41 g ammonium acetate (≥97% p.a., ACS, ROTH) were dissolved in 1L Millipore water. The pH of the buffer solution was adjusted to 4.8. For the extraction buffer, the acetate buffer (25%) was mixed with methanol (MeOH) (75%). For the extraction procedure, 100 ± 5 mg of each ground sample was weighed in a 2 mL Eppendorf tube. One milliliter of the extraction solution was added to each sample; the tube was tightly sealed and shaken for 10 s. Subsequently, each sample was sonicated for 5 min at 30 Hz using an FB 15061 sonicator (Elma, Singen, Germany) and then centrifuged for 15 min at 15,000× g. The supernatant was pipetted with a 1 mL pipette into a new-labeled Eppendorf tube, and the first Eppendorf tube was kept. By using the pipette, we added 1 mL of the extraction solution again to the pellet of the first extraction tube. The sealed tube was shaken again for 10 s and subsequently shaken for 5 min at 30 Hz in a sonicator. Then, it was centrifuged again for 15 min at 15,000× g. The two supernatants were combined, and the sample containing both supernatants was centrifuged for 10 min at 15,000× g; afterwards, 200 μL of the sample was transferred in an HPLC vial, and 800 μL of the extraction solution was added, resulting in a 1:5 dilution of the samples. The samples were then transferred to liquid chromatography–quadrupole time of flight–mass spectrometry for analysis.

4.7.2. Liquid Chromatography–Quadrupole Time of Flight–Mass Spectrometry and Data Analysis of the Leaf Extracts

We obtained mass spectra of separated metabolites from the leaf samples by using UPLC–MS. The liquid chromatograph (Dionex UltiMate™ 3000, Thermo Scientific, Sunnyvale, CA, USA) was equipped with a C18 analytical column (Acclaim TM RSLC 120; 2.1 × 150 mm, 2.2 µm particle size, 120 Å pore size). The column was kept at 40 °C. The mobile phase was composed of solvent A, water/formic acid (99–100%, VWR) (0.05% v/v), solvent B, and acetonitrile (HPLC grade, VWR)/formic acid (0.05% v/v) at the flow rate of 400 μL min−1. The multi-step gradient for solvent B was 0–1 min, 5 %; 1–4 min, 28%; 4–10 min, 36%; 10–12 min, 95%; 12–14 min, 95%; 14–16 min, 5%; 16–18 min, 5%. The chromatograph was coupled to a maXis impact HD MS-qToF (Bruker Daltonics) operated in positive polarity. ESI source conditions were end plate offset = 500 V, capillary = 4500 V, nebulizer = 2.5 bar, dry gas = 11 L min−1, dry temperature = 220 °C. Transfer line conditions were funnels 1 and 2 = RF 300 Vpp, isCD energy = 0 eV, hexapole = 60 Vpp, quadrupole ion energy = 5 eV, low mass = m/z 50, collision cell energy = 10 eV, collision RF = 500 Vpp, transfer time = 60 µs, pre-pulse storage = 5 µs. The mass spectrometer operated with a mass range of m/z 50–1500 and a spectral acquisition rate of 3 Hz. Sodium formate clusters (10 mM) were used for calibrating the m/z values. The clusters mix consisted of 250 mL isopropanol (≥99% for LC–MS, VWR), 1 mL formic acid, and 5 mL 1M NaOH (≥99% p.a., ISO, ROTH), and the final volume was adjusted to 500 mL. For the identification of the steroidal glycoalkaloid α-tomatine in the leaf extracts, we used the commercial standard α-tomatine (500 mg, 0602, Lot: 12021719, Extrasynthase, Genay, France).
For the data analysis, Bruker .d files were transformed to .abf files using the program Abf Converter (https://www.reifycs.com/AbfConverter/, Tokyo, Japan, accessed on 5 May 2021). The .abf files were processed with the program MS-DIAL (v. 4.00, available online: http://prime.psc.riken.jp/compms/msdial/main.html, RIKEN, accessed on 5 May 2021) with the following parameters: data collection: mass accuracy: MS1 tolerance = 0.01 Da, retention time begin = 0.7 min, retention time end = 10 min, mass range begin = m/z 50, mass range end = m/z 1500; peak detection parameters: minimum peak height = 1000 amplitude, mass slice width = 0.1 Da, smoothing method = linear weighted moving average, smoothing level = 3 scans, minimum peak width = 5 scans; alignment parameter settings: retention time tolerance = 0.2 min, MS1 tolerance = 0.015 Da. We normalized the alignments against the total ion chromatogram. We exported the normalized data matrix containing all the alignments as a .txt file (spectra type = centroid). The level of confidence for the annotation/identification of the metabolomic features described in our analyses was determined on the basis of Malinowska and Viant [45].

4.8. Dissection of Manduca sexta Larvae and Separation of the Gut and Fat Body Samples

Before the dissection, the larvae were kept cool on ice for 30 min to sedate them. By using a sterile scalpel, each larva was dissected on two points. At first, the red horn at the bottom of the larval body was removed. Then, each larva was cut open at the ventral side from the head down to the posterior end using surgical scissors. For the separation of the samples, the central gut and the fat body tissues were carefully removed from the larval body using tweezers and subsequently separated one from each other. Guts and fat body samples from individual larvae were stored separately in a 1.5 mL safety lock Eppendorf tube, and the cap of each tube was punctured by using a sterile syringe before use. The samples were stored at −80 °C until further processing. Afterwards, the samples were freeze-dried and stored again at −80 °C until metabolite extraction.

4.9. Insect Metabolomics

4.9.1. Extraction of Metabolites from the Gut and Fat Body of Manduca sexta

The gut and fat body sample dry masses were assessed before extraction. To handle the variability in the samples weight, we extracted the metabolites by following the ratio w/v = 1:2, meaning that in each sample tube, the volume of the extracting solution added in milliliters would be double that of the sample’s mass in milligrams. Using this procedure, we added the appropriate volume of 70% MeOH (≥99.9%, HiPerSolv CHROMANORM® til HPLC, VWR, Søborg, Denmark), with 10 ppm palmitic acid methyl ester (Merck, Søborg, Denmark) and 10 ppm sorbitol (99%, Merck, Søborg) as internal standards, to each sample. The samples were vigorously vortexed for 30 s at 3000 rpm and then centrifuged at 12,000× g for 20 min at 4 °C. For LC–MS analyses, 50 μL of the supernatant (extracts) was transferred to a 200 μL glass insert in a 2 mL labelled glass vial. The vials (32 × 11.6 mm, Mikrolab Aarhus A/S, Denmark) containing the extracts were sealed with cap with septum and placed in the fridge (−20 °C) until analysis on LC–MS.

4.9.2. Ultra High Performance Liquid Chromatography–Quadrupole Time of Flight–Mass Spectrometry and Data Analysis of the Insect Extracts

UHPLC–MS analyses were performed with the extracts of the gut and fat body of M. sexta larvae by using a Dionex Ultimate 3000RS UHPLC system (Thermo Fisher Scientific) system coupled to a CompactTM (QqToF) mass spectrometer (Bruker Daltonics) with an electrospray ionization source. The UHPLC system was equipped with a DAD detector (acquiring from 190–800 nm), temperature-controlled auto-sampler (10 °C), and column oven (set to 40 °C).
Samples were analyzed on a Kinetex XB-C18 UHPLC column (100 × 2.1 mm, 1.7 μm, 100 Å pore size; Phenomenex) and eluted with a flow rate of 0.3 mL/min. The mobile phase composed of a gradient of solvent A (0.05 % formic acid (LC–MS, Ultra UHPLC–MS, Fluka, Rosklid, Denmark) in water) and solvent B (0.05% formic acid in acetonitrile (≥99.9%, HiPerSolv CHROMANORM® til HPLC, suitable for UPLC/UHPLC, VWR, Søborg, Denmark)). The initial composition was 98% A and 2% B, which was held for 1 min before the composition of solvent B was increased linearly to 100% over 19 min. The column was washed with 100% solvent B for 7 min, before rapidly returning to 2% B over 1 min, and subsequently re-equilibrated at 2% B for 7 min prior to the next injection. The total run time was 35 min.
The qToF mass spectrometer was operated in full scan positive ion mode with the following instrument settings: m/z 50–1200: nebulizer gas (nitrogen), 2.0 bar; drying gas (nitrogen), 8 L/min; drying gas temperature, 220 °C; capillary voltage, 4000 V; full scan MS spectra acquisition rate, 2 Hz; set ion energy, 4.0 eV; set isolation mass, m/z 100.00; collision energy, 7.0 eV; and set collision cell RF, 500.0 Vpp. For the MS/MS spectra, the qToF mass spectrometer was operated as described previously with the following conditions for the collision cell (quadrupole): set ion energy, 4.0 eV; set isolation mass, m/z 100.00; collision energy, 7.0 eV; set collision cell RF, 500.0 Vpp. Every chromatogram was calibrated to provide accurate mass by automated infusion of sodium formate clusters (10 mM) at the beginning of each run. For the identification of the steroidal glycoalkaloid α-tomatine in the insect extracts, the commercial standard α-tomatine (CAS Number: 17406-45-0, Merck, Germany) was used. All data acquisition was automated using a combination of Chromeleon Express (Thermo Fisher Scientific), Compass qTOF Control (Version 4.0.15.3248, Bruker Daltonics), and Hystar (Version 3.2 SR4, Bruker Daltonics) software. For data analysis, DataAnalysis software (Version 4.3, Bruker Daltonics) was used. Metabolomic analyses were firstly performed using the Bruker MetaboScape Mass Spectrometry Software, version 5.0 (Build 683) (Bruker Daltonic GmbH, Bremen, Germany). The polarity mode was positive, and the workflow followed was T-ReX 3D (LC-QToF). The parameters set for the analyses were the following: minimum number of features for extraction = 4, presence of features in minimum number of analyses = 3, noise threshold = 2000, minimum peak length = 10, recursive feature extraction = 8, range for the retention time windows from 0.25 to 20 min, mass range from m/z 50 to 3000, ion deconvolution = [M+H]+, and EIC = 0.8. The chemical formula of the metabolites was automatically annotated by using the software’s Smart Formula option, and subsequently, each metabolite was annotated by using the spectral libraries and the MS/MS libraries available. The MS/MS libraries used have been created in international institutes on the basis of commercial standards.

4.10. Statistical Analysis

Pearson’s chi-squared test was used to determine whether there were statistically significant differences between the observed and expected frequencies of female and male M. sexta pupae that developed after feeding on the tomato plants of the three different treatment groups. One-way analysis of variance (ANOVA) was performed to evaluate the effect of the different treatments on the days required until pre-pupation, the days required for pupation, and the weight of the pupae showing normal morphology. For the statistical analysis of the tomato leaf data set, we used the web-based metabolomic data processing tool MetaboAnalyst (5.0) (available online: https://www.metaboanalyst.ca/, accessed on 5 May 2021) [101]. The data were filtered by taking the interquartile range and then pareto scaled. One-way analysis of variance (ANOVA) followed by Fisher’s least significant difference method (Fisher’s LSD) was performed in order to explain the variation within the data set. In addition, principal component analysis (PCA) was performed to identify significant differences among the treatments. For the statistical analyses of the M. sexta gut and fat body data set, firstly, the Bruker MetaboScape Mass Spectrometry Software (version 5.0) was used. A t-test was performed on the basis of the results of the processed spectral data. The resulting intensity table was exported and used for further statistical analysis using the web-based metabolomic data processing tool MetaboAnalyst (5.0) (available online: https://www.metaboanalyst.ca/, accessed on 5 May 2021) [101]. The data were filtered by interquartile range and transformed by using the generalized log transformation (glog 2). Pair-wise comparisons were then conducted between the non-inoculated and beneficial microbe-inoculated gut and fat body samples separately. These pair-wise comparisons included non-parametric t-tests with the level of significance set at α = 0.05 and volcano plots with a fold change threshold (x-axis) equal to 2 and t-test threshold (y-axis) equal to 0.05. The level of confidence for the annotation/identification of the metabolomic features described in all our analyses was determined on the basis of the work of Malinowska and Viant [45].

Supplementary Materials

The following are available online at https://www.mdpi.com/article/10.3390/metabo11110731/s1, Figure S1: qToF intensity of the metabolomic feature annotated as (A) α-tomatine; (B) an isomer of α-tomatine; (C) an isomer of α-tomatine; (D) α-dehydrotomatine; (E); an isomer of α-dehydrotomatine; (F) an isomer of α-dehydrotomatine. Samples correspond to leaves of tomato plants that were non-inoculated or root-inoculated with Rhizophagus irregularis and not challenged or shoot-challenged with Manduca sexta herbivory for three weeks. The qToF intensity was pareto scaled. The box plots summarize the scaled values of the qToF intensity in each group, the whiskers represent the values outside the middle 50%, the bisecting lines represent the median of the values, the yellow diamond indicates the mean qToF intensity in each group and the dots represent the samples in each group. Asterisks indicate statistically, Figure S2. qToF intensity of the metabolomic feature annotated as (A) α-tomatine; (B) an isomer of α-tomatine; (C) an isomer of α-tomatine; (D) an isomer of α-dehydrotomatine; (E) an isomer of α-dehydrotomatine. Samples correspond to leaves of tomato plants that were non-inoculated or root-inoculated with Trichoderma harzianum and not challenged or shoot-challenged with Manduca sexta herbivory for three weeks. The qToF intensity was pareto scaled. The box plots summarize the scaled values of the qToF intensity in each group, the whiskers represent the values outside the middle 50%, the bisecting lines represent the median of the values, the yellow diamond indicates the mean qToF intensity in each group and the dots represent the samples in each group. Asterisks indicate statistically significant differences among the groups according to Fisher’s Least Significance Difference (LSD) test (p ≤ 0.05)., Table S1. Results for the one-way ANOVA for the effect of root colonization by Rhizophagus irregularis on the qToF intensity of steroidal glycoalkaloids in the leaf metabolome of tomato plants after Manduca sexta herbivory for three weeks. Each metabolomic feature is given by its mass to charge ratio (m/z) and its retention time (rt). FDR: means False Discovery Rate., Figure S3. qToF intensity of the metabolomic feature annotated as α-tomatine in the gut (A) and fat body (B) samples of Manduca sexta larvae reared for three weeks on leaves of plants that were non-inoculated and root-inoculated by Rhizophagus irregularis. The qToF intensity was log transformed. The box plots summarize the values of the qToF intensity in each group, the whiskers represent the values outside the middle 50%, the bisecting lines represent the median of the values, the yellow diamond indicates the mean qToF intensity in each group and the dots represent the samples in each group. Asterisks indicate statistically significant difference between the treatments according to Student t-tests (p ≤ 0.05)., Figure S4. qToF intensity of the metabolomic feature annotated as α-tomatine in the gut (A) and fat body (B) samples of Manduca sexta larvae reared for three weeks on leaves of plants that were non-inoculated and root-inoculated by Trichoderma harzianum. The qToF intensity was log transformed. The box plots summarize the values of the qToF intensity in each group, the whiskers represent the values outside the middle 50%, the bisecting lines represent the median of the values, the yellow diamond indicates the mean qToF intensity in each group and the dots represent the samples in each group. Asterisks indicate statistically significant difference between the treatments according to Student t-tests (p ≤ 0.05). Table S2. Results for the one-way ANOVA for the effect of root colonization by Trichoderma harzianum on the qToF intensity of steroidal glycoalkaloids in the leaf metabolome of tomato plants after Manduca sexta herbivory for three weeks. Each metabolomic feature is given by its mass to charge ratio (m/z) and its retention time (rt). FDR: means False Discovery Rate.

Author Contributions

Conceptualization: A.M.-M., N.M.v.D. and D.P.; methodology: A.M.-M., T.Q., D.P., F.V., A.W. and D.I.P.; software: F.V., A.W., D.I.P. and D.P.; formal analysis: F.V., A.W. and D.P.; investigation: N.M.v.D.; resources: N.M.v.D., B.K. and S.B.; data curation: F.V. and D.P.; writing—original draft preparation: D.P., N.M.v.D. and A.M.-M.; writing—review and editing: D.P., N.M.v.D., A.M.-M., F.V., A.W., D.I.P., B.K. and S.B.; visualization: D.P., N.M.v.D. and A.M.-M; supervision: N.M.v.D., A.M.-M. and A.W.; project administration: N.M.v.D.; funding acquisition: A.M.-M. and N.M.v.D. All authors have read and agreed to the published version of the manuscript.

Funding

This project has received funding from the European Union’s Horizon 2020 research and innovation program under grant agreement no. 765290 (Microbe-Induced Resistance, MiRA project).

Institutional Review Board Statement

Not applicable.

Informed Consent Statement

Not applicable.

Data Availability Statement

The authors are willing to share the data files of the study upon request. The data set was deposited in the open repository MetaboLights under the project number MTBLS2700 (available online: https://www.ebi.ac.uk/metabolights/).

Acknowledgments

The work of D.P. was supported by the European Union’s Horizon 2020 research and innovation program (Microbe-Induced Resistance, MiRA project), grant agreement no. 765290. D.P., F.V., A.W., N.M.v.D. and A.M.-M. gratefully acknowledge the support of iDiv funded by the German Research Foundation (DFG–FZT 118, 202548816). A.M.-M. acknowledges funding from the program for attracting talent to Salamanca from the Fundación Salamanca Ciudad de Cultura y Saberes and Ayuntamiento de Salamanca; the program to support junior researchers to obtain third-party funding from Friedrich-Schiller-Universität Jena (DRM/2015-02); Junta de Castilla y León and European Union (ERDF “Europe drives our growth”; CLU-2019-05—IRNASA/CSIC Unit of Excellence); and the research network RED2018-102407-T from the Spanish Ministry of Science and Innovation and Feder funds.

Conflicts of Interest

The authors declare no conflict of interest.

References

  1. Furstenberg-Hagg, J.; Zagrobelny, M.; Bak, S. Plant defense against insect herbivores. Int. J. Mol. Sci. 2013, 14, 10242–10297. [Google Scholar] [CrossRef] [PubMed] [Green Version]
  2. Karban, R.; Baldwin, I. Induced Responses to Herbivory; University of Chicago Press: Chicago, IL, USA, 1997. [Google Scholar]
  3. Feeny, P.; Rosenthal, G.; Berenbaum, M. The evolution of chemical ecology: Contributions from the study of herbivorous insects. Herbiv. Interact. Second. Plant Metab. 1992, 2, 1–44. [Google Scholar]
  4. Falco, M.C.; Marbach, P.A.S.; Pompermayer, P.; Lopes, F.C.C.; Silva-Filho, M.C. Mechanisms of sugarcane response to herbivory. Genet. Mol. Biol. 2001, 24, 113–122. [Google Scholar] [CrossRef]
  5. Pavela, R. History, presence and perspective of using plant extracts as commercial botanical insecticides and farm products for protection against insects—A review. Plant Protect. Sci. 2016, 52, 229–241. [Google Scholar] [CrossRef] [Green Version]
  6. Pavela, R.; Maggi, F.; Lupidi, G.; Cianfaglione, K.; Dauvergne, X.; Bruno, M.; Benelli, G. Efficacy of sea fennel (Crithmum maritimum L., Apiaceae) essential oils against culex quinquefasciatus say and spodoptera littoralis (Boisd.). Ind. Crop. Prod. 2017, 109, 603–610. [Google Scholar] [CrossRef]
  7. Bloomquist, J.; Boina, D.; Chow, E.; Carlier, P.; Reina, M.; Gonzalez-Coloma, A. Mode of action of the plant-derived silphinenes on insect and mammalian GABAA receptor/chloride channel complex. Pestic. Biochem. Physiol. 2008, 91, 17–23. [Google Scholar] [CrossRef]
  8. Mbata, G.N.; Payton, M.E. Effect of monoterpenoids on oviposition and mortality of Callosobruchus maculatus (F.) (Coleoptera: Bruchidae) under hermetic conditions. J. Stored Prod. Res. 2013, 53, 43–47. [Google Scholar] [CrossRef]
  9. Yeom, H.-J.; Kang, J.S.; Kim, G.-H.; Park, I.-K. Insecticidal and acetylcholine esterase inhibition activity of Apiaceae plant essential oils and their constituents against adults of German cockroach (Blattella germanica). J. Agric. Food Chem. 2012, 60, 7194–7203. [Google Scholar] [CrossRef]
  10. Langenheim, J.H. Higher plant terpenoids: A phytocentric overview of their ecological roles. J. Chem. Ecol. 1994, 20, 1223–1280. [Google Scholar] [CrossRef]
  11. Zagrobelny, M.; Bak, S.; Rasmussen, A.V.; Jørgensen, B.; Naumann, C.M.; Møller, B.L. Cyanogenic glucosides and plant–insect interactions. Phytochemistry 2004, 65, 293–306. [Google Scholar] [CrossRef]
  12. Willinger, G.; Dobler, S. Selective sequestration of iridoid glycosides from their host plants in longitarsus flea beetles. Biochem. Syst. Ecol. 2001, 29, 335–346. [Google Scholar] [CrossRef]
  13. Nishida, R. Sequestration of defensive substances from plants by lepidoptera. Annu. Rev. Entomol. 2002, 47, 57–92. [Google Scholar] [CrossRef]
  14. Ode, P.J. Plant chemistry and natural enemy fitness: Effects on herbivore and natural enemy interactions. Annu. Rev. Entomol. 2006, 51, 163–185. [Google Scholar] [CrossRef] [Green Version]
  15. Mendes, R.; Raaijmakers, J.M. Cross-kingdom similarities in microbiome functions. ISME J. 2015, 9, 1905–1907. [Google Scholar] [CrossRef] [Green Version]
  16. Van Der Heijden, M.G.A.; Klironomos, J.N.; Ursic, M.; Moutoglis, P.; Streitwolf-Engel, R.; Boller, T.; Wiemken, A.; Sanders, I.R. Mycorrhizal fungal diversity determines plant biodiversity, ecosystem variability and productivity. Nature 1998, 396, 69–72. [Google Scholar] [CrossRef]
  17. Harman, G.E.; Howell, C.R.; Viterbo, A.; Chet, I.; Lorito, M. Trichoderma species—Opportunistic, avirulent plant symbionts. Nat. Rev. Microbiol. 2004, 2, 43–56. [Google Scholar] [CrossRef] [PubMed]
  18. Wang, B.; Qiu, Y.-L. Phylogenetic distribution and evolution of mycorrhizas in land plants. Mycorrhiza 2006, 16, 299–363. [Google Scholar] [CrossRef] [PubMed]
  19. Smith, S.; Read, D. Mycorrhizal Symbiosis, 3rd ed.; Academic Press: Cambridge, MA, USA, 2010. [Google Scholar]
  20. Parniske, M. Arbuscular mycorrhiza: The mother of plant root endosymbioses. Nat. Rev. Microbiol. 2008, 6, 763–775. [Google Scholar] [CrossRef]
  21. Bonfante, P.; Genre, A. Mechanisms underlying beneficial plant—Fungus interactions in mycorrhizal symbiosis. Nat. Commun. 2010, 1, 48. [Google Scholar] [CrossRef] [PubMed] [Green Version]
  22. Benítez, T.; Rincón, A.M.; Limón, M.C.; Codon, A.C. Biocontrol mechanisms of Trichoderma strains. Int. Microbiol. 2004, 7, 249–260. [Google Scholar]
  23. Martinez-Medina, A.; Pozo, M.J.; Cammue, B.P.; Vos, C.M. Belowground defence strategies in plants: The plant–Trichoderma dialogue. In Belowground Defence Strategies in Plants; Springer: Berlin/Heidelberg, Germany, 2016; pp. 301–327. [Google Scholar]
  24. Druzhinina, I.S.; Seidl-Seiboth, V.; Herrera-Estrella, A.; Horwitz, B.A.; Kenerley, C.M.; Monte, E.; Mukherjee, P.K.; Zeilinger, S.; Grigoriev, I.V.; Kubicek, C.P. Trichoderma: The genomics of opportunistic success. Nat. Rev. Microbiol. 2011, 9, 749–759. [Google Scholar] [CrossRef]
  25. Ghorbanpour, M.; Omidvari, M.; Abbaszadeh-Dahaji, P.; Omidvar, R.; Kariman, K. Mechanisms underlying the protective effects of beneficial fungi against plant diseases. Biol. Control 2018, 117, 147–157. [Google Scholar] [CrossRef]
  26. Bowles, T.M.; Barrios-Masias, F.H.; Carlisle, E.A.; Cavagnaro, T.R.; Jackson, L.E. Effects of arbuscular mycorrhizae on tomato yield, nutrient uptake, water relations, and soil carbon dynamics under deficit irrigation in field conditions. Sci. Total Environ. 2016, 566, 1223–1234. [Google Scholar] [CrossRef] [PubMed] [Green Version]
  27. Rouphael, Y.; Franken, P.; Schneider, C.; Schwarz, D.; Giovannetti, M.; Agnolucci, M.; De Pascale, S.; Bonini, P.; Colla, G. Arbuscular mycorrhizal fungi act as biostimulants in horticultural crops. Sci. Hortic. 2015, 196, 91–108. [Google Scholar] [CrossRef]
  28. Shoresh, M.; Harman, G.E. The relationship between increased growth and resistance induced in plants by root colonizing microbes. Plant Signal. Behav. 2008, 3, 737–739. [Google Scholar] [CrossRef] [PubMed] [Green Version]
  29. Shoresh, M.; Harman, G.E.; Mastouri, F. Induced systemic resistance and plant responses to fungal biocontrol agents. Annu. Rev. Phytopathol. 2010, 48, 21–43. [Google Scholar] [CrossRef] [Green Version]
  30. Goverde, M.; van der Heijden, M.V.D.H.; Wiemken, A.; Sanders, I.; Erhardt, A. Arbuscular mycorrhizal fungi influence life history traits of a lepidopteran herbivore. Oecologia 2000, 125, 362–369. [Google Scholar] [CrossRef]
  31. Pineda, A.; Dicke, M.; Pieterse, C.M.J.; Pozo, M.J. Beneficial microbes in a changing environment: Are they always helping plants to deal with insects? Funct. Ecol. 2013, 27, 574–586. [Google Scholar] [CrossRef] [Green Version]
  32. Schoonhoven, L.; Van Loon, B.; van Loon, J.; Dicke, M. Insect-Plant Biology; Oxford University Press on Demand: Oxford, UK, 2005. [Google Scholar]
  33. Gange, A.C.; West, H.M. Interactions between arbuscular mycorrhizal fungi and foliar-feeding insects in Plantago lanceolata L. New Phytol. 1994, 128, 79–87. [Google Scholar] [CrossRef] [PubMed]
  34. Larose, G.; Chênevert, R.; Moutoglis, P.; Gagné, S.; Piché, Y.; Vierheilig, H. Flavonoid levels in roots of Medicago sativa are modulated by the developmental stage of the symbiosis and the root colonizing arbuscular mycorrhizal fungus. J. Plant Physiol. 2002, 159, 1329–1339. [Google Scholar] [CrossRef] [Green Version]
  35. Hill, E.M.; Robinson, L.A.; Abdul-Sada, A.; Vanbergen, A.J.; Hodge, A.; Hartley, S.E. Arbuscular mycorrhizal fungi and plant chemical defence: Effects of colonisation on aboveground and belowground metabolomes. J. Chem. Ecol. 2018, 44, 198–208. [Google Scholar] [CrossRef] [Green Version]
  36. Chen, S.C.; Jin, W.J.; Liu, A.R.; Zhang, S.J.; Liu, D.L.; Wang, F.H.; Lin, X.M.; He, C.X. Arbuscular mycorrhizal fungi (AMF) increase growth and secondary metabolism in cucumber subjected to low temperature stress. Sci. Hortic. 2013, 160, 222–229. [Google Scholar] [CrossRef]
  37. Rivero, J.; Lidoy, J.; Llopis-Giménez, Á.; Herrero, S.; Flors, V.; Pozo, M.J. Mycorrhizal symbiosis primes the accumulation of antiherbivore compounds and enhances herbivore mortality in tomato. J. Exp. Bot. 2021, 72, 5038–5050. [Google Scholar] [CrossRef]
  38. Coppola, M.; Diretto, G.; Digilio, M.C.; Woo, S.L.; Giuliano, G.; Molisso, D.; Pennacchio, F.; Lorito, M.; Rao, R. Transcriptome and metabolome reprogramming in tomato plants by Trichoderma harzianum strain T22 primes and enhances defense responses against aphids. Front. Physiol. 2019, 10, 745. [Google Scholar] [CrossRef] [PubMed]
  39. Shoresh, M.; Yedidia, I.; Chet, I. Involvement of jasmonic acid/ethylene signaling pathway in the systemic resistance induced in cucumber by Trichoderma asperellum T203. Phytopathology 2005, 95, 76–84. [Google Scholar] [CrossRef] [PubMed] [Green Version]
  40. Yedidia, I.; Shoresh, M.; Kerem, Z.; Benhamou, N.; Kapulnik, Y.; Chet, I. Concomitant induction of systemic resistance to Pseudomonas syringae pv. lachrymans in cucumber by Trichoderma asperellum (T-203) and accumulation of phytoalexins. Appl. Environ. Microbiol. 2003, 69, 7343–7353. [Google Scholar] [CrossRef] [PubMed] [Green Version]
  41. Martínez-Medina, A.; Roldán, A.; Albacete, A.; Pascual, J.A. The interaction with arbuscular mycorrhizal fungi or Trichoderma harzianum alters the shoot hormonal profile in melon plants. Phytochemistry 2011, 72, 223–229. [Google Scholar] [CrossRef]
  42. Martínez-Medina, A.; Alguacil, M.D.M.; Pascual, J.A.; Van Wees, S.C. Phytohormone profiles induced by Trichoderma isolates correspond with their biocontrol and plant growth-promoting activity on melon plants. J. Chem. Ecol. 2014, 40, 804–815. [Google Scholar] [CrossRef]
  43. Zhou, D.; Huang, X.F.; Guo, J.; dos-Santos, M.L.; Vivanco, J.M. Trichoderma gamsii affected herbivore feeding behaviour on Arabidopsis thaliana by modifying the leaf metabolome and phytohormones. Microb. Biotechnol. 2018, 11, 1195–1206. [Google Scholar] [CrossRef] [PubMed]
  44. Koricheva, J.; Gange, A.C.; Jones, T. Effects of mycorrhizal fungi on insect herbivores: A meta-analysis. Ecology 2009, 90, 2088–2097. [Google Scholar] [CrossRef]
  45. Malinowska, J.M.; Viant, M.R. Confidence in metabolite identification dictates the applicability of metabolomics to regulatory toxicology. Curr. Opin. Toxicol. 2019, 16, 32–38. [Google Scholar] [CrossRef]
  46. Kariyat, R.R.; Mauck, K.E.; Balogh, C.M.; Stephenson, A.G.; Mescher, M.C.; De Moraes, C.M. Inbreeding in horsenettle (Solanum carolinense) alters night-time volatile emissions that guide oviposition by Manduca sexta moths. Proc. R. Soc. B Biol. Sci. 2013, 280, 20130020. [Google Scholar] [CrossRef] [Green Version]
  47. Stewart, J.G.; Philogène, B.J.R. Reproductive potential of laboratory-reared Manduca sexta (Lepidoptera: Sphingidae) as affected by sex ratio. Can. Entomol. 1983, 115, 295–298. [Google Scholar] [CrossRef]
  48. Tikkanen, O.P.; Niemelä, P.; Keränen, J. Growth and development of a generalist insect herbivore, Operophtera brumata, on original and alternative host plants. Oecologia 2000, 122, 529–536. [Google Scholar] [CrossRef] [PubMed]
  49. Teder, T.; Tammaru, T. Sexual size dimorphism within species increases with body size in insects. Oikos 2005, 108, 321–334. [Google Scholar] [CrossRef]
  50. Bell, R.A. Insect Neurochemistry and Neurophysiology 1986; Springer: Berlin/Heidelberg, Germany, 1986; pp. 347–350. [Google Scholar]
  51. West, S.A.; Sheldon, B.C. Constraints in the evolution of sex ratio adjustment. Science 2002, 295, 1685–1688. [Google Scholar] [CrossRef] [Green Version]
  52. Kaling, M.; Schmidt, A.; Moritz, F.; Rosenkranz, M.; Witting, M.; Kasper, K.; Janz, D.; Schmitt-Kopplin, P.; Schnitzler, J.P.; Polle, A. Mycorrhiza-triggered transcriptomic and metabolomic networks impinge on herbivore fitness. Plant Physiol. 2018, 176, 2639–2656. [Google Scholar] [CrossRef] [Green Version]
  53. Hare, J.D. Seasonal variation in plant-insect associations: Utilization of Solanum dulcamara by Leptinotarsa decemlineata. Ecology 1983, 64, 345–361. [Google Scholar] [CrossRef]
  54. Altesor, P.; García, Á.; Font, E.; Rodríguez-Haralambides, A.; Vilaró, F.; Oesterheld, M.; Soler, R.; González, A. Glycoalkaloids of wild and cultivated Solanum: Effects on specialist and generalist insect herbivores. J. Chem. Ecol. 2014, 40, 599–608. [Google Scholar] [CrossRef]
  55. Chowański, S.; Adamski, Z.; Marciniak, P.; Rosiński, G.; Büyükgüzel, E.; Büyükgüzel, K.; Falabella, P.; Scrano, L.; Ventrella, E.; Lelario, F. A review of bioinsecticidal activity of Solanaceae alkaloids. Toxins 2016, 8, 60. [Google Scholar] [CrossRef] [Green Version]
  56. Kumar, P.; Ortiz, E.V.; Garrido, E.; Poveda, K.; Jander, G. Potato tuber herbivory increases resistance to aboveground lepidopteran herbivores. Oecologia 2016, 182, 177–187. [Google Scholar] [CrossRef] [PubMed]
  57. Weissenberg, M.; Levy, A.; Svoboda, J.A.; Ishaaya, I. The effect of some Solanum steroidal alkaloids and glycoalkaloids on larvae of the red flour beetle, Tribolium castaneum, and the tobacco hornworm, Manduca sexta. Phytochemistry 1998, 47, 203–209. [Google Scholar] [CrossRef]
  58. Duffey, S.S.; Bloem, K.A.; Campbell, B.C. Consequences of Sequestration of Plant Natural Products Inplant-Insect-Parasitoid Interactions. John Wiley & Sons: New York, NY, USA, 1986. [Google Scholar]
  59. Friedman, M. Tomato glycoalkaloids: Role in the plant and in the diet. J. Agric. Food Chem. 2002, 50, 5751–5780. [Google Scholar] [CrossRef]
  60. Büyükgüzel, E.; Büyükgüzel, K.; Erdem, M.; Adamski, Z.; Adamski, Z.; Marciniak, P.; Ziemnicki, K.; Ventrella, E.; Scrano, L.; Bufo, S.A. The influence of dietary α-solanine on the waxmoth Galleria mellonella L. Arch. Insect Biochem. Physiol. 2013, 83, 15–24. [Google Scholar] [CrossRef]
  61. Adamski, Z.; Adamski, Z.; Marciniak, P.; Ziemnicki, K.; Büyükgüzel, E.; Erdem, M.; Büyükgüzel, K.; Ventrella, E.; Falabella, P.; Cristallo, M. Potato leaf extract and its component, α-solanine, exert similar impacts on development and oxidative stress in galleria mellonella L. Arch. Insect Biochem. Physiol. 2014, 87, 26–39. [Google Scholar] [CrossRef] [PubMed]
  62. Flanders, K.L.; Hawkes, J.G.; Radcliffe, E.B.; Lauer, F.I. Insect resistance in potatoes: Sources, evolutionary relationships, morphological and chemical defenses, and ecogeographical associations. Euphytica 1992, 61, 83–111. [Google Scholar] [CrossRef]
  63. Pelletier, Y.; Tai, G.C.C. Genotypic variability and mode of action of Colorado potato beetle (Coleoptera: Chrysomelidae) resistance in seven Solanum species. J. Econ. Entom. 2001, 94, 572–578. [Google Scholar] [CrossRef] [PubMed]
  64. López-Carretero, A.; Cruz, M.; Eben, A. Phenotypic plasticity of the reproductive system of female Leptinotarsa undecimlineata. Entomol. Exp. Appl. 2005, 115, 27–31. [Google Scholar] [CrossRef]
  65. Keukens, E.A.J.; de Vrije, T.; van den Boom, C.; de Waard, P.; Plasman, H.H.; Thiel, F.; Chupin, V.; Jongen, W.M.F.; de Kruijff, B. Molecular basis of glycoalkaloid induced membrane disruption. Biochim. Biophys. Acta BBA-Biomembr. 1995, 1240, 216–228. [Google Scholar] [CrossRef] [Green Version]
  66. Oberdörster, E.; Clay, M.A.; Cottam, D.M.; Wilmot, F.A.; McLachlan, J.A.; Milner, M.J. Common phytochemicals are ecdysteroid agonists and antagonists: A possible evolutionary link between vertebrate and invertebrate steroid hormones. J. Steroid Biochem. Mol. Biol. 2001, 77, 229–238. [Google Scholar] [CrossRef]
  67. Morris, C.E. Electrophysiological effects of cholinergic agents on the CNS of a nicotine-resistant insect, the tobacco hornworm (Manduca sexta). J. Exp. Zool. 1984, 229, 361–374. [Google Scholar] [CrossRef]
  68. Wink, M.; Theile, V. Alkaloid tolerance in Manduca sexta and phylogenetically related sphingids (Lepidoptera: Sphingidae). Chemoecology 2002, 12, 29–46. [Google Scholar] [CrossRef]
  69. Maddrell, S.H.; Gardiner, B.O. Induction of transport of organic anions in Malpighian tubules of Rhodnius. J. Exp. Biol. 1975, 63, 755–761. [Google Scholar] [CrossRef] [PubMed]
  70. Da Silva, V.D.A.; da Silva, A.M.M.; Silva, J.H.C.E.; Costa, S.L. Neurotoxicity of Prosopis juliflora: From natural poisoning to mechanism of action of its piperidine alkaloids. Neurotox. Res 2018, 34, 878–888. [Google Scholar] [CrossRef] [PubMed]
  71. Choudhary, M.I.; Nawaz, S.A.; Azim, M.K.; Ghayur, M.N.; Lodhi, M.A.; Jalil, S.; Khalid, A.; Ahmed, A.; Rode, B.M.; Ahmad, V.U. Juliflorine: A potent natural peripheral anionic-site-binding inhibitor of acetylcholinesterase with calcium-channel blocking potential, a leading candidate for Alzheimer’s disease therapy. Biochem. Biophys. Res. Commun. 2005, 332, 1171–1179. [Google Scholar] [CrossRef]
  72. Zhang, X.; Zhang, P.; Perez-Rodriguez, V.; Souders II, C.L.; Martyniuk, C.J. Assessing the toxicity of the benzamide fungicide zoxamide in zebrafish (Danio rerio): Towards an adverse outcome pathway for beta-tubulin inhibitors. Environ. Toxicol. Pharmacol. 2020, 78, 103405. [Google Scholar] [CrossRef]
  73. Nwani, C.D.; Odo, G.E.; Nwadinigwe, A.O.; Onyeke, C.C.; Atama, C.I.; Ngwu, G.; Oluah, S.N.; Ukonze, J.A.; Ezeibe, B.C.A. Short-term effects of albendazole on the oxidative stress markers and hematological parameters in tissues of African Catfish Clarias gariepinus. J. Aquat. Anim. Health 2016, 28, 222–228. [Google Scholar] [CrossRef]
  74. Andrade, T.S.; Henriques, J.F.; Almeida, A.R.; Machado, A.L.; Koba, O.; Giang, P.T.; Soares, A.M.; Domingues, I. Carbendazim exposure induces developmental, biochemical and behavioural disturbance in zebrafish embryos. Aquat. Toxicol. 2016, 170, 390–399. [Google Scholar] [CrossRef] [Green Version]
  75. Chance, B.; Sies, H.; Boveris, A. Hydroperoxide metabolism in mammalian organs. Physiol. Rev. 1979, 59, 527–605. [Google Scholar] [CrossRef] [PubMed]
  76. Li, X.; Schuler, M.A.; Berenbaum, M.R. Molecular mechanisms of metabolic resistance to synthetic and natural xenobiotics. Annu. Rev. Entomol. 2007, 52, 231–253. [Google Scholar] [CrossRef]
  77. Enayati, A.A.; Ranson, H.; Hemingway, J. Insect glutathione transferases and insecticide resistance. Insect Mol. Biol. 2005, 14, 3–8. [Google Scholar] [CrossRef] [PubMed] [Green Version]
  78. Lait, C.G.; Alborn, H.T.; Teal, P.E.A.; Tumlinson, J.H. Rapid biosynthesis of N-linolenoyl-L-glutamine, an elicitor of plant volatiles, by membrane-associated enzyme (s) in Manduca sexta. Proc. Natl. Acad. Sci. USA 2003, 100, 7027–7032. [Google Scholar] [CrossRef] [PubMed] [Green Version]
  79. Yoshinaga, N.; Aboshi, T.; Abe, H.; Nishida, R.; Alborn, H.T.; Tumlinson, J.H.; Mori, N. Active role of fatty acid amino acid conjugates in nitrogen metabolism in Spodoptera litura larvae. Proc. Natl. Acad. Sci. USA 2008, 105, 18058–18063. [Google Scholar] [CrossRef] [Green Version]
  80. Yoshinaga, N.; Ishikawa, C.; Seidl-Adams, I.; Bosak, E.; Aboshi, T.; Tumlinson, J.H.; Mori, N. N-(18-hydroxylinolenoyl)-L-glutamine: A newly discovered analog of volicitin in Manduca sexta and its elicitor activity in plants. J. Chem. Ecol. 2014, 40, 484–490. [Google Scholar] [CrossRef] [PubMed] [Green Version]
  81. Block, A.; Christensen, S.A.; Hunter, C.T.; Alborn, H.T. Herbivore-derived fatty-acid amides elicit reactive oxygen species burst in plants. J. Exp. Bot. 2018, 69, 1235–1245. [Google Scholar] [CrossRef] [PubMed]
  82. Paré, P.W.; Alborn, H.T.; Tumlinson, J.H. Concerted biosynthesis of an insect elicitor of plant volatiles. Proc. Natl. Acad. Sci. USA 1998, 95, 13971–13975. [Google Scholar] [CrossRef] [Green Version]
  83. Tumlinson, J.H.; Lait, C.G. Biosynthesis of fatty acid amide elicitors of plant volatiles by insect herbivores. Arch. Insect Biochem. Physiol. Collab. Entomol. Soc. Am. 2005, 58, 54–68. [Google Scholar] [CrossRef]
  84. Mori, N.; Yoshinaga, N. Function and evolutionary diversity of fatty acid amino acid conjugates in insects. J. Plant Interact. 2011, 6, 103–107. [Google Scholar] [CrossRef]
  85. Horne, I.; Haritos, V.S.; Oakeshott, J.G. Comparative and functional genomics of lipases in holometabolous insects. Insect Biochem. Mol. Biol. 2009, 39, 547–567. [Google Scholar] [CrossRef] [PubMed]
  86. Stanley-Samuelson, D.W.; Jurenka, R.A.; Cripps, C.; Blomquist, G.J.; de Renobales, M. Fatty acids in insects: Composition, metabolism, and biological significance. Arch. Insect Biochem. Physiol. 1988, 9, 1–33. [Google Scholar] [CrossRef]
  87. Soulages, J.; Wells, M.A. Metabolic fate and turnover rate of hemolymph free fatty acids in adult Manduca sexta. Insect Biochem. Mol. Biol. 1994, 24, 79–86. [Google Scholar] [CrossRef]
  88. Kaczmarek, A.; Wrońska, A.K.; Kazek, M.; Boguś, M.I. Metamorphosis-related changes in the free fatty acid profiles of Sarcophaga (Liopygia) argyrostoma (Robineau-Desvoidy, 1830). Sci. Rep. 2020, 10, 17337. [Google Scholar] [CrossRef] [PubMed]
  89. Bremer, J. Carnitine-metabolism and functions. Physiol. Rev. 1983, 63, 1420–1480. [Google Scholar] [CrossRef] [PubMed]
  90. Liepinsh, E.; Kalvinsh, I.; Dambrova, M. The regulation of energy metabolism pathways through L-carnitine homeostasis. Role Adipocyte Dev. Type 2 Diabetes 2011, 6, 107–128. [Google Scholar]
  91. Li, J.-M.; Li, L.-Y.; Qin, X.; Ning, L.-J.; Lu, D.-L.; Li, D.-L.; Zhang, M.-L.; Wang, X.; Du, Z.-Y. Systemic regulation of L-carnitine in nutritional metabolism in zebrafish, Danio rerio. Sci. Rep. 2017, 7, 40815. [Google Scholar] [CrossRef] [Green Version]
  92. Wu, Z.; Guo, W.; Yang, L.; He, Q.; Zhou, S. Juvenile hormone promotes locust fat body cell polyploidization and vitellogenesis by activating the transcription of Cdk6 and E2f1. Insect Biochem. Mol. Biol. 2018, 102, 1–10. [Google Scholar] [CrossRef]
  93. Martínez-Medina, A.; Roldán, A.; Pascual, J.A. Performance of a Trichoderma harzianum bentonite—Vermiculite formulation against fusarium wilt in seedling nursery melon plants. Hortic. Sci. 2009, 44, 2025–2027. [Google Scholar] [CrossRef] [Green Version]
  94. Grosse-Wilde, E.; Kuebler, L.S.; Bucks, S.; Vogel, H.; Wicher, D.; Hansson, B.S. Antennal transcriptome of Manduca sexta. Proc. Natl. Acad. Sci. USA 2011, 108, 7449–7454. [Google Scholar] [CrossRef] [PubMed] [Green Version]
  95. Thakur, M.P.; Quast, V.; Van Dam, N.M.; Eisenhauer, N.; Roscher, C.; Biere, A.; Martinez-Medina, A. Interactions between functionally diverse fungal mutualists inconsistently affect plant performance and competition. Oikos 2019, 128, 1136–1146. [Google Scholar] [CrossRef]
  96. Hoagland, D.R.; Arnon, D.I. The water-culture method for growing plants without soil. In Circular; California Agricultural Experiment Station: Berkeley, CA, USA, 1950; Volume 347, p. 32. [Google Scholar]
  97. Phillips, J.M.; Hayman, D.S. Improved procedures for clearing roots and staining parasitic and vesicular-arbuscular mycorrhizal fungi for rapid assessment of infection. Trans. Br. Mycol. Soc. 1970, 55, 158–161. [Google Scholar] [CrossRef]
  98. Giovannetti, M.; Mosse, B. An evaluation of techniques for measuring vesicular arbuscular mycorrhizal infection in roots. New Phytol. 1980, 84, 489–500. [Google Scholar] [CrossRef]
  99. Rogachev, I.; Aharoni, A. UPLC-MS-based metabolite analysis in tomato. In Plant Metabolomics; Springer: Berlin/Heidelberg, Germany, 2011; pp. 129–144. [Google Scholar]
  100. De Vos, R.; Schipper, B.; Hall, R. High-performance liquid chromatography–mass spectrometry analysis of plant metabolites in Brassicaceae. In Plant Metabolomics; Springer: Berlin/Heidelberg, Germany, 2011; pp. 111–128. [Google Scholar]
  101. Chong, J.; Wishart, D.S.; Xia, J. Using MetaboAnalyst 4.0 for comprehensive and integrative metabolomics data analysis. Curr. Protoc. Bioinform. 2019, 68, e86. [Google Scholar] [CrossRef] [PubMed]
Figure 1. The impact of root colonization by Rhizophagus irregularis or Trichoderma harzianum on the morphology of the pupae and moths developed by Manduca sexta larvae that had fed from root-inoculated tomato plants. (A) Representative pupae with anomalous morphology developed by larvae that had fed from T. harzianum-inoculated plants (right panel), and a representative pupa presenting normal morphology developed by larvae that had fed form non-inoculated plants (left panel). (B) Representative Manduca sexta moths showing anomalous morphology (underdeveloped wings) formed by larvae that had fed from R. irregularis-inoculated plants (right panel) and a representative moth presenting normal morphology developed by larvae that had fed form non-inoculated plants (left panel).
Metabolites 11 00731 g001
Figure 2. The impact of root colonization by Rhizophagus irregularis or Trichoderma harzianum and Manduca sexta shoot herbivory on the metabolome of tomato leaves. (A) Two-dimensional principal component analysis (PCA) scores plot of leaf samples of tomato plants that were non-inoculated or root-inoculated with R. irregularis and not challenged or shoot-challenged with M. sexta for three weeks. (B) PCA scores plot of leaf samples of tomato plants that were non-inoculated or root-inoculated with T. harzianum and not challenged or shoot-challenged with M. sexta for three weeks.
Metabolites 11 00731 g002
Figure 3. The impact of tomato root colonization by Rhizophagus irregularis on the gut metabolome of Manduca sexta larvae. (A) Two-dimensional principal component analysis (PCA) scores plot of M. sexta gut samples. (B) Significant metabolomic features annotated for the M. sexta gut samples. Manduca sexta larvae were fed for three weeks on leaves of tomato plants that were non-inoculated or root-inoculated with R. irregularis. In (B), the volcano plot displays fold change threshold (x-axis) of 2 and t-test threshold (y-axis) of 0.05. The purple circles represent features above the threshold. Both fold changes and p-values are log-transformed. The metabolomic features that showed the highest increase for the larvae reared on non-inoculated plants are found towards the right side of the volcano plot. The metabolomic features that showed the highest increase for the larvae reared on R. irregularis-inoculated plants are found towards the left side of the volcano plot. The most statistically significant metabolomic features for both treatments are found towards the top of the volcano plot.
Metabolites 11 00731 g003
Figure 4. The impact of tomato root colonization by Trichoderma harzianum on the gut metabolome of Manduca sexta larvae. (A) Two-dimensional principal component analysis (PCA) scores plot of M. sexta gut samples. (B) Significant metabolomic features annotated for the M. sexta gut samples. Manduca sexta larvae were fed for three weeks on leaves of tomato plants that were non-inoculated or root inoculated with T. harzianum. In (B), the volcano plot displays fold change threshold (x-axis) of 2 and t-test threshold (y-axis) of 0.05. The purple circles represent features above the threshold. Both fold changes and p-values are log-transformed. The metabolomic features that showed the highest increase for the larvae reared on non-inoculated plants are found towards the right side of the volcano plot. The metabolomic features that showed the highest increase for the larvae reared on T. harzianum-inoculated plants are found towards the left side of the volcano plot. The most statistically significant metabolomic features for both treatments are found towards the top of the volcano plot.
Metabolites 11 00731 g004
Figure 5. The impact of tomato root colonization by Rhizophagus irregularis on the fat body metabolome of Manduca sexta larvae. (A) Two-dimensional principal component analysis (PCA) scores plot of M. sexta fat body samples. (B) Significant metabolomic features annotated for the M. sexta fat body samples. Manduca sexta larvae were fed for three weeks on leaves of tomato plants that were non-inoculated, or root-inoculated with R. irregularis. In (B), the volcano plot displays fold change threshold (x-axis) of 2 and t-test threshold (y-axis) of 0.05. The purple circles represent features above the threshold. Both fold changes and p-values are log-transformed. The metabolomic features that showed the highest increase for the larvae reared on non-inoculated plants are found towards the right side of the volcano plot. The metabolomic features that showed the highest increase for the larvae reared on R. irregularis-inoculated plants are found towards the left side of the volcano plot. The most statistically significant metabolomic features for both treatments are found towards the top of the volcano plot.
Metabolites 11 00731 g005
Figure 6. The impact of tomato root colonization by Trichoderma harzianum on the fat body metabolome of Manduca sexta larvae. (A) Two-dimensional principal component analysis (PCA) scores plot of M. sexta fat body samples. (B) Significant metabolomic features annotated for the M. sexta fat body samples. Manduca sexta larvae were fed for three weeks on leaves of tomato plants that were non-inoculated or root-inoculated with T. harzianum. In (B), the volcano plot displays fold change threshold (x-axis) of 2 and t-test threshold (y-axis) of 0.05. The purple circles represent features above the threshold. Both fold changes and p-values are log-transformed. The metabolomic features that showed the highest increase for the larvae reared on non-inoculated plants are found towards the right side of the volcano plot. The metabolomic features that showed the highest increase for the larvae reared on T. harzianum-inoculated plants are found towards the left side of the volcano plot. The most statistically significant metabolomic features for both treatments are found towards the top of the volcano plot.
Metabolites 11 00731 g006
Table 1. Impact of tomato root inoculation by Rhizophagus irregularis or Trichoderma harzianum on Manduca sexta pupation and adult emergence.
TreatmentNo Larvae Reaching the Pre-Pupa Stage Days Until Pre-Pupation (±SD)Days until Pupation (±SD)Total No of PupaeNo. of Pupae with Normal MorphologyNo. of Pupae with Anomalous MorphologyWeight (g) of Normal Pupae (±SD)F/M Ratio of the Normal PupaeNumber of Normal Pupae Not EclosingNo of Moths with Anomalous MorphologyNo of Moths with Normal Morphology
Non-inoculated1923.39 ± 1.4722.06 ± 3.83171342.65 ± 0.499:42110
R. irregularis1520.41 ± 2.5419.94 ± 4.45151142.71 ± 0.613:8344
T. harzianum1322.69 ± 1.911.61 ± 6.5912571.61 ± 0.912:3122
One-way ANOVA-nsns---nsχ2 = 4.196 ---
One-way ANOVA evaluated the effect of the different treatments on the days required until pre-pupation, the days required for pupation, and the weight of the pupae showing a normal morphology. Pearson’s chi-squared test evaluated the effect of the different treatments on the ratio of normally developed female to male M. sexta pupae. SD: standard deviation, ns: not significant.
Table 2. The most significant metabolomic features annotated for the gut samples of Manduca sexta larvae fed for three weeks on leaves of tomato plants non-inoculated and root-inoculated with Rhizophagus irregularis. The feature number corresponds to the features given in Figure 3B, which are given by their corresponding mass to charge ratio (m/z) and retention time (rt) in minutes. The fold change (FC) refers to the feature’s qToF intensity and was calculated on the basis of a volcano plot conducted for the non-inoculated and R. irregularis-inoculated larvae. The volcano plot was conducted with a fold change threshold (x-axis) of 2 and t-test threshold (y-axis) of 0.05. The level of confidence of the identification/annotation is given according to Malinowska and Viant [45].
Feature IDAnnotationm/zrtFClog2(FC)Raw p-ValueLevel of Confidence
1C23H39NO4394.295112.05.632.5p < 0.00013
2C10H17N3O6S (Glutathione)308.09081.15.612.49p = 0.00062
3C24H41NO3392.315717.96.252.64p = 0.0023
4C23H39NO3378.301217.46.562.71p = 0.013
5C27H39O3426.300917.96.492.7p = 0.043
6C5H11N
(Piperidine)
86.09670.50.49−1.03p < 0.00012
7C55H94N10O16P2623.31058.00.37−1.45p < 0.00013
8C52H97N8O17P3S616.30288.00.36−1.48p < 0.00013
9No formula110.06531.20.28−1.84p < 0.00014
10No formula132.10180.40.49−1.03p < 0.00014
11C12H37N7OS328.284113.10.02−6.05p < 0.00013
12C23H43N3O6P2520.270814.90.02−5.76p < 0.00013
13C14H18N2O5295.12934.90.004−8.16p = 0.0023
14No formula782.01878.20.03−5.1p = 0.0014
15No formula644.237010.40.03−4.5p = 0.0034
Table 3. The most significant metabolomic features annotated for the gut samples of Manduca sexta larvae fed for three weeks on leaves of tomato plants that were non-inoculated and root-inoculated with Trichoderma harzianum. The feature number corresponds to the features given in Figure 4B and are given by their corresponding mass to charge ratio (m/z) and retention time (rt) in minutes. The fold change (FC) refers to the feature’s qToF intensity and was calculated on the basis of a volcano plot conducted for the non-inoculated and T. harzianum-inoculated larvae. The volcano plot was conducted with a fold change threshold (x-axis) of 2 and t-test threshold (y-axis) of 0.05. The level of confidence of the identicication/annotation is given according to Malinowska and Viant [45].
Feature IDAnnotationm/zrtFClog2(FC)Raw p-ValueLevel of Confidence
1C23H39NO4394.295112.0378.828.57p < 0.00013
2C25H45NO4 (linoleyl-carnitine)424.342113.9597.139.22p < 0.00012
3C22H42N2O351.337012.9614.719.26p< 0.00013
4No formula224.20109.8388.278.6p < 0.00014
5C25H43NO4 (γ-linolenoyl-carnitine)422.327413.2340.618.41p < 0.00012
6C23H42NO7P476.277213.00.19−2.4p < 0.00013
7C13H16N4229.14447.90.1−3.31p < 0.00013
8No formula110.06531.20.2−2.34p < 0.00014
9C8H9NO2152.07096.70.05−4.34p < 0.00013
10C10H9NO4225.08721.30.16−2.67p < 0.00013
11No formula133.08667.90.01−6.13p < 0.00014
12No formula812.06688.00.009−6.84p < 0.00014
13C12H37N7OS328.284113.10.01−6.42p < 0.00013
14C23H45NO4(O-palmitoyl-carnitine)400.342114.80.01−6.31p < 0.00012
15C14H18N2O5295.12934.90.005−7.740.00013
Table 4. The most significant metabolomic features annotated for the fat body samples of Manduca sexta larvae fed for three weeks on leaves of tomato plants that were non-inoculated and root-inoculated with Rhizophagus irregularis. The feature number corresponds to the features given in Figure 5B, which are given by their corresponding mass to charge ratio (m/z) and retention time (rt) in minutes. The fold change (FC) refers to the feature’s qToF intensity and was calculated on the basis of a volcano plot conducted for the non-inoculated and R. irregularis-inoculated larvae. The volcano plot was conducted with a fold change threshold (x-axis) of 2 and t-test threshold (y-axis) of 0.05. The level of confidence of the identification/annotation is given according to Malinowska and Viant [45].
Feature IDAnnotationm/zrtFClog2(FC)p-ValueLevel of Confidence
1C25H43NO5438.321011.93.711.89p < 0.00013
2C32H66N4O7P2S357.21386.83.521.82p < 0.00013
3C10H12N2O3209.09090.94.732.24p < 0.00013
4C37H62N6591.509515.13.291.72p < 0.00013
5C36H74N2O2567.582319.93.641.87p < 0.0083
6C23H4NO7P476.277411.70.4−1.31p < 0.00013
7No formula175.11631.10.37−1.42p < 0.00014
8No formula112.05021.00.28−1.82p < 0.00014
9No formula671.35425.90.14−2.83p < 0.00014
10C23H43NO4 (2E)-hexadecenoylcarnitine)398.326513.70.15−2.77p < 0.00012
11No formula224.201010.00.05−4.42p < 0.00014
12C37H66N8O10392.25166.90.03−4.86p < 0.00013
13C50H94N8O17360.56506.20.04−4.53 p < 0.00013
14C41H79N14O5PS304.53525.90.04−4.6p < 0.00013
15C12H37N7OS328.283913.10.04−4.66p < 0.00013
Table 5. The most significant metabolomic features annotated for the fat body samples from Manduca sexta larvae fed for three weeks on leaves of tomato plants that were non-inoculated and root-inoculated with Trichoderma harzianum. The feature number corresponds to the features given in Figure 6B, which are given by their corresponding mass to charge ratio (m/z) and retention time (rt) in minutes. The fold change (FC) refers to the feature’s qToF intensity and was calculated on the basis of a volcano plot conducted for the non-inoculated and T. harzianum-inoculated larvae. The volcano plot was conducted with a fold change threshold (x-axis) of 2 and t-test threshold (y-axis) of 0.05. The level of confidence of the identification/annotation is given according to Malinowska and Viant [45].
Feature IDAnnotationm/zrtFClog2(FC)p-ValueLevel of Confidence
1C9H18O2159.137712.96.82.77p < 0.00013
2No formula320.255814.512.363.63p < 0.00014
3C17H31NO266.248313.610.713.42p < 0.00013
4C18H37NO (octadecanamide)284.29519.619.244.27p < 0.00012
5C36H70N2O4595.540815.865.576.04p < 0.00013
6C27H50N2O2435.394417.8105.256.72p < 0.00013
7C36H70N2O6627.531014.9105.46.72p < 0.00013
8C28H50N4O8S603.341610.4119.756.9p < 0.00013
9C15H41N6O3PS417.277110.662.575.97p < 0.00013
10C23H42NO7P476.277411.70.21−2.24p < 0.00013
11C44H74N5O10P432.76488.00.01−6.32p < 0.00013
12C8H16O2
(octanoic acid)
145.12228.00.01−6.37p < 0.00012
13C58H77N31O7660.83898.00.008−6.93p < 0.00013
14C35H36N4O7
(benzamide)
625.266215.90.01−6.26p < 0.00012
15No formula742.00447.870.009−6.73p < 0.00014
Publisher’s Note: MDPI stays neutral with regard to jurisdictional claims in published maps and institutional affiliations.

