Article

Genomic Diversity among Actinomyces naeslundii Strains and Closely Related Species

1
Centre of Host Microbiome Interactions, Faculty of Dentistry, Oral & Craniofacial Sciences, King’s College London, London SE1 9RT, UK
2
Centre of Oral Clinical & Translational Sciences, Faculty of Dentistry, Oral & Craniofacial Sciences, King’s College London, London SE1 9RT, UK
3
Department of Endodontics, Faculty of Dentistry, Oral & Craniofacial Sciences, King’s College London, London SE1 9RT, UK
4
Division of Oral Biology, School of Dentistry, Faculty of Medicine and Health, University of Leeds, Leeds LS9 7TF, UK
5
School of Life Sciences and Department of Statistics, University of Warwick, Coventry CV4 7AL, UK
6
Centre of Dental Education, Faculty of Dentistry, Oral & Craniofacial Sciences, King’s College London, London SE1 9RT, UK
*
Author to whom correspondence should be addressed.
Microorganisms 2023, 11(2), 254; https://doi.org/10.3390/microorganisms11020254
Submission received: 15 December 2022 / Revised: 16 January 2023 / Accepted: 16 January 2023 / Published: 19 January 2023

Abstract

:
The aim of this study was to investigate and clarify the ambiguous taxonomy of Actinomyces naeslundii and its closely related species using state-of-the-art high-throughput sequencing techniques, and, furthermore, to determine whether sub-clusters identified within Actinomyces oris and Actinomyces naeslundii in a previous study by multi locus sequence typing (MLST) using concatenation of seven housekeeping genes should either be classified as subspecies or distinct species. The strains in this study were broadly classified under Actinomyces naeslundii group as A. naeslundii genospecies I and genospecies II. Based on MLST data analysis, these were further classified as A. oris and A. naeslundii. The whole genome sequencing of selected strains of A. oris (n = 17) and A. naeslundii (n = 19) was carried out using Illumina Genome Analyzer IIxe and Roche 454 allowing paired-end and single-reads sequencing, respectively. The sequences obtained were aligned using CLC Genomic workbench version 5.1 and annotated using RAST (Rapid Annotation using Subsystem Technology) release version 59 accessible online. Additionally, genomes of seven publicly available strains of Actinomyces (k20, MG1, c505, OT175, OT171, OT170, and A. johnsonii) were also included. Comparative genomic analysis (CGA) using Mauve, Progressive Mauve, gene-by-gene, Core, and Pan Genome, and finally Digital DNA-DNA homology (DDH) analysis was carried out. DDH values were obtained using in silico genome–genome comparison. Evolutionary analysis using ClonalFrame was also undertaken. The mutation and recombination events were compared using chi-square test among A. oris and A. naeslundii isolates (analysis methods are not included in the study). CGA results were consistent with previous traditional classification using MLST. It was found that strains of Actinomyces k20, MG1, c505, and OT175 clustered in A. oris group of isolates, while OT171, OT170, and A. johnsonii appeared as separate branches. Similar clustering to MLST was observed for other isolates. The mutation and recombination events were significantly higher in A. oris than A. naeslundii, highlighting the diversity of A. oris strains in the oral cavity. These findings suggest that A. oris forms six distinct groups, whereas A. naeslundii forms three. The correct designation of isolates will help in the identification of clinical Actinomyces isolates found in dental plaque. Easily accessible online genomic sequence data will also accelerate the investigation of the biochemical characterisation and pathogenesis of this important group of micro-organisms.

1. Introduction

The micro-organisms found in the oral cavity of humans may be known collectively by the terms oral microbiota or oral microbiome [1]. There are 775 microbial species included in the expanded Human Oral Microbiome Database (eHOMD) [1,2,3,4]. The community of micro-organisms residing in the oral cavity varies between individuals and is unique to everyone [5,6]. The Actinomyces species are the second largest group of micro-organisms found in the dental plaque at interproximal sites and in gingival crevices [7,8]. Oral Actinomyces strains play an integral role in the initiation and progression of dental plaque formation [9,10,11,12,13].
The whole genome of selected clinical Actinomyces strains from King’s College London Microbiology Laboratory were sequenced for the first time in this study. However, these strains have been used in various studies since 1990 [14,15,16,17]. A. oris (previously known as A. naeslundii) was the most common member of the genus found in dental plaque [14]. A. naeslundii is an early colonizer of the oral biofilm [11]. A study reported that biofilms collected from different sites in the oral cavity harboured a significantly higher number of A. naeslundii (genospecies II) currently known as A. oris as compared to A. naeslundii (genospecies I) [18]. Phenotypic tests and 16S rRNA sequencing approaches are insufficient in discriminating the Actinomyces spp. isolates [17]. An MLST approach was adopted in a previous study to differentiate the genospecies of Actinomyces and provide a more accurate identification to the species level. A revision to their designation was put forward [17]; however, the status of these sub clusters was unclear, and further investigation based on genomic comparisons among closely related strains are therefore necessary.
Since the 1960s, the DNA–DNA hybridization (DDH) technique was the only whole genome characterization approach used for genome-wide comparisons among bacterial organisms. Seventy percent similarity was proposed for delineating bacterial species by Wayne et al. [19] but the techniques used were tedious, error-prone, and unfortunately were not adequate for building a comparative database. The availability of diverse methods led to variable and inconsistent results [20,21]. These drawbacks drove the research community to seek cost-effective alternatives to replace the tedious and unreliable DDH experiments [22,23,24,25]. The past couple of decades have seen great advancements in high-throughput sequencing technologies including whole genome sequencing, facilitating genomic comparative analysis. Among them, Digital DDH have revolutionised comparative genomics of closely related strains of species since the technology was first used for comparing several strains [26,27,28,29]. DDH calculation was also considered as a major tool for the delineation of microbial species [30].
Bacterial species can be described by their pan-genome, which is composed of a core genome containing genes present in all strains, and a dispensable genome containing genes present in two or more strains and genes unique to single strains [31]. Determining the pan-genome of microbial species is another approach used to investigate diversity among closely related bacterial species, and is typically applied to bacteria and archaea, which can have large variations in gene content among closely related strains [32,33]. The number of genes which are unique is vast; therefore, a pan genome size can be larger than any single genome. This study investigated 36 A. oris and A. naeslundii sub-clusters initially identified in a previous study by Henssge et al., (2011) [17] to determine whether they can be considered sub-species or distinct species. For this purpose, near-complete genome sequences of the A. oris and A. naeslundii strains were analysed in detail. DDH, core, pan-genome, and ClonalFrame analyses were used to investigate the phylogenetic status of the selected strains of Actinomyces.

2. Material and Methods

2.1. DNA Extraction from Actinomyces

2.1.1. Bacterial Strains and Growth Conditions

Thirty-six Actinomyces isolates were included (n = 19 belonged to Actinomyces naeslundii, n = 17 belonged to Actinomyces oris group of species) (Supplementary Table S1). Gen Bank accession numbers of all strains used in this study are mentioned in Supplementary Table S1 (SAMN05898698---SAMN05898733). The isolates used in the study were previously identified using MLST analysis by Henssge et al., (2011) [17]. The isolates were grown on fastidious anaerobic agar plates (FAA) (LabM Ltd., Scotland, UK), supplemented with 5% (v/v) defibrinated horse blood (TCS Biosciences Ltd., Buckingham, UK) at 37 °C anaerobically for 48 h. The purity of strains was verified by repeated streaking, Gram-staining, and partial 16S rRNA gene sequencing.

2.1.2. Lysis, Purification, and Isolation of Genomic DNA

Bacterial cells (2–3 loops full) were removed from the agar plate and suspended in 1 mL of sterile distilled water. The suspension was centrifuged at 13,000 rpm for 5 min and the cell pellet resuspended in 500 µL of TES buffer [0.1 M NaCl, 10 mM Tris HCl, and 1 mM EDTA (pH:8.0, Sigma-Aldrich, Dorset, UK) and 5% (v/v) Triton (X-100, Sigma-Aldrich, Dorset, UK)]. 100 µL of a solution of Achromopeptidase from Achromobacter lyticus (5 mg/mL, Sigma-Aldrich, Dorset, UK) and chicken-egg-white lysozyme (15 mg/mL, Sigma, UK) in TE buffer and 4 µL of RNase solution (10 mg/mL, Sigma Aldrich, Dorset, UK) were added to lyse the cell wall and to digest the contaminating RNA. The suspension was incubated at 37 °C for 2 h. Then, 50 µL of Proteinase K from Tritirachium album (10 mg/mL, Sigma-Aldrich, Dorset, UK), 10 µL of Pronase E (20 mg/mL in TE buffer, Sigma, UK), and 100 µL of 20% Sarkosyl (N-Lauryl sarcosine, Sigma, UK) were added to complete cell lysis, to digest cell debris, and remove extracellular polysaccharides and incubated at 37 °C for 2 h.
The GenEluteTM bacterial Genomic DNA (NA 2100, Sigma-Aldrich, Dorset, UK) kit was used with modification (Lysis treatment was used as described above) for purification and isolation of Genomic DNA. The protocol was followed using pre-assembled GenElute Miniprep Binding according to manufacturer’s instructions.
To obtain almost complete whole genome sequences, Illumina Sequencing was complemented with Roche 454 sequencing. The genome sequences from both methods were merged to get maximum coverage and high-quality genome sequencing.

2.2. Library Preparation for Illumina Paired-End Sequencing

The paired-end multiplexing sequencing assay protocol of Illumina kit was followed to generate high-quality sequences from both ends of DNA inserts. The paired-end run enables DNA sequencing up to 2 × 76 bp reads for fragments ranging from 150–200 bp and generate up to 200 million reads in a single run. The DNA samples were quantified using Qubit® 3.0 Fluorometer (ThermoFisher Scientific, Waltham, USA). The Quant-iT dsDNA BR (broad range) assay kit (Invitrogen, Scotland, UK) was used. The manufacturer protocol was used to prepare samples and standards to quantify dsDNA. DNA shearing, repairing the ends, addition of ‘A’ bases to the 3′ end of DNA fragments (A-Tailing), ligation of paired-end adapter, amplification of adapter-ligated library by PCR, and cluster generation were created using the Illumina’s standard protocol. After generating clusters, the flow cell was loaded onto Illumina Genome Analyser. The raw multiplexed sequences were obtained as fastq files and uploaded onto the University’s computing server.

2.3. Single-End Sequencing Using the Roche 454 GS (FLX) Titanium Platform

The sample requirement for rapid library preparation for the Roche 454 GS (FLX) titanium analyser was the double stranded DNA with an OD260/280 > 1.8 with a concentration of 500 ng and fragment size of more than 1.5 kb. The single-end sequencing assay protocol from Roche 454 was followed and sequencing was carried out on the Roche GS (FLX) analyser to generate 400 bp reads. High-quality sequences from single-end of the same DNA insert was obtained. The protocol used was a modified version of the GS-FLX-Titanium-Rapid-Library-Preparation-Method-Manual and NEBNext Quick DNA sample Prep Set2 (E6080S) to prepare the whole genomic DNA library.

2.4. De Novo Sequence Assembly and RAST Annotation

The resulting DNA sequences of Actinomyces strains obtained from Illumina and Roche 454 were processed and de novo sequence analysis was carried out using the CLC Genomic workbench version 5.1. The resulting contigs were exported from CLC as FASTA files and were annotated using RAST, which enables comparison of isolates on a gene-by-gene basis. For comparative purposes, the Actinomyces oris strain MG-1 (https://www.ncbi.nlm.nih.gov/genome/3064?genome_assembly_id=278833 accessed on 1 October, 2012) was used as a reference genome and was annotated using RAST (http://rast.nmpdr.org/) with the previously identified gene calls retained but with new RAST annotation release version 59. In effect, the genes identified by the CMR website http://cmr.jcvi.org/tigr-scripts/CMR/CmrHomePage.cgi accessed on 1 October, 2012, were retained but annotated using the methodology employed in RAST. K20, c505, OT170, OT171, and OT175, and A. johnsonii were also obtained from the publicly available database (www.homd.org) and included in the study. These genomes were closely related to those of either A. oris or A. neaslundii.

2.5. Genomic Comparisons among Actinomyces Strains

2.5.1. Comparative Analysis of Whole Genomes using Mauve

Mauve version 2.3.1 software (http://gel.ahabs.wisc.edu/mauve/ accessed on 1 December, 2012) [34] was used for multiple genome alignment, sequencing re-arrangement structures within genomes, and providing a comprehensive picture of genetic differences among Actinomyces genomes. The draft genome used in the analysis has contigs which were de novo assembled and aligned using MG-1 as a reference genome. The choice of A. oris MG-1 as a reference was made based on online availability of nearly complete genome sequence. Furthermore, it had only one contig. The whole genomes (Supplementary Table S1) were compared and aligned using Mauve [35]. The (alignment) file is the output file produced following mauve alignment. The file (alignment) was converted into a FASTA file format by concatenating the blocks. This was done using a Matlab script (Appendix A.3). Finally, the alignment data were loaded into MEGA version 5.0 to construct the Neighbor-Joining tree (Figure 1).

2.5.2. Comparative Analysis using Progressive Mauve (ClonalFrame)

Whole Genomes Analysis

Progressive mauve (PM) alignment tool [36] was the preferred method to align the genomic sequences as it performs better than Mauve. The only minor disadvantage of PM is that it is a slower program; however, it is a significantly more accurate than the original version. The program runs using genome sequences as input to find fragments that are shared amongst subset of genomes. PM was applied to 17 A. oris isolates (Supplementary Table S1) along with c505, MG1, k20, OT170, OT171, OT175, and 19 A. naeslundii strains separately as it was not possible to run 43 genomes using PM (Figure 2 and Figure 3). PM runs optimally on smaller data sets; therefore, fewer number of genomes (less than 25) were used. The (backbone) file is an output file from PM which was used to run StripsubsetLCBs (http://gel.ahabs.wisc.edu/mauve/snapshots/ was accessed on 1 January 2013). StripsubSetLCBs is a software used to align the sequences created during the PM program and convert them into required format needed to run the ClonalFrame analysis program (version 1.1). This identifies common sequences between strains. Ten independent runs of ClonalFrame were performed, each consisting of 40,000 iterations. Five hundred bootstrap replicates were generated. Furthermore, a maximum likelihood tree was constructed for each individual gene using MEGA version 5.0.
Figure 2. ClonalFrame analysis of A. oris isolates using whole Actinomyces spp. genomes.
Microorganisms 11 00254 g002
* Six independent groups were observed, known as A. oris, A. oris_1, A. oris_2, A. oris_3, and two independent clusters.
Figure 3. ClonalFrame analysis of A. naeslundii isolates using whole genomes.
Microorganisms 11 00254 g003
* Three independent groups were observed, known as A. naeslundii, A. naeslundii_1, and A. naeslundii_2.

Core and Pan-Genome Analysis

In addition to ClonalFrame analysis of whole genomes, Core and Pan Genomes were obtained for each of A. oris and A. naeslundii separately using PM. The plots were drawn using MEGA version 5.0 (information can be found in Appendix A.2).

2.5.3. Mapping and Alignment of Whole Genomes (Core Genomes) of Actinomyces Using Gene-to-Gene Analysis

Since PM tends not to work with large number of genomes, it was important therefore to align 43 genomes as one task to compare multiple whole genome sequences which were a million base pairs in length. This comparison facilitates the population study, core genome study, and genome evolution study. Therefore, gene-to-gene alignment approach was adapted, and core and shared genes were identified. Mapping between the genes (proteins) of the 43 annotated genomes delivered in this study was done using RAST (http://rast.nmpdr.org/). Ten genomes showing only protein coding genes with >90% homology with A. oris-MG1 were aligned at a time in RAST and exported to an Excel file. This was performed using a batch of 10 genomes (this number was the maximum which could be aligned at one time, always using a mixture of A. oris and A. naeslundii). The composite file was made in Excel deleting those genes not common to all genomes. Then, 476 genes were identified as core when all strains were considered in the mapping table and for each of these, MUSCLE was used to align the sequences (http://www.ebi.ac.uk/Tools/msa/muscle/ accessed on 1 July 2013). The MUSCLE program used a nonaligned FASTA file as input and produces an output as an aligned FASTA file. Matlab script (Appendix A.4) was used to complete gene alignment. This script read mapping table as well as the gene sequences of each genome to produce the correct input files for MUSCLE. Each gene-by-gene alignment was then appended into an XMFA file, with “=” signs separating the genes, and this is the required format needed to input for ClonalFrame [37].

2.5.4. Digital DNA–DNA Hybridization

DNA–DNA Hybridization (DDH) studies of genomic strains were used to determine the homology of all the common genes of a sequenced and annotated reference strain. DDH estimates were calculated using GGDC (Genome-to-Genome Distance calculator) version 2.0 (http://ggdc.dsmz.de), an online calculator using the strategy of GBDP (Genome Blast Distance Phylogeny). Data were obtained from whole genome sequences of Actinomyces strains using next-generation sequencing technologies of Illumina Genome Analyzer and Roche 454.
A total of 43 genomes including 17 A. oris, 19 A. naeslundii strains, and seven publicly available oral Actinomyces spp. [MG1, k20, OT170, OT171, OT175, A. johnsonii, and A. odontolyticus (Supplementary Table S1) (www.homd.org)] were included for sequence-based DDH calculations [38]. The strains listed in Supplementary Table S1 were clinical isolates (caries lesions and dental plaque biofilm) from King’s College London and source of strains was published by Henssge et al., (2011) [17]. The alignment method used for finding inter-genomic distances was NCBI-BLAST. The FASTA files used were those created during de novo analysis. The one FASTA file was selected for the query genome and up to 10 FASTA files were selected in the reference genomes list. Each FASTA query and reference genomes were named. The online submission form compares query genome with reference or known genome and uses three distance formulas to calculate the distance among genomes. The results obtained with Formula 2 (Identities/HSP length (High-scoring segment pairs) were considered in this study as suggested by Auch [4]. Formula 2 is a stronger option to use against the use of incomplete draft genome and therefore the results obtained were independent of genome length. The calculated DDH estimate was regression based. The predicted value closer to 70% is of interest and regression (with a special type of generalized linear model (GLM)) used for reporting the DDH is ≥70%. The DDH estimates produced using the computational method in the current study is both accurate and precise.

3. Results

3.1. Comparative Analysis of Whole Genomes Using Mauve

De novo assembled whole genome sequences were used for the alignment of strains using Mauve. The dendogram was generated using whole genome sequences (Figure 1). Genomes of selected Actinomyces spp. were the most divergent. Based on NJ-tree information (Figure 1), the isolates were divided into two main groups. One group composed of A. oris, with six subgroups/subspecies, and the other consisted of A. naeslundii, with three subgroups/subspecies. The A. oris cluster consisted of genomes of MG1, k20, F4D1, W11-1-1, G53E, OT175, c505, A7A-1, and R23275; WE8B-23 is in an independent cluster; A19A-1, CCUG 34286, and R11372 are included in the A. oris_1 cluster; MMRCO6, F28B1, and M48-1B-1 are in A. oris_2 cluster; P6N, CCUG 33920, and OT171 are considered as a separate cluster; and finally, R21091, S24V, and S64C are clustered as A. oris_3. The other main group consisted of A. naeslundii which have isolates grouped in the true A. naeslundii cluster named S44D, T23P-1, CCUG 35334, NCTC_10301, G127B, S43L, MB-1, R24330, and S65A. The A. naeslundii_1 cluster consisted of isolates named F6E1, MMRC-12-1, CCUG 37599, and Pn6N, while F12B-1, R19039, R8152, R13240, W8-2-3, and WE6B-3 were part of the A. naeslundii_2 cluster. OT170 and A. johnsonii were not associated with either group. Figure 1 revealed consistent results with those obtained using an MLST approach [14,17].

3.2. Comparative Analysis Using Progressive Mauve (ClonalFrame)

ClonalFrame analysis of 22 A. oris isolates revealed six independent groups known as A. oris, A. oris_1, A. oris_2, A. oris_3, and two independent clusters. Similarly, when ClonalFrame analysis was performed on 19 A. naeslundii isolates, three independent groups were observed consisting of A. naeslundii, A. naeslundii_1, and A. naeslundii_2 (Figure 2 and Figure 3). The same results were obtained as those identified using MLST and Mauve analysis.

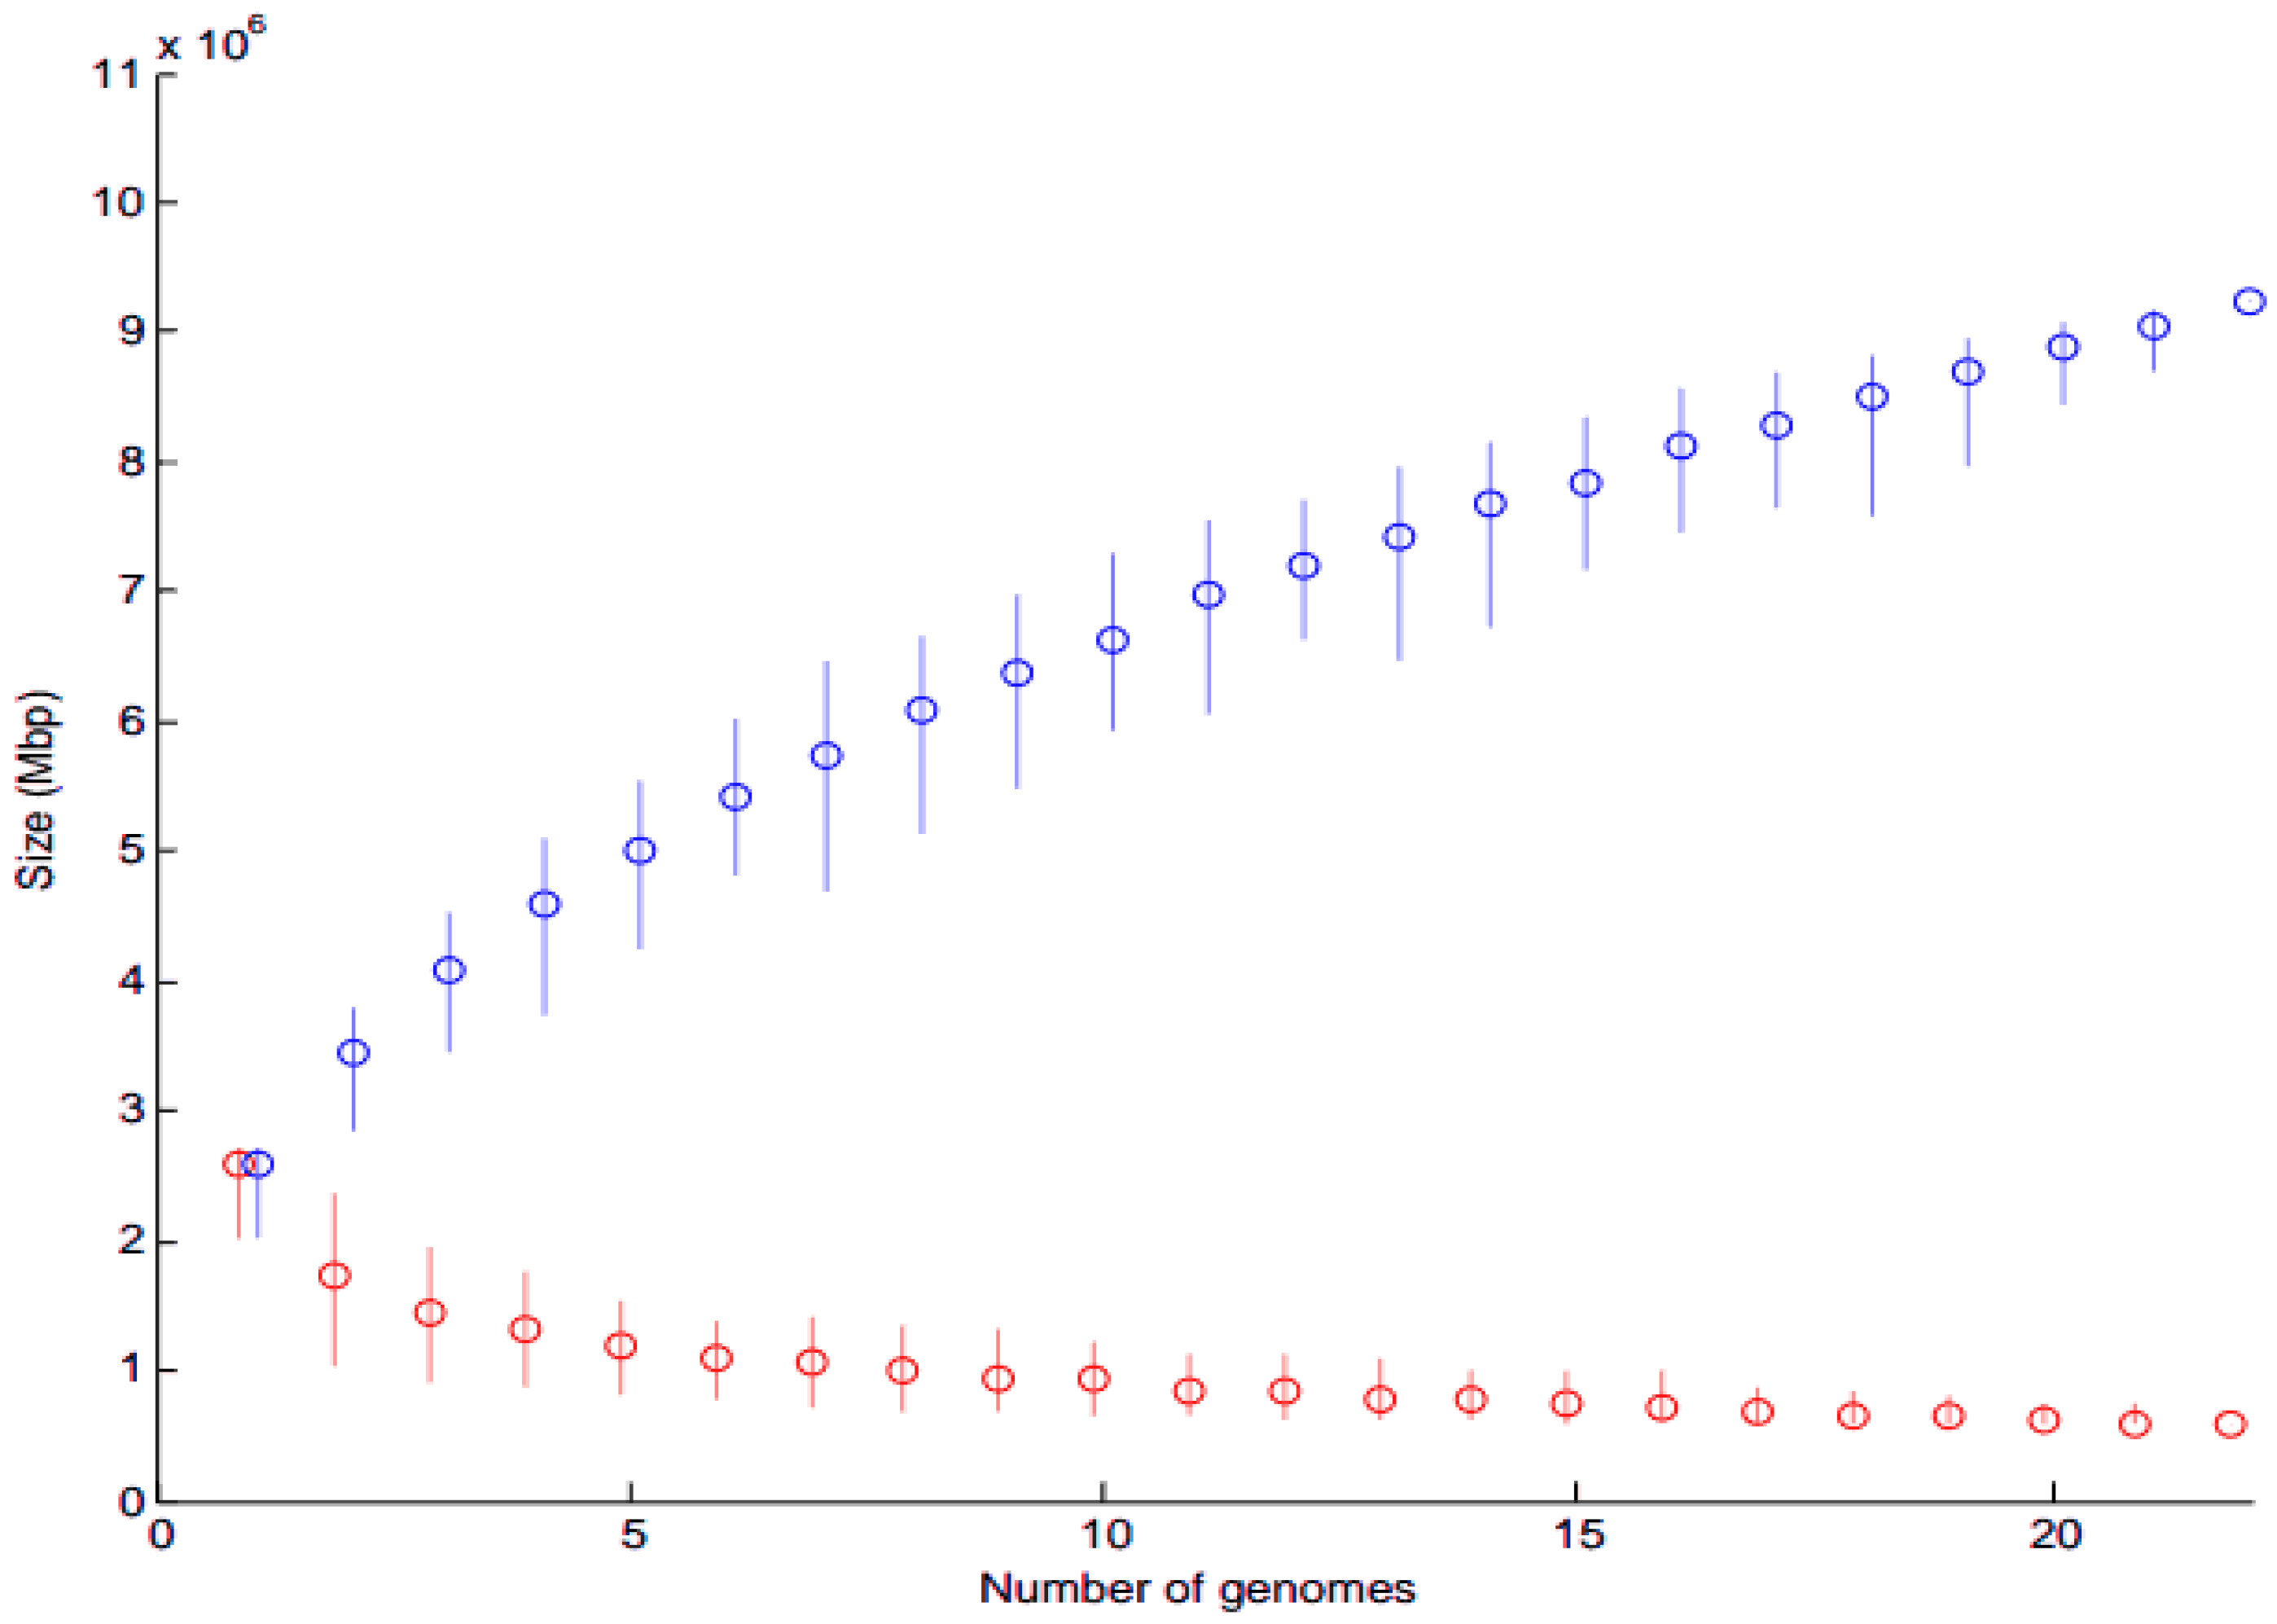
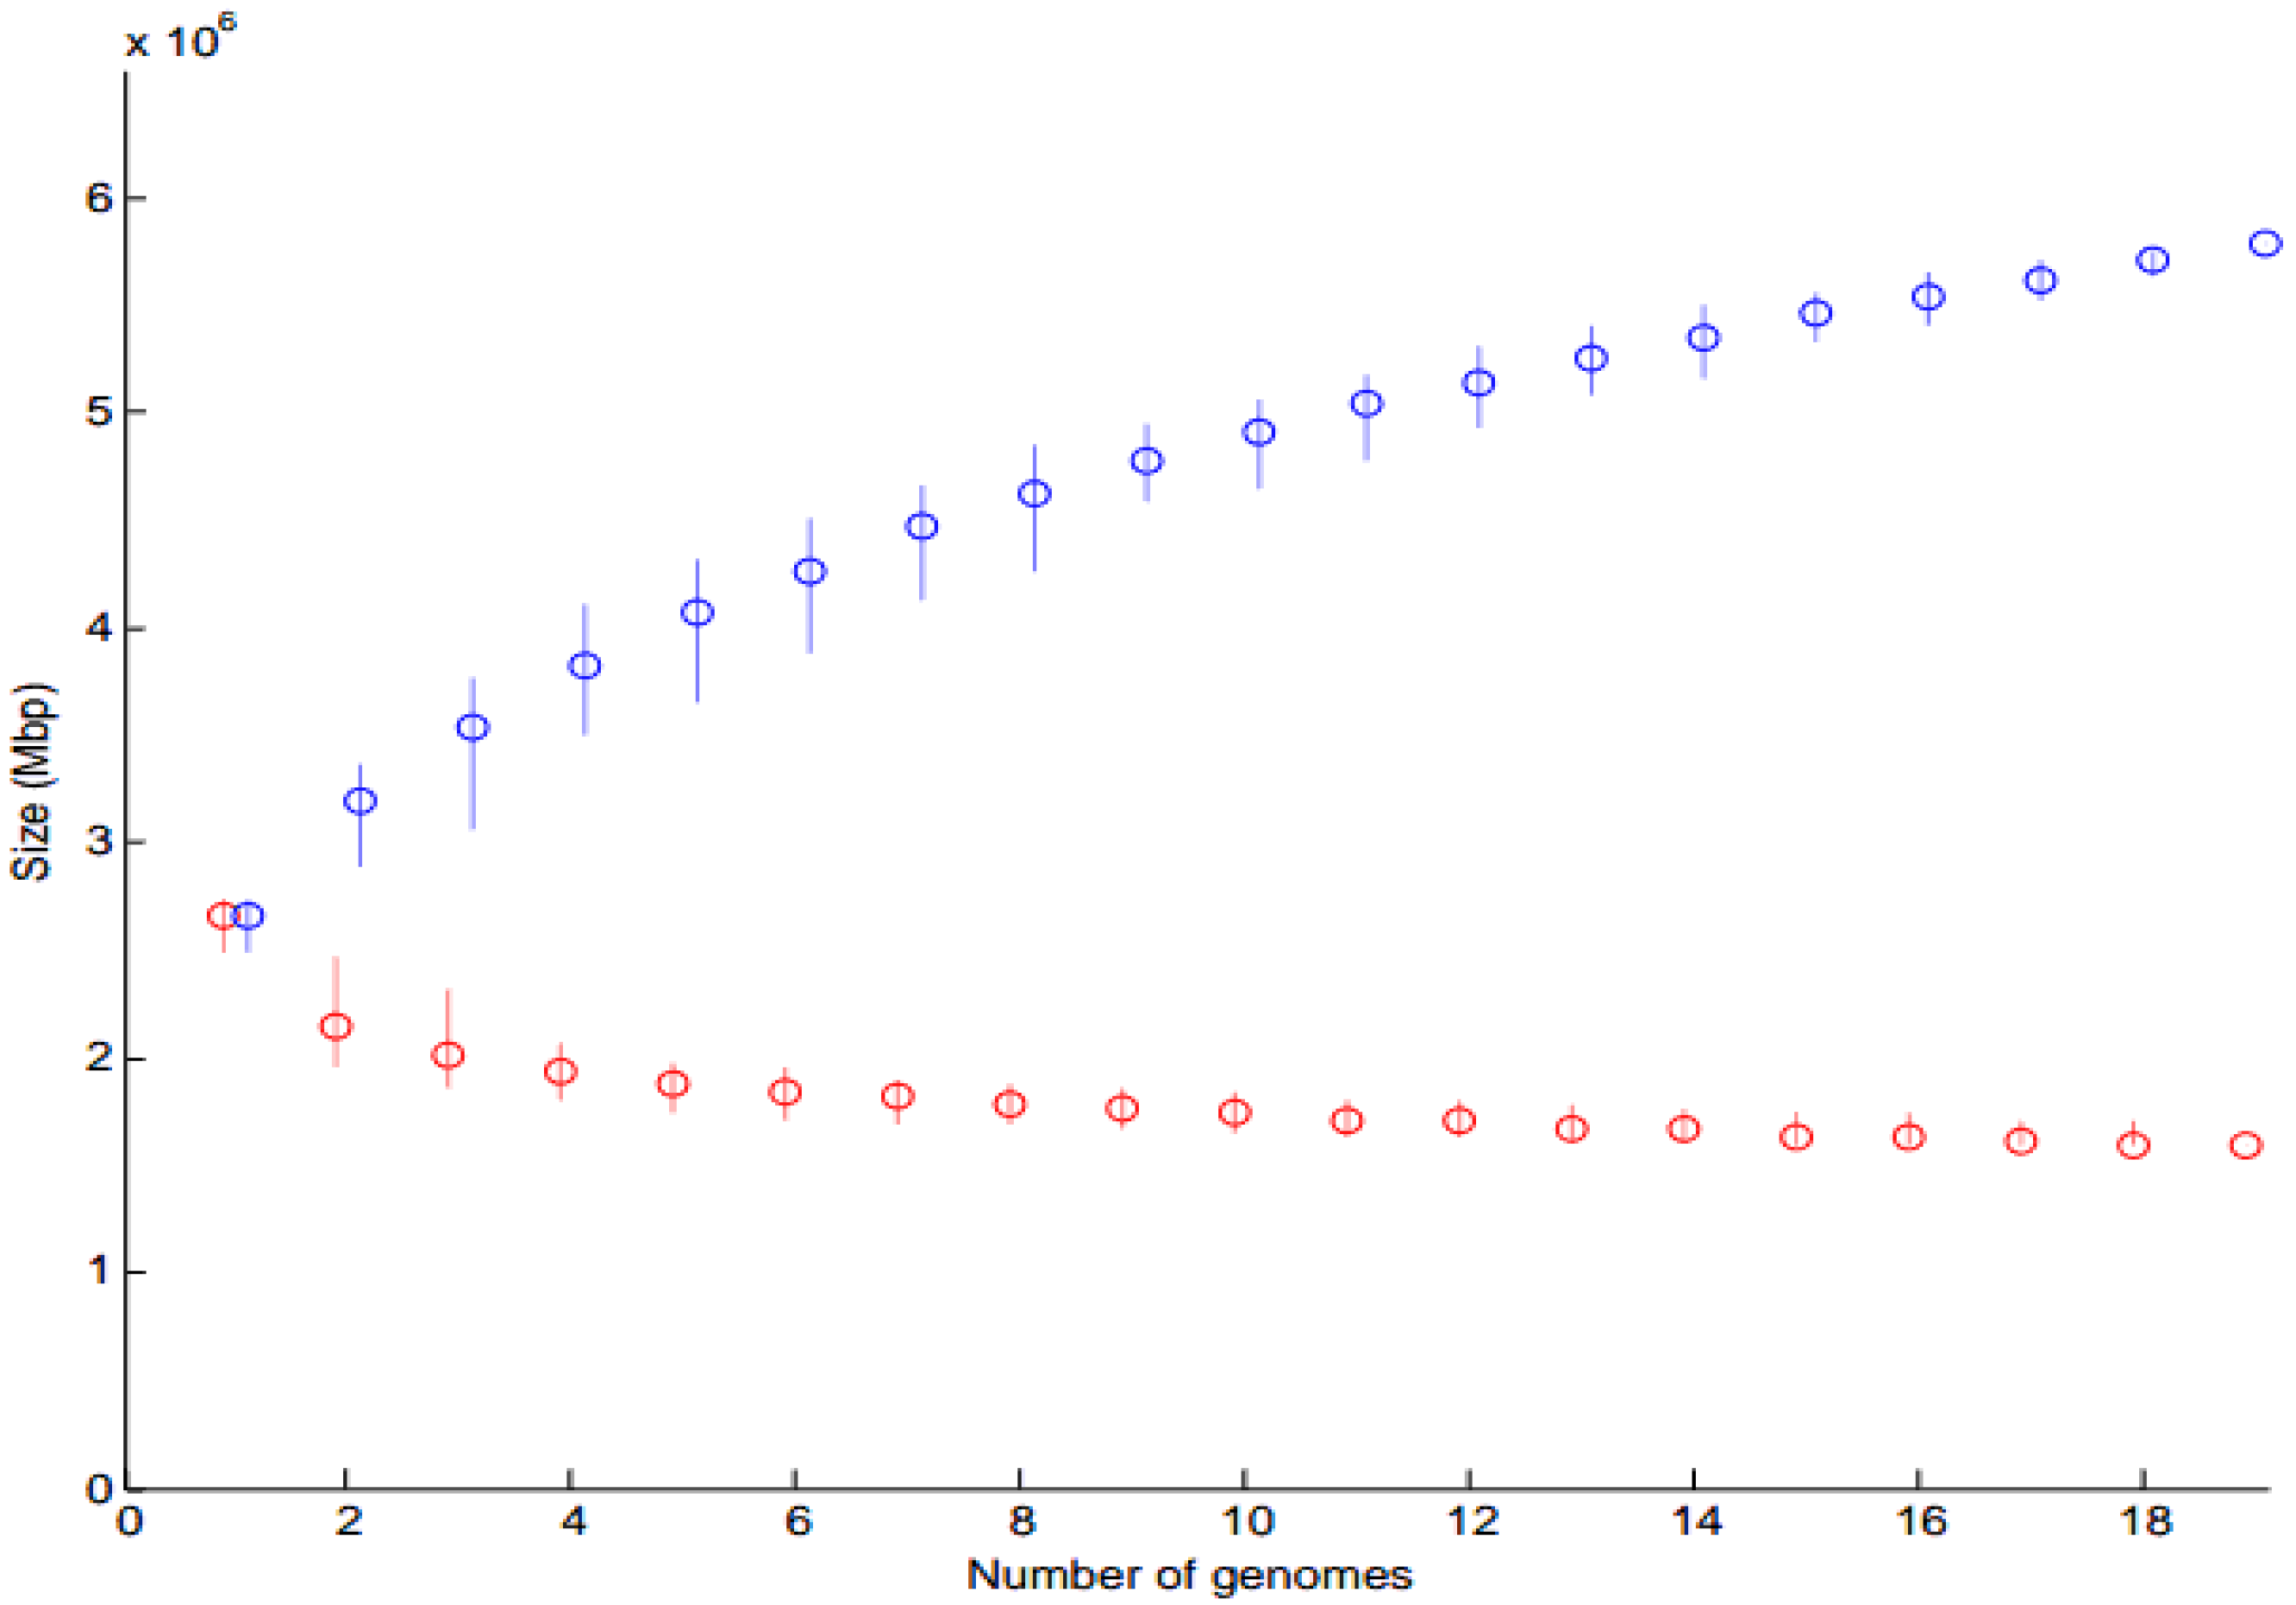
3.2.1. Core and Pan-Genome Analysis

Core genome is indicated in red and pan genome in blue (Figure 4 and Figure 5). The analysis revealed that when more sequenced strains were added in the analysis, the number of core genes decreased. The maximum core genome size calculated was ≤2.7 Mbs and ≤1.5 Mbs for 22 A. oris and 19 A. naeslundii genomes, respectively. Similarly, the pan-genome size calculated was ≥9.3 Mbs and ≥5.7 Mbs for 22 A. oris and 19 A. naeslundii genomes, respectively. The core genome size of A. oris is smaller as compared to the core genome size of A. naeslundii, while the pan-genome size of A. oris is higher as compared to the pan-genome size of A. naeslundii. As more and more genomes (x-axis) were considered (Figure 4 and Figure 5), the sum of the length of regions found in all of them (i.e., core in red) decreases, whereas the sum of the length of regions found in at least one genome (i.e., the pan in blue) increases. This happened faster for A. oris than for A. naeslundii, presumably because the genomes in A. oris are more closely related to each another than the genomes in A. naeslundii. This demonstrates the greater diversity of A. oris as compared to A. naeslundii (Figure 4 and Figure 5).
Figure 4. Core and pan-genome model of 22 A. oris strains.
Microorganisms 11 00254 g004
* Core and pan-genome size is plotted as a function of a number (n) of genomes added. Circles are the average of such values. A red circle represents core genomes while a blue circle represents pan genomes of Actinomyces.
Figure 5. Core and pan-genome model of 19 A. naeslundii strains.
Microorganisms 11 00254 g005
* Core and pan-genome size is plotted as a function of a number (n) of genomes added. Circles are the average of such values. A red circle represents core genomes while a blue circle represents pan genomes of Actinomyces.

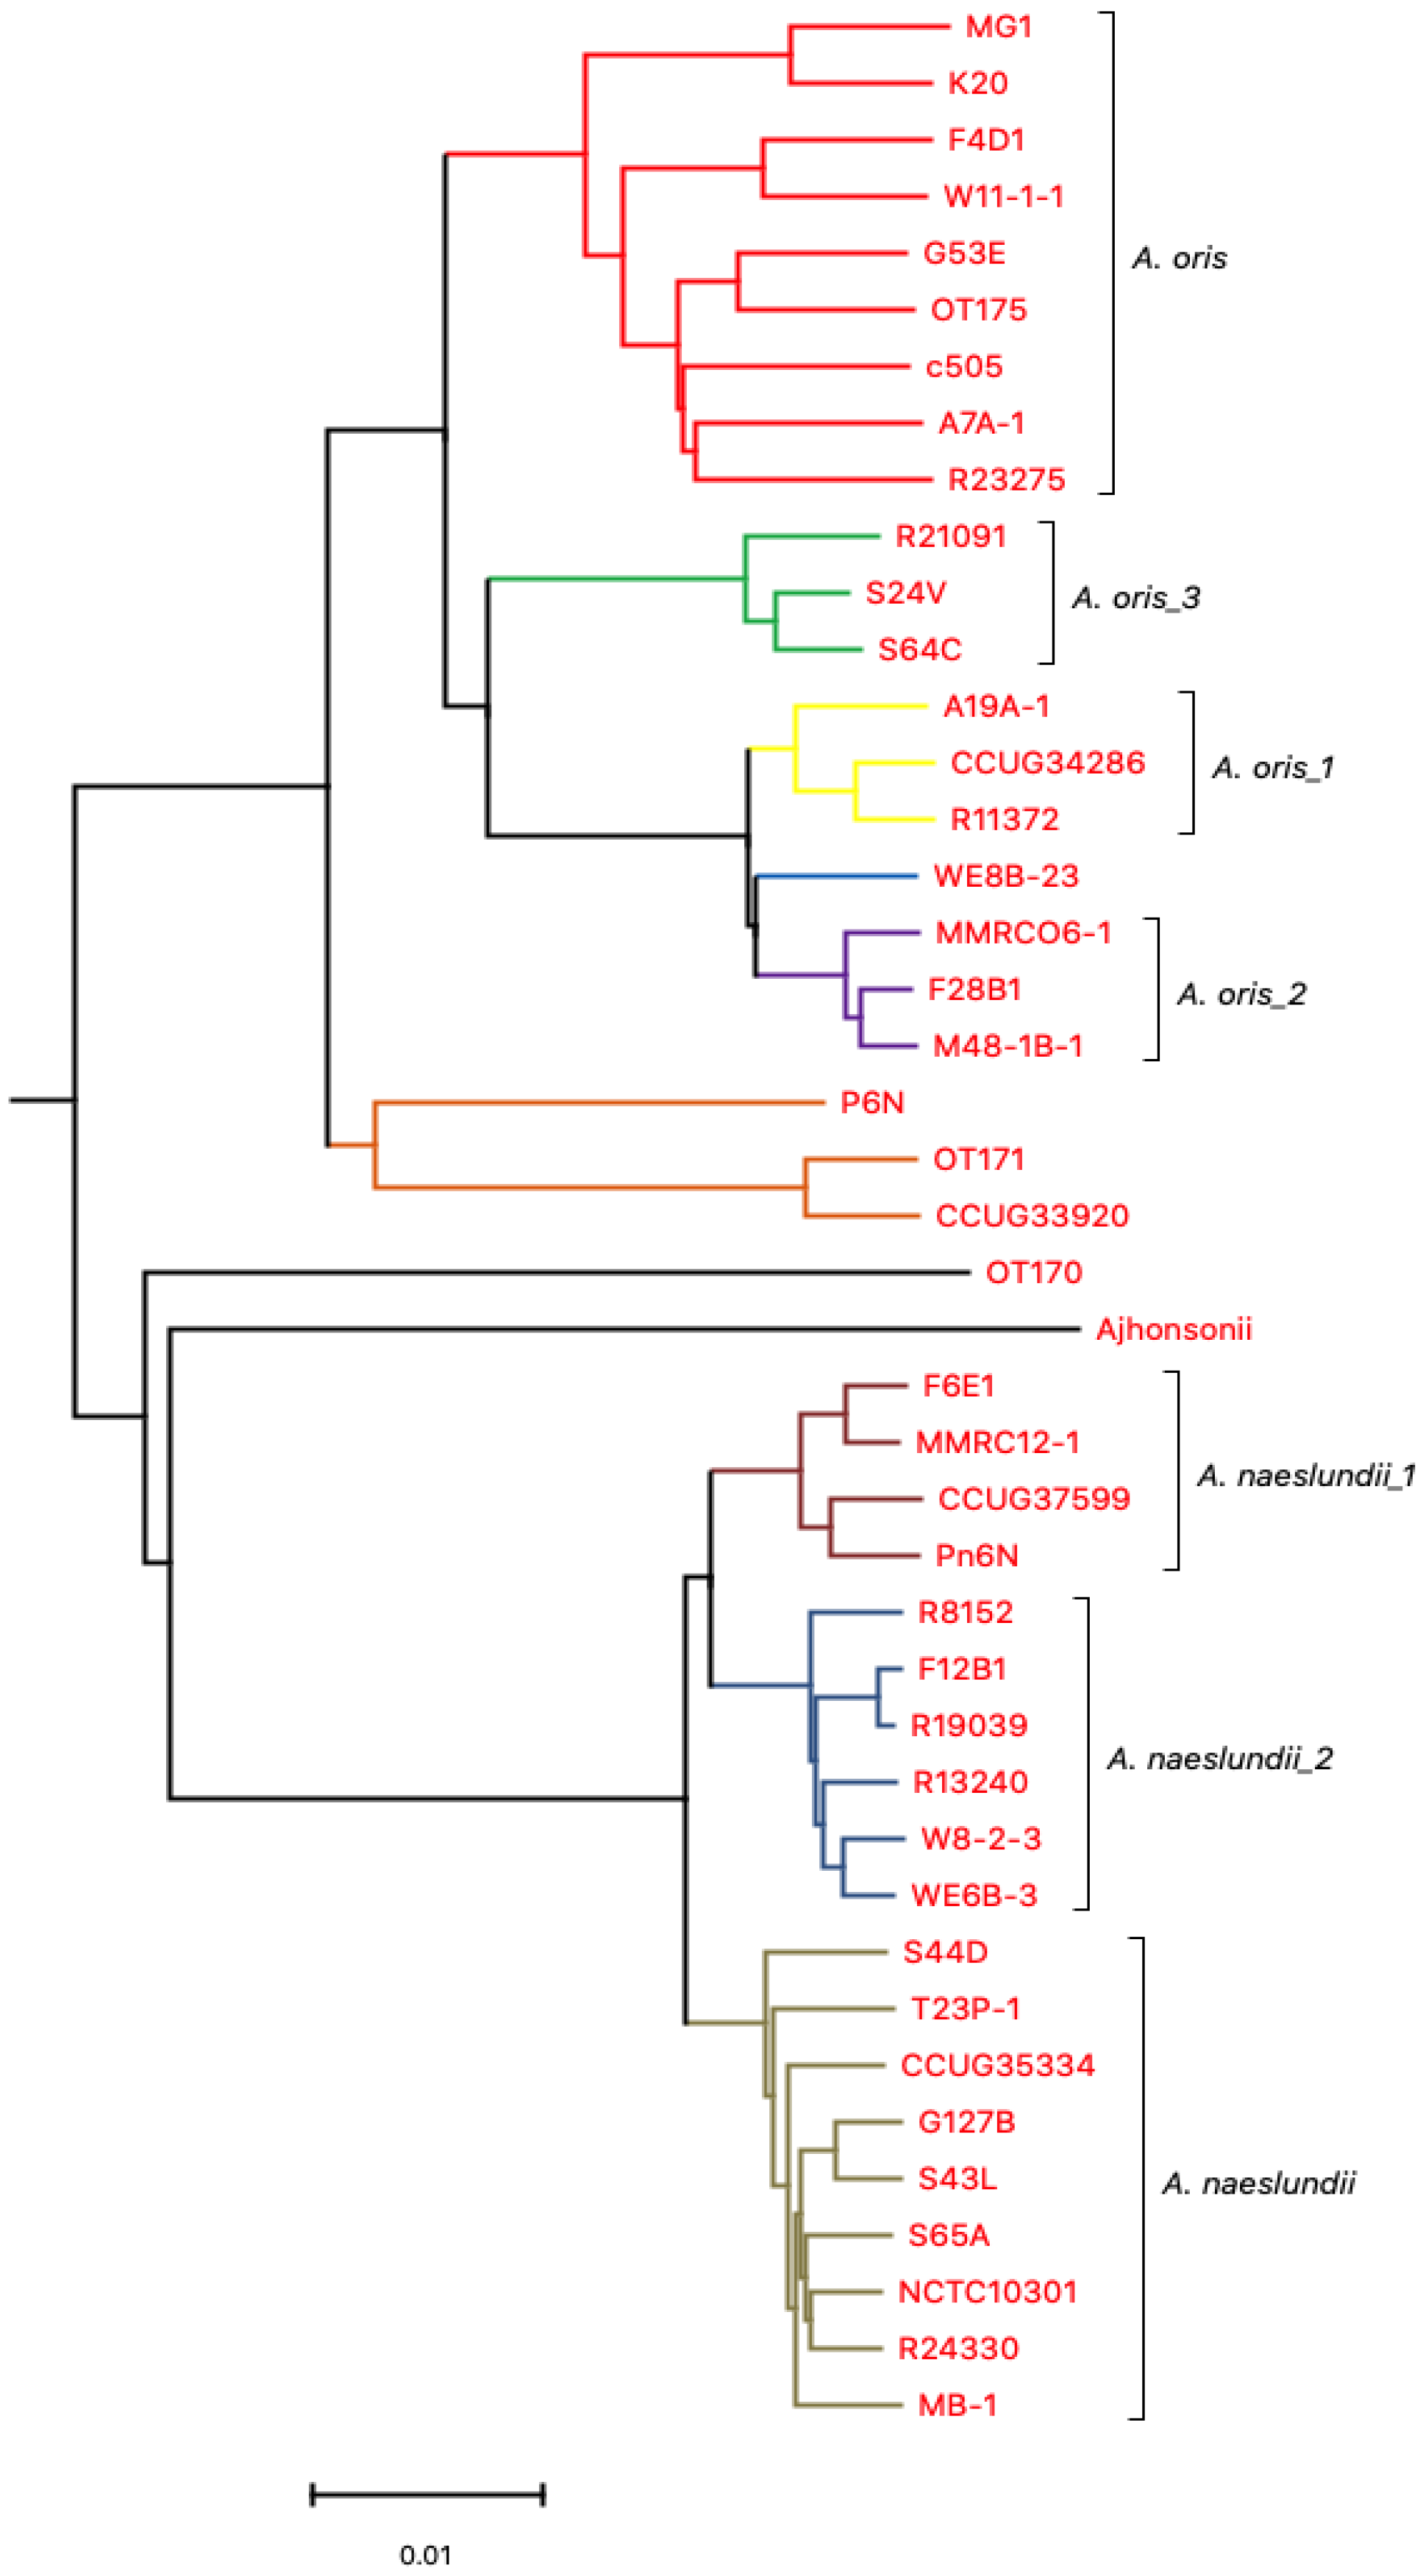
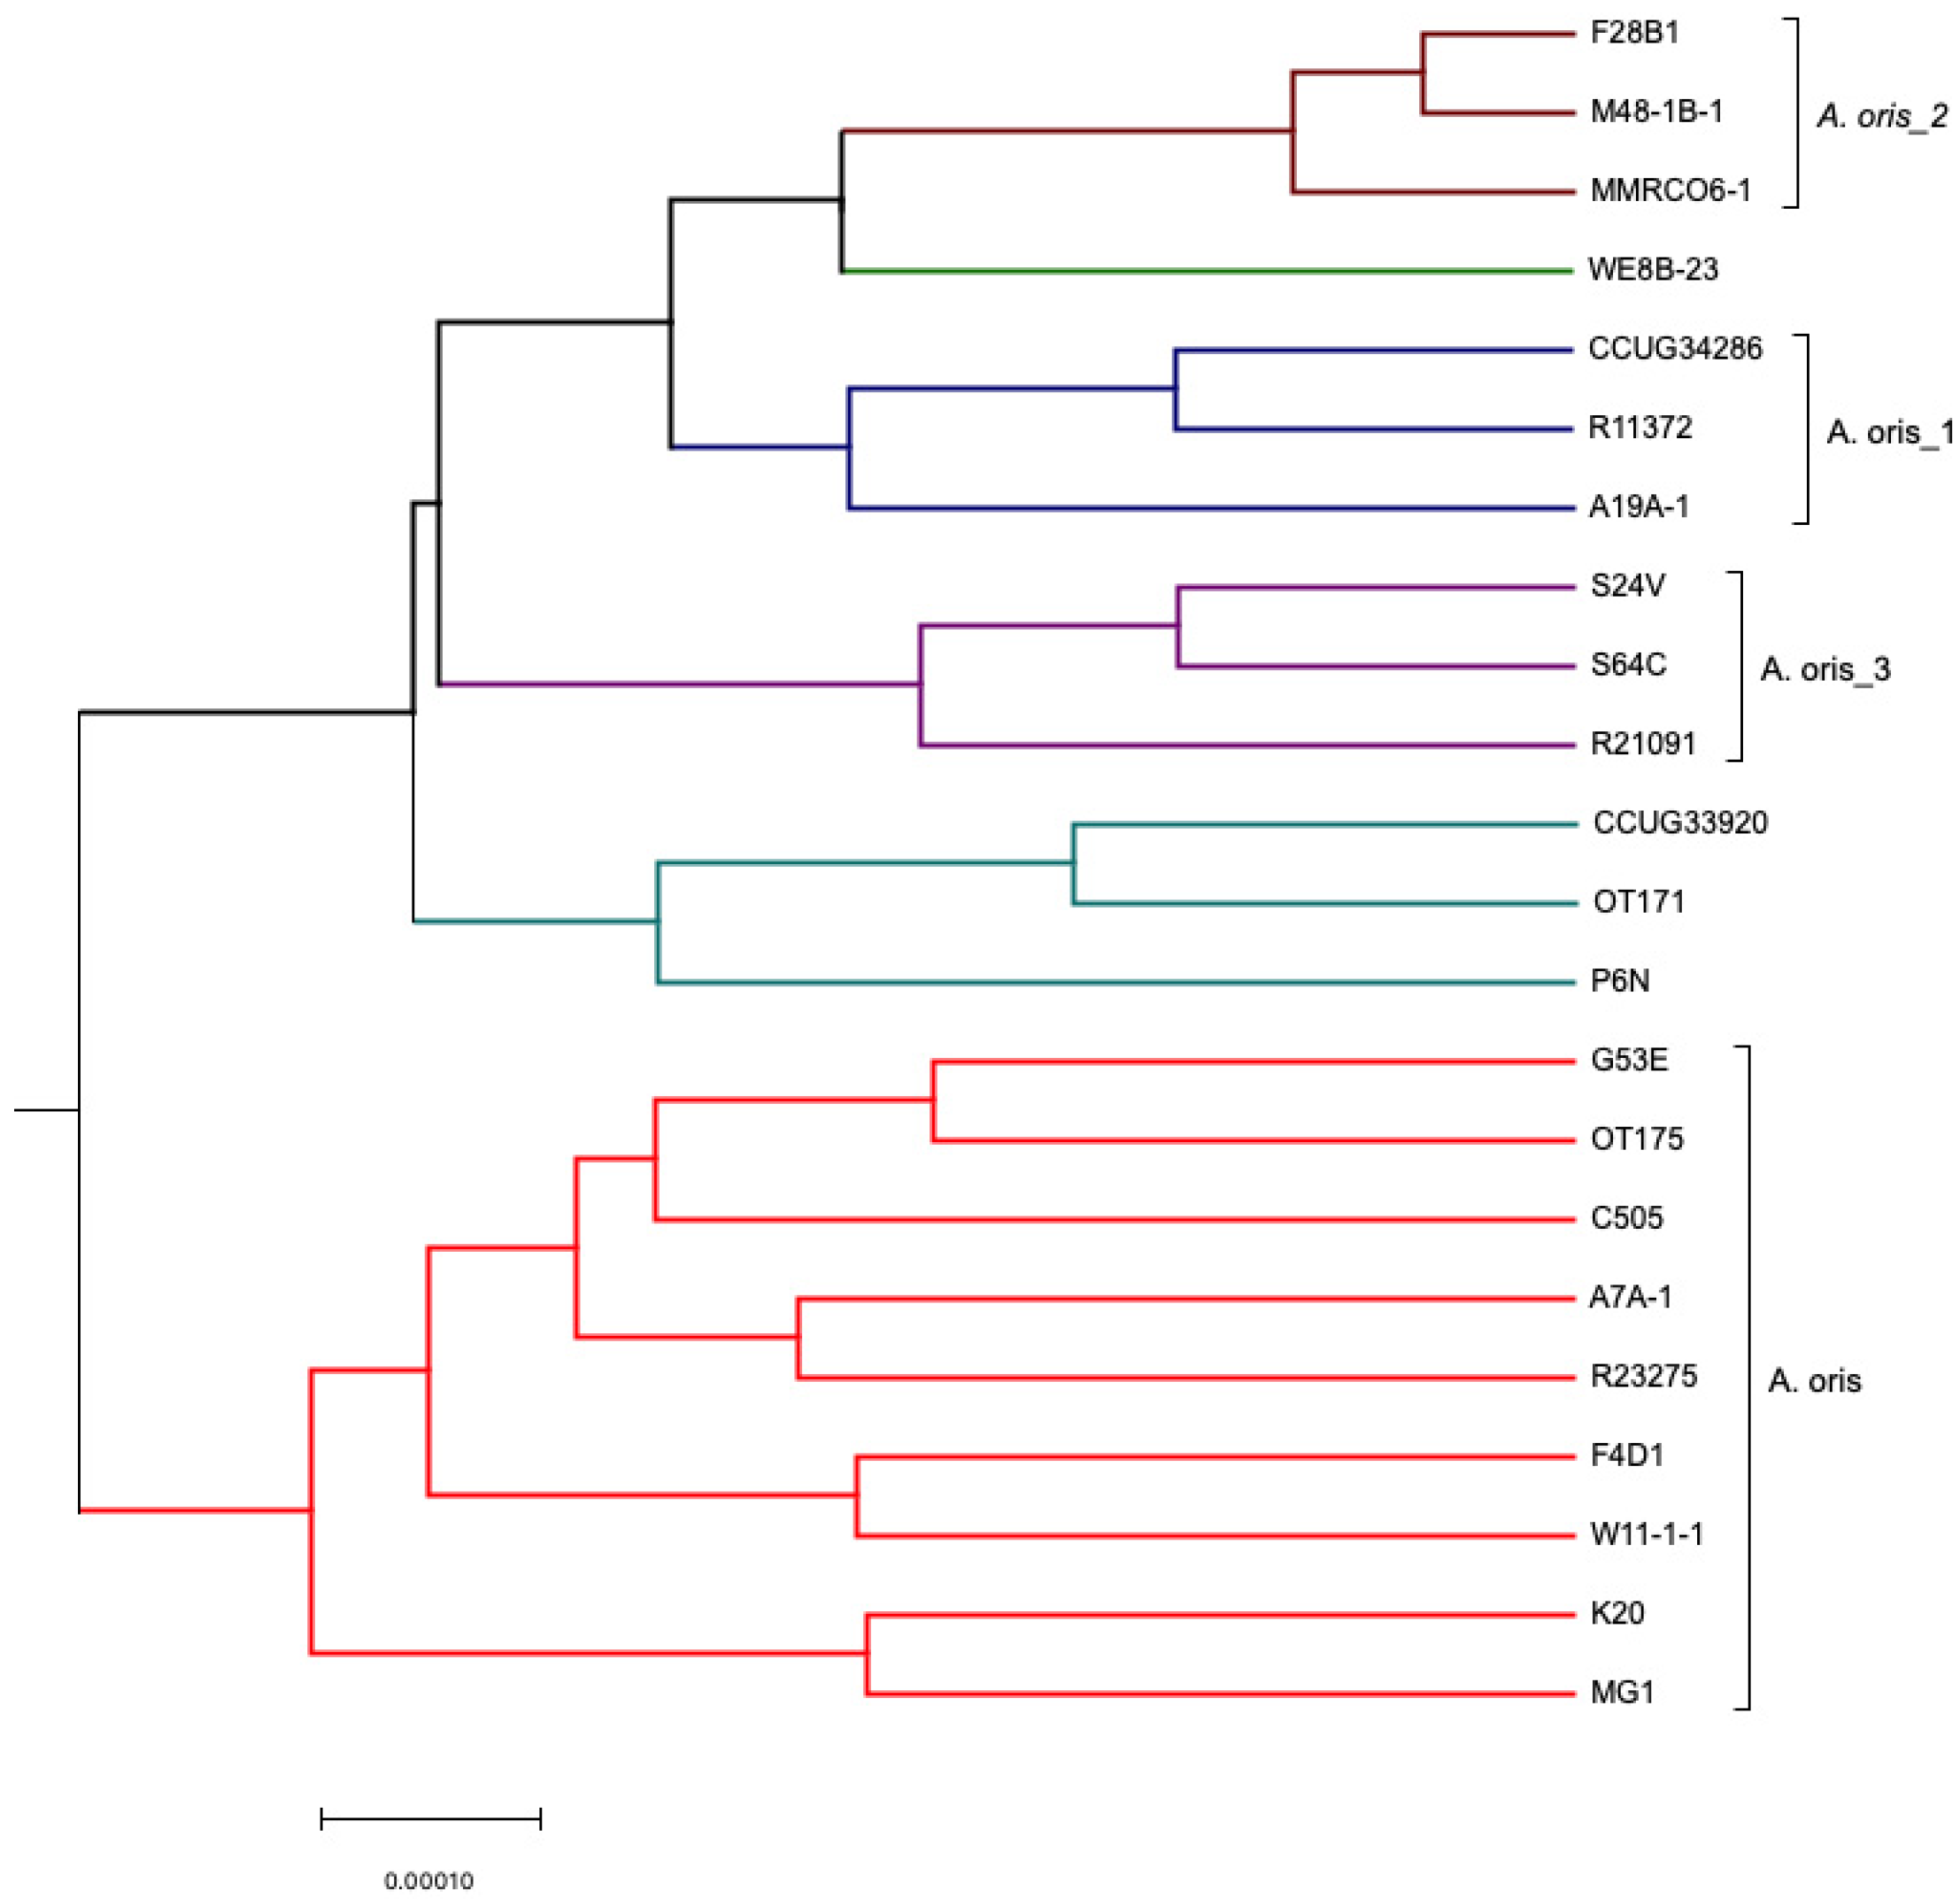
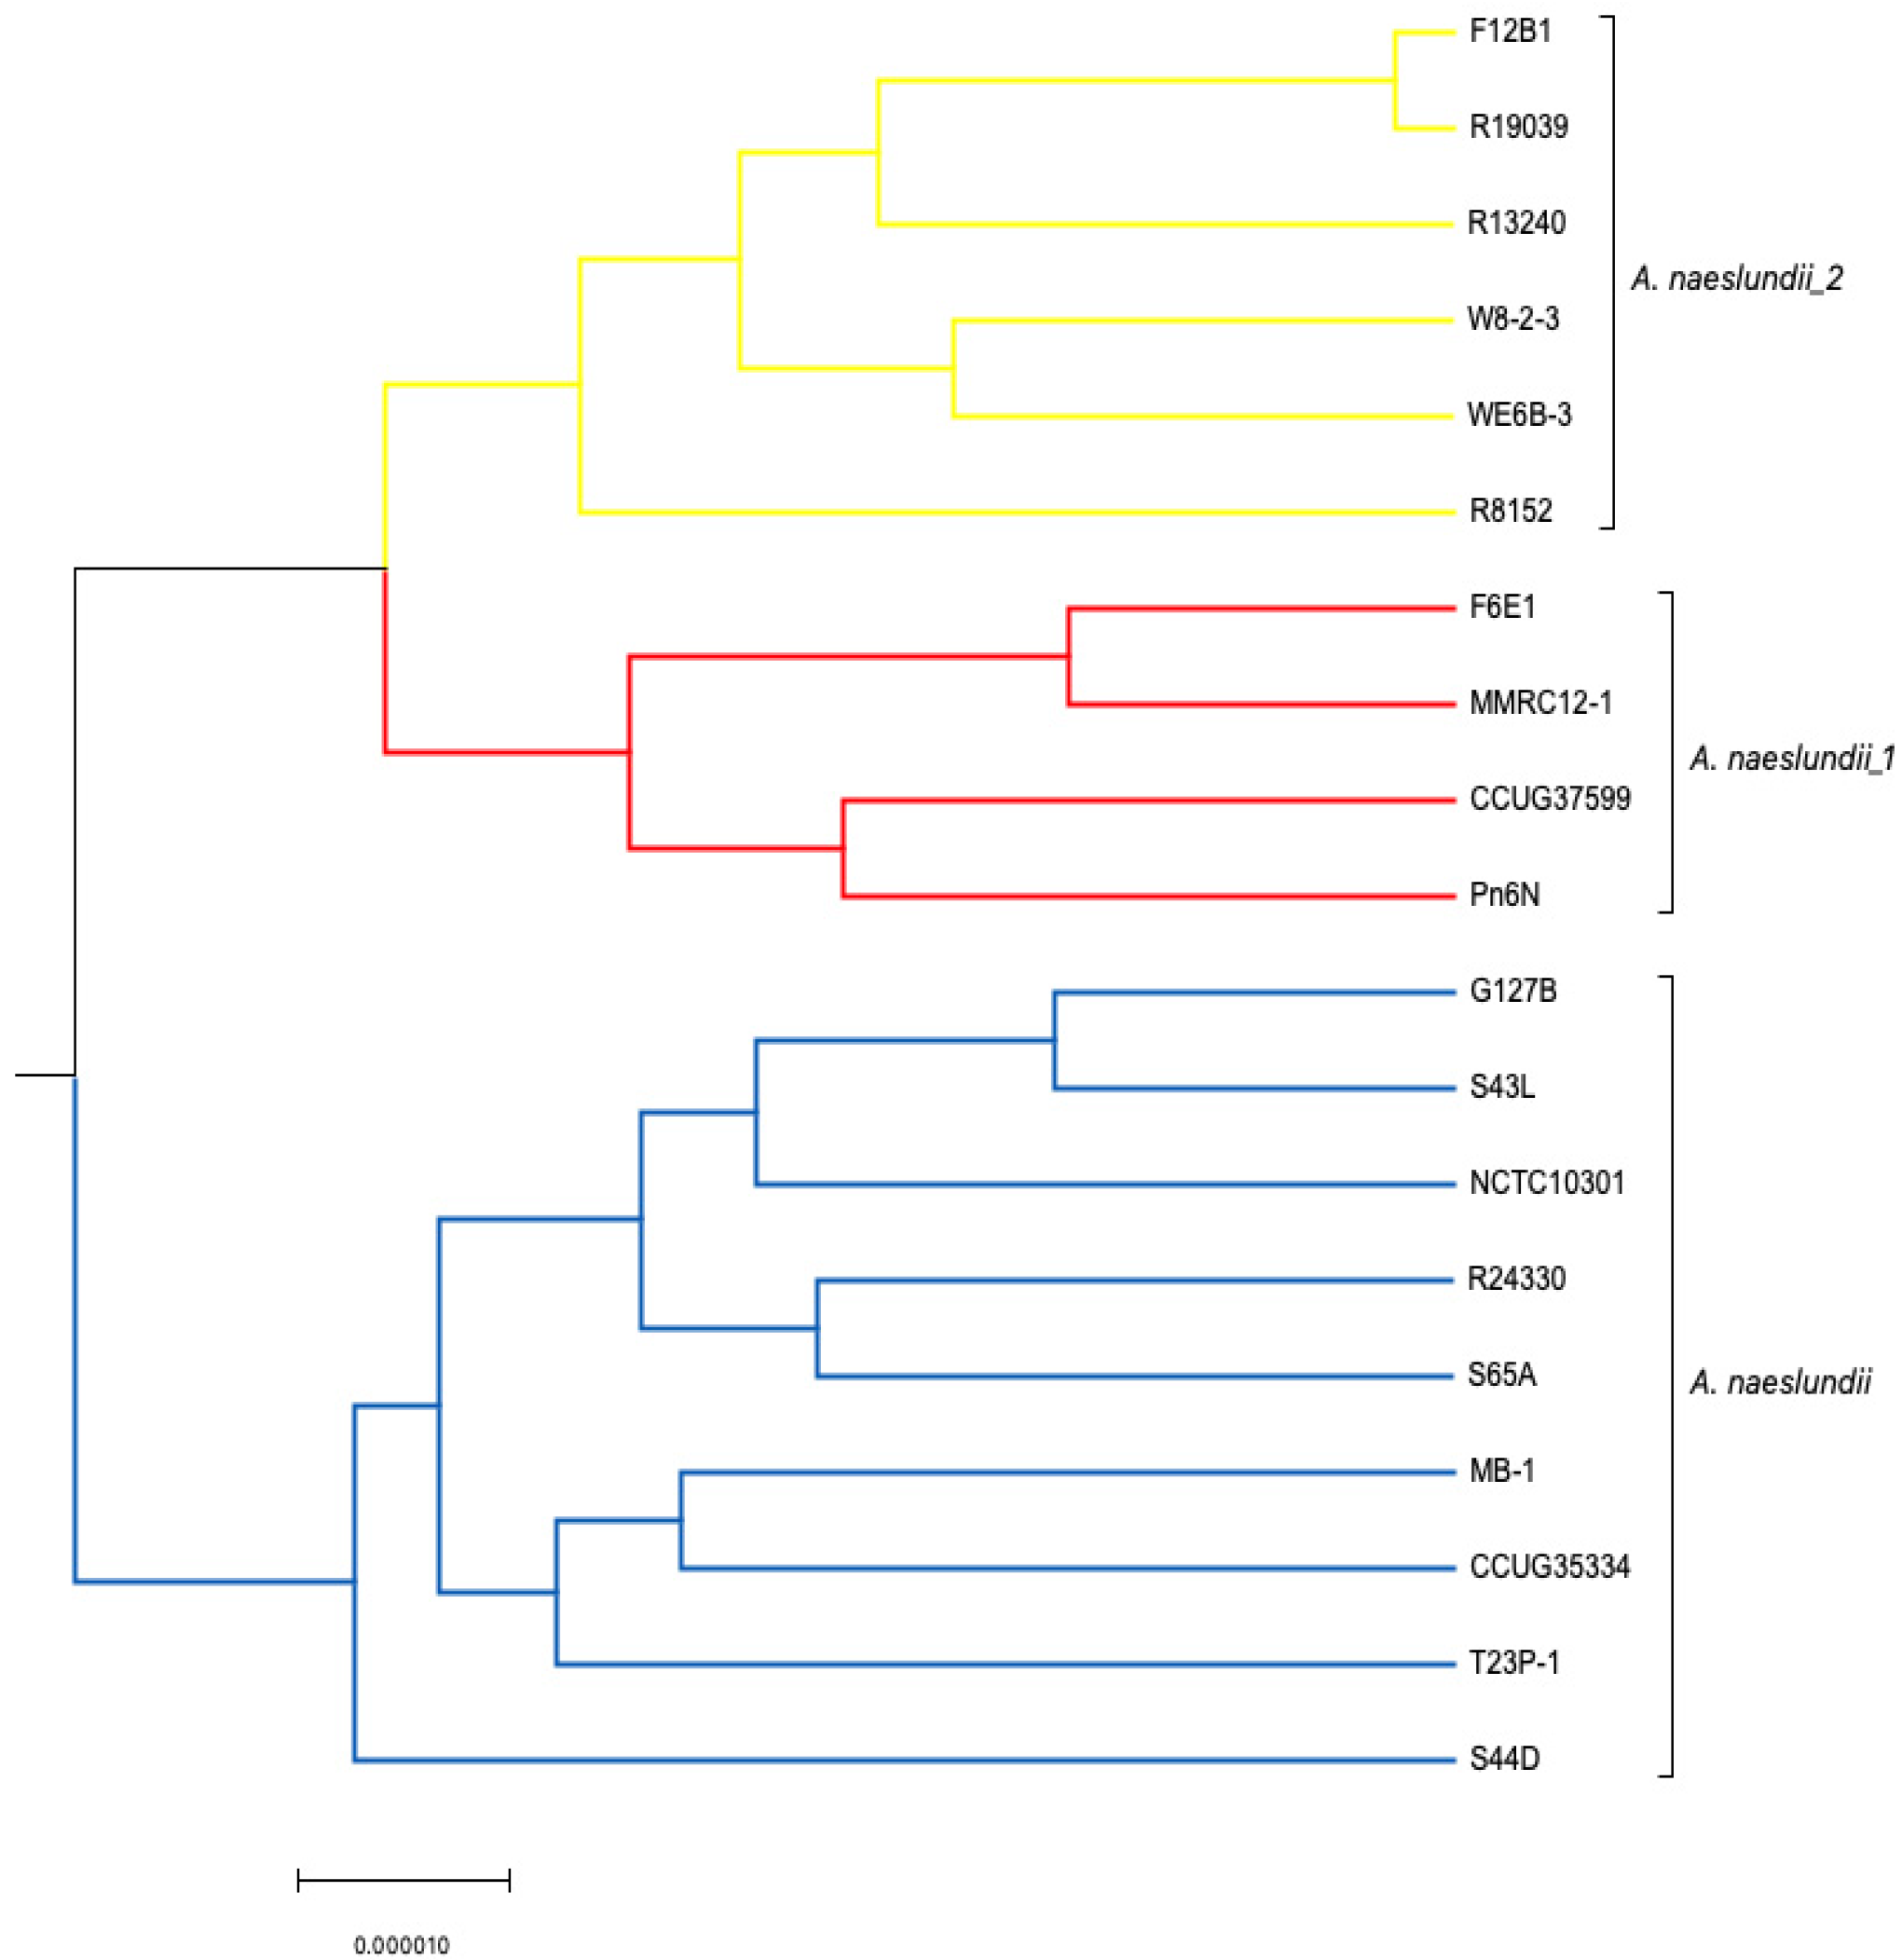
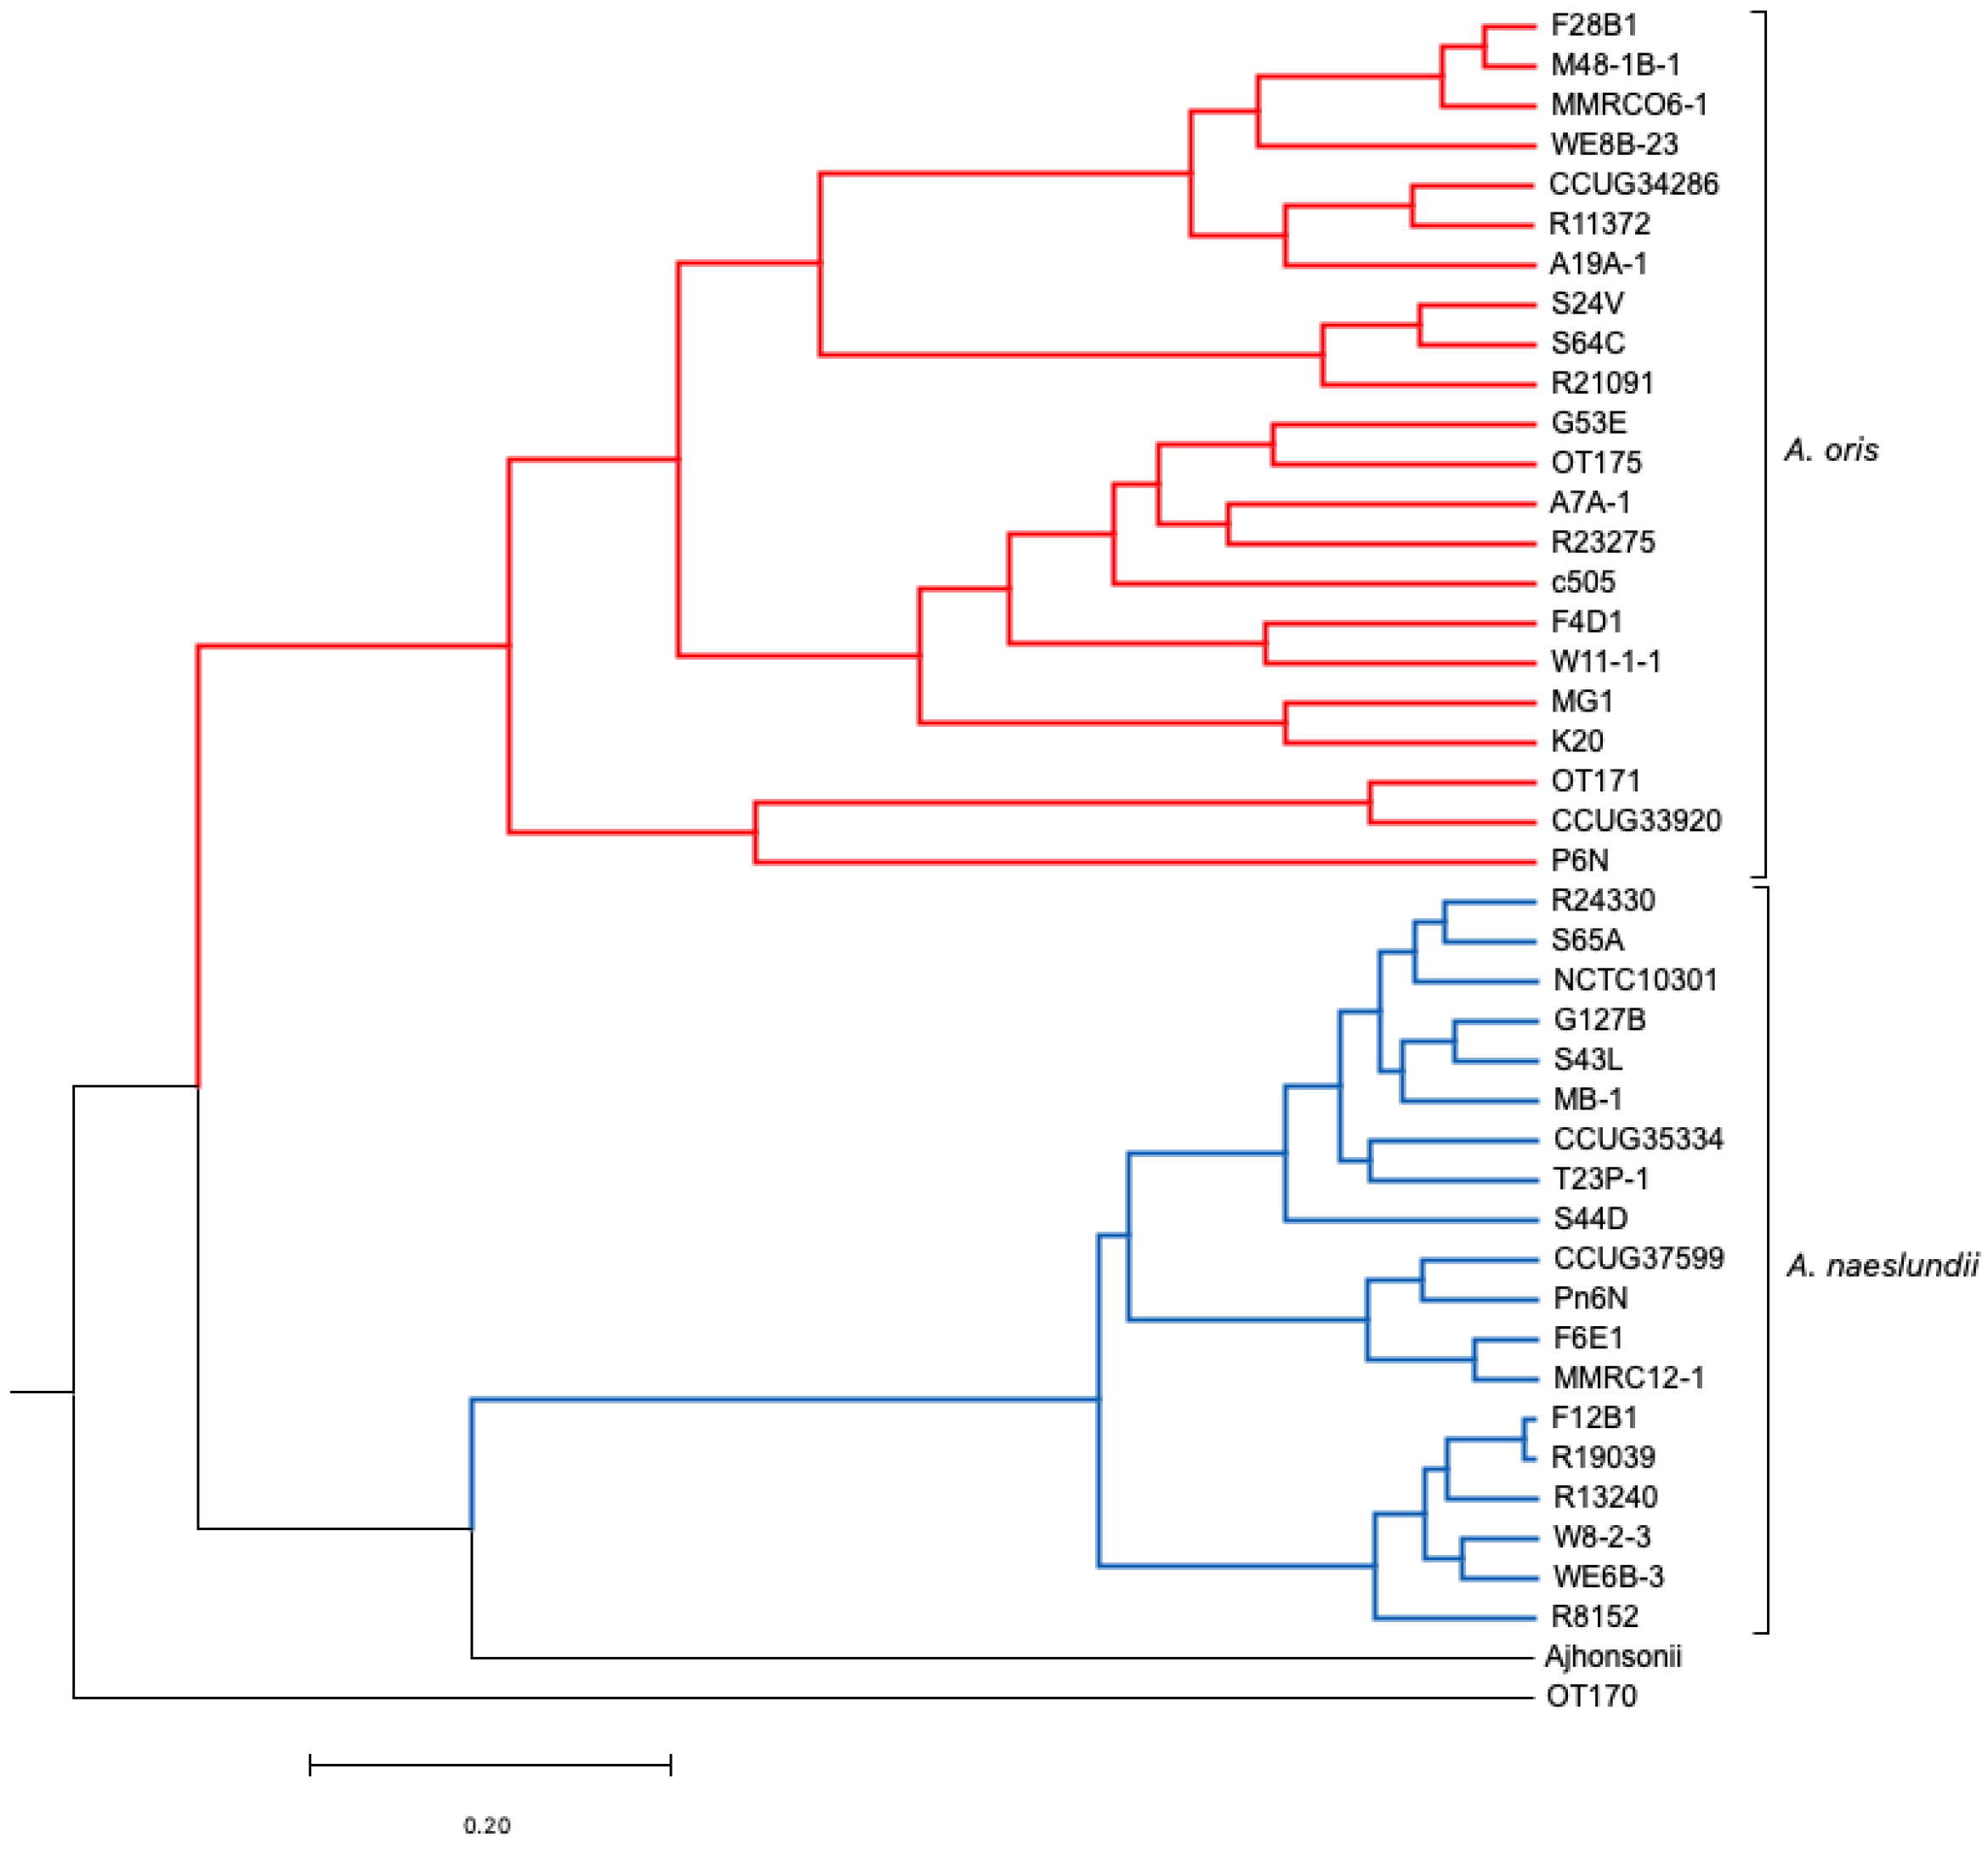
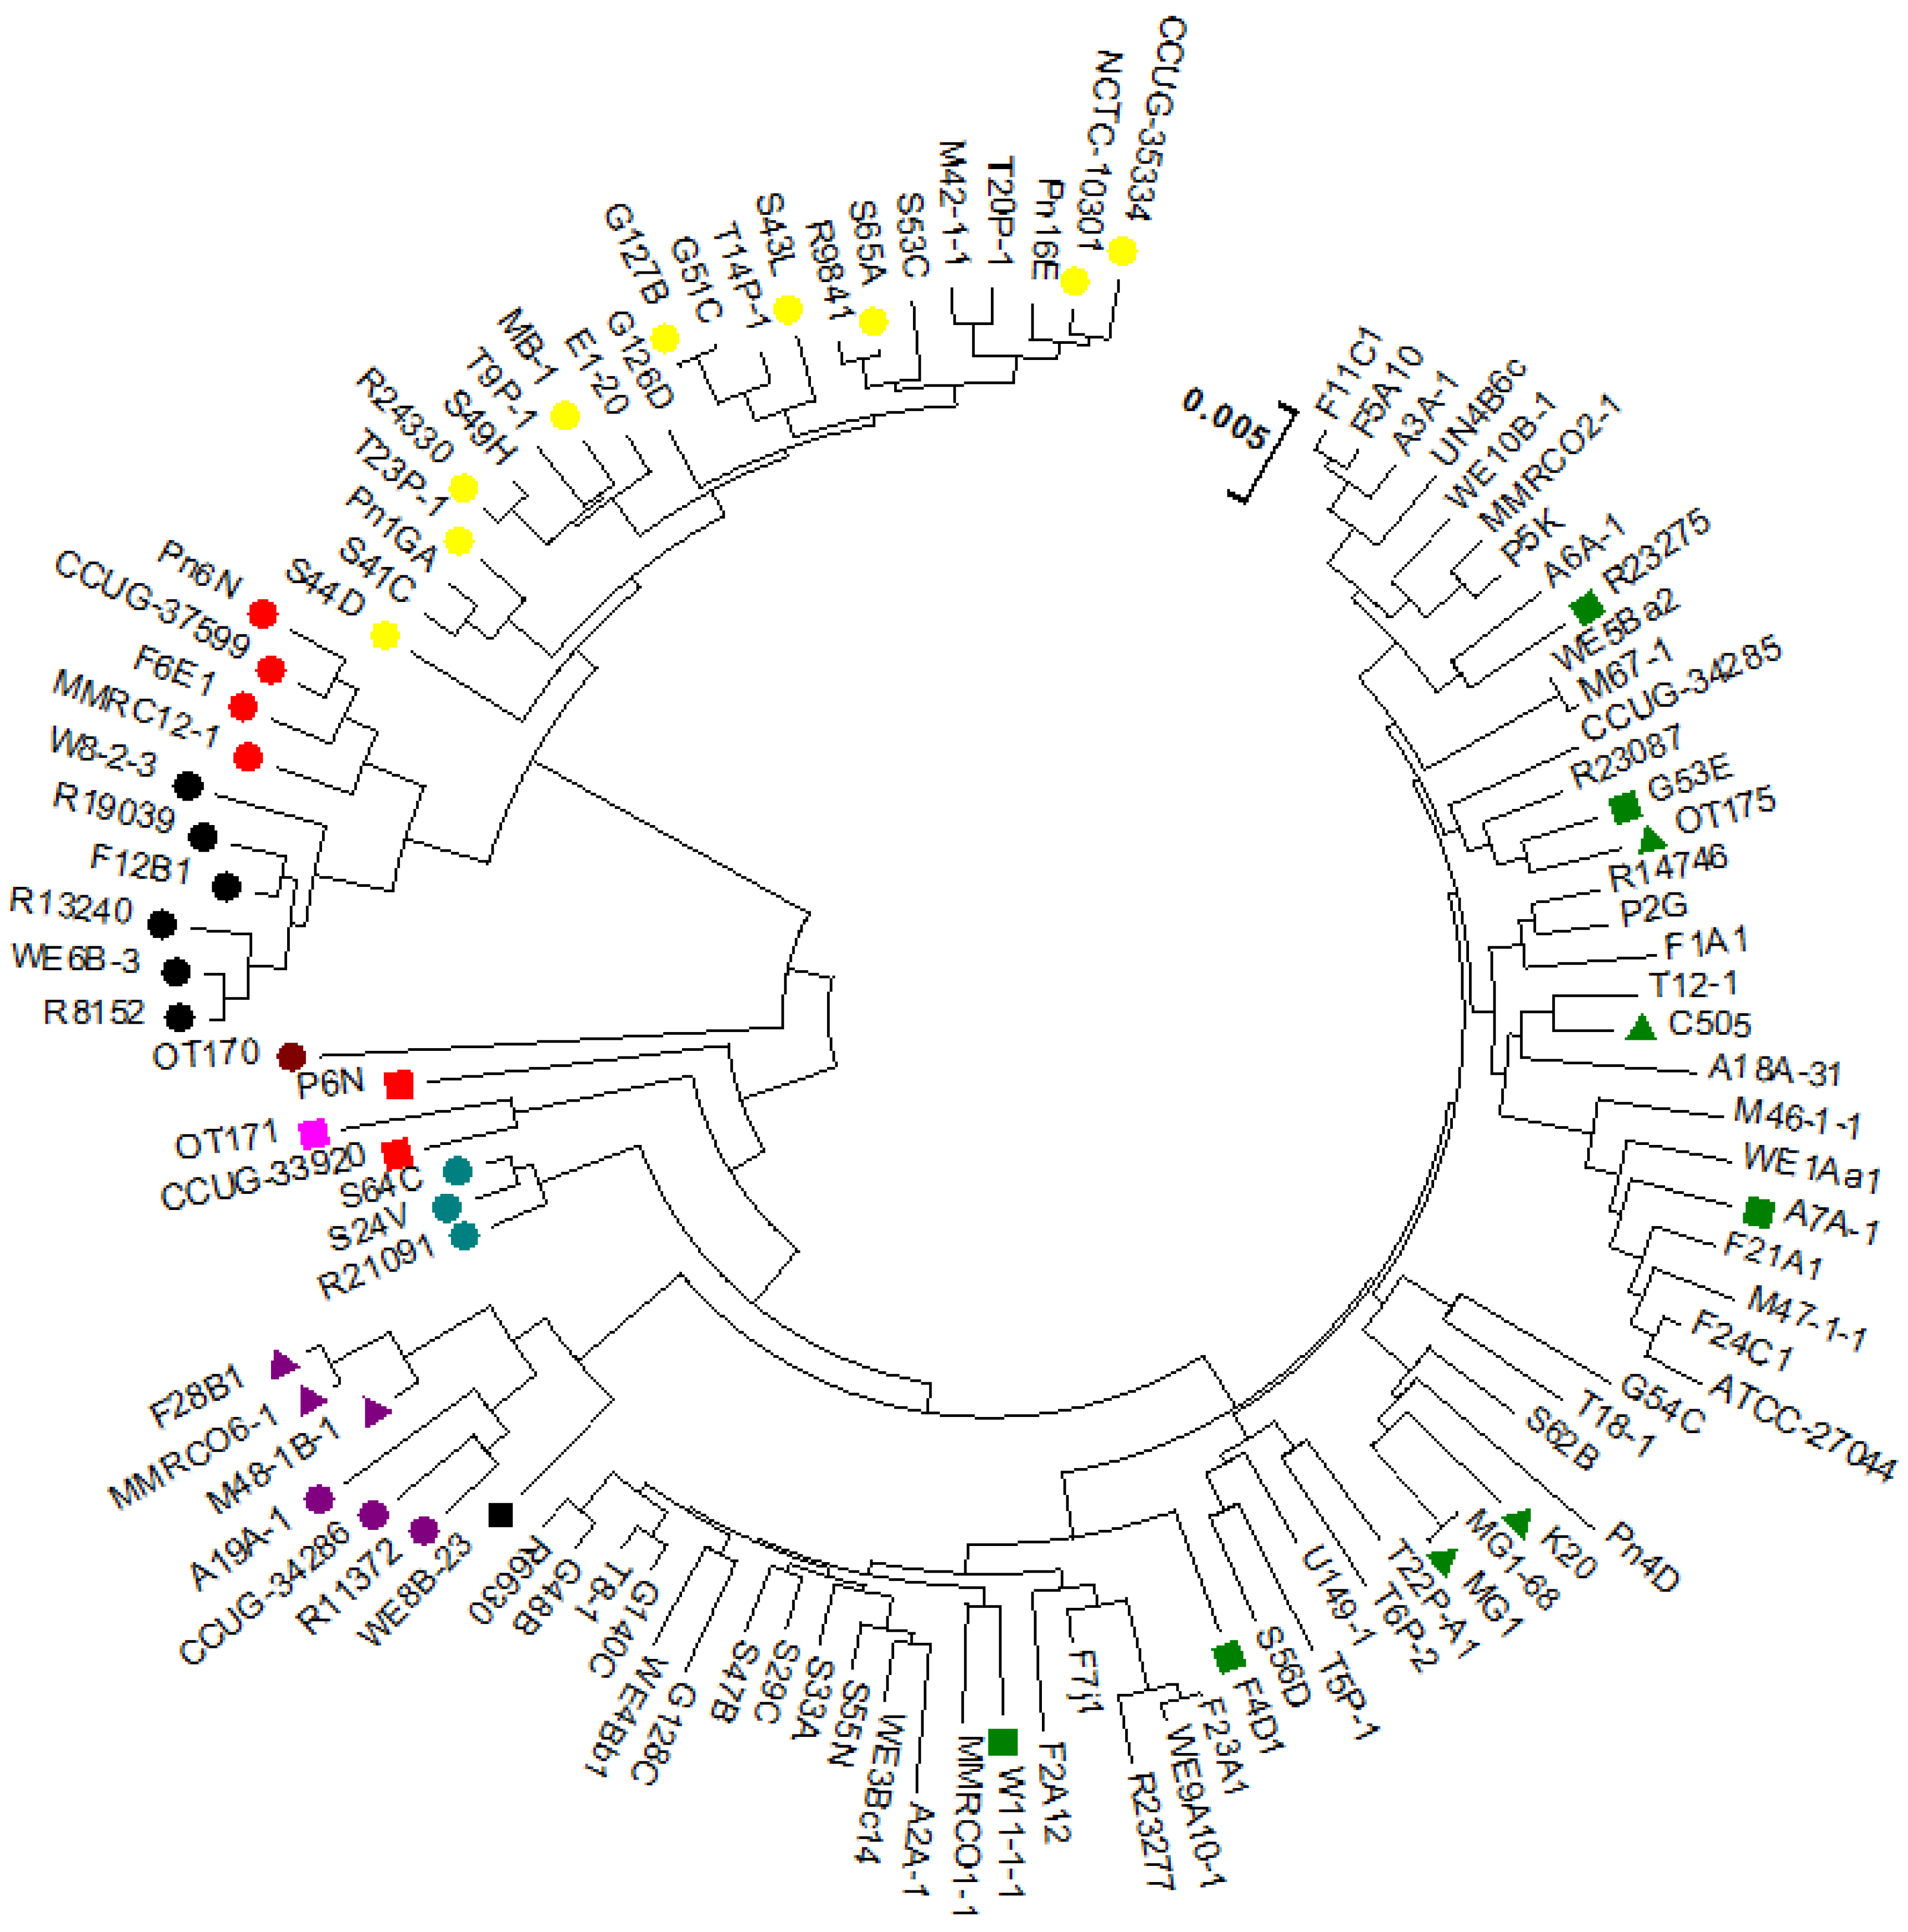
3.2.2. Core Genome Analysis (Evolutionary Analysis)

There were 476 single-copy genes universally present in all 22 A. oris and 19 A. naeslundii genomes. The phylogeny of the concatenated sequences of 476 genes was constructed using the ClonalFrame analysis programme (version 1.1) (Figure 6). The CF analysis displayed separate clusters of A. oris and A. naeslundii. The annotated tree is shown in Figure 6. Most isolates of A. oris derived from a single clonal lineage. Only two strains P6N and CCUG 33920 formed a distinct cluster but were close to A. oris and therefore assigned to the A. oris group and is proposed to share either an ancient common ancestor or formed a distinct lineage. The genealogy of two species was observed and analysis showed few differences. In the genealogy of A. oris, two strains named CCUG 33920 and OT171 share a common ancestor with P6N and formed a distinct cluster in A. oris group. The same is observed for k20 and MG1 which originate from a single branch and share a mutual ancestor with other isolates of this group, named W11-1-1, F4D1, c505, R23275, A7A-1, OT175, and G53E. Another distinct lineage was found in the A. oris group having only three isolates named S24V, S64C, and R21091. Strains A19A-1, R11372, CCUG 34286, MMRCO6-1, M48-1B-1, and F28B1 were found to originate from a single branch of a clade in the A. oris group and formed two distinct cluster in the A. oris clade. All 19 strains of A. naeslundii developed from a clonal lineage. The clonal genealogy was investigated for A. naeslundii isolates and they formed a compact cluster with less diversity as compared to the A. oris clade. All 19 isolates of A. naeslundii were found to divide into three subgroups under the A. naeslundii clade. The isolates which grouped in the main A. naeslundii cluster were R24330, S65A, NCTC 10301, G127B, S43L, MB-1, CCUG 35334, T23P-1, and S44D. However, CCUG 37599, Pn6N, F6E1, and MMRC12-1 formed a distinct branch along with another branch having six isolates named F12B1, R19039, R13240, W8-2-3, WE6B-3, and R8152. Therefore, the clonal branch pattern showed that A. oris isolates were divided into six groups and A. naeslundii into three groups. A. johnsonii and OT171 were assigned separate positions to A. oris and A. naeslundii due to their distinct origin in the dendrogram as seen in Figure 6. The findings from this analysis were similar to the one obtained with MLST, Mauve and PM. The mutation and recombination events were compared using chi-square test among A. oris and A. naeslundii isolates and revealed that A. oris mutation and recombination event were significantly higher to A. naeslundii showing the diversity of A. oris strains in oral cavity (detail of analysis is not shown here).
* Displayed in MEGA 3.1. The numbers are the bootstrap values.

3.3. Digital DNA–DNA Hybridization

The DDH values were measured between the six A. oris and three A. naeslundii bacterial groups and are presented in Summary Table 1. The homology values were 100% for the A. oris strains when compared among themselves, e.g., A7A versus A7A, F4D1 versus F4D1, G53E versus G53E, and R23275 versus R23275. However, when tested with each other, homology values of 53.3–75.5% were observed for the A. oris strains, e.g., A7A versus F4D1 had 60.1 % homology. The DNA–DNA relatedness values of A. oris strains were also compared with MG1 which showed on average 56% DNA homology.
Similarly, when all members of the A. oris (AO) cluster were compared with members of clusters AO_1 to AO_3 and three independent clusters (WE8B-23, P6N, and CCUG 33920), the average homology values observed for AO versus WE8B-23 were 48.8% ± 0.29, AO_1 showed 47.5% ± 0.38, AO_2 gave 48.3% ± 0.30, P6N and CCUG 33920 showed 43.0% ± 0.24, and AO_3 had 47.4% ± 0.28 (Table 1). The DDH values of AO_1 to AO_3 and three independent clusters were in the range of 42.7–49.2% when compared to main AO strains. Therefore, all these clusters are different compared to the main AO cluster (Table 1).
The DNA relatedness values for WE8B-23, AO_1 to 2, when compared to each other was in the range of 71.90 to 100% (shown in red in Table 1). The probability of being the same species was very high. The clusters of WE8B-23, AO_1, and 2 were identical, while clusters of P6N, CCUG33920, and AO_3 were distinct from each other.
The DDH values of ≥70% were observed among strains of cluster AO_3 (S64C, R21091 and S24V); therefore, the strains of cluster AO_3 were the same species. Similarly, a couple of DDH values of ≥70% were observed. These were CCUG 33920 and OT171 (84.9%), MG1 and k20 (79.4%), W11-1-1 and F4D1 (75.5%), and G53E and OT175. Therefore, they were all same species.
The strains which were sequenced belonging to the true A. naeslundii cluster showed average DNA homology values in the range of 81.6–100% (Table 1). No significant difference was observed when compared with each other (Table 1). Similarly, the strains of AN_1 gave 69–71% average DNA homology values when compared to the true AN cluster (Table 1). When AN_1 was compared with AN_1, 85–100% homologies were seen (Table 1), and 73–75% homology values were seen when compared with AN_2 (Table 1). The DDH values of 87–100% were observed when AN_2 tested with AN_2 (Table 1). Hence, all the DDH values were in the range of 70–100%. Therefore, all the strains of A. naeslundii belonged to a single cluster.
The DDH values were also observed when all strains of cluster AO to AO_3 were tested for homology with AN to AN_2. The DDH values fell in the range of 35–36%. Therefore, A. oris clusters were clearly a separate group from A. naeslundii clusters (Table 1). The same finding was observed when tested with A. johnsonii and A. odontolyticus. They both were distinct to all other A. oris and A. naeslundii clusters. The DDH findings were in agreement with the MLST analysis results which also showed similar groupings/clusters based on house-keeping gene analysis.

4. Discussion

Actinomyces spp. comprise a significant proportion of the bacterial population of dental plaque where they contribute to the overall balance and function of the plaque community [39]. Actinomyces represents a wide variety of phenotypically and genotypically diverse species. The identification of Actinomyces spp. is difficult and variable [40]. Initially, Actinomyces were identified by their catalase activity to differentiate between A. naeslundii and A. viscosus [41,42,43]. Efforts have been made previously to distinguish Actinomyces species using 16S rRNA gene analysis. The first major attempt of investigating the intragenic relationship revealed that A. bovis, A. viscosus, A. naeslundii, A. odontolyticus, and A. israelii were all genetically distinct species [44].
The potential ambiguities observed while classifying the Actinomyces indicated the need for new techniques that can differentiate between different species. The housekeeping gene analysis approach was employed to identify closely related species which failed to be recognized with 16S rRNA gene analysis [45,46,47,48,49]. A detailed taxonomic study using six concatenated genes sequenced by Henssge et al., (2009) [14], delineated distinct clusters for Actinomyces species; however, in the same study using seven concatenated genes, some strains of each species were quite distinct and formed separate clusters. To determine if these clusters represent distinct subspecies, studies were undertaken to obtain whole genome sequences of these isolates. In the current study, MLST analysis of seven more publicly available strains were added to the analysis to investigate the phylogenetic status (sequenced files were obtained from NCBI website). The phylogenetic tree of concatenated sequences of A. oris and A. naeslundii (Appendix A.1) revealed 14 isolates as distinct to A. oris clonal complex which showed that these isolates are from 14 different sources/individuals. The isolate with study number OT171 was found in the subcluster comprising three isolates, and isolate MG1, k20, and c505 were found in the main A. oris cluster, suggesting that OT171 is a subspecies of A. oris. The same was observed in a study by Henssge et al., (2009) [14], where strain number CCUG 34286 was found in a separate cluster of seven isolates. This isolate was previously identified as A. naeslundii serotype III [16] and emended within a group of A. oris [17] as its subspecies. In conclusion, this study supports the hypothesis that there may be subspecies of A. oris.
Therefore, the high variability especially among the group of genospecies II (A. oris), does not allow the clear indication of differentiation among two genospecies. The availability of complete genome sequences of Actinomyces has not only shed light on the genetic features, but also provides the basis for the application of post-genomic techniques. The genome sequence identified several large gene clusters, suggesting they had been acquired by horizontal gene transfer. However, the sequence of the genomes revealed few mechanisms by which genetic diversity can be generated.

4.1. Clonal Frame Analysis

ClonalFrame analysis was employed in the current study to explore the evolutionary history, recombination, and mutation rate. A Neighbor-Joining tree revealed long separate branches for isolates which indicated the presence of few isolates on one cluster. The analysis clearly indicated that A. naeslundii was distinct from the majority of A. oris except for a few isolates which were found to be present in the intermediate position and therefore was an indication of some branches within each species. ClonalFrame analysis revealed that A. oris and A. naeslundii originate separately when a combined analysis was obtained on 43 genomes. There were clonal lineages observed in both species with few splits due to recombination and mutation events. The separate analysis revealed a hierarchical structure with high resolution for A. oris as compared to A. naeslundii which showed a big compact split for A. naeslundii. It represented one major cluster for the population and two separate independent clusters in A. naesludnii, while five separate clades were found for A. oris with one main cluster. The similar structure of two lineages was observed for Vibrio vulnificus [50]. It was observed that strains causing human diseases were more clonally arranged due to frequent recombination and mutation as compared to the environmental strains that show less resolution due to smaller recombination rates among them [50].
The availability of whole genome sequences of these isolates provide insight into the intricate genomic features of Actinomyces and will serve as an important reference in the study of oral Actinomyces strains associated with plaque in the future. Overall, there seemed to be some patterns that indicated evolutionary events in the history of Actinomyces as species. Furthermore, there is a large ancestral split between A. oris and A. naeslundii strains. The evolution of two big clades among the Actinomyces species suggested that these strains may have evolved from a single ancestor many million years ago into two main groups which had homologous genes.

4.2. Core Gene Analysis

The present study provides the first insight and novel approach for defining the core genome of an A. oris and A. naeslundii species for taxonomical classification. The core genome was estimated from the whole genome sequences of 43 Actinomyces strains as 476 orthologs or gene families. The function of these gene families was determined through RAST annotations or subsystem technology; however, the functions of many gene families remain unknown, and were characterized as hypothetical proteins. This work indicates further efforts are needed to identify the functions of the highly conserved and essential genes in Actinomyces species. The phylogenetic tree based on core gene sequence similarity is the same as the phylogenomic tree based on total genome content. The sets of strains are clustered together in a msimilar mode using full genomic content and core gene (ClonalFrame analysis) dendrograms, suggesting that they are closely related in evolution. The predicted genes can be used for efficient large-scale screening of strains from the culture collections. Finally, the pan-genome analysis also sheds light on the variability of cell surface proteins and exopolysaccharides. The descending trend in the core genome size was also observed in many studies with the increasing number of isolates [51].

4.3. Digital DNA–DNA Hybridization Analysis

Based on Digital DNA–DNA Hybridization analysis, it was proposed that A. naeslundii should be kept as a single cluster and A. oris should be divided into six clusters as suggested previously by Henssge et al., (2009) [14]. In this study, we represented the first Digital-DDH investigation of Actinomyces species which required finished whole genomes. In addition to determining which species are related to which group, it provides researchers with a more accurate taxonomical classification at species level. This group represented strains from caries-free and caries-active individuals. They comprise a consistent genome size from 2.9 MB (W11-1-1) to mean genome sizes of 3.5 Mb (WE8B-23), which allowed for robust interpretations.
The microplate DNA–DNA hybridization method of Ezaki et al. [52] is a well-established and frequently used method in bacterial taxonomy [52]. Several reviews [53,54,55,56] cited that 80% identity must be shared in DNA fragments in order to hybridize during DDH experiments. However, the current results revealed that the 70% DDH recommendation covers relatively identical strains at the genomic level and previous studies results based on the phenotypic similarity of strains were reliable using the same 70% DDH standard. The authenticity of the values obtained using in silico DDH comparisons emphasizes the call for the concept of species to be re-evaluated; it was discussed, and recommendations were: “Investigators are encouraged to propose new species based upon other genomic methods or techniques provided that they can demonstrate that, within the taxa studies, there is a sufficient degree of congruence between the technique used and DNA–DNA reassociation. In addition, investigators are encouraged to develop new methods to supplement or supplant DNA–DNA reassociation” [57]. This recommendation was met in the present study by employing the Digital DNA–DNA Hybridization technique to obtain the homology values which were authentic and accurate by using advanced whole genome sequences. Separate species were considered to have difference of up to 21% in gene content between strains; e.g., up to 1000 genes may be different in a genome of approximately 5 Mb size [27].

5. Conclusions

The combined use of Digital DDH, Mauve, Progressive Mauve, Core and Pan genome, and ClonalFrame analyses validated that A. oris and A. naeslundii are distinct species. The de novo assembly of high-throughput short-read and long-read sequences was obtained. The nearly complete whole genome sequencing of 36 Actinomyces strains clarified the ambiguous taxonomy of the human A. naeslundii/viscosus group. Their classification remains unchanged from the one obtained through MLST analysis. A. oris and A. naeslundii have a distinct clonal population structure. Recombination/mutation events are greater in A. oris when compared to A. naeslundii. A. naeslundii was found to be a compact group while A. oris was found to be formed of a few distinct sub-species; however, the apparent biochemical and ecological similarity of each species suggests that it would be inappropriate to change the valid description of the species. Deeper knowledge of the diversity within a species can provide invaluable insight into its ability to adapt and survive in the complex oral microbiota environment. Such knowledge can also infer on their pathogenicity mechanisms due to the identification of the pan genome.

Supplementary Materials

The following supporting information can be downloaded at: https://www.mdpi.com/article/10.3390/microorganisms11020254/s1.

Author Contributions

Conceptualization, designed the experiments and project administration: D.B. and S.R.M.; Methodology: S.R.M., T.D. and S.C.G.; Formal analysis and investigation: D.B., S.R.M., X.D. and T.D.; Validation: S.R.M., S.A.N., T.D., D.B., D.R.R. and X.D.; Writing—original draft preparation: S.R.M., S.A.N. and D.B.; Writing—review and editing: S.R.M., S.A.N., T.D., X.D., S.C.G., D.B. and D.R.R.; Supervision: D.B. and D.R.R. All authors have read and agreed to the published version of the manuscript.

Funding

This research was supported by Higher Education Commission of Pakistan and Prof. David Beighton’s research fund at King’s s College London.

Data Availability Statement

Whole genomic sequence data of 36 Actinomyces strains were published on GenBank and accessible on weblink https://www.ncbi.nlm.nih.gov/bioproject/347929 accessed on 12 October 2016.

Acknowledgments

We acknowledge support from the Higher Education Commission H-9, Islamabad, Pakistan and Dental Institute, King’s College London.

Conflicts of Interest

The authors have no conflict of interest to declare that are relevant to the content of this article.

Appendix A

Appendix A.1

Figure A1. Concatenation of 7 house keeping genes. A. oris:Microorganisms 11 00254 i001; A. oris_1: Microorganisms 11 00254 i002; A. oris_2: Microorganisms 11 00254 i003; A. oris_3: Microorganisms 11 00254 i004; A. naeslundii: Microorganisms 11 00254 i005; A. naeslundii_1: Microorganisms 11 00254 i006; A. naeslundii_2: Microorganisms 11 00254 i007; c505, MG1, k20, OT175 (A. oris): Microorganisms 11 00254 i008; OT170: Microorganisms 11 00254 i009; OT171: Microorganisms 11 00254 i010.
Microorganisms 11 00254 g0a1
* A. johnsonii was not included in MLST analysis as it lacks pheS gene, ** ATCC 12104 = NCTC_10301.

Appendix A.2

Plotting of Core and Pan-Genomes
To make the plots, an output file after a progressive mauve run that ends with "backbone" is required. The backbone file relates to Locally Collinear Block’s present in two or more genomes used to identify the nucleotide coordinates in each LCB. This file contained a row of tables for each genomic region and its presence/absence/location was mentioned in columns in each genome in the respective file. The number of shared or core genes were extracted using in-house programming. The plots were drawn using MEGA version 5.0.

Appendix A.3

Matlab Script to convert from “XMFA” to “FASTA”
clear all;
close all;
data=fastaread(‘new.xmfa’);
iso=43;
data2=data(1:iso);
for i=1:iso
   data2(i).Sequence=strcat(data(i:iso:end).Sequence);
end
data2(end).Sequence=data2(end).Sequence(data2(end).Sequence~=′=′);
fastawrite(‘new.fasta’,data2);

Appendix A.4

Matlab script to convert “gene-by-gene alignment” file into “XMFA”.
clear all
close all
genes=csvread(‘mapping.csv’);
names={‘MG1’,‘P6N’,‘CCUG35334’,‘CCUG37599’,‘F12B1’,‘F6E1’,‘G127B’,‘OT171’,‘A19A-1’,‘A7A-1’,‘c505’,‘MB-1’,‘MMRC12-1’,‘NCTC10301’,‘Pn6N’,‘R13240’,‘CCUG33920’,‘CCUG34286’,‘F28B1’,‘F4D1’,‘G53E’,‘R19039’,‘R24330’,‘R8152’,‘S43L’,‘S44D’,‘K20’,‘M48-1B-1’,‘MMRCO6-1’,‘OT170’,‘R11372’,‘S65A’,‘T23P-1’,‘W8-2-3’,‘WE6B-3’,‘R21091’,‘R23275’,‘S24V’,‘S64C’,‘W11-1-1’,‘WE8B-23’,‘Ajhonsonii’,‘OT175’};
fasta=cell(length(names),1);
for i=1:length(names)
   i
   fasta{i}=fastaread(sprintf(‘fastaGENES/%s.fna’,names{i}));
end
!rm -f actino2.xmfa
for i=1:size(genes,1)%For all genes
   i
   for j=1:size(genes,2)
   toali(j).Header=names{j};
   toali(j).Sequence=fasta{j}(genes(i,j)).Sequence;
   end
   !rm -f /tmp/toali.fasta
   !rm -f /tmp/aligned.fasta
   !rm -f /tmp/alignedSTABLE.fasta
   fastawrite(‘/tmp/toali.fasta’,toali);
   !muscle -quiet -in /tmp/toali.fasta -out /tmp/aligned.fasta
   !python stable.py /tmp/toali.fasta /tmp/aligned.fasta > /tmp/alignedSTABLE.fasta
   !cat /tmp/alignedSTABLE.fasta >> actino2.xmfa
   !echo = >> actino2.xmfa

References

  1. Dewhirst, F.E.; Chen, T.; Izard, J.; Paster, B.J.; Tanner, A.C.; Yu, W.H.; Lakshmanan, A.; Wade, W.G. The human oral microbiome. J. Bacteriol. 2010, 192, 5002–5017. [Google Scholar] [CrossRef] [PubMed] [Green Version]
  2. Paster, B.J.; Olsen, I.; Aas, J.A.; Dewhirst, F.E. The breadth of bacterial diversity in the human periodontal pocket and other oral sites. Periodontology 2000 2006, 42, 80–87. [Google Scholar] [CrossRef] [PubMed]
  3. Escapa, I.F.; Chen, T.; Huang, Y.; Gajare, P.; Dewhirst, F.E.; Lemon, K.P. New Insights into Human Nostril Microbiome from the Expanded Human Oral Microbiome Database (eHOMD): A Resource for the Microbiome of the Human Aerodigestive Tract. mSystems 2018, 3, e00187-18. [Google Scholar] [CrossRef] [PubMed] [Green Version]
  4. Auch, A.F.; von Jan, M.; Klenk, H.P.; Göker, M. Digital DNA-DNA hybridization for microbial species delineation by means of genome-to-genome sequence comparison. Stand. Genomic Sci. 2010, 2, 117–134. [Google Scholar] [CrossRef] [PubMed] [Green Version]
  5. Aas, J.A.; Paster, B.J.; Stokes, L.N.; Olsen, I.; Dewhirst, F.E. Defining the normal bacterial flora of the oral cavity. J. Clin. Microbiol. 2005, 43, 5721–5732. [Google Scholar] [CrossRef] [PubMed] [Green Version]
  6. Bik, E.M.; Long, C.D.; Armitage, G.C.; Loomer, P.; Emerson, J.; Mongodin, E.F.; Nelson, K.E.; Gill, S.R.; Fraser-Liggett, C.M.; Relman, D.A. Bacterial diversity in the oral cavity of 10 healthy individuals. ISME J. 2010, 4, 962–974. [Google Scholar] [CrossRef]
  7. Slots, J.; Möenbo, D.; Langebaek, J.; Frandsen, A. Microbiota of gingivitis in man. Scand. J. Dent. Res. 1978, 86, 174–181. [Google Scholar] [CrossRef]
  8. Li, J.; Li, Y.; Zhou, Y.; Wang, C.; Wu, B.; Wan, J. Actinomyces and Alimentary Tract Diseases: A Review of Its Biological Functions and Pathology. Biomed. Res. Int. 2018, 2018, 3820215. [Google Scholar]
  9. Nyvad, B.; Kilian, M. Microbiology of the early colonization of human enamel and root surfaces in vivo. Scand. J. Dent. Res. 1987, 95, 369–380. [Google Scholar] [CrossRef]
  10. Nyvad, B.; Kilian, M. Comparison of the initial streptococcal microflora on dental enamel in caries-active and in caries-inactive individuals. Caries Res. 1990, 24, 267–272. [Google Scholar] [CrossRef]
  11. Li, J.; Helmerhorst, E.J.; Leone, C.W.; Troxler, R.F.; Yaskell, T.; Haffajee, A.D.; Socransky, S.S.; Oppenheim, F.G. Identification of early microbial colonizers in human dental biofilm. J. Appl. Microbiol. 2004, 97, 1311–1318. [Google Scholar] [CrossRef] [PubMed]
  12. Diaz, P.I.; Chalmers, N.I.; Rickard, A.H.; Kong, C.; Milburn, C.L.; Palmer, R.J.; Kolenbrander, P.E. Molecular characterization of subject-specific oral microflora during initial colonization of enamel. Appl. Environ. Microbiol. 2006, 72, 2837–2848. [Google Scholar] [CrossRef] [PubMed] [Green Version]
  13. Periasamy, S.; Kolenbrander, P.E. Central role of the early colonizer Veillonella sp. in establishing multispecies biofilm communities with initial, middle, and late colonizers of enamel. J. Bacteriol. 2010, 192, 2965–2972. [Google Scholar] [CrossRef] [PubMed] [Green Version]
  14. Henssge, U.; Do, T.; Radford, D.R.; Gilbert, S.C.; Clark, D.; Beighton, D. Emended description of Actinomyces naeslundii and descriptions of Actinomyces oris sp. nov. and Actinomyces johnsonii sp. nov., previously identified as Actinomyces naeslundii genospecies 1, 2 and WVA 963. Int. J. Syst. Evol. Microbiol. 2009, 59, 509–516. [Google Scholar] [CrossRef]
  15. Do, T.; Henssge, U.; Gilbert, S.C.; Clark, D.; Beighton, D. Evidence for recombination between a sialidase (nanH) of Actinomyces naeslundii and Actinomyces oris, previously named ‘Actinomyces naeslundii genospecies 1 and 2’. FEMS Microbiology Letters. 2008, 288, 156–162. [Google Scholar] [CrossRef] [PubMed] [Green Version]
  16. Johnson, J.L.; Moore, L.V.H.; Kaneko, B.; Moore, W.E.C. Actinomyces georgiae sp. nov., Actinomyces gerencseriae sp. nov., Designation of Two Genospecies of Actinomyces naeslundii, and Inclusion of A. naeslundii serotypes II and III and Actinomyces viscosus serotype II in A. naeslundii Genospecies 2. Int. J. Syst. Bacteriol. 1990, 40, 273–286. [Google Scholar] [CrossRef] [PubMed] [Green Version]
  17. Henssge, U.; Do, T.; Gilbert, S.C.; Cox, S.; Clark, D.; Wickström, C.; Ligtenberg, A.J.M.; Radford, D.R.; Beighton, D. Application of MLST and pilus gene sequence comparisons to investigate the population structures of Actinomyces naeslundii and Actinomyces oris. PLoS ONE 2011, 6, e21430. [Google Scholar] [CrossRef] [Green Version]
  18. Brailsford, S.R.; Lynch, E.; Beighton, D. The isolation of Actinomyces naeslundii from sound root surfaces and root carious lesions. Caries Res. 1998, 32, 100–106. [Google Scholar] [CrossRef]
  19. Wayne, L.G.; Brenner, D.J.; Colwell, R.R.; Grimont, P.A.D.; Kandler, O.; Krichevsky, M.I.; Moore, L.H.; Moore, W.E.C.; Murray, R.G.E.; Stackebrandt, E.; et al. Report of the Ad Hoc Committee on Reconciliation of Approaches to Bacterial Systematics. Int. J. Syst. Bacteriol. 1987, 37, 463–464. [Google Scholar] [CrossRef] [Green Version]
  20. Grimont, P.A.D.; Popoff, M.Y.; Grimont, F.; Coynault, C.; Lemelin, M. Reproducibility and correlation study of three deoxyribonucleic acid hybridization procedures. Current Microbiol. 1980, 4, 325–330. [Google Scholar] [CrossRef]
  21. Huss, V.A.R.; Festl, H.; Schleifer, K.H. Studies on the spectrophotometric determination of DNA hybridization from renaturation rates. Syst. Appl. Microbiol. 1983, 4, 184–192. [Google Scholar] [CrossRef] [PubMed]
  22. Gevers, D.; Cohan, F.M.; Lawrence, J.G.; Spratt, B.G.; Coenye, T.; Feil, E.J.; Stackebrandt, E.; Van de Peer, Y.; Vandamme, P.; Thompson, F.L.; et al. Re-evaluating prokaryotic species. Nat. Rev. Micro. 2005, 3, 733–739. [Google Scholar] [CrossRef] [PubMed]
  23. Stackebrandt, E. The richness of prokaryotic diversity: There must be a species somewhere. Food Technol. Biotechnol. 2003, 41, 17–22. [Google Scholar]
  24. Cho, J.-C.; Tiedje, J.M. Bacterial Species Determination from DNA-DNA Hybridization by Using Genome Fragments and DNA Microarrays. Appl. Environ. Microbiol. 2001, 67, 3677–3682. [Google Scholar] [CrossRef] [PubMed] [Green Version]
  25. Coenye, T.; Gevers, D.; Van de Peer, Y.; Vandamme, P.; Swings, J. Towards a prokaryotic genomic taxonomy. FEMS Microbiol. Rev. 2005, 29, 147–167. [Google Scholar] [CrossRef] [PubMed]
  26. Konstantinidis, K.T.; Tiedje, J.M. Genomic insights that advance the species definition for prokaryotes. Proc. Natl. Acad. Sci. USA 2005, 102, 2567–2572. [Google Scholar] [CrossRef] [Green Version]
  27. Goris, J.; Konstantinidis, K.T.; Klappenbach, J.A.; Coenye, T.; Vandamme, P.; Tiedje, J.M. DNA-DNA hybridization values and their relationship to whole-genome sequence similarities. Int. J. Syst. Evol. Microbiol. 2007, 57, 81–91. [Google Scholar] [CrossRef] [Green Version]
  28. Deloger, M.; El Karoui, M.; Petit, M.A. A genomic distance based on MUM indicates discontinuity between most bacterial species and genera. J. Bacteriol. 2009, 191, 91–99. [Google Scholar] [CrossRef] [Green Version]
  29. Meier-Kolthoff, J.P.; Goker, M.; Sproer, C.; Klenk, H.P. When should a DDH experiment be mandatory in microbial taxonomy? Arch. Microbiol. 2013, 195, 413–418. [Google Scholar] [CrossRef]
  30. Auch, A.F.; Klenk, H.P.; Goker, M. Standard operating procedure for calculating genome-to-genome distances based on high-scoring segment pairs. Stand. Genomic Sci. 2010, 2, 142–148. [Google Scholar] [CrossRef] [Green Version]
  31. Medini, D.; Donati, C.; Tettelin, H.; Masignani, V.; Rappuoli, R. The microbial pan-genome. Curr. Opin. Genet. Dev. 2005, 15, 589–594. [Google Scholar] [CrossRef] [PubMed]
  32. Smokvina, T.; Wels, M.; Polka, J.; Chervaux, C.; Brisse, S.; Boekhorst, J.; Vlieg, J.E.; Siezen, R.J. Lactobacillus paracasei Comparative Genomics: Towards Species Pan-Genome Definition and Exploitation of Diversity. PLoS ONE 2013, 8, 22. [Google Scholar] [CrossRef] [PubMed]
  33. Tettelin, H.; Masignani, V.; Cieslewicz, M.J.; Donati, C.; Medini, D.; Ward, N.L.; Angiuoli, S.V.; Crabtree, J.; Jones, A.L.; Durkin, A.S.; et al. Genome analysis of multiple pathogenic isolates of Streptococcus agalactiae: Implications for the microbial “pan-genome”. Proc. Natl. Acad. Sci. USA 2005, 102, 13950–13955. [Google Scholar] [CrossRef] [PubMed] [Green Version]
  34. Darling, A.C.; Mau, B.; Blattner, F.R.; Perna, N.T. Mauve: Multiple alignment of conserved genomic sequence with rearrangements. Genome Res. 2004, 14, 1394–1403. [Google Scholar] [CrossRef] [Green Version]
  35. Darling, A.E.; Miklos, I.; Ragan, M.A. Dynamics of genome rearrangement in bacterial populations. PLoS Genet. 2008, 4, e1000128. [Google Scholar] [CrossRef] [Green Version]
  36. Darling, A.E.; Mau, B.; Perna, N.T. progressiveMauve: Multiple Genome Alignment with Gene Gain, Loss and Rearrangement. PLoS ONE 2010, 5, e11147. [Google Scholar] [CrossRef] [Green Version]
  37. Didelot, X.; Falush, D. Inference of Bacterial Microevolution Using Multilocus Sequence Data. Genetics 2007, 175, 1251–1266. [Google Scholar] [CrossRef] [Green Version]
  38. Chen, T.; Yu, W.-H.; Izard, J.; Baranova, O.V.; Lakshmanan, A.; Dewhirst, F.E. The Human Oral Microbiome Database: A web accessible resource for investigating oral microbe taxonomic and genomic information. Database 2010, 2010. [Google Scholar] [CrossRef] [Green Version]
  39. Chen, L.; Zhang, Q.; Wang, Y.; Zhang, K.; Zou, J. Comparing dental plaque microbiome diversity of extrinsic black stain in the primary dentition using Illumina MiSeq sequencing technique. BMC Oral Health 2019, 19, 269. [Google Scholar] [CrossRef]
  40. Hall, V.; Brazier, J.S. Identification of actinomyces—What are the major problems? In Anaerobic Pathogens; Eley, A.R., Bennett, K.W., Eds.; Academic Press: Sheffield, UK, 1997; pp. 187–192. [Google Scholar]
  41. Ellen, R.P.; Balcerzak-Raczkowski, I.B. Differential medium for detecting dental plaque bacteria resembling Actinomyces viscosus and Actinomyces naeslundii. J. Clin. Microbiol. 1975, 2, 305–310. [Google Scholar] [CrossRef]
  42. Ellen, R.P. Establishment and distribution of Actinomyces viscosus and Actinomyces naeslundii in the human oral cavity. Infect. Immun. 1976, 14, 1119–1124. [Google Scholar] [CrossRef] [PubMed] [Green Version]
  43. Schaal, K.P. Genus Actinomyces. In Bergey’s Manual of Systematic Bacteriology; Sneath, P.H.A., Mair, N.S., Sharpe, M.E., Holt, J.G., Eds.; Williams and Wilkins: Baltimore, MD, USA, 1986; pp. 1383–1418. [Google Scholar]
  44. Stackebrandt, E.; Charfreitag, O. Partial 16S rRNA primary structure of five Actinomyces species: Phylogenetic implications and development of an Actinomyces israelii-specific oligonucleotide probe. J. Gen. Microbiol. 1990, 136, 37–43. [Google Scholar] [CrossRef] [PubMed]
  45. Arif, N.; Sheehy, E.C.; Do, T.; Beighton, D. Diversity of Veillonella spp. from sound and carious sites in children. J. Dent. Res. 2008, 87, 278–282. [Google Scholar] [CrossRef] [PubMed] [Green Version]
  46. Christensen, H.; Kuhnert, P.; Olsen, J.E.; Bisgaard, M. Comparative phylogenies of the housekeeping genes atpD, infB and rpoB and the 16S rRNA gene within the Pasteurellaceae. Int. J. Syst. Evol. Microbiol. 2004, 54, 1601–1609. [Google Scholar] [CrossRef] [PubMed] [Green Version]
  47. Kiratisin, P.; Li, L.; Murray, P.R.; Fischer, S.H. Use of housekeeping gene sequencing for species identification of viridans streptococci. Diagn. Microbiol. Infect. Dis. 2005, 51, 297–301. [Google Scholar] [CrossRef]
  48. Poyart, C.; Quesne, G.; Coulon, S.; Berche, P.; Trieu-Cuot, P. Identification of streptococci to species level by sequencing the gene encoding the manganese-dependent superoxide dismutase. J. Clin. Microbiol. 1998, 36, 41–47. [Google Scholar] [CrossRef] [Green Version]
  49. Wertz, J.E.; Goldstone, C.; Gordon, D.M.; Riley, M.A. A molecular phylogeny of enteric bacteria and implications for a bacterial species concept. J. Evol. Biol. 2003, 16, 1236–1248. [Google Scholar] [CrossRef] [Green Version]
  50. Bisharat, N.; Cohen, D.I.; Maiden, M.C.; Crook, D.W.; Peto, T.; Harding, R.M. The evolution of genetic structure in the marine pathogen, Vibrio vulnificus. Infect Genet. Evol. 2007, 7, 685–693. [Google Scholar] [CrossRef]
  51. Chen, C.; Zhang, W.; Zheng, H.; Lan, R.; Wang, H.; Du, P.; Bai, X.; Ji, S.; Meng, Q.; Jin, D.; et al. Minimum Core Genome Sequence Typing of Bacterial Pathogens: A Unified Approach for Clinical and Public Health Microbiology. J. Clin. Microbiol. 2013, 51, 2582–2591. [Google Scholar] [CrossRef] [Green Version]
  52. Ezaki, T.; Hashimoto, Y.; Yabuuchi, E. Fluorometric Deoxyribonucleic Acid-Deoxyribonucleic Acid Hybridization in Microdilution Wells as an Alternative to Membrane Filter Hybridization in which Radioisotopes Are Used To Determine Genetic Relatedness among Bacterial Strains. Int. J. Syst. Bacteriol. 1989, 39, 224–229. [Google Scholar] [CrossRef]
  53. Stackebrandt, E.; Rossello-Mora, R. DNA-DNA Reassociation Methods Applied to Microbial Taxonomy and Their Critical Evaluation. In Molecular Identification, Systematics, and Population Structure of Prokaryotes; Springer: Berlin/Heidelberg, Germany, 2006; pp. 23–50. [Google Scholar]
  54. Rossello-Mora, R.; Amann, R. The species concept for prokaryotes. FEMS Microbiol. Rev. 2001, 25, 39–67. [Google Scholar] [CrossRef] [PubMed]
  55. Stackebrandt, E.; Goebel, B.M. Taxonomic Note: A Place for DNA-DNA Reassociation and 16S rRNA Sequence Analysis in the Present Species Definition in Bacteriology. Int. J. Syst. Bacteriol. 1994, 44, 846–849. [Google Scholar] [CrossRef]
  56. Stackebrandt, E.; Liesack, W. Nucleic acids and classification. In Handbook of New bacterial Systematics; Goodfellow, M., O’Donnell, A.G., Eds.; Academic Press: London, UK, 1993; pp. 151–194. [Google Scholar]
  57. Stackebrandt, E.; Frederiksen, W.; Garrity, G.M.; Grimont, P.A.D.; Kämpfer, P.; Maiden, M.C.J.; Nesme, X.; Rosselló-Mora, R.; Swings, J.; Trüper, H.; et al. Report of the ad hoc committee for the re-evaluation of the species definition in bacteriology. Int. J. Syst. Evol. Microbiol. 2002, 52, 1043–1047. [Google Scholar] [PubMed]
Figure 1. A phylogenetic tree showing relationship after Mauve run of 43 Actinomyces genomes.
Microorganisms 11 00254 g001
Figure 6. ClonalFrame consensus tree for 43 Actinomyces genomes using 476 Core genes.
Microorganisms 11 00254 g006
Table 1. Summary of Final DDH Calculation.
AorisWE8B-23AO1AO2P6NCCUG-33920AO3ANAN1AN2
Aoris66.29
(53.3–100)
48.8
(48.7–49.2)
47.5
(47.0–48.3)
48.3
(47.8–48.9)
43.0
(42.5–42.8)
43.0
(42.6–43.4)
47.4
(47.7–46.9)
36
(35.7–36.0)
35
(35.1–35.4)
35.5
(35.4–35.9)
WE8B-23 100 * 72.7
(71.9–73.9)
74.8
(74.3–75.5)
42.843.251.2
(51.1–51.23
36
(35.8–36.3)
35.5
(35.5–35.6)
35.9
(35.8–36.0)
AO1 87.8
(79–100)
72.8
(72.6–73.6)
42.5
(42.5–42.6)
43.0
(42.9–43.1)
51.4
(51.1–51.7)
35.7
(35.9–36.0)
36
(35.0–35.9)
36
(35.7–35.9)
A02 92.4
(86.8–100)
42.9
(4.8–43.0)
43
(43.1–43.0)
51.0
(50.9–51.2)
36.7
(36.0–38.1)
36
(36.0–36.2)
36
(35.0–36.0)
P6N 100 * 47.544.6
(44.5–44.8)
38.1
(38–38.3)
37.2
(37.2–37.2)
37.2
(37.2–37.4)
CCUG 33920 100 * 44.7
(44.6–44.9)
36.6
(36.5–36.6)
35.9
(35.9–36)
36.2
(36.1–36.2)
AO3 88.2
(80–100)
36.7
(36.5–37)
36
(36.0–36.5)
36
(36.1–36.8)
AN 86.8
(81.6–100)
70
(69.1–71.5)
71
(70.0–72.4)
AN1 90.6
(85.4–100)
75
(72.1–75.1)
AN2 91.6
(87.3–100)
* Final summary of DDH values showing average and also the minimum and maximum values in brackets.
Disclaimer/Publisher’s Note: The statements, opinions and data contained in all publications are solely those of the individual author(s) and contributor(s) and not of MDPI and/or the editor(s). MDPI and/or the editor(s) disclaim responsibility for any injury to people or property resulting from any ideas, methods, instructions or products referred to in the content.

