Improved Geotechnical Behavior of an Expansive Soil Amended with Tire-Derived Aggregates Having Different Gradations


1
School of Engineering, IT and Physical Sciences, Federation University, Churchill, VIC 3842, Australia
2
School of Civil, Environmental and Mining Engineering, The University of Adelaide, Adelaide, SA 5005, Australia
3
Department of Civil, Structural and Environmental Engineering, Trinity College Dublin, Dublin 2, Ireland
*
Author to whom correspondence should be addressed.
Minerals 2020, 10(10), 923; https://doi.org/10.3390/min10100923
Submission received: 30 August 2020
/
Revised: 12 October 2020
/
Accepted: 15 October 2020
/
Published: 19 October 2020
(This article belongs to the Special Issue Stabilisation and Reinforcement of Clays with Environmentally Friendly Materials)
Abstract
:This experimental laboratory study examines the potential use of tire-derived aggregate (TDA) products as an additive to alleviate the inferior geotechnical properties of a subgrade deposit of clay soil with high expansivity. A total of ten mix designs—the unamended soil and nine soil–TDA blends prepared at 5%, 10% and 20% TDA contents (by dry mass) using three different TDA gradations/sizes—were examined. The experiments included standard Proctor compaction, oedometer swell and unconfined compression tests. The TDA materials’ lower specific gravity, hydrophobic character and higher energy absorption capacity compared with the soil solids led to notable reductions in the soil compaction characteristics. The amendment of the soil with TDA resulted in notable decreases in the rate and magnitude of swelling—the observed reductions were in favor of higher TDA contents, with larger TDA particle size being a secondary factor. Further, for any given TDA size, the variations of strength and toughness with respect to TDA content exhibited rise–fall relationships, peaking at 5% TDA and then decreasing for higher TDA contents. The stiffness and ductility parameters, however, were found to monotonically decrease and increase with the TDA content, respectively. Finally, TDA contents of up to 10%, with gradations equivalent to those of medium and coarse sands, were found to reduce the soil’s swelling potential from high to moderate expansivity, while simultaneously improving its strength-related features, and thus can be deemed as optimum mix design choices from a geotechnical perspective.
1. Introduction
Clay soils are among the most common of all materials encountered in civil engineering operations. Most clays, however, are characterized as low-grade construction materials, as their intrinsic mechanical features impacted by high moisture susceptibility (and hence plasticity) may present significant challenges for geotechnical engineering systems [1,2]. In South Australia, for instance, the presence of significant clay soil deposits, most of which possess notable fractions of 2:1 swelling-type smectite group minerals, has been reported to adversely affect the design and construction of road infrastructure [3]. Such soils, which are commonly referred to as reactive or expansive soils, adsorb water in wet seasons and hence increase in volume (heave), in some cases by up to three times, and subsequently contract and settle during dry seasons. The consequent cyclic increase and decrease in soil volume lead to undulation and cracking of overlying pavements, as well as embankment slumping, all of which are costly to repair and also compromise road safety [1,4,5]. To cope with such adversities, the geotechnical engineer can either complete the design within the limitations imposed by the low-grade clay soil (e.g., overdesigning the pavement system), or preferably, attempt to positively modify the soil’s undesirable properties by way of soil replacement and/or soil stabilization techniques. The former could involve complete removal of the bearing low-grade clay soil and its replacement with a suitable engineered fill, or substituting a portion of the low-grade clay soil with suitable quarried materials, such as sands and gravels, possessing desirable mechanical properties [6,7,8].
The stabilization of fine-grained soils, and clays in particular, is often achieved through the introduction of chemical agents—mainly Portland cement and hydrated lime, and more recently, polymers, sulfonated oils and resins—to the soil–water medium, which encourage soil particle flocculation or aggregation and hence the development of a more coherent soil matrix with enhanced geomechanical properties [2,5,9,10,11,12,13,14,15,16]. Though effective in serving their purpose, traditional soil stabilization practices, particularly those employing cementitious binders, are often not financially competitive in terms of materials’ procurement, labor and equipment usage. More importantly, the use of cement-based binders can be associated with major environmental drawbacks, such as the need for quarry-based materials, which have significant energy and carbon emissions footprints [5,16,17]. In this context, Williamson and Cortes [18] state, “In roadway construction for instance, a single percentile reduction in cement content could effectively reduce embedded energy by 3 × 10¹¹ J/km and the carbon footprint by 44 × 103 kg of carbon dioxide per kilometer.” Accordingly, civil, geotechnical and pavement engineering construction practices are increasingly moving towards more sustainable soil stabilization practices, particularly those capable of minimizing the need for conventional cement-based products.
2. Soil Stabilization Using Tire-Derived Aggregates
A green and potentially low-cost solution to reducing the dependence on conventional cementitious binders, and chemical stabilization in general, is to incorporate appropriate solid waste materials, possessing synergistic mechanical properties, as an “additive” to the problematic soil. In Australia, for instance, it has been reported that 51 million passenger-car tires (known as equivalent passenger units (EPUs)) enter the waste stream annually, with only 5% of them recovered through recycling chains [19]. A major problem associated with this is the space requirement for transporting and storage of end-of-life tires (ELTs), and their related health hazards and economic costs. Quite clearly, ELTs are not desired at landfills, due to their relatively low density, high resilience and the fact that they are rarely “flat-packed” [20,21]. These adverse characteristics, from a landfill perspective, also make ELTs some of the most targeted solid waste materials for beneficial incorporation in a variety of geotechnical engineering applications, such as subgrade soil stabilization. Recent research involving the addition of tire-derived aggregate (TDA) products to clay soils has shown that the soil–TDA composite exhibits remarkable properties in terms of diminishing the soil’s swell–shrink volume changes [2,22,23,24,25,26,27]. Furthermore, the addition of TDA particles has been reported to increase the soil’s shear strength, and also greatly enhance the damping of the soil, which adds greatly to bearing capacity and seismic resistance [28,29,30,31,32,33,34]. Much like conventional fiber-reinforced soil systems, the efficiency of TDA-based products in enhancing the soil’s mechanical properties, particularly its shear strength, relies on optimizing the TDA component in terms of its particle geometry (i.e., gradation/size and shape) and content in the amended soil [24,33,35]. Although recent studies have explored the mechanical performance of soil–TDA composites, and the results have been favorable, in the context of reactive clays, the available data are still rather limited, and several gaps in knowledge remain, including, most importantly, the role of TDA gradation/size. In the authors’ view, such restrictions, among others, have hindered the acceptance of TDA materials as a value-added resource, and their more widespread usage in geotechnical engineering applications.
This study reports the results of a comprehensive experimental investigation into the use of TDA products as a sustainable solution towards alleviating the inferior geotechnical attributes of a subgrade clay deposit located in South Australia. The main objectives are to examine the effects of TDA content and, in particular, its gradational characteristics on the soil’s compactability, swelling potential and unconfined compressive strength. A total of ten mix designs, consisting of one control (unamended soil) and nine TDA-blended cases (prepared at three different TDA contents using three different TDA gradations), were examined. The experiments reported include standard Proctor compaction, oedometer swell and unconfined compression tests. The results obtained from these three test groups were then carefully analyzed, and cross-checked with each other, to determine the optimum TDA-based mix design(s).
3. Materials
3.1. Clay Soil
The soil used in this study was collected from Downer Street, located in Kilkenny, South Australia. Its pertinent physical and mechanical properties were determined in accordance with relevant ASTM and Australian codes of practice, and the results are summarized in Table 1.
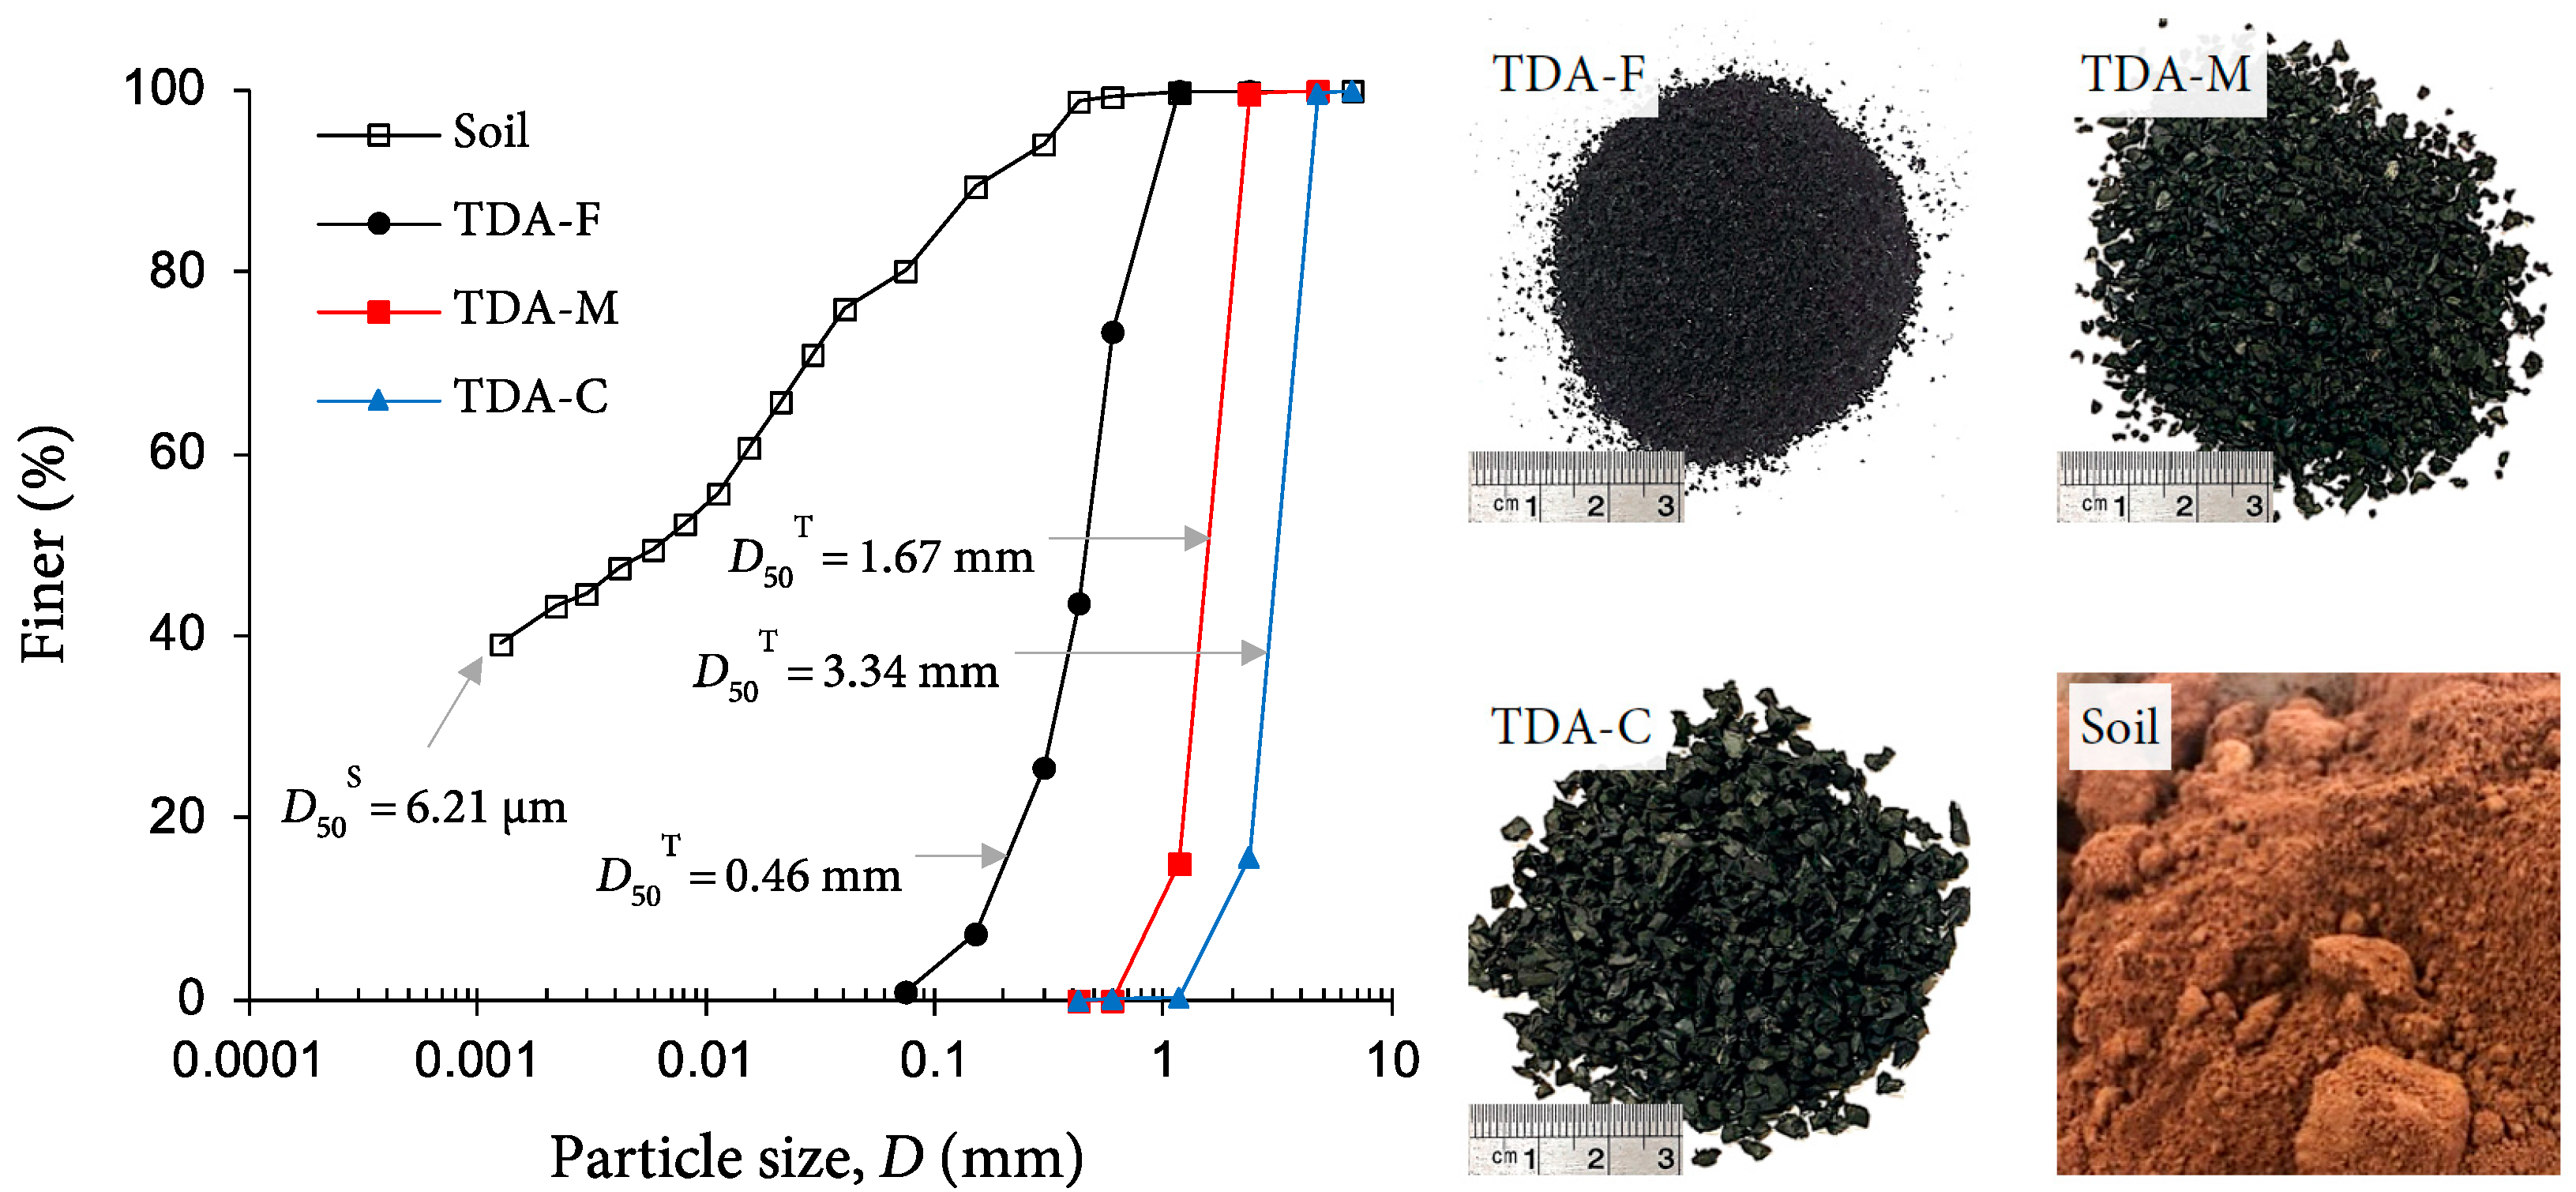
Referring to Figure 1, which illustrates the grading curves for the test materials; the soil consisted of 43% clay (<2 μm), 37% silt (2–75 μm) and 20% sand (0.075–4.75 mm). In terms of consistency limits, the liquid and plastic limits were, respectively, obtained as wL = 43.6% and wP = 22.1%, giving a plasticity index of IP = wL − wP = 21.5%. Following the Unified Soil Classification System (USCS), the fines fraction of the soil (<75 μm sized particles) can be classified as clay with intermediate plasticity (CI). In terms of compactability, the standard Proctor compaction test resulted in a maximum dry unit weight of γdmax = 17.0 kN/m3 for an optimum water content of wopt = 19.5%; the former producing a void ratio of e = 0.598. The swelling potential—that is, percent axial expansion strain in an oedometer from the initial condition of γdmax and wopt to a saturated condition under a surcharge of 7 kPa—was measured as SP = 7.54%. Following the classification framework proposed by Seed et al. [36], the test soil can be classified as “highly expansive” (see Table A1 of Appendix A for relevant classification criteria). The free swell ratio (FSR)—recognized as a quantitative measure of clay mineralogy and hence soil expansivity [37] (see Table A2 of Appendix A)—was measured as FSR = 1.55, thereby indicating that the soil’s clay fraction was mainly dominated by montmorillonite, which in turn explains the soil’s high expansive potential.
3.2. Tire-Derived Aggregates
Three types of commercially available tire-derived aggregate (TDA) products, with different gradations (see Figure 1), were investigated. The physical and mechanical properties of the three TDA variants (sizes), hereafter referred to as TDA-F, TDA-M and TDA-C, are presented in Table 2.
Referring to Figure 1; the particles of TDA-F (D50T = 0.46 mm), TDA-M (D50T = 1.67 mm) and TDA-C (D50T = 3.34 mm) approximated in size to those of fine (0.075–0.425 mm), medium (0.425–2 mm) and coarse (2–4.75 mm) sands, respectively. In view of the coefficients of uniformity and curvature values reported in Table 2, the gradation of all three TDA materials investigated can be classified in accordance with the USCS criteria as equivalent to poorly-graded sand (SP). Furthermore, the specific gravity of TDA-F, TDA-M and TDA-C were, respectively, found to be GsT = 1.08, 1.10 and 1.11; these values are approximately 2.5-fold lower than that of the test soil (GsS = 2.77). As specified in the manufacturer’s literature, the chemical composition of the three TDA variants was dominated by styrene–butadiene copolymer and carbon black, with mass fractions of 55% and 25–35%, respectively; the secondary constitutes included 5–20% acetone extract, 2–3% zinc oxide and 1–3% sulfur. Other physical properties for the three TDA variants included a softening point of 170 °C, and a maximum water adsorption capacity of 4%.
4. Experimental Program
The main objectives of this study were to investigate the effects of TDA content fT (i.e., TDA-to-soil dry mass ratio) and gradation, specifically mean particle size D50T, on the soil’s compactability, swelling potential and shear strength properties. Accordingly, a total of ten mix designs—consisting of one control (unamended soil) and nine TDA-blended cases (three for each TDA size)—were examined in this study. The experimental program consisted of standard Proctor compaction, oedometer swell and unconfined compression tests.
4.1. Mix Designs and Sample Preparations
The test soil and TDA were first blended in dry form, as per the selected mix designs outlined in Table 3. Upon gaining visible homogeneity, the required volume of water corresponding to the mixtures’ standard Proctor optimum water content values (i.e., wopt presented in Table 3 and discussed in Section 5.1) was added to each soil–TDA blend and thoroughly mixed by hand. Samples for the oedometer swell tests (see Section 4.2) were formed in three equal-height layers by static compaction in a series of 50-mm diameter and 20-mm high oedometer confining rings, such that each layer achieved the mixtures’ respective standard Proctor maximum dry unit weight values (i.e., γdmax presented in Table 3 and discussed in Section 5.1). Samples for the unconfined compression tests (see Section 4.3) were prepared in a similar manner. In this case, however, a different mold, producing samples measuring 50 mm in diameter and 100 mm in height, was adopted. The methodologies associated with the oedometer swell and unconfined compression tests are presented in the following sections. It should be noted that the specific gravity for the TDA-based blends was estimated by the following theoretical relationship [2,23]:
where GsM = specific gravity of soil–TDA blends; GsS = specific gravity of soil solids (=2.77, as reported in Table 1); GsT = specific gravity of TDA particles (=1.08, 1.10 and 1.11 for TDA-F, TDA-M and TDA-C, respectively; see Table 2); and MS and MT = dry masses of soil and TDA fractions, respectively.
4.2. Oedometer Swell Tests
Oedometer swell tests were carried out in accordance with ASTM D4546–14. The prepared 50-mm diameter by 20-mm high samples were inundated with water and allowed to swell in a conventional oedometer setup under a surcharge of 7 kPa, as recommended in the research literature [38,39]. For each sample, the incurred axial swelling strain was recorded at predefined time intervals—that is, εsw(t) = ΔH(t)/H0 × 100 where ΔH(t) = increase in sample height with respect to the elapsed time of swelling t, and H0 = initial sample height—to a point at which the ultimate swelling strain, defined as the swelling potential, was achieved. For the present investigation, a swelling test duration of 10,080 min was required.
4.3. Unconfined Compression Tests
Unconfined compression tests were performed in accordance with ASTM D2166–16. The prepared 50-mm diameter and 100-mm long samples were axially compressed at a constant displacement rate of 1 mm/min, as commonly used for testing TDA mixed fine-grained soils [25,28]. For each sample, the axial strain and the corresponding mobilized axial stress were recorded at predefined time intervals to a point at which the peak axial stress, defined as the unconfined compressive strength (UCS), was fully mobilized.
5. Results and Discussion
5.1. Effects of TDA on Soil Compactability
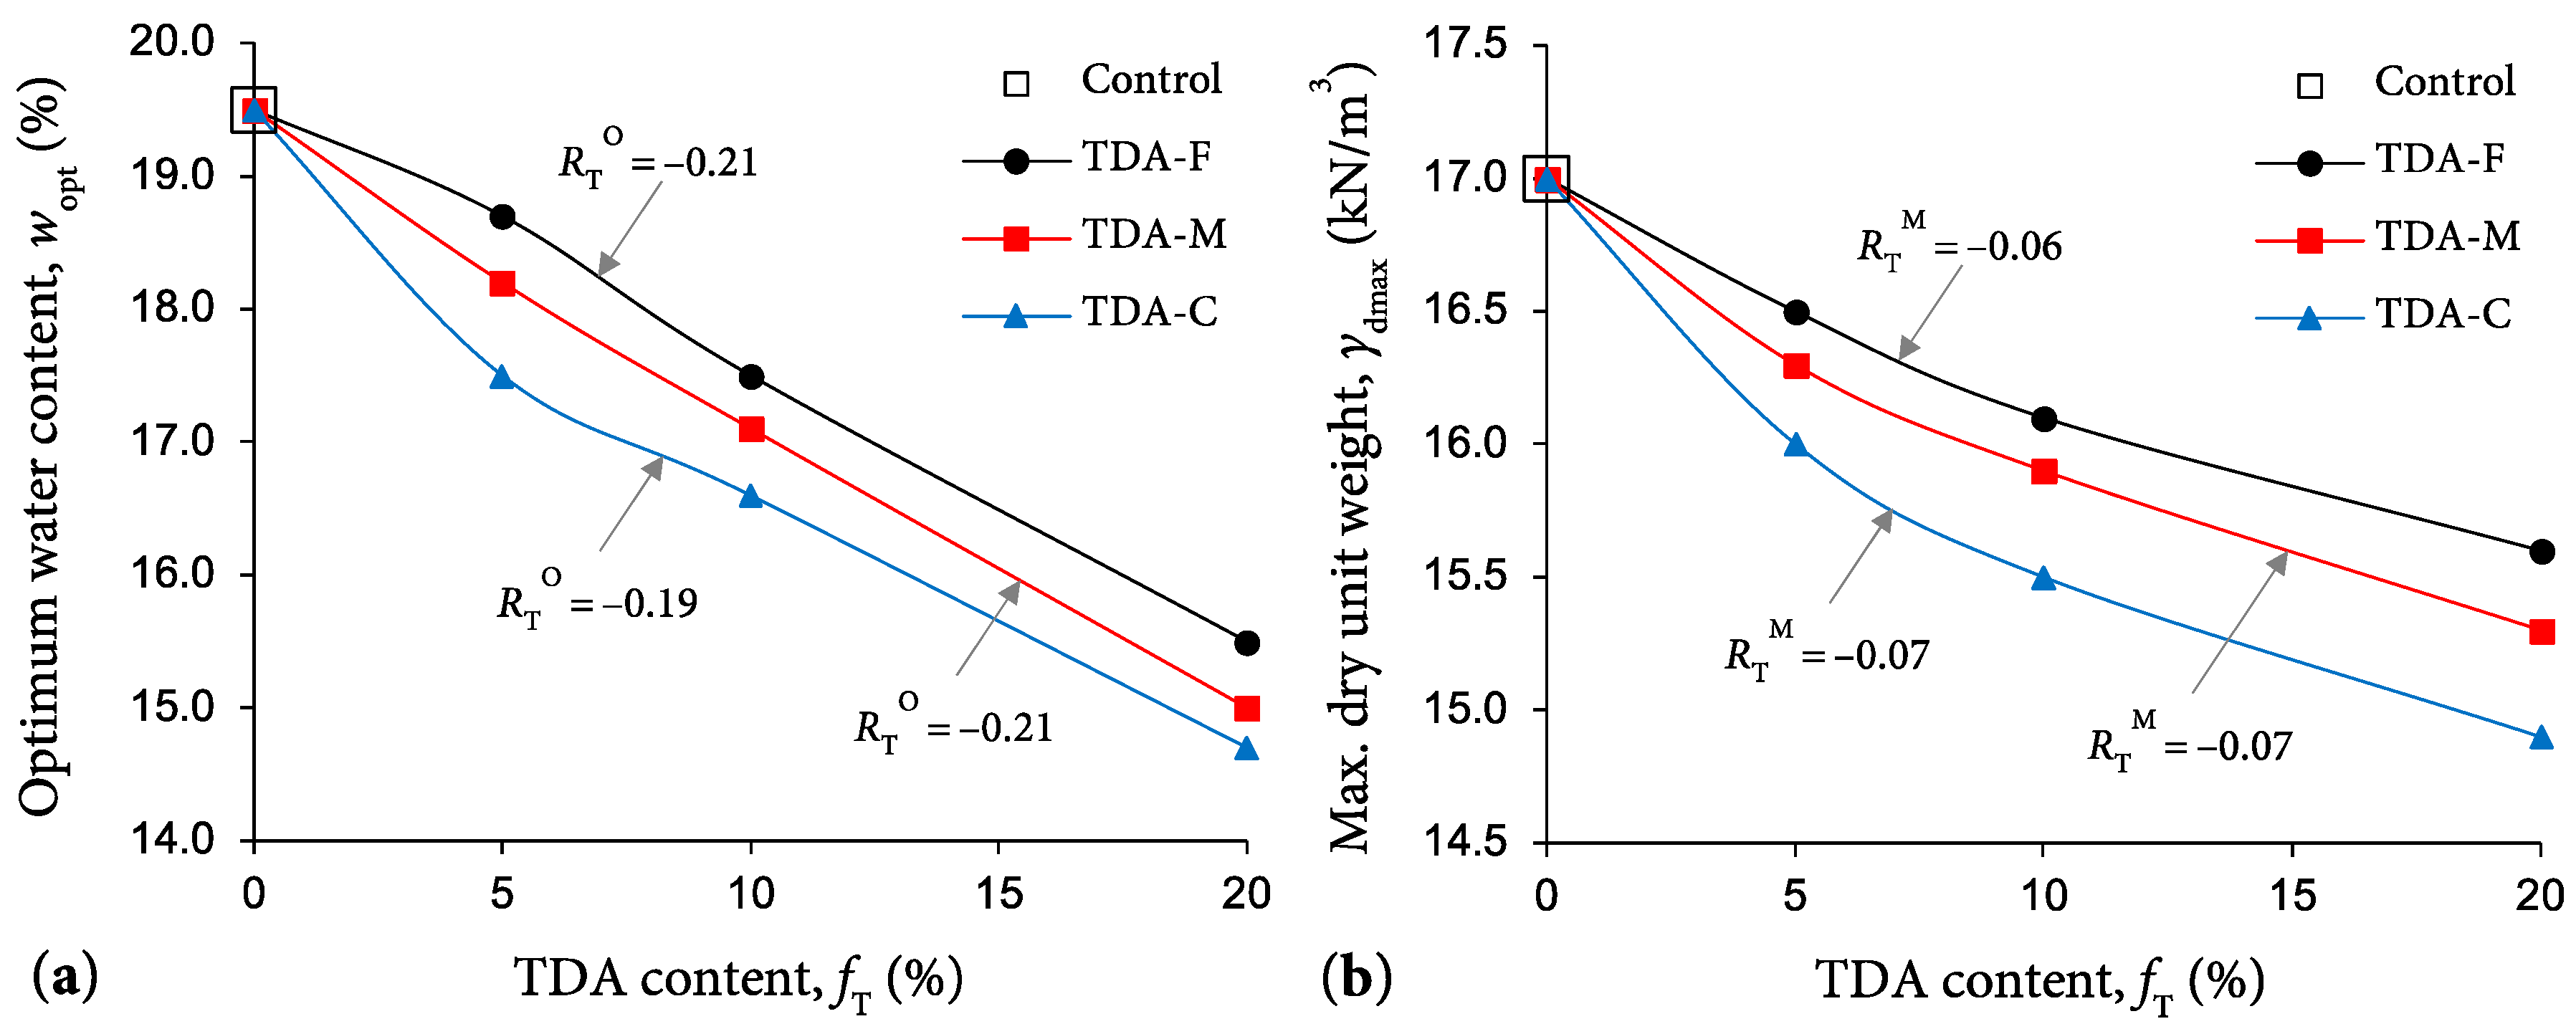
Figure 2 illustrates the variations of the compaction optimum water content wopt and maximum dry unit weight γdmax against TDA content fT for the tested mix designs. For any given TDA size, the greater the TDA content, the lower the soil compaction characteristics, with both wopt and γdmax following monotonically decreasing trends. The unamended test soil, referred to as “control” in Figure 2, resulted in γdmax = 17.0 kN/m3 for wopt = 19.5%. As typical cases highlighting the effects of TDA content; the addition of 5%, 10% and 20% TDA-M produced lower values of 16.3 kN/m3, 15.9 kN/m3 and 15.3 kN/m3 for γdmax, and 18.2%, 17.1% and 15.0% for wopt, respectively. Similarly, for any given TDA content, an increase in TDA size led to a further, yet less pronounced, decrease in the values of γdmax and wopt. For instance, the mix designs containing 10% TDA-F, TDA-M and TDA-C resulted in γdmax = 16.1 kN/m3, 15.9 kN/m3 and 15.5 kN/m3 (corresponding to wopt = 17.5%, 17.1% and 16.6%), respectively. The rates of decrease in γdmax (in kN/m3) and wopt (in %) with respect to 5% ≤ fT ≤ 20%—represented by the slope of a linear trendline fitted through a desired γdmax–fT or wopt–fT dataset—were calculated as RTM = Δγdmax/ΔfT = −0.06, −0.07 and −0.07 (see Figure 2b), and RTO = Δwopt/ΔfT = −0.21, −0.21 and −0.19 (see Figure 2a) for TDA-F, TDA-M and TDA-C, respectively. These values indicate that, for the three TDA materials examined in this study (see Figure 1), the rates of reduction in the compaction γdmax and wopt parameters are substantially independent of the TDA gradation (or D50T).
The observed reductions in the maximum dry unit weight encourage the use of TDA-based materials as a lightweight earth-fill alternative compared to traditional quarried materials (e.g., sands and gravels). The TDA materials’ lower specific gravity and hydrophobic character (water adsorption capacity < 4%) compared with those of the soil solids, and clay particles in particular, elucidate the observed reductions in the compaction characteristics [25,28,40]. Because of their high energy absorption capacity, the compacted TDA particles may gradually recover their initial (uncompacted) shapes by way of a so-called “elastic rebound” effect, thereby reducing the efficiency of the compactive effort and hence producing lower maximum dry unit weights [41]. In this regard, the larger the TDA particles, the higher their energy absorption capacity, and thus the more pronounced their elastic-rebound recovery.
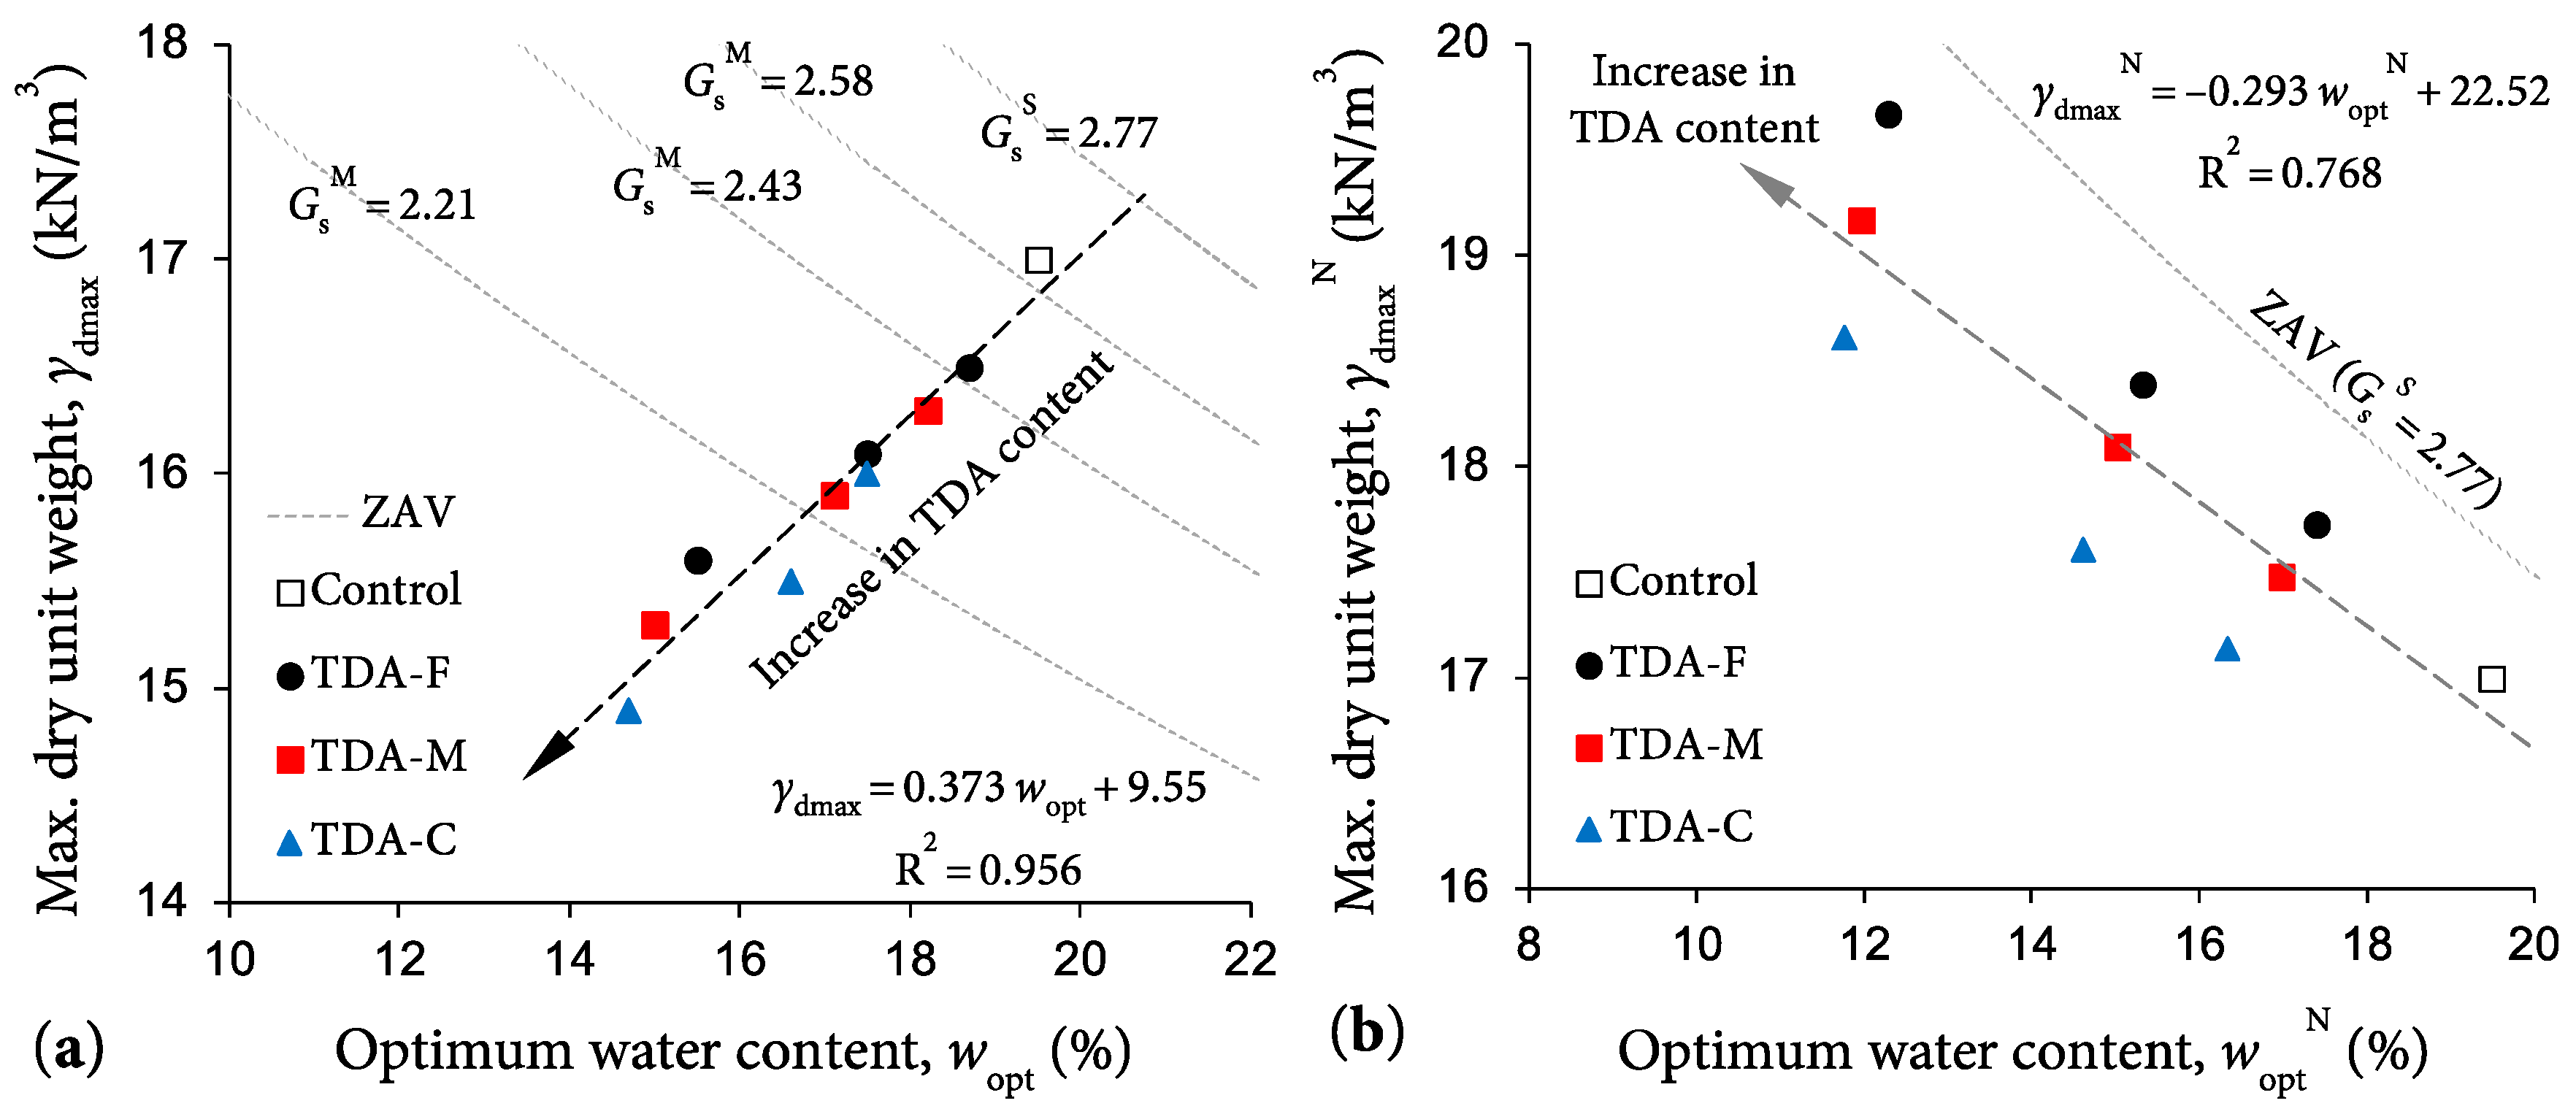
Figure 3a illustrates the variations of γdmax against wopt “the path of optimums” for the tested mix designs. As demonstrated in the figure, the optimum points followed a linear path, which can be expressed as γdmax = 0.373wopt + 9.55 (with R2 = 0.956), somewhat perpendicular to the test soil’s zero air-voids (ZAV) saturation line. Similarly, the observed linear path of optimums was found to be perpendicular to that commonly reported for natural fine-grained soils (with varying coarse fractions) tested under the same standard Proctor conditions—that is, γdmax = −0.260wopt + 21.61 [42]. For a natural fine-grained soil, the addition of a coarse fraction (>75 μm) leads to an “upward–leftward” translation of the compaction curve, and hence the optimum point, over the γd:w space. For the soil–TDA blends, however, an increase in TDA content, which for the present investigation is essentially similar to increasing the soil coarse fraction, promotes a “downward–leftward” translation of the optimum point. This discrepancy can be attributed to the lower specific gravity of the TDA materials (i.e., GsT = 1.08, 1.10 and 1.11 for TDA-F, TDA-M and TDA-C, respectively; see Table 2) compared to that of soil solids (i.e., GsS = 2.77; see Table 1). To achieve a more familiar visualization of the compaction characteristics of TDA-based blends, consistent with the traditionally understood soil compaction framework, the maximum dry unit weight and optimum water content for the soil–TDA blends should be redefined as follows [43,44]:
where γdmaxN = normalized maximum dry unit weight; woptN = normalized optimum water content; GsS = specific gravity of soil solids (=2.77, as reported in Table 1); and GsM = specific gravity of the soil–TDA blends, obtained by Equation (1) and reported in Table 3.
Figure 3b illustrates the variations of γdmaxN against woptN for the tested mix designs. As expected, the normalized compaction parameters were found to follow a path which can be expressed as γdmaxN = −0.293woptN + 22.52 (with R2 = 0.768), similar to that of natural fine-grained soils.
5.2. Effects of TDA on Swelling Potential
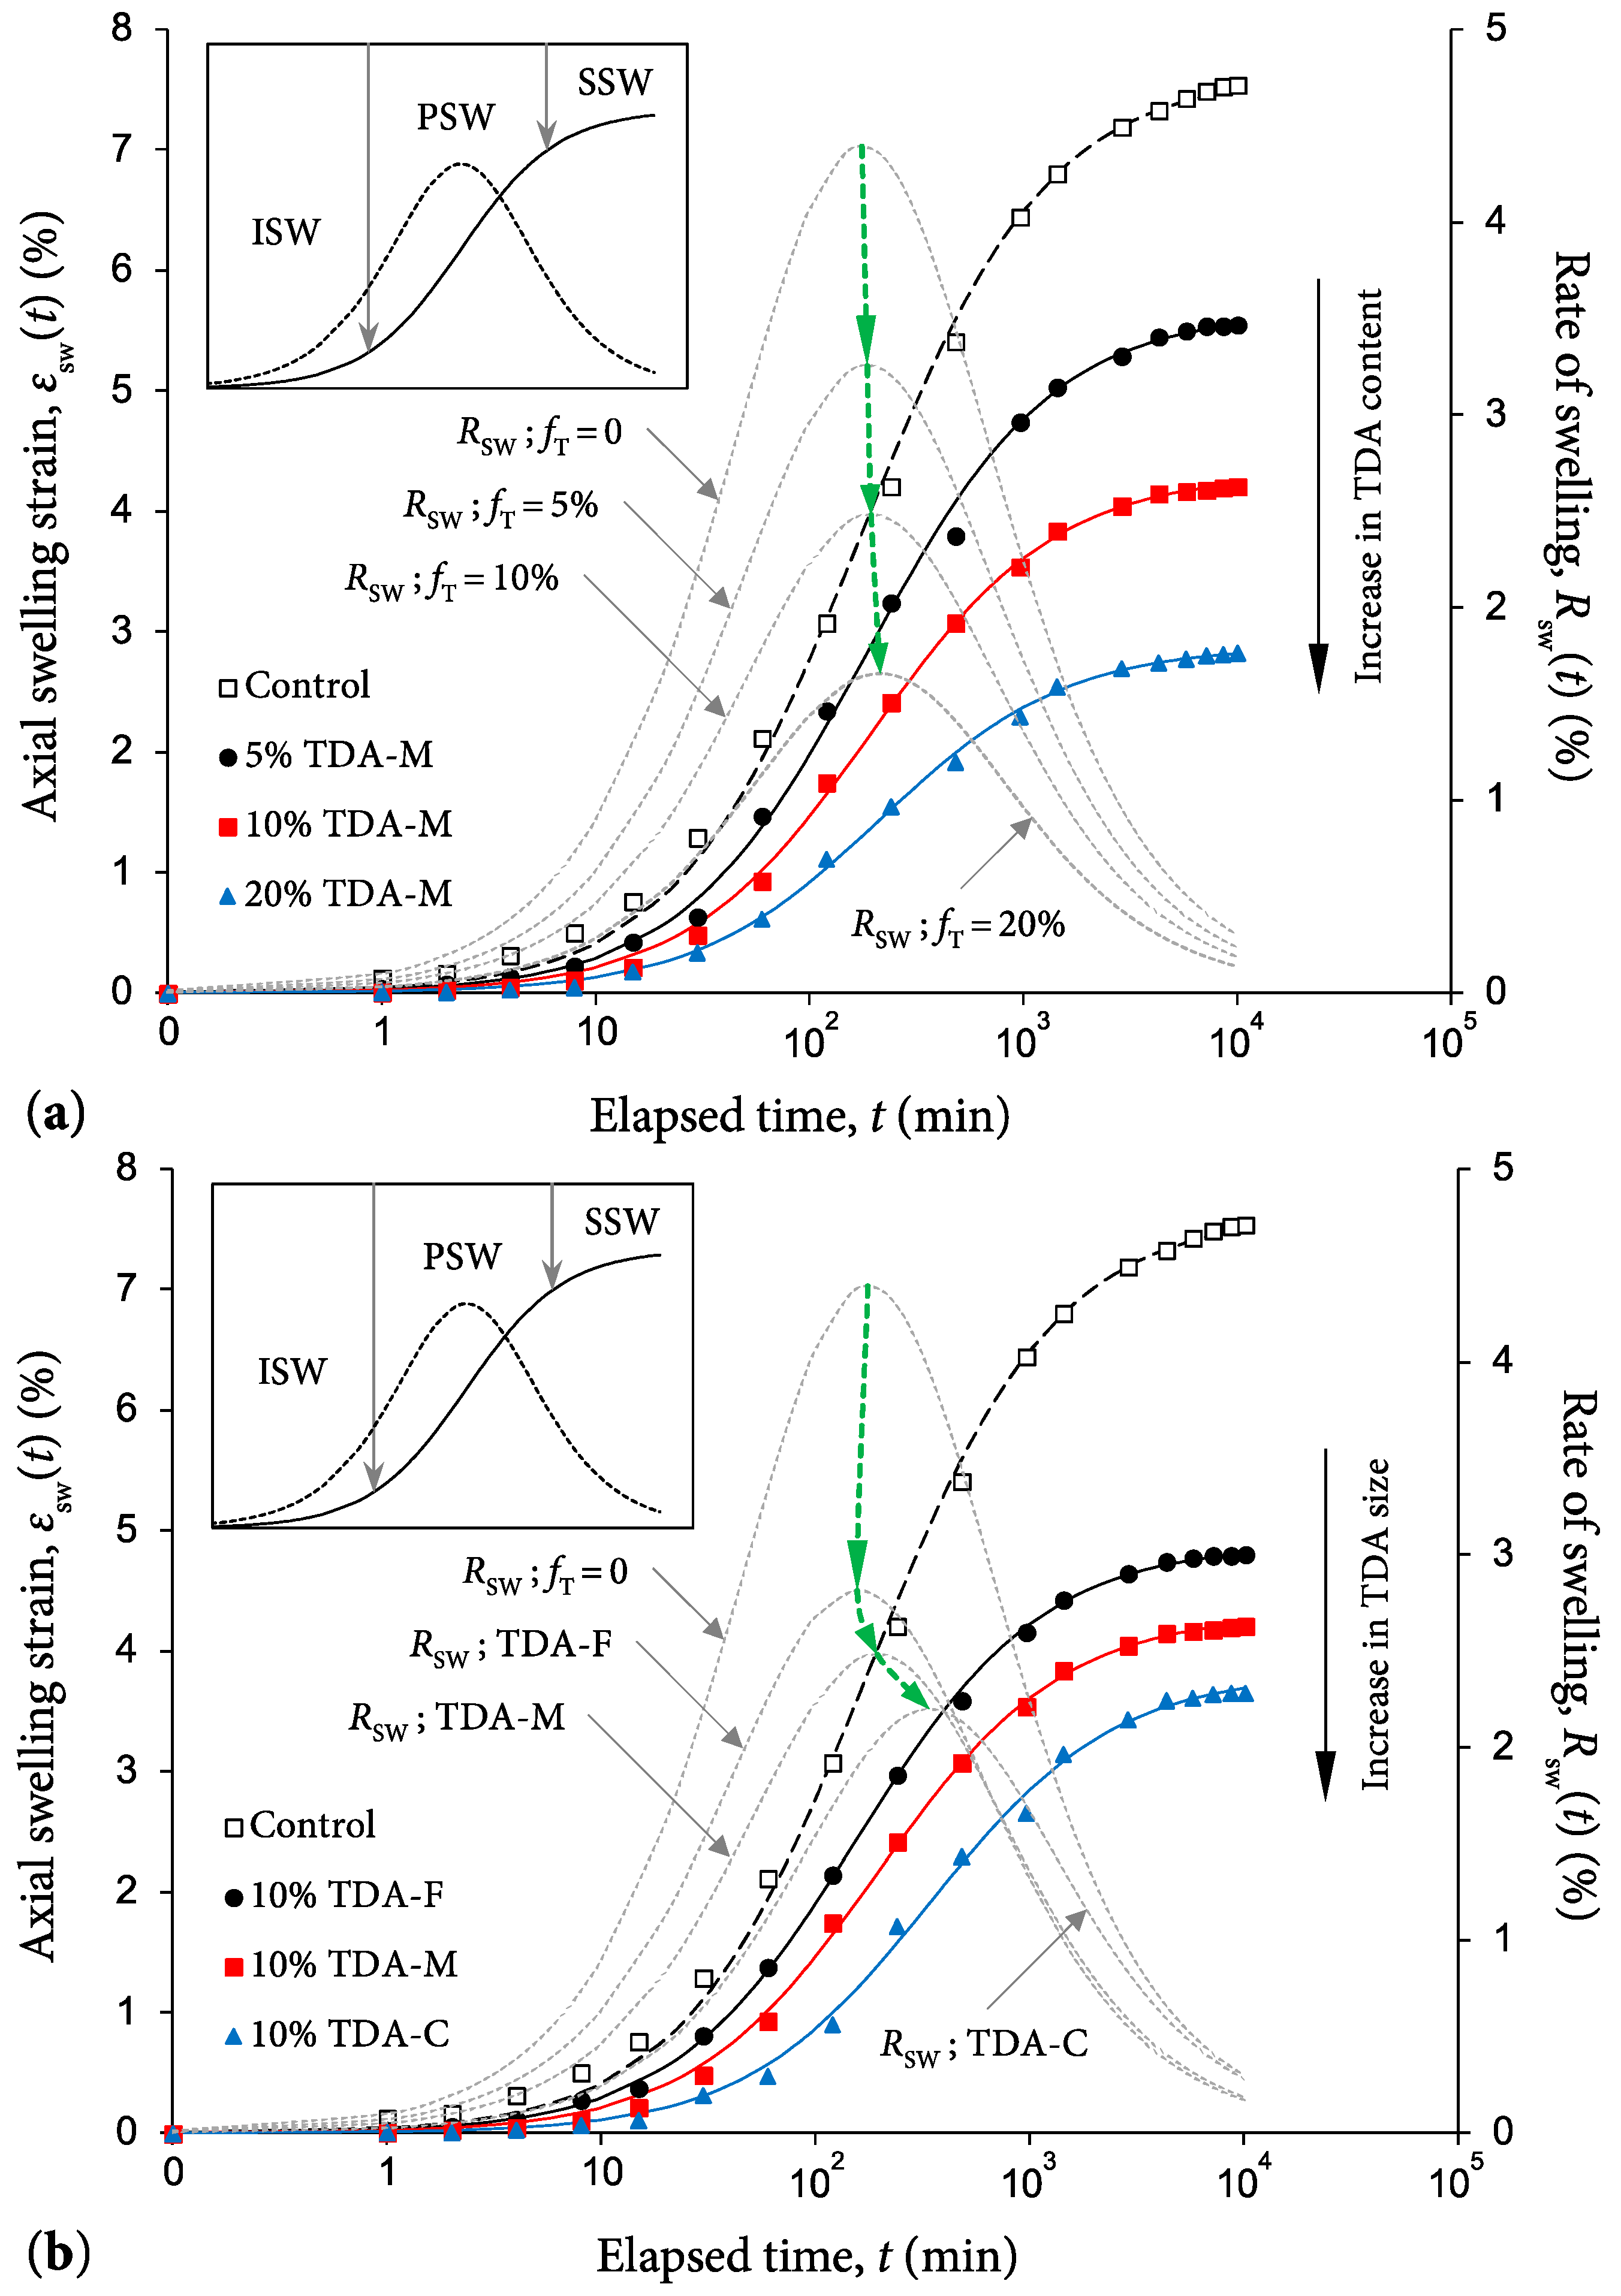
Figure 4 illustrates typical swell–time relationships—plotted over the εsw:Logt space (where εsw = axial swelling strain, and t = elapsed time of swelling)—for the unamended test soil (control) and various TDA-blended samples. The swell–time relationships were found to follow S-shaped paths, thereby suggesting the existence of three distinct phases during swell evolvement. For ease of presentation and analysis, the S-shaped swell–time path was represented using the rectangular hyperbola function, which can be expressed as follows [14,39,45]:
where εsw(t) = axial swelling strain (in %) with respect to the elapsed time of swelling t (in min); and α and β = fitting parameters (α in %−1min, and β in %−1). It should be noted that t = α/β and εsw = 1/2β represent the curve’s inflection point over the εsw:Logt space.
The regression analyses outputs with respect to Equation (4) are summarized in Table 4. The rate of swelling with respect to the elapsed time can be obtained as the first derivative of Equation (4) with respect to Logt [46]:
where Rsw(t) = rate of swelling (in %) with respect to the elapsed time of swelling t (in min).
As demonstrated in Figure 4, the swelling process entails three distinct stages—that is, initial, primary and secondary swelling [3,26,39,45,47]. The initial swelling (ISW) phase, often referred to as intervoid swelling, takes place at the macrostructural level where active clay minerals, such as montmorillonite, expand within the soil interassemblage voids. It progresses until such time that the interassemblage voids are no longer capable of accommodating further clay mineral expansion. As such, this first swelling phase is normally associated with a relatively minor swelling strain, often less than 10% of the ultimate swelling strain (or swelling potential). The primary swelling (PSW) phase progresses at the microstructural level. It is graphically represented by a steep-sloped linear segment over the εsw:Logt space, and thus signifies a substantially steady rate of swelling with respect to the elapsed time. This swelling phase often accounts for up to 80% of the swelling potential. The secondary swelling (SSW) phase also evolves at the microstructural level, taking place as a result of double-layer repulsion, and accounts for small time-dependent increases in the soil volume.
In view of the above, the swelling rate Rsw(t) was found to develop into a bell-shaped curve, peaking within the PSW region (at the inflection point of the S-shaped curve) and then decreasing as the swelling process transitions from the PSW to the SSW stage. Referring to Figure 4a, which highlights the effects of TDA content on the swell–time behavior; at any given elapsed time of swelling, the greater the TDA content, the lower the magnitude and rate of swelling. Similarly, for any given TDA content, an increase in TDA size was found to decrease the soil’s swelling strain magnitude and rate, albeit to lesser degrees (see Figure 4b). Unlike TDA content, the role of TDA gradation/size in reducing the rate of swelling was notable only within the ISW and PSW regions; for the SSW stage, the rate of swelling for the three TDA gradations examined in this study (see Figure 1) was found to be rather similar. As demonstrated in Figure 4a, for any given TDA size, changes in the TDA content within the investigated range of 5% ≤ fT ≤ 20% did not significantly affect the time required to achieve the maximum swelling rate. On the contrary, the coarser the TDA material, the longer the time required to attain the maximum swelling rate (see Figure 4b).
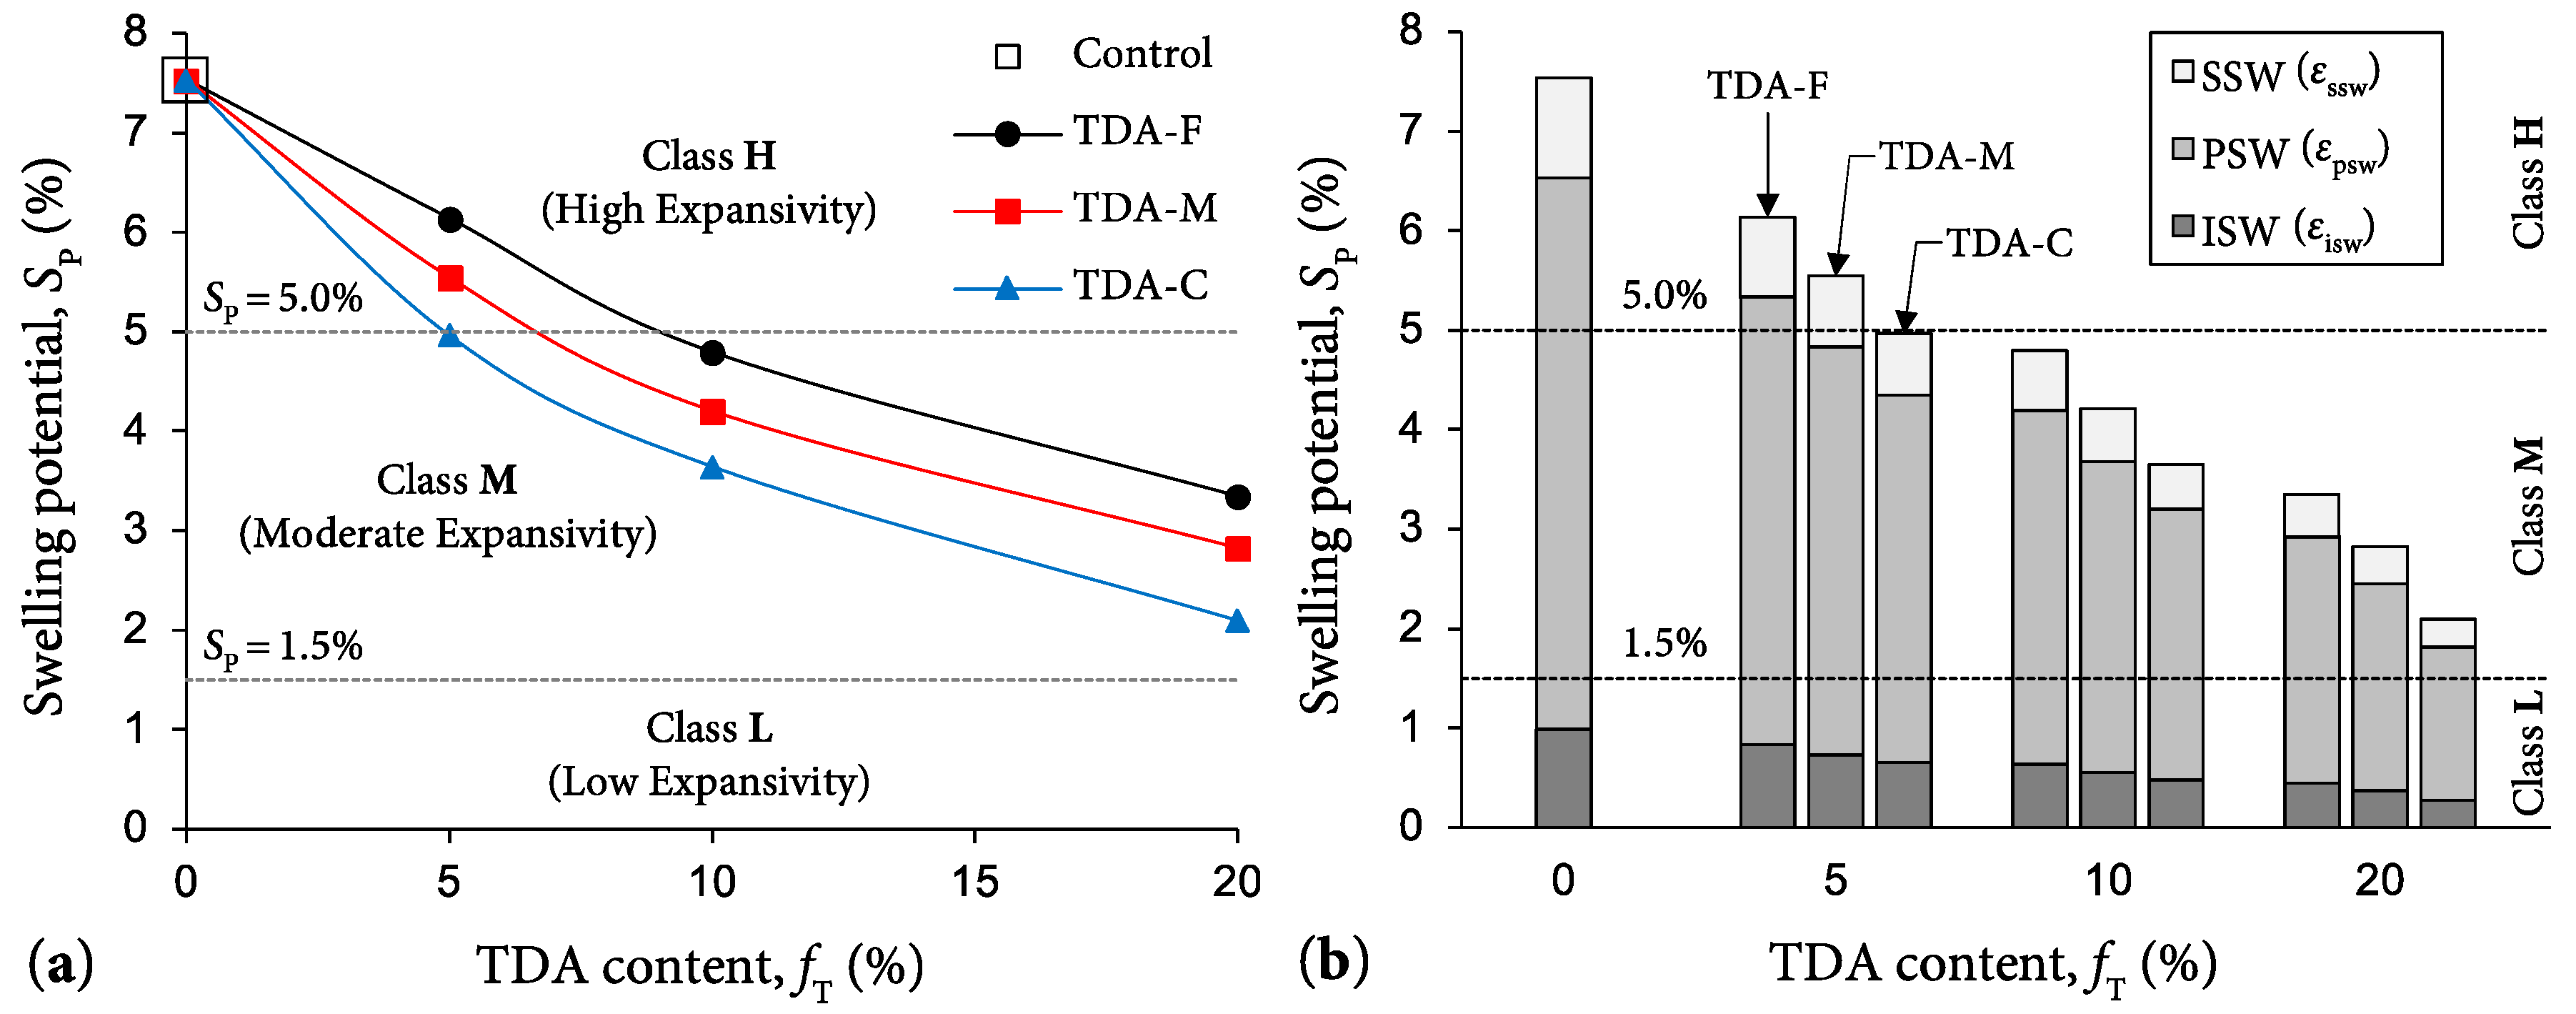
Figure 5a illustrates the variations of the ultimate swelling strain, i.e., swelling potential SP, against TDA content for the tested mix designs. For any given TDA size, the greater the TDA content, the lower the swelling potential, following a monotonically decreasing trend. The unamended soil sample (control) resulted in SP = 7.54%. As typical cases highlighting the effects of TDA content; the use of 5%, 10% and 20% TDA-M led to lower values of 5.55%, 4.21% and 2.82%, respectively. Similarly, an increase in TDA size (for any given TDA content) led to a further, yet less pronounced, decrease in the soil’s swelling potential. For instance, the samples blended with 10% TDA-F, TDA-M and TDA-C resulted in SP = 4.80%, 4.21% and 3.65%, respectively. The rate of decrease in SP with respect to 5% ≤ fT ≤ 20% was calculated as RTS = ΔSP/ΔfT = −0.18, −0.18 and −0.19 for TDA-F, TDA-M and TDA-C, respectively. Accordingly, for the three TDA gradations examined in this study (see Figure 1), the rate of reduction in swelling potential is independent of the TDA size (or D50T).
In view of the three swelling stages described above, the swelling potential can be subdivided into the initial, primary and secondary swelling strains—that is, SP = εisw + εpsw + εssw. Figure 5b illustrates the variations of εisw, εpsw and εssw against TDA content for the tested mix designs. In general, the variations of the initial, primary and secondary swelling strains were all found to follow a trend similar to that observed for the swelling potential. The swelling potential can be employed to specify the soil degree of expansivity [38]. Corresponding classifications for the unamended soil and various TDA-blended samples—obtained in accordance with the classification framework suggested by Seed et al. [36] (see Table A1 of Appendix A)—are outlined in Figure 5. The unamended soil sample can be classified as “highly expansive”. The samples containing 5% TDA-F and TDA-M produced the same “highly expansive” classification, whereas the addition of 5% TDA-C led to an improved classification of “moderately expansive”. Beyond 5% TDA, regardless of the TDA size investigated, all samples were found to be “moderately expansive”.
It is customary to interpret the time-dependent nature of the swelling phenomenon by means of the primary and secondary swelling coefficients, i.e., Cpsw and Cssw, respectively. These two coefficients can be defined as follows [26,39]:
where tisw, tpsw and tssw = completion times (from t = 0) of the ISW, PSW and SSW stages, respectively; and εpsw and εssw = primary and secondary swelling strains, respectively (data provided in Figure 5b).
Making use of Equations (4) and (5), along with basic geometrical laws, the parameters tisw and tpsw can be quantified using the following explicit relationships (values presented in Table 4) [46]:
where εsw(t0) and Rsw(t0) = axial swelling strain and rate of swelling at the start time of recording, which can be obtained by substituting t0 = 1 min into Equations (4) and (5), respectively; and εsw(t1) and Rsw(t1) = axial swelling strain and rate of swelling at the end time of recording, which can be obtained by substituting t1 = tssw = 10,080 min into Equations (4) and (5), respectively.
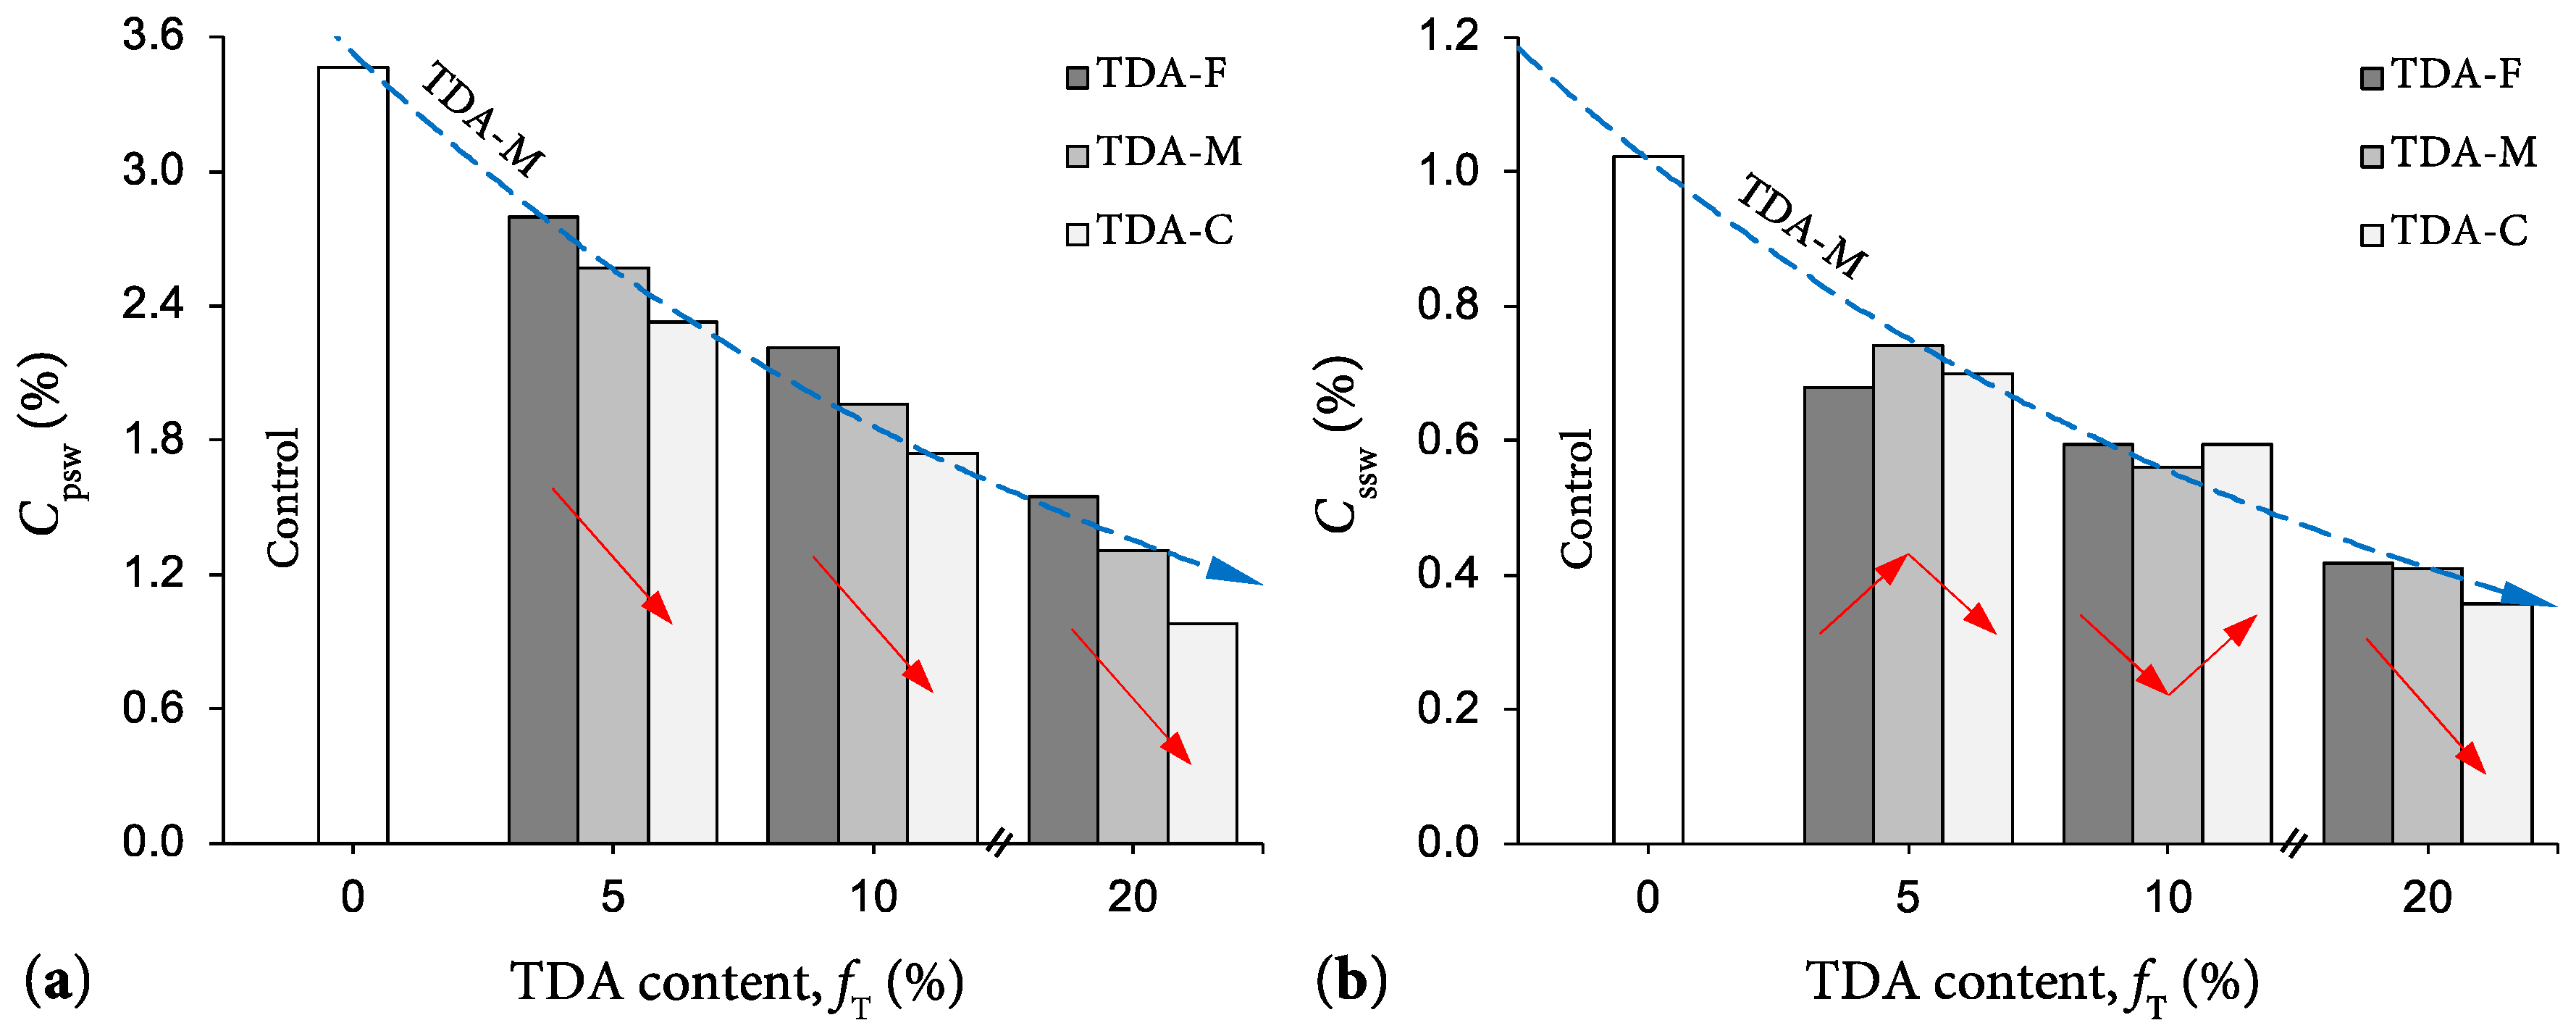
Figure 6a,b illustrates the variations of Cpsw and Cssw against TDA content for the tested mix designs. Much like the swelling potential, for any given TDA size, the greater the TDA content, the lower the swelling coefficients, further confirming the TDA materials’ capability to counteract the heave in both magnitude and rate (e.g., see the trend curves “TDA-M” in Figure 6). As typical cases, the unamended soil and various TDA-blended samples prepared with 5%, 10% and 20% TDA-M resulted in Cpsw = 3.46%, 2.57%, 1.96% and 1.31%, and Cssw = 1.02%, 0.74%, 0.56% and 0.41%, respectively. For any given TDA content, the tendency for reduction in the Cpsw parameter was in favor of larger TDA sizes (see the arrowed lines in Figure 6a). The same, however, was not observed for Cssw, as the effects of TDA gradation (or D50T) was found to be rather marginal (see the arrowed lines in Figure 6b). For instance, the samples blended with 10% TDA-F, TDA-M and TDA-C resulted in Cpsw = 2.22%, 1.96% and 1.74%, and Cssw = 0.60%, 0.56% and 0.59%, respectively. It should be noted that these observations are in agreement with the observed general trends for the Rsw(t) parameter in Figure 4.
5.3. Effect of TDA on Soil Compressive Strength
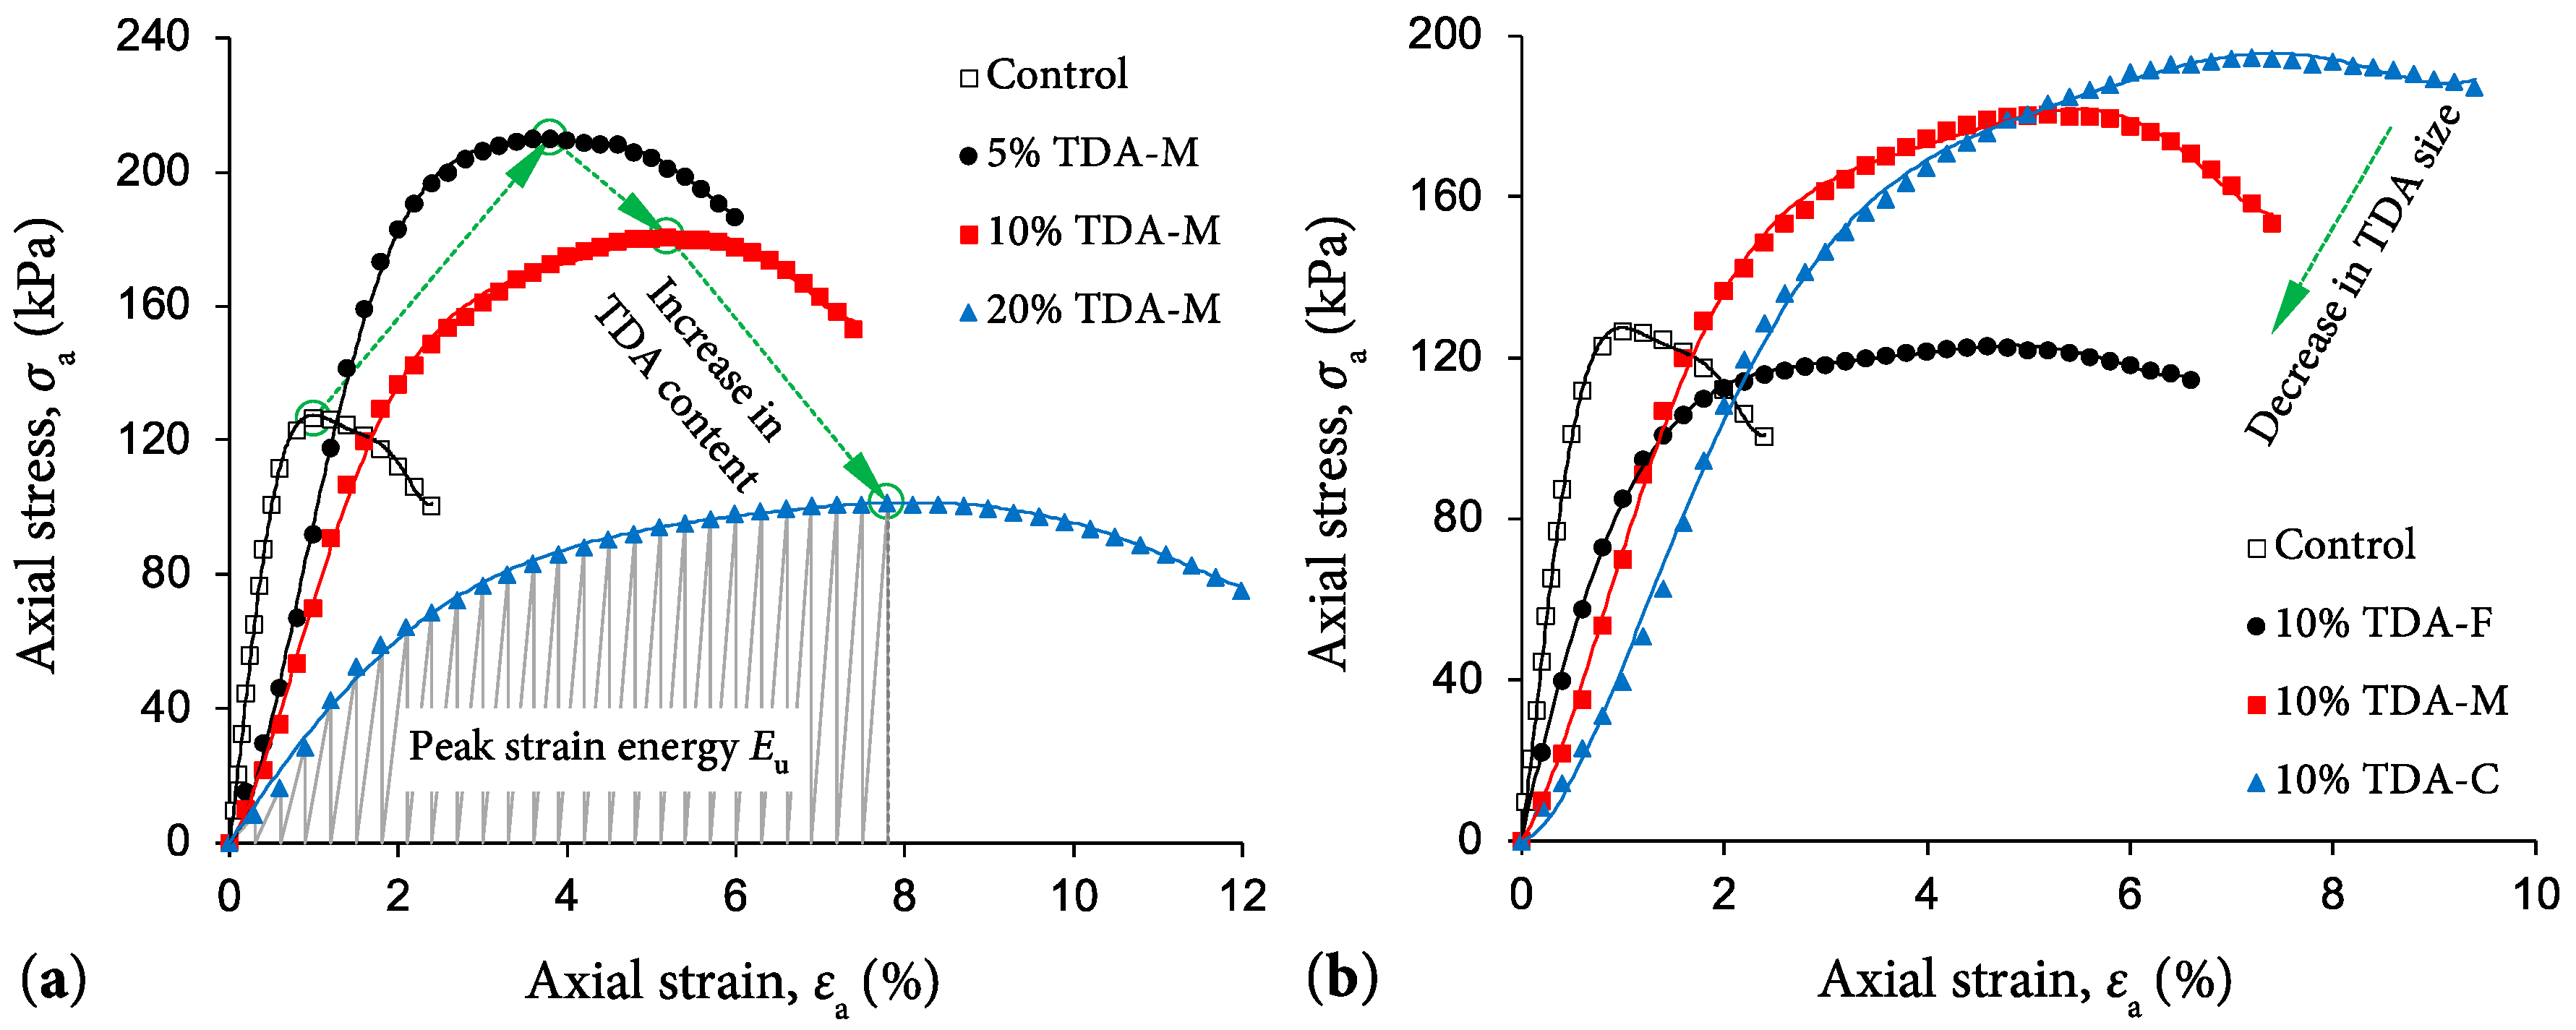
Typical stress–strain curves for the unamended soil (control) and various TDA-blended samples prepared with TDA-M are presented in Figure 7a. The constitutive response for the unamended soil sample exhibited a rise–fall trace with a visually-identifiable peak point, signifying a strain-softening behavior leading to a brittle failure mode. As a result of increasing the TDA content, the stress–strain locus progressively transitioned towards a strain-hardening (or more ductile) character, as reflected in the axial strain at peak parameter increasing in magnitude with the TDA content (follow the arrowed lines in Figure 7a). This transitional mechanism can be ascribed to the lower stiffness and higher deformability of the soil solids–TDA agglomerations compared with that of the aggregated soil solids of the unamended soil (control) [2,21,28]. Referring to Figure 7b, which highlights the effects of TDA gradation on the stress–strain response; an increase in TDA size was also found to enhance the soil’s axial strain at peak and hence its strain-hardening character (see the arrowed line in Figure 7b).
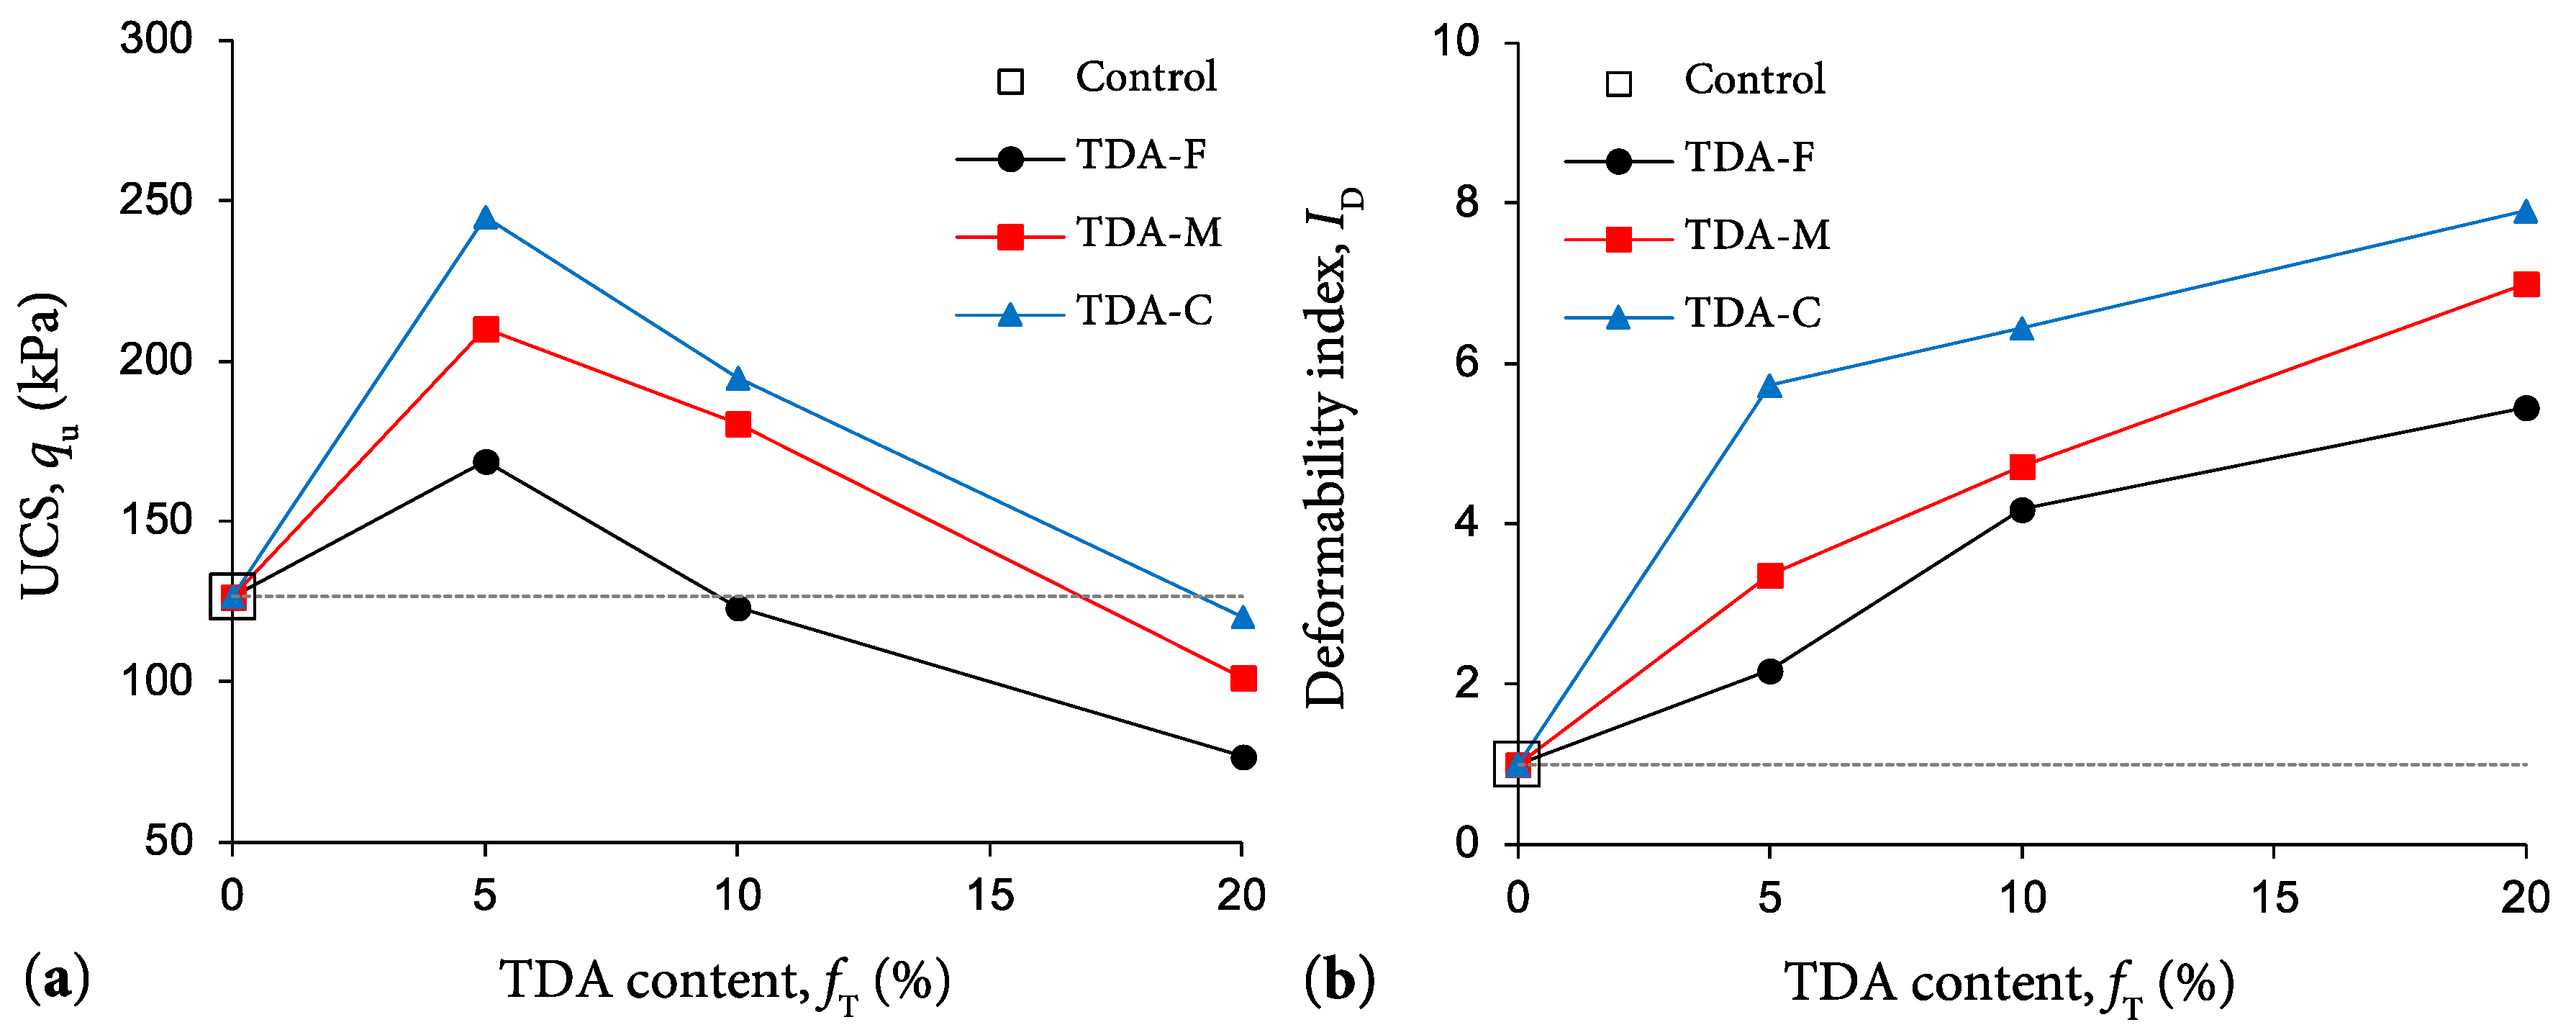
Figure 8a illustrates the variations of the UCS qu against TDA content for the tested mix designs. For any given TDA size, the variations of the UCS parameter with respect to TDA content demonstrated a rise–fall relationship, peaking at fT = 5% and then decreasing for higher TDA contents. Although the highest UCS values were recorded for fT = 5%, the samples prepared with 10% TDA-M and TDA-C were still able to outperform (in terms of mobilized UCS) the unamended soil by comfortable margins. The addition of 10% TDA-F, however, produced a UCS similar to that obtained for the unamended soil. The samples containing 20% TDA-F and TDA-M were found to produce markedly lower UCS values compared with that of the unamended soil, while the same 20% inclusion of TDA-C was essentially on par with the unamended soil. As typical cases, the unamended soil and various TDA-blended samples containing 5%, 10% and 20% TDA-M resulted in qu = 126.7 kPa, 210.2 kPa, 180.7 kPa and 101.4 kPa, respectively. For any given TDA content, an increase in TDA size promoted a notable improvement in the UCS, hence indicating a TDA size-dependent amending mechanism. For instance, the samples blended with 10% TDA-F, TDA-M and TDA-C produced UCS values of 123.1 kPa, 180.7 kPa and 194.9 kPa, respectively.
Improvement in composite ductility is often interpreted by means of the deformability index. For the problem at hand, the deformability index ID can be defined as follows [2,48]:
where εuN = axial strain at peak for the unamended soil sample (=1.1%, as shown in Figure 7); and εuT = axial strain at peak for the TDA-blended sample.
The variations of the deformability index against TDA content for the tested mix designs are presented in Figure 8b. Unlike the UCS, the deformability index exhibited a monotonically increasing trend with the TDA content, and as such, the greater the TDA content, the more ductile the soil’s response to unconfined compression. By definition, the unamended soil sample has a deformability index of ID = 1.0 (εuN = 1.1%). As typical cases, the samples prepared with 5%, 10% and 20% TDA-M resulted in ID = 3.4, 4.7 and 7.0 (εuT = 3.7%, 5.2% and 7.7%), respectively. Interestingly, an increase in TDA size was also found to considerably enhance composite ductility. For instance, the samples blended with 10% TDA-F, TDA-M and TDA-C resulted in ID = 4.2, 4.7 and 6.5 (εuT = 4.6%, 5.2% and 7.1%), respectively.
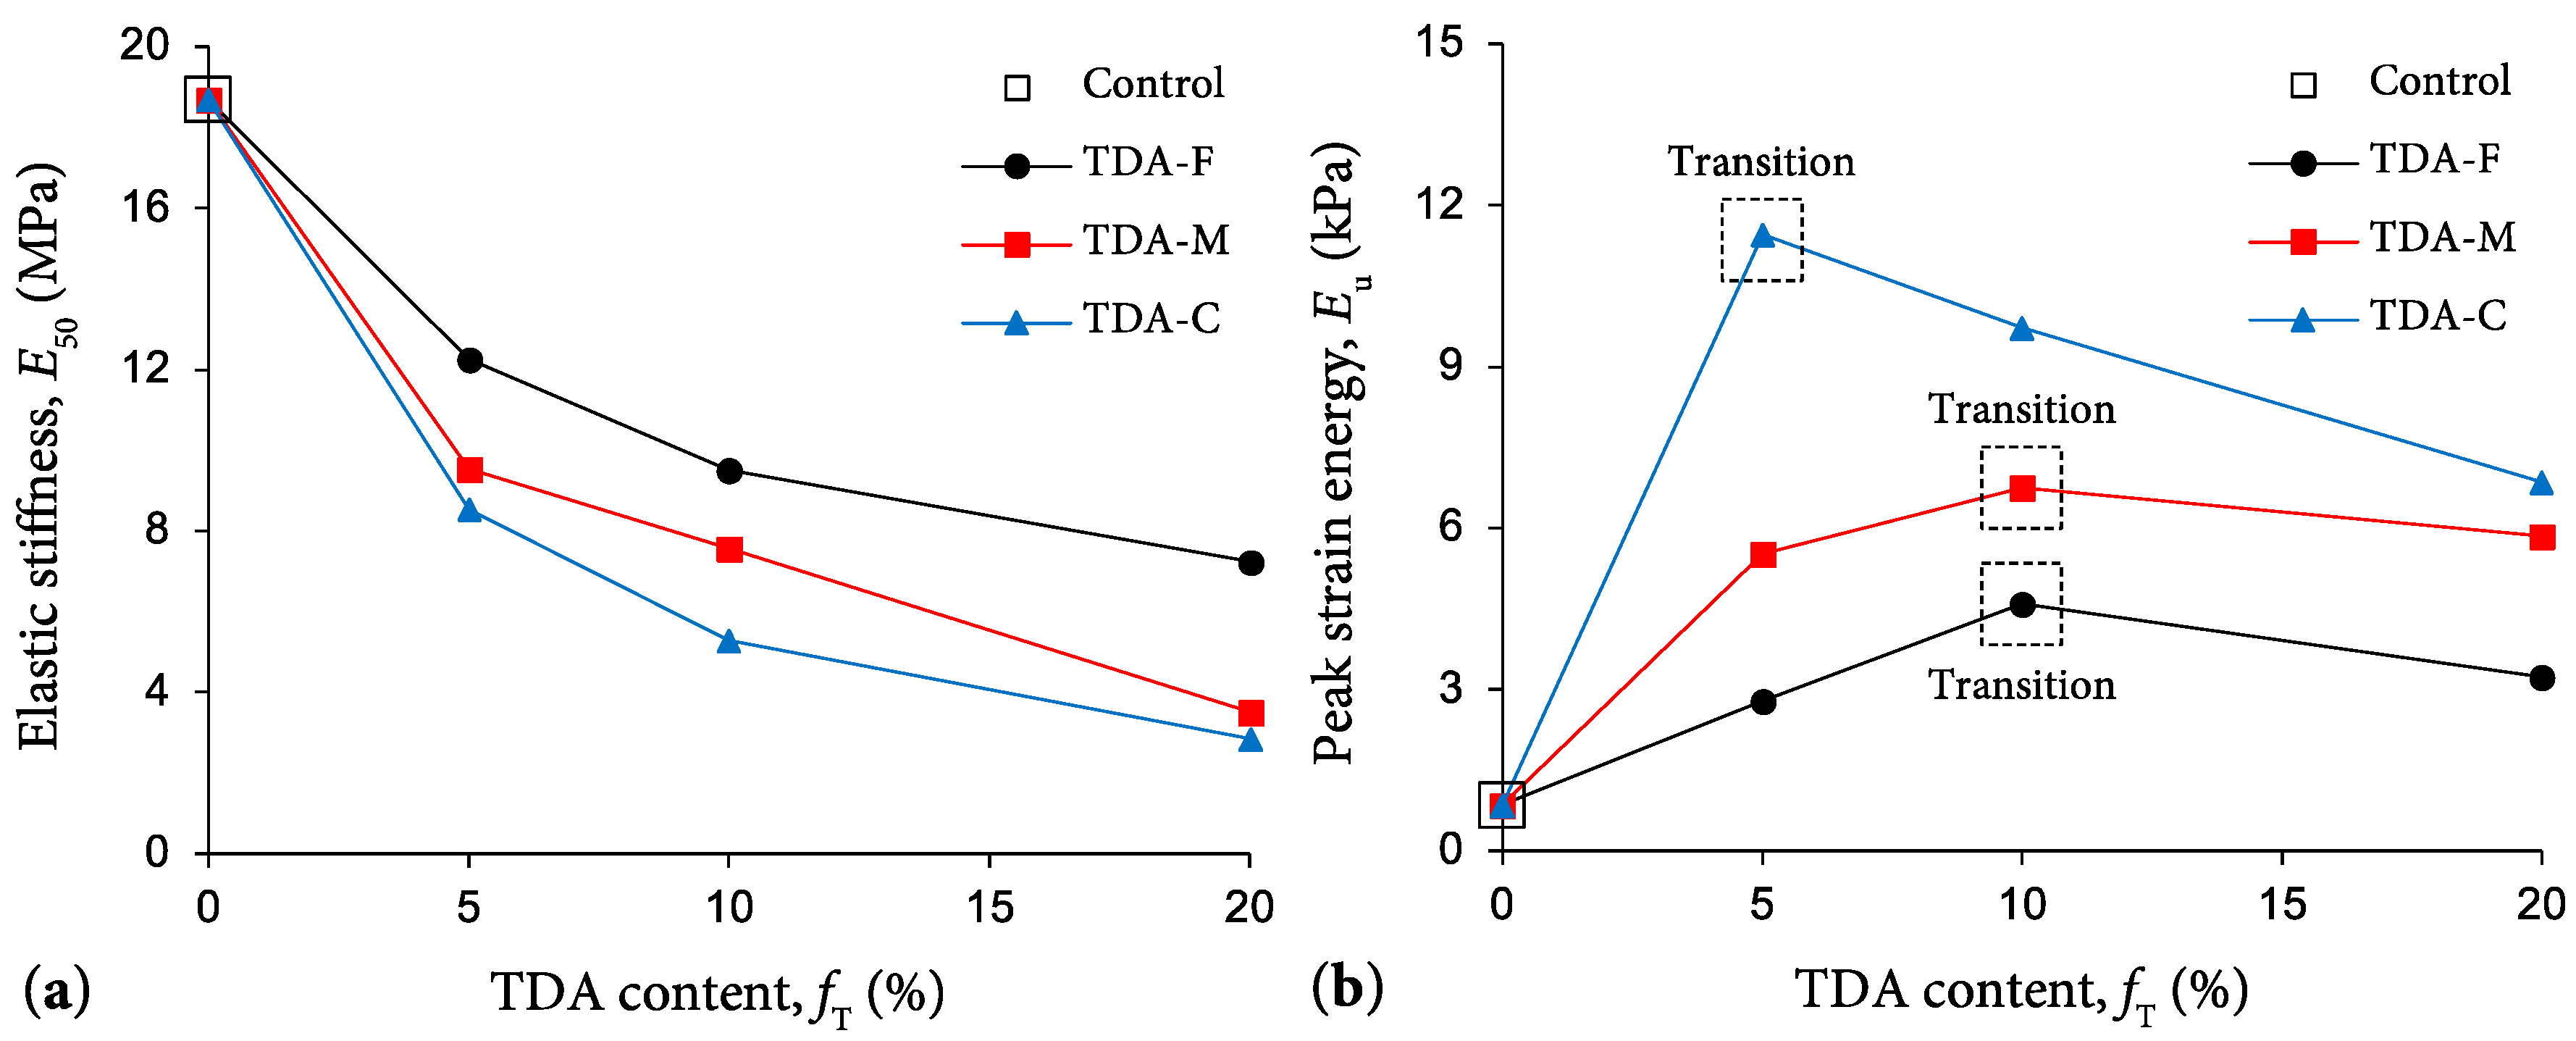
Figure 9a illustrates the variations of the elastic stiffness modulus E50—defined as the secant modulus at 50% of the UCS [49]—against TDA content for the tested mix designs. In general, the variations of the E50 parameter exhibited a trend similar to that observed for the deformability index (or axial strain at peak); however, in an adverse manner. As such, the greater the TDA content and/or the coarser its particles, the lower the developed stiffness, attributed to the lower stiffness of the soil solids–TDA agglomerations compared with that of the aggregated soil solids of the unamended soil (control) [2,21,28]. The unamended soil sample resulted in E50 = 18.7 MPa. When blended with 5%, 10% and 20% TDA-M, for instance, the E50 parameter dropped to 9.6 MPa, 7.6 MPa and 3.5 MPa, respectively. Similarly, the samples prepared with 10% TDA-F, TDA-M and TDA-C produced E50 values of 9.5 MPa, 7.6 MPa and 5.3 MPa, respectively.
The variations of peak strain energy Eu—defined as the area under the stress–strain curve up to mobilization of the UCS or qu (e.g., see the shaded area for 20% TDA-M in Figure 7a), which signifies the sample’s energy absorption capacity, and hence its toughness, up to that point [50]—against TDA content for the tested mix designs are presented in Figure 9b. Simpson’s rule for numerical integration was used to calculate the area under the stress–strain curve up to mobilization of the UCS (and hence the Eu parameter). It should be mentioned that, with the axial stress σa in kPa and the dimensionless form of the axial strain εa (i.e., not in %) used in these calculations, the Eu parameter is obtained in kPa. By definition, an increase in toughness can be achieved by increases in the UCS and/or the axial strain at peak [17,51]. As demonstrated in Figure 8, the deformability index (and hence the axial strain at peak) was consistently in favor of higher TDA contents, whereas TDA contents greater than 5% adversely influenced the UCS. In view of these opposing actions, for any given TDA size, the role of TDA content in improving the toughness was positive only up to a certain (or optimum) content, beyond which the toughness exhibited a decreasing trend with the TDA content. In this regard, the optimum TDA content was found to be 5% for TDA-C, and 10% for both TDA-M and TDA-F (see the dotted squares denoted as “Transition” in Figure 9b). These results indicate that the magnitude of reduction associated with the UCS at fT > 5% for TDA-C and fT > 10% for both TDA-M and TDA-F outweighed the magnitude of improvement associated with the axial strain at peak (or deformability index). Moreover, for any given TDA content, an increase in TDA size enhanced composite toughness by way of increasing both the UCS and the axial strain at peak—that is, the coarser the TDA particles, the higher the UCS and ductility of the soil–TDA blends (see Figure 8). The unamended soil sample resulted in Eu = 0.9 kPa. When blended with 5%, 10% and 20% TDA-M, for instance, the peak strain energy changed to 5.5 kPa, 6.8 kPa and 5.8 kPa, respectively. As typical cases highlighting the positive effects of TDA size, the samples prepared with 10% TDA-F, TDA-M and TDA-C produced Eu values of 4.6 kPa, 6.8 kPa and 9.7 kPa, respectively.
5.4. Soil–TDA Interactions
Previous studies have mainly discussed clay–TDA interactions in a way similar to that of clay–sand mixtures, attempting to link the variations of the UCS to changes in cohesion and friction. However, the terminologies employed in this context, such as “interparticle cohesion” and “interparticle friction”, are often vague, as they do not explicitly clarify which components of the TDA-blended composite are actually involved in the development of cohesion and friction [2,23,28,29,35]. Conventionally, for clay–sand mixtures, the loss of cohesion at low sand contents is often small, while the increase in friction can be high; consequently, the UCS can increase. As the sand content increases, the loss of cohesion becomes more significant and begins to dominate the increase in friction, such that the UCS begins to decrease [52,53,54,55].
Quite clearly, there are significant differences between clay–sand mixtures and the examined clay–TDA blends in the present investigation. Firstly, for the sample preparation method employed here (and with the 5–20% TDA contents), on water addition, the dry-mixed soil and TDA particles aggregate, forming soil–TDA agglomerations, such that the TDA particles can be visualized as embedded coarse-grained “isolated solid inclusions”. Secondly, the embedded TDA particles themselves have greater deformability (or lower rigidity) compared to that of the soil solids, considering these mixtures are compacted at optimum conditions, such that compared with individual soil agglomerations (0% TDA), individual soil–TDA agglomerations possess substantially lower stiffness. This significant mismatch in relative stiffness between the soil solids and embedded TDAs gives the soil–TDA agglomerations a so-called “friable” nature, such that in unconfined compression, the soil–TDA samples undergo greater radial expansion (producing greater values of axial strain at peak), and mobilize lower E50 values (see Figure 8b and Figure 9a). Consequently, a new take on the clay–sand mixture analogy is required to explain the rise–fall behavior of the UCS with respect to TDA content, as well as the effects of TDA size, observed in the present experimental investigation.
Starting with 0% TDA, the UCS capacity mobilized due to cohesion of the soil solids matrix (soil undrained strength) reduces with increasing TDA content, such that for the limiting case—that is, a 100% TDA sample—and soil with very high TDA contents (>>20%), the resistance capacity resulting from frictional (granular) behavior provided by the skeleton of contacting TDA particles would mobilize negligible UCS. Accordingly, a 100% TDA sample and soil with very high TDA contents (>>20%) would have negligible E50. In transitioning from these dominant “cohesive” to “frictional” type behaviors, an intermediate scenario occurs whereby the UCS capacity, when considered at the soil–TDA agglomeration-scale level, is provided by the combination of the cohesion resistance of its soil solids matrix and an adhesion resistance (interface undrained strength) developed at the surfaces of the isolated embedded TDA particles. Since the adhesion resistance (soil–TDA interface) is less than the cohesion resistance (soil–soil interface), compared to the overall cohesion resistance of an individual soil agglomeration (0% TDA), the combined cohesion–adhesion resistances for the soil–TDA agglomeration would be lower overall and progressively reduces with increasing TDA content. In terms of deformability behavior, one could postulate that, for the compacted mixture with a given TDA content, the stiffness of individual soil–TDA agglomerations is dominated by the stiffness contribution of the soil solids matrix, such that agglomerations containing more smaller-sized embedded TDA particles have greater overall stiffness compared to those containing fewer larger-sized (and with higher deformability) TDAs. Further, beyond a certain TDA content, the stress–strain–strength response at some points within the TDA-blended sample may be governed by a dominant TDA-to-TDA particles’ interaction [28,33,56], so-called “TDA-clustering”, which adversely affects the mobilized UCS, analogous to the “frictional” behavior with very high TDA contents described earlier.
For those soil–TDA mixtures where the mobilized UCS was greater than that of the unamended soil (control), “arching” between large TDA inclusions within the soil–TDA agglomerations is proposed as the governing mechanism—with the positive effects of arching dominant compared with the negative effects of the cohesion–adhesion mechanism described above. In this regard, the relative size of the TDA particles in relation to that of the soil–TDA agglomerations, and the number of these inclusions, are likely important factors. Up to a certain limiting size and TDA content, the larger their relative size, the greater the arching effects, such that this could explain the greater UCS mobilized for the soil agglomerations containing 5% TDA-C. In other words, for 5% TDA content, fewer larger-sized embedded TDA-C particles produce a better outcome in terms of arching effects (and hence UCS) compared to more smaller-sized TDA-F particles. Compared to 5% TDA, although the arching effects are greater for 10% and 20% TDA contents; as explained above, the adverse impact with increasing TDA content of the cohesion–adhesion mechanism produces lower overall UCS values for these samples. As such, for 10% TDA-C and TDA-M, which are also higher in terms of UCS compared with the unamended soil (see Figure 8a), the arching effects are still dominant compared to the cohesion–adhesion effects. For 10% TDA-F, however, these mechanisms seem to produce equal but counteracting results; hence, the UCS is similar to that of the unamended soil. In order to verify the postulated soil–TDA interactions described above, additional tests by means of X-ray μCT scanning techniques should be performed on compacted soil–TDA samples prepared with varying TDA contents/sizes at different stress/strain levels. The results obtained from these tests will allow the initial TDA distribution, and more importantly, its changes during compressive loading, to be visualized and hence employed to verify and/or further improve upon the postulated soil–TDA interactions.
A review of the swelling potential data reported in Figure 5 indicates that, unlike the UCS, the swelling potential was consistently in favor of higher TDA contents, with the TDA particle size being a secondary factor. This can be attributed to the fact that the swelling potential is primarily governed by the soil clay fraction, such that the substitution of a portion of the clay fraction with silt and/or coarse-grained materials (such as TDA) produces a decrease in the swelling potential [26]. Accordingly, an increase in TDA content, regardless of TDA particle size, substitutes a larger portion of the clay fraction with hydrophobic TDA particles, thereby permitting a further decrease in the swelling potential. The following mechanism is presented to explain the observed minor effects of TDA size in reducing the swelling potential. Since the oedometer swell test is conducted under confined conditions, friction between the constituent soil and TDA particles influences the swelling potential. For the soil sample to heave, the frictional resistance generated between these particles during swelling should be overcome. The higher the generated frictional resistance, the lower the swelling potential. TDA particles are well established as “high-friction” materials, and thus their inclusion is expected to increase the overall frictional resistance acting against heave. Consequently, an increase in TDA particle size (and hence its surface area) is expected to increase the frictional resistance generated between the soil solids and TDA particles, such that an increase in TDA particle size provides a further reduction in the swelling potential [2,26,27].
5.5. Optimum Mix Designs and Research Recommendations
The primary objective of stabilization with respect to expansive clay soils is to reduce their swelling potential to an acceptable level while either maintaining, or preferably improving, their strength-related features [27,57]. As demonstrated in Section 5.2, the three TDA sizes examined in this study (see Figure 1) were all consistently effective in reducing the level of swelling—that is, improvement in swelling potential was in favor of higher TDA contents. However, as demonstrated in Section 5.3, for any given TDA size, TDA contents greater than 5% resulted in UCS, stiffness and toughness concerns. Based on the experimental results presented in Section 5.2 and Section 5.3, TDA contents of up to 10% were able to satisfy the stabilization objective and hence can be deemed as optimum choices for the standard Proctor-compacted highly expansive clay soil investigated. Where strength-related features are not the primary concern, higher TDA contents may also be considered acceptable. As demonstrated in Figure 5 and Figure 8a, the TDA-C material, with its coarser gradation, was able to outperform the finer TDA-M and TDA-F variants in terms of lower swelling potential and higher UCS values. As such, the TDA-C material can be deemed as the optimum TDA gradation. However, it has been the authors’ experience that achieving uniform soil–TDA-C mixtures is more tedious compared with soil–TDA-M/TDA-F blends, implying an increased tendency for TDA segregation to occur with an increase in TDA size. Although segregation effects can be effectively moderated under controlled laboratory conditions, the same may be difficult to achieve for field conditions. Accordingly, to minimize potential segregation concerns, TDA-M may be a more appropriate material choice. Quite clearly, additional research, with emphasis on segregation, is required to translate/upscale the presented experimental outcomes to practice. It has also been observed that the soil’s clay content and its associated plasticity, defined in terms of the plasticity index, play critical roles in deriving the optimum TDA content (and potentially its gradation). Based on the authors’ previous research, it can be hypothesized that soils with higher clay contents and of higher plasticity, which in turn possess higher cohesion resistance, are often able to accommodate higher TDA contents—that is, the optimum TDA content/size is not unique for all clay soils [2,24,27,28,33,41,58]. Accordingly, a systematically controlled test program, involving a variety of clay soils with varying plasticity characteristics blended with different TDA contents and gradations, should be carried out with the dual aims of checking the postulated soil–TDA interaction mechanisms described in Section 5.4 and exploring potential correlations between the optimum TDA content/size and fundamental clay properties.
6. Conclusions
This experimental study investigated the potential use of TDA materials as an additive, with contents ranging from 5% to 20% (by dry mass), to alleviate the inferior geotechnical properties of a highly expansive clay soil. Three different TDA gradations/sizes, comparable with fine, medium and coarse sands, were considered—that is, materials TDA-F, TDA-M and TDA-C, with mean particle size values of D50T = 0.46 mm, 1.67 mm and 3.34 mm, respectively. Based on the experimental results and observations, the following conclusions can be drawn:
- The TDA materials’ lower specific gravity, hydrophobic character (water adsorption capacity < 4%) and higher energy absorption capacity compared with those of the soil solids, and clay particles in particular, led to notable reductions in the standard Proctor compaction optimum water content and maximum dry unit weight values, both following monotonically decreasing trends with increasing TDA content. Similarly, for any given TDA content, an increase in TDA particle size led to a further, yet less pronounced, decrease in the compaction optimum water content and maximum dry unit weight values.
- As expected, the partial replacement of the clay soil with hydrophobic TDA particles led to notable decreases in the rate and magnitude of swelling. For any given TDA size, the greater the TDA content, the lower the swelling potential, following a monotonically decreasing trend. Similarly, an increase in TDA size (for any given TDA content) was found to decrease the soil’s swelling potential, albeit to a lesser degree.
- Further, for any given TDA size, the variations of strength (UCS) and toughness with respect to TDA content exhibited rise–fall relationships, peaking at 5% TDA and then decreasing for higher TDA contents. The stiffness and ductility (deformability index) parameters, however, were found to monotonically decrease and increase with the TDA content, respectively. Interestingly, an increase in TDA particle size (for any given TDA content) produced a notable increase in the UCS, ductility and toughness parameters, whereas the developed stiffness was found to substantially decrease.
- Finally, TDA contents of up to 10%, preferably employing TDA-M and TDA-C variants, were able to reduce the soil’s swelling potential from high to moderate expansivity, while simultaneously improving its strength-related features, and thus can be deemed as optimum mix design choices from a geotechnical perspective. Where strength-related features are not the primary concern, higher TDA contents may also be considered acceptable. Additional research, with emphasis on establishing the basic soil–TDA interaction mechanisms for the compacted soil–TDA blends investigated, as well as mitigating against adverse effects of TDA segregation arising from excessive TDA contents and/or inadequate mixing procedures, is recommended to upscale the reported experimental outcomes to practice.
Author Contributions
Conceptualization, A.S., A.T. and A.D.; Methodology, A.S., A.T. and A.D.; Validation, A.S. and B.C.O.; Formal analysis, A.S. and B.C.O.; Investigation, A.S.; Writing—original draft preparation, A.S.; Writing—review and editing, A.S., A.T., A.D. and B.C.O.; Visualization, A.S.; Supervision, A.T. and A.D.; Funding acquisition, A.T. All authors have read and agreed to the published version of the manuscript.
Funding
This research was partially funded by Green Industries SA; this support is gratefully acknowledged.
Acknowledgments
The authors wish to thank Paul Morgan from Pavement Asset Services Pty Ltd., and Downer Group for their assistance in collecting soil samples.
Conflicts of Interest
The authors declare no conflict of interest.
Abbreviations
The following abbreviations are used in this manuscript:
| AS | Australian standard |
| ASTM | American Society for Testing and Materials |
| CI | Clay with intermediate plasticity |
| ELT | End-of-life tire |
| EPU | Equivalent passenger unit (of car-tire) |
| FSR | Free swell ratio |
| ISW | Initial swelling |
| PSW | Primary swelling |
| SP | Poorly-graded sand |
| SSW | Secondary swelling |
| TDA | Tire-derived aggregate |
| UCS | Unconfined compressive strength |
| USCS | Unified Soil Classification System |
Appendix A
The classification procedure for expansive soils based on the oedometer swell test, as suggested by Seed et al. [36], is presented in Table A1.

Table A1.
Classification procedure for expansive soils based on the oedometer swell test [36].
Table A1.
Classification procedure for expansive soils based on the oedometer swell test [36].
| Swelling Potential, SP (%) 1 | Degree of Expansivity |
|---|---|
| 0–1.5 | Low (Class L) |
| 1.5–5 | Moderate (Class M) |
| 5–25 | High (Class H) |
| >25 | Very High (Class VH) |
1 Percent axial expansion strain in an oedometer from the initial condition of standard Proctor optimum to a saturated condition under a surcharge of 7 kPa.
The classification procedure for identifying clay mineralogy based on the FSR, as suggested by Prakash and Sridharan [37], is presented in Table A2.
Table A2.
Classification procedure for identifying clay mineralogy based on the FSR [37].
Table A2.
Classification procedure for identifying clay mineralogy based on the FSR [37].
| Free Swell Ratio (FSR) 1 | Probable Degree of Expansivity | Dominant Clay Mineral |
|---|---|---|
| ≤1 | Negligible (Class N) | Kaolinite |
| 1–1.5 | Low (Class L) | Kaolinite + Montmorillonite |
| 1.5–2 | Moderate (Class M) | Montmorillonite |
| 2–4 | High (Class H) | Montmorillonite |
| >4 | Very High (Class VH) | Montmorillonite |
1 FSR = VD/VK where VD and VK = equilibrium sediment volumes of 10 g oven-dried soil (<425 μm) when placed in distilled water and kerosene, respectively.
References
- Jones, L.D.; Jefferson, I. Expansive soils. In ICE Manual of Geotechnical Engineering: Volume I; Burland, J., Chapman, T., Brown, M., Skinner, H., Eds.; ICE Publishing: London, UK, 2012; pp. 413–441. ISBN 9780727757081. [Google Scholar] [CrossRef]
- Soltani, A.; Deng, A.; Taheri, A.; O’Kelly, B.C. Engineering reactive clay systems by ground rubber replacement and polyacrylamide treatment. Polymers 2019, 11, 1675. [Google Scholar] [CrossRef] [Green Version]
- Soltani, A.; Deng, A.; Taheri, A.; Mirzababaei, M. Rubber powder–polymer combined stabilization of South Australian expansive soils. Geosynth. Int. 2018, 25, 304–321. [Google Scholar] [CrossRef]
- Nelson, J.D.; Miller, D.J. Expansive Soils: Problems and Practice in Foundation and Pavement Engineering, 1st ed.; Wiley: New York, NY, USA, 1992; ISBN 0471511862. [Google Scholar]
- Soltani, A.; Raeesi, R.; O’Kelly, B.C. Cyclic swell–shrink behaviour of an expansive soil treated with a sulfonated oil. Proc. Inst. Civ. Eng. Gr. Improv. 2020. [Google Scholar] [CrossRef]
- Wang, H.L.; Cui, Y.J.; Lamas-Lopez, F.; Dupla, J.C.; Canou, J.; Calon, N.; Saussine, G.; Aimedieu, P.; Chen, R.P. Effects of inclusion contents on resilient modulus and damping ratio of unsaturated track-bed materials. Can. Geotech. J. 2017, 54, 1672–1681. [Google Scholar] [CrossRef]
- Wang, H.L.; Cui, Y.J.; Lamas-Lopez, F.; Calon, N.; Saussine, G.; Dupla, J.C.; Canou, J.; Aimedieu, P.; Chen, R.P. Investigation on the mechanical behavior of track-bed materials at various contents of coarse grains. Constr. Build. Mater. 2018, 164, 228–237. [Google Scholar] [CrossRef]
- Qi, S.; Cui, Y.J.; Chen, R.P.; Wang, H.L.; Lamas-Lopez, F.; Aimedieu, P.; Dupla, J.C.; Canou, J.; Saussine, G. Influence of grain size distribution of inclusions on the mechanical behaviours of track-bed materials. Géotechnique 2020, 70, 238–247. [Google Scholar] [CrossRef] [Green Version]
- Dash, S.K.; Hussain, M. Lime stabilization of soils: Reappraisal. J. Mater. Civ. Eng. 2012, 24, 707–714. [Google Scholar] [CrossRef]
- Estabragh, A.R.; Pereshkafti, M.R.S.; Parsaei, B.; Javadi, A.A. Stabilised expansive soil behaviour during wetting and drying. Int. J. Pavement Eng. 2013, 14, 418–427. [Google Scholar] [CrossRef]
- Estabragh, A.R.; Rafatjo, H.; Javadi, A.A. Treatment of an expansive soil by mechanical and chemical techniques. Geosynth. Int. 2014, 21, 233–243. [Google Scholar] [CrossRef]
- Garzón, E.; Cano, M.; O’Kelly, B.C.; Sánchez-Soto, P.J. Phyllite clay–cement composites having improved engineering properties and material applications. Appl. Clay Sci. 2015, 114, 229–233. [Google Scholar] [CrossRef] [Green Version]
- Garzón, E.; Cano, M.; O’Kelly, B.C.; Sánchez-Soto, P.J. Effect of lime on stabilization of phyllite clays. Appl. Clay Sci. 2016, 123, 329–334. [Google Scholar] [CrossRef]
- Soltani, A.; Taheri, A.; Khatibi, M.; Estabragh, A.R. Swelling potential of a stabilized expansive soil: A comparative experimental study. Geotech. Geol. Eng. 2017, 35, 1717–1744. [Google Scholar] [CrossRef]
- Zhao, Y.; Taheri, A.; Soltani, A.; Karakus, M.; Deng, A. Strength development and strain localization behavior of cemented paste backfills using Portland cement and fly ash. Materials 2019, 12, 3282. [Google Scholar] [CrossRef] [PubMed] [Green Version]
- Alazigha, D.P.; Indraratna, B.; Vinod, J.S.; Ezeajugh, L.E. The swelling behaviour of lignosulfonate-treated expansive soil. Proc. Inst. Civ. Eng. Gr. Improv. 2016, 169, 182–193. [Google Scholar] [CrossRef] [Green Version]
- Zhang, J.; Soltani, A.; Deng, A.; Jaksa, M.B. Mechanical performance of jute fiber-reinforced micaceous clay composites treated with ground-granulated blast-furnace slag. Materials 2019, 12, 576. [Google Scholar] [CrossRef] [Green Version]
- Williamson, S.; Cortes, D.D. Dimensional analysis of soil–cement mixture performance. Géotechnique Lett. 2014, 4, 33–38. [Google Scholar] [CrossRef]
- Disfani, M.M.; Mohammadinia, A.; Narsilio, G.A.; Aye, L. Performance evaluation of semi-flexible permeable pavements under cyclic loads. Int. J. Pavement Eng. 2020, 21, 336–346. [Google Scholar] [CrossRef]
- Thomas, B.S.; Gupta, R.C.; Panicker, V.J. Recycling of waste tire rubber as aggregate in concrete: Durability-related performance. J. Clean. Prod. 2016, 112, 504–513. [Google Scholar] [CrossRef]
- Raeesi, R.; Soltani, A.; King, R.; Disfani, M.M. Field performance monitoring of waste tire-based permeable pavements. Transp. Geotech. 2020, 24, 100384. [Google Scholar] [CrossRef]
- Patil, U.; Valdes, J.R.; Evans, T.M. Swell mitigation with granulated tire rubber. J. Mater. Civ. Eng. 2011, 23, 721–727. [Google Scholar] [CrossRef]
- Trouzine, H.; Bekhiti, M.; Asroun, A. Effects of scrap tyre rubber fibre on swelling behaviour of two clayey soils in Algeria. Geosynth. Int. 2012, 19, 124–132. [Google Scholar] [CrossRef]
- Srivastava, A.; Pandey, S.; Rana, J. Use of shredded tyre waste in improving the geotechnical properties of expansive black cotton soil. Geomech. Geoengin. 2014, 9, 303–311. [Google Scholar] [CrossRef]
- Signes, C.H.; Garzón-Roca, J.; Fernández, P.M.; de la Torre, M.E.G.; Franco, R.I. Swelling potential reduction of Spanish argillaceous marlstone Facies Tap soil through the addition of crumb rubber particles from scrap tyres. Appl. Clay Sci. 2016, 132–133, 768–773. [Google Scholar] [CrossRef]
- Soltani, A.; Deng, A.; Taheri, A.; Mirzababaei, M.; Vanapalli, S.K. Swell–shrink behavior of rubberized expansive clays during alternate wetting and drying. Minerals 2019, 9, 224. [Google Scholar] [CrossRef] [Green Version]
- Soltani, A.; Deng, A.; Taheri, A.; Sridharan, A. Swell–shrink–consolidation behavior of rubber-reinforced expansive soils. Geotech. Test. J. 2019, 42, 761–788. [Google Scholar] [CrossRef]
- Yadav, J.S.; Tiwari, S.K. Effect of waste rubber fibres on the geotechnical properties of clay stabilized with cement. Appl. Clay Sci. 2017, 149, 97–110. [Google Scholar] [CrossRef]
- Li, S.; Li, D. Mechanical properties of scrap tire crumbs–clayey soil mixtures determined by laboratory tests. Adv. Mater. Sci. Eng. 2018, 2018, 1742676. [Google Scholar] [CrossRef] [Green Version]
- Indraratna, B.; Qi, Y.; Ngo, T.N.; Rujikiatkamjorn, C.; Neville, T.; Ferreira, F.B.; Shahkolahi, A. Use of geogrids and recycled rubber in railroad infrastructure for enhanced performance. Geosciences 2019, 9, 30. [Google Scholar] [CrossRef] [Green Version]
- Saberian, M.; Li, J. Long-term permanent deformation behaviour of recycled concrete aggregate with addition of crumb rubber in base and sub-base applications. Soil Dyn. Earthq. Eng. 2019, 121, 436–441. [Google Scholar] [CrossRef]
- Soltani, A.; Deng, A.; Taheri, A.; Mirzababaei, M.; Nikraz, H. Interfacial shear strength of rubber-reinforced clays: A dimensional analysis perspective. Geosynth. Int. 2019, 26, 164–183. [Google Scholar] [CrossRef]
- Soltani, A.; Taheri, A.; Deng, A.; Nikraz, H. Tyre rubber and expansive soils: Two hazards, one solution. Proc. Inst. Civ. Eng. Constr. Mater. 2019. [Google Scholar] [CrossRef]
- Abbaspour, M.; Narani, S.S.; Aflaki, E.; Moghadas Nejad, F.; Mir Mohammad Hosseini, S.M. Strength and swelling properties of a waste tire textile fiber-reinforced expansive soil. Geosynth. Int. 2020. [Google Scholar] [CrossRef]
- Akbarimehr, D.; Eslami, A.; Aflaki, E. Geotechnical behaviour of clay soil mixed with rubber waste. J. Clean. Prod. 2020, 271, 122632. [Google Scholar] [CrossRef]
- Seed, H.B.; Woodward, J.; Lundgren, R. Prediction of swelling potential for compacted clays. J. Soil Mech. Found. Div. 1962, 88, 53–87. [Google Scholar]
- Prakash, K.; Sridharan, A. Free swell ratio and clay mineralogy of fine-grained soils. Geotech. Test. J. 2004, 27, 220–225. [Google Scholar] [CrossRef]
- Sridharan, A.; Prakash, K. Classification procedures for expansive soils. Proc. Inst. Civ. Eng. Geotech. Eng. 2000, 143, 235–240. [Google Scholar] [CrossRef] [Green Version]
- Sridharan, A.; Gurtug, Y. Swelling behaviour of compacted fine-grained soils. Eng. Geol. 2004, 72, 9–18. [Google Scholar] [CrossRef]
- Özkul, Z.H.; Baykal, G. Shear behavior of compacted rubber fiber–clay composite in drained and undrained loading. J. Geotech. Geoenviron. Eng. 2007, 133, 767–781. [Google Scholar] [CrossRef]
- Soltani, A.; Deng, A.; Taheri, A.; Sridharan, A. Consistency limits and compaction characteristics of clay soils containing rubber waste. Proc. Inst. Civ. Eng. Geotech. Eng. 2019, 172, 174–188. [Google Scholar] [CrossRef] [Green Version]
- Gurtug, Y.; Sridharan, A. Compaction behaviour and prediction of its characteristics of fine grained soils with particular reference to compaction energy. Soils Found. 2004, 44, 27–36. [Google Scholar] [CrossRef] [Green Version]
- Sridharan, A.; Pandian, N.S.; Srinivas, S. Compaction behaviour of Indian coal ashes. Proc. Inst. Civ. Eng. Gr. Improv. 2001, 5, 13–22. [Google Scholar] [CrossRef]
- Mir, B.A.; Sridharan, A. Physical and compaction behaviour of clay soil–fly ash mixtures. Geotech. Geol. Eng. 2013, 31, 1059–1072. [Google Scholar] [CrossRef]
- Sivapullaiah, P.V.; Sridharan, A.; Stalin, V.K. Swelling behaviour of soil–bentonite mixtures. Can. Geotech. J. 1996, 33, 808–814. [Google Scholar] [CrossRef]
- Soltani, A. Comments on “Effect of wetting–drying–freezing–thawing cycles on the swelling behaviour of the Yanji mudstone” [Environ Earth Sci (2019) 78: 435]. Environ. Earth Sci. 2019, 78, 512. [Google Scholar] [CrossRef]
- Rao, S.M.; Thyagaraj, T.; Thomas, H.R. Swelling of compacted clay under osmotic gradients. Géotechnique 2006, 56, 707–713. [Google Scholar] [CrossRef]
- Park, S.S. Unconfined compressive strength and ductility of fiber-reinforced cemented sand. Constr. Build. Mater. 2011, 25, 1134–1138. [Google Scholar] [CrossRef]
- Radovic, M.; Lara-Curzio, E.; Riester, L. Comparison of different experimental techniques for determination of elastic properties of solids. Mater. Sci. Eng. A 2004, 368, 56–70. [Google Scholar] [CrossRef]
- Maher, M.H.; Ho, Y.C. Mechanical properties of kaolinite/fiber soil composite. J. Geotech. Eng. 1994, 120, 1381–1393. [Google Scholar] [CrossRef]
- Mirzababaei, M.; Miraftab, M.; Mohamed, M.; McMahon, P. Unconfined compression strength of reinforced clays with carpet waste fibers. J. Geotech. Geoenviron. Eng. 2013, 139, 483–493. [Google Scholar] [CrossRef]
- Mullins, C.E.; Panayiotopoulos, K.P. The strength of unsaturated mixtures of sand and kaolin and the concept of effective stress. J. Soil Sci. 1984, 35, 459–468. [Google Scholar] [CrossRef]
- Wood, D.M.; Kumar, G.V. Experimental observations of behaviour of heterogeneous soils. Mech. Cohesive Frict. Mater. Mater. 2000, 5, 373–398. [Google Scholar] [CrossRef]
- Khan, F.S.; Azam, S.; Raghunandan, M.E.; Clark, R. Compressive strength of compacted clay–sand mixes. Adv. Mater. Sci. Eng. 2014, 2014, 921815. [Google Scholar] [CrossRef] [Green Version]
- Nagaraj, H.B. Influence of gradation and proportion of sand on stress–strain behavior of clay–sand mixtures. Int. J. Geo Eng. 2016, 7, 19. [Google Scholar] [CrossRef] [Green Version]
- Cabalar, A.F.; Karabash, Z.; Mustafa, W.S. Stabilising a clay using tyre buffings and lime. Road Mater. Pavement Des. 2014, 15, 872–891. [Google Scholar] [CrossRef]
- Shahbazi, M.; Rowshanzamir, M.; Abtahi, S.M.; Hejazi, S.M. Optimization of carpet waste fibers and steel slag particles to reinforce expansive soil using response surface methodology. Appl. Clay Sci. 2017, 142, 185–192. [Google Scholar] [CrossRef]
- Kalkan, E. Preparation of scrap tire rubber fiber–silica fume mixtures for modification of clayey soils. Appl. Clay Sci. 2013, 80–81, 117–125. [Google Scholar] [CrossRef]
Figure 1.
Gradation curves for the test materials.

Figure 2.
Variations of (a) optimum water content wopt and (b) maximum dry unit weight γdmax against TDA content fT for the tested mix designs.
Figure 2.
Variations of (a) optimum water content wopt and (b) maximum dry unit weight γdmax against TDA content fT for the tested mix designs.

Figure 3.
Variations of maximum dry unit weight against optimum water content “path of optimums” for the tested mix designs: (a) Conventional definition (i.e., γdmax–wopt); and (b) Normalized definition (i.e., γdmaxN–woptN).
Figure 3.
Variations of maximum dry unit weight against optimum water content “path of optimums” for the tested mix designs: (a) Conventional definition (i.e., γdmax–wopt); and (b) Normalized definition (i.e., γdmaxN–woptN).

Figure 4.
Typical swell–time relationships for the unamended test soil (control) and various soil–TDA blends: (a) TDA-M with fT = 5%, 10% and 20%; and (b) TDA-F, TDA-M and TDA-C with fT = 10%.
Figure 4.
Typical swell–time relationships for the unamended test soil (control) and various soil–TDA blends: (a) TDA-M with fT = 5%, 10% and 20%; and (b) TDA-F, TDA-M and TDA-C with fT = 10%.

Figure 5.
Variations of axial swelling strain against TDA content fT for the tested mix designs: (a) Ultimate swelling strain (i.e., swelling potential SP); and (b) Initial, primary and secondary swelling strains (i.e., εisw, εpsw and εssw).
Figure 5.
Variations of axial swelling strain against TDA content fT for the tested mix designs: (a) Ultimate swelling strain (i.e., swelling potential SP); and (b) Initial, primary and secondary swelling strains (i.e., εisw, εpsw and εssw).

Figure 6.
Variations of the (a) primary swelling and (b) secondary swelling coefficients (i.e., Cpsw and Cssw) against TDA content fT for the tested mix designs.
Figure 6.
Variations of the (a) primary swelling and (b) secondary swelling coefficients (i.e., Cpsw and Cssw) against TDA content fT for the tested mix designs.

Figure 7.
Typical stress–strain relationships for the unamended soil (control) and various soil–TDA blends: (a) TDA-M with fT = 5%, 10% and 20%; and (b) TDA-F, TDA-M and TDA-C with fT = 10%.
Figure 7.
Typical stress–strain relationships for the unamended soil (control) and various soil–TDA blends: (a) TDA-M with fT = 5%, 10% and 20%; and (b) TDA-F, TDA-M and TDA-C with fT = 10%.

Figure 8.
Variations of the (a) UCS qu and (b) deformability index ID against TDA content fT for the tested mix designs.
Figure 8.
Variations of the (a) UCS qu and (b) deformability index ID against TDA content fT for the tested mix designs.

Figure 9.
Variations of (a) elastic stiffness E50 and (b) peak strain energy Eu against TDA content fT for the tested mix designs.
Figure 9.
Variations of (a) elastic stiffness E50 and (b) peak strain energy Eu against TDA content fT for the tested mix designs.

Table 1.
Physical and mechanical properties of the test soil.
| Properties | Value | Standard Designation |
|---|---|---|
| Specific gravity, GsS | 2.77 | ASTM D854–14 |
| Clay content (<2 μm) (wt %) | 43 | ASTM D422–07 |
| Silt content (2–75 μm) (wt %) | 37 | ASTM D422–07 |
| Sand content (0.075–4.75 mm) (wt %) | 20 | ASTM D422–07 |
| Mean particle size, D50S (μm) | 6.21 | ASTM D422–07 |
| Liquid limit, wL (%) | 43.6 | AS 1289.3.9.1–15 |
| Plastic limit, wP (%) | 22.1 | AS 1289.3.2.1–09 |
| Plasticity index, IP = wL − wP (%) | 21.5 | AS 1289.3.3.1–09 |
| USCS classification | CI 1 | ASTM D2487–17 |
| Optimum water content, wopt (%) 2 | 19.5 | ASTM D698–12 |
| Maximum dry unit weight, γdmax (kN/m3) 2 | 17.0 | ASTM D698–12 |
| Swelling potential, SP (%) 3 | 7.54 | ASTM D4546–14 |
| Degree of expansivity | High | Seed et al. [36] |
| Free swell ratio (FSR) 4 | 1.55 | Prakash and Sridharan [37] |
| Dominant clay mineral | Montmorillonite | Prakash and Sridharan [37] |
1 Clay with intermediate plasticity; 2 Standard Proctor effort; 3 % Expansion in an oedometer from γdmax (=17.0 kN/m3) and wopt (=19.5%) to a saturated condition under a surcharge of 7 kPa; 4 FSR = VD/VK where VD and VK = equilibrium sediment volumes of 10 g oven-dried soil (<425 μm) when placed in distilled water and kerosene, respectively; for the present investigation, VD = 17.0 cm3 and VK = 11.0 cm3.
Table 2.
Physical and mechanical properties of the investigated TDA materials.
| Properties | TDA-F | TDA-M | TDA-C | Standard Designation |
|---|---|---|---|---|
| Specific gravity, GsT | 1.08 | 1.10 | 1.11 | — |
| Particle diameter D10T (mm) | 0.17 | 0.98 | 1.92 | ASTM D422–07 |
| Particle diameter D30T (mm) | 0.33 | 1.39 | 2.77 | ASTM D422–07 |
| Mean particle diameter, D50T (mm) | 0.46 | 1.67 | 3.34 | ASTM D422–07 |
| Particle diameter D60T (mm) | 0.52 | 1.81 | 3.62 | ASTM D422–07 |
| Particle diameter D90T (mm) | 0.96 | 2.22 | 4.47 | ASTM D422–07 |
| Coefficient of uniformity, Cu 1 | 3.03 | 1.84 | 1.88 | ASTM D422–07 |
| Coefficient of curvature, Cc 2 | 1.22 | 1.08 | 1.10 | ASTM D422–07 |
| USCS classification | SP 3 | SP | SP | ASTM D2487–17 |
| Water adsorption capacity (wt %) | <4 | <4 | <4 | — |
| Softening point (°C) | 170 | 170 | 170 | — |
| Styrene–butadiene copolymer (wt %) | 55 | 55 | 55 | — |
| Carbon black (wt %) | 25–35 | 25–35 | 25–35 | — |
| Acetone extract (wt %) | 5–20 | 5–20 | 5–20 | — |
| Zinc oxide (wt %) | 2–3 | 2–3 | 2–3 | — |
| Sulfur (wt %) | 1–3 | 1–3 | 1–3 | — |
1Cu = D60T/D10T; 2 Cc = (D30T)2/D10TD60T; 3 Equivalent to poorly-graded sand.
Table 3.
Soil–TDA mix designs and their properties.
| Group | fT (%) 1 | GsM 2 | wopt (%) 3 | γdmax (kN/m3) 3 | e4 |
|---|---|---|---|---|---|
| Control | 0 | 2.77 | 19.5 | 17.0 | 0.598 |
| TDA-F | 5 | 2.58 | 18.7 | 16.5 | 0.533 |
| 10 | 2.43 | 17.5 | 16.1 | 0.478 | |
| 20 | 2.20 | 15.5 | 15.6 | 0.382 | |
| TDA-M | 5 | 2.58 | 18.2 | 16.3 | 0.555 |
| 10 | 2.43 | 17.1 | 15.9 | 0.502 | |
| 20 | 2.21 | 15.0 | 15.3 | 0.417 | |
| TDA-C | 5 | 2.59 | 17.5 | 16.0 | 0.585 |
| 10 | 2.44 | 16.6 | 15.5 | 0.543 | |
| 20 | 2.22 | 14.7 | 14.9 | 0.460 |
1 TDA-to-soil dry mass ratio—that is, fT = MT/MS × 100; 2 Mixture specific gravity, calculated by means of Equation (1); 3 Standard Proctor effort; 4 Void ratio, calculated by e = GsMγw/γdmax − 1 where γw = unit weight of water.
Table 4.
Summary of the regression analyses outputs with respect to Equation (4).
| Group | fT (%) | α (%−1min) | β (%−1) | R2 | α/β (min) 1 | 1/2β (%) 2 | tisw (min) 3 | tpsw (min) 4 |
|---|---|---|---|---|---|---|---|---|
| Control | 0 | 23.09 | 0.131 | 0.984 | 176 | 3.82 | 26 | 1043 |
| TDA-F | 5 | 16.72 | 0.162 | 0.979 | 103 | 3.09 | 16 | 657 |
| 10 | 32.17 | 0.205 | 0.975 | 157 | 2.44 | 24 | 947 | |
| 20 | 46.75 | 0.293 | 0.981 | 159 | 1.71 | 24 | 958 | |
| TDA-M | 5 | 33.04 | 0.177 | 0.980 | 187 | 2.83 | 28 | 1095 |
| 10 | 45.23 | 0.232 | 0.974 | 195 | 2.16 | 29 | 1135 | |
| 20 | 74.62 | 0.347 | 0.981 | 215 | 1.44 | 32 | 1229 | |
| TDA-C | 5 | 45.29 | 0.195 | 0.980 | 232 | 2.56 | 34 | 1308 |
| 10 | 89.62 | 0.262 | 0.973 | 342 | 1.91 | 49 | 1778 | |
| 20 | 143.19 | 0.464 | 0.980 | 309 | 1.08 | 44 | 1643 |
1,2 The abscissa and ordinate corresponding to the inflection point of Equation (4) over the εsw:Logt space, respectively; 3 Completion time (from t = 0) of the ISW stage, obtained by Equation (8); 4 Completion time (from t = 0) of the PSW stage, obtained by Equation (9).
Publisher’s Note: MDPI stays neutral with regard to jurisdictional claims in published maps and institutional affiliations. |
© 2020 by the authors. Licensee MDPI, Basel, Switzerland. This article is an open access article distributed under the terms and conditions of the Creative Commons Attribution (CC BY) license (http://creativecommons.org/licenses/by/4.0/).
Share and Cite
MDPI and ACS Style
Soltani, A.; Taheri, A.; Deng, A.; O’Kelly, B.C. Improved Geotechnical Behavior of an Expansive Soil Amended with Tire-Derived Aggregates Having Different Gradations. Minerals 2020, 10, 923. https://doi.org/10.3390/min10100923
AMA Style
Soltani A, Taheri A, Deng A, O’Kelly BC. Improved Geotechnical Behavior of an Expansive Soil Amended with Tire-Derived Aggregates Having Different Gradations. Minerals. 2020; 10(10):923. https://doi.org/10.3390/min10100923
Chicago/Turabian StyleSoltani, Amin, Abbas Taheri, An Deng, and Brendan C. O’Kelly. 2020. "Improved Geotechnical Behavior of an Expansive Soil Amended with Tire-Derived Aggregates Having Different Gradations" Minerals 10, no. 10: 923. https://doi.org/10.3390/min10100923
Note that from the first issue of 2016, this journal uses article numbers instead of page numbers. See further details here.