Article

The Origin and Evolution of Late Holocene Tsunamiites in the Doñana National Park (SW Spain): Trace Elements as Geochemical Proxies

by
Manuel Pozo
1,*,
Francisco Ruiz
2,3,
María Luz González-Regalado
2,
María Isabel Carretero
4,
Guadalupe Monge
4,
Joaquín Rodríguez Vidal
2,3,
Luis Miguel Cáceres
2,3,
Manuel Abad
5,
Josep Tosquella
2,
Tatiana Izquierdo
6,
Juan Manuel Muñoz
7,
María Isabel Prudencio
8,
María Isabel Dias
8,
Rosa Marques
8,
Paula Gómez
2,
Antonio Toscano
2,
Verónica Romero
2 and
Marta Arroyo
2
1
Departamento de Geología y Geoquímica, Universidad Autónoma de Madrid, Avda. Francisco Tomas y Valiente 7, 28049 Madrid, Spain
2
Departamento de Ciencias de la Tierra, Universidad de Huelva, Avda. Tres de Marzo, s/n, 21071 Huelva, Spain
3
Centro de Investigación en Patrimonio Histórico, Cultural y Natural (CIPHCN), Universidad de Huelva, Facultad de Humanidades, Avda. Tres de Marzo s/n, 21071 Huelva, Spain
4
Departamento de Cristalografía, Mineralogía y Química Agrícola, Universidad de Sevilla, C/Profesor García González 1, 41012 Sevilla, Spain
5
Departamento de Biología y Geología, Física y Química Inorgánica, ESCET, Universidad Rey Juan Carlos, 28933 Móstoles, Spain
6
Instituto de Investigaciones Científicas y Tecnológicas de la, Universidad de Atacama (IDICTEC-UDA), Avenida Copayapu, 485, 1532297 Copiapó, Chile
7
Departamento de Estadística e Investigación Operativa, Universidad de Sevilla, C/Profesor García González 1, 41012 Sevilla, Spain
8
Centro de Ciências e Tecnologias Nucleares (C2TN), Instituto Superior Técnico, Universidade de Lisboa, Estrada Nacional 10 (k 139.7), 2695-066 Bobadela LRS, Portugal
*
Author to whom correspondence should be addressed.
Minerals 2020, 10(11), 956; https://doi.org/10.3390/min10110956
Submission received: 2 September 2020 / Revised: 17 October 2020 / Accepted: 24 October 2020 / Published: 26 October 2020

Abstract

:
The elemental content—mainly trace elements—of samples from two boreholes (PLN, CM) with evidence of tsunamiites, located in the Doñana National Park (SW Spain), were studied. The geochemical variations of the REE, LILE, HFSE, and other elements (Al, Ti, S, Na, Br, Sc, Co, Cr) were interpreted according to the mineralogy present in the samples. The results obtained show the geochemical complexity of the estuarine paleoenvironments, in this case with the existence of three Holocene-age tsunamigenic deposits (around 4.25, 3.56 and 2.2–2 kyr BP). The statistical analysis of the samples’ geochemistry, by means of linear correlation and factor analysis, made it possible to differentiate two associations. The first is representative of an inherited mineralogy (REE-Y-Rb-Sr-Cs-Th-U-Hf-Al-Ti-Co-Cr-Sc); the second includes elements (Br-Na) linked to mineral formation under evaporite conditions (halite). The trace element geochemistry of sediments thus becomes an excellent tool to identify tsunamiites in the studied zone, especially those elements that are clear proxies for marine incursions (Na, Br, Sr) and high energy events (Hf, Ti). The parent area of the provenance of the materials is mainly of felsic composition.

1. Introduction

The geochemical compositions of sediments and their temporal variations can be used for the paleoenvironmental reconstruction of coastal areas [1]. Concentrations of heavy and other metals permit us to trace marine transgression/regression stages [2], the impact of wastewater discharges and deforestation [3], or to detect historical pollution derived from mining and industrial activities [4,5]. Some elements, such as REE (rare earth elements), LILE (large-ion lithophile elements) and HFSE (high-field-strength elements), can represent (paleo-)environmental markers in the analysis of recent and Holocene littoral sediments [6,7], as well as being indicators of sediment provenance [8,9]. An additional application of geochemistry is the characterization of tsunami deposits (see the review in [10]). Correlations with textural, mineralogical, paleontological and magnetic signatures allow us to detect these high-energy events and their associated deposits (tsunamiites) in the Holocene record [11,12]. The use of geochemistry as a proxy in the identification of tsunami deposits has acquired importance in recent years. The geochemical signal can serve as a marker of marine flooding, either as an indicator of changes in salinity or as evidence of marine carbonate inputs.
The geochemical proxies provide information on the origin of the sediments (mineralogy) and their biomaterial (such as shells or reef remains), and also the broad provenance (e.g., marine or terrestrial). The relationship between the sediment’s geochemistry and provenance is generally site-specific, and therefore the local context must be taken into consideration. For example, the geochemical proxies of a tsunami derived from carbonate coralline material will be different from one derived from basalt or weathered granite. In addition, the sandy nature of tsunamiites and their deposition in an unstable environment can lead to their erosion and poor preservation potential in the sedimentary record, which restrain their geochemical identification [10].
Within this general context, this paper analyses the composition of REE-LILE-HFSE and other selected elements of late Holocene sediments from two cores collected in the Doñana National Park (SW Spain). The aim is to establish the geochemical features and identification of useful trace elements (proxies) for the recognition of tsunamigenic beds (tsunamiites) previously identified by other analytical procedures.

2. Study Area: Cores PLN and CM

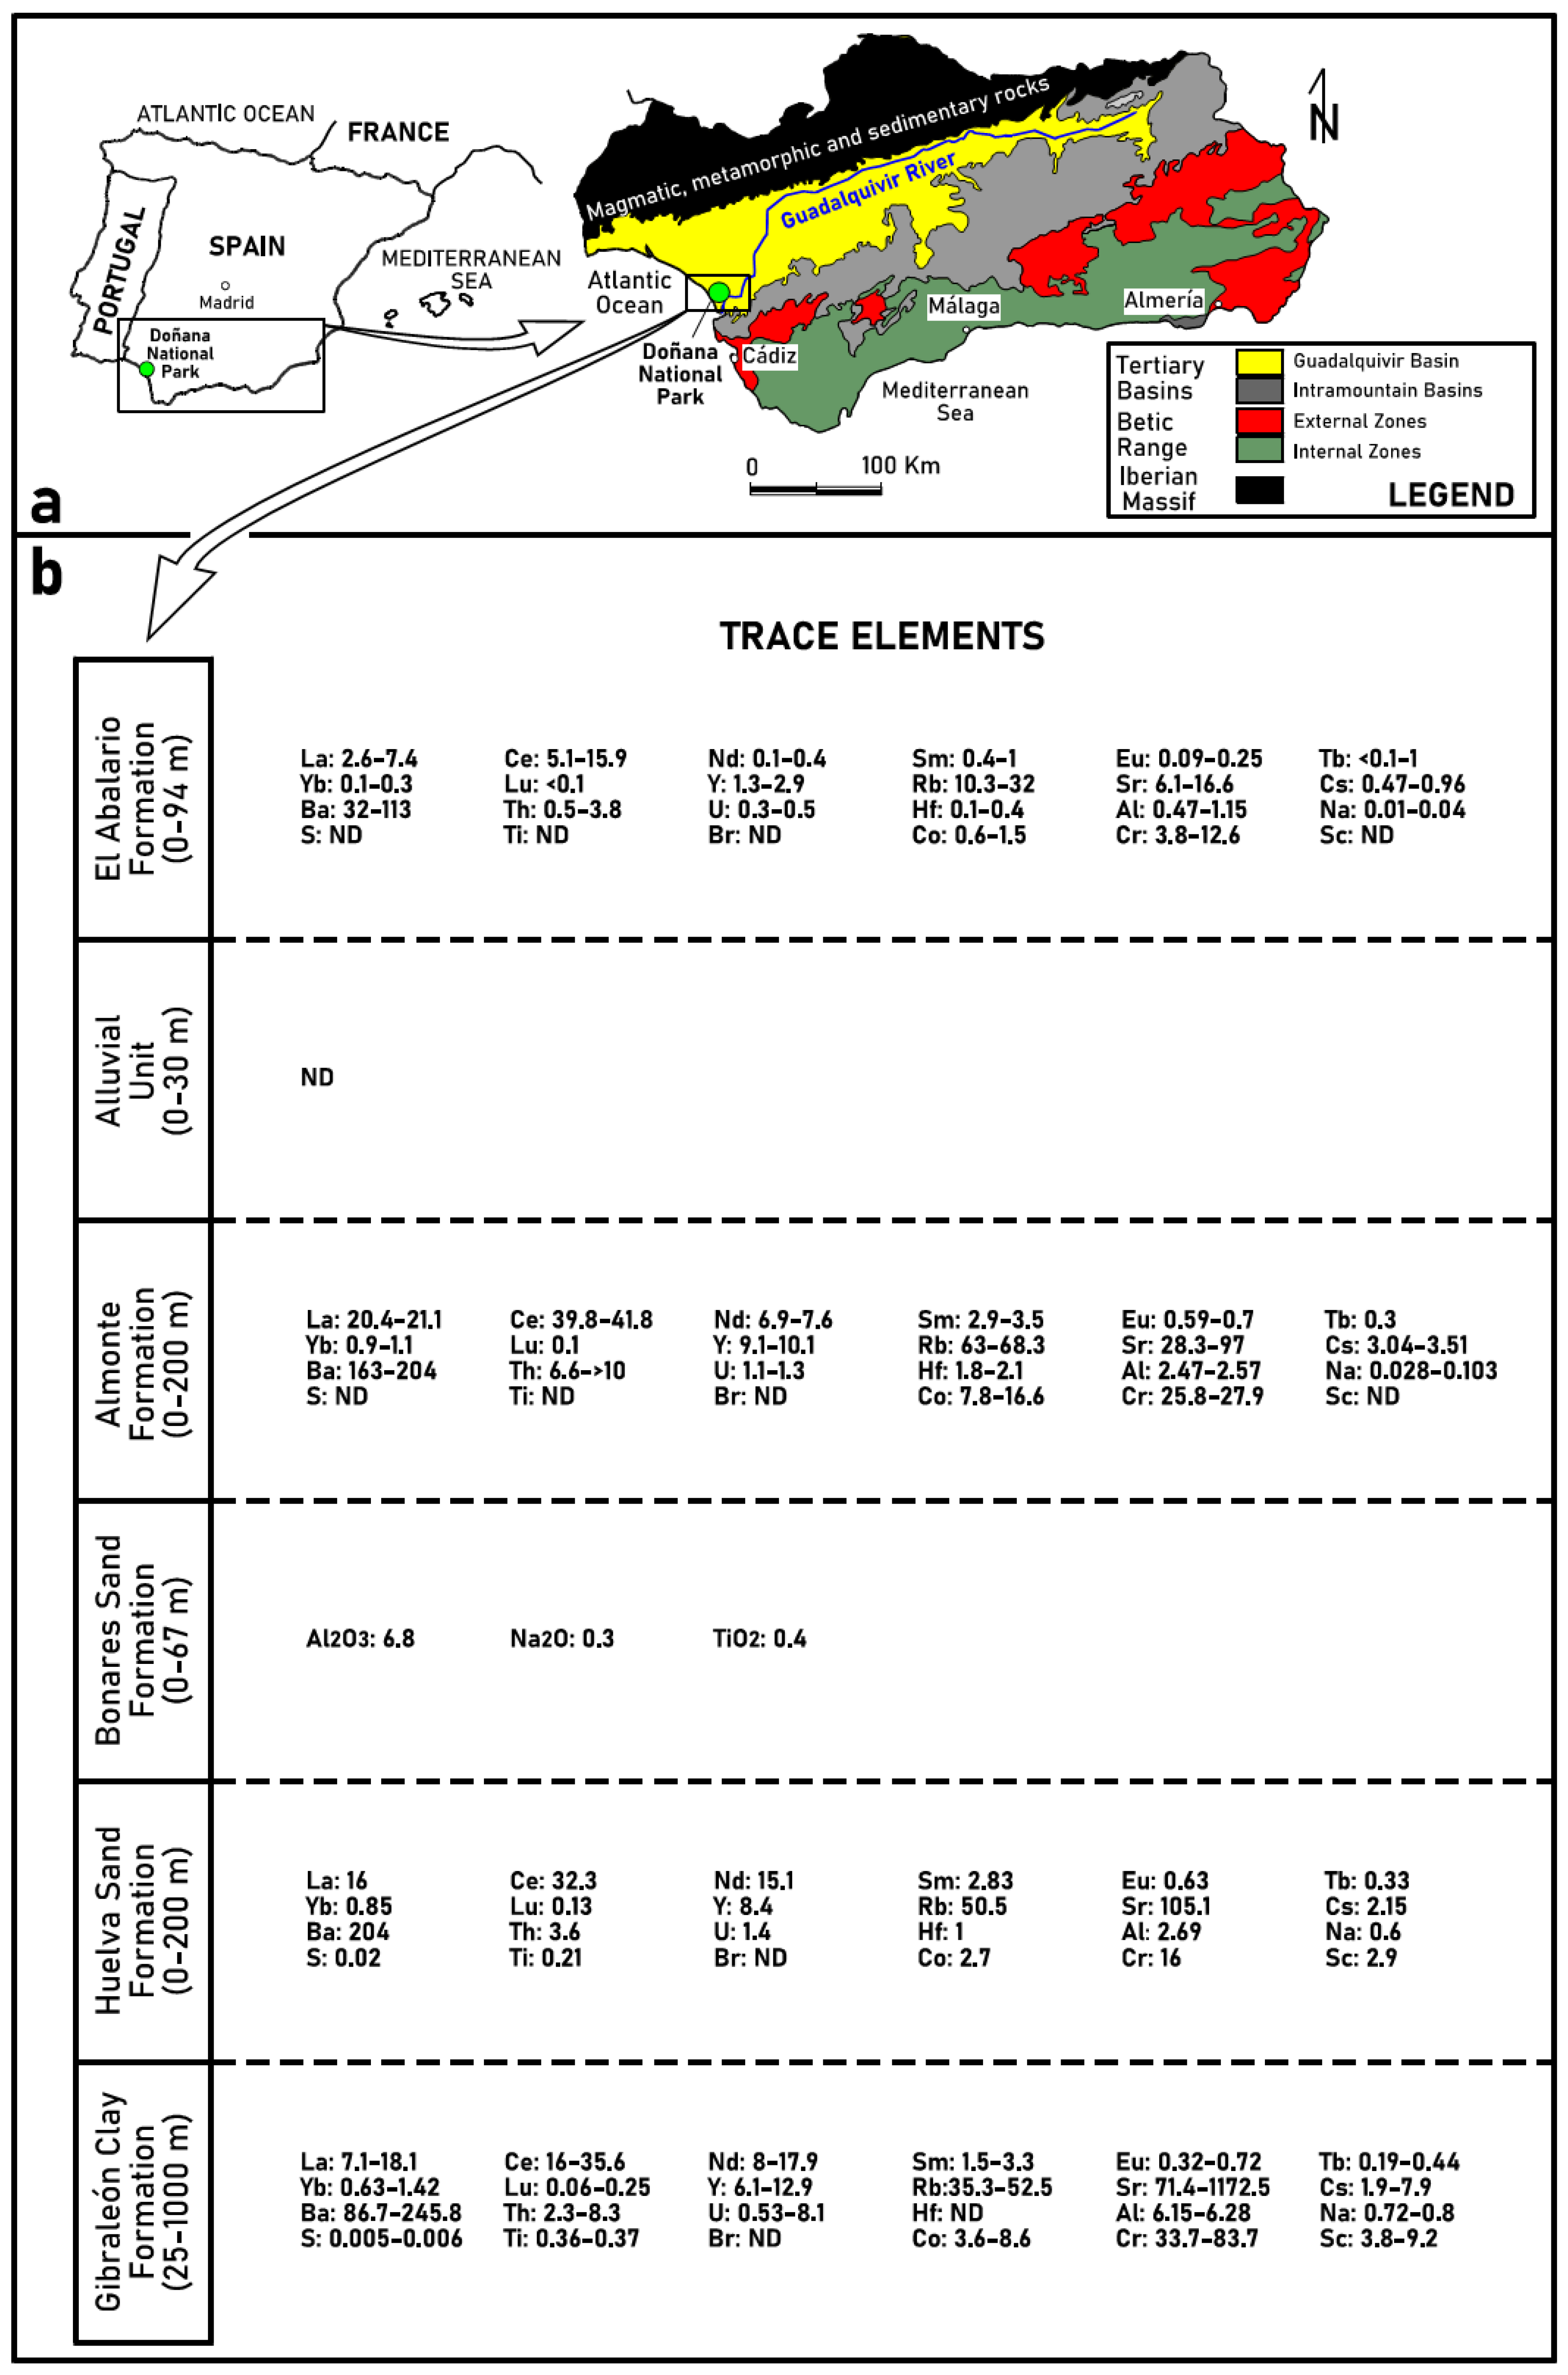
2.1. Geological Setting: Main Geological Formations of the Southwestern Guadalquivir Basin

In southern Spain, the different geological formations are grouped into the following domains (Figure 1a): (i) the Iberian Massif (Precambrian-Paleozoic), with magmatic, metamorphic and sedimentary rocks; (ii) the Betic Range, with Paleozoic internal zones (schists, quartzites, gneisses, peridotites, etc.) and Mesozoic–Cenozoic external zones (mainly clays, gypsum and carbonates); and the Neogene depressions, the most important of which is the Guadalquivir river Basin. Near the mouth of this river, six main formations are defined (Figure 1b) [13,14,15]: (i) the Gibraleón Clay Formation, monotonous lithofacies consisting of marine gray-blue marls and clays; (ii) the Huelva Sand Formation, with massive bioturbated sandy beds interbedded with lumachellic layers of marine mollusc shells; (iii) the Bonares Sand Formation, with basal, bioturbated coarse-grained sands and conglomerates near the top; (iv) the Almonte Formation, with alluvial sands and gravels; (v) the Alluvial Unit, with fluvial gravels and conglomerates; and (vi) El Abalario Formation, formed by aeolian sands.
The trace elements of these formations are scarcely studied, and some of them lack data (Figure 1b). Some elements are more abundant in the marine formations (e.g., Na, Sr), while the lowest concentrations of numerous trace elements (e.g., La, Yb, Ce, Nd, Sm) are measured in the upper aeolian sediments of El Abalario Formation [16,17,18].

2.2. Doñana National Park

The southwestern Spanish coast is formed of large sandy beaches and cliffs (145 km long), only interrupted by the presence of several estuaries. The Guadalquivir estuary is the largest of them, and includes the Doñana National Park, an extensive Biosphere Reserve (Figure 2a: >54,000 ha). This privileged natural site includes more than 25,000 ha of seasonal marshes, which are crossed by numerous tidal channels. These marshes are almost flat, and only small elevations formed by sandy ridges and cheniers rise above them (Figure 2a: Carrizosa-Veta La Arena, Las Nuevas, Vetalengua). Some of them represent evidence of old extreme wave events (storms, tsunamis) during the late Holocene [19,20]. Since ca. 4000 years ago, the protection provided by the growing spit barrier of Doñana throughout different stages of coastal progradation (Figure 2a; H2: 4200–2550 cal yr BP; H3: 2300–800 cal yr BP; H4: 500 cal yr BP-Present; [21]) favored the development of these sheltered marshes dominated by tides and fluvial currents, with some depressions occupied by freshwater ponds (Figure 2a: so-called ‘lucios’). This natural reserve is surrounded by different Neogene formations which constitute both its drainage basin and its underlying deposits.
As mentioned above, this coast has suffered numerous marine high-energy events during the last thousands of years. Its historical catalogue includes at least sixteen tsunamis between 218 BCE and 1900 CE [22], with an associated geological record that reached the bathyal zones [23]. Some of them left their geological footprint in some cores collected within the Doñana National Park.

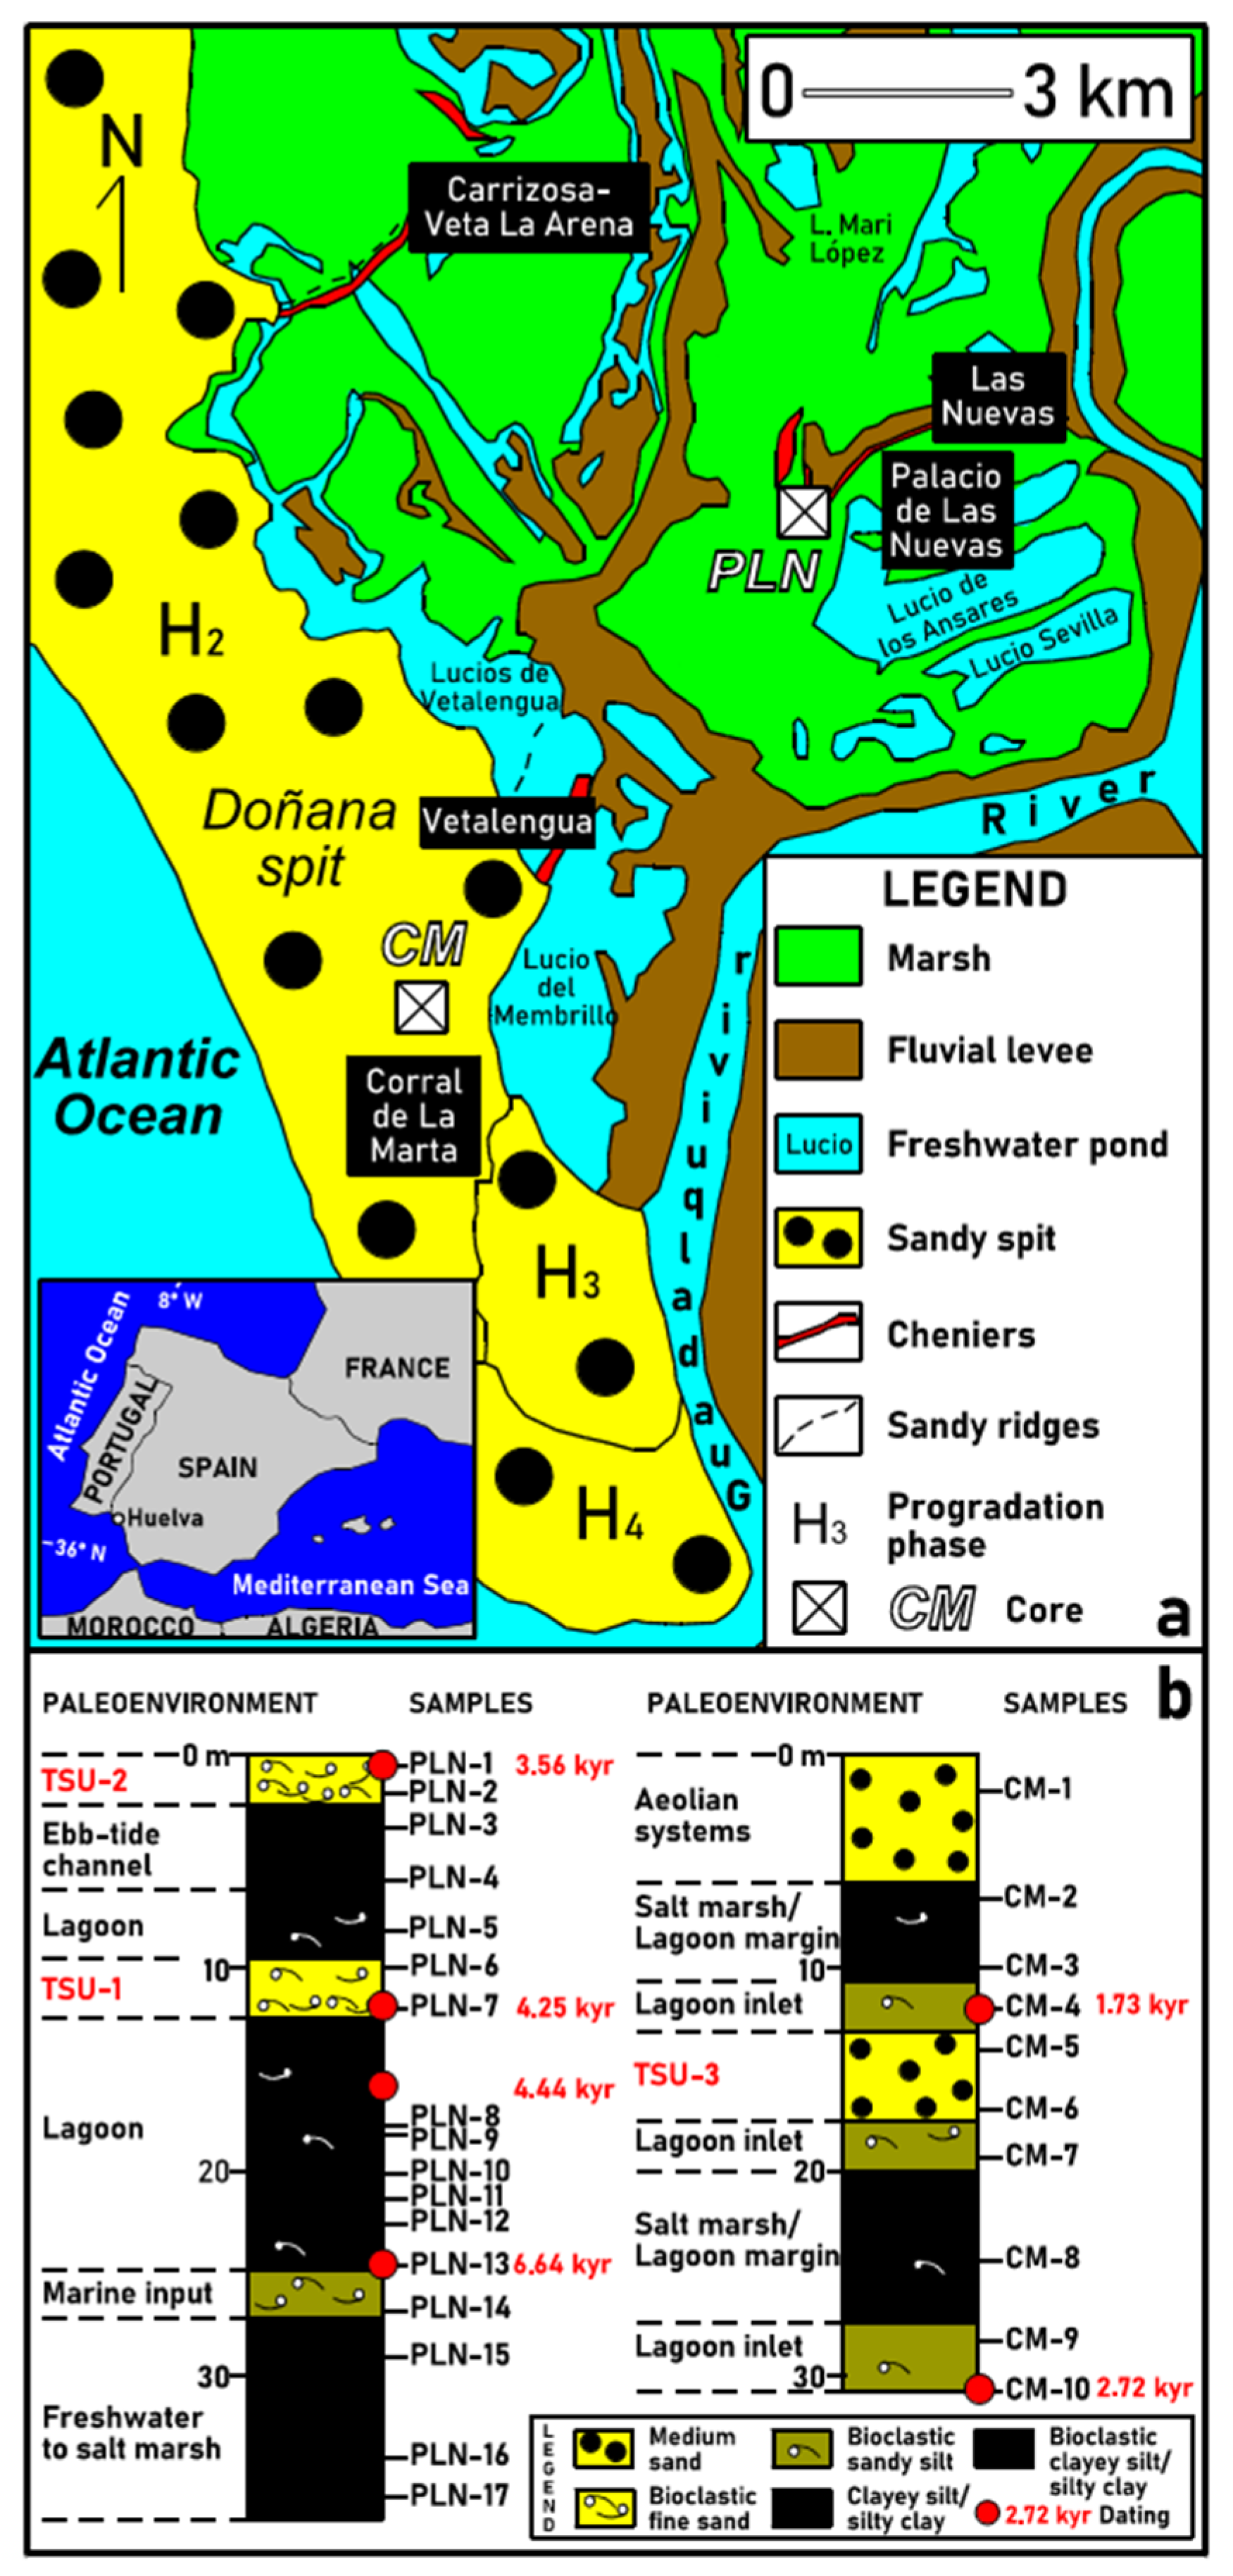
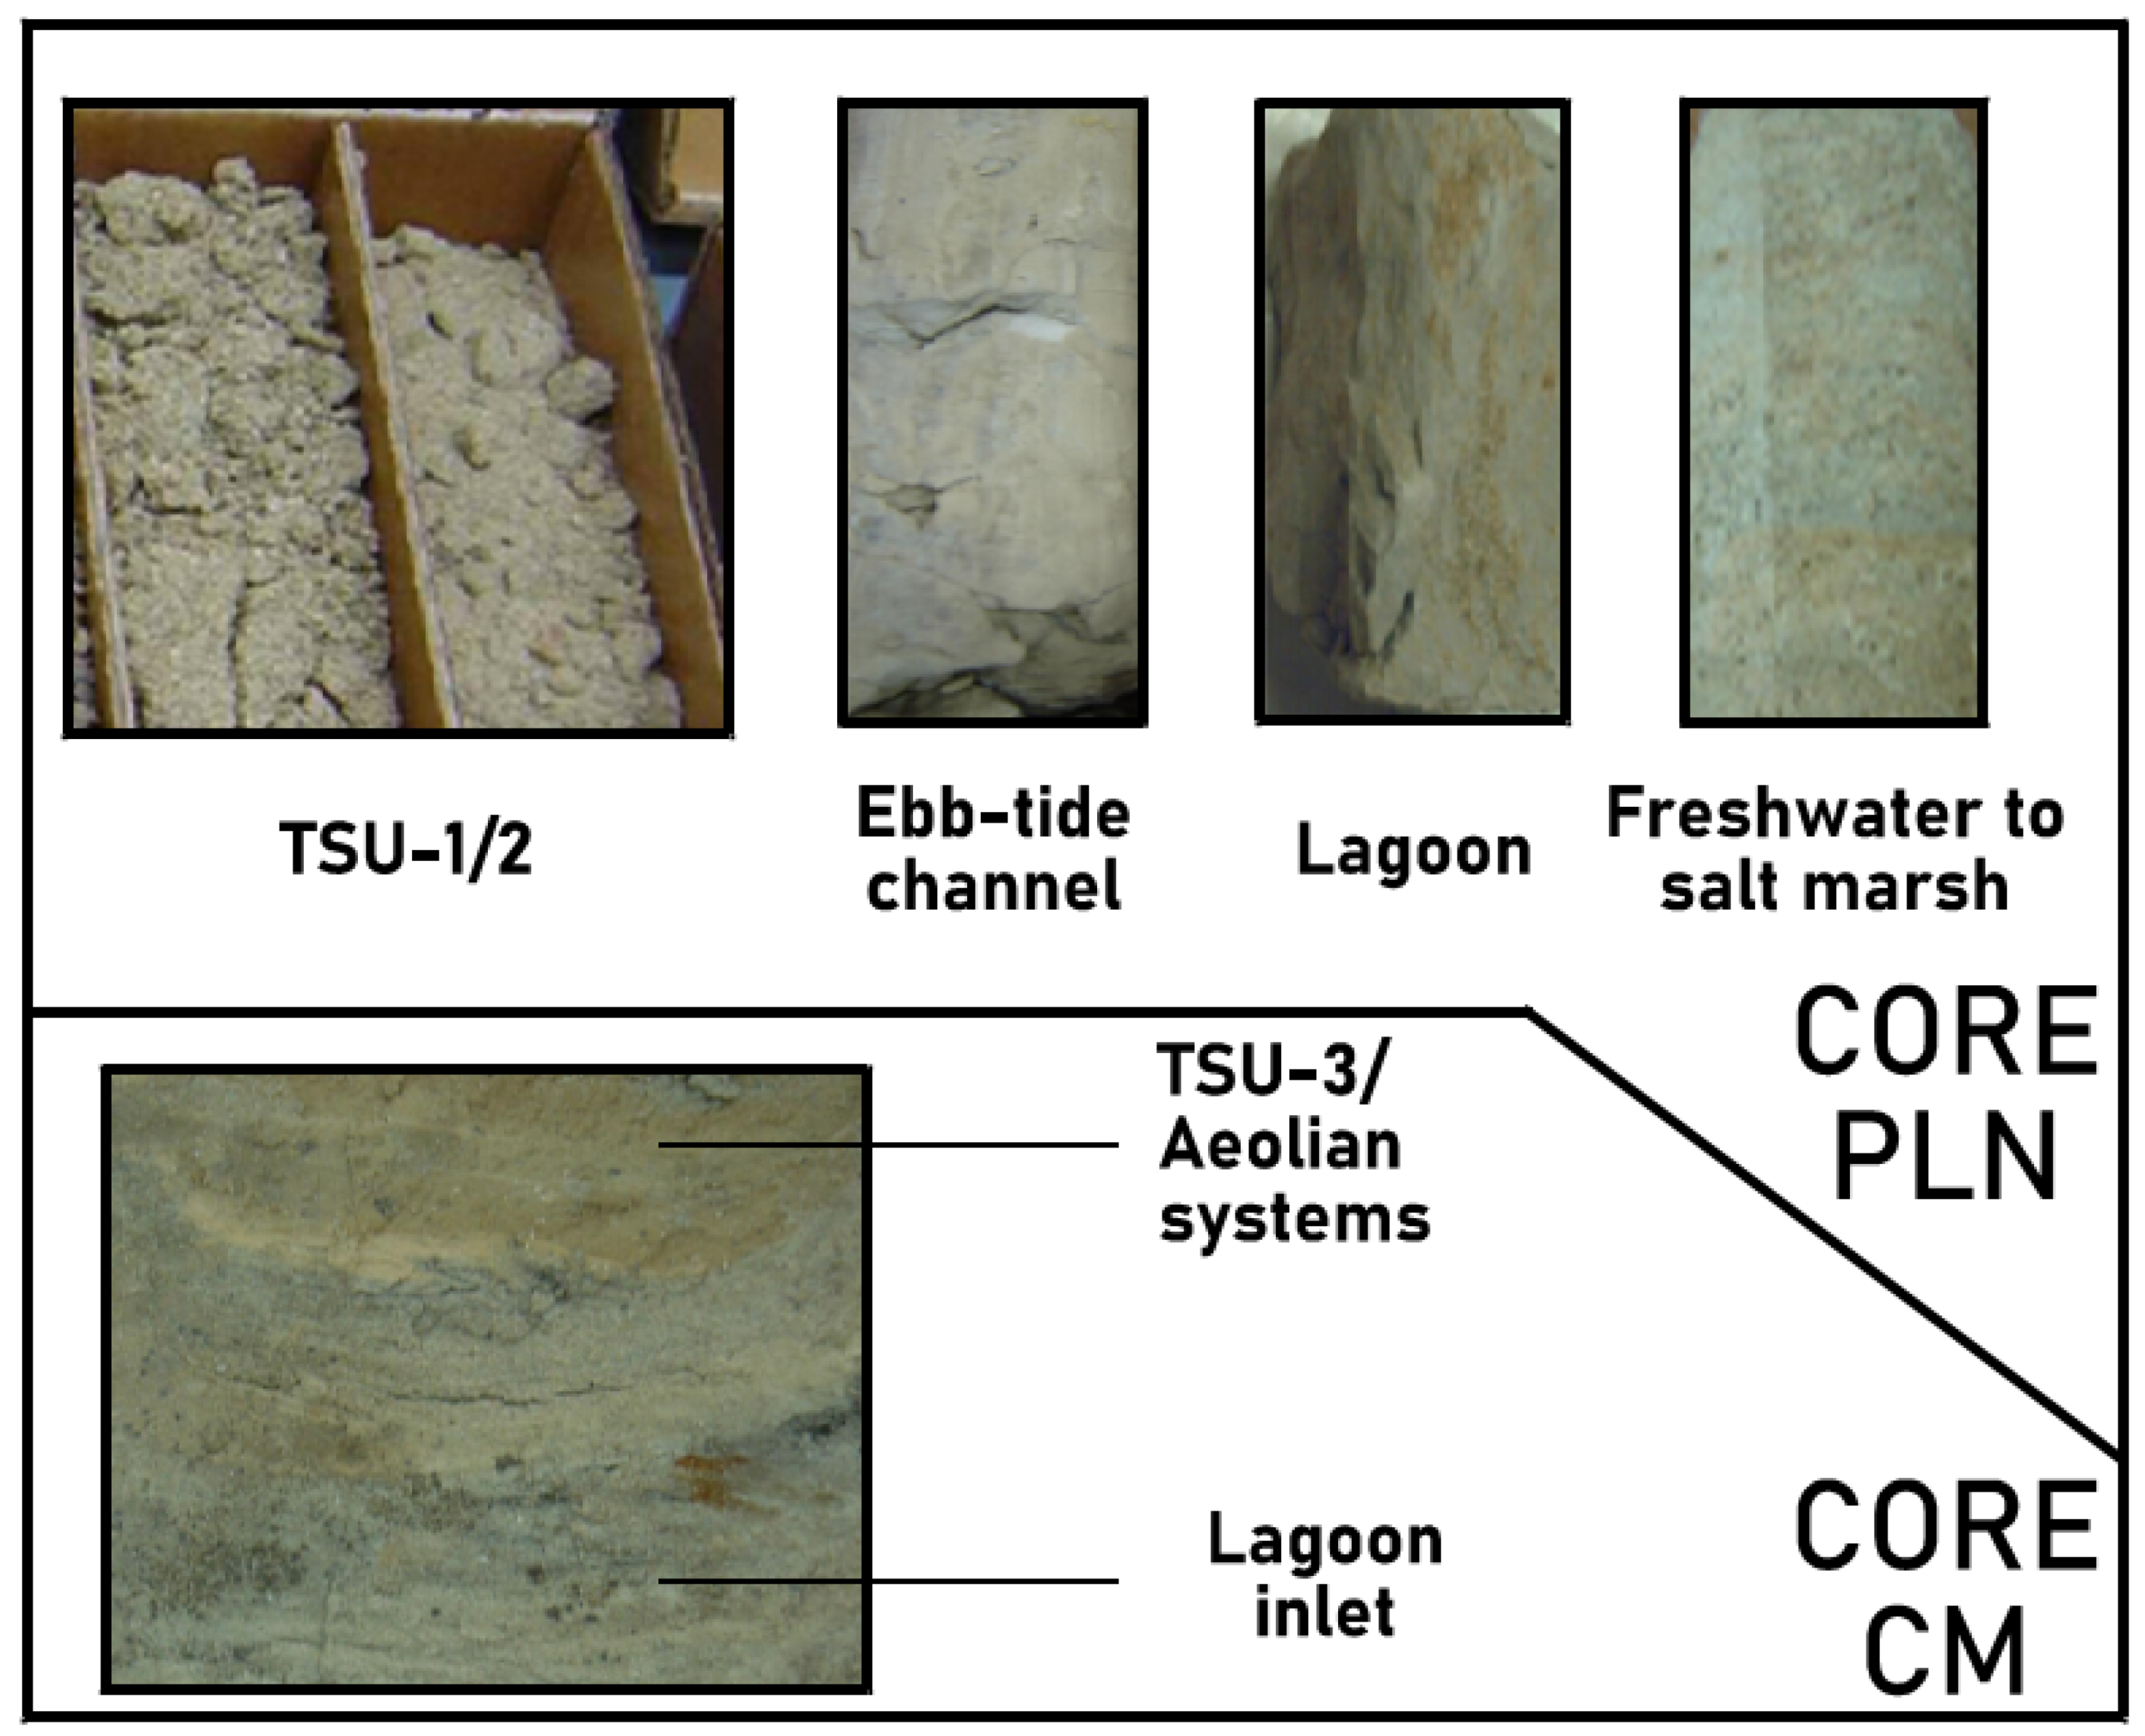
2.3. Cores PLN and CM

Two cores (Figure 2b; core PLN: 36.5 m; core CM: 31 m) drilled by the Spanish Geological and Mining Institute (IGME) were selected. Core PLN was located in the central sector of the Doñana National Park (Figure 2a), close to the so-called ‘Palacios de las Nuevas’ and the Caño del Tiro tidal channel. A multidisciplinary study of this core allowed its paleoenvironmental reconstruction [19]. The basal marshes (Figure 3) were flooded during the maximum of the Fladrian transgression (Figure 2b: marine input; ~6500 cal yr BP; [21]), evolving into a restricted brackish lagoon (called the Lacus Ligustinus by the Romans). Two tsunamis caused the deposition of bioclastic fine sands (Figure 2b-Figure 3: TSU-1 and TSU-2) around 4.25 cal kyr BP and 3.56 cal kyr BP, respectively. This core was located in the inner areas of this old lagoon.
Core CM was located in the outer sector of the Doñana National Park, inside the Doñana spit and close to the so-called ‘Corral de la Marta’ (Figure 2a). The sedimentary record of this core was subdivided into four facies, with several transitions from a lagoon inlet to a salt marsh/lagoon margin, and the presence of aeolian systems in the uppermost part of this core (see Figure 3). These periodic transitions were interrupted by high-energy events, which caused the deposition of a thick sandy layer (Figure 2b: TSU-3) near the mouth of this old lagoon from 2.2 to 2 kyr BP [20].

3. Materials and Methods

3.1. Sampling

Seventeen samples were selected from the different sedimentary facies of core PLN, including two layers of each tsunamiites (Figure 2b). In addition, ten samples were selected from core CM, two of which were extracted from TSU-3. The different characteristics of these samples (texture, mineralogy, major elements) and dates are reported in a previous paper [19].

3.2. Analytical Methodology

The chemical analyses were performed by Activation Laboratories, Ancaster, ON, Canada. The element concentrations of the metals were determined on the <63 μm fraction by: (a) Instrumental Neutron Activation Analysis (INAA) for Light Rare-Earth Elements (LREE: La, Ce, Nd, Sm, Eu), some Heavy Rare-Earth Elements (HREE: Yb, Lu), some LILE (Rb, Cs, Ba), HFSE (Th, U, Hf) and other elements (Br, Cr, Sc, Co); (b) Near total-digestion (HF-HNO3-HClO4-HCl method) Inductively Coupled Plasma–Mass Spectrometry (TD-ICP-MS) for Y, some LILE (Sr) and other elements (S); and (c) X-Ray Fluorescence (XRF) for other elements (Al, Na, Ti). The calibration is based on the analysis of international standard reference materials (e.g., BE-N, DMMAS-105, GXR-1, GXR-2, GXR-4, GRX-6, NIST-694, OREAS 13P, SCO-1, SDC-1, SGR-1, STM-2, W-2a or ZW-C, among others). The variation between the three different replicate samples does not exceed 5%. The detection limits are different for each element (see Figure 4, Figure 5 and Figure 6). The selection of these chemical elements will help us to obtain information about their application as proxies to identify: (a) a marine vs. terrestrial source; (b) high-energy events; (c) the redox conditions, and (d) the sediment provenance (parent rock).
The results were compared with those extracted from a previous paper [19]. In this paper, the mineralogical analysis of the samples was carried out by means of X-ray diffraction (XRD) using SIEMENS D-5000 equipment with a scanning speed of 1° 2θ/min and Cu-kα radiation (40 kV, 20 mA). The XRD studies were carried out on randomly oriented bulk samples.

3.3. Statistical Procedures

The statistical treatment of the sediment geochemistry was conducted with procedures developed in the R program [24]. In the first step, the tolerance intervals (2σ) were calculated for each element, and the results were compared with those obtained at the base and top of each tsunamiite, in order to be able to conclude if its geochemical content is distinctive in relation to the rest of the lagoonal facies. In the second step, the Pearson correlation coefficients were calculated to determine the different geochemical associations. In the third step, a factor analysis was applied to both elements and samples. The Kayser–Meyer–Olkin index was selected to test the relevance of this multivariate analysis. This index is a measure of sampling adequacy that is recommended to check the case-to-variable ratio for the analysis being conducted. In the fourth step, a Varimax rotation was applied, which maximizes the correlations between the variables and components.
The previous statistical procedures were applied in order to determine the relationship between the mineralogy and the geochemistry of the studied samples. The mineralogical data were extracted from [19,20] (Table 1), and the final number of variables (mineralogy: 8; geochemistry: 24) was reduced, since this number must be less than the number of samples (27) in order to perform the factor analysis. Some variables with very low values were excluded (halite, aragonite, gypsum, Eu, Lu, Tb), as well as others with extreme variability (e.g., Ba).

3.4. Dating

The ages of six different samples were extracted from previous studies (Table 2; [19,20]). These dates were recalibrated using the Marine13 calibration of the program Calib. 7.1, with the application of a new reservoir correction determined for this area (−108 ± 31 yr). In these previous papers, a different reservoir effect was applied (−135 ± 20 yr), and the newly calibrated ages were between 200 and 300 years older than those previously calculated (Table 2).

4. Results and Discussion

4.1. Dating

The application of this new reservoir effect significantly changes the age of the tsunamites contained in the cores PLN and CM. The mean calibrated age of the oldest tsunamiite (core PLN: TSU-1) is 4.25 cal kyr BP, while the uppermost tsunamiite of this core has a mean calibrated age of 3.56 kyr (Table 2; TSU-2). The age of TSU-3 (core CM) is between two mean calibrated dates (maximum of 2.7 cal kyr BP and minimum of 1.7 cal kyr BP), and it could be due to a tsunami [20]. Consequently, an approximated age (2.2–2 cal kyr BP) was attributed to this layer.

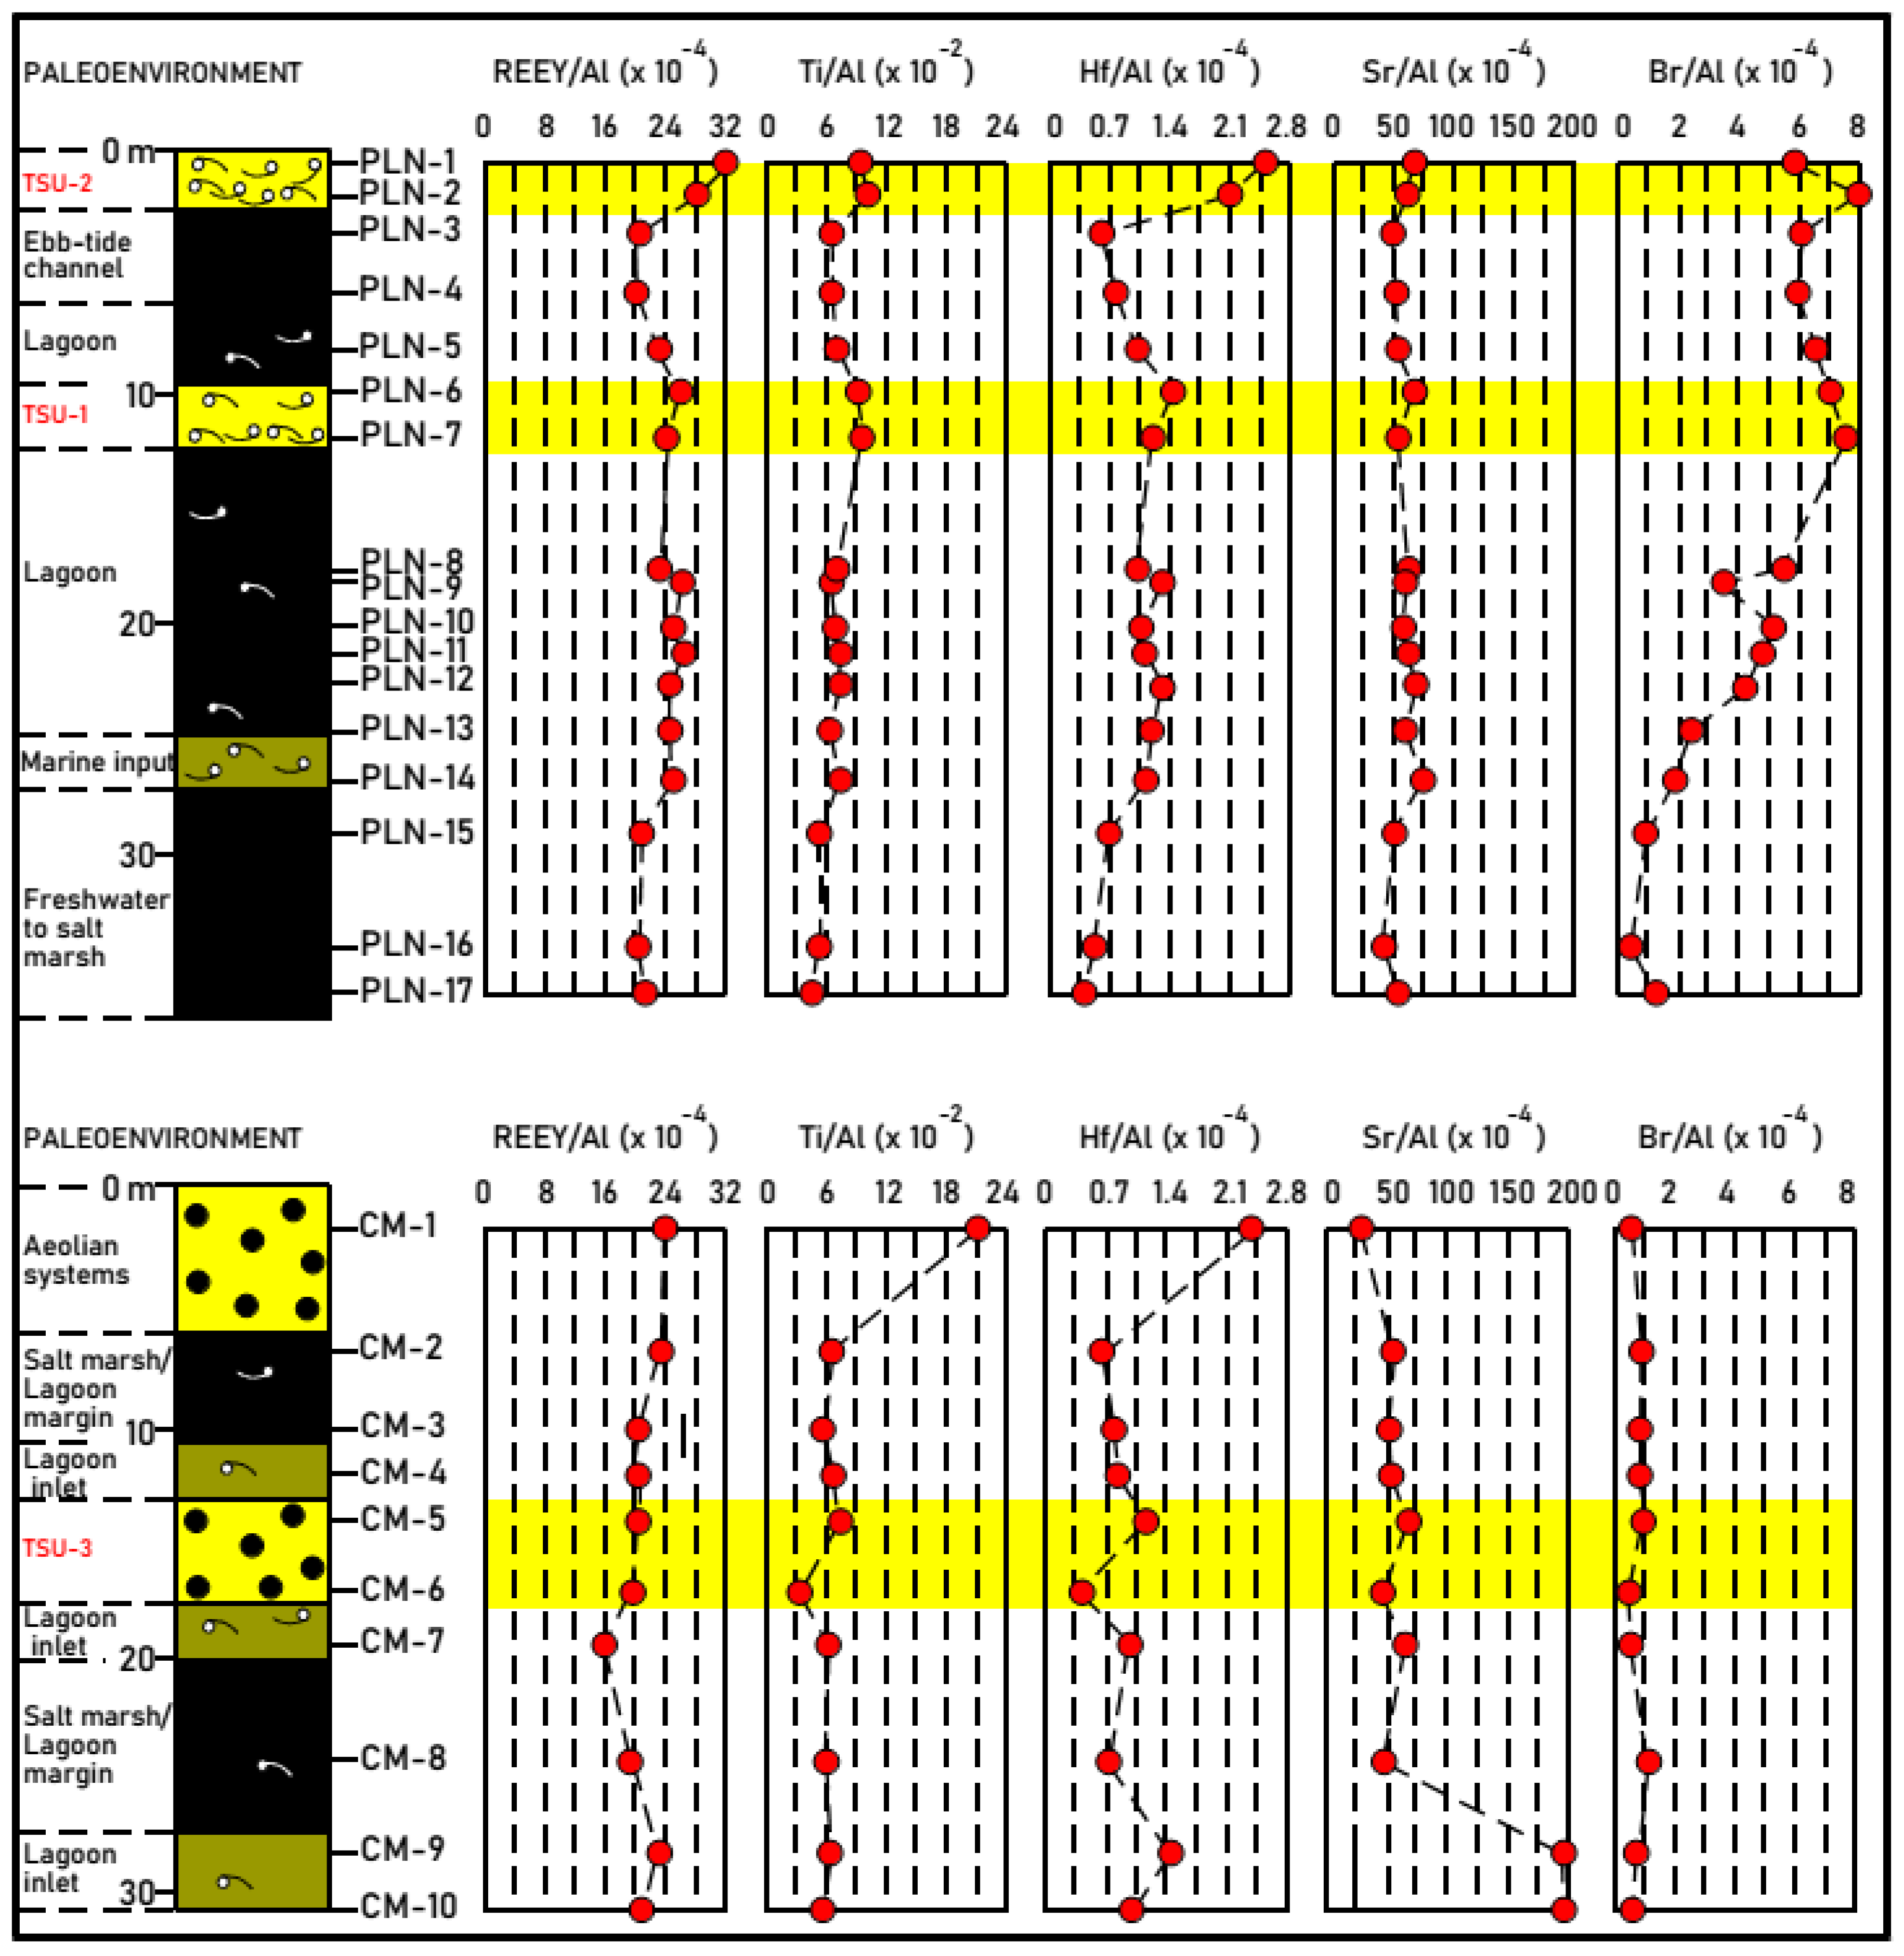
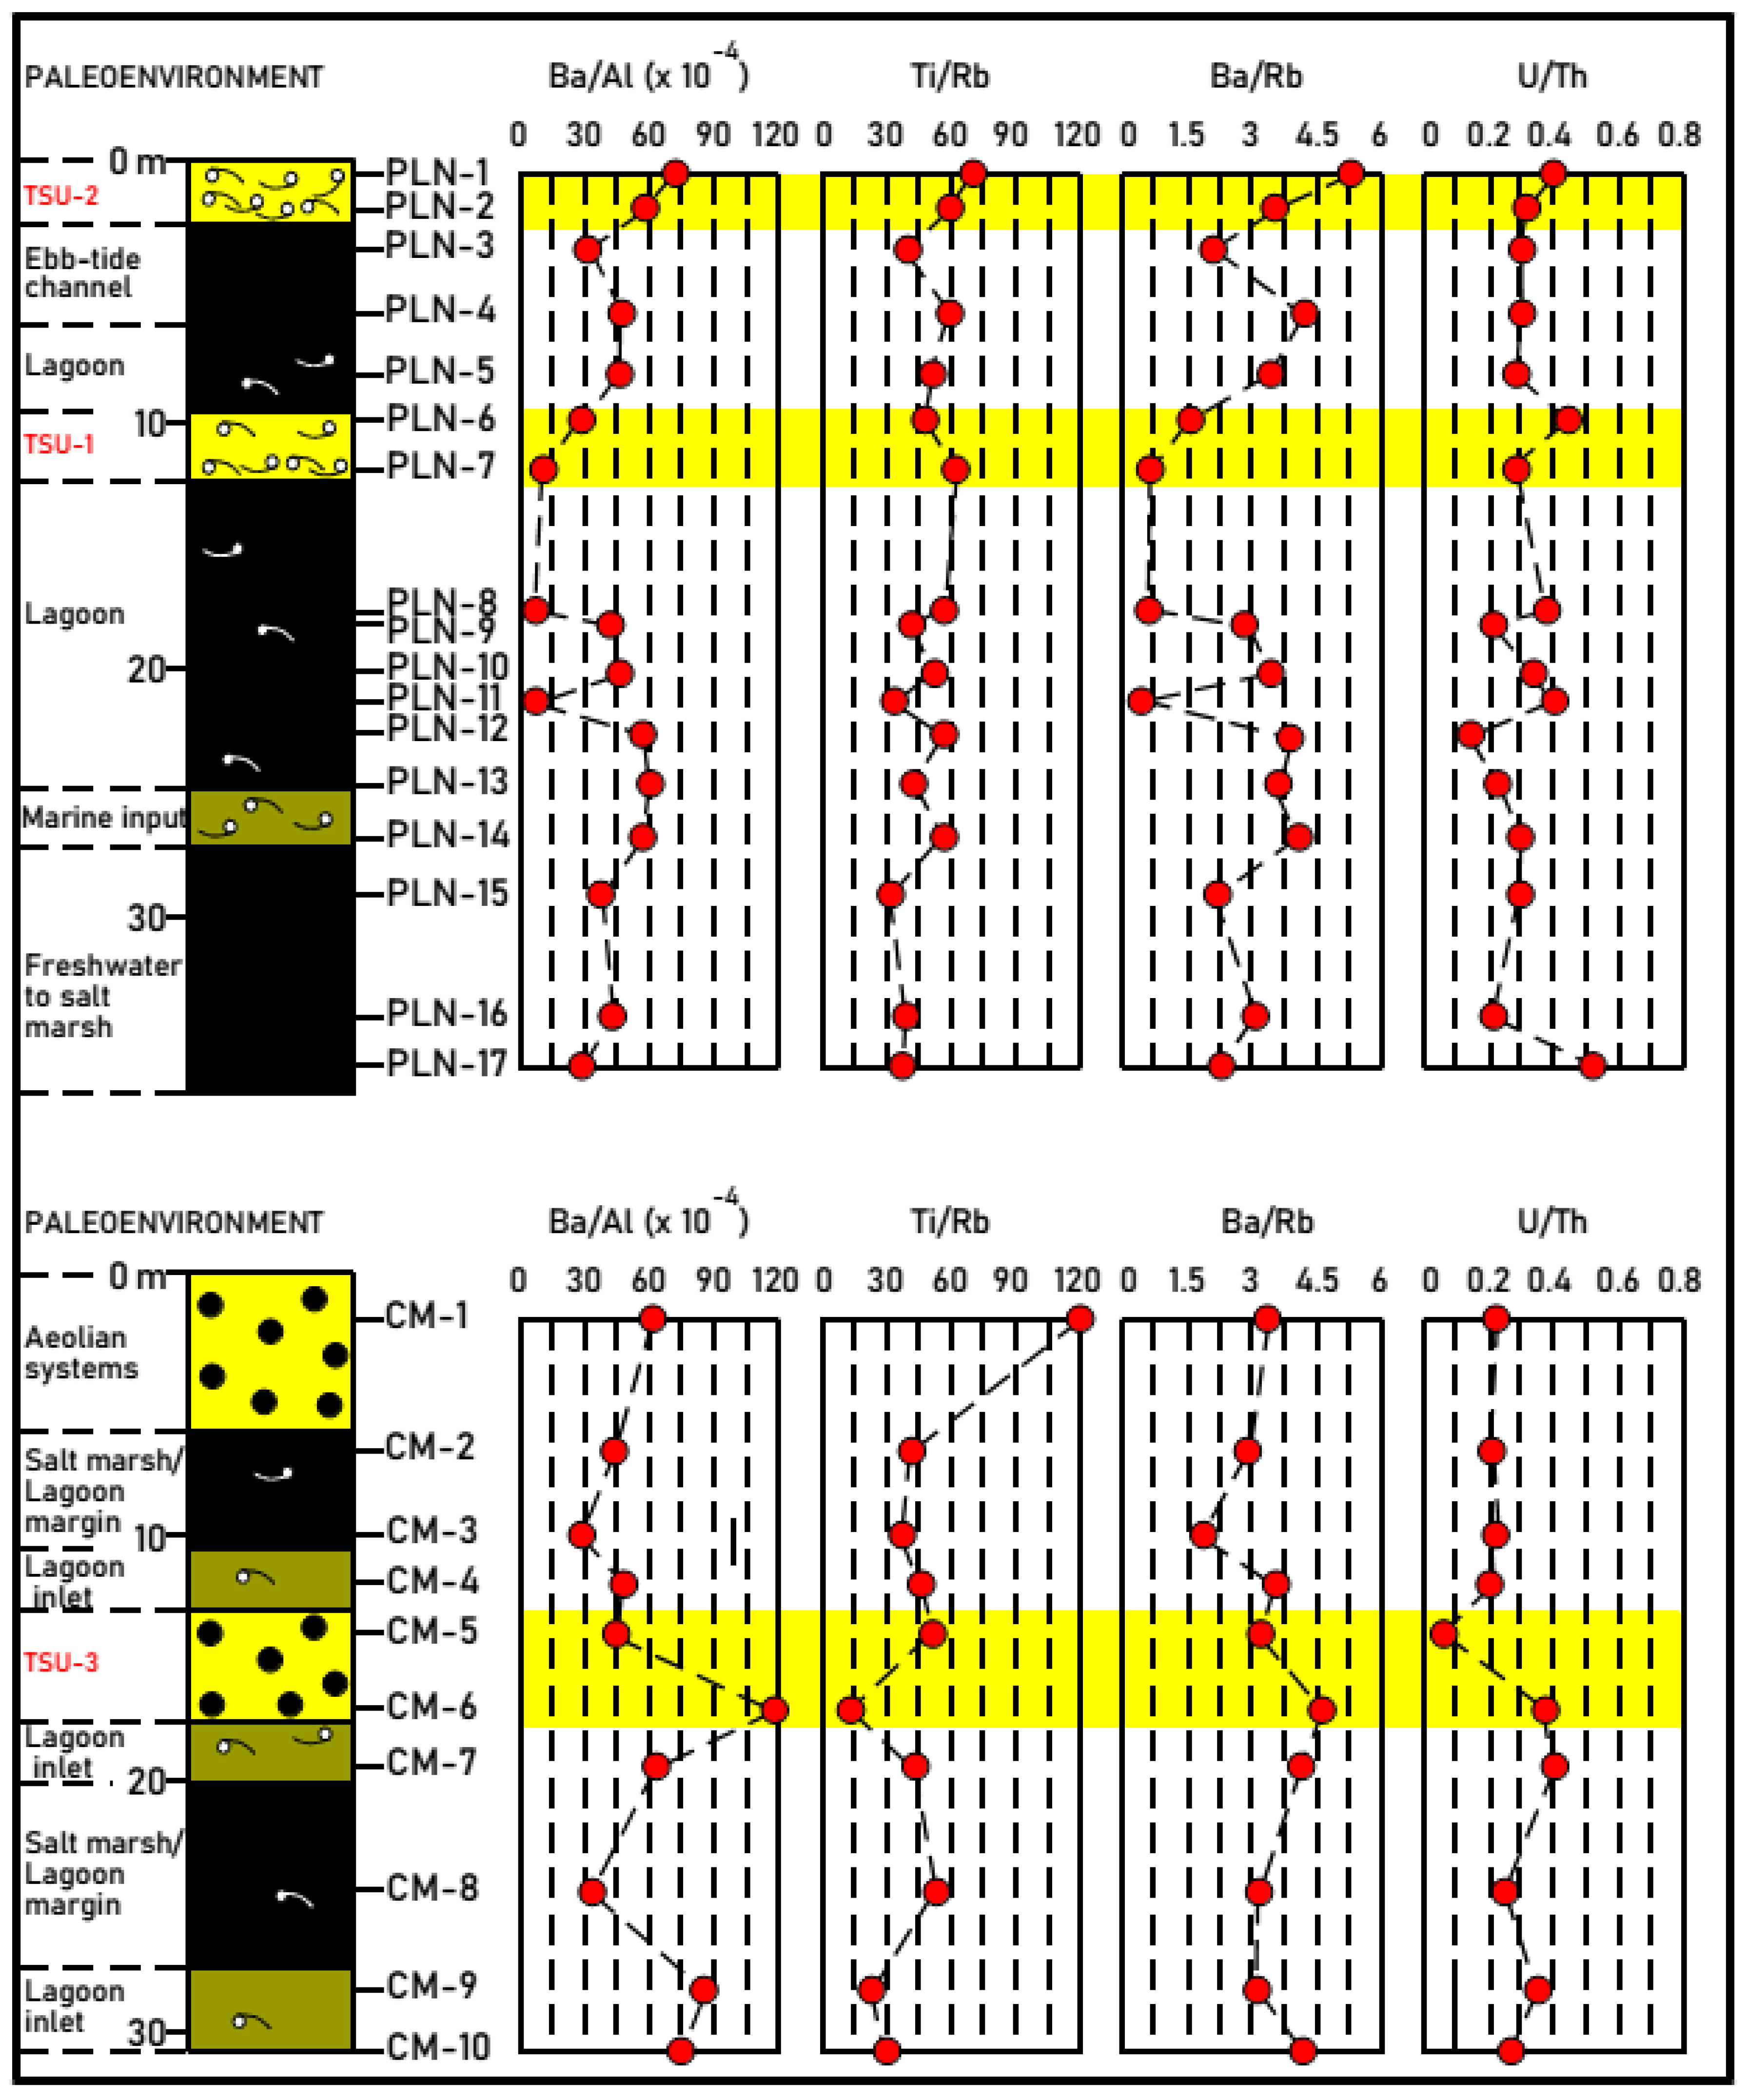
4.2. Geochemical and Mineralogical Trends

The results obtained in the geochemical analysis of the samples are shown in Figure 4, Figure 5 and Figure 6. The chemical elements were grouped into REE-Y, LILE, HFSE, and other elements. The mineralogical analyses of the samples, coming from previous works (see Section 3.3), were also included, in order to compare the geochemical and mineralogical changes of the tsunamiites.

4.2.1. TSU-1 (~4.25 cal. kyr BP)

Geochemical Changes

TSU-1 consists of yellowish to greyish-brown sandy silts to silty sands with scarce shells and fragments of bryozoans (PLN-6). This unit includes a basal, fine level of fine silty sands, characterized by numerous fragmented shells (PLN-7) and up to 2.6% material >2 mm. This tsunamiite is deposited on grayish green mud (PLN-8) (Figure 2b).
The geochemical results obtained show variations in the contents of the REE (both LREE and HREE) and Y (Figure 4). Their contents are maintained or decreased in TSU-1 with respect to the lagoon deposits, highlighting the impoverishment in La (lagoon: 31.8 ppm; basal layer of TSU-1: 26.9 ppm), Ce (lagoon: 56 ppm; basal layer of TSU-1: 43 ppm), Sm (lagoon: 5.4 ppm; basal layer of TSU-1: 4.36 ppm) and Yb (lagoon: 2.6 ppm; basal layer of TSU-1: 2.1 ppm). This impoverishment exceeds 20% for these elements. At the top of the tsunamigenic deposit, the content of all of the REE increases. An exception is the Y, which decreased slightly (Figure 4).
Taking into consideration the LILE elements, it has been observed that, in TSU-1, these elements practically did not change their content (Rb, Sr and Ba) when passing from the lagoon to this tsunamiite, and only the Cs show a small decrease (2 ppm) (Figure 5). At the top of the tsunamigenic deposit, the content of Rb (73 to 101 ppm), Cs (5 to 6 ppm) and Ba (50 to 160 ppm) increases. Only the Sr (330 a 306 ppm) content decreases, possibly due to a lower proportion of shells (aragonite).
In the HFSE group, the content of Th and Hf show practically no variation with respect to those of the lagoon deposits, while the U decreases only by 1.3 ppm (Figure 5). At the top of this tsunamiite, the proportion of Th is maintained, but the contents of U (2.5 to 4.6 ppm) and Hf (6 to 8 ppm) increase.
Compared to the underlying lagoon deposits, TSU-1 contains higher concentrations of Na (1.06 to 1.32%), Ti (0.42 to 0.47%) and Br (32.8 to 37.4 ppm), and lower concentrations of Al (4.9 to 5.89%) and S (0.19 to 0.31%) (Figure 6). At the top of TSU-1, a significant decrease in the content of Na (1.32 to 1.19%) was observed, whereas the content of the other elements is maintained (Ti) or increased, as is the case of Al (4.9 to 5.48%), S (0.19 to 0.3%) and Br (37.4 to 38.9%).
At the base of TSU-1, the Co content is maintained, decreasing slightly at the top (3 ppm). Both Cr and Sc initially decrease, but increase at the top. The variations are especially relevant in the case of the Cr, which decreases by 21 ppm at the base and then increases by 16 ppm at the top.

Mineralogical Changes

From a mineralogical point of view, the passing from the lagoon deposits (PLN-8) to TSU-1 (PLN-7) shows the decrease of phyllosilicates (51 to 35%) and calcite (21 to 12%), but an increase of dolomite (5 to 24%) and feldspars (7 to 13%) (Table 1). At the top of this tsunamiite (PLN-6), feldspars (13 to 24%) and calcite (12 to 22%) increase again, but dolomite decreases (24 to 9%). The presence of halite has been observed in this tsunamiite (up to 4%), despite being absent in the underlying lagoon deposits.

Environmental Setting

TSU-1 is deposited at the bottom of a lagoon, and is preserved in a submerged area, since the overlying facies are also from a lagoon. The mineralogical and geochemical results clearly differentiate the tsunamiite deposit from the underlying deposits. With the exception of a few elements (Y, Rb, Ba, Al, U), the geochemistry of the tsunamiite’s top shows similarities to the overlying lagoon deposit. This could indicate a physical mixing between the top of TSU-1 and the overlying lagoon sediments, resulting in a sediment with mixed geochemical features (Figure 2b: PLN-6).

4.2.2. TSU-2 (~3.56 cal. kyr BP)

Geochemical Changes

TSU-2 consists of greyish to dark yellowish-brown (Figure 3: 10YR4/2) silty sands to sandy silts with abundant disarticulated valves and fragments of bivalves, together with frequent carapaces of gastropods (PLN-1, 2). It is deposited on greyish green muds with fragments of shells (PLN-3) (Figure 2b).
In this tsunamiite, a greater increase in the contents of La (51 to 62 ppm), Sm (5.19 to 6.22 ppm), Yb (2.4 to 2.9 ppm), Lu (0.36 to 0.45 ppm) and Y (22 to 24 ppm) is observed with respect to the underlying tidal channel deposits (Figure 4). This tsunamiite shows very little variation in the contents at its top, with the exception of the Nd, which increases by 6 ppm.
Regarding the LILE elements, a decrease in Rb (106 to 93 ppm) and Cs (7 to 6 ppm) was observed with respect to the ebb-tide channel deposits, perhaps due to lower phyllosilicate content. Other elements of the group, such as Sr and Ba, increase by 34 and 120 ppm, respectively (Figure 5). At the top of this tsunamigenic deposit, the Sr and Cs contents are maintained, but the Rb content decreases by 24 ppm and the Ba content increases by 30 ppm. The most remarkable of these elements is the content in Ba at the top of TSU-2, where it reaches 360 ppm, which is more than double that observed in TSU-1.
In TSU-2, there is a slight increase in Th and U, and a more important increase in Hf compared to the underlying ebb-tide channel sediments. At the top of the tsunamigenic deposit, the content of Th is maintained, but the contents of U and Hf are increased even more (Figure 5). Regarding other elements, in the passing of the tidal channel deposits to TSU-2, the content of Al (6.57 to 5.70%) and S (0.54 to 0.31%) decreases, while the contents of Na (1.21 to 1.32%), Ti (0.43 to 0.56%) and Br (40.8 to 45.7 ppm) increase (Figure 6). At the top of the tsunamigenic episode, the content of Al (5.70 to 5.13%), Na (1.32 to 0.92%), Ti (0.56 to 0.49%) and Br (45.7 to 30.2 ppm) decreases. In addition, the Co, Cr and Sc contents are practically maintained at the base of the TSU-2, decreasing at the top, especially the Cr content (12 ppm).

Mineralogical Changes

From a mineralogical point of view, the passing from the ebb-tide channel deposits (PLN-3) to TSU-2 (PLN-2) shows the decrease in the phyllosilicate content (54 to 33%) and the increases in quartz (10 to 14%), feldspars (3 to 8%) and especially calcite (19 to 31%) (Table 1; [19]). This calcite content is a consequence of the increase of mollusc shells. At the top of this tsunamiite (PLN-1), phyllosilicates increase (33 to 42%), but both calcite (31 to 28%) and dolomite (11 to 7%) decrease. The occurrence of halite was observed in both the ebb-tide channel deposits and this tsunamiite (up to 3%), and gypsum (up to 2%), mostly in the first.

Environmental Setting

TSU-2 was deposited on the margin of a tidal channel, and has remained there ever since. From a mineralogical point of view, the tsunami (~3.56 cal. kyr BP) caused an increase in calcite against phyllosilicates, possibly due to the accumulation of shells and fragments of mollusc shells (bioclasts). The geochemistry of the base and top of TSU-2 is more similar to that observed in TSU-1. On the other hand, the top of TSU-2 has remained emerged until now, and so the meteorization processes have been able to act in different degrees. In this tsunamiite, the small decrease of calcite (3%) may be due to the partial dissolution observed in the mollusc shells observed near the top, while the increase in phyllosilicates would be associated with new contributions from the nearby marshes or the tidal fluxes.

4.2.3. TSU-3 (~2.2–2 kyr BP)

Geochemical Changes

TSU-3 is formed, at its base, of fine to medium-grain yellowish sand, which is poorly consolidated (Figure 3), with moderate to good sorting, and subrounded to rounded grains (CM-6). The top is light brown to grey mud, with a deformed parallel lamination made up of layers of clay and fine sand (CM-5) (Figure 2b). It is deposited on fine to medium sand, which is dark brown in colour, with regular to moderate sorting (CM-7).
In TSU-3, REE (especially La, Ce and Nd), Y, LILE and HFSE decrease in concentrations compared to the underlying lagoon sediments. (Figure 4 and Figure 5). At the top of this tsunamiite, all of these elements present enrichment, especially La (13.6 ppm), Ce (25 ppm), Nd (13 ppm) and Y (10 ppm).
With respect to the other elements, the change from the lagoon inlet deposits to the tsunamiite shows a decrease in the content of Al, Na, S and Ti, while that of Br remains (Figure 6). At the top of TSU-3, there is a general enrichment in Al (3.19%), Na (0.30%), S (0.25%), Ti (0.28%) and Br (3.6 ppm). The base of this tsunamigenic layer shows a decrease in the contents of Co, Cr and Sc (up to 8 ppm in the case of Cr). At the top of TSU-3, all of the elemental concentrations increase: especially Cr, which reaches 25 ppm.

Mineralogical Changes

From a mineralogical point of view, the passing from the lagoon inlet deposits to the tsunamiite shows an increase in quartz (57 to 71%) at the expense of phyllosilicates (9 to 3%) and calcite (10 to 4%) [19]. At the top of this tsunamiite, there is a significant decrease in quartz (71 to 44%) and an increase in phyllosilicates (3 to 15%) and calcite (4 to 20%).

Environmental Setting

TSU-3 was deposited at the intertidal mouth of a lagoon, probably in a tidal delta with subtidal and intertidal areas. Therefore, it was exposed to subsequent tidal action and the modification of its composition, as TSU-1 was, although in a totally different environment. Mineralogically, there are some changes in the tsunamiite with respect to the inlet lagoon deposits. This may be due to the fact that the mouth of the lagoon was already fed by aeolian sediments from the Doñana spit dune ridges. In fact, the mineralogical composition of the base of the tsunamiite is quite similar to that of the Doñana upper aeolian deposits (CM-1), although with less quartz and more feldspars (Table 1; [20]).
The geochemistry of the basal samples of TSU-3 is quite similar to that of the Doñana aeolian systems, although with higher contents in Rb and Ba, and lower concentrations of Hf (Figure 6). The geochemistry of the tsunamiite top is intermediate between that of its base and the subsequent lagoon inlet deposits. This would indicate, as in TSU-1, that its composition would be partially modified by the subsequent tidal action, with potential sediment mixing between the aeolian sediments (e.g., CM-6) and the finer sediments eroded from the adjacent lagoon inlets (e.g., CM-4).

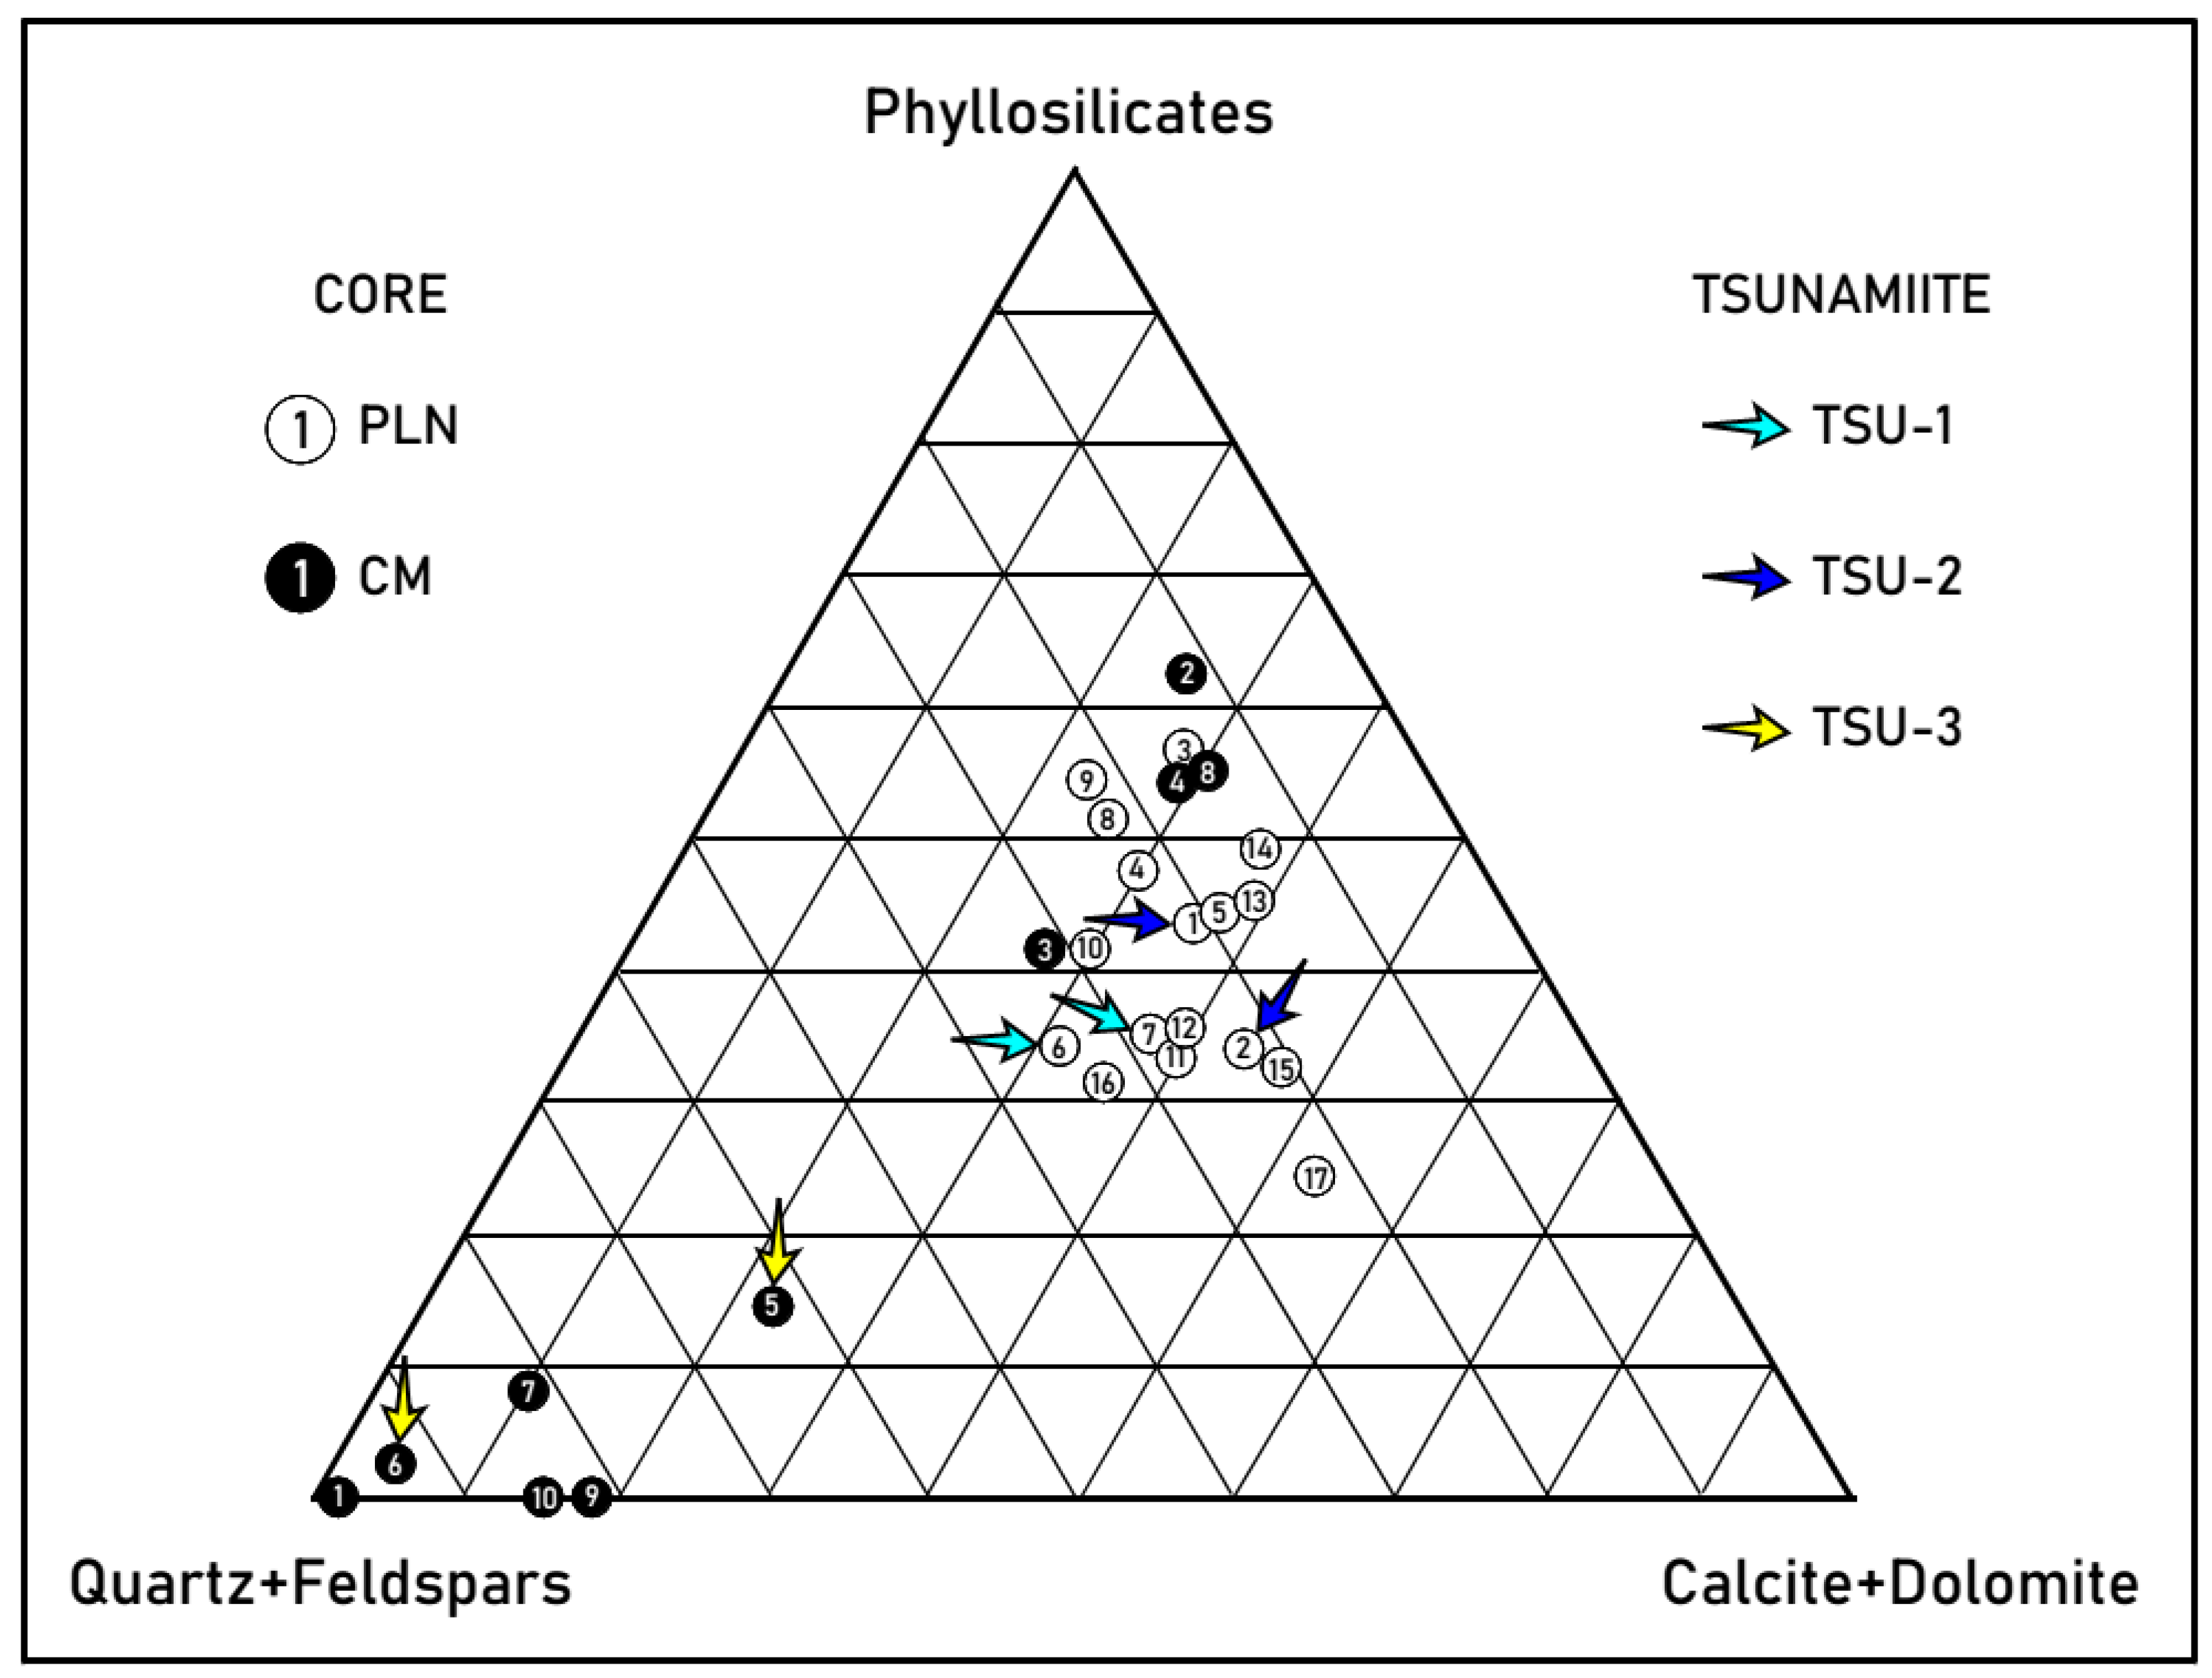
4.2.4. Compositional Variations of Tsunamiites

The results suggest that the origin of the sediments in the three tsunamis is different. All three tsunamiites have distinctive mineralogical features in relation to the underlying sediments, with phyllosilicates being substituted by dolomite and feldspars (TSU-1), calcite (TSU-2) or quartz (TSU-3). The triangular representation of the mineralogical results is shown in Figure 7. The mineralogical complexity of the materials studied was observed, highlighting the differences in the three tsunamiites, with the most terrestrial character (aeolian quartz and feldspars) being observed in the samples belonging to core CM.
These mineralogical differences logically influenced the content and distribution of the analysed trace elements, and also the selected major elements. In this sense, it is important to note that part of the geochemical behavior of the sediments was influenced by the occurrence of heavy minerals [19]. According to these authors, the association of heavy minerals is mainly made up of rutile, zircon, garnet and hornblende (Figure 8), with minor contents of chlorite, epidote, andalucite, kyanite, glaucophane, augite, staurolite and opaques. The average content of heavy minerals in the analysed samples is low (0.9%), with the exception of the TSU-1 and TSU-2 deposits, where they sometimes reach 4.5%. In the latter, the petrographic examination of the grain mounts (0.250–0.125 mm) showed that more than half of the contents correspond to rutile (1.25%) and zircon (1.75%).
The three tsunamiites also exhibit distinctive geochemical characteristics in relation to the underlying sediments in at least 15 elements (Figure 4, Figure 5 and Figure 6: La, Ce, Sm, Yb, Lu, Rb, Ba, Th, U, Hf, Al, Na, S, Ti, Br). Table 3 shows the concentration ranges of the chemical elements analysed according to the sedimentary environment, indicating—in the case of the tsunamiites—the observed values based on their base and top.

4.3. Geochemistry of Trace Elements: Statistical Analysis

This first statistical study of the samples was carried out by means of tolerance intervals (2σ), linear correlation and factor analysis.

4.3.1. Tolerance Intervals and Tsunamiites

The tolerance intervals calculated without the inclusion of the tsunamiites are shown in Table 4. A comparison of its geochemical contents with those of the remaining lagoon facies is interesting, since it allows the differentiation of both the negative and positive outliers; that is, it is possible to discriminate those elements that distinguish these tsunamigenic layers. The basal layers of both TSU-1 and TSU-2 are positive outliers for Na, and even the top of TSU-1 is also an almost-positive outlier for this element. In addition, the base of TSU-2 shows other positive outliers for Hf, Br, and almost for Ti.
TSU-3 represents the opposite case to TSU-1, and above all to TSU-2. The base of this tsunamiite includes negative outliers for fourteen elements, and the values of other three elements (Nd, Eu, S) are near the lower limit of the tolerance interval. This layer is impoverished in these seventeen elements in relation to the rest of the lagoon facies.

4.3.2. Correlation Matrix

This matrix permits us to delimitate two main geochemical associations: (i) Association 1 (La-Ce-Nd-Sm-Eu-Yb-Lu-Y-Rb-Sr-Cs-Th-U-Hf-Al-Ti-Co-Cr-Sc), with very high correlation coefficients among them (p < 0.01; r > 0.8 in most cases, except for U and Hf); (ii) Association 2 (Br-Na), very well correlated among them (r = 0.95; p < 0.01) and, to a lesser extent, with Association 1 (0.42 ≤ r ≤ 0.69; p < 0.01 in most cases). Sulfur and Ba only have significant, but lower, correlation coefficients (r < 0.5; p < 0.05 in most cases) with Association 1. The Pearson correlation coefficients are shown in Table 5.

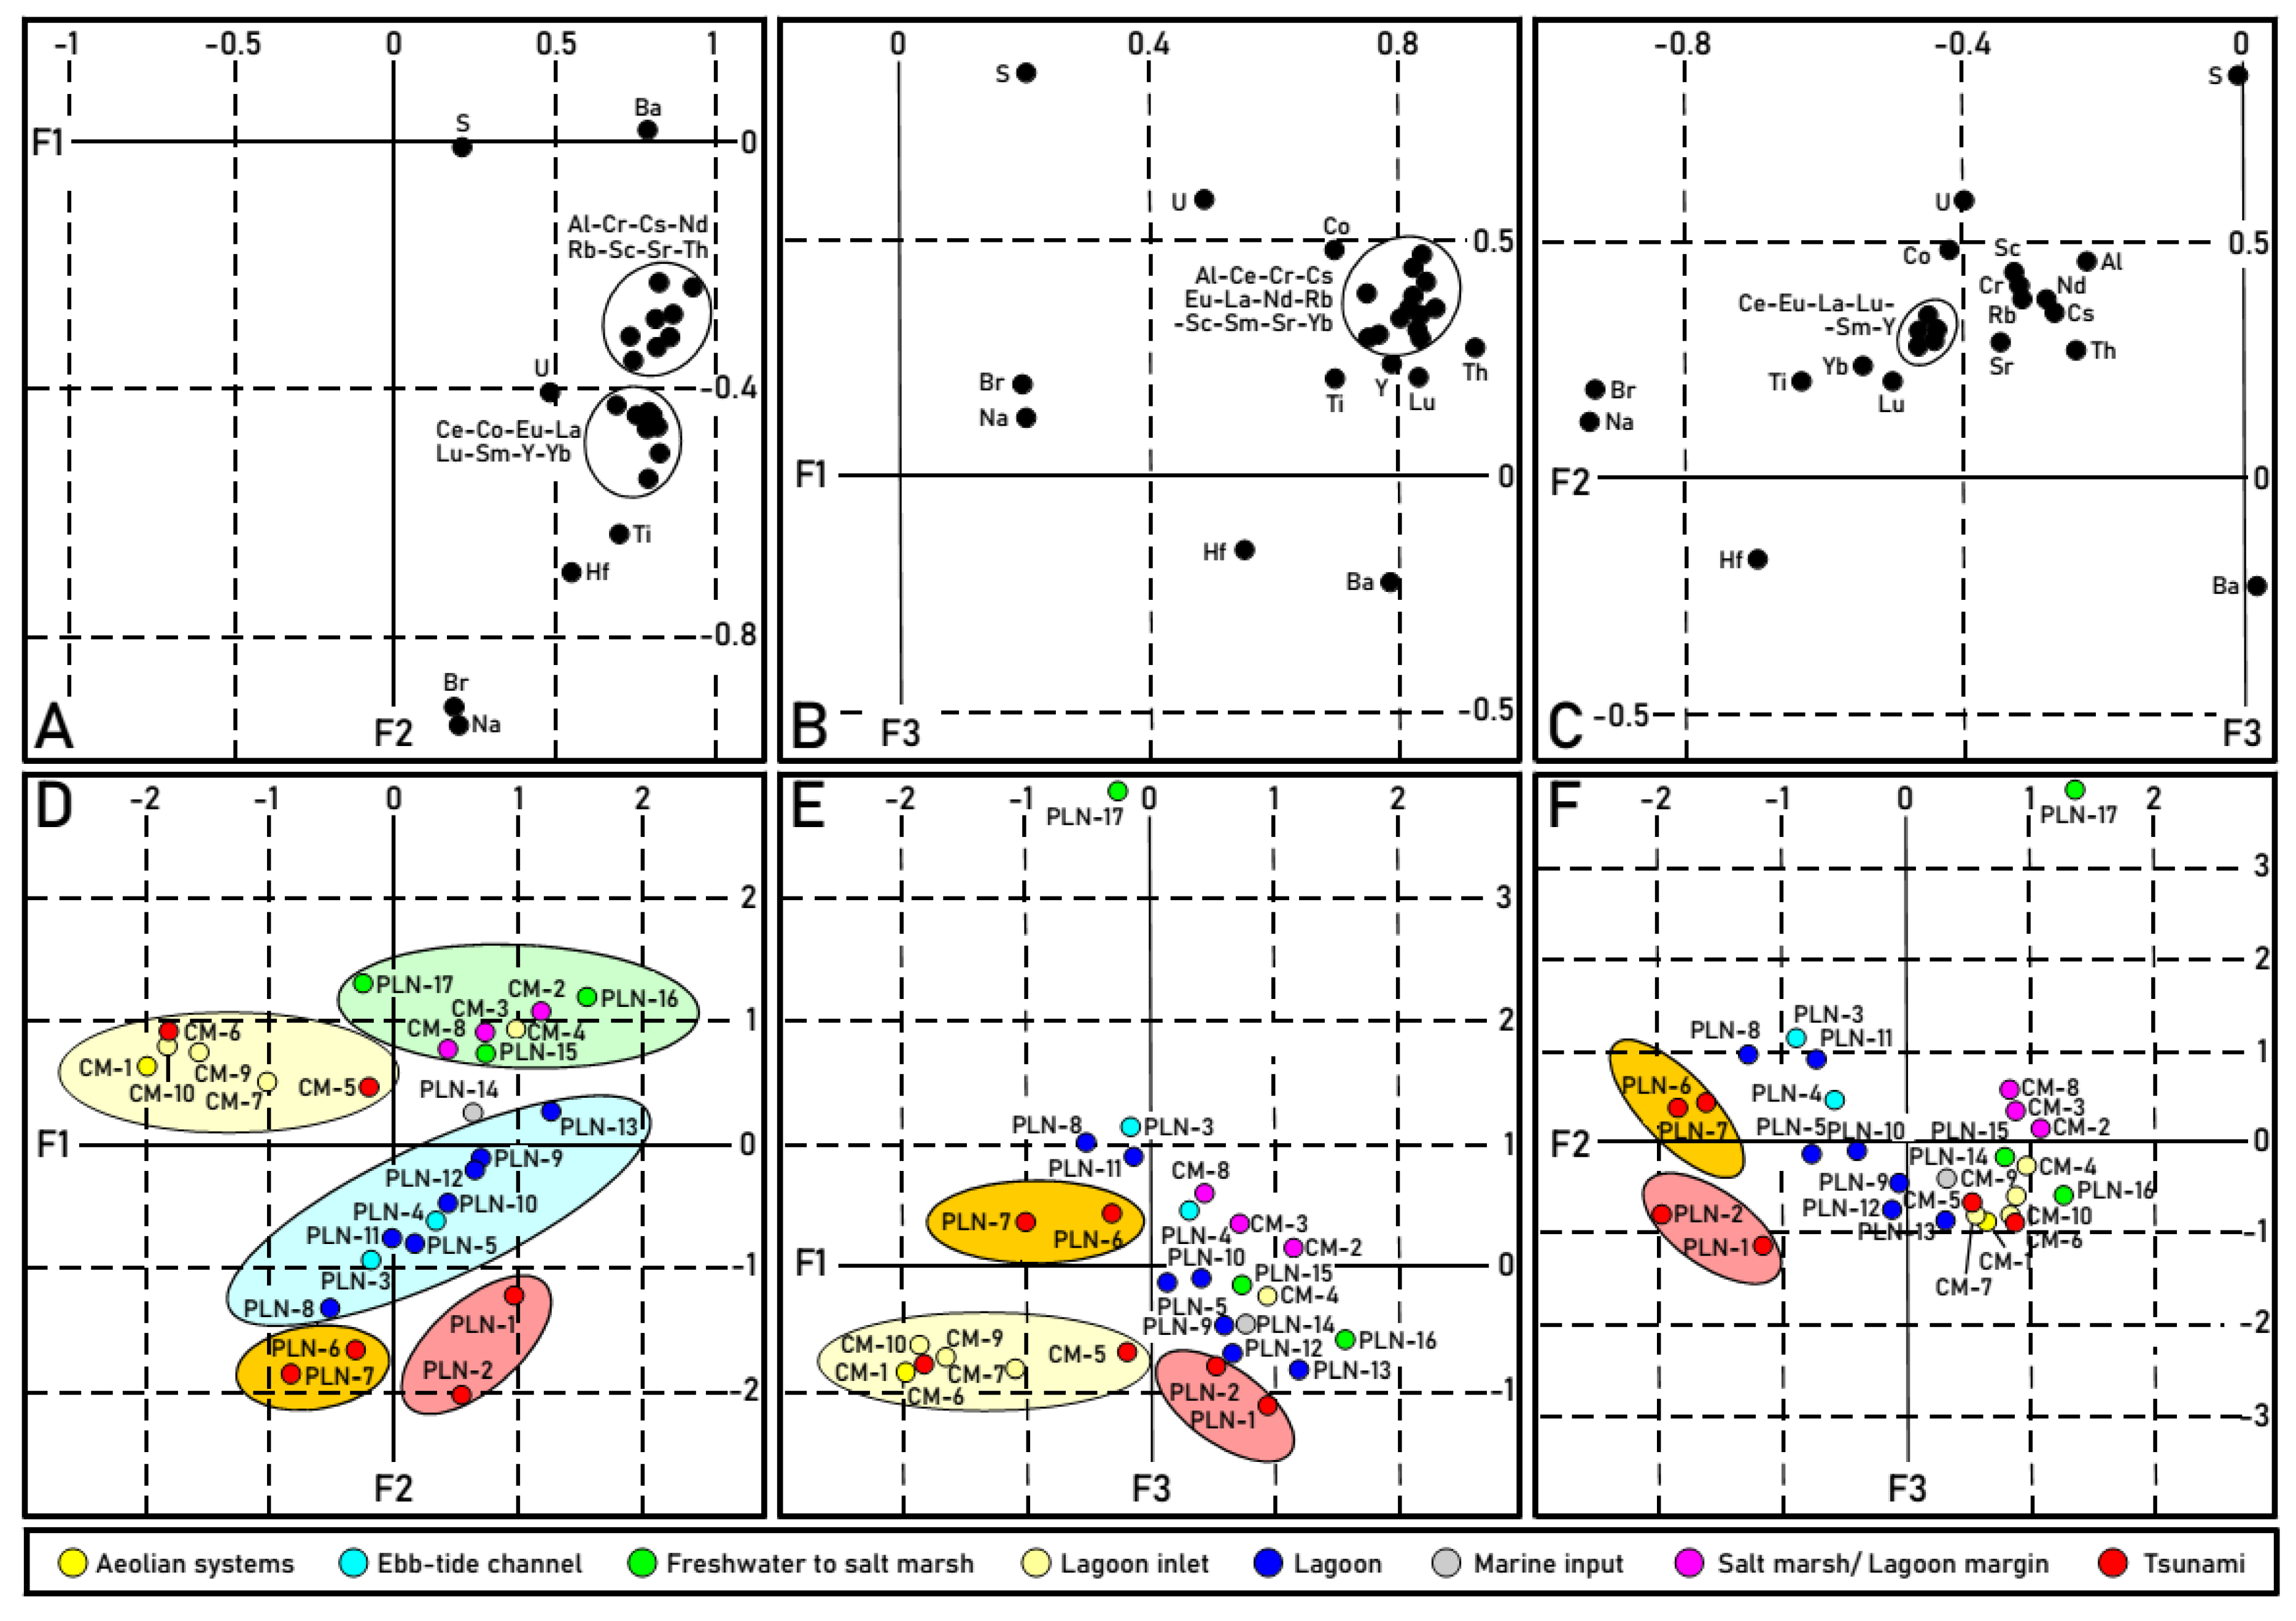
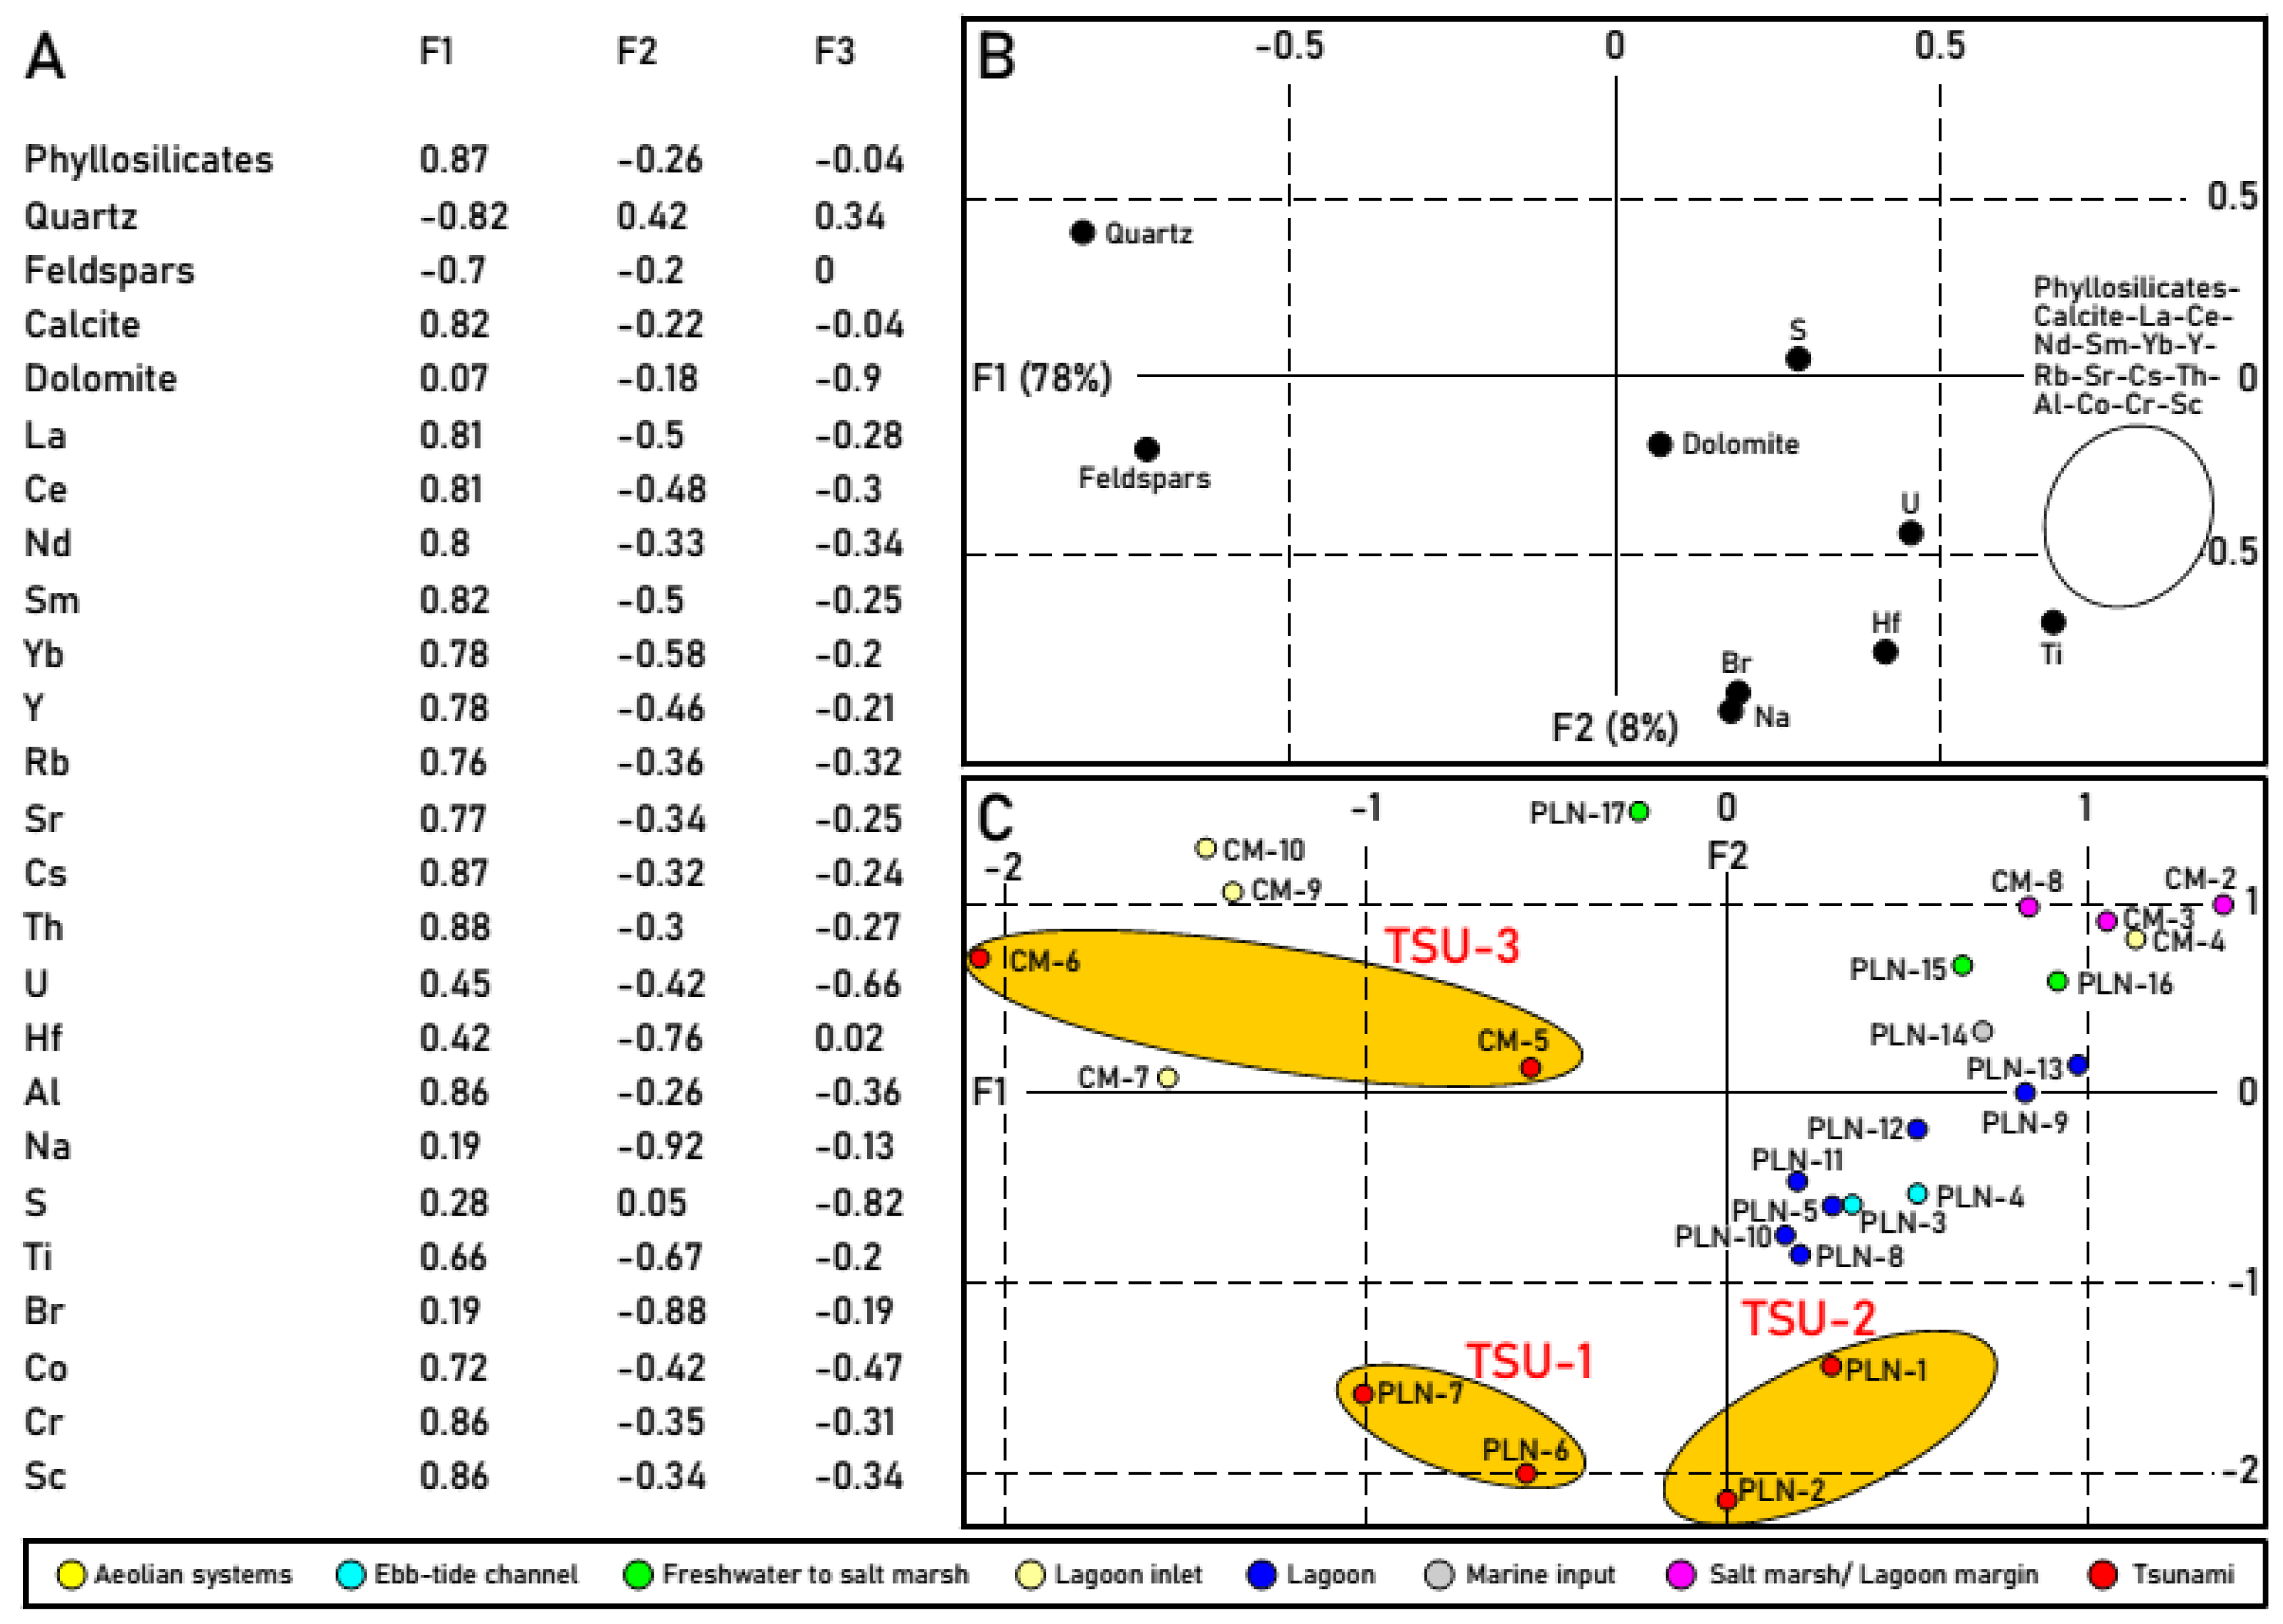
4.3.3. Factor Analysis Applied to Elements

The Kayser–Meyer–Olkin index that was obtained (0.747) indicates that the factor analysis is acceptable for the set of elements. The three main factors produced by the Varimax rotation explain 89.7% of the total variance (Table 6; F1: 53%; F2: 22.8%; F3: 14%). F1 is closely linked to the high positive factor loadings of Association 1 (>0.69) and Ba (0.785). Except for Ba (0.02), the factor loadings of F2 are all negative, among which stand out Association 2 [(Na:(−0.94); Br:(−0.927)], Hf (−0.696) and Ti (−0.634). S (0.853) and U (0.587), which have the highest factor loadings of F3, which are only negative for Ba (−0.227) and Hf (−0.16).
The F1–F2 diagram (Figure 9A: 75.8% of the variance explained) corroborates the two associations obtained in the bivariate analysis. For F1, association 1 has positive factor loadings (0.5–1, except U), while these elements have negative factor loadings for F2 ((−0.2) to (−0.7)), especially for Ti and Hf. In this association, F2 partially separates these last two elements because they have lower values than the rest ((−0.696) to (−0.634)). Association 2 is clearly differentiated by the minimum values for F1 (<0.2) and F2 ((−0.94) to (−0.927)). Sulfur and Ba differ markedly from both associations, since they present the maximum values for F1 (close to 0).
The two remaining diagrams (Figure 9B,C) produce similar results: (i) Hf and, to a lesser extent, Ti and U are separated from association 1; (ii) Association 2 is reaffirmed, with very similar factor loadings for F3 (0.121–0.197); and (iii) S and Ba move away from both associations.

4.3.4. Factor Analysis Applied to the Samples and Paleoenvironments

The F1–F2 diagram (Figure 9D) separates the five groups of samples: (i) Group 1 (yellow: F1 < 0; F2 > 0): aeolian systems–lagoon inlet (except CM-4); (ii) Group 2 (green: F1 > 0; F2 > 0, except PLN-17): salt marsh/lagoon margin–freshwater to salt marsh–marine input–uppermost lagoonal samples of core PLN; (iii) Group 3 (blue: F1 > 0; F2 < 0 in most cases): lagoon–ebb-tide channel; (iv) Group 4 (orange: (−1) < F1 < 0; (−2) < F2 < (−1)): TSU-1; and v) Group 5 (red: 0 < F < 1; (−1) < F2: TSU-2).
These five groups are more difficult to distinguish on diagrams F1–F3 and F2–F3. In the first (Figure 9E), groups 1, 4 and 5 are clearly defined (F1 < 0; F3 < 0), while groups 2 and 3 are mixed. In the second of them (Figure 9F), groups 4 (TSU-1) and 5 (TSU-2) are differentiated from the other samples. According to all of these results, the F1–F2 diagram distinguishes the paleoenvironments, while F2 is the factor that best differentiates the two oldest tsunamis (TSU-1 and TSU-2). This factor is mainly associated with Na, Br, Hf and Ti (Table 6).

4.4. Relationship between the Trace Element Distribution and the Mineralogy

The geochemical variations observed in the tsunami deposits are controlled by the mineralogical composition of the supplied sediments, both from terrestrial and marine sources.

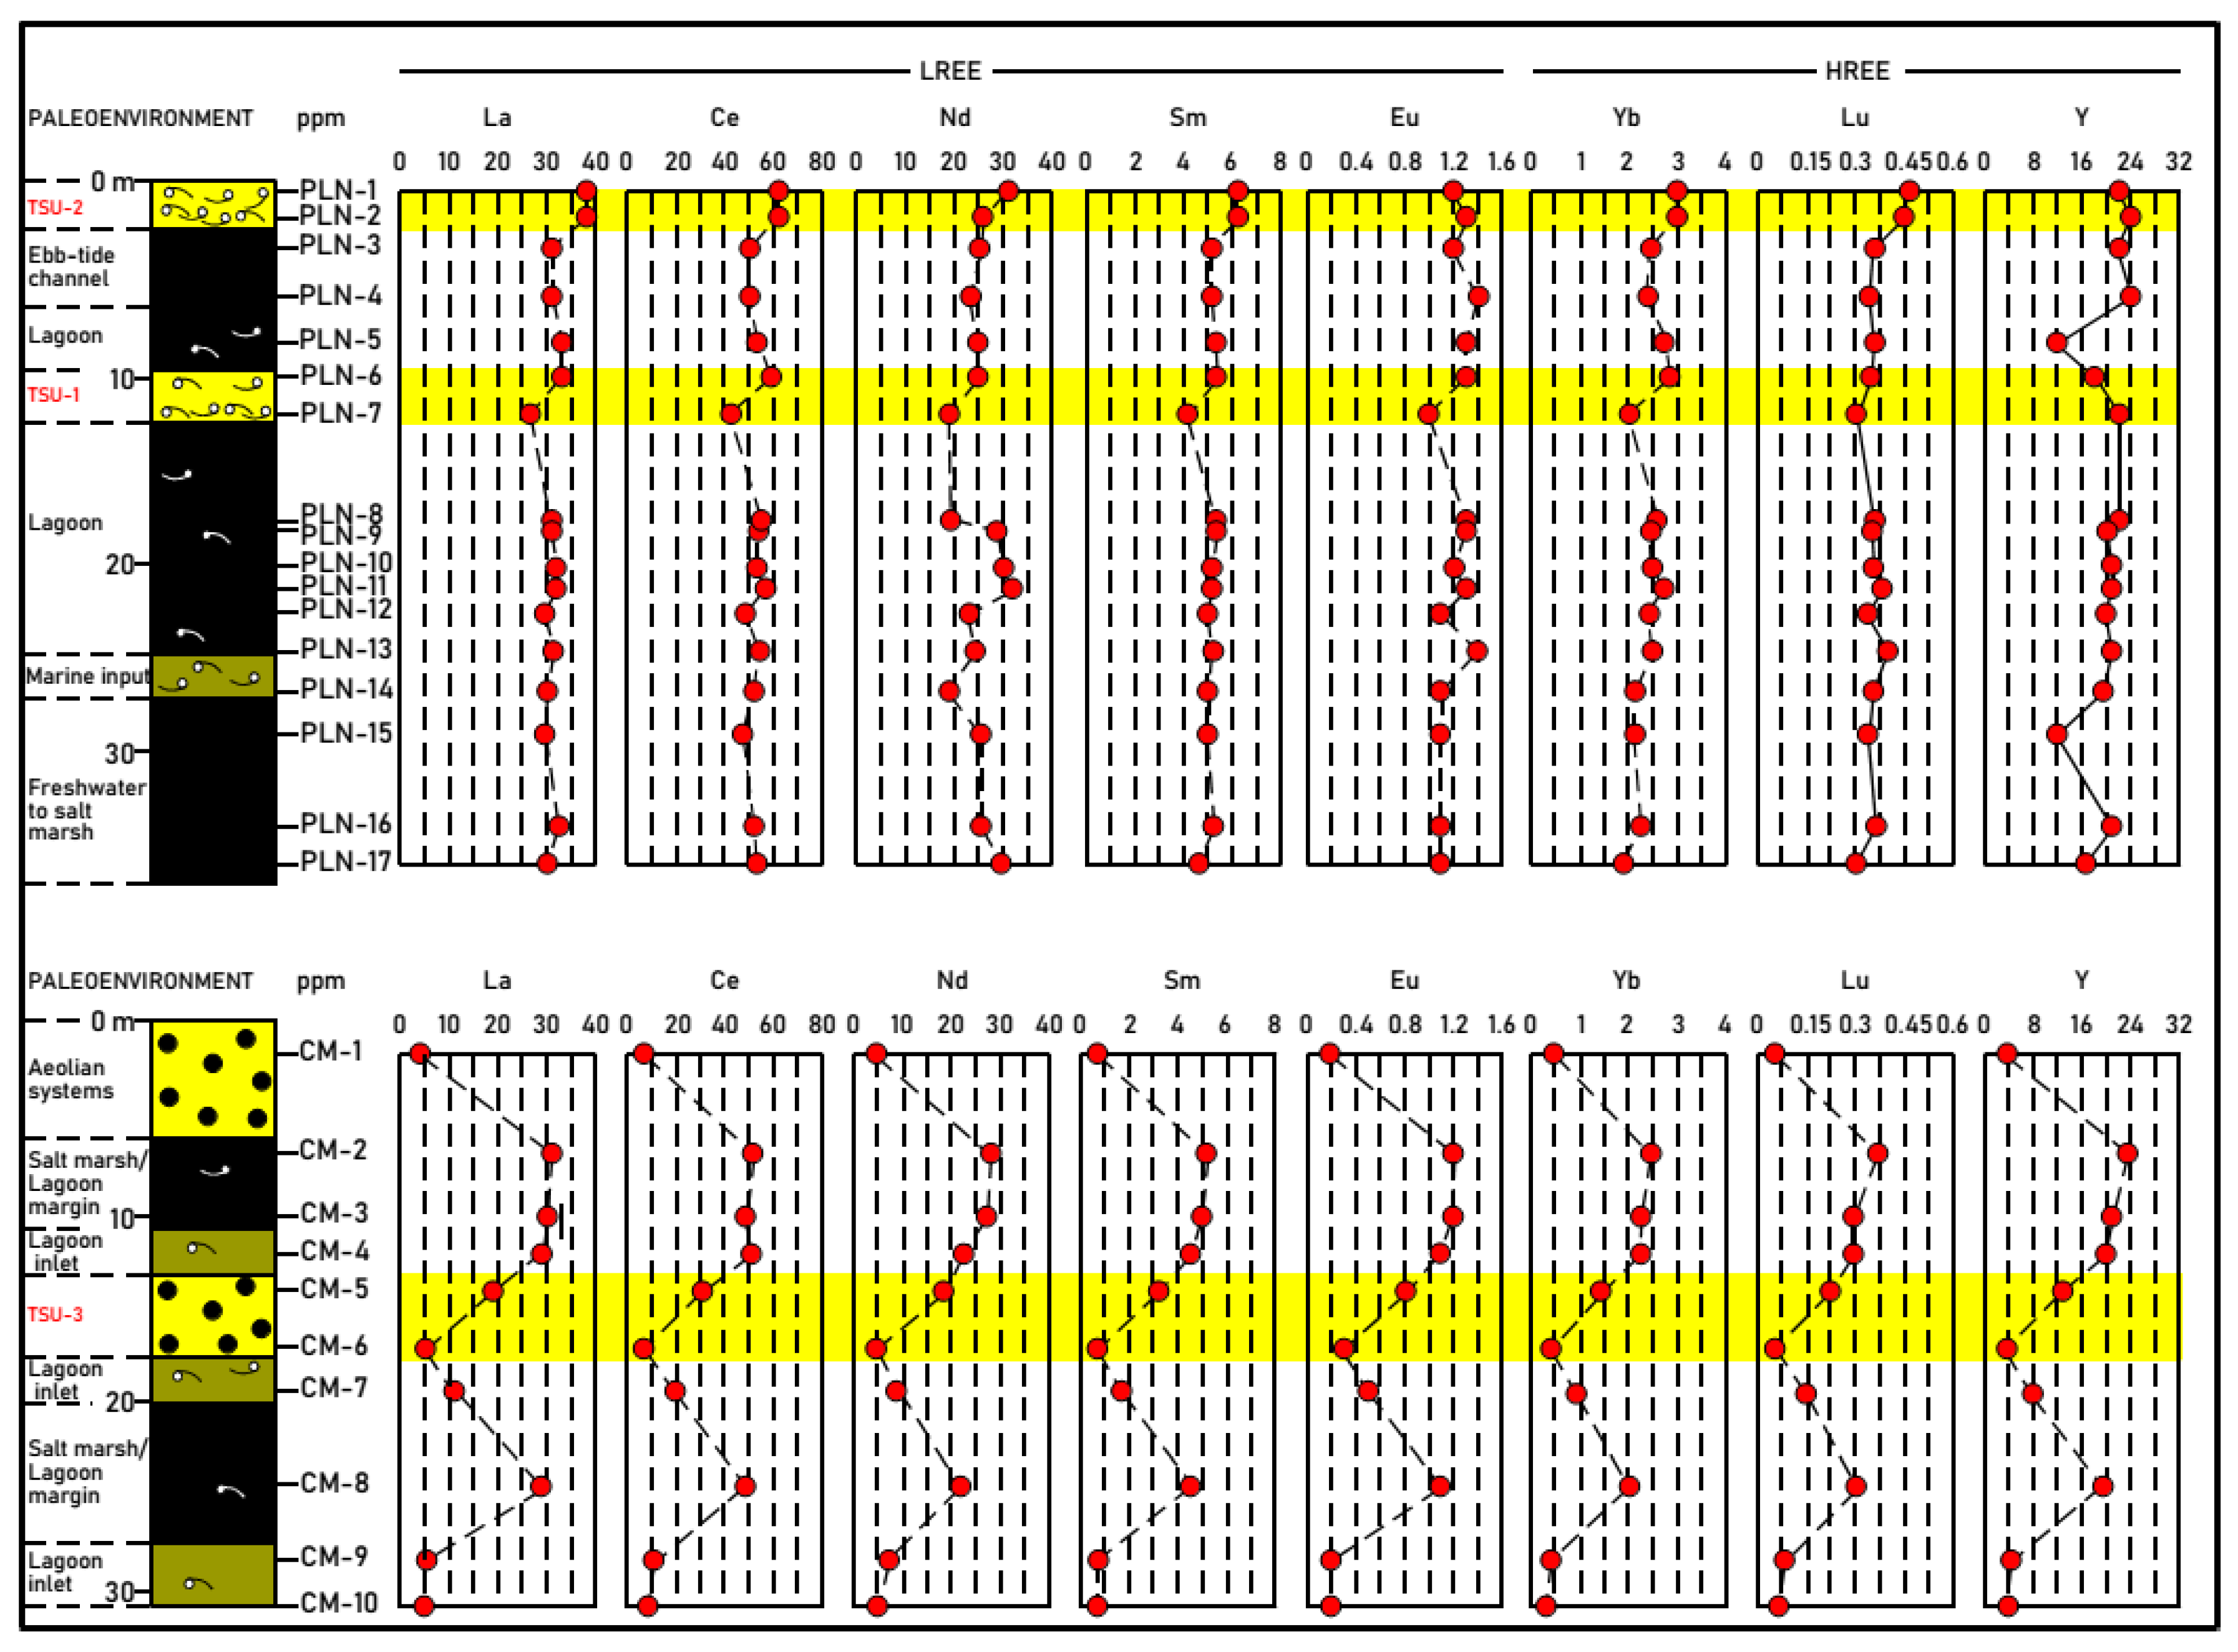
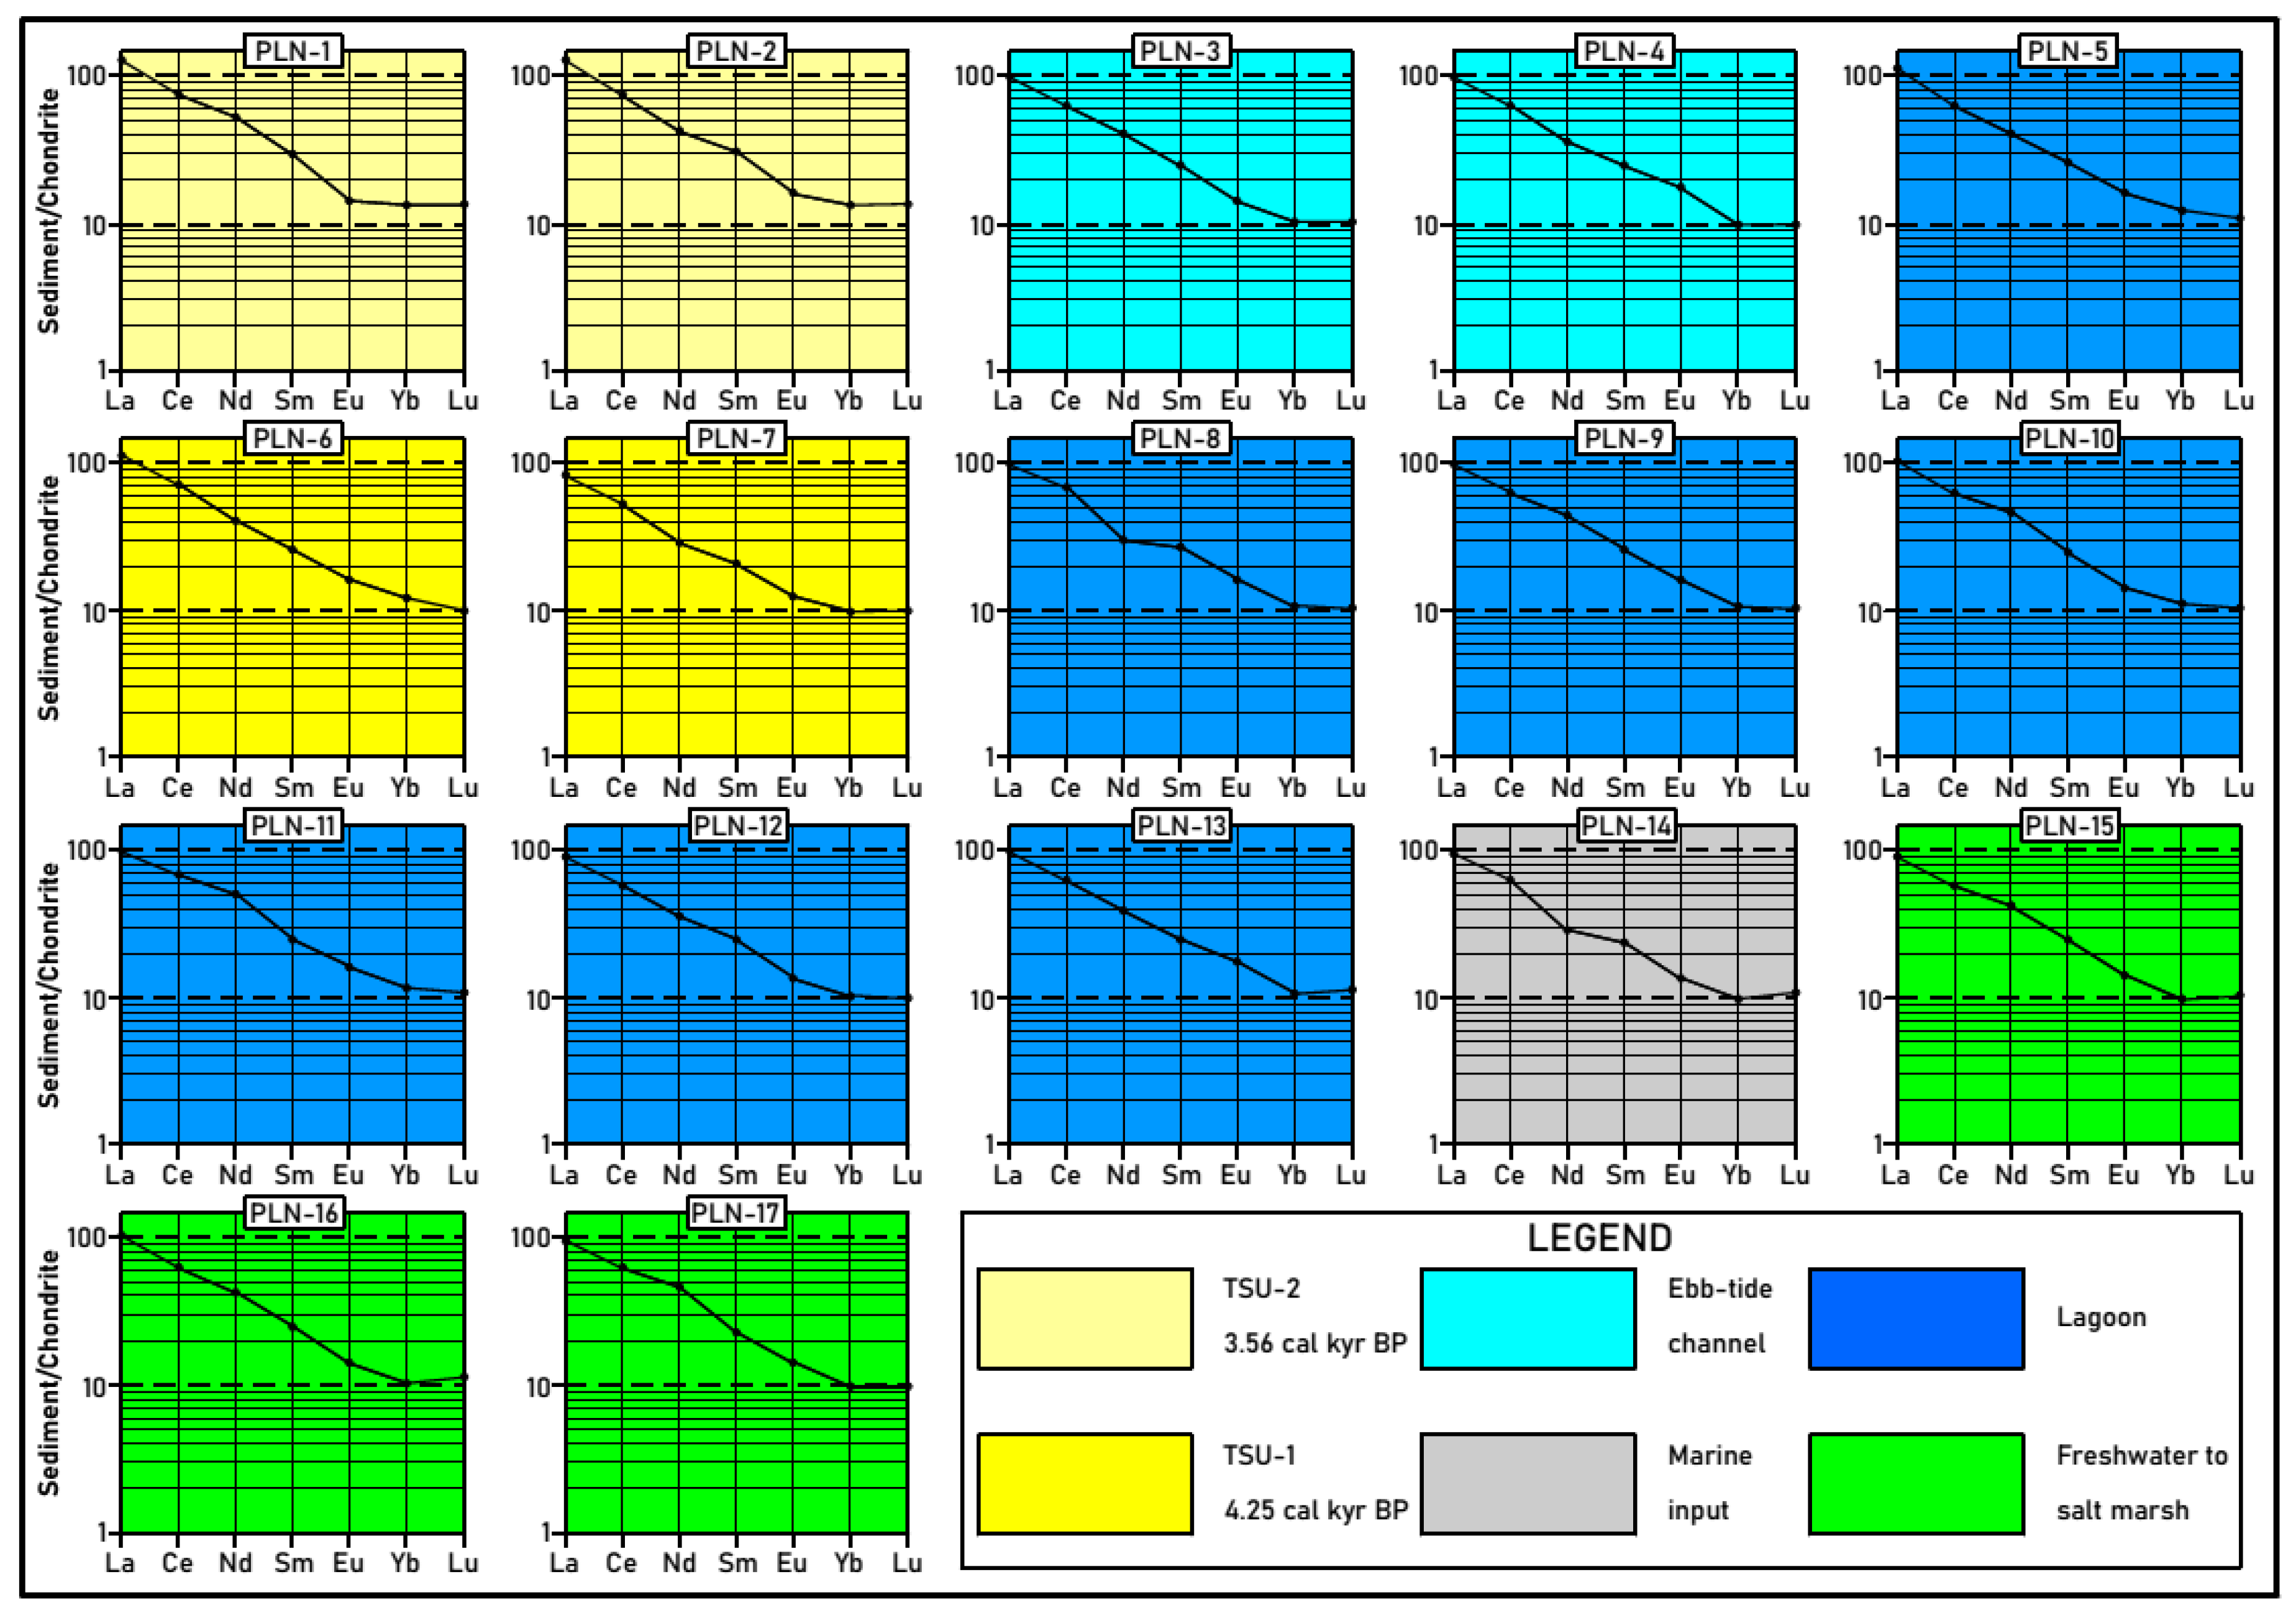
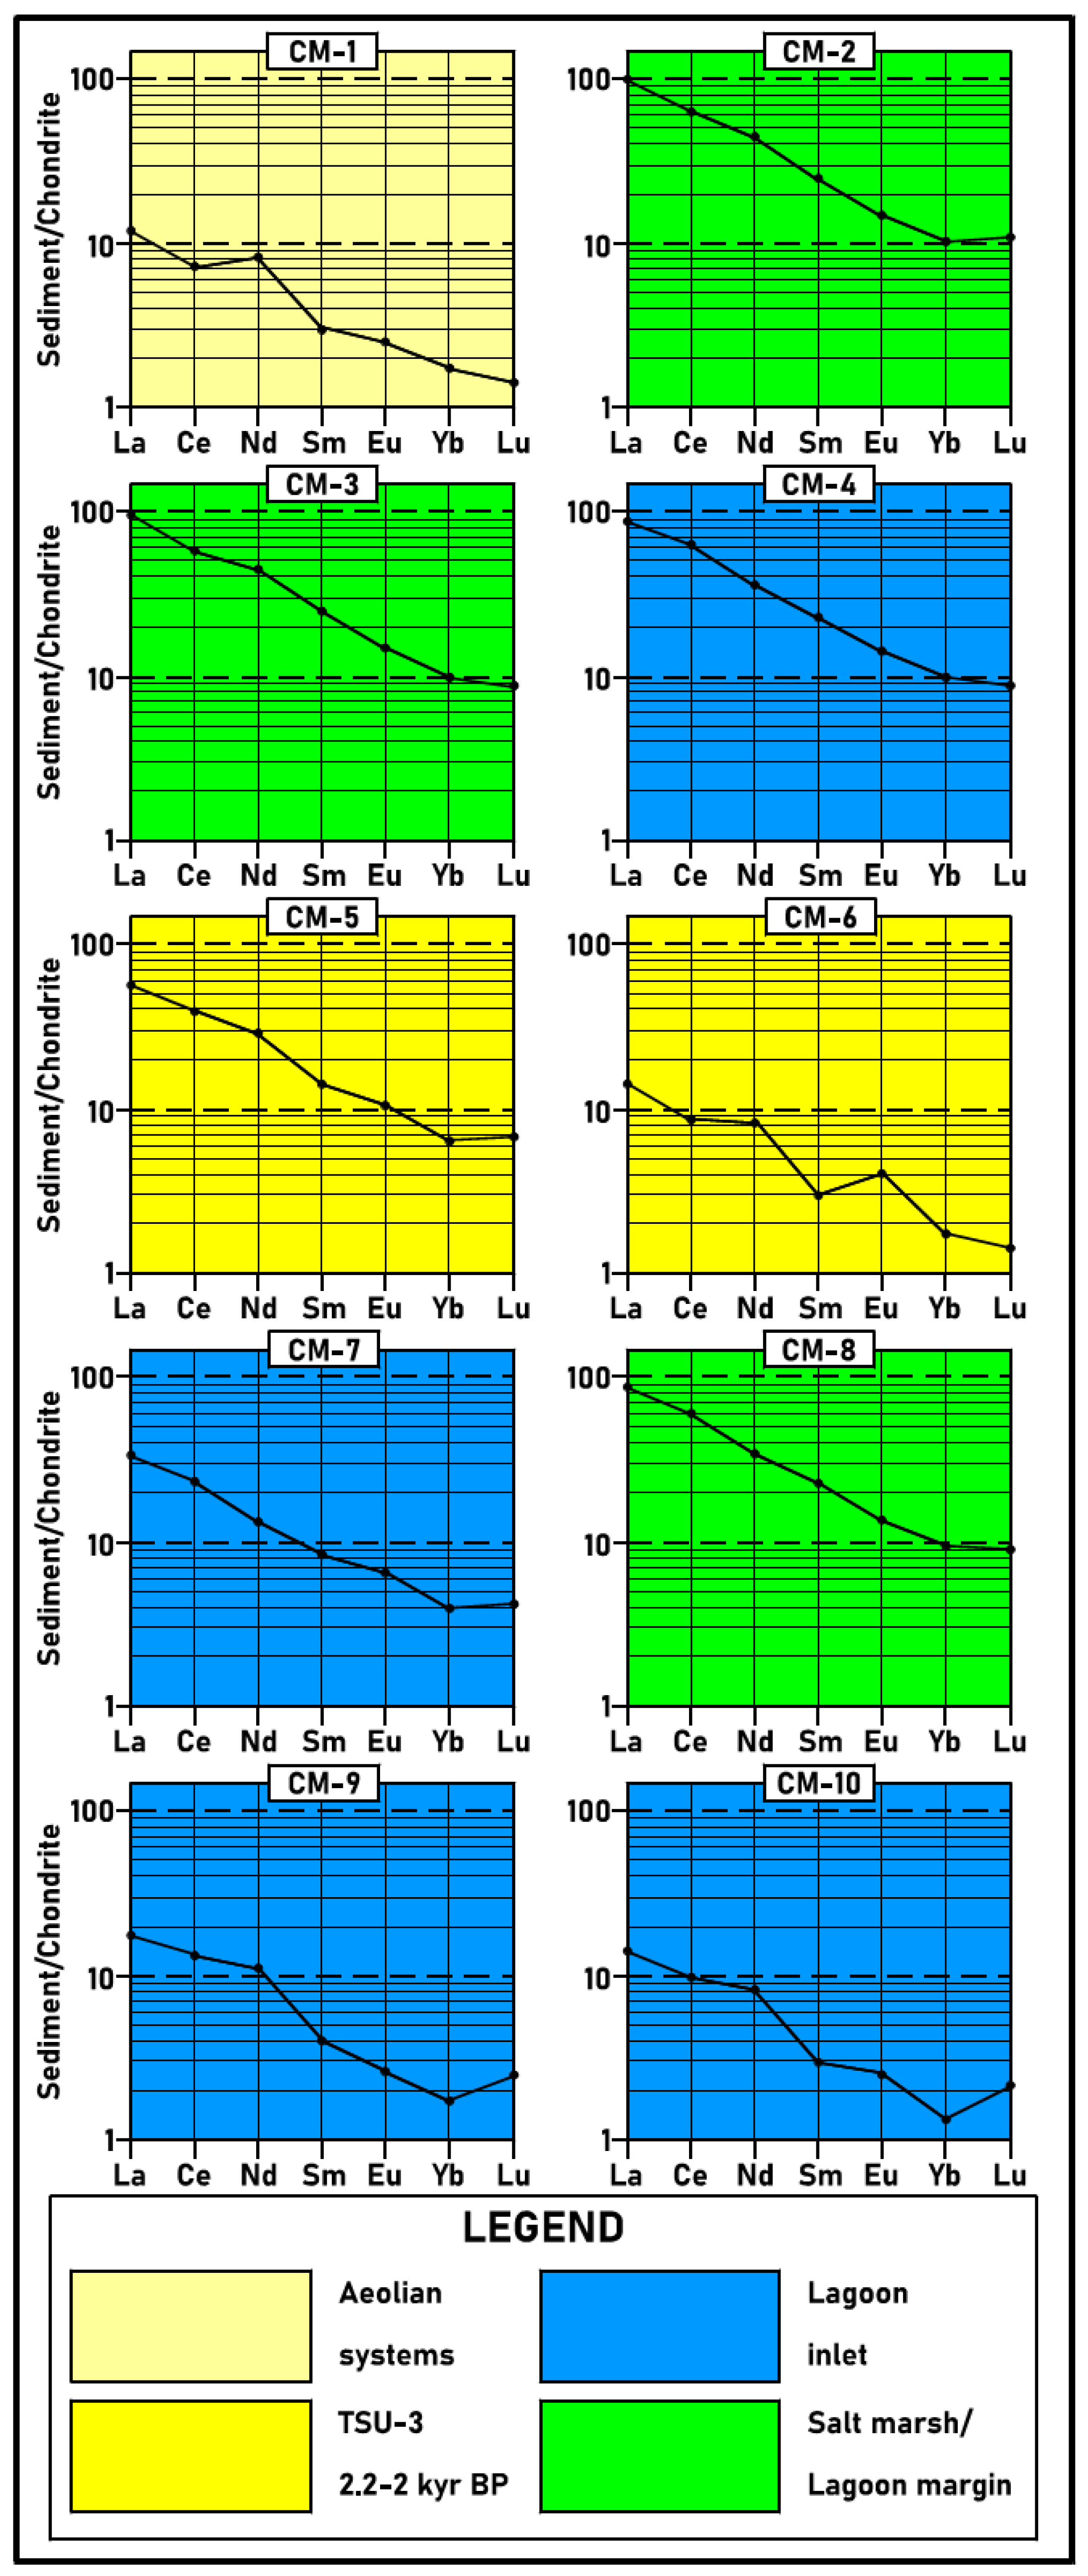
4.4.1. Rare Earth Elements (REE)

The vertical distribution of the REE contents are shown in Figure 4. The REE content in TSU-1 decreases due to the decrease in phyllosilicates in the deposit and the dilution effect caused by the increase in carbonates (especially dolomite). At the top, the incorporation of heavy minerals (see Section 4.2.4) would favour its increment, which is supported by the increase in the Hf content.
At the base of TSU-2, an increase in REE is observed, while the content of phyllosilicates decreases. At the top, the REE contents are maintained. A relationship with heavy minerals (mostly zircon and rutile) is evident, as shown by the notable increase in Hf and Ti.
At the base of TSU-3, the REE decrease due to the dilution effect of the high quartz content found and the low percentage of phyllosilicates. On the top, there is a substantial change, with an increment in the phyllosilicate content, which favors an increase in the REE.
The REE distribution diagrams normalized with the chondrite show that LREE in PLN predominate over HREE, with differences between the samples of TSU-1 and TSU-2, with a greater accumulation of REE in the second, including LREE values above 10 (Figure 10). In CM, below TSU-3, the lagoon inlet samples contain HREE/chondrite ratios smaller then 10. The same ratio is close to or greater than 10 in the lagoon margin samples. At the top of this tsunamiite, the distribution is very different (Figure 11), corroborating the mineralogical differences of both samples (e.g., base: 71% quartz; top: 44% quartz).
The REE are elements with limited mobility and fractionation in most geological processes [25]. They are frequently hosted in phyllosilicates and heavy minerals in detrital deposits [26,27]. Their distribution in the sediments depends on the granulometry; clay-rich sediments have a greater capacity to retain these elements, since the constituent clay minerals can incorporate them into their structure and/or adsorb them onto their surfaces [28]. On the other hand, the REE content of the sediments can be diluted in coarser sediments with less clay (phyllosilicates) and more quartz and carbonates.

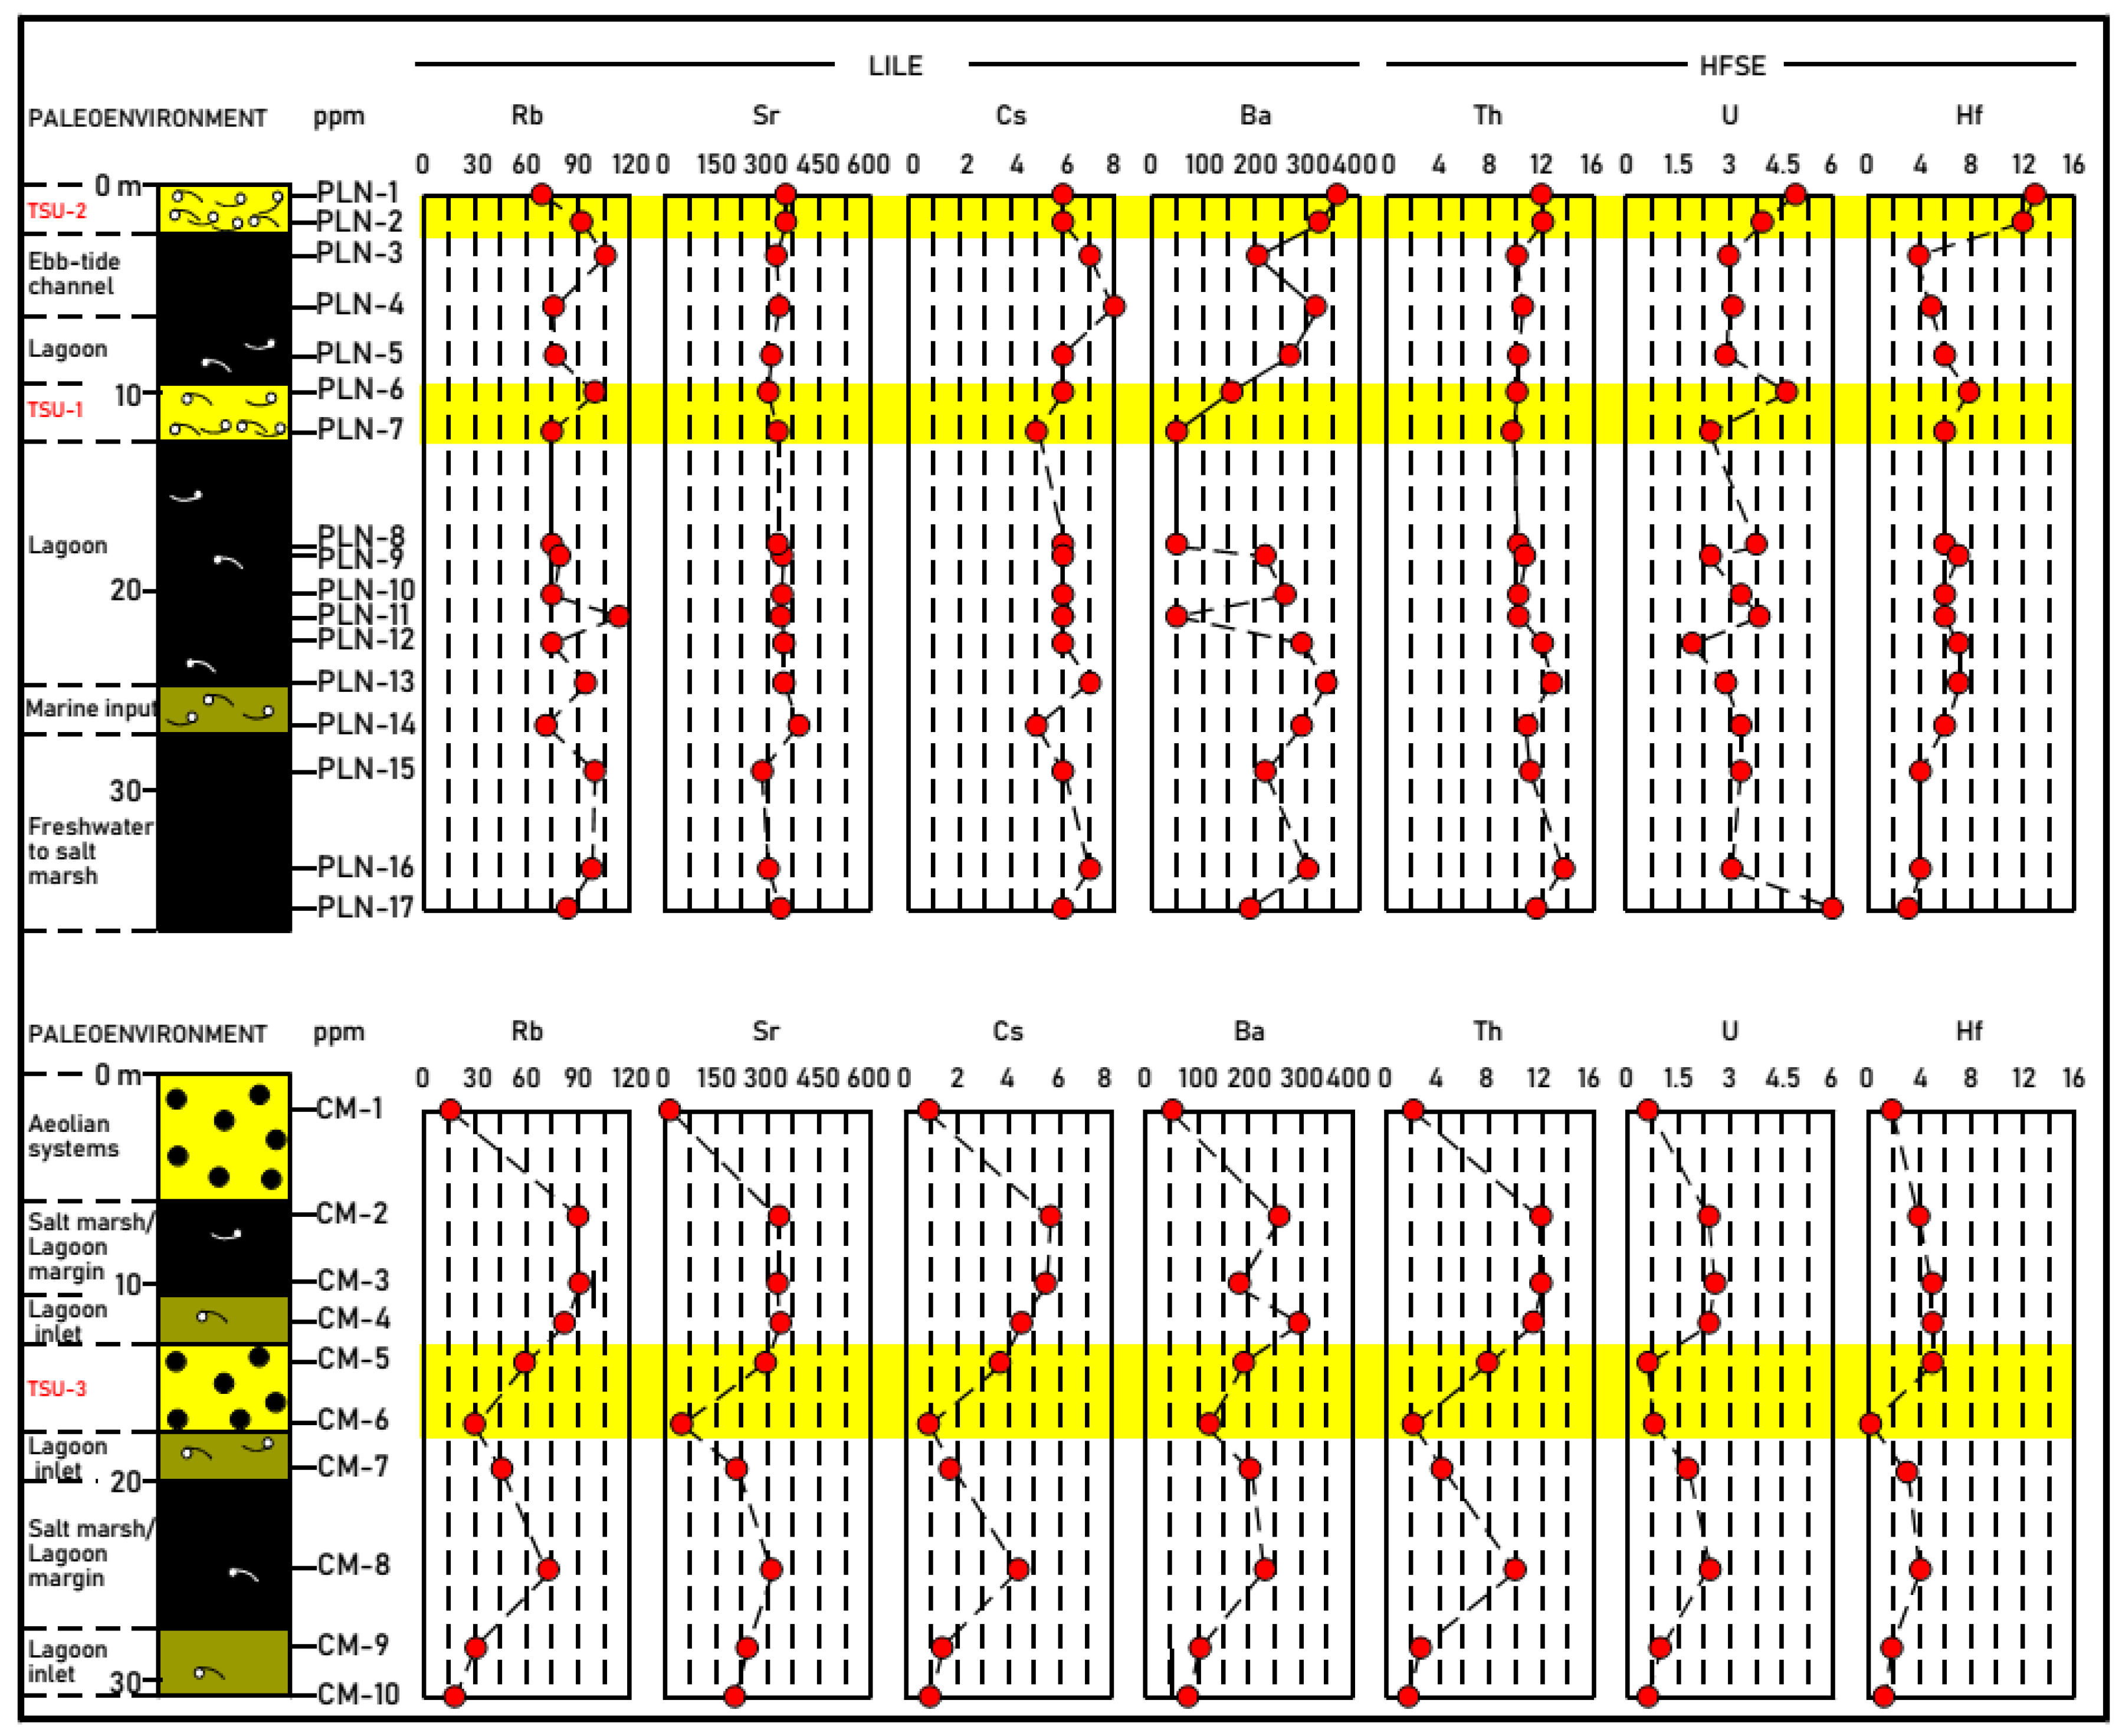
4.4.2. Large Ion Lithophile Elements (LILE)

The vertical distribution of the LILE contents are shown in Figure 5. The LILE have similar contents at the base of TSU-1 and the underlying lagoon deposit, although the phyllosilicates decrease significantly, possibly as a result of the increase in feldspars (Table 1). This effect of the feldspars is confirmed at the top of this tsunamiite, where a notable increase of feldspars is observed, as well as Rb, Cs and Ba contents.
This correlation between a decrease in phyllosilicates and lower concentrations of Rb and Cs has been also observed when passing from the tidal channel deposit to the base of TSU-2. The variation of Sr in TSU-1 and TSU-2 is related to the content of the bioclast remains formed by calcite and aragonite. The high Ba content suggests that at least part of it may be in the form of sulfate (barite) or carbonate (whiterite).
At the base of TSU-3, the LILE decrease due to the dilution effect of the high quartz content present and the low percentage of phyllosilicates. At the top, there is a substantial change, with an increment in the phyllosilicate content that favors an increase of these elements.
The variation of Rb, Cs and at least part of Ba is related to the content in phyllosilicates and feldspars [29]. Given their similar atomic radii, Rb can substitute for K in certain mineral lattices, such as alkaline feldspars and K-rich phyllosilicates—such as muscovite or illite—and therefore with good correlation with Al, a major element in the minerals mentioned [30,31]. The presence of micaceous minerals is more frequent at the top of tsunami deposits in the finer sediments, which would come from deep waters, and not from beach areas [32]. This would justify an increase in the contents of some elements, such as Rb [33,34]. In the samples studied in this work, the correlation between Al and Rb is high (0.89) (Table 5).
Ba can also be associated with detrital minerals, as it can be easily captured by potassium minerals [30] and plagioclase [35]. In our study, the concentrations and variations observed for this element suggest that it should also be found as an authigenic phase in the form of barite or whiterite. Another possibility is that it partly replaces Ca in aragonite [36]. This would explain its increase in the lagoon deposits, which are difficult to explain only in relation to detrital minerals. In the samples studied, a good correlation with S has not been observed (Table 5), which may be due to the absence of barite, or to the interference caused by the presence of gypsum in the samples.

4.4.3. High Field Strength Elements (HFSE)

The vertical distribution of the HFSE contents is shown in Figure 5. The main variation is the behavior of Hf, which increases at the top of TSU-1, and at the base and top of TSU-2. A slight increase in U was also observed at the top of the deposits. At the base of TSU-3, the HFSE decrease due to the dilution effect of the high quartz content present and the low percentage of phyllosilicates. At the top, their contents are increased or maintained (U).
The variation in Hf is interpreted to be related to that of zircon, which—as a heavy mineral—is associated with detrital minerals [37,38,39]. In this mineral, Hf can occur in the range 0.6–3% (mean value 1.7%) [40]. The presence of zircon, together with a wide range of heavy minerals, in the lithofacies studied has been previously described by [19].
The increase in U can be interpreted as authigenesis in the anoxic zone of the sediment. Under reducing conditions, U(VI) passes to more insoluble U(IV), precipitating as UO2, U3O7 or U3O8, or being adsorbed onto the surfaces of other minerals. At the pH of seawater, the redox potential is close to that of the ferric to ferrous ion change [41,42].

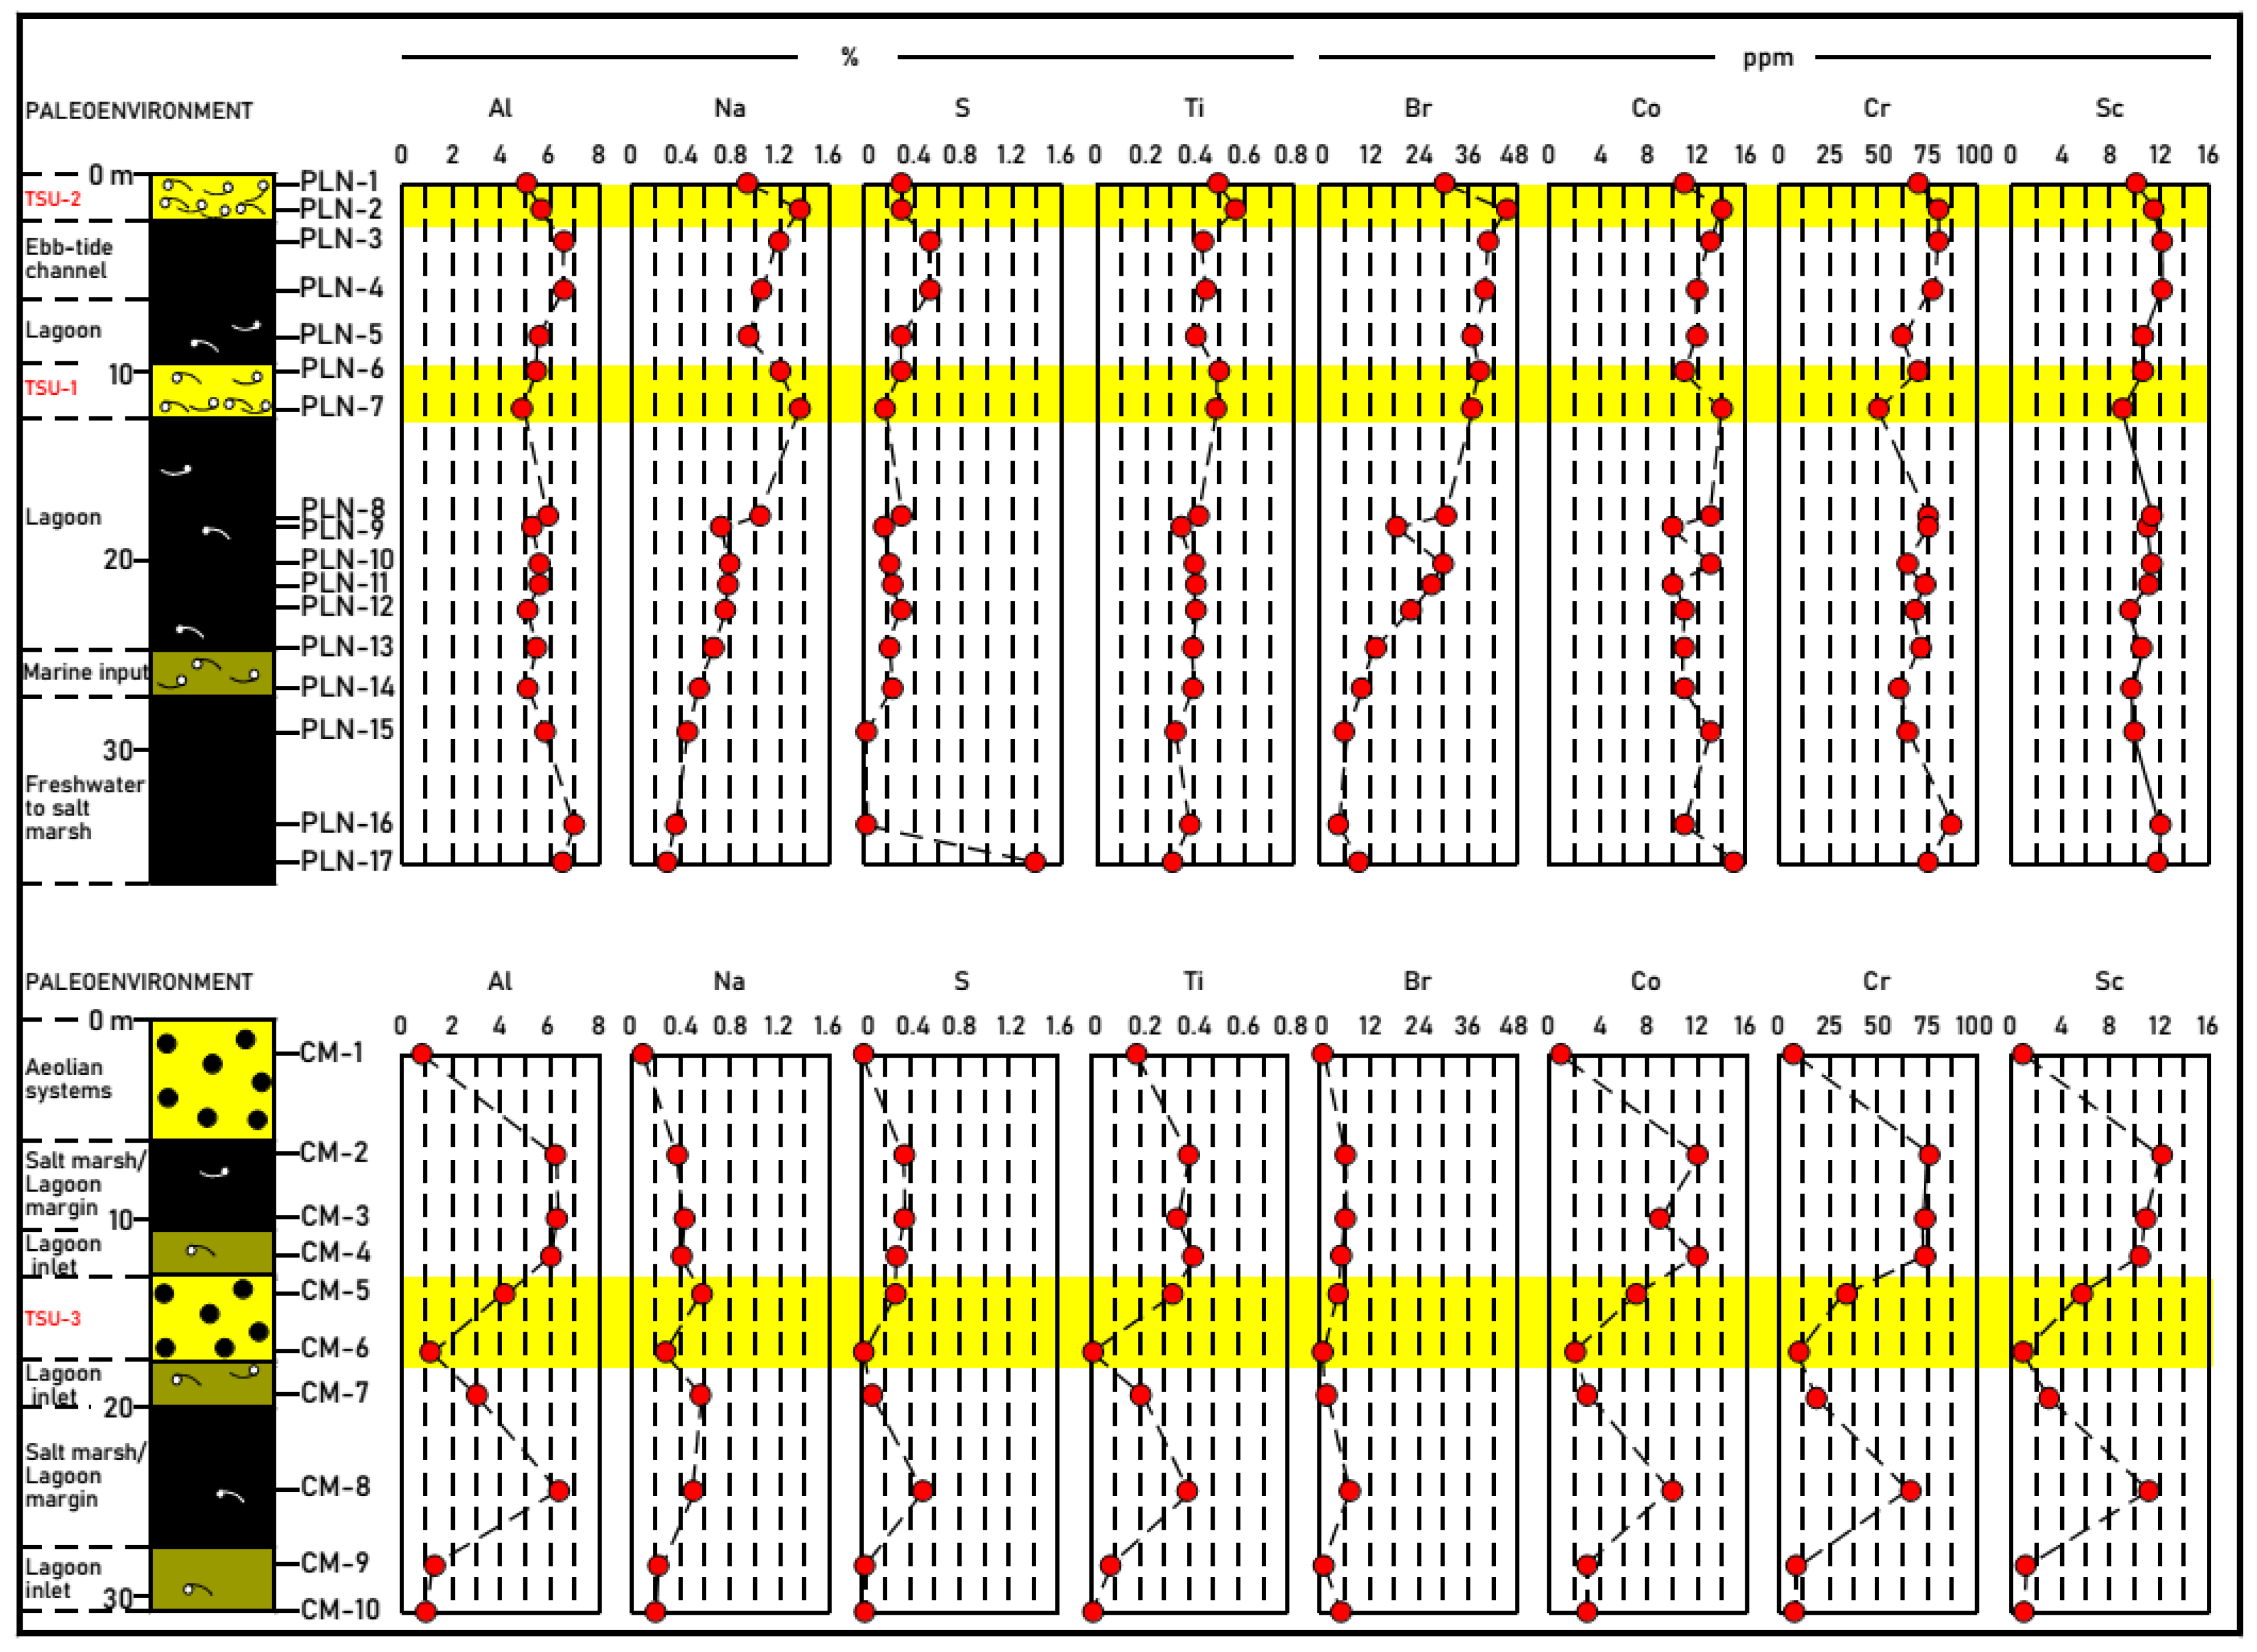
4.4.4. Other Elements

The vertical distributions of the Al, Na, S, Ti, Br, Co, Cr and Sc contents are shown in Figure 6. In both TSU-1 and TSU-2, the increase in Na and Br related to the presence of halite stands out. The increase in Ti content would indicate heavy mineral involvement. The variation in the Al content is mainly related to that of phyllosilicates, and—to a lesser extent—to the content of feldspars. In micaceous minerals, the Al content is of the order of 20%, while in feldspars, it is around 10%. The elements Co, Cr and Sc behave—in a general way—like Al. The S content is mainly controlled by the mineral gypsum.
At the base of TSU-3, all of the elements decrease due to the dilution effect of the high content of quartz present, and the low percentage of phyllosilicates. The phyllosilicate and carbonate (especially calcite) contents increase at the top, which favours an increase in all of these elements.
The Br in sediments can be due to the formation of evaporite deposits, or can be associated with organic matter [43,44]. The good correlation between Br and Na (0.95), and the presence of halite in the samples, confirms that it is associated with evaporite minerals (see Section 4.2.1 and Section 4.2.2). This is supported by the presence of gypsum in the samples.
The Ti content and its variation is related to heavy minerals, and its presence both at the base and inside the tsunamiite deposit indicates high-energy environmental conditions [10]. The presence of rutile in the heavy mineral assemblage of these lithofacies was reported by [19].
Sc and Co are elements that are typically associated with inherited, commonly ferromagnesian, minerals [45]. Cr is associated with clay minerals, chromite and ferromagnesian minerals (replacing Mg) [46]. As observed in TSU-1, some authors have observed an impoverishment of Cr in tsunami deposits with respect to the underlying sediments [47]. The correlation of Al with these transition elements is high, reaching 0.89 with Co, 0.97 with Cr, and 0.98 with Sc (Table 4). This implies that they are associated with detrital minerals, especially phyllosilicates (clays).

4.5. The Role of Trace Elements as Geochemical Proxies

According to [10], and the references therein, the elements that indicate marine influence are mainly Cl, Br and S; other elements—such as Ca, Sr and sometimes Mg—can also be used as marine proxies, either because of the composition of the water or because of the content of bioclasts, since there are more carbonates in seawater and marine sediments than in freshwater and terrestrial sediments. Some trace elements have been used as indicators of paleoredox conditions in marine and continental environments [48]; among these elements are U, V, Co and Cr, among others. Likewise, elements associated with heavy minerals—such as Ti, Zr and Hf—are indicators of high-energy conditions [49]. Other elements—such as La, Cr, Co and Th—have been used to determine the felsic or mafic composition of the area of provenance of the materials [50].

4.5.1. Marine vs. Terrestrial Sources

Among the other elements, Br and Na are excellent indicators of marine-influenced salinity [51,52,53,54,55]. The Br/Al ratio shows two maxima corresponding to TSU-1 and TSU-2, which demonstrate the input of marine waters (Figure 12). The Br content correlates very well with that of Na, supporting the linking of its origin to the precipitation of evaporite minerals. The increase in Sr may be an indicator of marine influence, linked to bioclastic sands, biogenic carbonates and/or detrital carbonates [34,56,57]. The Sr/Al ratio shows only a slight increase in TSU-1, but is unclear in TSU-2. In TSU-3, these relationships only show an increase at the top of the tsunamiite, due to the dilution effect of the aeolian sands.
Increases in the Ba/Rb ratio are also indicative of marine sediments [58]. The concentration of Ba is higher in seawater than continental water, varying its distribution with salinity [59]. In the samples studied, the Ba/Rb ratio shows differences in the three tsunamiites, reaching the highest value in TSU-2, showing that the behavior of Ba in these environments is complex [60] (Figure 13). The existence of maximums in the Ba/Al ratio allows the inference of the authigenesis of the sulfate or carbonate of Ba (Figure 13). This suggests the possibility that—at least in part—the Ba has a non-detrital origin. In estuarine environments, it is common for Ba to precipitate where marine waters continuously mix with surface and groundwater. Ba is released by various mechanisms, such as the desorption of particles transported by river systems, a process which is especially rapid at high salinities [60,61]. Another mechanism could be the release of Ba by cationic exchange with Mg from seawater [62]. The presence of authigenic Ba mineral phases would imply oxidizing conditions that favour its precipitation, since it solubilizes in the reducing ones.
The changes in TSU-1 and TSU-3 are minimal with respect to REEY/Al, relative to the overlying or underlying areas (Figure 12). However, this ratio corroborates that the intake of phyllosilicates and heavy minerals plays a relevant role in TSU-2, since maximums are observed. This suggests the input of sediments with phyllosilicates and heavy minerals deposited in the coastal zone, or even on the shelf.

4.5.2. High-Energy Events

The elements Hf and Ti are associated with heavy minerals and high energy events [10]. Especially, Ti is considered to be a geochemical indicator of tsunami inundation [10,13,63,64], and this explains the use of its Ti/Rb and Ti/Al ratios to identify high-energy events [65,66]. In this work, the Ti/Al, Ti/Rb and Hf/Al ratios show maximums in TSU-1 and TSU-2 (Figure 12 and Figure 13), especially highlighting the increase in Hf in the second mentioned example, which is an element linked to zircon, a heavy mineral that was identified in these lithofacies by [18]. The behaviour of Hf/Al and Ti/Al ratios is similar to that of the REEY/Al ratio (Figure 12).
Higher Ti/Rb ratios have been observed in tsunamiites than in the underlying fine-grained sediments. This is related to a coarser grain size in the deposits originated from the high energy events, which favors the content of heavy minerals (Figure 8: rutile) compared to phyllosilicates.
The increase in heavy minerals would be related to contributions from marine areas. The presence of heavy minerals in the continental shelf near the studied area was described by [67], and it includes the presence of zircon (Zr, Hf) and rutile (Ti). These authors emphasized the role played by fluvial supplies, sea-level changes and/or oceanographic factors in their distribution.

4.5.3. Redox Conditions

The existence of maximums in the U/Th ratios (Figure 13) in TSU-1 and TSU-2 could indicate the establishment of reducing conditions. U is among the trace elements that are sensitive to redox conditions in the environment, being more soluble in oxidizing conditions than reducing conditions, which favors its enrichment in sediments deposited in oxygen-poor environments [68,69]. For U to be indicative of redox conditions, it needs to be associated to authigenic minerals. The strong correlation between U and Al in our samples (0.7 as shown in Table 5) suggests that most of the U is tied in detrital minerals. Consequently, the U/Th ratio in TSU-1 and TSU-2 is not indicative of redox conditions. Cr and Co are elements that have also been used as redox indicators in marine and continental environments, useful when they are not linked to detrital minerals [48]. In our study, their high correlation with Al (>0.85) rules them out as possible redox indicators.

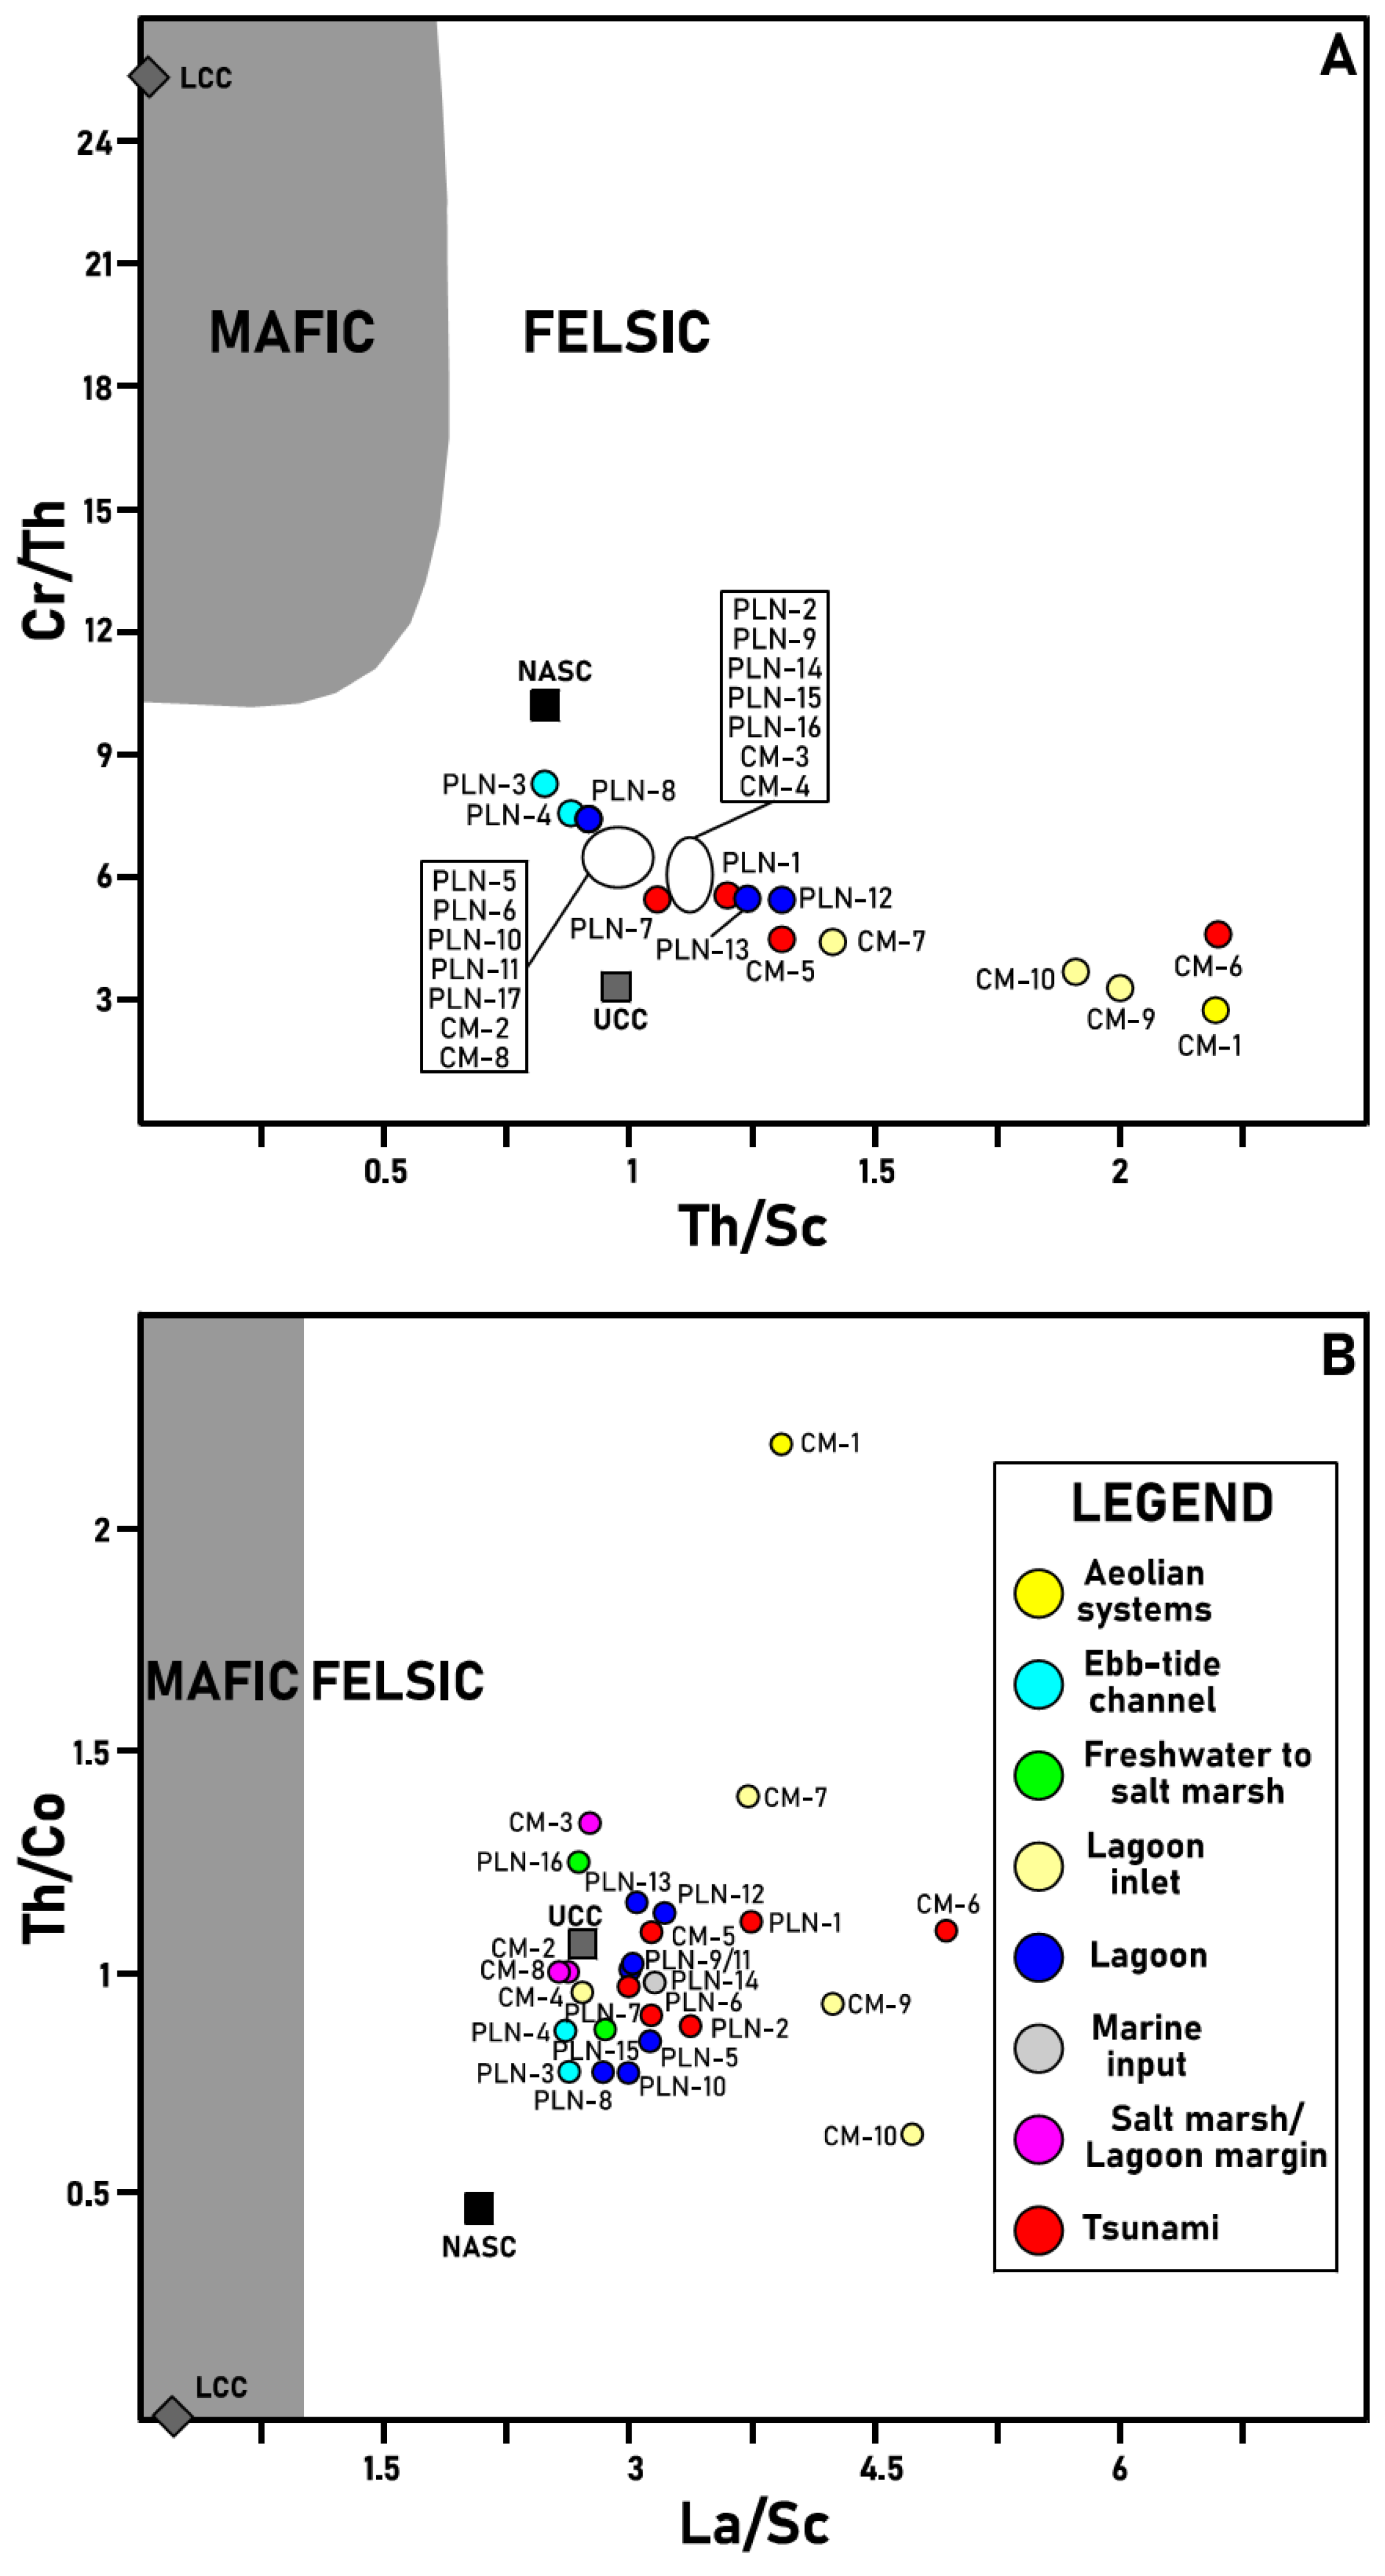
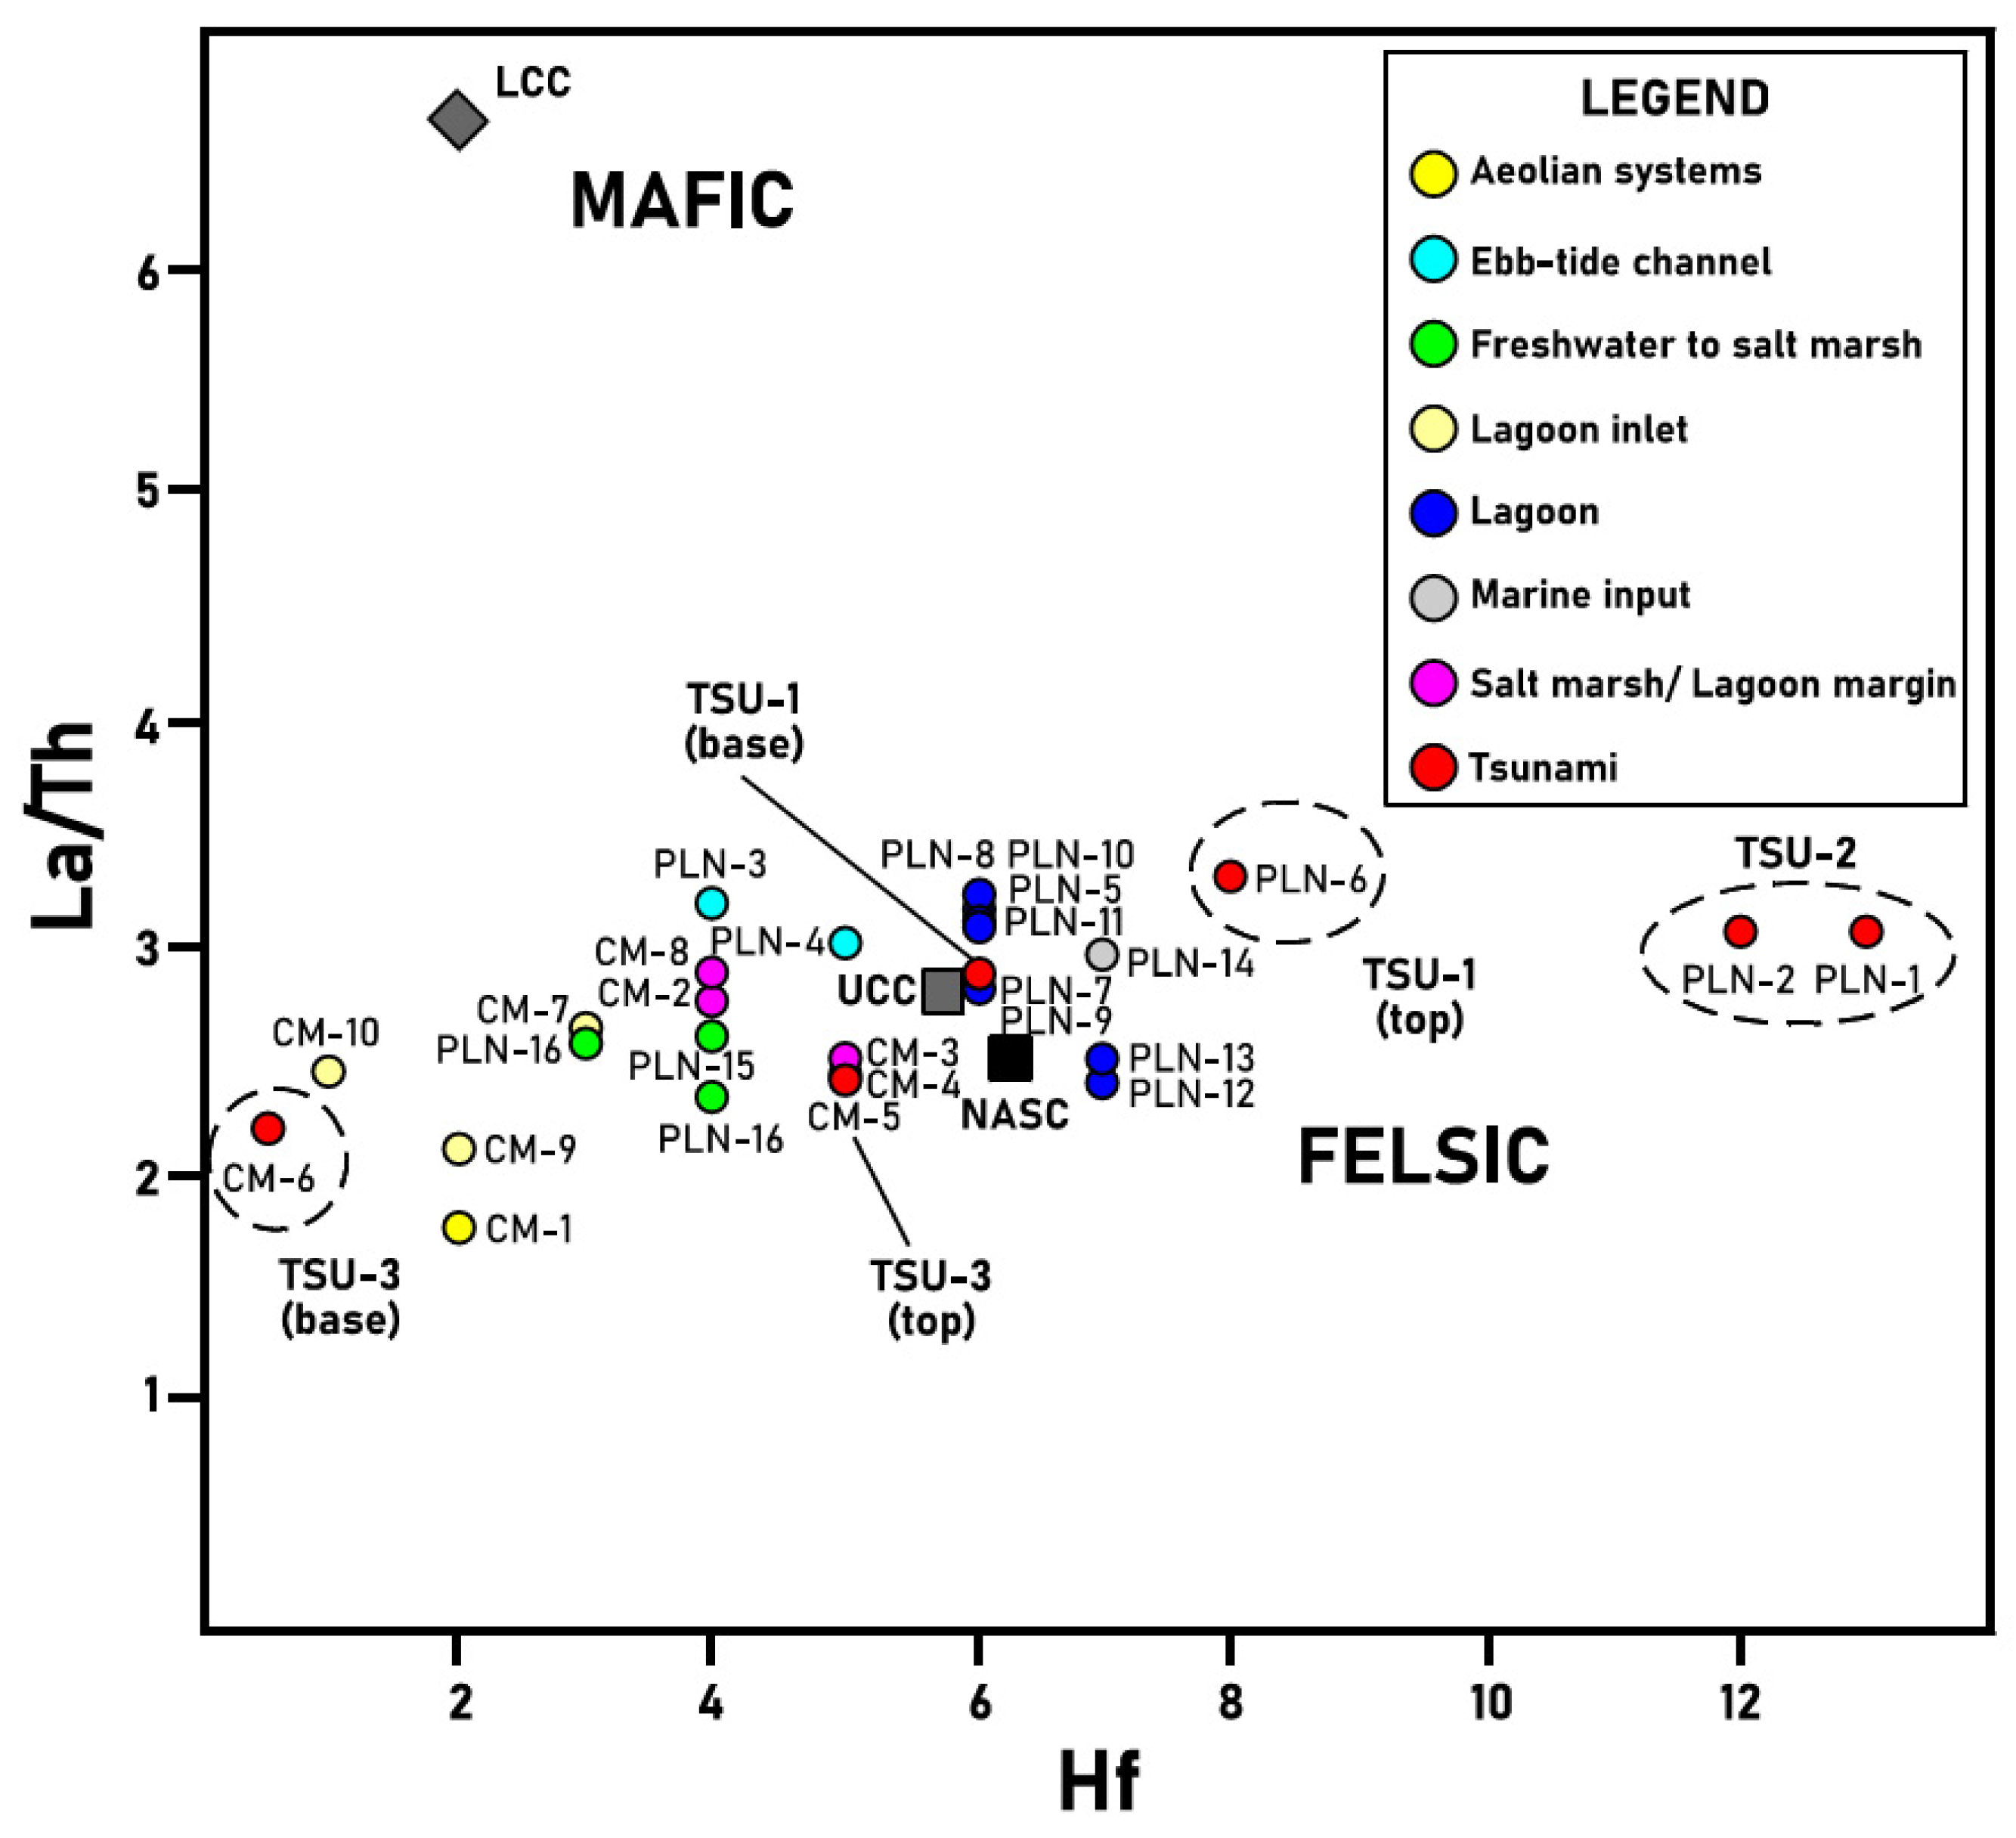
4.5.4. Sediment Provenance (Parent Rock).

Some elements—such as La, Sc, Cr and Co—have been used as indicators of sediment provenance, along with their La/Sc, Cr/Th and Co/Th ratios [26,50,70]. In general, higher contents of Th indicate a felsic parent area, while higher contents of La and Cr indicate a mafic parent area. The immobile elements La and Th are more abundant in the felsic rocks than in the basic ones, and the opposite is true for Sc and Co, especially in sandy materials [70]. In recycled and mixed sediments, these authors indicate that interpretation is more difficult.
The Th/Sc ratio has been considered to be a reliable indicator of the origin of magmatic rocks. This is due to the fact that Sc is a compatible element in the magmatic differentiation, while Th is incompatible. A typical value for the upper crust (felsic) is 1, while values <0.8 would indicate an origin of mafic composition [71,72].
The Th/Sc-Cr/Th (Figure 14A) and La/Sc-Th/Co (Figure 14B) graphs show a clustering of the samples close to the composition of the UCC (Upper Crust Composition) [71] and NASC (North American Shale Composite) [73], but far from that of the LCC (Lower Crust Composition) [74]. The exceptions are four samples belonging to CM, with aeolian influence in their deposit. It is interpreted that the composition of the parent rock area of the sediments is mainly felsic, with at least two provenances: the Iberian Massif for most of the samples, and the Doñana spit for some samples of core CM. In this sense, the existence of several sources for the heavy mineral input may explain the mixing of very stable (e.g., zircon, rutile) and unstable (garnet, epidote, hornblende) heavy minerals in the studied samples. Moreover, the heavy mineral association observed indicates mainly igneous–metamorphic parent rock sources for the analysed sediments, which are most likely derived from the Iberian Massif (Figure 1).
Some authors [75] have used the La/Th–Hf relationship to differentiate the provenance of felsic and mafic parent rock areas in sedimentary rocks. In the studied samples, the Hf–La/Th graph not only shows the felsic character of the parent rock area of provenance of the sediments, but also clearly differentiates the samples of TSU-1 and TSU-2, and the compositional variability between the base and the top of TSU-3 (Figure 15).

4.6. Mineralogy vs. Geochemistry: A Statistical Approach

4.6.1. Correlation Matrix

The analysis of the correlation matrix (Table 7) allows us to connect the mineralogical and geochemical compositions of the samples. Some deductions can be made: (i) the concentrations of most of the trace elements belonging to Association 1 (see Section 4.3.1) are highly, positively correlated (r ≥ 0.48 in most cases; p < 0.01) with the percentages of phyllosilicates and calcite; (ii) the positive correlations of most of these trace elements are also observed with dolomite, gypsum and halite; (iii) all of the elements included in the statistical analysis (except Tb) show significant negative correlations with quartz (r ≤ (−0.45)) and, to a lesser extent, with feldspars and aragonite; (v) dolomite is mainly linked with U and S; (vi) halite is mainly associated with Br and Na; and (vii) some elements (Tb, U, Hf, Na, S, Br) have clearly lower positive correlation coefficients or higher negative correlation coefficients than the others with the different minerals.

4.6.2. Factorial Analysis

The Kayser–Meyer–Olkin index obtained (0.62) indicates that the factor analysis is adequate for the set of elements. The three main factors produced by the Varimax rotation explain 93%of the total variance (Figure 16A; F1: 78%; F2: 8%; F3: 7%). F1 is closely linked to high positive factor loadings of phyllosilicates, calcite and Association 1, with minor positive contributions of dolomite, Na and Br. Conversely, both quartz and feldspars have negative scores in this factor. Except for quartz (0.42) and S (0.05), the factor loadings of F2 are all negative, among which stand out Association 2 ((Na:(−0.92); Br:(−0.88)), Hf (−0.76) and Ti (−0.67). Quartz (0.34) has the highest factor loading of F3, which are extremely negative for dolomite (−0.9), S (−0.82) and U (−0.66).
The F1–F2 diagram (Figure 16B: 86% of the variance explained) corroborates the two geochemical associations obtained in the previous bivariate analysis (see Section 4.2.1). For F1, Association 1, the phyllosilicates and calcite are grouped (F1 > 0.5; F2 < 0). In this diagram, Association 2 (Br–Na) is also differentiated (Figure 16B), while some elements (Ti, U, Hf) have intermediate positions between both associations. Quartz and feldspars are clearly differentiated by their very negative factor scores, while dolomite and S are located near the F1–F2 intersection.

4.6.3. Factor Analysis Applied to the Samples and Paleoenvironments

The F1–F2 diagram (Figure 16C) separates five main groups of samples: (i) Group 1 [F1 < 0; F2 > 0): aeolian systems–lagoon inlet (except CM-4)-TSU-3; (ii) Group 2 (F1 > 0; F2 > 0, except PLN-17): salt marsh/lagoon margin–freshwater to salt marsh–marine input–uppermost lagoonal sample of core PLN; (iii) Group 3 (F1 > 0; (−1) < F2 < 0): lagoon (except PLN-13)-ebb-tide channel; (iv) Group 4 ((−1) < F1 < 0; (−2) < F2 < (−1)): TSU-1; and v) Group 5 (0 < F < 1; (−1) < F2: TSU-2). These groups are the same as those obtained in the geochemical analysis (Figure 9).
Consequently, these analyses clearly delineate the tsunamiites from cores PLN and CM. TSU-2 is linked to lagoon and ebb-tide samples, while TSU-3 has an aeolian origin (e.g., sample CM-6). TSU-1 presents the intermediate features between them.

5. Conclusions

This work shows the importance of combining geochemistry and mineralogy as proxies in an estuary zone with sedimentological evidence of tsunami deposits during the Quaternary age (paleotsunamiites). The vertical distribution of the analyzed trace element contents allows us to clearly identify the samples belonging to the three tsunamiites that were deposited in the (nowadays) Doñana National Park (SE Spain) along the Holocene, about 4.25 cal kyr BP, 3.56 cal kyr BP and 2.2–2 kyr BP. The geochemical differences and variations observed in the tsunamiites are justified by the changes in the type and content of the minerals present in the tsunamiites. Of particular note are the phyllosilicates and heavy minerals linked to the inputs (TSU-1 and TSU-2), along with the dilution effect caused by carbonates (calcite, dolomite) or detrital silicates such as quartz and feldspars (TSU-3).
A direct relationship was observed between the variation in the content of trace elements and the mineral constituents. Within the inherited minerals, REE are controlled by phyllosilicates and heavy minerals. Together with Al, the trace elements Rb, Cs, and—partly—Ba and Sr are related to feldspars and micas. Furthermore, Co, Cr and Sc closely linked to Al are considered to be elements associated with phyllosilicates. The variation of Ti and Hf is clearly associated with the heavy minerals (rutile, zircon). The Sr content is mainly related to the remains of the identified bioclasts (shells). Among the elements not linked to inherited minerals are Br and Na, which are formed under evaporative conditions (halite), S (gypsum) and part of Ba (possible whiterite).
The statistical study has made it possible to establish two geochemical associations. One is linked mainly to inherited minerals (REE-Y-Rb-Sr-Cs-Th-U-Hf-Al-Ti-Co-Cr-Sc), with a generally very high correlation coefficient (r > 0.80) with the exception of Hf and U. Other elements, such as Ba and S, present a very low correlation with this association. The second association is constituted by Br and Na, elements linked to evaporite minerals, where the correlation coefficient is high (r = 0.95).
The factor analysis supports the results obtained in the bivariate analysis, but also allows for the geochemical differentiation of the three tsunami deposits. Despite the geochemical complexity of estuary environments, factor analysis becomes an excellent tool to differentiate tsunamiites and samples belonging to other sedimentary environments (lagoon, ebb-tide channels or eolian environments). In both TSU-1 and TSU-2, the factor that best differentiates them is that associated with elements linked to high-energy events (Hf, Ti) and the evidence of marine influence (Br, Na). TSU-3 is clearly influenced by the involvement of aeolian sands, especially at its base.
Several elementary relationships have shown the existence of proxies of marine incursions (Br/Al, Sr/Al, Ba/Al and Ba/Rb) and associated high-energy events (Hf/Al, Ti/Al, Ti/Rb, REE/Al).
With respect to the type of rocks in the parent area of THE provenance of the sedimentary lithofacies, the elemental ratios (Th/Sc, Cr/Th, La/Sc and Th/Co) indicate a predominant felsic composition. The relation La/Th versus Hf is presented as an excellent example of a graphic representation that corroborates the felsic character of the parent rocks, along with the differentiation of the tsunamiite deposits studied.
In the studied area, the main sedimentary sources are the Guadalquivir river, the Doñana spit and the marine shelf, with significant mineralogical differences. A greater proportion of sediments derived from one of these sources controls the geochemistry of the sediments.

Author Contributions

Conceptualization: M.P., F.R., and M.I.C.; methodology: all authors; software, J.M.M., F.R.; validation: J.R.V.; L.M.C.; formal analysis: all authors; investigation: all authors; resources: M.I.C., M.P., F.R., J.R.V.; data curation: all authors; writing—original draft preparation: M.P., F.R.; writing—review and editing: M.P., F.R., M.L.G.-R., M.I.C., M.I.P.; visualization: all authors; supervision, M.P., F.R., M.I.C.; project administration: F.R.; funding acquisition: M.I.C., M.P., F.R., J.R.V. All authors have read and agreed to the published version of the manuscript.

Funding

This work was carried out through the following projects: (a) DGYCIT project CTM2006-06722/MAR; (b) DGYCIT project CGL2006-01412; and (c) FEDER 2014-2020 project UHU-126029. Other funds have come from the Autonomous University of Madrid (GPG-418 Research Group) and the Andalusian Government (groups RNM-238, RNM-293 and RNM-349). It is a contribution to the Research Center in Historical, Cultural and Natural Heritage (CIPHCN) of the University of Huelva.

Conflicts of Interest

The authors declare no conflict of interest. The funders had no role in the design of the study; in the collection, analyses, or interpretation of data; in the writing of the manuscript, or in the decision to publish the results.

References

  1. Farley, G.; Schneider, L.; Clark, G.J.; Haberle, S.G. A Late Holocene palaeoenvironmental reconstruction of Ulong Island, Palau, from starch grain, charcoal, and geochemistry analyses. J. Archaeol. Sci. Rep. 2018, 22, 248–256. [Google Scholar] [CrossRef]
  2. Kostecki, R.; Janczak-Kostecka, B.; Endler, M.; Moros, M. Environmental evolution of western Baltic Sea in the Holocene in the light of multidisciplinary investigations of sediments cores from Arkona Basin. Quat. Int. 2018, 493, 39–49. [Google Scholar] [CrossRef]
  3. Schnedl, S.-M.; Haselmair, A.; Gallmetzer, I.; Mautner, A.-K.; Tomašových, A.; Zuschin, M. Molluscan benthic communities at Brijuni Islands (northern Adriatic Sea) shaped by Holocene sea-level rise and recent human eutrophication and pollution. Holocene 2018, 28, 1801–1817. [Google Scholar] [CrossRef] [PubMed]
  4. Akkajit, P.; Suteersak, T. The study of historical contamination of Tin (Sn) and Zinc (Zn) in sediments at the Bang-Yai River estuary, Phuket Province. J. Appl. Sci. 2017, 16, 8–18. [Google Scholar] [CrossRef]
  5. Cundy, A.B.; Croudace, I.W. The Fate of Contaminants and Stable Pb Isotopes in a Changing Estuarine Environment: 20 Years On. Environ. Sci. Technol. 2017, 51, 9488–9497. [Google Scholar] [CrossRef] [Green Version]
  6. Liu, C.; Clift, P.D.; Murray, R.W.; Blusztajn, J.; Ireland, T.; Wan, S.; Ding, W. Geochemical evidence for initiation of the modern Mekong delta in the southwestern South China Sea after 8 Ma. Chem. Geol. 2017, 451, 38–54. [Google Scholar] [CrossRef] [Green Version]
  7. Adebayo, S.B.; Cui, M.; Hong, T.; White, C.D.; Martin, E.E.; Johannesson, K.H. Rare Earth Elements Geochemistry and Nd Isotopes in the Mississippi River and Gulf of Mexico Mixing Zone. Front. Mar. Sci. 2018, 5, 166. [Google Scholar] [CrossRef] [Green Version]
  8. Pourret, O.; Tuduri, J. Continental shelves as potential resource of rare earth elements. Sci. Rep. 2017, 7, 1–6. [Google Scholar] [CrossRef] [Green Version]
  9. Fiket, Ž.; Mlakar, M.; Kniewald, G. Distribution of Rare Earth Elements in Sediments of the Marine Lake Mir (Dugi Otok, Croatia). Geoscience 2018, 8, 301. [Google Scholar] [CrossRef] [Green Version]
  10. Chagué-Goff, C.; Szczuciński, W.; Shinozaki, T. Applications of geochemistry in tsunami research: A review. Earth-Sci. Rev. 2017, 165, 203–244. [Google Scholar] [CrossRef]
  11. Moreira, S.; Costa, P.J.; Andrade, C.; Lira, C.P.; Freitas, M.C.; Oliveira, M.A.; Reichart, G.-J. High resolution geochemical and grain-size analysis of the AD 1755 tsunami deposit: Insights into the inland extent and inundation phases. Mar. Geol. 2017, 390, 94–105. [Google Scholar] [CrossRef]
  12. Nentwig, V.; Bahlburg, H.; Górecka, E.; Huber, B.; Bellanova, P.; Witkowski, A.; Encinas, A. Multiproxy analysis of tsunami deposits—The Tirúa example, central Chile. Geosphere 2018, 14, 1067–1086. [Google Scholar] [CrossRef] [Green Version]
  13. Civis, J.; Sierro, F.J.; González-Delgado, J.A.; Flores, J.A.; Andrés, I.; Porta, J.; Valle, M.F. El Neógeno marino de la provincial de Huelva: Antecedents y definición de las unidades litoestratigráficas. In Paleontología del Neógeno de Huelva; Universidad de Salamanca: Salamanca, Spain, 1987; pp. 9–21. [Google Scholar]
  14. Mayoral, E.; Pendón, J.G. Icnofacies y sedimentación en zona costera. Plioceno superior (?), litoral de Huelva. Acta Geol. Hisp. 1987, 21–22, 507–513. [Google Scholar]
  15. Salvany, J.M.; Medialvilla, C.; Rebollo, A. Las formaciones Plio-Cuaternarias de El Abalario en el litoral de la provincial de Huelva (España). Est. Geol. 2010, 66, 209–225. [Google Scholar] [CrossRef] [Green Version]
  16. Galán, E.; González, I.; Mayoral, M.; Vázquez, M.A. Caracterización y origen de la facies glauconítica de la Cuenca del Guadalquivir. Est. Geol. 1989, 45, 169–175. [Google Scholar] [CrossRef]
  17. Abad, M. La transgression Tortoniense en el Margen Pasivo de la Cuenca del Guadalquivir: Respuesta Estratigráfica e Implicaciones Paleontológicas. Ph.D. Thesis, University of Huelva, Huelva, Spain, 2007. [Google Scholar]
  18. Pozo, M.; Carretero, M.I.; Ruiz, F.; Olías, M.; Abad, M.; Rodríguez Vidal, J.; Cáceres, L.M.; Prudencio, M.I.; Dias, M.I.; Muñoz, A.; et al. Geochemistry of Lower Pliocene to Holocene Formations from the Doñana National Park (SW Spain). In Advances in Geochemistry; Sanjurjo, J., Ed.; Nova Science Publishers: New York, NY, USA, 2013; pp. 1–10. [Google Scholar]
  19. Pozo, M.; Ruiz, F.; Carretero, M.I.; Rodríguez-Vidal, J.; Cáceres, L.M.; Abad, M.; González-Regalado, M.L. Mineralogical assemblages, geochemistry and fossil associations of Pleistocene–Holocene complex siliciclastic deposits from the Southwestern Doñana National Park (SW Spain): A palaeoenvironmental approach. Sediment. Geol. 2010, 225, 1–18. [Google Scholar] [CrossRef]
  20. Ruiz, F.; Pozo, M.; Carretero, M.I.; Abad, M.; González-Regalado, M.L.; Muñoz, J.M.; Rodríguez Vidal, J.; Cáceres, L.M.; Prudencio, M.I.; Dias, M.I. Birth, evolution and death of a lagoon: Late Pleistocene to Holocene palaeoenvironmental reconstruction of the Doñana National Park SW Spain. In Lagoons: Biology, Management and Environmental Impact; Friedman, A.G., Ed.; Nova Science Publishers: New York, NY, USA, 2010; pp. 371–396. [Google Scholar]
  21. Zazo, C.; Goy, J.L.; Somoza, L.; Dabrio, C.J.; Belluomini, G.; Improta, S.; Larío, J.; Bardají, T.; Silva, P.G. Holocene Sequence of Sea-Level Fluctuations in Relation to Climatic Trends in the Atlantic-Mediterranean Linkage Coast. J. Coast. Res. 1994, 10, 933–945. [Google Scholar]
  22. Campos, M.L. Tsunami hazard on the Spanish coasts of the Iberian Peninsula. Sci. Tsunami Haz. 1991, 9, 83–90. [Google Scholar]
  23. Gràcia, E.; Vizcaino, A.; Escutia, C.; Asioli, A.; Rodés, A.; Pallàs, R.; Garcia-Orellana, J.; Lebreiro, S.; Goldfinger, C. Holocene earthquake record offshore Portugal SW Iberia: Testing turbidite paleoseismology in a slow-convergence margin. Quat. Sci. Rev. 2010, 29, 1156–1172. [Google Scholar] [CrossRef]
  24. R Core Team. R: A Language and Environment for Statistical Computing; R Foundation for Statistical Computing: Vienna, Austria, 2019. [Google Scholar]
  25. Rollinson, H.R. Using Geochemical Data: Evaluation, Presentation, Interpretation; Longman: New York, NY, USA, 1993. [Google Scholar]
  26. Mosser, C.; Brillanceau, A.; Besnus, Y. Relationship between sedments and their igneous source rocks using clay mineral multi.element chemistry: The Cenozoic lacustrine Anloua Basin Aldamaoua, Cameroon. Chem. Geol. 1991, 90, 319–342. [Google Scholar] [CrossRef]
  27. Deer, F.W.A.; Howie, R.A.; Zussman, J. Introduction to the Rock-Forming-Minerals; Mineralogical Society: London, UK, 2013. [Google Scholar]
  28. Cullers, R.L.; Barrett, T.; Carlson, R.; Robinson, B. Rare-earth element and mineralogic changes in Holocene soil and stream sediment: A case study in the Wet Mountains, Colorado, U.S.A. Chem. Geol. 1987, 63, 275–297. [Google Scholar] [CrossRef]
  29. Cullers, R. Mineralogical and chemical changes of soil and stream sediment formed by intense weathering of the Danburg granite, Georgia, U.S.A. Lithos 1988, 21, 301–314. [Google Scholar] [CrossRef]
  30. Mason, B.B.; Sons, J.W.A. Principles of Geochemistry. Soil Sci. 1958, 86, 228. [Google Scholar] [CrossRef]
  31. Bauluz, B.; Abad, C.A.; Fernandez-Nieto, C.; Lopez, J.M.G. Mineralogy and geochemistry of Miocene deposits at Alcubierre Sierra, central sector of the Ebro Basin, Spain. Clay Miner. 1994, 29, 391–400. [Google Scholar] [CrossRef]
  32. Jagodziński, R.; Sternal, B.; Szczuciński, W.; Lorenc, S. Heavy minerals in 2004 tsunami deposits on Kho Khao Island, Thailand. Pol. J. Environ. Stud. 2009, 18, 103–110. [Google Scholar]
  33. Mosser, C. Etude Géochemique de Quelques Éléments Traces Dans Les Argiles Des Altérations Et Des Sediments; Sciences Géologiques, Bulletins et Mémoires; Université de Strasbourg: Strasbourg, Fance, 1980; Volume 63, 229p. [Google Scholar]
  34. Cuven, S.; Paris, R.; Falvard, S.; Miot-Noirault, E.; Benbakkar, M.; Schneider, J.-L.; Billy, I. High-resolution analysis of a tsunami deposit: Case-study from the 1755 Lisbon tsunami in southwestern Spain. Mar. Geol. 2013, 337, 98–111. [Google Scholar] [CrossRef]
  35. Rutsch, H.J.; Mangini, A.; Bonani, G.; Dittrich-Hannen, B.; Kubile, P.W.; Suter, M.; Segl, M. 10Be and Ba concentrations in western African sediments trace productivity in the past. Earth Planet. Sci. Lett. 1995, 133, 129–143. [Google Scholar] [CrossRef]
  36. Tucker, M.E.; Wright, V.P. Carbonate Mineralogy and Chemistry. In Carbonate Sedimentology; Wiley: Hoboken, NJ, USA, 2009; pp. 284–313. [Google Scholar]
  37. Robinson, C. Lago Grande di Monticchio, southern Italy: A long record of environmental change illustrated by sediment geochemistry. Chem. Geol. 1994, 118, 235–254. [Google Scholar] [CrossRef]
  38. Bau, M. Controls on the fractionation of isovalent trace elements in magmatic and aqueous systems: Evidence from Y/Ho, Zr/Hf, and lanthanide tetrad effect. Contrib. Miner. Pet. 1996, 123, 323–333. [Google Scholar] [CrossRef]
  39. Wang, X.; Griffin, W.L.; Chen, J. Hf contents and Zr/Hf ratios in granitic zircons. Geochem. J. 2010, 44, 65–72. [Google Scholar] [CrossRef] [Green Version]
  40. Arhens, L.H.; Erlank, A.J. Hafnium. In Handbook of Geochemistry; Part 5, Sections B.–O.; Wedepohl, K.H., Ed.; Springer: Berlin/Heidelberg, Germany; New York, NY, USA, 1969; Volume 2. [Google Scholar]
  41. Langmuir, D. Uranium solution-mineral equilibrium at a low temperatures with applications to sedimentary ore deposits. Geochim. Cosmochim. Acta 1978, 42, 547–569. [Google Scholar] [CrossRef]
  42. Kniewald, G.; Branica, M. Role of uranium(V) in marine sedimentary environments: A geochemical possibility. Mar. Chem. 1988, 24, 1–12. [Google Scholar] [CrossRef]
  43. Cosgrove, M. Iodine in the bituminous Kimmeridge Shales of the Dorset Coast, England. Geochim. Cosmochim. Acta 1970, 34, 830–836. [Google Scholar] [CrossRef]
  44. Kabata-Pendias, A. Trace Elements in Soils and Plants, 3rd ed.; CRC Press Inc.: Bocca Raton, FL, USA, 2001. [Google Scholar]
  45. Sánchez-Bellón, A.; Mosser, C.; Roquin, C.; Pardo, E.S. Geochemical characterization of sedimentary basins by statistical analysis: The Mio-Pliocene sequences of the Vera Basin, SE Spain. Chem. Geol. 1994, 116, 229–243. [Google Scholar] [CrossRef]
  46. Hild, E.; Brumsack, H.J. Major and minor element geochemistry of Lower Aptian sediments from the NW German Basin (core Hoheneggelsen KB 40). Cretac. Res. 1998, 19, 615–633. [Google Scholar] [CrossRef]
  47. Chagué-Goff, C.; Dawson, S.; Goff, J.; Zachariasen, J.; Berryman, K.; Garnett, D.; Waldron, H.; Mildenhall, D. A tsunami (ca. 6300 years BP) and other Holocene environmental changes, northern Hawke’s Bay, New Zealand. Sediment. Geol. 2002, 150, 89–102. [Google Scholar] [CrossRef]
  48. Sohlenius, G.; Emeis, K.-C.; Andrén, E.; Andrén, T.; Kohly, A. Development of anoxia during the Holocene fresh–brackish water transition in the Baltic Sea. Mar. Geol. 2001, 177, 221–242. [Google Scholar] [CrossRef]
  49. Nichol, S.; Goff, J.; Devoy, R.; Chague-Goff, C.; Hayward, B.W.; James, I. Lagoon subsidence and tsunami on the West Coast of New Zealand. Sediment. Geol. 2007, 200, 248–262. [Google Scholar] [CrossRef]
  50. Daesslé, L.W.; Rendón-Márquez, G.; Camacho-Ibar, V.F.; Gutiérrez-Galindo, E.A.; Shumilin, E.; Ortiz-Campos, E. Geochemistry of modern sediments from San Quintín coastal lagoon, Baja California: Implication for provenance. Rev. Mex. Cienc. Geol. 2009, 26, 117–132. [Google Scholar]
  51. Schlichting, R.B.; Peterson, C.D. Mapped Overland Distance of Paleotsunami High-Velocity Inundation in Back-Barrier Wetlands of the Central Cascadia Margin, U.S.A. J. Geol. 2006, 114, 577–592. [Google Scholar] [CrossRef] [Green Version]
  52. Brill, D.; Brückner, H.; Jankaew, K.; Kelletat, D.; Scheffers, A.; Scheffers, S.R. Potential predecessors of the 2004 Indian Ocean Tsunami—Sedimentary evidence of extreme wave events at Ban Bang Sak, SW Thailand. Sediment. Geol. 2011, 239, 146–161. [Google Scholar] [CrossRef]
  53. Wells, J.R.G.A.; Nichol, S.L.; Devoy, R.J.; Chagué-Goff, C. The Elusive AD 1826 Tsunami, South Westland, New Zealand. N. Z. Geogr. 2004, 60, 28–39. [Google Scholar] [CrossRef]
  54. Goff, J.; Pearce, S.; Nichol, S.L.; Chagué-Goff, C.; Horrocks, M.; Strotz, L. Multi-proxy records of regionally-sourced tsunamis, New Zealand. Geomorphology 2010, 118, 369–382. [Google Scholar] [CrossRef]
  55. Chagué-Goff, C.; Chan, J.C.H.; Goff, J.; Gadd, P. Late Holocene record of environmental changes, cyclones and tsunamis in a coastal lake, Mangaia, Cook Islands. Isl. Arc 2016, 25, 333–349. [Google Scholar] [CrossRef]
  56. Font, E.; Veiga-Pires, C.; Pozo, M.; Nave, S.; Costas, S.; Muñoz, F.R.; Abad, M.; Simoes, N.; Duarte, S.; Rodríguez-Vidal, J. Benchmarks and sediment source(s) of the 1755 Lisbon tsunami deposit at Boca do Rio Estuary. Mar. Geol. 2013, 343, 1–14. [Google Scholar] [CrossRef] [Green Version]
  57. Paris, R.; Wassmer, P.; Lavigne, F.; Alexander, B.; Belousova, M.; Iskandarsyah, Y.; Benbakkar, M.; Ontowirjo, B.; Mazzoni, N. Coupling eruption and tsunami records: The Krakatau 1883 case study, Indonesia. Bull. Volcanol. 2014, 76, 814. [Google Scholar] [CrossRef]
  58. Goff, J. Tsunami Hazard Assessment for Hawke’s Bay Region; NIWA Client Report, CH2008-021; Tonkin & Taylor Ltd.: Hawke Bay, New Zealand, 2008. [Google Scholar]
  59. Chen, Z.; Chen, Z.; Zhang, W. Quaternary Stratigraphy and Trace-Element Indices of the Yangtze Delta, Eastern China, with Special Reference to Marine Transgressions. Quat. Res. 1997, 47, 181–191. [Google Scholar] [CrossRef]
  60. Coffey, M.; Dehairs, F.; Collette, O.; Luther, G.; Church, T.; Jickells, T. The Behaviour of Dissolved Barium in Estuaries. Estuar. Coast. Shelf Sci. 1997, 45, 113–121. [Google Scholar] [CrossRef] [Green Version]
  61. Lan, X.H.; Ma, D.X.; Xu, M.G. Some geochemical indicators of the Pearl River Delta and their facies significance. Mar. Geol. Quat. Geol. 1987, 7, 39–49, (In Chinese, with English Summary). [Google Scholar]
  62. Hanor, J.S.; Chan, L.H. Non-conservative behaviour of barium during mixing of Mississippi River and Gulf of Mexico waters. Earth Planet. Sci. Lett. 1977, 37, 242–250. [Google Scholar] [CrossRef]
  63. Morton, R.A.; Gelfenbaum, G.; Jaffe, B.E. Physical criteria for distinguishing sandy tsunami and storm deposits using modern examples. Sediment. Geol. 2007, 200, 184–207. [Google Scholar] [CrossRef]
  64. Morton, R.A.; Goff, J.; Nichol, S.L. Hydrodynamic implications of textural trends in sand deposits of the 2004 tsunami in Sri Lanka. Sediment. Geol. 2008, 207, 56–64. [Google Scholar] [CrossRef]
  65. López-González, N.; Borrego, J.; Ruiz, F.; Carro, B.; Lozano-Soria, O.; Abad, M. Geochemical variations in estuarine sediments: Provenance and environmental changes (Southern Spain). Estuar. Coast. Shelf Sci. 2006, 67, 313–320. [Google Scholar] [CrossRef]
  66. Ramírez-Herrera, M.-T.; Corona, N.; Lagos, M.; Černý, J.; Goguitchaichvili, A.; Goff, J.; Chagué-Goff, C.; Machain, M.L.; Zawadzki, A.; Jacobsen, G.; et al. Unearthing earthquakes and their tsunamis using multiple proxies: The 22 June 1932 event and a probable fourteenth-century predecessor on the Pacific coast of Mexico. Int. Geol. Rev. 2014, 56, 1584–1601. [Google Scholar] [CrossRef]
  67. Gutiérrez-Mas, J.; Domínguez-Bella, S.; López-Aguayo, F. Present-day sedimentation patterns of the Gulf of Cadiz northern shelf from heavy mineral analysis. Geo-Mar. Lett. 1994, 14, 52–58. [Google Scholar] [CrossRef]
  68. Chaillou, W.; Anschutz, P.; Lavaux, G.; Schäfer, J.; Blanc, G. The distribution of Mo, U, and Cd in relation to major redoxspecies in muddy sediments of the Bay of Biscay. Mar. Chem. 2002, 80, 41–59. [Google Scholar] [CrossRef]
  69. Tribovillard, N.; Algeo, T.J.; Lyons, T.; Riboulleau, A. Trace metals as paleoredox and paleoproductivity proxies: An update. Chem. Geol. 2006, 232, 12–32. [Google Scholar] [CrossRef]
  70. Cullers, R.L.; Basu, A.; Suttner, L.J. Geochemical signature of provenance in sand-mixed material in sand-mixed material in soils and stream sediments near the Tobacco Root batholith, Montana, USA. Chem. Geol. 1988, 70, 335–348. [Google Scholar] [CrossRef]
  71. Taylor, S.R.; McLennan, S.M. The Continental Crust: Its Composition and Evolution; Blackwell: Oxford, UK, 1985. [Google Scholar]
  72. McLennan, S.; Taylor, S.; McCulloch, M.; Maynard, J. Geochemical and Nd–Sr isotopic composition of deep-sea turbidites: Crustal evolution and plate tectonic associations. Geochim. Cosmochim. Acta 1990, 54, 2015–2050. [Google Scholar] [CrossRef]
  73. Gromet, L.; Haskin, L.A.; Korotev, R.L.; Dymek, R.F. The “North American shale composite”: Its compilation, major and trace element characteristics. Geochim. Cosmochim. Acta 1984, 48, 2469–2482. [Google Scholar] [CrossRef]
  74. Rudnick, R.L.; Fountain, D.M. Nature and composition of the continental crust: A lower crustal perspective. Rev. Geophys. 1995, 33, 267–309. [Google Scholar] [CrossRef] [Green Version]
  75. Wang, C.; Zhang, L.; Dai, Y.; Lan, C. Geochronological and geochemical constraints on the origin of clastic meta-sedimentary rocks associated with the Yuanjiacun BIF from the Lüliang Complex, North China. Lithos 2015, 231–246. [Google Scholar] [CrossRef]
Figure 1. (a) Synthetic geology of southern Spain; (b) SW Guadalquivir Basin: geochemistry of the main geological formations. ND: no data.
Minerals 10 00956 g001
Figure 2. (a) Synthetic geomorphological map of the Doñana National Park; (b) Paleoenvironmental reconstruction of the cores PLN [19] and CM [20], including samples and radiocarbon dating from these references.
Minerals 10 00956 g002
Figure 3. Cores PLN and CM: photos of the main facies.
Minerals 10 00956 g003
Figure 4. Vertical variations (in ppm) of the light rare-earth elements (LREE) and heavy rare-earth elements (HREE). The detection limits are 0.5 ppm (La), 3 ppm (Ce), 5 ppm (Nd), 0.1 ppm (Sm), 0.2 ppm (Eu), 0.2 ppm (Yb), 0.05 ppm (Lu) and 1 ppm (Y).
Minerals 10 00956 g004
Figure 5. Vertical variations (in ppm) of large-ion lithophile elements (LILEs) and high field strength elements (HFSEs). The detection limits are 15 ppm (Rb), 1 ppm (Sr), 1 ppm (Cs), 50 ppm (Ba), 0.2 ppm (Th), 0.5 ppm (U) and 1 ppm (Hf).
Minerals 10 00956 g005
Figure 6. Vertical variations of other elements (%: Al, Na, S, Ti; ppm: Br, Ce, Cr, Sc). The detection limits are 0.01% (Al), 0.01% (Na), 0.01% (S), 0.5 ppm (Br), 1 ppm (Co), 2 ppm (Cr) and 0.1 ppm (Sc).
Minerals 10 00956 g006
Figure 7. Mineralogy: triangular plot. Phyllosilicates are mostly formed by the following association: illite/mica-smectite > (kaolinite) [19].
Minerals 10 00956 g007
Figure 8. Representative heavy mineral assemblage from TSU-1 and TSU-2. Adapted from [19].
Minerals 10 00956 g008
Figure 9. Trace elements: factor analysis. (AC) elements. (A) F1–F2 diagram; (B) F1–F3 diagram; (C) F2–F3 diagram. (DF) samples. (D) F1–F2 diagram; (E) F1–F3 diagram; (F) F2–F3 diagram.
Minerals 10 00956 g009
Figure 10. EE abundances normalized to the chondrite values in core PLN. The Y-axis is in a logarithmic scale.
Minerals 10 00956 g010
Figure 11. REE abundances normalized to chondrite values in core CM. The Y axis is in a logarithmic scale.
Minerals 10 00956 g011
Figure 12. Vertical distribution of the REEY/Al, Ti/Al, Hf/Al, Sr/Al and Br/Al ratios. REEY: REE+Y.
Minerals 10 00956 g012
Figure 13. Vertical distribution of the Ba/Al, Ti/Rb, Ba/Rb and U/Th ratios.
Minerals 10 00956 g013
Figure 14. (A) Bivariate plot of Th/Sc–Cr/Th. (B) Bivariate plot of La/Sc–Th/Co.
Minerals 10 00956 g014
Figure 15. Bivariate plot of Hf-La/Th.
Minerals 10 00956 g015
Figure 16. Factorial analysis: mineralogy vs geochemistry. (A) The rotated factor loadings (factor scores) of the three main factors; (B) variables: F1–F2 diagram; (C) samples: F1–F2 diagram.
Minerals 10 00956 g016
Table 1. Mineralogical database of samples. P: phyllosilicates; Q: quartz; F: feldspars; C: calcite; D: dolomite; H: halite; G: gypsum; A: aragonite; Tr. traces (extracted from [19,20]).
SamplesPaleoenvironmentTotal Mineralogy
PLN-1TSU-2P42Q13F7C28D7GTrH3
PLN-2TSU-2P33Q14F8C31D11H3
PLN-3Ebb-tide channelP54Q10F3C19D9G2H3
PLN-4Ebb-tide channelP45Q16F4C26D2G4H3
PLN-5LagoonP43Q14F4C28D8GTrH3
PLN-6TSU-1P34Q10F24C22D9GTrH1
PLN-7TSU-1P35Q12F13C12D24H4
PLN-8LagoonP51Q16F7C21D5
PLN-9LagoonP55Q20F2C20D3
PLN-10LagoonP41Q13F15C24D5G1H1
PLN-11LagoonP33Q18F8C24D14H3
PLN-12LagoonP35Q20F6C32D7
PLN-13LagoonP45Q12F4C33D6
PLN-14Marine inputP49Q8F5C31D6G1
PLN-15Freshwater to salt marshP32Q14F8C34D12
PLN-16Freshwater to salt marshP31Q17F14C28D8G2
PLN-17Freshwater to salt marshP24Q14F8C21D32G1
CM-1Aeolian systemsPTrQ83F15C2
CM-2Salt marsh/lagoon marginP62Q10F3C22D3
CM-3Salt marsh/lagoon marginP40Q27F3C24D3G3
CM-4Lagoon inletP55Q12F3C27D3GTr
CM-5TSU-3P15Q44F19C20D2
CM-6TSU-3P3Q71F21C4D1
CM-7Lagoon inletP9Q57F24C10
CM-8Salt marsh/lagoon marginP56Q13F2C23D6
CM-9Lagoon inletQ70F10C15D2A3
CM-10Lagoon inletQ76F7C12D2A3
Table 2. Database of the 14C results and historical data (TSU-3).
Core-SampleLab. Number14C Age (BP)Error cal BP (2σ)Mean cal BP (2σ)References
PLN-1 (TSU-2)B-2288803550403700–34303560 (3.56 cal kyr BP)[19]
PLN-7 (TSU-1)B-2288814060404400–40904250 (4.25 cal kyr BP)[19]
PLN-7/8B-2288854200404580–42704440[19]
PLN-13B-2288826090406770–65006640[19]
CM-4B-2288732030401860–15901730[20]
TSU-3Historical data: tsunamis/storms~2.2–2 kyr BP
CM-10B-2288762830402840–25602720[20]
Table 3. Paleoenvironments. B: base; T: top.
(a) LREE and HREE (in ppm)
PALEOENVIRONMENTCORE PLN: INNER AREAS
LREEHREE
LaCeNdSmEuYbLuY
Freshwater to salt marsh29.3–32.548–5326–294.77–5.191.11.9–2.30.3–0.3712–21
Ebb-tide channel31.7–31.95123–255.191.2–1.42.3–2.40.34–0.3622–24
Lagoon29.7–33.348–5719–314.98–5.41.1–1.42.4–2.70.35–0.3712–22
Marine input30.452184.981.12.20.3619
TSU-126.9 (B)–33.1 (T)43 (B)–59 (T)18 (B)–25 (T)4.36 (B)–5.4 (T)1 (B)–1.3 (T)2.1 (B)–2.8 (T)0.31 (B)–0.35 (T)22 (B)–18 (T)
TSU-237.8 (B)–37.9 (T)62 (B–T)26 (B)–32 (T)6.22 (B–T)1.3 (B)–1.2 (T)2.9 (B–T)0.45 (B)–0.46 (T)24 (B)–22 (T)
PALEOENVIRONMENTCORE CM: EXTERNAL AREAS
LREEHREE
LaCeNdSmEuYbLuY
Lagoon inlet4.7–27.88–515–230.6–4.60.2–1.10.3–2.20.07–0.294–20
Salt marsh/lagoon margin28–31.949–5222–284.6–5.21.1–1.22.1–2.40.3–0.3719–23
Aeolian systems3.9650.60.20.40.054
TSU-34.9 (B)–18.5 (T)7 (B)–32 (T)5 (B)–18 (T)0.6 (B)–3.1 (T)0.3 (B)–0.8 (T)0.4 (B)–1.4 (T)0.05 (B)–0.22 (T)3 (B)–13 (T)
(b) LILE and HFSE (in ppm)
PALEOENVIRONMENTCORE PLN: INNER AREAS
LILEHFSE
RbSrCsBaThUHf
Freshwater to salt marsh82–99286–3436–7 11.3–13.83–63–4
Ebb-tide channel75–106325–3357–8210–32010–10.53–3.14–5
Lagoon73–115310–3586–750–34010.2–12.71.8–4.16–7
Marine input70383529010.83.36
TSU-173 (B)–101 (T)330 (B)–306 (T)5 (B)–6(T)50 (B)–160 (T)9.5 (B)–10 (T)2.5 (B)–4.6 (T)6 (B)–8 (T)
TSU-293 (B)–69 (T)359 (B)–358 (T)6 (B–T)330 (B)–360 (T)12.4 (B)–12.3 (T)4 (B)–4.9 (T)12 (B)–13 (T)
PALEOENVIRONMENTCORE CM: EXTERNAL AREAS
LILEHFSE
RbSrCsBaThUHf
Lagoon inlet19–83214–3321–680–2901.9–11.50.5–2.41–5
Salt marsh/lagoon margin71–91310–3336–7 230–26010–122.4–2.54
Aeolian systems15241502.20.52
TSU-328 (B)–59 (T)50 (B)–292 (T)1 (B)–5 (T)130 (B)–190 (T)2.2 (B)–7.7 (T)0.5 (B)–0.8 (T)<1 (B)–5 (T)
(c) Other Elements (in %: Al, Na, S, Ti; the rest of elements are shown in ppm)
PALEOENVIRONMENTCORE PLN: INNER AREAS
OTHERS
AlNaSTiBrCoCrSc
Freshwater to salt marsh5.8–6.530.31–0.450.02–1.370.31–0.384.1–8.911–1566–8710.3–12.2
Ebb-tide channel6.57–6.651.05–1.210.53–0.540.43–0.4539.5–40.812–1379–8212.2–12.3
Lagoon5.2–5.890.67–1.060.17–0.320.34–0.4214.1–37.610–1363–759.4–11.2
Marine input5.230.560.260.3910.111609.6
TSU-14.9 (B)–5.48 (T)1.32 (B)–1.19 (T)0.19 (B)–0.3 (T)0.47 (B)–0.5 (T)37.4 (B)–38.9 (T)14 (B)–11 (T)54 (B)–70 (T)9 (B)–10.6 (T)
TSU-25.7 (B)–5.13 (T)1.32 (B)–0.92 (T)0.31 (B)–0.3 (T)0.56 (B)–0.49 (T)45.7 (B)–30.2 (T)14 (B)–11 (T)81 (B)–69 (T)11.3 (B)–10.2 (T)
PALEOENVIRONMENTCORE CM: EXTERNAL AREAS
OTHERS
AlNaSTiBrCoCrSc
Lagoon inlet1.08–5.970.19–0.410.02–0.290.06–0.410.7–5.13–127–721–10.4
Salt marsh/lagoon margin6.12–6.420.36–0.490.34–0.510.35–0.46–7.19–1266–7810.8–12.2
Aeolian systems0.840.1<0.010.180.5161
TSU-31.1 (B)–4.29 (T)0.28 (B)–0.58 (T)0.01 (B)–0.26 (T)0.04 (B)–0.32 (T)0.6 (B)–4.2 (T)2 (B)–7 (T)10 (B)–35 (T)1 (B)–5.9 (T)
Table 4. Tolerance intervals (2σ). Red: positive outliers; orange: almost-positive outliers; dark green: negative outliers; light green: almost-negative outliers.
ELEMENTMEANSDMINMAXTOLERANCE INTERVAL (2σ)TSU-1 (Base)TSU-1 (Top)TSU-2 (Base)TSU-2 (Top)TSU-3 (Base)TSU-3 (Top)
La26.2510.053.933.36.1646.3526.933.137.937.84.918.5
Ce43.9516.6865710.5877.3243596262732
Nd21.528.275314.9938.06182526325 18
Sm4.291.70.65.40.897.694.365.46.226.220.63.1
Eu1.030.390.21.40.251.8111.31.31.20.3 0.8
Yb20.780.32.70.453.552.12.82.92.90.41.4
Lu0.30.110.050.40.080.520.310.350.450.460.050.22
Y16.956.574243.8230.0922182422313
Rb74.926.421511522.05127.767310193692859
Sr303.8678.6824383146.5461.2233030635935850292
Cs5.432.09181.259.6566615
Ba21092.365034025.28394.7250160330360130190
Th9.583.551.913.82.4916.689.51012.412.32.27.7
U2.71.240.560.235.172.54.644.90.80.5
Hf4.621.75171.138.116812130.55
Al5.141.880.847.011.388.894.95.485.75.131.14.29
Na0.590.310.11.2101.21.321.19 1.320.920.280.58
S0.30.30.0051.3700.890.190.30.310.30.01 0.26
Ti0.340.110.060.450.110.570.470.50.56 0.490.040.32
Br15.2513.930.540.8043.137.438.945.730.20.64.2
Co9.953.941152.0717.841411141127
Cr60.1425.86878.55111.73547081693510
Sc9.183.87112.31.4416.91910.611.310.215.9
Table 5. Correlation matrix. Bold: p < 0.01; underlined: p < 0.05.
ElementLaCeNdSmEuYbLuYRbSrCsBaThUHfAlNaSTiBrCoCrSc
La1
Ce0.991
Nd0.930.931
Sm0.990.990.931
Eu0.970.970.900.971
Yb0.990.980.910.990.971
Lu0.990.980.900.980.950.981
Y0.910.900.820.910.900.890.891
Rb0.880.880.870.880.890.880.860.801
Sr0.850.860.800.850.820.820.850.840.751
Cs0.930.920.890.930.950.900.890.900.890.801
Ba0.570.530.510.560.520.510.580.470.38 0.490.571
Th0.950.940.910.950.920.920.930.890.870.830.940.631
U0.790.810.760.770.730.750.760.640.690.630.640.310.691
Hf0.730.730.630.740.660.770.780.660.500.630.540.510.640.581
Al0.780.770.690.780.800.760.760.950.700.760.850.400.780.490.501
Na0.620.610.440.620.630.680.640.620.510.520.510.160.430.480.690.581
S0.420.450.460.410.420.34 0.34 0.400.35 0.420.460.180.410.620.10.400.161
Ti0.920.920.800.920.900.940.920.900.790.760.850.480.850.680.790.820.760.341
Br0.640.610.490.630.630.690.640.590.490.490.500.170.420.540.660.510.950.240.741
Co0.920.910.840.920.890.880.890.850.820.830.860.430.890.760.560.770.610.530.850.621
Cr0.960.960.910.960.950.930.930.920.900.810.960.530.950.740.570.820.520.470.860.540.911
Sc0.970.960.910.960.960.930.930.910.900.820.970.510.950.740.550.830.530.500.870.550.930.991
Table 6. Factor analysis: rotated factor loadings (factor scores) of the three main factors. Bold: the most significant elements of each factor.
FACTORF1 (53%)F2 (22.8%)F3 (14%)
La0.826−0.4620.309
Ce0.813−0.4510.344
Nd0.819−0.2850.367
Sm0.831−0.4630.292
Eu0.801−0.4450.334
Yb0.789−0.5420.242
Lu0.822−0.5010.212
Y0.760−0.4430.294
Rb0.751−0.3160.384
Sr0.742−0.3490.290
Cs0.852−0.2770.355
Ba0.7850.020−0.227
Th0.916−0.2370.273
U0.482−0.4010.587
Hf0.549−0.696−0.160
Al0.829−0.2260.461
Na0.199−0.9400.121
S0.201−0.0100.853
Ti0.695−0.6340.206
Br0.181−0.9270.197
Co0.693−0.4240.486
Cr0.836−0.3190.402
Sc0.822−0.3240.441
Table 7. Correlation matrix between mineralogy and trace elements. Bold: p < 0.01; underlined: p < 0.05.
PhyllosilicatesQuartzFeldsparsCalciteDolomiteGypsumHaliteAragonite
La0.84−0.96−0.450.80.390.240.33−0.58
Ce0.84−0.96−0.440.80.40.20.3−0.57
Nd0.75−0.88−0.430.740.410.230.26−0.53
Sm0.85−0.96−0.460.80.360.230.32−0.59
Eu0.86−0.95−0.450.770.330.280.29−0.62
Yb0.83−0.94−0.410.780.340.160.34−0.59
Lu0.81−0.94−0.440.810.360.160.36−0.55
Y0.84−0.89−0.460.650.310.350.44−0.53
Rb0.72−0.88−0.340.710.420.240.29−0.53
Sr0.74−0.86−0.520.80.370.20.27−0.22
Cs0.84−0.92−0.470.760.290.430.26−0.61
Ba0.49−0.53−0.330.72−0.10.250.01−0.34
Th0.8−0.93−0.480.850.390.270.2−0.58
U0.5−0.75−0.20.550.640.180.31−0.42
Hf0.48−0.61−0.190.60.17−0.10.45−0.38
Al0.84−0.94−0.450.750.390.410.22−0.6
Na0.44−0.59−0.040.310.290.10.67−0.36
S0.33−0.45−0.310.220.620.30.13−0.28
Ti0.77−0.89−0.310.680.350.180.47−0.62
Br0.45−0.57−0.130.320.310.160.66−0.31
Co0.78−0.95−0.450.710.590.210.34−0.5
Cr0.85−0.94−0.510.760.380.360.28−0.57
Sc0.87−0.96−0.510.750.40.360.27−0.58
Publisher’s Note: MDPI stays neutral with regard to jurisdictional claims in published maps and institutional affiliations.

