Article

Investigation of the 176Yb Interference Correction during Determination of the 176Hf/177Hf Ratio by Laser Ablation and Solution Analysis on the Neoma MC-ICP-MS

Oak Ridge National Laboratory, Oak Ridge, TN 37830, USA
*
Author to whom correspondence should be addressed.
Minerals 2022, 12(7), 882; https://doi.org/10.3390/min12070882
Submission received: 23 May 2022 / Revised: 20 June 2022 / Accepted: 6 July 2022 / Published: 13 July 2022

Abstract

:
We utilized the Neoma™, a recently released MC-ICP-MS platform offered by ThermoFisher Scientific, to assess the behavior of the Lu-Yb-Hf system during laser ablation analyses of various zircon standards as well as solution-based analyses of the JMC-475 Hf standard doped with varying quantities of Yb and Lu. The primary goal of this work was to characterize the behavior of the Yb interference correction on the Neoma™ platform since this is one of the biggest issues in the Hf isotope analysis community and because the Neoma™ platform will supplant the Neptune™ series instrument. During laser ablation analysis, we found that the overall data quality scales proportionally with the total Hf signal intensity, with higher signal analyses producing extremely accurate (within 1 εHf unit) and precise (sub εHf unit within-run standard errors) data. At low Yb signals (<0.1 V 173Yb), we were not able to produce an accurate internal Yb mass bias factor. However, utilizing an empirical approach allows for the application of session-specific relationships between the Yb and Hf mass bias factors, determined by analysis of standards of varying Yb content, to produce accurate εHf values from zircons with higher Yb/Hf ratios even where the total Hf signal intensity is relatively low. Similar behavior was observed in the solution analyses. Lastly, while the behavior of the Yb interference correction on the Neoma™ platform appears comparable to the Neptune™ series MC-ICP-MS, further work will help refine the understanding of the controls on mass bias behavior, oxide formation, session-to-session stability, etc.

1. Introduction

Advances in analytical chemistry methods and the instrumentation needed to perform the analyses are synergistically linked. For example, ThermoFisher Scientific has recently released the new Neoma™ multi collector-inductively coupled plasma-mass spectrometer (MC-ICP-MS). This new platform has several key improvements over its predecessor (the Neptune™ series MC-ICP-MS) that were designed within the framework of the needs and direction of the analytical community [1]). This new platform will ultimately replace the existing Neptune™ series MC-ICP-MS from this manufacturer, so it is important to understand how the new instrument behaves with regard to the measurements commonly carried out within the analytical community. The Neptune™ series instrument is one of two commercially available MC-ICP-MS systems (the other platform is offered by Nu™) and is therefore widely utilized by analytical laboratories carrying out isotope ratio measurement across a wide range of disciplines (see discussion by [2]).
Within the Earth Science community, one of the most common applications of the Neptune™ is for the measurement of the Hf isotope composition of zircon. There are hundreds of thousands of zircon Hf isotope compositions reported in the literature (see discussion by [3]), and this ever-growing dataset has provided great insights into the evolution of Earth’s lithosphere and beyond.
For the Hf isotope system, the major ratio of interest is the 176Hf/177Hf because 176Hf is produced radiogenically from the beta decay of 176Lu (see discussion by [4]). Therefore, differences in the 176Hf/177Hf between various samples, typically noted in epsilon Hf (εHf) units, which are deviations in parts per 10,000 from the assumed 176Hf/177Hf of the undifferentiated bulk Earth (0.282785 is the value utilized in this study as determined by [5]), can be attributed to geochemical processes resulting in the fractionation of Lu and Hf from one another [6]. This technique has been most commonly applied to the mineral zircon because it typically contains weight % levels of Hf and only ppm levels of Lu, which means that the present-day observed 176Hf/177Hf remains relatively unchanged relative to 176Hf/177Hf acquired at the time of crystallization, thus reducing the impact of uncertainty attributed to a decay correction [7]. Additionally, the analysis of zircon can be readily performed by laser ablation (LA) so large numbers of zircons can be analyzed efficiently, meaning it is comparatively easy to generate a comprehensive dataset addressing whatever geologic problem is being investigated.
In order to perform the 176Hf/177Hf determination, a correction for the presence of the isobaric 176Yb and 176Lu interferences on 176Hf is necessary during the analytical session. This correction has been the subject of debate within the literature (e.g., [8]), with the major issue being how to properly determine a Yb mass bias factor that allows for the 176Yb to be stripped from the total 176Hf+Lu+Yb signal based on the signal intensity of the other Yb isotopes. In some cases, it is possible to directly constrain the Yb mass bias factor from an observed Yb isotope ratio (e.g., 173Yb/171Yb), but in other cases, the use of the directly calculated Yb mass bias factor produces erroneous 176Hf/177Hf ratios. While this behavior can sometimes be attributed to low Yb signal intensity, there are other documented cases where, even at higher Yb signal intensity, the directly calculated Yb mass bias factor produces an incorrect result. In this situation, another approach is to assume that the Yb and Hf mass bias factors are equal to one another. However, while this approach works for low Yb zircons, it has been shown to produce progressively more inaccurate 176Hf/177Hf ratios as the Yb content of the zircon increases (e.g., [9]). The alternative is to use an empirical approach to determine a session-specific relationship between the measured Hf mass bias factor and an inferred Yb mass bias factor that results in the best quality data (e.g., [10]). The 176Lu interference is less of an issue due to the fact that natural Lu is >99% 175Lu (however the correction must still be performed and typically relies on applying the Yb mass bias factor, empirical or observed, to the Lu interference correction calculation).
A key observation of the zircon Hf isotope literature is that the best Yb correction regime seems to be laboratory-specific even where the same laser ablation and MC-ICP-MS systems are utilized. For example, a comprehensive investigation by [11] reveals how instrumental parameters can drastically affect the mass bias regimes taking place during laser Hf analysis of zircon. Additionally, for the empirical approach, the relationship between the Yb and Hf mass bias factors appears to change from session to session (e.g., [9]) on the Neptune™ MC-ICP-MS. Despite these differences, there is a consensus within the community on best practices for processing and reporting data from the widely available zircon standards such that the quality of zircon Hf isotope data can generally easily be assessed for any given study [12].
A recent application note from ThermoFisher [13] presents the 176Hf/177Hf of several zircon standards measured by LA-ICP-MS utilizing the Neoma platform. While the observed values for the standards examined are consistent with their accepted values, the application note does not detail the behavior of the Yb mass bias correction on this new instrument other than to state that they were able to use the internally observed Yb mass bias factor for the Yb interference correction. Here, we investigate the behavior of the Yb (and Lu) interference correction regime during laser ablation as well as solution mode on the new ThermoFisher Neoma™ MC-ICP-MS. We utilize data from several sessions and from a variety of zircon standards with variable amounts of Yb and Lu to ascertain whether there are any obvious differences between the performance characteristics of the Neptune™ and Neoma™ MC-ICP-MS regarding this common measurement.

2. Methods

2.1. Instrument Setup and Different Analytical Modes

The data presented in this study were collected during six sessions (three laser ablation and three solution mode) utilizing two different faraday cup configurations (see Table 1). For the two different cup configurations, the only difference is that one configuration included 180Hf on the ‘highest’ faraday cup whereas the other configuration did not. Otherwise, the other isotopes were collected on the same faraday cups across the duration of the study. For both the laser ablation and solution analyses, one session (each sampling mode) was conducted with the standard cones (H + I), whereas the remaining two were conducted using the Jet + X cones (For a description of the different cone configurations pertinent to zircon LA-ICP-MS Hf analysis, see discussion by [11]). For the laser ablation analyses (all conducted using a 30 µm spot size utilizing an Elemental Scientific NWR 193™ laser ablation system), two different power settings (50% and 90%) were utilized resulting in fluences of ~4.14 and ~8.14 J/cm2 (10 Hz rep rate) at the zircon surface. During laser ablation analyses, the sample gas flow was ~1 L/min He with an additional ~4 mL/min of N added to the system just prior to the introduction of the ablated material into the plasma (we tuned for maximum Hf signal intensity while aiming for the lowest oxide production rate). For the solution analyses, a 50 µL/min nebulizer was utilized to aspirate the various solutions into a standard glass spray chamber. A nebulizer gas flow of ~1.1 L/min was utilized (the sample gas). The various analytical conditions are summarized in Table 2. For the solution analyses (which preceded the corresponding laser session), faraday cup gain and baseline calibrations were performed through the Neoma™ Qtegra instrument control software. Note that each analysis was preceded by a ‘blank’ consisting of data acquisition while the laser was not firing for the laser ablation analyses and aspiration of clean 2% HNO3 for the solution analysis. For the laser ablation analyses, data collection (not including the ‘blank’) lasted 30 s for each analysis which corresponds to the length of time the laser was firing. For all sessions, the instrument was operated in low-resolution mode and utilized a cooling gas flow of ~17 L/min, an auxiliary gas flow of ~1.3 L/min, and a plasma radiofrequency power of ~1600 W.

2.2. Standards

For the laser ablation sessions, shards from five different zircon standards were mounted in epoxy and then polished down to ~1 um utilizing diamond abrasives. The standards utilized included Plesovich (accepted 176Hf/177Hf = 0.282482; [14] who also report 178Hf/177Hf = 1.46720), Penglai (accepted 176Hf/177Hf = 0.282906; [15]), Mud Tank (176Hf/177Hf = 0.282507), 91500 (176Hf/177Hf = 0.282305), and R33 (176Hf/177Hf = 0.282767). Refer to summary Table 1 in [12] for sources of the accepted values of Mud Tank, 91500, and R33. Note that the value for 91500 reported in Fisher et al. (2014) is within error of the value reported in [16] (176Hf/177Hf = 0.282302(8)). While the accepted Hf isotopic composition of the R33 standard is less well constrained than the others (see discussion by [9]), it was included because it is known as a high Yb content standard and thus provides a qualitative assessment of the behavior of the Yb interference correction regime.
For the solution analyses, three standards were utilized: The JMC-475 Hf isotopic standard, as well as 1000 µg/g Lu and 1000 µg/g Yb (concentration standards manufactured by High Purity Standards) Firstly, the JMC-475 Hf isotope standard, having an accepted 176Hf/177Hf of 0.282160 ± 10 [17,18];, was analyzed in its pure form (dissolved in 2% HNO3 + 0.1M HF) at various concentration levels and with varying amounts of Yb and Lu, both prepared from the original 1000 µg/g stock solutions produced by High Purity Standards. While the isotopic composition of these Yb and Lu solutions is not certified, they are both assumed to have natural Yb and Lu isotopic compositions. The accepted 176Hf/177Hf and inferred 178Hf/177Hf, 179Hf/177Hf, and 180Hf/177Hf of the JMC-475 standard are provided in the electronic appendix along with the inferred Yb and Lu isotopic compositions of the HPS solutions utilized for data processing. In order to assess the Yb mass bias behavior at varying Yb contents, the JMC-475 Hf standard, diluted to 1 ppm, was doped with varying proportions of Yb and Lu ranging from 0.1 µg/g Yb and 0.025 µg/g Lu up to 0.5 µg/g Yb (in 0.1 µg/g increments) and 0.1 µg/g Lu in (in 0.025 µg/g increments). The exact proportions of Hf, Lu, and Yb in the solutions are provided with the solution analytical results in the electronic appendix.

3. Results

Data Processing

The raw signal intensities for each cycle of data collection (gain and baseline corrected) were exported directly from the Neoma™ Qtegra instrument control software and then further processed in Microsoft Excel™ for Microsoft 365 MSO (Version 2202 Build 16.0.14931.20494). For the observed signal intensities, a blank correction was applied on a line-by-line basis for the cycles in each analysis. This blank correction was derived by averaging the signal over a several-second period prior to firing the laser onto the zircon surface for the case of the laser ablation analyses, or by averaging the signal intensities over the entire analysis of the clean 2% HNO3 solution prior to each analysis. In practice, we found the blank correction to be negligible. For each cycle of data in an analysis, the Hf beta factor was calculated using the observed 179Hf/177Hf ratio according to the equation ‘beta Hf’ = LN(179Hf/177Hf(true)/179Hf/177Hf(obs))/LN(M179Hf/M177Hf). This beta factor was then used to directly calculate mass bias-corrected 178Hf/177Hf and 180Hf/177Hf (where measured) ratios for each cycle using the equations 178Hf/177Hf(true) = 178Hf/177Hf(obs) × (M178Hf/M177Hf)^(betaHf) and 180Hf/177Hf(true) = 180Hf/177Hf(obs) × (M180Hf/M177Hf)^(beta Hf). The observed 173Yb/171Yb was then utilized to calculate a Yb mass bias factor according to the equation ‘beta Yb’ = LN(173Yb/171Yb(true)/ 173Yb/171Yb (obs))/LN(M173Yb/M171Yb). Note that ‘M’ denotes the isotopic mass of each isotope.
The 176Yb and 176Lu interference corrections on the 176Hf signal were then performed in several ways. The first approach involved assuming the Yb and Lu beta factors are equal to the 179Hf/177Hf beta factor, and then using the equations 176Yb(calc) = 173Yb(obs) × 176Yb/173Yb(true) × (M173Yb/M176Yb)^(beta Hf) and 176Lu(calc) = 175Lu(obs) × 176Lu/175Lu(true) × (M175Lu/M176Lu)^(beta Hf) to calculate the magnitude of the 176Yb and 176Lu signals. The ‘peak stripped’ 176Hf signal was then utilized to calculate the 176Hf/177Hf ratio according to the following equation 176Hf/177Hf = ((176Hf(obs)176Yb(calc)176Lu(calc))/177Hf(obs) × (M176Hf/M177Hf)^(beta Hf). The second approach involved using the independently calculated Yb beta factor (and assuming that beta Lu = beta Yb) to determine the ‘peak stripped’ 176Hf signal. The 176Hf/177Hf was then calculated as described above. The third approach, referred to as the empirical approach, involved preparing a plot of the final calculated 176Hf/177Hf ratios for each analysis during a session as a function of that analyses average 173Yb signal while simultaneously varying the relationship between the Yb and Hf mass bias factors. The true values utilized in this study are 179Hf/177Hf = 0.7325 [19], 176Yb/173Yb = 0.79618, 173Yb/171Yb = 1.132685, and 176Lu/175Lu = 0.02655 (all from sources reported in [12]). The atomic masses (denoted by ‘M’ in the various equations) are those reported in [20].
Once a beta Yb = X beta Hf was found resulting in the flattest trend on this plot (e.g., no over or under correction of the 176Hf/177Hf with an increasing 173Yb signal), this relationship was adopted for that particular session (the Lu beta factor was also assumed to follow the same relationship with beta Hf). The various isotope ratios calculated for each cycle in an analysis were then averaged together, with the uncertainty associated with these averages calculated represented by the standard error of the mean. These averages were then compiled, which equate to the values contained in Supplementary Tables S1 (laser ablation) and S2 (solution data). Note that a complete dataset (the raw intensities observed at each cycle of data as well as calculations) can also be found in the electronic appendix associated with this study.

4. Discussion

4.1. Data Quality

In Figure 1, the 176Hf/177Hf ratios (±1 se) for each of the laser ablation analyses are shown relative to the accepted values of the various zircon standards. The 176Hf/177Hf ratios in this figure were calculated using the session-specific empirically determined Yb beta factor since this tended to produce the most accurate 176Hf/177Hf ratios at increasingly high Yb contents of the various zircons. This issue will be discussed in greater detail below, but an important observation of Figure 1 is that there is a range of within-run uncertainties as well as accuracy. Examination of Figure 2 reveals that there is an exponentially decreasing level of within-run uncertainty with increasing 177Hf intensity, which is the expected relationship during mass spectrometric analysis. The analyses with the lowest uncertainties are those with the highest 177Hf intensities (within run 1 se of less than 1 εHf unit). However, even at the higher levels of within-run uncertainty, it should be noted that the reported uncertainties are generally on the order of 1 to 2 epsilon Hf units which is consistent with what is observed on the Neoma™ predecessor instrument (the Neptune™ series). Additionally, while the choice of Yb interference correction regimes appears to exert the most control over the accuracy of the 176Hf/177Hf ratio, is also noteworthy that there is a trend towards marked improvement of the 176Hf/177Hf accuracy with increasing 177Hf voltage during the laser ablation analyses (Figure 3). The effects of different Yb interference correction regimes (Figure 4) and mass bias behavior (Figure 5) during the laser ablation analyses will be discussed further in Section 4.2.
For the solution dataset, analyses of the pure JMC-475 solution are associated with very low within-run uncertainties (<0.003%, Figure 6). For these pure solutions, the average 176Hf/177Hf observed across all three sessions is 0.282147(9) (1 sd). This agrees well with the accepted 176Hf/177Hf of the JMC-475 of 0.282160 [18]. However, once Yb and Lu are added to the JMC-475 standard, there is a tendency toward increasing within-run uncertainty as well as a decrease in the accuracy (regardless of which Yb interference correction regime is utilized). The increased within-run uncertainty with increasing proportions of Lu and Yb is not uniform across the three solution-based analytical sessions (Figure 6 and Figure 7), whereas the decrease in accuracy at increasing Yb and Lu is ubiquitous (Figure 8A–C). This is also reflected in Figure 7, where it can be seen that the analyses with higher magnitudes of deviation of the 176Hf/177Hf relative to the JMC-475 standard’s accepted value occur at the lower 177Hf voltages.

4.2. Effect of Different Yb Mass Bias Correction Regimes

In Figure 4A, it is evident that assuming Beta Hf and Beta Yb are equal results in a drastic over correction of the 176Hf/177Hf ratio with increasing Yb content for the laser ablation data. In Figure 4B, it can be seen that the use of an independently calculated Yb beta factor produces accurate 176Hf/177Hf ratios for the analyses with relatively high Yb intensity. This is unsurprising given the relationship between the calculated Yb beta factor and the 173Yb signal intensity depicted in Figure 5A. While the higher 173Yb signal intensities do appear to result in a stable Yb beta factor within a given session, it is clear that lower 173Yb intensities are associated with considerable scatter. While the magnitude of the Yb interference correction decreases with decreasing Yb signal intensity, the high degree of scatter in the Yb factors determined for the low Yb signal intensity analyses still appears to introduce scatter in the final calculated 176Hf/177Hf ratios. In contrast, the use of the session-specific empirical beta factor (Figure 4C) appears to produce the most accurate 176Hf/177Hf ratios regardless of the Yb signal intensity. Similar trends are observed for the solution analyses (Figure 8A–C), except that the magnitudes of the deviation from the true value of the JMC-475 Hf standard are considerably larger than for the laser ablation analyses (especially at higher Yb intensities). This is likely due to the increased Yb/Hf and Lu/Hf ratios in the solution analyses as compared to the laser ablation analyses. Other factors may also be present (e.g., deviation of the actual solution Yb and Lu isotopic compositions from the inferred compositions utilized in the calculations as described in the ‘data processing’ section).
Figure 4. (AC) Series of plots illustrating the effect of different Yb mass bias factor determination regimes on the final calculated 176Hf/177Hf ratios determined via LA-ICP-MS over the course of this study versus the average 173Yb voltage observed during each analysis. In (A), beta Yb is assumed to equal beta Hf. In (B), the Yb beta factor is independently calculated using the observed 173Yb/171Yb ratio. In (C), the session-specific Yb beta factor is empirically determined by iteratively finding the Yb = X beta Hf relationship which results in the lowest degree of deviation between the calculated versus true 176Hf/177Hf ratios as a function of the 173Yb signal. Symbols are as described in Figure 2.
Minerals 12 00882 g004
Figure 5. (A,B) Plots of the calculated Yb (A) and Hf (B) beta factors versus the 173Yb and 177Hf voltages (respectively) for the LA-ICP-MS analyses. Symbols are as described in Figure 2.
Minerals 12 00882 g005
Figure 6. Plot of the % 1 se internal for the 176Hf/177Hf ratios versus the average 177Hf voltage observed for the solution analyses conducted over the course of this study. Symbols are further explained in Table 2.
Minerals 12 00882 g006
Figure 7. Plot of the relationship between the 176Hf/177Hf ratios determined by solution ICP-MS (calculated using the empirical Yb mass bias factor) and the ‘true’ value of the JMC-475 Hf standard versus the average 177Hf intensity observed during each analysis. Symbols are as described in Figure 6.
Minerals 12 00882 g007
Figure 8. (A–C) Series of plots illustrating the effect of different Yb mass bias factor determination regimes on the final calculated 176Hf/177Hf ratios determined via solution ICP-MS over the course of this study versus the average 173Yb voltage observed during each analysis. In Figure 4A, beta Yb is assumed to equal beta Hf. In Figure 4B, the Yb beta factor is independently calculated using the observed 173Yb/171Yb ratio. In Figure 4C, the session-specific Yb beta factor is empirically determined by iteratively finding the Yb = X beta Hf relationship which results in the lowest degree of deviation between the calculated versus true 176Hf/177Hf ratios as a function of the 173Yb signal. Symbols are as described in Figure 6.
Minerals 12 00882 g008
Examination of the Yb and Hf beta factors during the laser ablation and solution analyses (Figure 5A,B and Figure 9A,B) reveals that once the average 173Yb signal exceeds ~0.03V, the Yb beta factor remains relatively stable within a given session (Figure 5A and Figure 9A). While the 177Hf signal always exceeds 0.25V across all of the analyses in this study, it is interesting that the analysis-specific Hf beta factors (Figure 5B and Figure 9B) do exhibit inconsistency within the various sessions. For example, during the solution analyses (Figure 9B) the Hf beta factors exhibit a marked trend toward lower values during one of the sessions whereas, for the other two sessions, the Hf mass bias factor remains consistent across the entire session. A similar observation can be made of the Hf beta factors associated with the laser ablation analyses (Figure 5B). Additionally, for the laser ablation analyses, we did not notice any systematic shifts in either the beta Yb or Hf mass bias factors as a function of pit depth for the various laser conditions. However, a general observation is that the Hf beta factors exhibit considerably less scatter than the Yb beta factors within a given analysis. This observation is consistent with the fact that, for most of the analyses, utilizing the internally calculated Yb beta factor produces an erroneous 176Hf/177Hf ratio.

4.3. Avenues for Future Study

The data collected in this study indicate that, broadly speaking, the Neoma™ performs similarly to the Neptune™ series MC-ICP-MS with regard to the Yb interference correction. Major observations are that at low Yb signal intensities, it is difficult to utilize the observed Yb isotopic composition to calculate accurate 176Hf/177Hf ratios. Assuming that the Yb and Hf beta factors are equal to one another results in a massive overcorrection of the 176Hf/177Hf ratios on the Neoma™ MC-ICP-MS, which is also widely observed in laser ablation datasets collected using the Neptune™ MC-ICP-MS. In contrast, the use of a session-specific empirical Yb beta factor appears to produce the most accurate 176Hf/177Hf ratios regardless of the Yb signal. While these observations indicate that the Neoma™ will be able to perform comparatively to the Neptune™ with regard to the Yb interference correction, there are still some questions that have arisen from the current dataset.
One question pertains to the stability of the Hf mass bias factor. We observed drift and inconsistency in the calculated Hf mass bias factor during one laser session and one solution session. Therefore, it will be important to investigate the effect of different analytical parameters on the mass bias behavior. These parameters could range from different cone combinations, gas flow rates for the sample introduction, plasma power settings, laser ablation parameters, etc. However, it is important to note that even with the evidence for some sporadic instability in the Hf mass bias factors, the final calculated 176Hf/177Hf (as well as other Hf isotope ratios) provide sufficient accuracy for geological applications—especially at higher signal intensities. Therefore, further investigation of the phenomena observed in this study will only strengthen what preliminarily appears to be a robust measurement capability. For example, oxide formation can impact the observed Yb and Hf isotope ratios during zircon analysis (e.g., [21]), so a study dedicated to understanding oxide formation in the plasma of the new instrument will be warranted.
It will also be necessary to develop best practices for data handling and reduction since the Neoma™ software (Qtegra™) has a built-in option for handling laser ablation data (the ‘transient signal’ function). While this software does contain the option to perform a Yb interference correction, it utilizes an observed Yb isotope ratio to calculate a Yb mass bias factor that is then carried through the calculations. While our data demonstrate that this approach can work for zircons with low Yb/Hf ratios, or in situations that have a sufficiently high Yb signal to accurately constrain the Yb mass bias behavior, for zircons with high Yb/Hf ratios, but low overall Yb signal intensity, a different approach is necessary. Therefore, future studies will also need to focus on understanding how the built-in data processing software associated with the new instrument can be utilized for the wide range of zircon Yb/Hf ratios observed in nature. Ideally, further study of these issues will allow for the application of this platform towards reducing laser ablation analytical volumes and/or combining the Hf isotope measurement with other analytes in the same measurement (e.g., [22]).

5. Conclusions

Analysis of zircon standards by laser ablation and Lu-Yb-Hf solutions on the newly released Neoma™ MC-ICP-MS suggests that this platform performs comparatively with the Neptune™ series MC-ICP-MS, which is currently the most commonly utilized instrument for these types of measurement. Major observations of the Neoma™ dataset are that:
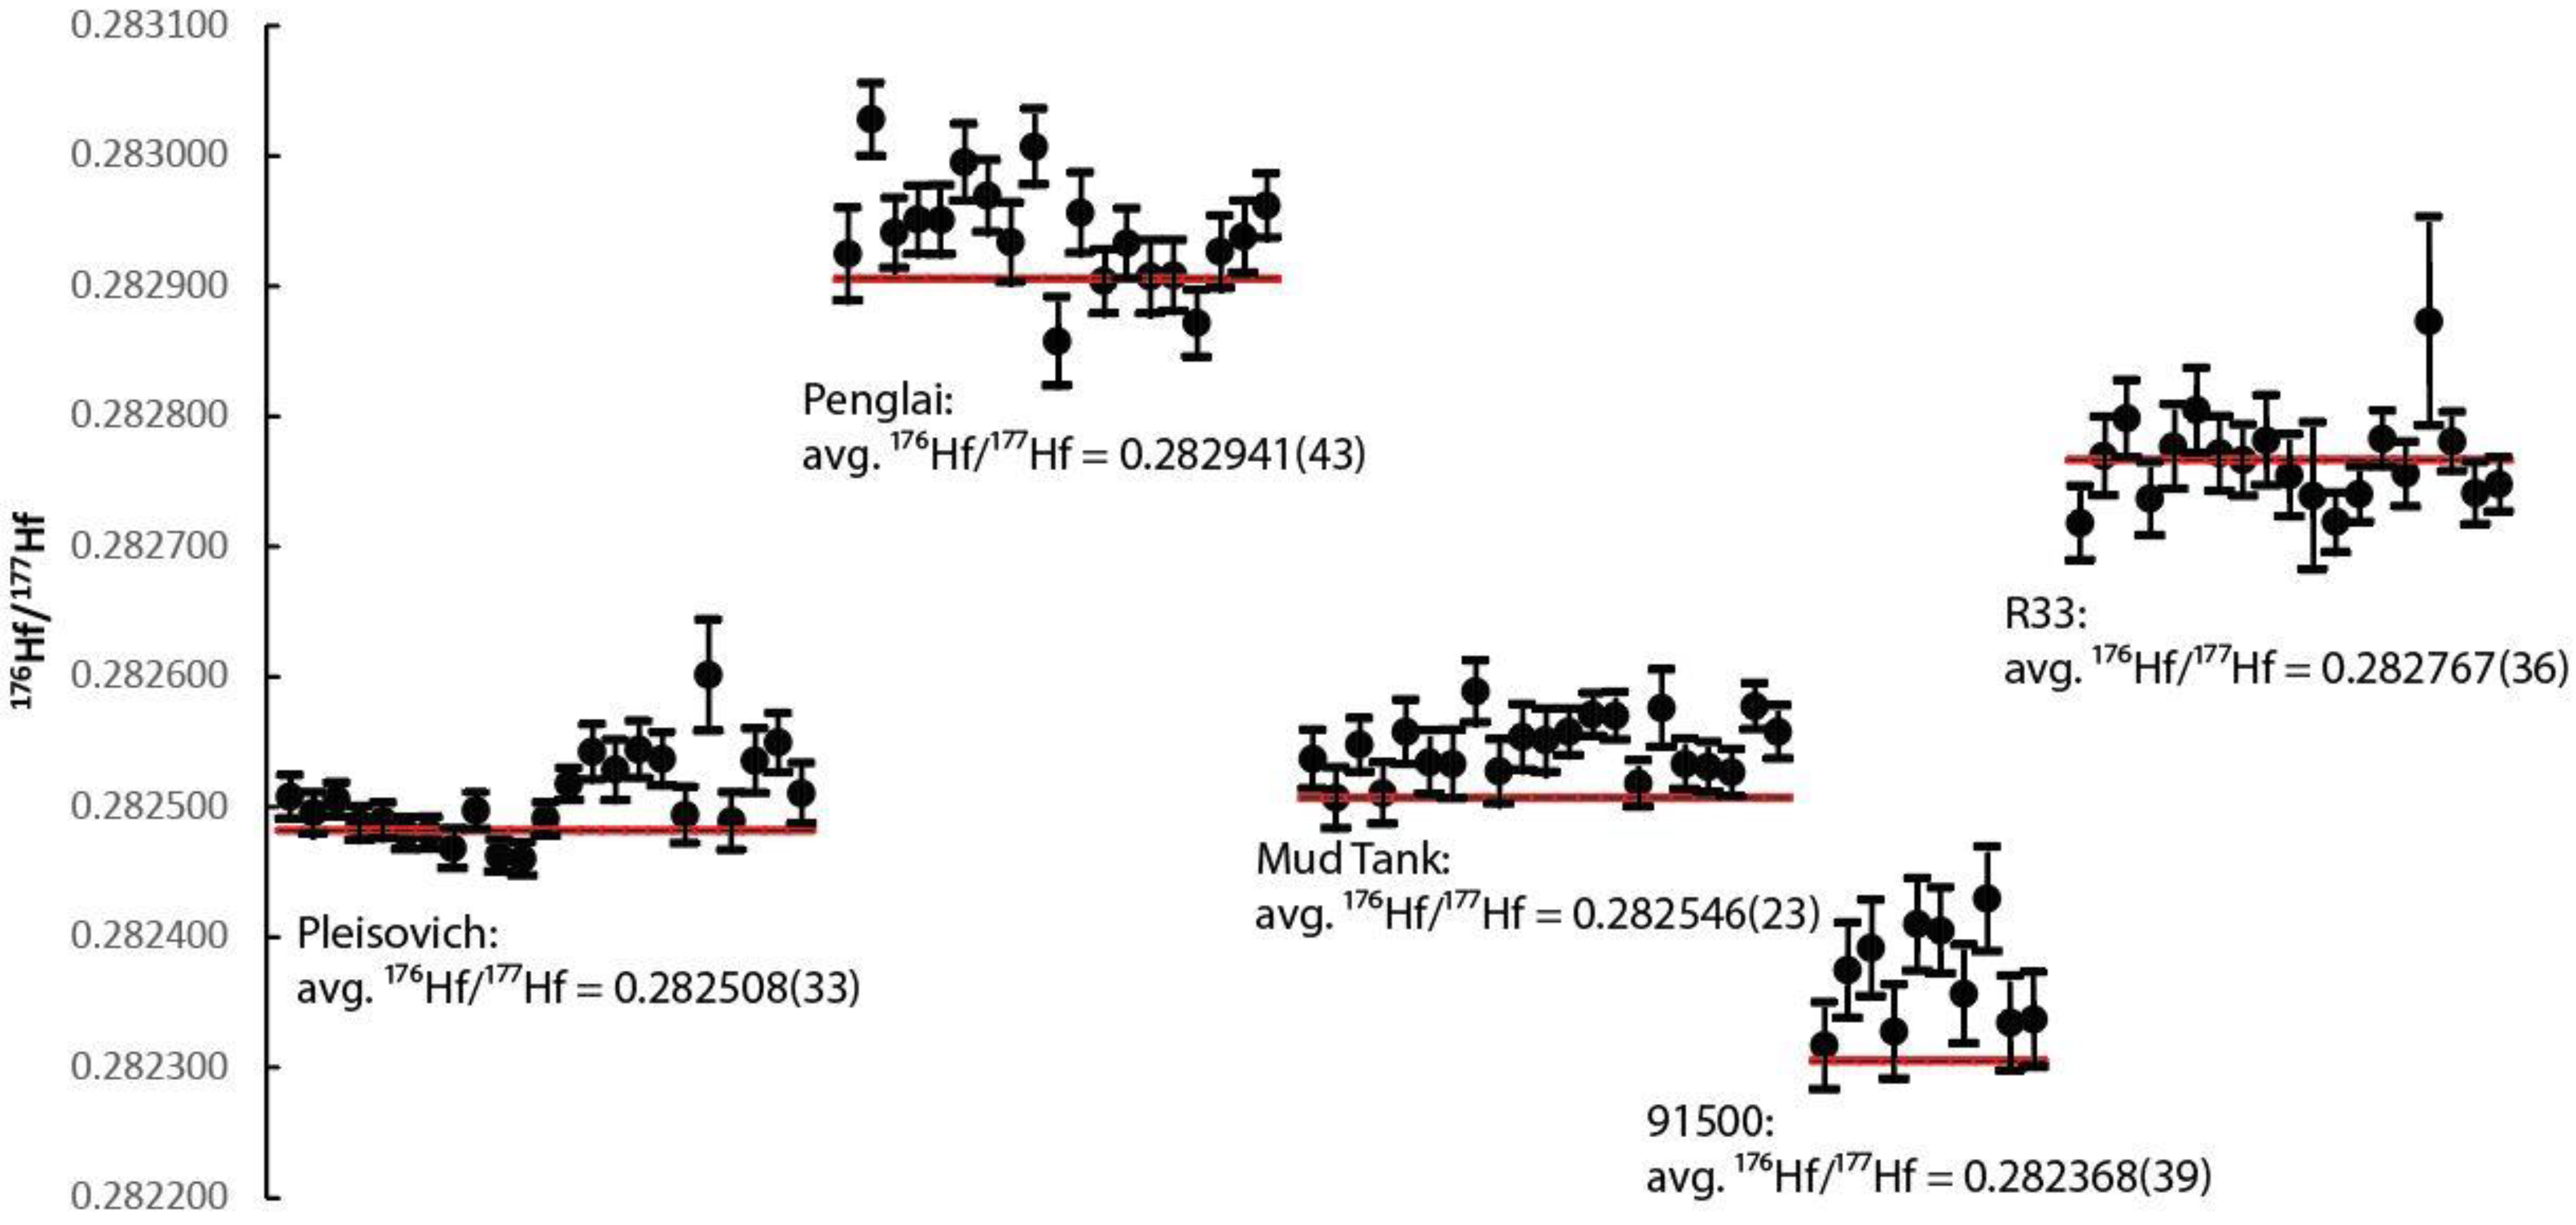
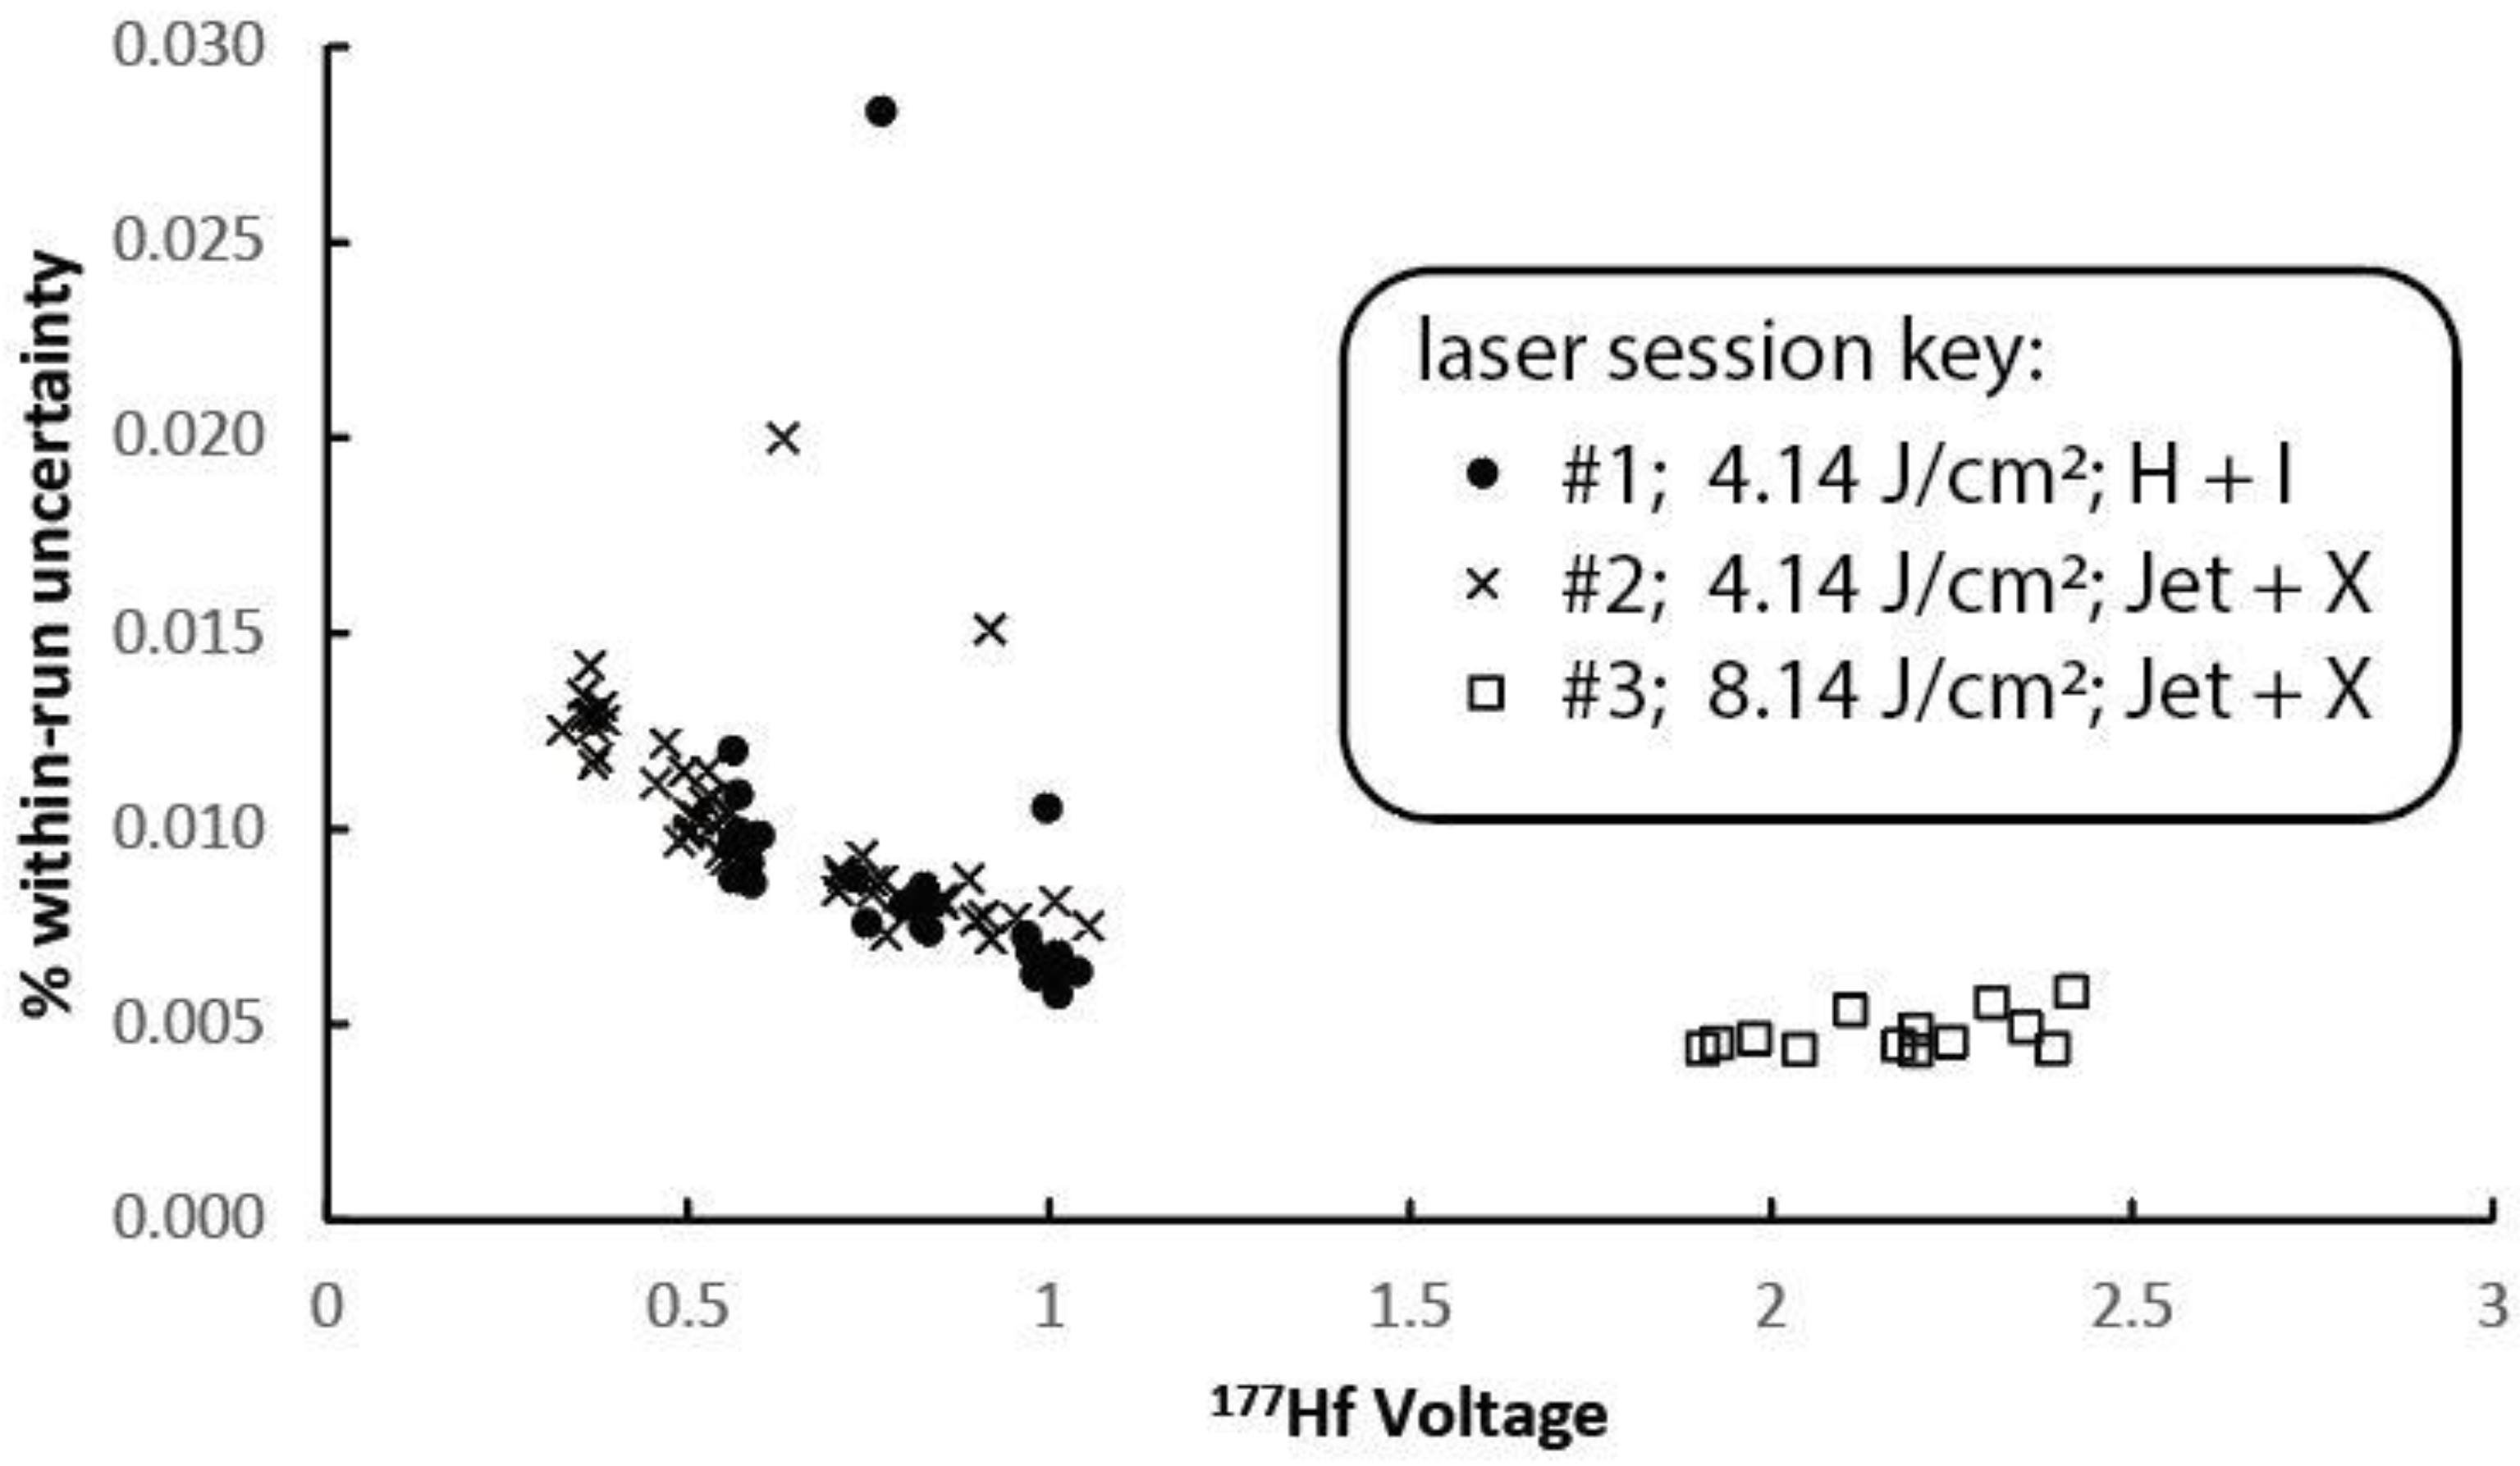
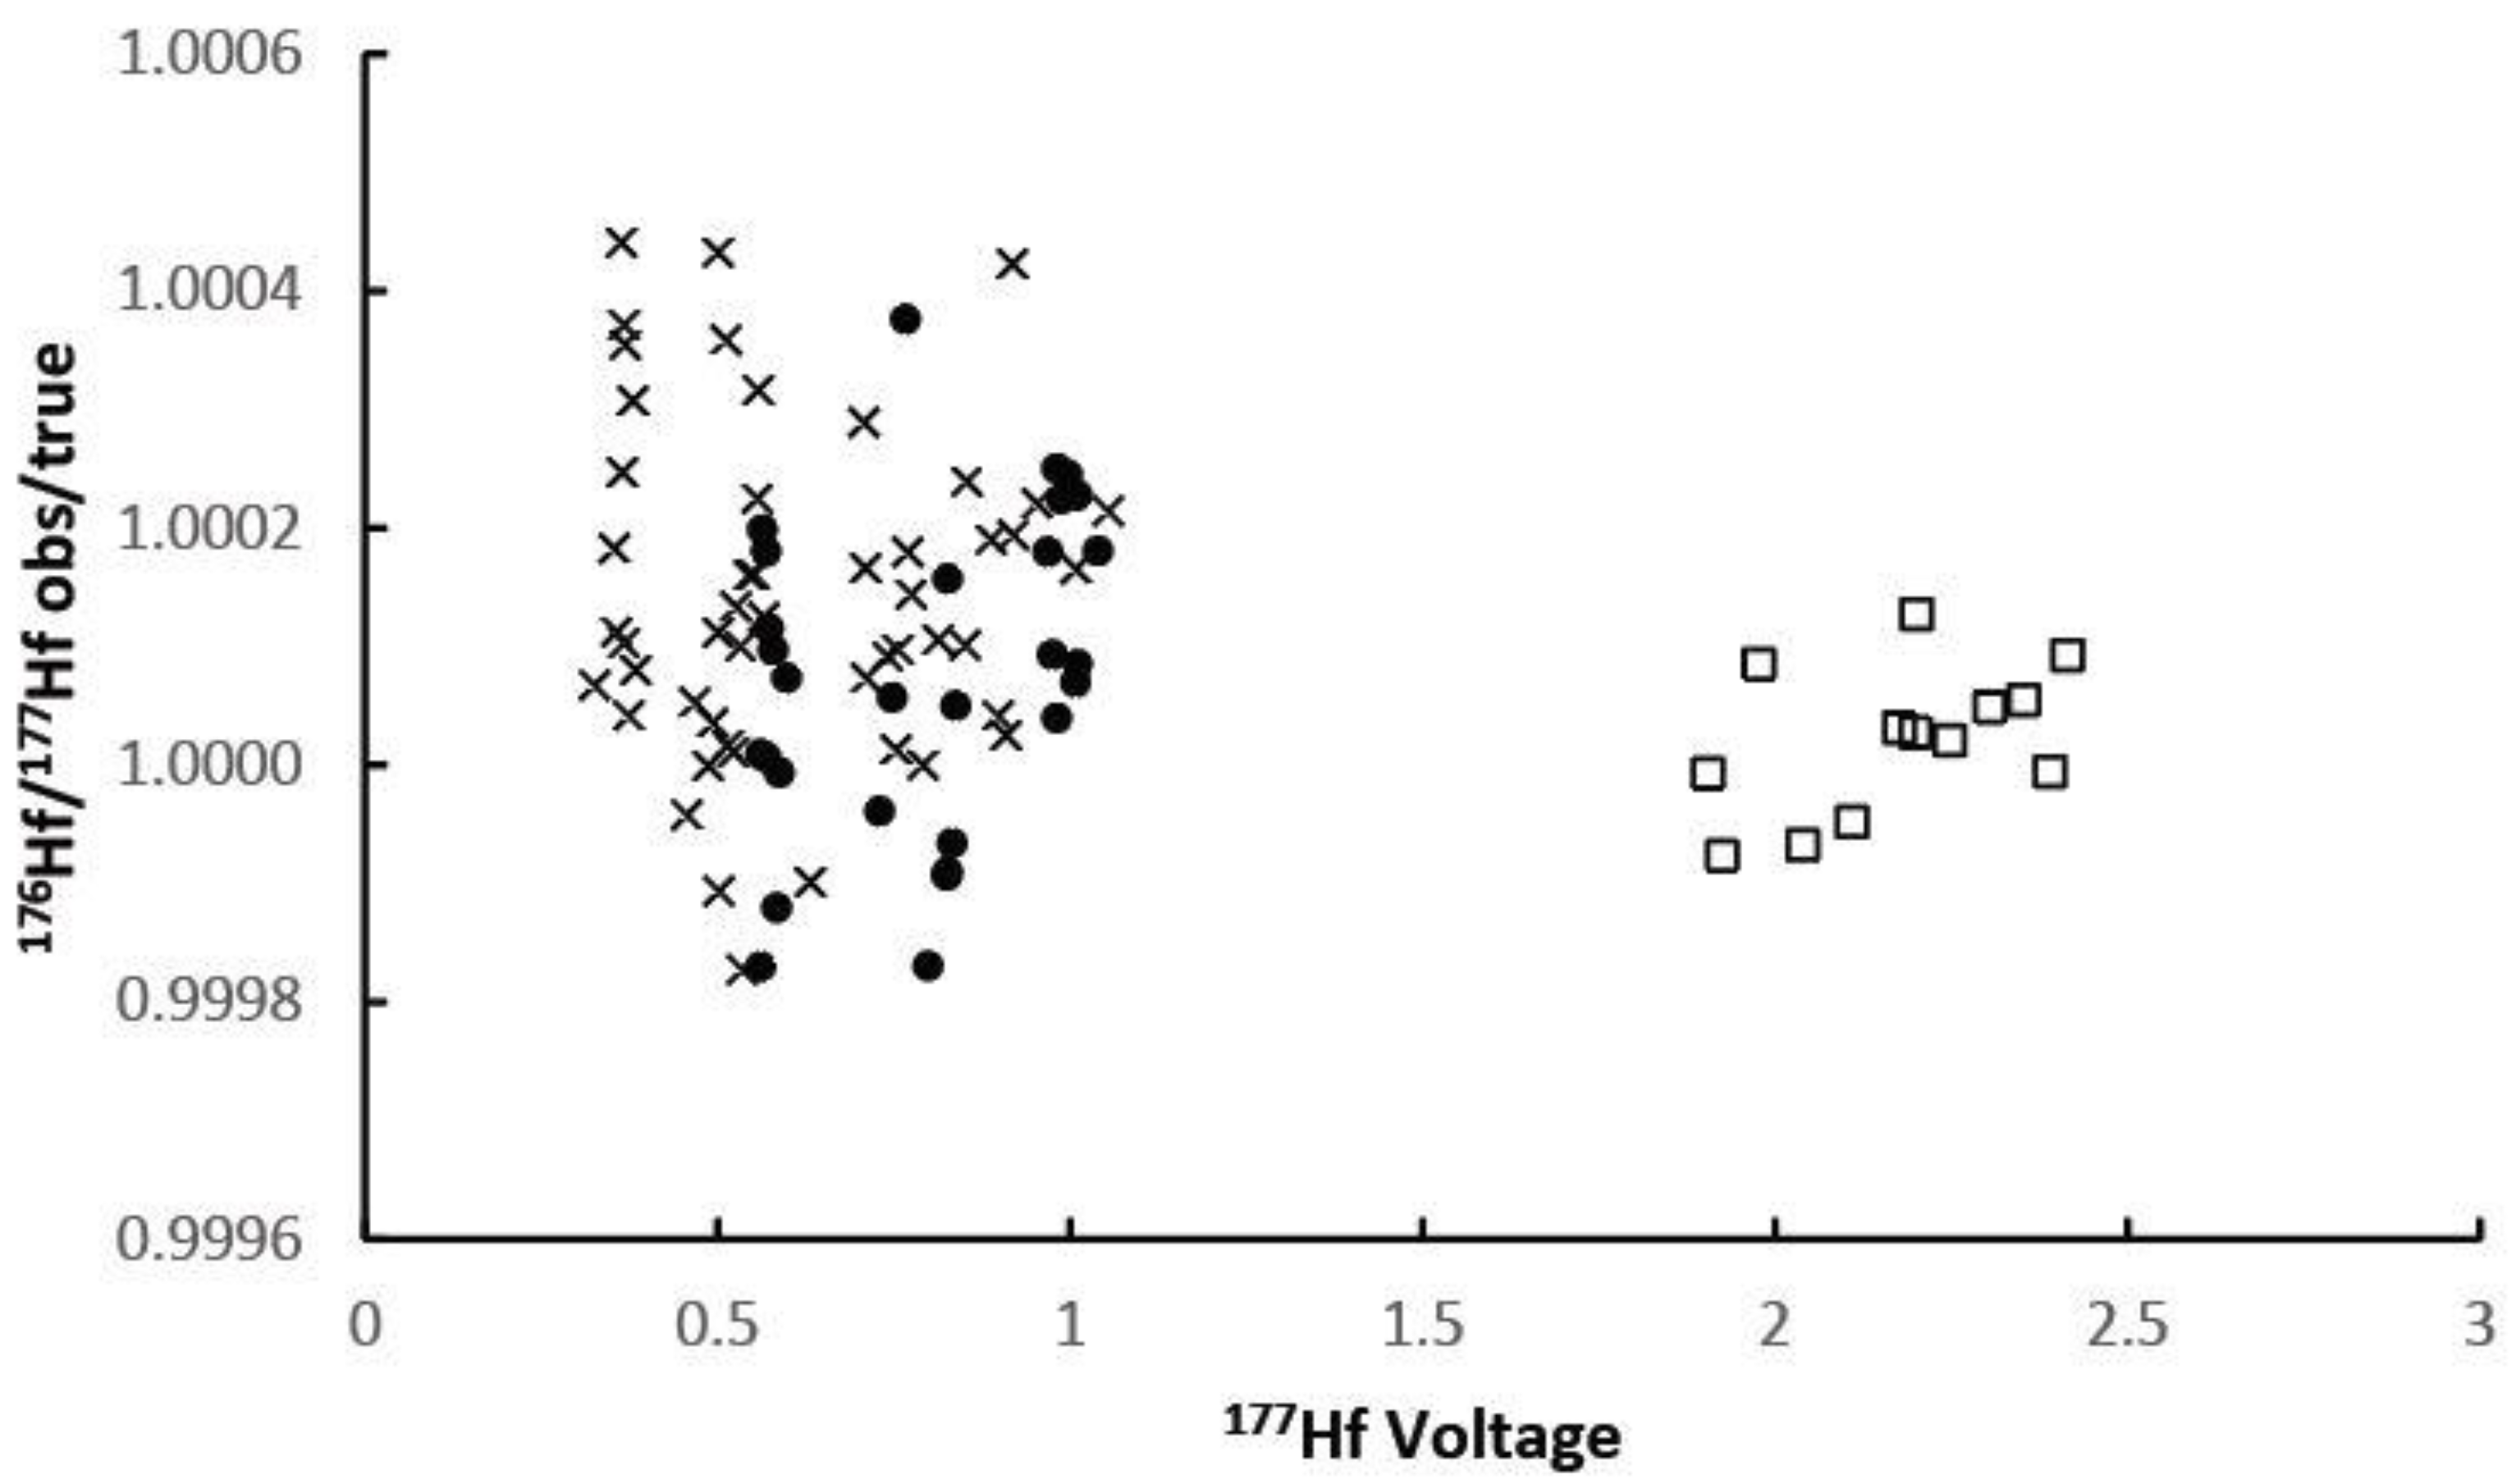
  • At Hf signals above a few volts during laser ablation, it is possible to obtain single analysis εHf values that are within 1 εHf unit of the accepted values for the standards with internal precision <1 εHf unit.
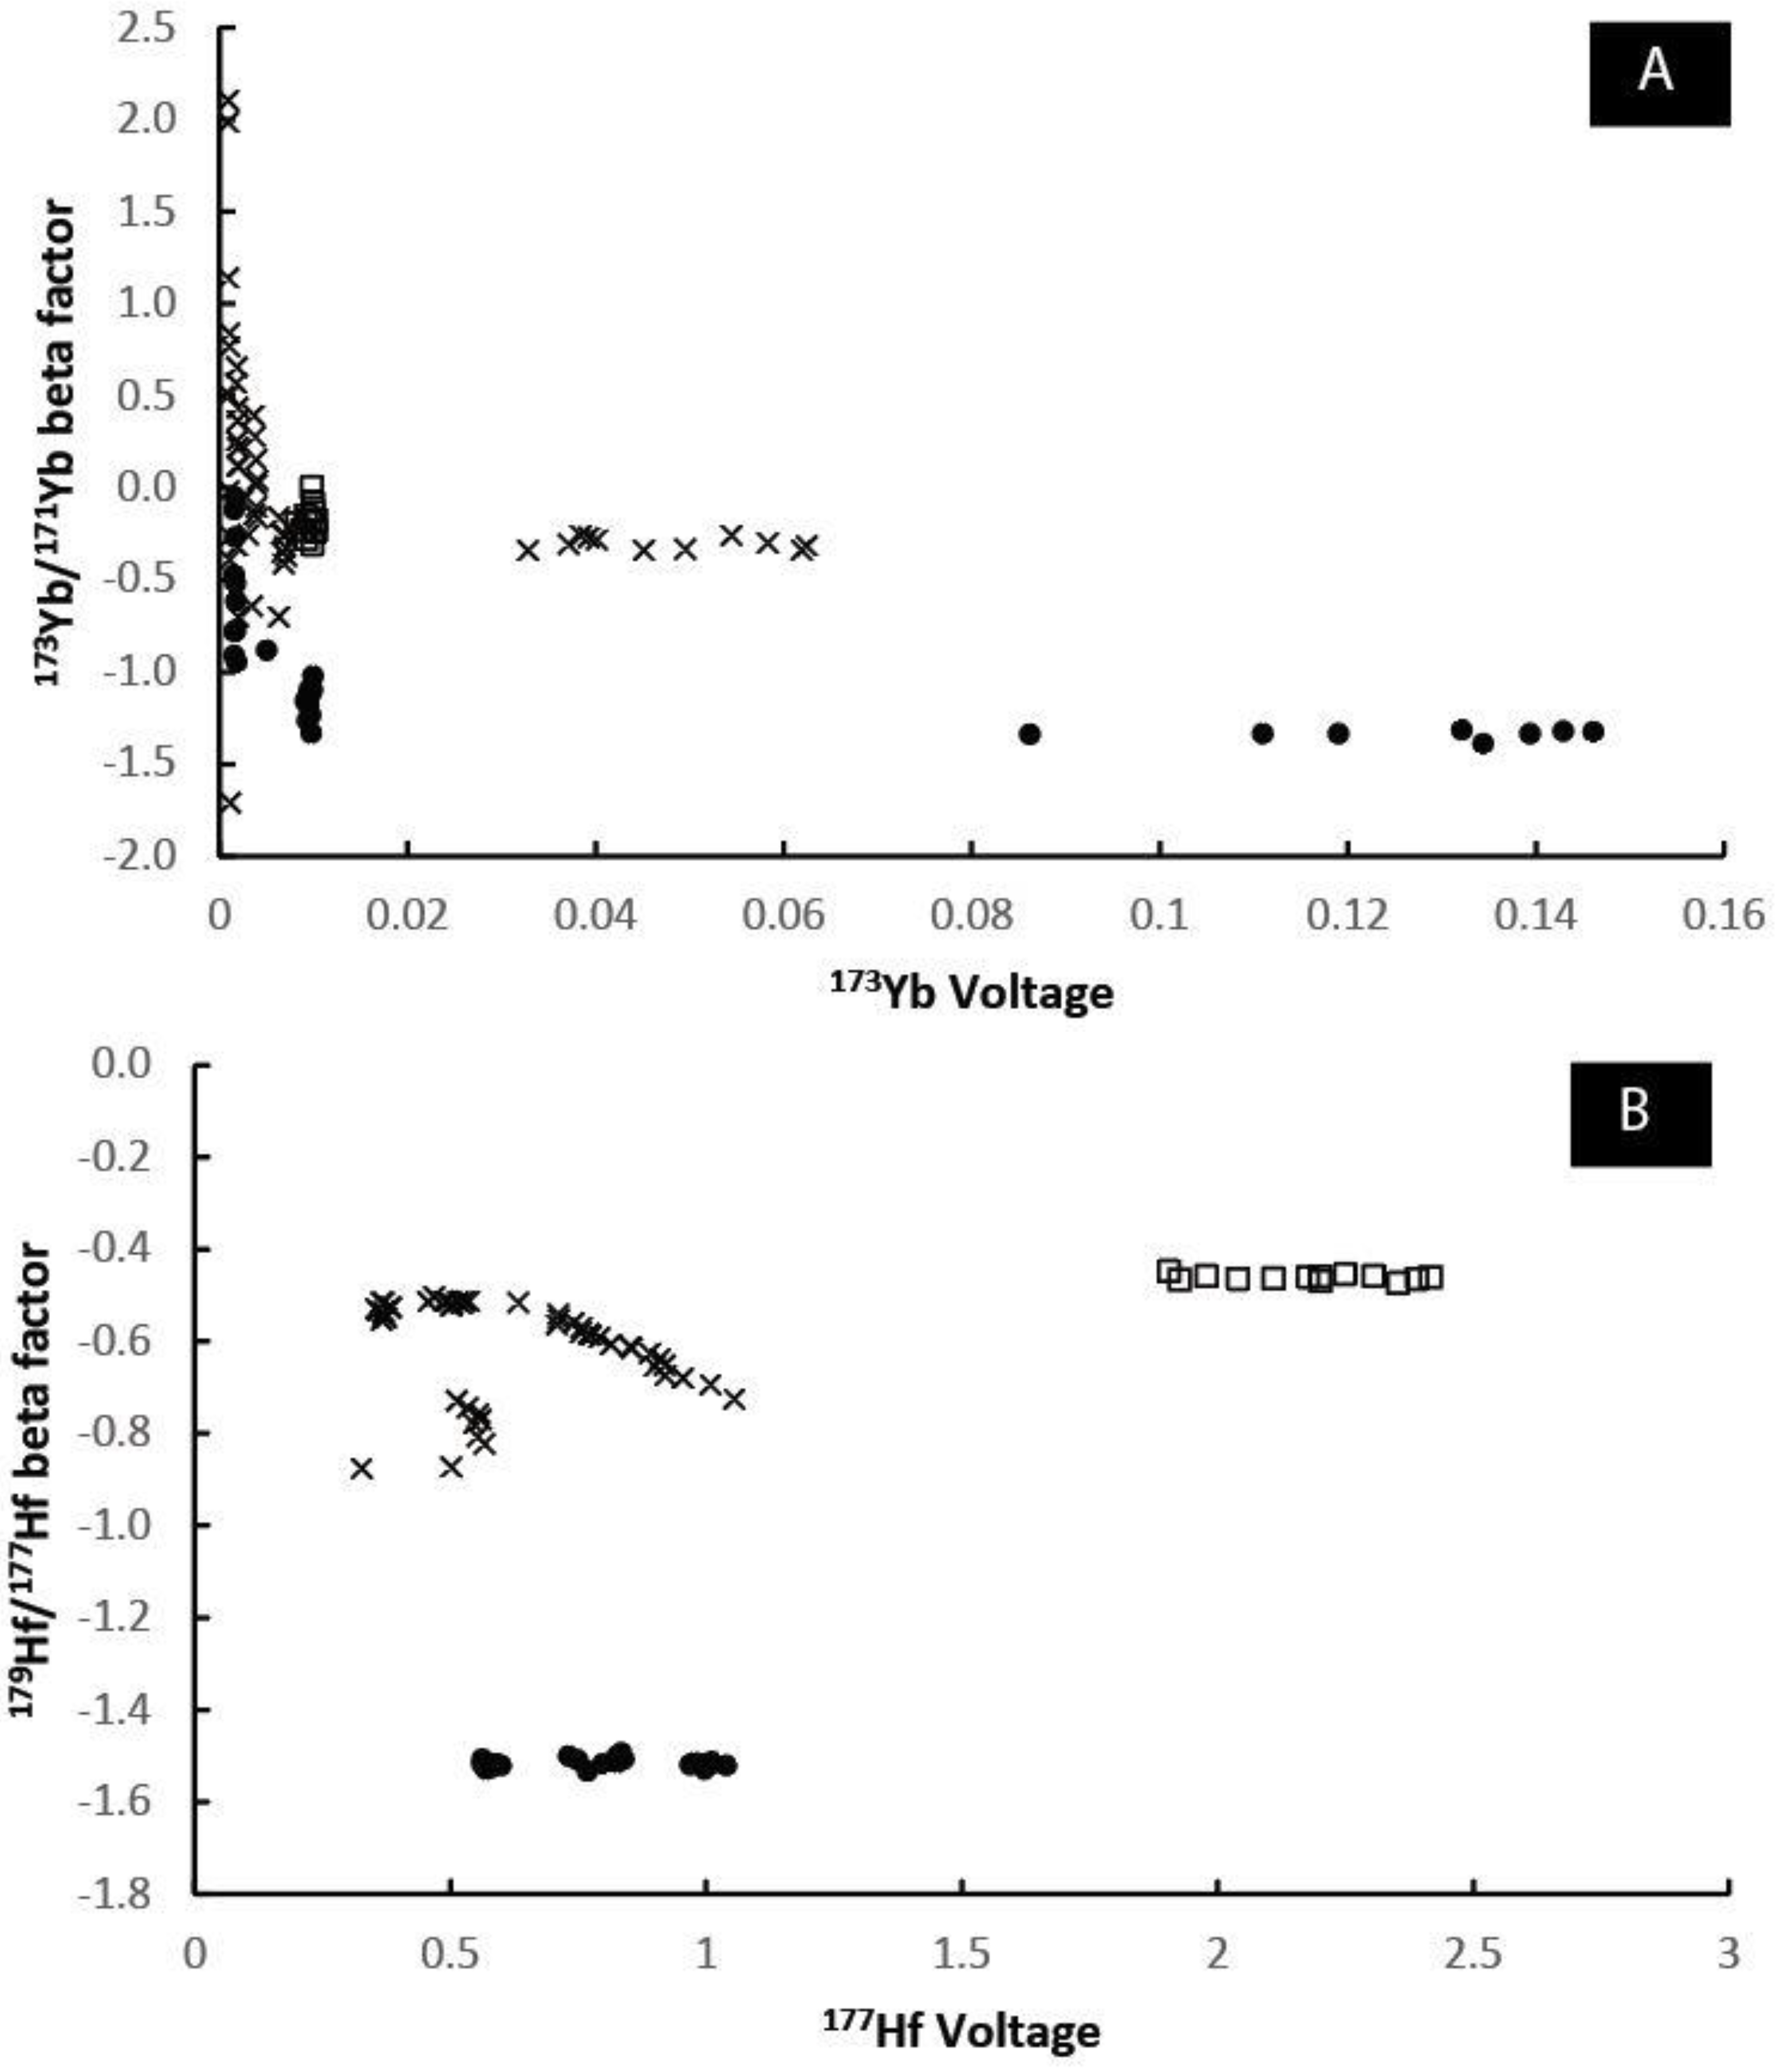
  • While a Yb mass bias factor is difficult to accurately constrain at Yb intensities <0.1 V, analysis of standards with varying Yb content allows for an empirical approach to constraining the Yb mass bias behavior that can then be utilized to ensure that the Yb interference correction is being applied correctly for zircons with higher Yb content.
  • Both the Yb and Hf mass bias behavior appear to vary from session to session, and more work is necessary to understand the cause and implications of this behavior. Specifically, oxide formation regimes need to be studied on this new platform as they relate to this particular application.
  • Additional studies will be needed to understand how the built-in data processing software for handling laser ablation data associated with the Neoma™ can be utilized to correctly perform the Yb interference correction for the wide range of Yb/Hf ratios seen in natural zircons.

Supplementary Materials

The following supporting information can be downloaded at: https://www.mdpi.com/article/10.3390/min12070882/s1.

Author Contributions

Conceptualization, N.A.Z.; methodology, N.A.Z., B.T.M., C.R.H. and D.R.D.; investigation, N.A.Z., B.T.M., C.R.H. and D.R.D.; resources, C.R.H.; data curation, N.A.Z.; writing—original draft preparation, N.A.Z.; writing—review and editing, N.A.Z., B.T.M., C.R.H. and D.R.D.; supervision, C.R.H.; project administration, C.R.H.; funding acquisition, C.R.H. All authors have read and agreed to the published version of the manuscript.

Funding

This manuscript has been authored in part by UT-Battelle, LLC, under contract DE-AC05-00OR22725 with the US Department of Energy (DOE). The US government retains and the publisher, by accepting the article for publication, acknowledges that the US government retains a nonexclusive, paid-up, irrevocable, worldwide license to publish or reproduce the published form of this manuscript, or allow others to do so, for US government purposes. DOE will provide public access to these results of federally sponsored research in accordance with the DOE Public Access Plan (http://energy.gov/downloads/doe-public-access-plan, accessed on 20 June 2022).

Data Availability Statement

All data supporting the findings in this article can be found in the associated electronic appendix.

Conflicts of Interest

The authors declare no conflict of interest.

References

  1. ThermoFisher Scientific. Illuminating the Edge of Discover: Neoma Multicollector ICP-MS. Produce Brochure. 2021. Available online: https://www.thermofisher.com/document-connect/document-connect.html?url=https%3A%2F%2Fassets.thermofisher.com%2FTFS-Assets%2FCMD%2Fbrochures%2Fbr-30600-neoma-mc-icp-ms-br30600-en.pdf (accessed on 21 December 2021).
  2. Balaram, V.; Rahaman, W.; Roy, P. Recent advances in MC-ICP-MS applications in Earth and Environmental Sciences. Geosystems Geoenvironment 2022, 1, 100019. [Google Scholar] [CrossRef]
  3. Spencer, C.J.; Kirkland, C.L.; Roberts, N.M.W.; Evans, N.J.; Liebmann, J. Strategies towards robust interpretations of in situ zircon Lu-Hf isotope analyses. Geosci. Front. 2020, 11, 843–853. [Google Scholar] [CrossRef]
  4. Vervoort, J. Lu-Hf Dating: The Lu-Hf Isotope System. In Encyclopedia of Scientific Dating Methods; Rink, W., Thompson, J., Eds.; Springer: Dordrecht, The Netherlands, 2014. [Google Scholar] [CrossRef]
  5. Bouvier, A.; Vervoort, J.D.; Patchett, P.J. The Lu-Hf and Sm-Nd isotopic composition of CHUR: Constraints from unequilibrated chondrites and implications for the bulk composition of terrestrial planets. Earth Planet. Sci. Lett. 2008, 273, 48–57. [Google Scholar] [CrossRef]
  6. Faure, G.; Mensing, T. The Lu-Hf Method. In Isotopes: Principles and Applications, 3rd ed.; John Wiley and Sons, INC.: Hoboken, NJ, USA, 2005; Chapter 12; pp. 284–296. [Google Scholar]
  7. Payne, J.L.; Mclnerney, D.J.; Barovich, K.M.; Kirkland, C.L.; Pearson, N.J.; Hand, M. Strengths and limitations of zircon Lu-Hf and O isotopes in modelling crustal growth. Lithos 2016, 248–251, 175–192. [Google Scholar] [CrossRef]
  8. Blichert-Toft, J. The Hf isotopic composition of zircon reference material 91500. Chem. Geol. 2008, 253, 252–257. [Google Scholar] [CrossRef]
  9. Zirakparvar, N.A.; Mathez, E.A.; Scoates, J.S.; Wall, C.J. Zircon Hf isotope evidence for an enriched mantle source for the Bushveld Igneous Complex. Contrib. Mineral. Petrol. 2014, 168, 1050. [Google Scholar] [CrossRef]
  10. Gu, H.O.; Sun, H.; Wang, F.; Ge, C.; Zhou, T. A new practical isobaric interference correction model for the in situ Hf isotopic analysis using laser ablation multi-collector-ICP-mass spectrometry of zircons with high Yb/Hf ratios. J. Anal. At. Spectrom. 2019, 34, 1223–1232. [Google Scholar] [CrossRef]
  11. Hu, Z.; Liu, Y.; Gao, S.; Liu, W.; Zhang, W.; Tong, X.; Lin, L.; Zong, K.; Li, M.; Chen, H.; et al. Improved in situ Hf isotope ratio analysis of zircons using newly designed X skimmer cone and jet sample cone in combination with the addition of nitrogen by laser ablation multi collector ICP-MS. J. Anal. At. Spectrom. 2012, 27, 1391–1399. [Google Scholar] [CrossRef]
  12. Fisher, C.M.; Vervoort, J.D.; Hanchar, J.M. Guidelines for reporting zircon Hf isotopic data by LA-MC-ICPMS and potential pitfalls in the interpretation of these data. Chem. Geol. 2014, 363, 125–133. [Google Scholar] [CrossRef]
  13. Craig, G.; Roberts, J.; Bouman, C.; Lloyd, N.; Schwieters, J.B. High Precision 176Hf/177Hf Measurements in Zircons by LA-MC-ICP-MS; Application Note 000091; ThermoScientific: Waltham, MA, USA, 2022; Available online: https://assets.thermofisher.com/TFS-Assets/CMD/Application-Notes/an-000091-neoma-hf-an000091-en.pdf (accessed on 21 December 2021).
  14. Slama, J.; Kosler, J.; Condon, D.J.; Crowley, J.L.; Gerdes, A.; Hanchar, J.M.; Hortwood, M.S.A.; Morris, G.A.; Nasdala, L.; Norberg, N.; et al. Plesovice zircon—A new natural reference material for U-Pb and Hf isotopic microanalysis. Chem. Geol. 2008, 249, 1–35. [Google Scholar] [CrossRef]
  15. Li, H.; Long, W.G.; Li, Q.L.; Liu, Y.; Zheng, Y.F.; Yang, Y.H.; Chamberlain, K.R.; Wan, D.F.; Guo, C.H.; Wang, X.C.; et al. Penglai zircon megacrysts: A potential new reference matiral for microbeam determination of Hf–O Isotopes and U–Pb Age. Geostand. Geoanalytical Res. 2010, 34, 117–134. [Google Scholar] [CrossRef]
  16. Goolaerts, A.; Mattielli, N.; de Jong, J.; Weis, D.; Scoates, J.S. Hf and Lu isotopic reference values for the zircon standard 91500 by MC-ICP-MS. Chem. Geol. 2004, 206, 1–9. [Google Scholar] [CrossRef]
  17. Blichert-Toft, J.; Chauvel, C.; Albarède, F. Separation of Hf and Lu for high precision isotope analysis of rock samples by magnetic sector—Multiple collector ICP-MS. Contrib. Mineral. Petrol. 1997, 127, 248–260. [Google Scholar] [CrossRef]
  18. Vervoort, J.; Blichert-Toft, J. Evolution of the depleted mantle: Hafnium isotope evidence from juvenile rocks through time. Geochim. Et Cosmochim. Acta 1999, 63, 533–556. [Google Scholar] [CrossRef]
  19. Patchett, P.J.; Tatsumoto, M. Lu/Hf in chondrites and definition of a chondritic hafnium growth curve. Lunar Planet. Sci. 1981, 12, 822–824. [Google Scholar]
  20. Baum, E.M.; Knox, H.D.; Miller, T.R. (Eds.) Nuclides and Isotopes, 16th ed.; Knolls Atomic Power Laboratory, Lockheed Martin: New York, NY, USA, 2002; p. 88. [Google Scholar]
  21. Payne, J.L.; Pearson, N.J.; Grant, K.J.; Halverson, G.P. Reassessement of relative oxide formation rates and molecular interferences on in situ lutetium-hafnium analysis with laser ablation MC-ICP-MS. J. Anal. At. Spectrom. 2013, 28, 1068–1079. [Google Scholar] [CrossRef]
  22. Bauer, A.M.; Horstwood, M.S.A. Small-volume Lu-Hf and U-Pb isotope determination of complex zircons by solution and laser ablation MC-ICP-MS. Chem. Geol. 2018, 476, 85–99. [Google Scholar] [CrossRef] [Green Version]
Figure 1. Summary of 176Hf/177Hf ratios (± each analysis with 1 σ within-run standard error), calculated using the session-specific empirically determined Yb beta factor, observed for the various zircon standards analyzed by LA-ICP-MS over the course of this study. The average 176Hf/177Hf values for each standard are reported with their 1σ standard deviations. The red lines correspond to the following values for the standards: Plesovich (accepted 176Hf/177Hf = 0.282482; [14]), Penglai (accepted 176Hf/177Hf = 0.282906; Li et al., 2010), Mud Tank (176Hf/177Hf = 0.282507), 91500 (176Hf/177Hf = 0.282305), and R33 (176Hf/177Hf = 0.282767). Refer to summary Table 1 in [12]) for sources of the accepted values of Mud Tank, 91,500, and R33.
Minerals 12 00882 g001
Figure 2. Plot of the % 1 se internal for the 176Hf/177Hf ratios versus the average 177Hf voltage observed during each LA-ICP-MS analysis over the course of this study. Note that the grouping at lower 177Hf voltage is associated with analyses conducted using a laser power of ~4.14 J/cm2 whereas the grouping at higher 177Hf intensity were collected using a higher power (~8.41 J/cm2). Symbols are further explained in Table 2.
Minerals 12 00882 g002
Figure 3. Plot of the relationship between the 176Hf/177Hf ratios determined by LA-ICP-MS (calculated using the empirical Yb mass bias factor) and the ‘true’ value of the zircon standards versus the average 177Hf intensity observed during each analysis. Symbols are as described in Figure 2.
Minerals 12 00882 g003
Figure 9. (A,B) Plots of the calculated Yb (A) and Hf (B) beta factors versus the 173Yb and 177Hf voltages (respectively) for the solution ICP-MS analyses. Symbols are as described in Figure 6.
Minerals 12 00882 g009aMinerals 12 00882 g009b
Table 1. Summary of the two different cup configurations utilized during this study.
ConfigL3L2L1CH1H2H3H4H5
A171Yb173Yb174Yb175Lu176Lu + Hf + Yb177Hf178Hf179Hf
B171Yb173Yb174Yb175Lu176Lu + Hf + Yb177Hf178Hf179Hf180Hf
Table 2. Summary of analytical parameters during the various data collection sessions performed during this study. Note that the symbols referenced in the final column of the table correspond to the symbols utilized in the figures. ‘Int.’ refers to integration time and is reported in seconds (s). Symbols are further explained in the figure captions.
Laser:Laser PowerConesConfig:Int (s)Cycle/AnalysisSymbol
Session 14.14 J/cm2H + IA0.1~250
session 24.14 J/cm2Jet + XA0.1~250x
session 38.14 J/cm2Jet + XB0.1~250
Solution:NebulizerConesConfig:Int. (s)Cycle/analysis
session 150 µL/minH + IA8s20
session 250 µL/minJet + XA8s20x
session 350 µL/minJet + XB8s20
Publisher’s Note: MDPI stays neutral with regard to jurisdictional claims in published maps and institutional affiliations.

