Article

Multivariate Analysis Based on Geochemical, Isotopic, and Mineralogical Compositions of Uranium-Rich Samples

1
Department of Civil and Environmental Engineering and Earth Sciences, University of Notre Dame, Notre Dame, IN 46556, USA
2
Oak Ridge National Laboratory, 1 Bethel Valley Rd, Oak Ridge, TN 37830, USA
3
Department of Chemistry and Biochemistry, University of Notre Dame, Notre Dame, IN 46556, USA
*
Author to whom correspondence should be addressed.
Minerals 2019, 9(9), 537; https://doi.org/10.3390/min9090537
Submission received: 5 August 2019 / Revised: 30 August 2019 / Accepted: 3 September 2019 / Published: 5 September 2019
(This article belongs to the Special Issue Nuclear Forensic Applications in Geoscience and Radiochemistry)

Abstract

:
The chemical and isotopic (U, Pb, Sr) signatures for a suite (n = 23) of pristine (>80 wt. % UO2) and altered uraninite samples (>70–80 wt. % UO2) from various locations worldwide have been determined for the purpose of identifying potential fingerprints for nuclear forensic analysis. The characterization of the uraninite samples included determination of major, minor and trace element contents, Sr, Pb, and U isotopic compositions, and secondary mineral assemblages. Due to the multivariate approach adopted in this study, principal component analysis (PCA) has been employed to allow the direct comparison of multiple variable types. The PCA results indicate that the geological origin (sandstone, metamorphite, intrusive, granite and unconformity) of pristine uraninite can be readily identified utilizing various combinations of major and/or trace element concentrations with isotopic compositions.

1. Introduction

Over the past few decades, there has been increased interest in developing novel methods/approaches for the forensic analysis of nuclear materials. This has been primarily motivated by the need to have fast and efficient methods of identifying the origin of any intercepted illicit nuclear materials (e.g., stolen or illegally mined material, uranium ore concentrates, fuel pellets, etc.). Since 1993, the International Atomic Energy Agency (IAEA) has reported 3497 incidents of nuclear and/or radioactive materials outside of regulatory control with 285 confirmed as “acts of trafficking or malicious use” [1]. The predominant source of nuclear fuel worldwide is uranium ore deposits, and therefore, these have been the subject of a growing number of mineralogical, chemical, and isotopic investigations [2,3,4,5,6,7,8,9,10,11,12]. These previous studies have determined and established various geochemical signatures as fingerprints for uranium ore deposits, which can then be used as a means of deciphering the origins of any unknown intercepted nuclear materials.
Uranium ore deposits are found globally with >800 locations identified [13]. These ore deposits are found in a wide variety of geological settings and span Earth’s history from the Archean/early Proterozoic to recent times [5,12,13]. For the purpose of this study, we have adopted the IAEA [13] classification, which is based on the geological setting of the uranium deposit and takes into account either the host rock (e.g., intrusive type) or geological structure (e.g., Paleozoic unconformity). Fifteen distinct deposit types are described with each deposit type containing numerous subtypes [13]. As uranium ore deposits form under a large range of conditions including temperature and source (elemental availability), variations in their major and trace element compositions and isotopic signatures are expected. This has been the main premise of many of the previous studies listed above. Combinations of these various signatures can indicate the deposit type of the unknown nuclear material, which in turn will limit the possibilities of geographic origin. For example, an elevated temperature of formation (>350 °C) allows for cations other than U4+ to substitute more readily into the crystal structure of uraninite, U4+1−x−y−z−uU6+xREE3+yM2+z4−u)O2+x−0.5y−z−2u the primary mineral of uranium ore (REE= rare earth elements, M2+ represents divalent metals and □ indicates a vacant site; [14,15,16]). Thus, uraninite formed at higher temperatures typically contains higher abundances of Th4+, REEs3+, and Y3+ [2,7,11,12,17]. To date, chondrite-normalized REE (CN-REE) patterns have proven to be the most effective forensic tool in terms of distinguishing between uraninite samples formed under different geologic conditions (e.g., [7,11,12]). Moreover, the concentration of Pb is linked to the age of the uraninite deposit as a result of the decay of 235U and 238U over geological time to 207Pb and 206Pb, respectively [15]. In addition to the elements that are preferentially incorporated due to geological setting or time of formation, the geochemical signature of uraninite samples will change due to the degree of alteration experienced by the uraninite. For example, due to auto-oxidation and decay damage, various elements will be lost and substituted with other elements depending on the degree of availability of the elements in the alteration fluid (e.g., Ca, Fe, and Si; [18]).
In this study, the geochemical and isotopic (U, Pb, Sr) compositions of a global suite of uraninite from various deposit types have been characterized in detail. Individual uraninite samples consist of different regions/segments that have undergone various degrees of alteration. Therefore, we assign the term pristine to uraninites that contain >80 wt. % UO2, and altered to samples that contains 70–80 wt. % UO2. All regions of the uraninite that contain <70 wt. % are considered to represent secondary uranium minerals and are beyond the scope of this study. Initially, the major and trace element contents that have been used previously to identify various deposit types are examined. However, to date, no single geochemical signature has been able to successfully distinguish between all the different ore deposit types. Therefore, an additional multivariate statistical approach, namely principal component analysis (PCA), was used based on the geochemical data to help discern further information, and evaluate its application as a tool for nuclear forensic analysis. PCA is a commonly-used statistical procedure for multivariate datasets that allows for the reduction of dimensionality, but maintains the most information possible, e.g., removal of variables to reveal any systematic hidden trends/patterns within the dataset [19,20]. To our knowledge, PCA has been adopted previously for forensic analysis of nuclear materials [9,10], however, this study is the first to combine chemical signatures with isotope and mineralogical data.

2. Materials and Methods

2.1. Deposit Type and Sample Descriptions

A total of 23 uraninite samples (Table 1) representing five of the IAEA uranium deposit types are investigated here: intrusive non-granite-related (type 1), intrusive granite-related (type 2), metamorphite (type 6), Proterozoic unconformity (type 7), and sandstone (type 9). A brief description of each uranium deposit type is provided below in addition to the geological setting for each uraninite investigated here.
Intrusive non-granite-related deposits are classified according to the host rock of the deposit, which can include a wide range of whole rock compositions, e.g., pegmatite to carbonatite. Intrusive non-granite-related deposit types can be related to either anatectic or plutonic activity [13]. Six intrusive type samples were investigated in this study (Table 1): Yancey (#333), Mitchell 1 (#334), Mitchell 2 (#338), Bancroft (#340), Ruggles (#344), and Foster Lake (#348). Yancey, Mitchell 1, and Mitchell 2 uraninite (North Carolina, USA) are hosted in Paleozoic pegmatite from the Spruce Pine pegmatite, which crosscuts Precambrian interlayered mica and amphibole gneiss and schist [21]. The Bancroft sample (Bancroft region, Ontario, Canada) is hosted within the Central Metasedimentary Belt of the Proterozoic Grenville Province, which was intruded by a number of plutonic suites. The uranium mineralization is associated with fenite-carbonatite and granite pegmatite post-tectonic plutonic events [22]. The Ruggles sample (New Hampshire, USA) is a pegmatite hosted uraninite found in the Devonian-aged Littleton Formation, which is related to the closing of the Proto-Atlantic Ocean [2,23]. The Foster Lake uraninite (Saskatchewan, Canada) is hosted within narrow belts of biotite schist along the margins of granitic pegmatites at fault intersections of the Wollaston Group and Archean basement contacts [24,25,26].
Granite-related uranium deposits are associated with granite intrusions and may consist of uranium ore veins, either endogranitic or perigranitic, or disseminated mineralization within granitic bodies. The Jachymov (#564) uraninite sample is an intrusive granite-related uranium ore from the Czech Republic. It is associated with the Erzgebirge granites that formed during the collisional stage of the Variscan Orogeny along the NW trending Gera-Jachymov Fault Zone present within the central Bohemain Massif [13]. Metamorphite uranium deposits form deposit types similar to granite-related deposits, e.g., veins and disseminated mineralization; however, metamorphite deposits are associated with regional metamorphism of uraniferous sediments rather than a granite intrusion. Six of the samples investigated here have been grouped as metamorphite uranium deposits: Great Bear 1 (#423), Great Bear 2 (#626), Shinkolobwe 1 (#437), Shinkolobwe 2 (#662), Australia 1 (#516), and Billiken (#522). The Great Bear samples (Great Bear Lake region, Northwest Territories, Canada) are found within quartz and carbonate gangue in pumice-dominated pyroclastic flows of late Aphebian age. The remobilization of uranium has been linked to diabase intrusions in the Echo Bay region [27,28,29]. The Shinkolobwe uraninite (Democratic Republic of Congo) is located within fractures of siliceous dolomite and dolomitic shale of the lower Roan Group of the Neoproterozoic Katanga Supergroup that unconformably overlies basement [7]. The Billiken uraninite (Colorado, USA) consists of uranium ore veins hosted in Neoproterozoic metasediments [2,30]. Three samples from Marshall Pass (#531, 623, 809), Colorado, USA, have been further classified as metamorphite hydrothermal veins [23]. The uranium deposits formed due to hydrothermal activity and are constrained within fault-controlled veins and brecciated zones of Pennsylvanian-aged limestone [31].
Proterozoic unconformity uranium deposits are defined by geological structure rather than host rock type; e.g., uranium deposits occur either above or below an unconformity that separates the crystalline basement from overlying Proterozoic sediments. Two uraninite samples from Proterozoic unconformities are investigated in this study: Rabbit Lake (#511) and Australia 2 (#604). The Rabbit Lake sample is from northern Saskatchewan, Canada. The orebody is located within the Wollaston domain, 10–100 m below the Helikian sub-Athabasca Formation unconformity [32]. The Australian sample is from Northern Territories, Australia. A mine location is not known for this sample, however, its CN-REE signature indicates that it is an unconformity-related deposit (Figure S1; [11,12].
The last type of uranium deposit discussed in this study is sandstone. Sandstone uranium deposit types form due to the reduction of U6+ in fluids within sandstone resulting in U4+ precipitation. Sandstone uranium deposits are hosted in fluvial and marginal marine sedimentary environments [13]. Four samples are classified as sandstone type: Big Indian Wash 1 (#1232), Big Indian Wash 2 (#1303), Adair Mine 1 (#1237), and Adair Mine 2 (#1262). An additional sample, Happy Jack (#353) is identified as sandstone tabular deposit [2,12]. These five samples are from San Juan County, Utah; Adair Mine, Big Indian Wash, and Happy Jack. Adair Mine is uraninite from Cane Spring Canyon. It is hosted within the Moss Back member of the Triassic Chinle formation. It consists of calcite-cemented sandstone that grades into calcareous siltstone interbedded with limestone, shale, and minor sandy layers. The uraninite is primarily found as a replacement of woody material or as cement [33]. Big Indian Wash is hosted in the Cutler formation located below the Permian-Triassic unconformity (below the Moss Back member). The Cutler formation consists of alternating lenses of mudstone, calcareous siltstone, and arkosic sandstone [34]. The Happy Jack sample from the White Canyon area is classified as a tabular sandstone due to the geometry of the deposit. The Happy Jack U ore deposit is hosted in the same Permian to Triassic formations as Adair Mine and Big Indian Wash [35].

2.2. Analytical Methods

For each uraninite investigated here (Table 1), an aliquot was prepared for both in-situ and solution mode analyses. For in-situ analysis, a ~1 cm2 cut portion of each uraninite was mounted in epoxy, cured, and then polished. The portion of sample selected, where possible, included the transition from pristine to altered uraninite, as determined by color and hardness of the sample (Figure 1). The spatial distribution and qualitative assessment of the major element abundances, U, Pb, Si, Ca, Th, and Fe (Figure S2), were determined by micro-X-ray Fluorescence Spectroscopy (µXRF). An EDAX Orbis PC µXRF was used to collect the elemental maps with an X-ray aperture of 30 µm, 40 kV voltage, 300 µA current, and a 100 µs dwell time over a 512 × 400 matrix. Appropriate transects through individual uraninite samples that encompass transition zones between pristine and altered sections were conducted for further investigation (e.g., Figure 1). A suite of major element oxide abundances (wt. %; UO2, PbO, ThO2, SiO2, FeO, Al2O3, MnO, TiO2, As2O3, V2O3, CaO, ZrO2, K2O, P2O5, SO3, and Y2O3) were determined along the transects identified by µXRF utilizing a Cameca SX-50 electron microprobe (EMP: Table S1). Standard EMP operating conditions included an accelerating voltage of 15 kV and beam size of ca. 3 µm with a beam current of 100 nA. A suite of well characterized standards were used to calibrate the EMP prior to each analytical session and included; synthetic uranium dioxide (UO2), pyrite (PbS), synthetic thorium dioxide (ThO2), synthetic zircon (ZrSiO4), anorthite glass (CaAl2Si2O8), titanium dioxide (TiO2), Mn metal, synthetic Y-Al garnet (Y3Al5O12), synthetic calcium phosphide (Ca2P), synthetic vanadium oxide (V2O3), K-feldspar, Mn-bearing olivine, and asbestos. The trace element concentrations were determined using a New Wave Research UP213 Nd:YAG laser ablation (LA) system coupled to a Thermo Finnegan Element2 sector field high resolution (HR) inductively coupled plasma mass spectrometer (ICP-MS: Table S2). Analyses were conducted using a repetition rate of 5 Hz on a 30 µm diameter spot corresponding to a fluence of 12 Jcm−2. Acquisition parameters consisted of 1 pass with 160 cycles of 8 ms dwell time for each mass of interest [36,37,38,39]. Background signals were collected for 60 s with the shutter closed prior to sample ablation of 60 s duration. The typical pit depth for a 60 s ablation was <75 µm with clean edges and flat base [23,38]. A standard-bracketing technique was employed with NIST SRM 610 glass wafer as the external standard [40]. Where possible, PbO wt. % as determined by EMP was used as the internal standard [23]; if the abundance of PbO was considered too low (<0.5 wt. %), then the CaO wt. % content was used as the internal standard for data reduction purposes within the GLITTER© software [23,41].
For solution and powder X-ray diffraction (PXRD) analyses, the uraninite samples were separated into pristine and altered aliquots (Figure 1). If a clear distinction could not be made between the pristine and altered portions, then a third aliquot identified as bulk was prepared. Approximately, 0.5–1.0 g of each sample aliquot (pristine, altered, ± bulk) was powdered using an agate pestle and mortar with ca. 0.05 g of sample being digested using a two-acid method (HNO3 and HF; [42]). An additional 0.1–0.2 g of the powdered sample was used for PXRD analysis for the purpose of phase identification within the altered and bulk samples only (Table S3). PXRD data were collected using a Bruker D8 Advance Davinci powder diffractometer in Bragg–Brentano configuration. Cu–Kα radiation was produced with an accelerating voltage of 40 kV and 40 mA current. An incident-beam slit of 1.0 mm was reduced by a 0.6 mm slit in combination with 0.02 mm absorber and diffraction (0.6 mm) slits. Data were collected using a step scan with a step velocity of 0.8° min−1 in the range of 5–55° 2θ using a LynxEye solid-state detector.
Trace element concentrations of all solution aliquots were collected on a Nu Instruments AttoM High Resolution (HR) inductively coupled plasma mass spectrometer (ICP-MS). Analyses were conducted using medium mass resolution (M/MΔ ≈ 2500) employing a spike addition method in wet plasma mode modified after Jenner et al. [43]. Acquisition consisted of 3 cycles of 300 sweeps with equal dwell times of 1 ms for each isotope of interest. In addition to trace element concentrations, Pb, U, and Sr isotopic compositions were also investigated in this study (Table S4). All isotopic measurements were conducted on a Nu Plasma II Multi-Collector ICP-MS with a desolvating nebulizing system (DSN-100 from Nu Instruments). With regard to Pb isotope measurements, lead separation was accomplished by a two-step anion-exchange chromatographic procedure modified after Manhes et al. [44]. Following lead separation, the samples were evaporated to dryness and re-dissolved in 2% HNO3 solution spiked with NIST SRM 997 Thallium standard (5 ppb). Simultaneous measurements were acquired for all Pb and Tl isotopes as the Tl isotope ratio, 205Tl/203Tl, was used to correct for instrumental mass bias [45]. External reproducibility was monitored by repeated measurements of a 25 ppb NIST SRM 981 (Pb) spiked with NIST SRM 997 (Tl) and yields average values (2σ) of 206Pb/204Pb = 16.937 ± 0.006, 207Pb/204Pb = 15.490 ± 0.005, 208Pb/204Pb = 36.697 ± 0.015, and 207Pb/206Pb = 0.91462 ± 0.00004 (n = 6). For U isotope analyses, UTEVA ion exchange columns were utilized to successfully separate uranium from any potential interferences [46]. A standard-bracketing technique was employed with New Brunswick Laboratory CRM 112-A as the external standard, which was used to correct for instrumental mass bias. The external reproducibility (2σ) associated with the 238U/235U, 234U/238U, and 235U/238U ratios are 0.38‰, 4.32‰, 0.38‰, respectively. Strontium isotope analyses involved separation of Sr from the sample matrix by the cation-exchange chromatographic procedure modified after Crock et al. [47]. Due to the high abundances of REEs within uraninites (e.g., [2,11,12]), all samples were processed through the cation-exchange chromatography twice in order to achieve sufficient purity for Sr isotopic analysis on the MC-ICP-MS, which aided in the removal of plasma-based isobaric interferences (i.e., doubly-charged REEs) on Sr isotopes of interest (Tables S2 and S3). However, for six uraninite samples with a Sr/total REEs ratio of <0.03, adequate separation of Sr from REE was not achieved despite the double pass on the ion exchange columns. Five of the 6 samples excluded for Sr isotope analysis are intrusive non-granite-related deposit type and one is a Proterozoic unconformity deposit type. The external reproducibility for the Sr isotope analyses was monitored by repeated measurement of a 100 ppb NIST SRM 987 strontium standard that yielded an average value and associated 2σ standard deviation of 87Sr/86Sr of 0.71025 ± 0.00004 (n = 9).
The principal component analysis was performed using R statistical software [48]. All data were log-transformed to normalize the data prior to the multivariate analyses using FactoMineR and factoextra (Factor analysis and data Mining with R; [49]) with ggplots2, GGally, and ggsci to aid in graphing [50,51,52]. For the purposes of this study, solely principal components 1 and 2 will be discussed.

3. Results and Discussion

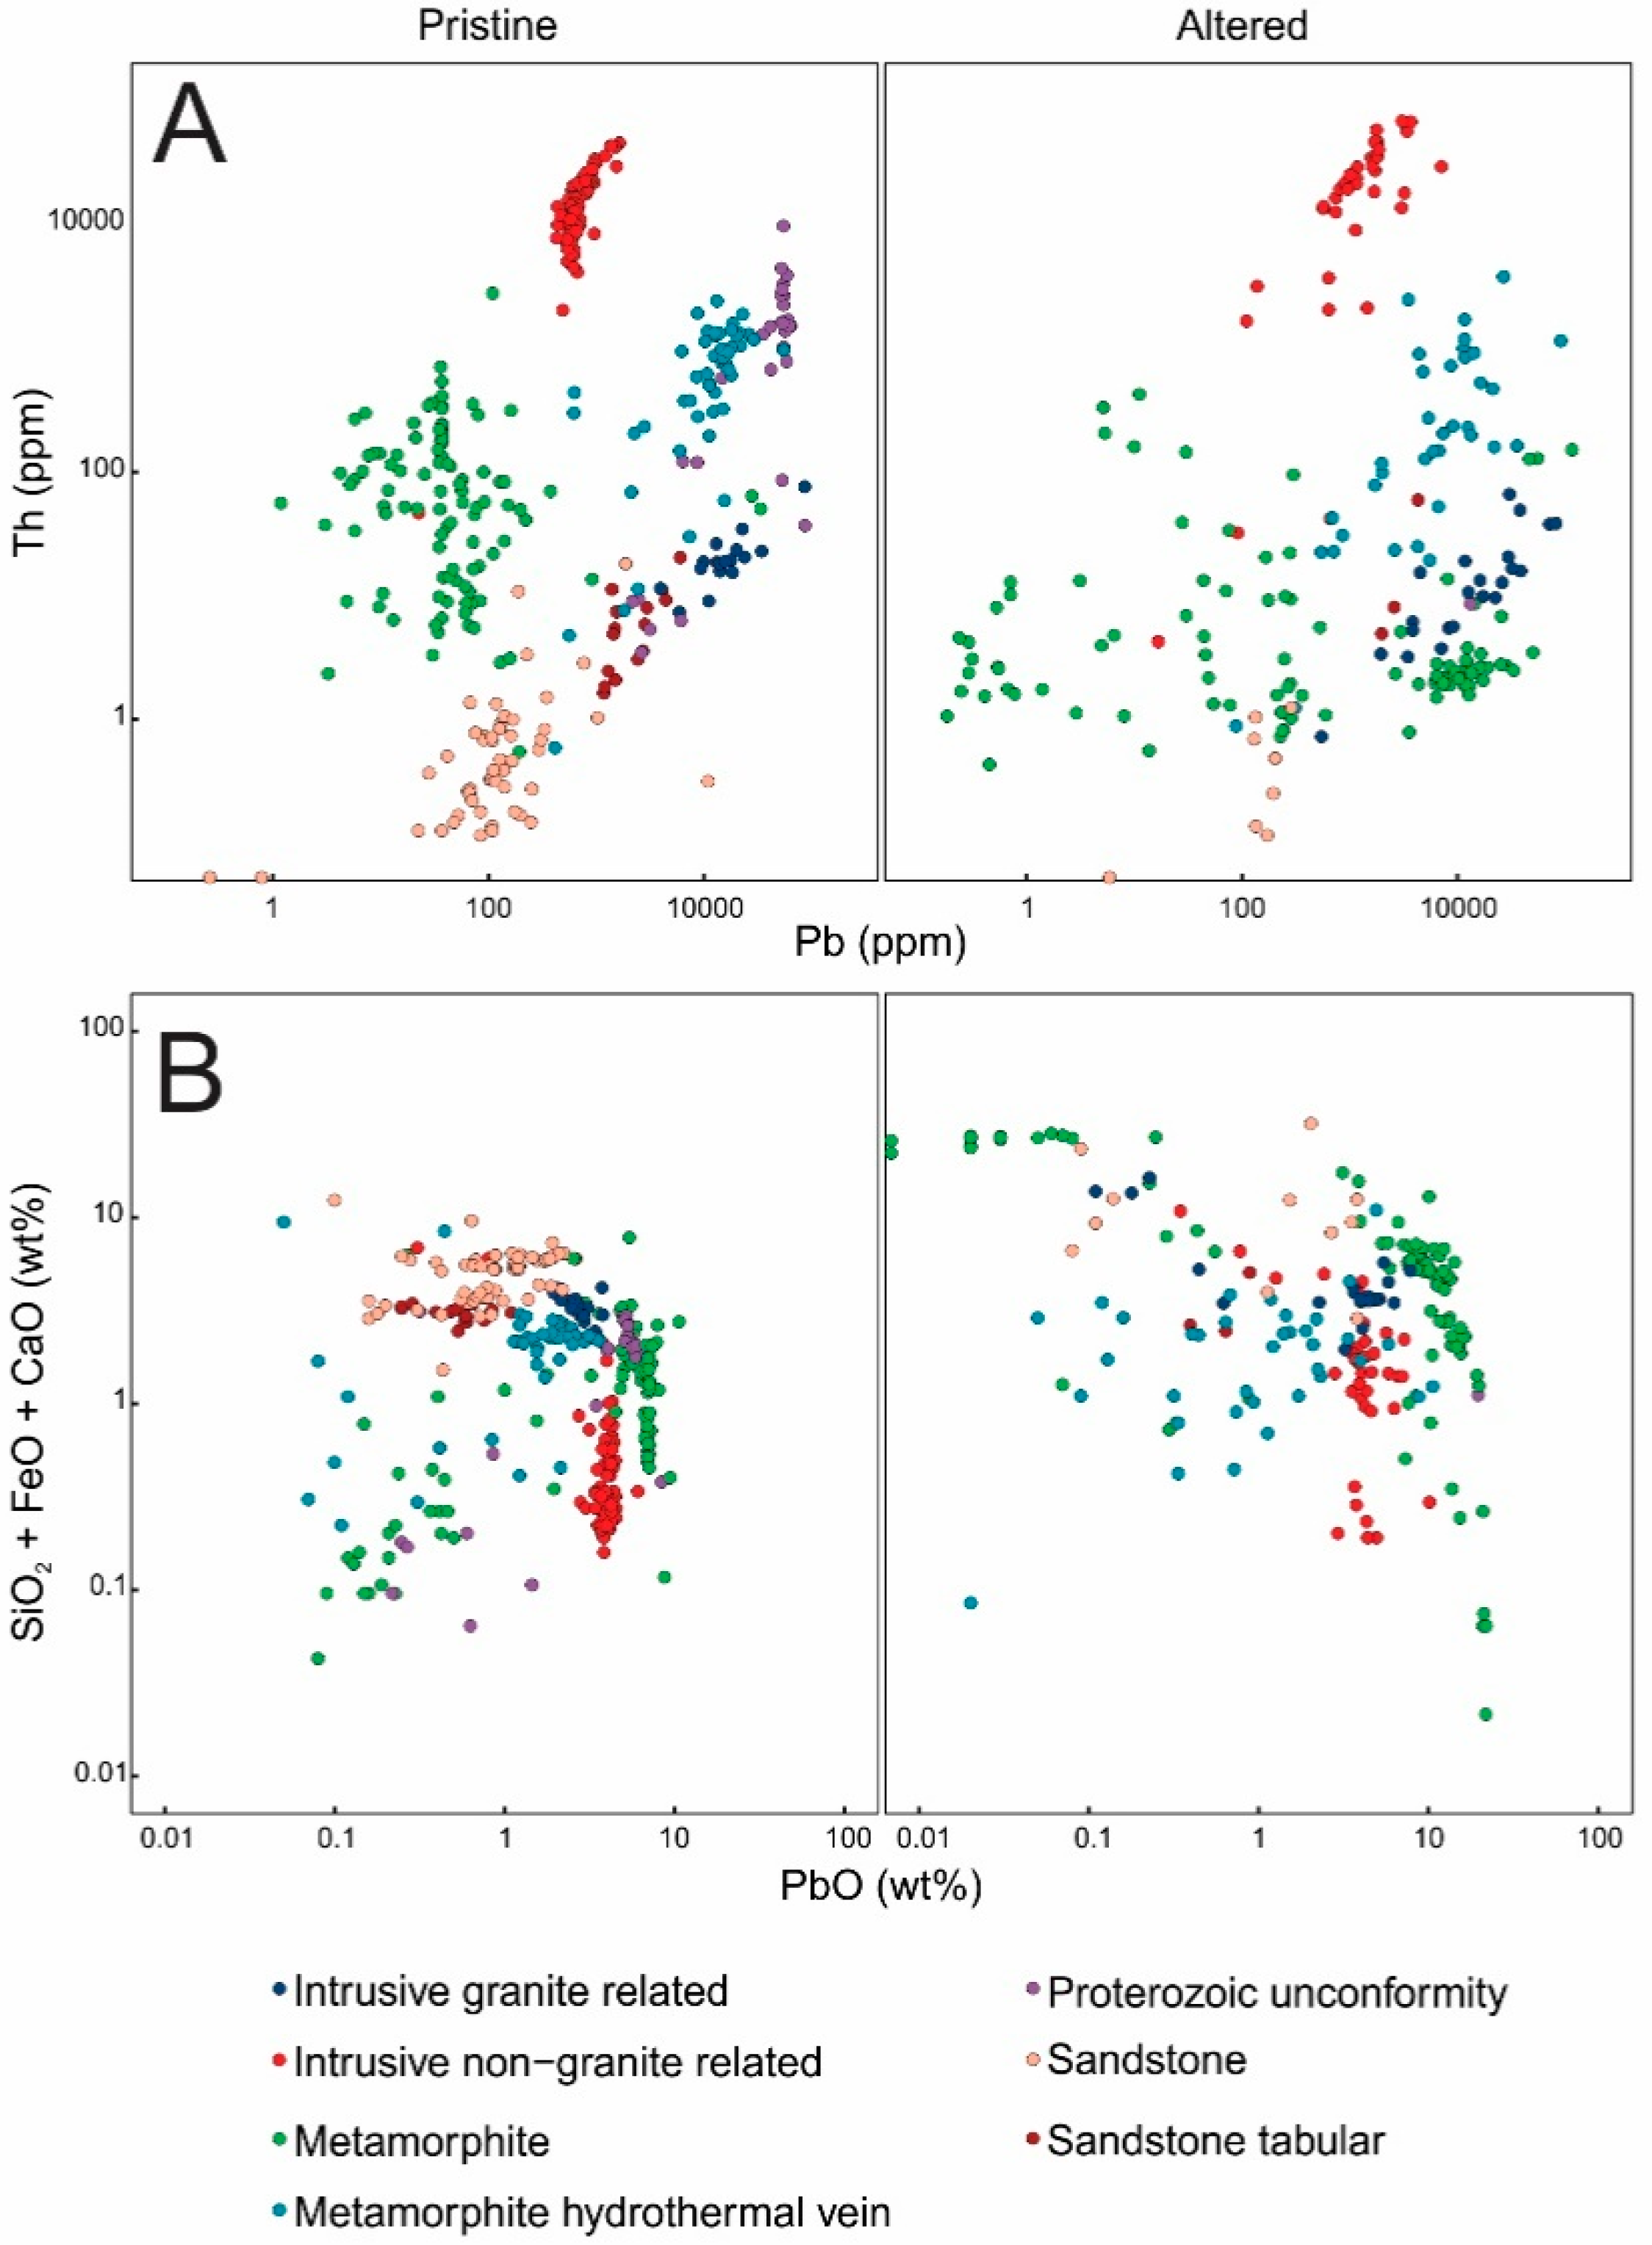
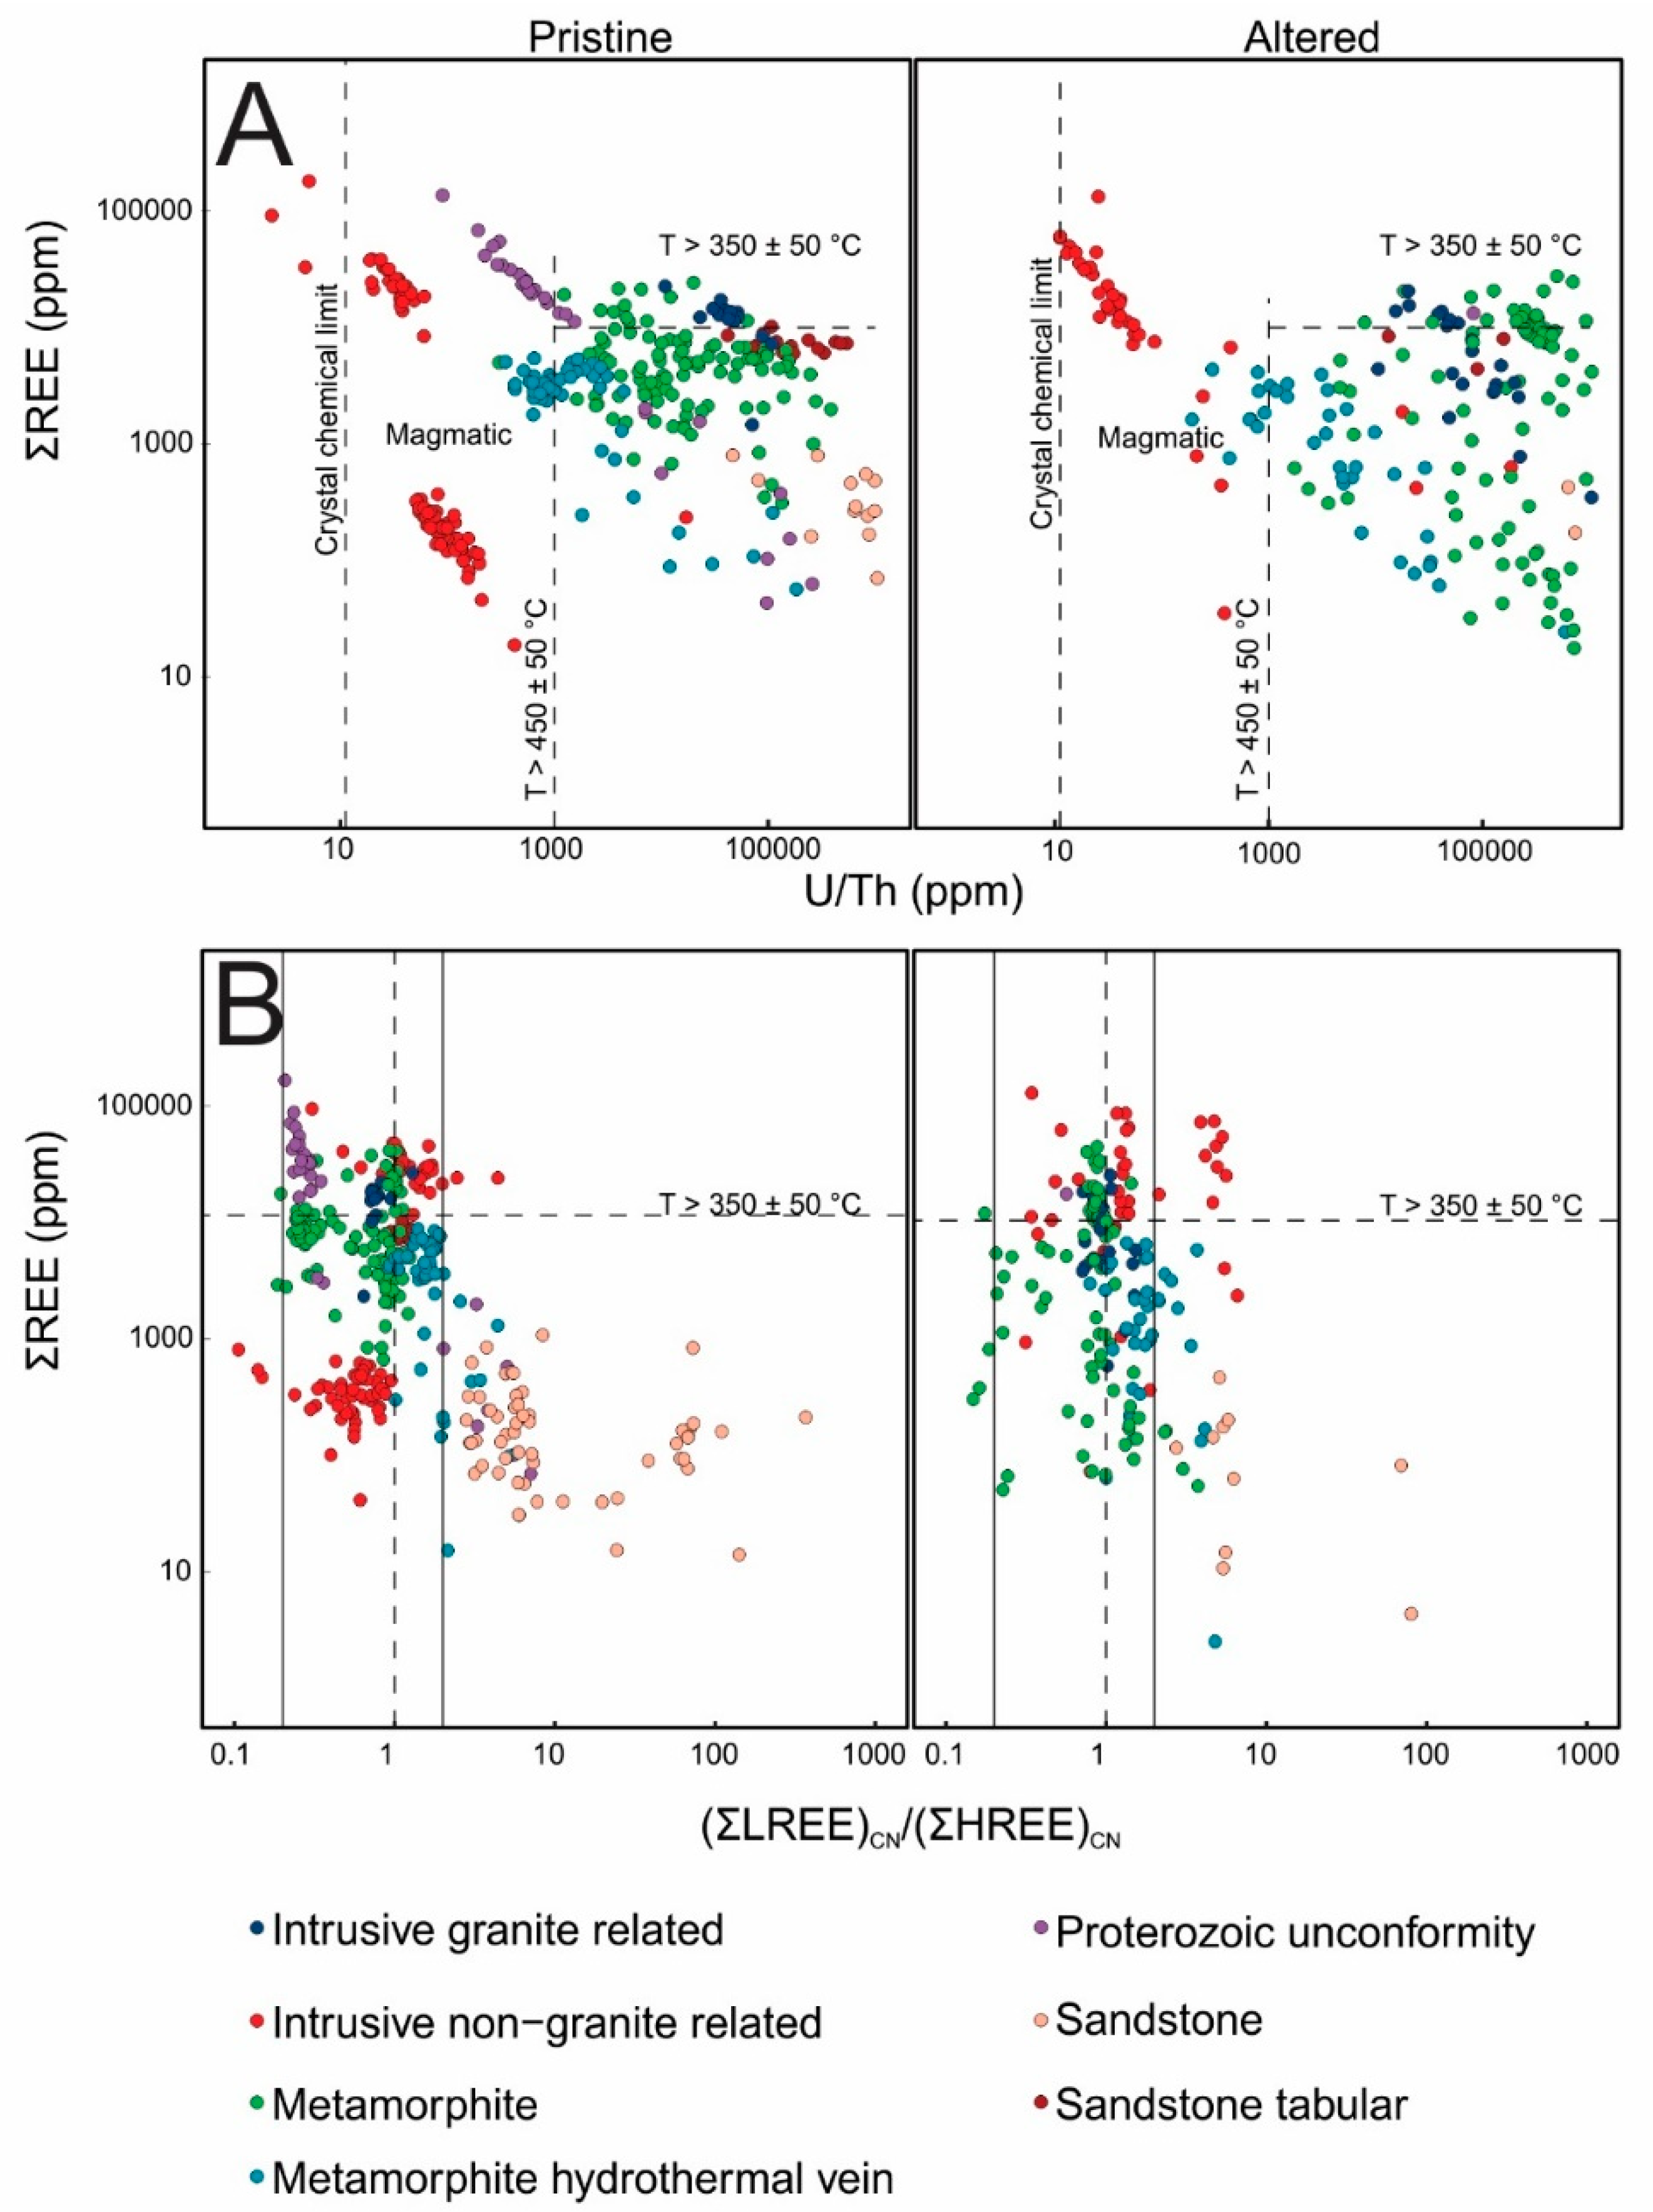
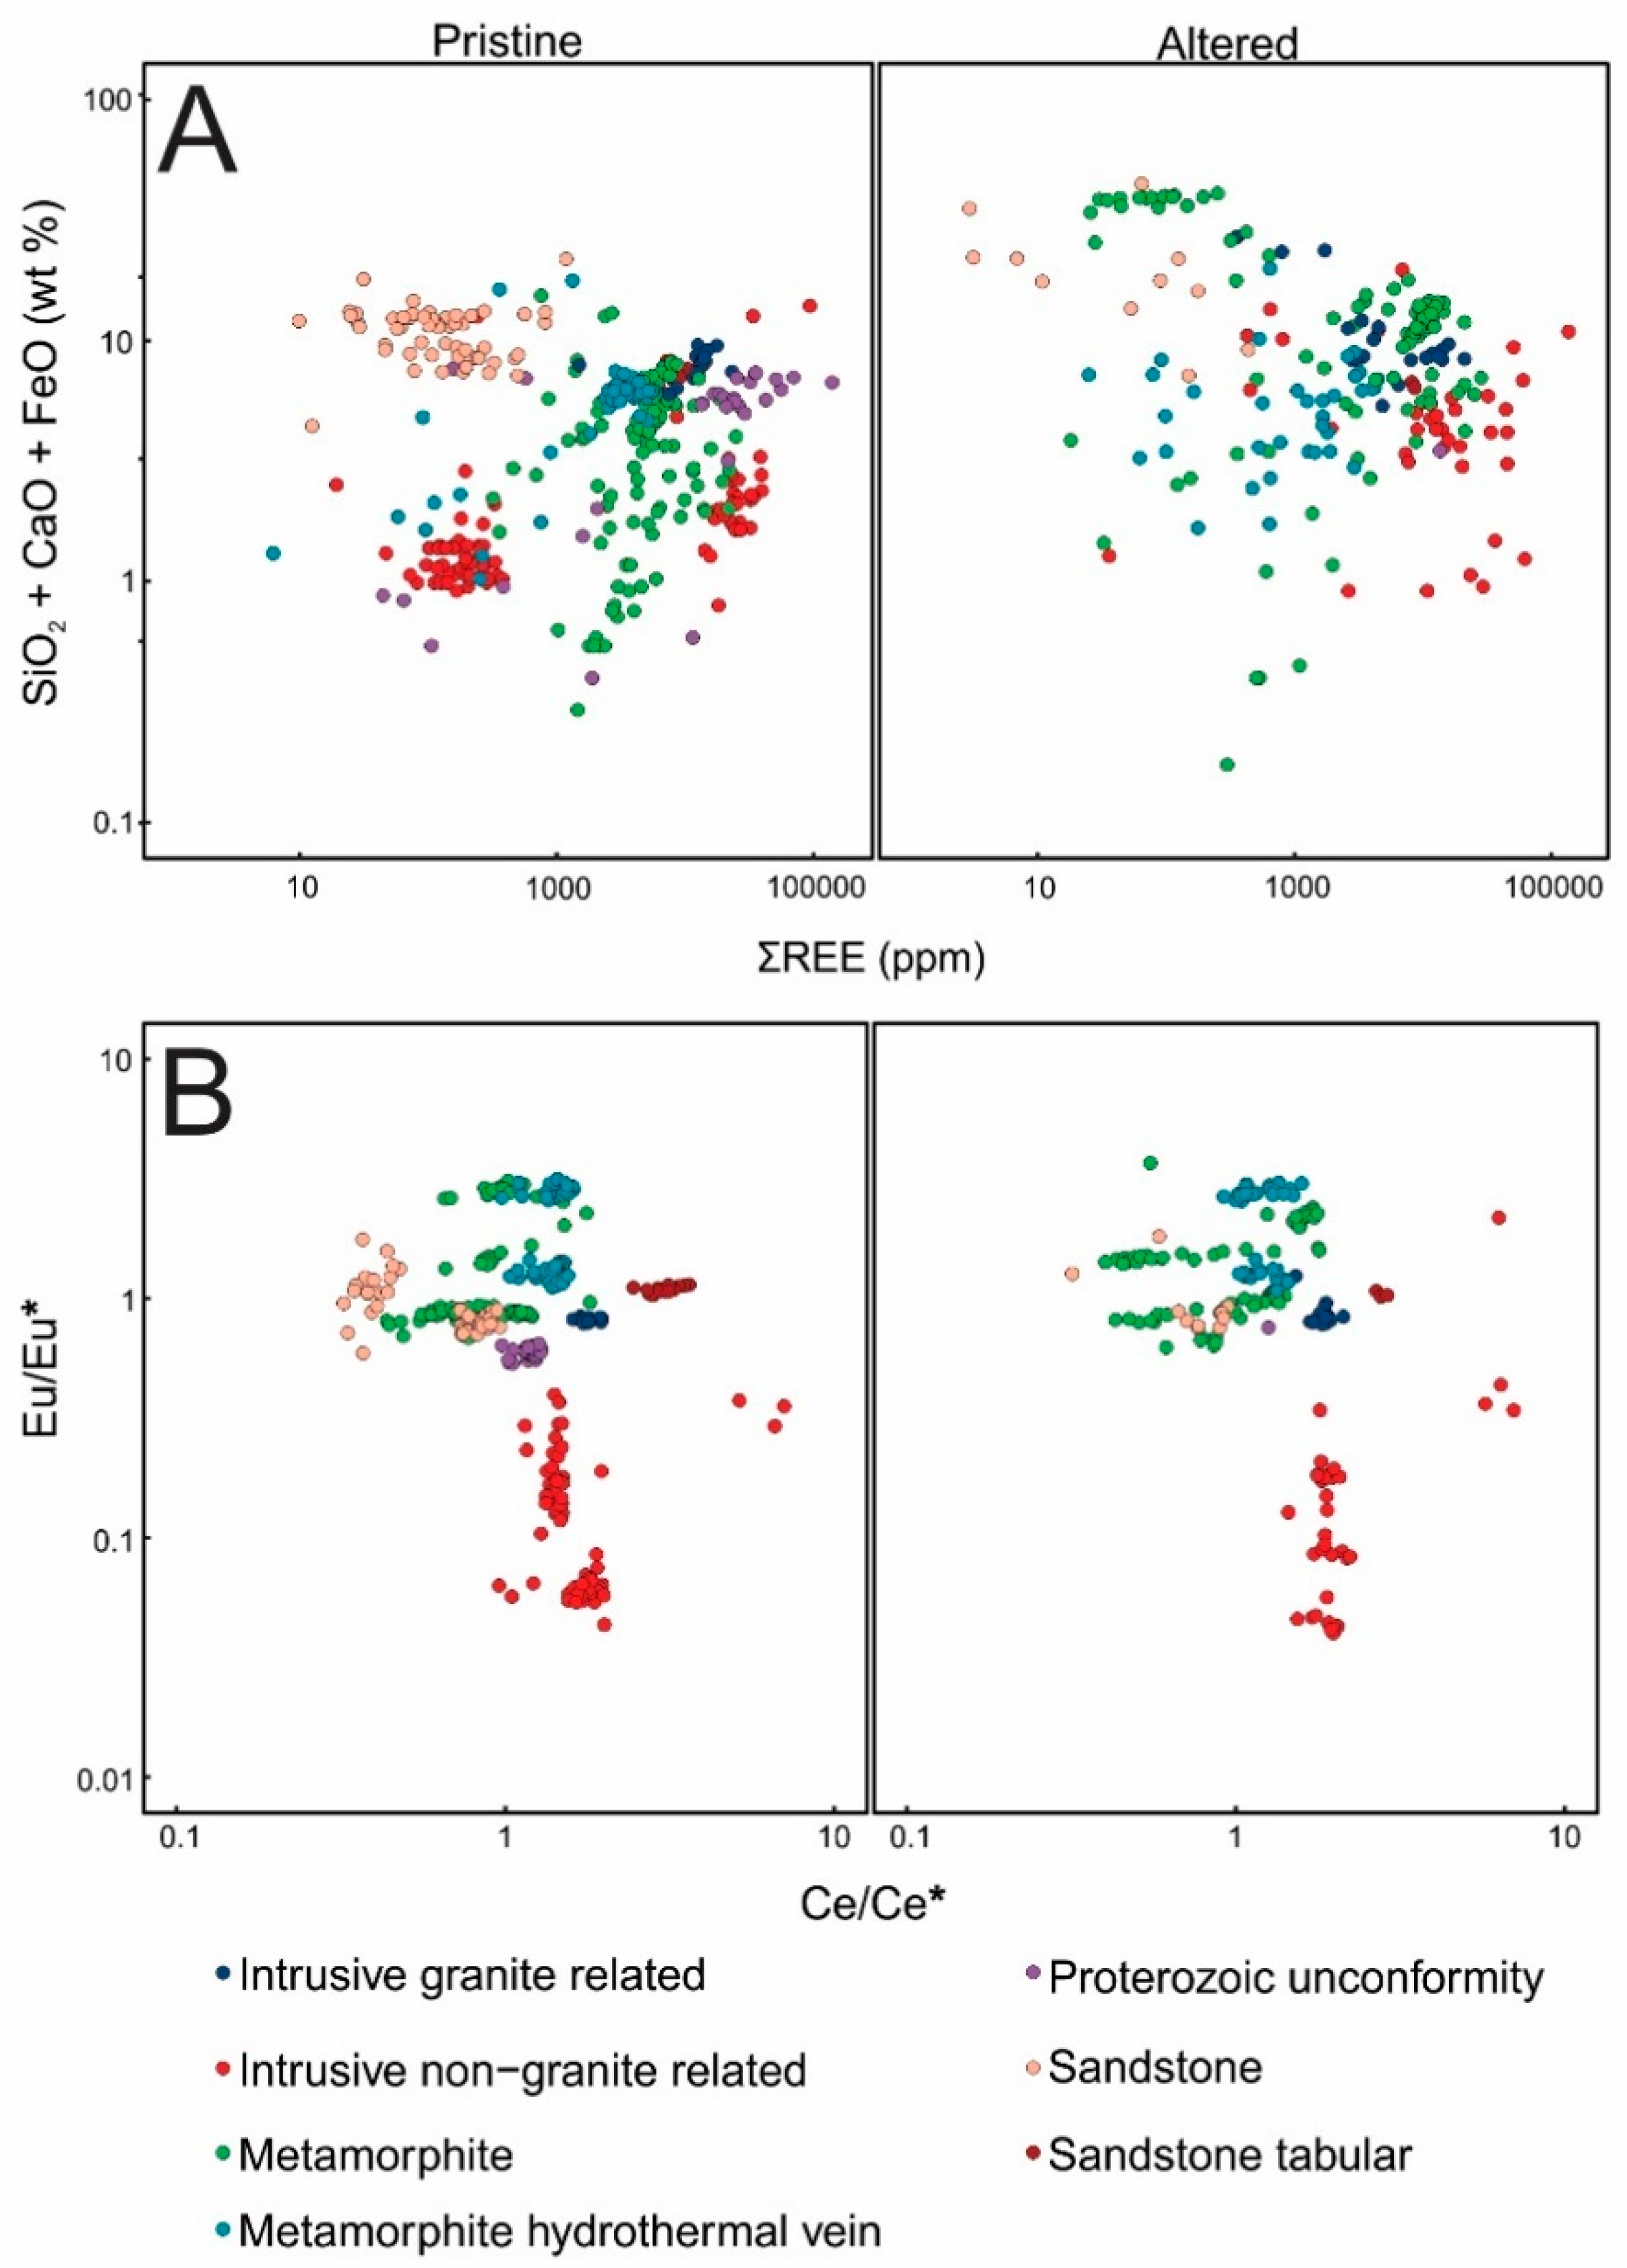
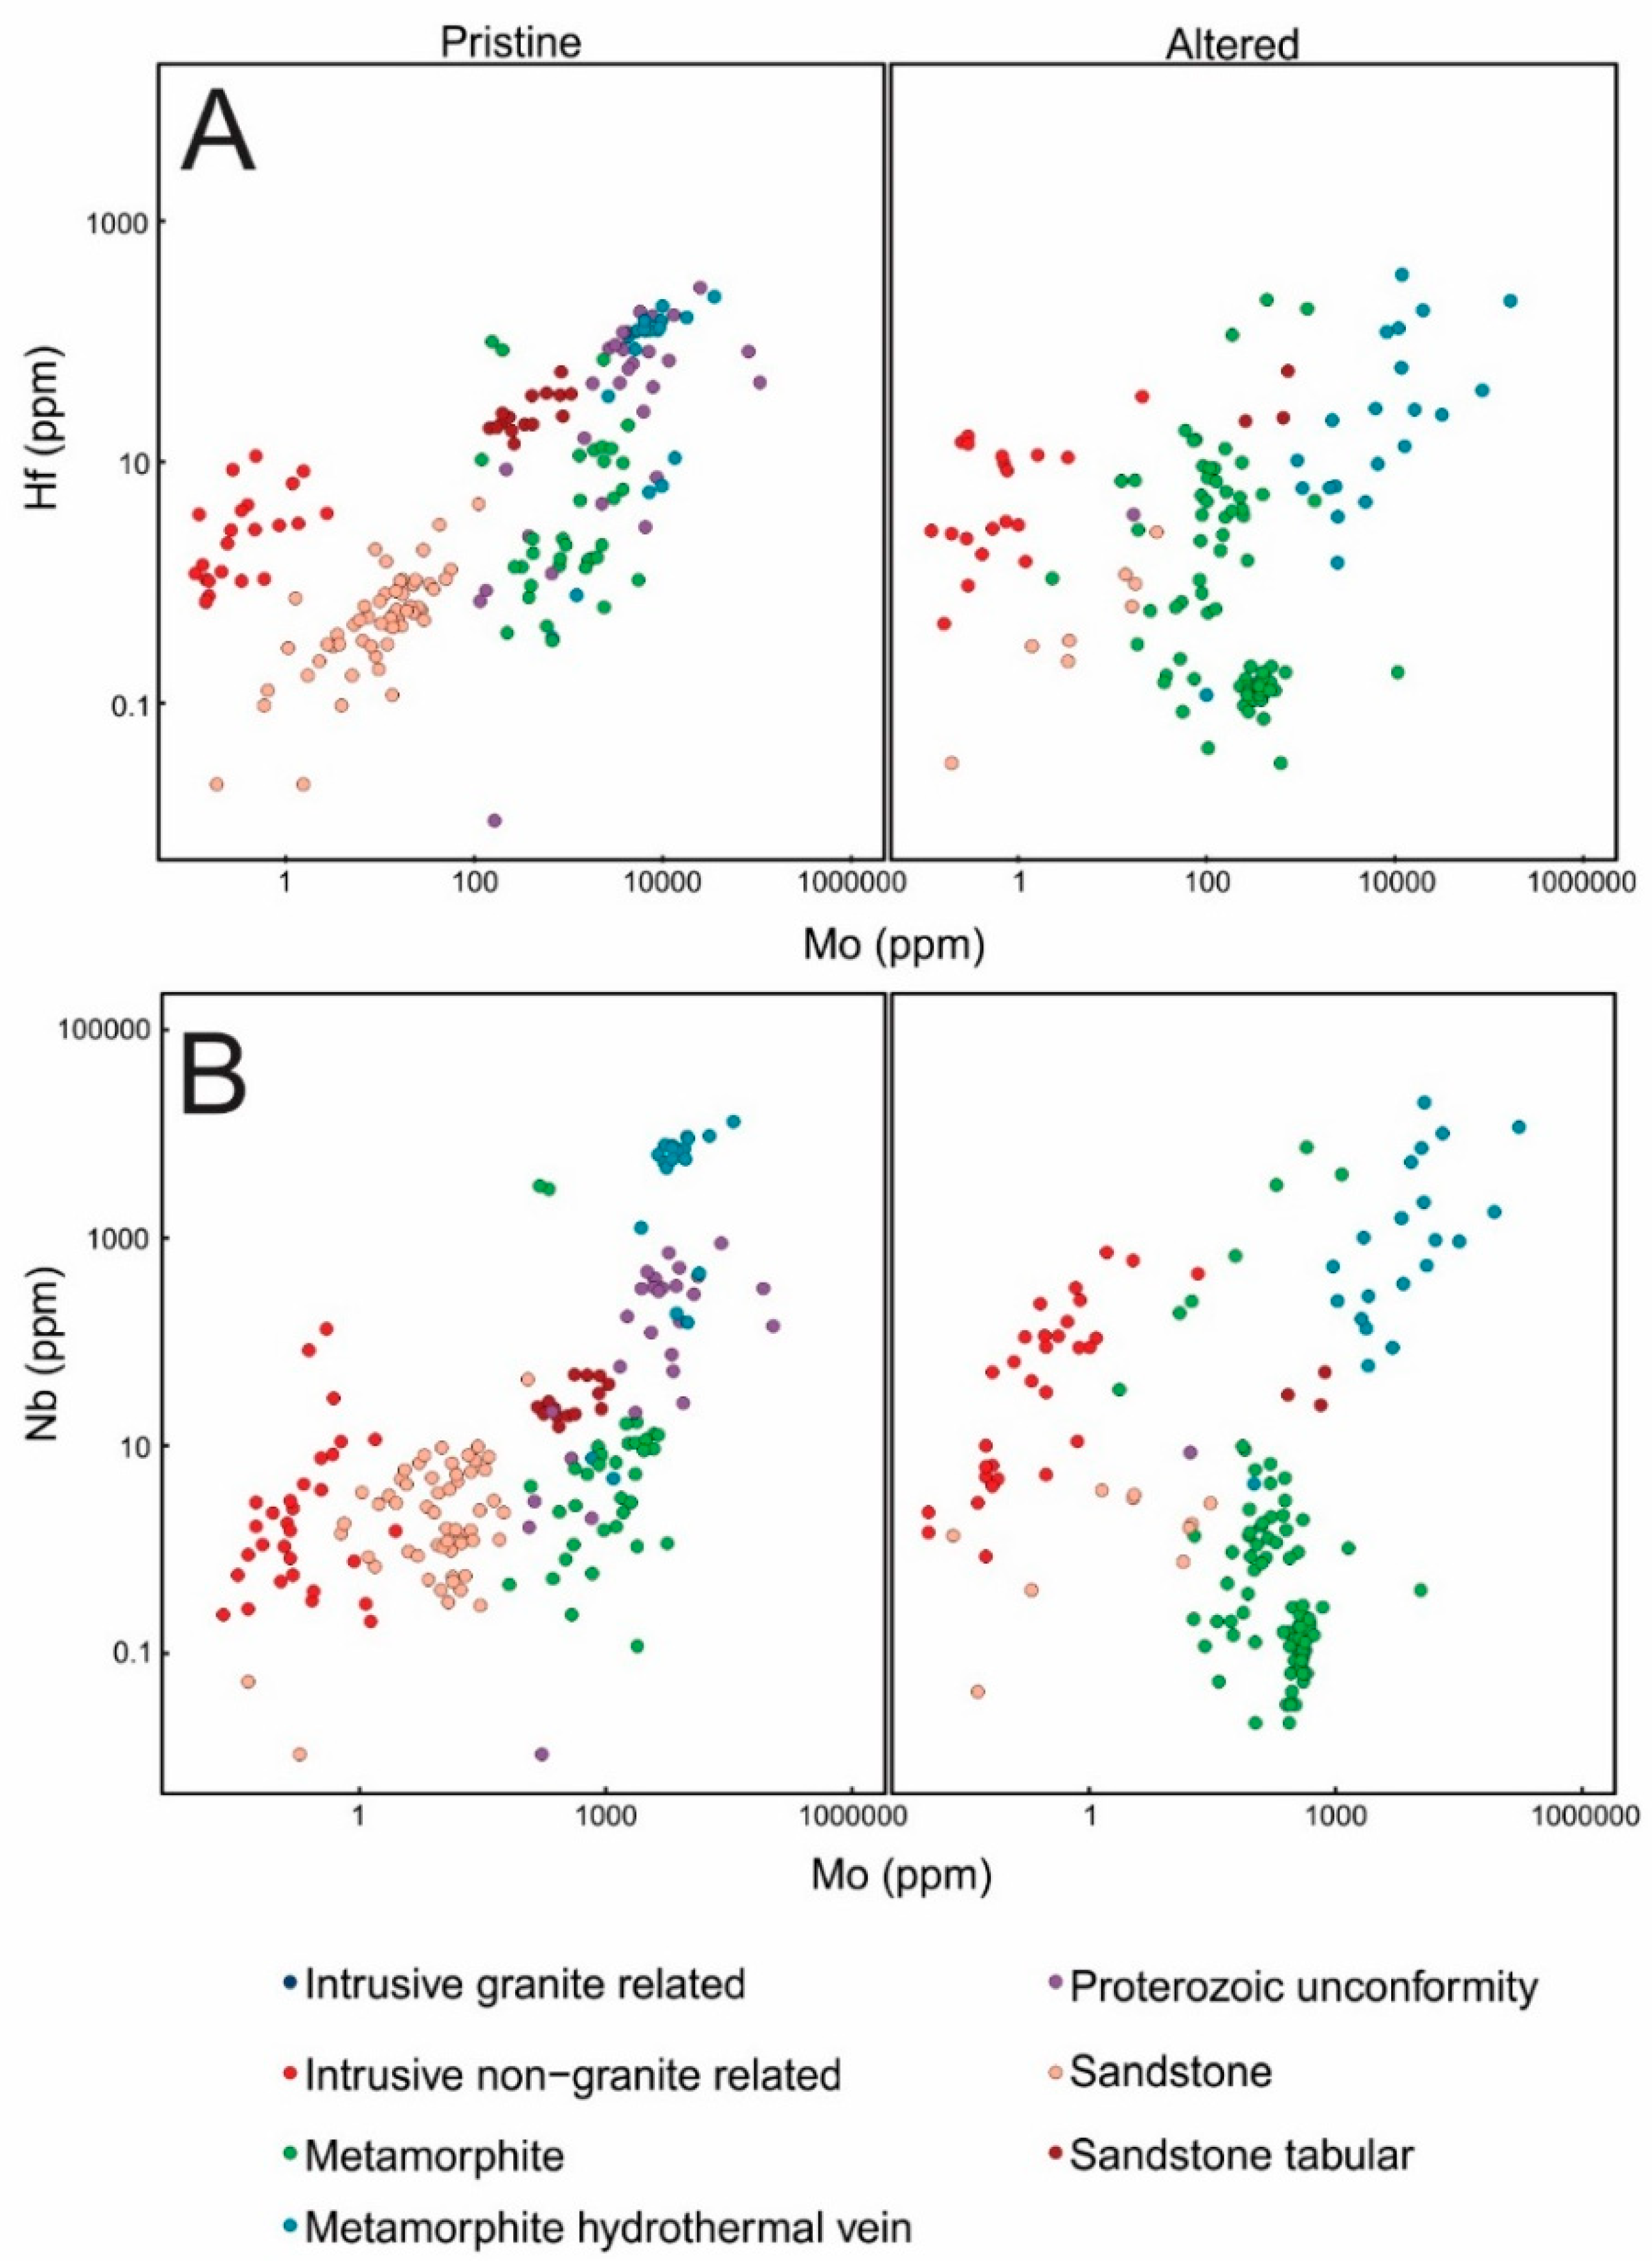
3.1. Major and Trace Element Compositions and PXRD Results

The in-situ major and trace element data for the uraninite samples investigated here are presented in Tables S1 and S2. Of the 900 individual in-situ analyses conducted on the 23 samples (average 40 spots per sample), 354 analyses represent pristine uraninite (UO2 > 80 wt. %), 213 correspond to altered sections (UO2 70–80 wt. %), and the remaining analyses are considered secondary minerals as they are characterized by UO2 contents of <70 wt. %. The totals of included analyses for each type are as follows: intrusive non granite-related = 120 (84 pristine and 36 altered), intrusive granite-related = 39 (17 pristine and 22 altered), metamorphite = 206 (103 pristine and 103 altered), metamorphite hydrothermal vein = 85 (49 pristine and 36 altered), Proterozoic unconformity = 31 (30 pristine and 1 altered), sandstone = 68 (57 pristine and 11 altered), and sandstone tabular = 18 (15 pristine and 3 altered).
As previous studies have shown, major elements can be used to distinguish between different deposit types [7,14,18]. Th4+ has a similar ionic radius to U4+ and can therefore substitute into the uraninite structure depending on element availability, especially at elevated temperatures [2,7,11,17]. The Th (ppm) and Pb (ppm) contents of the uraninite samples examined in this study are shown in Figure 2A for both pristine and altered areas. The Th and Pb concentrations are distinct for a number of deposit types in the pristine areas, namely for intrusive non-granite-related, metamorphite, and sandstone (Figure 2A). Intrusive non-granite-related samples have the highest concentrations of Th (>5000 ppm), which is attributed to the higher crystallization temperature that favors Th substitution for U (>450 °C, [7]). The Proterozoic unconformity uraninite samples are also characterized by high Th concentrations. Conversely, sandstone type uraninite samples record the lowest abundances of Th (<1 ppm) and relatively low Pb contents (<500 ppm). Pristine metamorphite type samples are identified by low Pb concentrations (typically <100 ppm) and variable Th contents that range from 10 to 1000 ppm (Figure 2A). Of note, for pristine samples, Th and Pb contents may be used to clearly distinguish between metamorphite and metamorphite hydrothermal vein type samples as the latter have higher Pb concentrations (>5000 ppm). The groupings observed for the pristine areas are not apparent in the altered sections of the samples since the latter record larger variations in the concentrations of Th and Pb for both the intrusive non-granite-related and metamorphite. As with the pristine sections, the Th concentrations for the altered regions remain the highest in the intrusive non-granite type (Figure 2A). Moreover, the Pb concentrations for the altered metamorphite samples span the entire range of measured Pb abundances. With progressive alteration of uraninite, there will be preferential loss of Pb along with various other cations that substitute within the uraninite structure, such as Si, Fe, and Ca [8,18]. Figure 2B demonstrates the scatter and lack of correlation between Pb contents and the total major cation (SiO2 + FeO + CaO) abundances for altered uraninites. In summary, within the pristine areas of the uraninite the signatures shown in Figure 2B indicate that all deposit types do form clusters except for the metamorphite and metamorphite hydrothermal vein deposit types. However, the deposit types are not adequately distinguished from each other, i.e., the various types of uraninite overlap with the metamorphite deposit type spanning the entire range for both the total cation abundance and the Pb concentration. In addition, no discrete groups are identified in the altered areas when comparing the cation and PbO abundances (Figure 2B), which suggests either the presence of other cations not examined during EMP analysis, or that a combination of minor elements contribute to replacing U during alteration.
To date and as stated earlier, CN-REE patterns have been demonstrated to be the most reliable forensic signature in identifying the provenance of uranium ore from different deposit types. Similar to Th4+, the REE signatures of uranium deposits are primarily attributed to the source (elemental availability) and, to a lesser extent, temperature of formation [7,11]. The general consensus is that if the REEs are present at constant concentrations, then their incorporation within uraninite is positively correlated with temperature; i.e., higher temperature of formation will be associated with higher REE abundances. Conversely, if the temperature is held constant, then the availability of the REEs will dictate the degree to which they are sequestered into the uraninite structure [2,7,11,12]. Therefore, the relationship between Th4+ and REEs can be used to gain insight into the temperature of formation for uranium deposits (Figure 3A). As previously stated, the Th concentration is highest for the intrusive non-granite-related samples and the Proterozoic unconformity samples followed by the metamorphite hydrothermal vein samples; therefore, these samples are characterized by the lowest U/Th ratio (U/Th < 1000, Figure 3A; [7]). The REE compositions of the pristine areas for the uraninite samples indicate a large range between all deposit types (10–100,000 ppm) and also within individual deposit types. For example, uraninite from intrusive non-granite-related samples define two distinct groups, which both plot in the magmatic temperature field (T > 450 °C, U/Th < 1000); both groups show variation in the REE concentrations, which is likely due to source availability rather than temperature variability (Figure 3A). Lower temperature deposits such as sandstone, sandstone tabular, and (most of) the metamorphite samples formed below 350 °C, as indicated by the total REE concentrations and 450 °C temperature cutoff as defined by a U/Th ratio > 1000. The altered samples exhibit the same large range in the total REE concentrations, which suggests that there is no loss of REEs as a result of alteration (Figure 3A,B and Figure S1). However, altered regions of uraninite from the different deposit types do plot in the expected temperature field, e.g., intrusive non-granite-related plot within the 450 °C or above region (Figure 3A).
Deposit type grouping is also evident based on the ∑REEs and ∑cation compositions of pristine uraninite, e.g., sandstone, sandstone tabular, intrusive granite-related, and Proterozoic unconformity (Figure 4A). However, the metamorphite uraninite samples overlap all other deposit types except for sandstone due to the large range in cation abundances (0.1–10 wt. %). Also, no trend is observed in the altered uraninites on the basis of their ∑REE and ∑cation compositions (Figure 4A). The CN-REE signature for each deposit type has a typical shape/pattern, e.g., intrusive non-granite-related deposit type is characterized by both positive cerium and negative europium anomalies, where a positive anomaly indicates an enrichment of Ce relative to its neighboring REEs and, conversely, a negative anomaly signifies a lower abundance of Eu relative to its neighboring REEs (Figure S1). As the overall CN-REE pattern remains unaffected by the degree of alteration (Figure S1), comparison of the magnitudes of both the Ce and Eu anomalies illustrates the same relative groupings for both pristine and altered regions (Figure 4B). For example, the sandstone tabular type forms a separate group relative to the sandstone type due to a positive Ce anomaly associated with the sandstone tabular, whereas a negative Ce anomaly is related to the sandstone type. CN-REE patterns for uraninite from intrusive non-granite-related type deposits define a large range in Eu anomaly values and are the most negative of all sample types investigated in this study (Figure 4B).
In addition to the major and minor elements discussed above, previous studies have suggested that some trace elements have the potential of differentiating between various deposit types; these include Mo, Hf, Zr, and Nb [2,7,10,18,53]. Figure 5 illustrates the variation in both Hf and Nb abundances relative to Mo concentrations. The concentrations of the latter vary from <1 ppm to >10,000 ppm for all deposit types investigated here. The intrusive non-granite-related and sandstone uraninites have the lowest Mo, Hf, and Nb abundances, whereas the metamorphite hydrothermal and Proterozoic unconformity have the highest Mo, Hf, and Nb contents in pristine regions of the samples. The same holds true for the altered regions of the samples with the exception of the Proterozoic unconformity uraninite samples since none of the Proterozoic unconformity samples are considered altered (i.e., UO2 abundances were all >80 wt. %; Figure 5).
The secondary mineral phases identified by PXRD are listed in Table S3. Plasil et al. [16] summarized the sequence of secondary mineral formation expected with progressive uraninite alteration. The secondary minerals identified here encompass the range of alteration, and include mixed valance, e.g., oxidized uraninite to phosphuranylite (KCa(H3O)3(UO2)7(PO4)4O4∙8H2O), e.g., uranocircite (Ba(UO2)2(PO4)2∙10H2O), and natrouranospinite ((Na2,Ca)(UO2)2(AsO4)2∙5H2O). The secondary mineral assemblages documented here do not show any systematic variation/correlation with their associated deposit types (Table S3). Thus, this feature suggests that the geological setting of the uraninite deposit does not exert an important control on the type of secondary minerals that form; rather, it is possible that secondary mineral formation is related to the chemical composition of the alteration fluids, which reflects the regional geology rather than just the localized uranium-rich deposit. However, a larger dataset may allow for a more rigorous comparison and investigation of any significant correlation between the secondary mineral assemblage, degree of alteration, and deposit types.

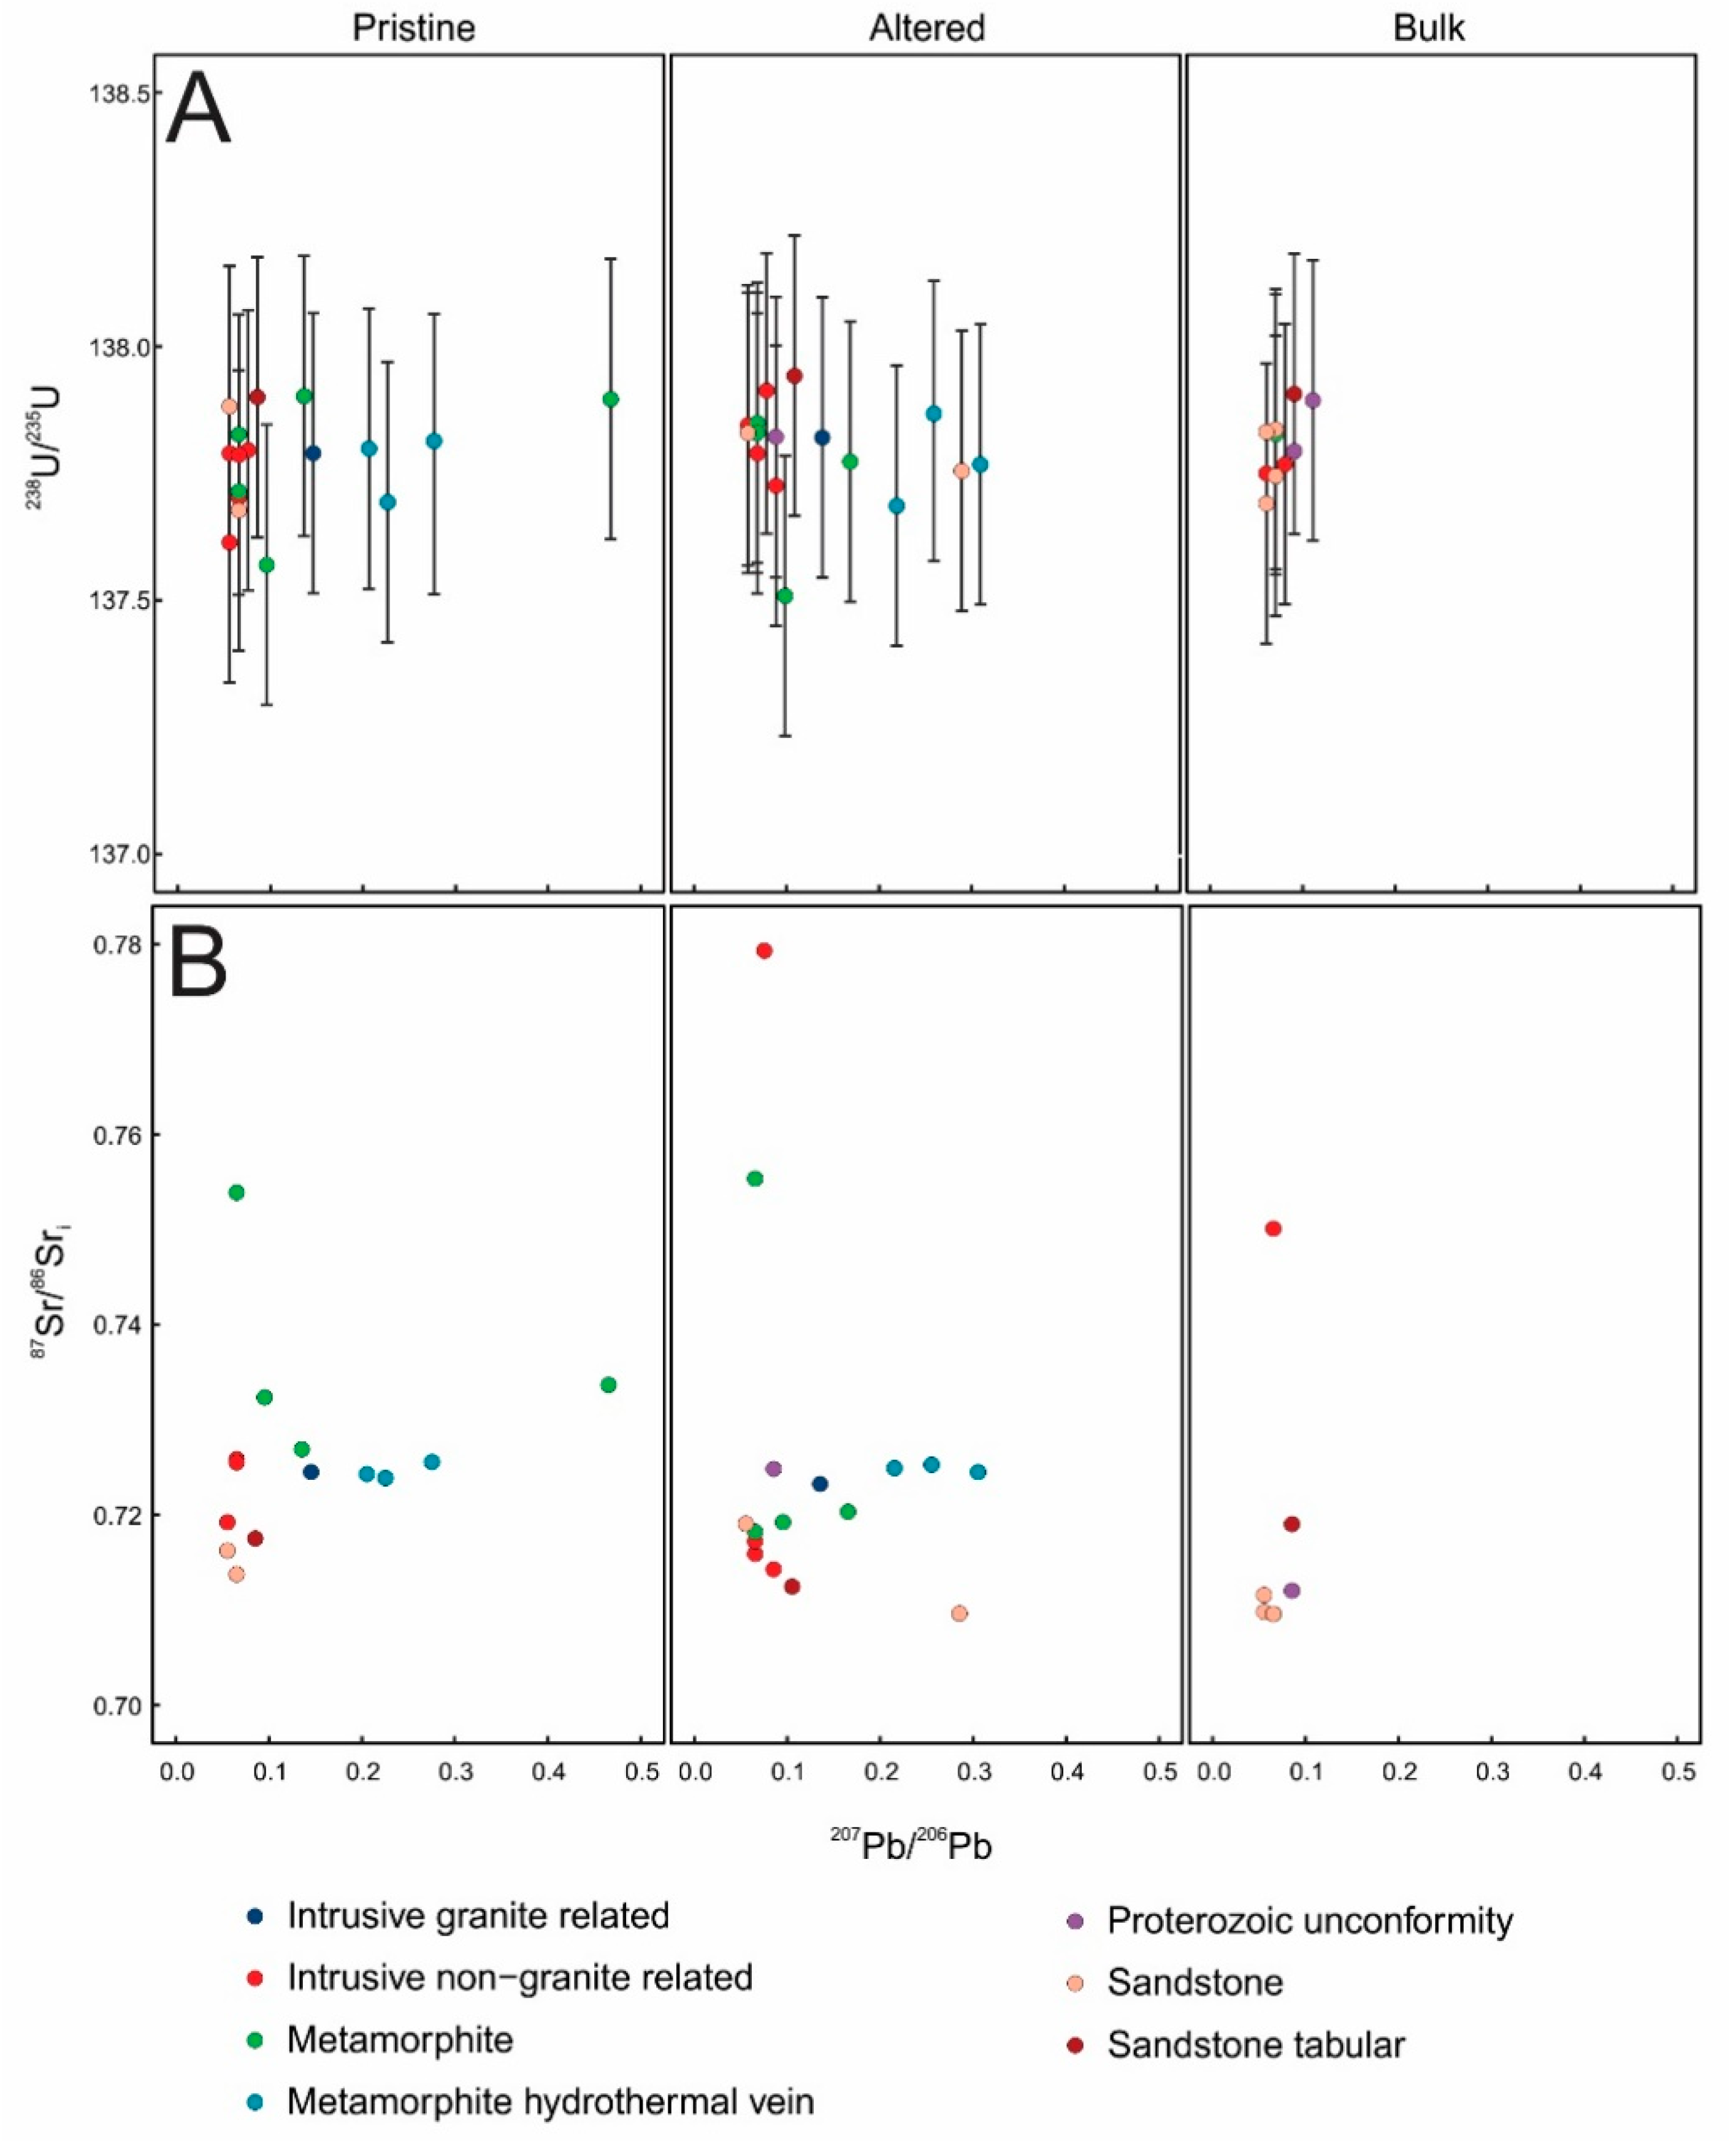
3.2. Radiogenic Isotopes

The Sr, Pb, and U isotope compositions recorded for the uraninite samples investigated in this study are listed in Table S4 and shown in Figure 6. There is no clear, systematic variation between the geological setting and any of the three radiogenic isotope systems examined here. Unlike the previously discussed major and trace element concentrations, the U, Pb, and Sr isotopic data reported here were collected using bulk solution aliquots rather than in-situ methods (EMP or LA-ICP-MS), and thus this may have had the effect of averaging or eliminating discrete isotopic variations within individual samples. The total range for the 87Sr/86Sri values reported here is 0.70913 to 0.77885 (Table S4). The sandstone uraninite samples typically have a lower 87Sr/86Sri ratio (~0.71858), whereas the metamorphite hydrothermal vein samples all cluster around 0.72450. Both the intrusive non-granite-related and metamorphite samples define the largest range in 87Sr/86Sri ratios (0.71382 to 0.77885). These two uraninite types also have a large range in deposit ages (Table S4), however, there is no clear relationship between initial 87Sr/86Sri ratios and age of deposit (Figure S3). There also appears to be little change in the overall range in the initial 87Sr/86Sri ratios for both altered or pristine uraninite (Figure 6 and Figure S3).
The 207Pb/206Pb values for the samples studied here range between 0.05243 and 0.51904. The lower 207Pb/206Pb values (<0.100) are associated with the intrusive non-granite-related samples, sandstone, and sandstone tabular sample (with the exception of sample 1237; Table S4). As with their initial Sr compositions, the metamorphite uraninite samples record the largest range in 207Pb/206Pb compositions such that these cover the entire observed range. The 206Pb/204Pb and 207Pb/204Pb ratios also define a large range, 32–364450 and 16.7–27065, respectively. The 238U/235U compositions range from 137.502 to 137.934 (Figure 6). The lowest 238U/235U value is reported for a metamorphite sample, whereas the highest is for a sandstone tabular uraninite. However, based on the U isotope compositions reported here (Figure 6; Table S4), it is clear that these cannot be used as an effective tool for provenance determination within a nuclear forensic analysis.

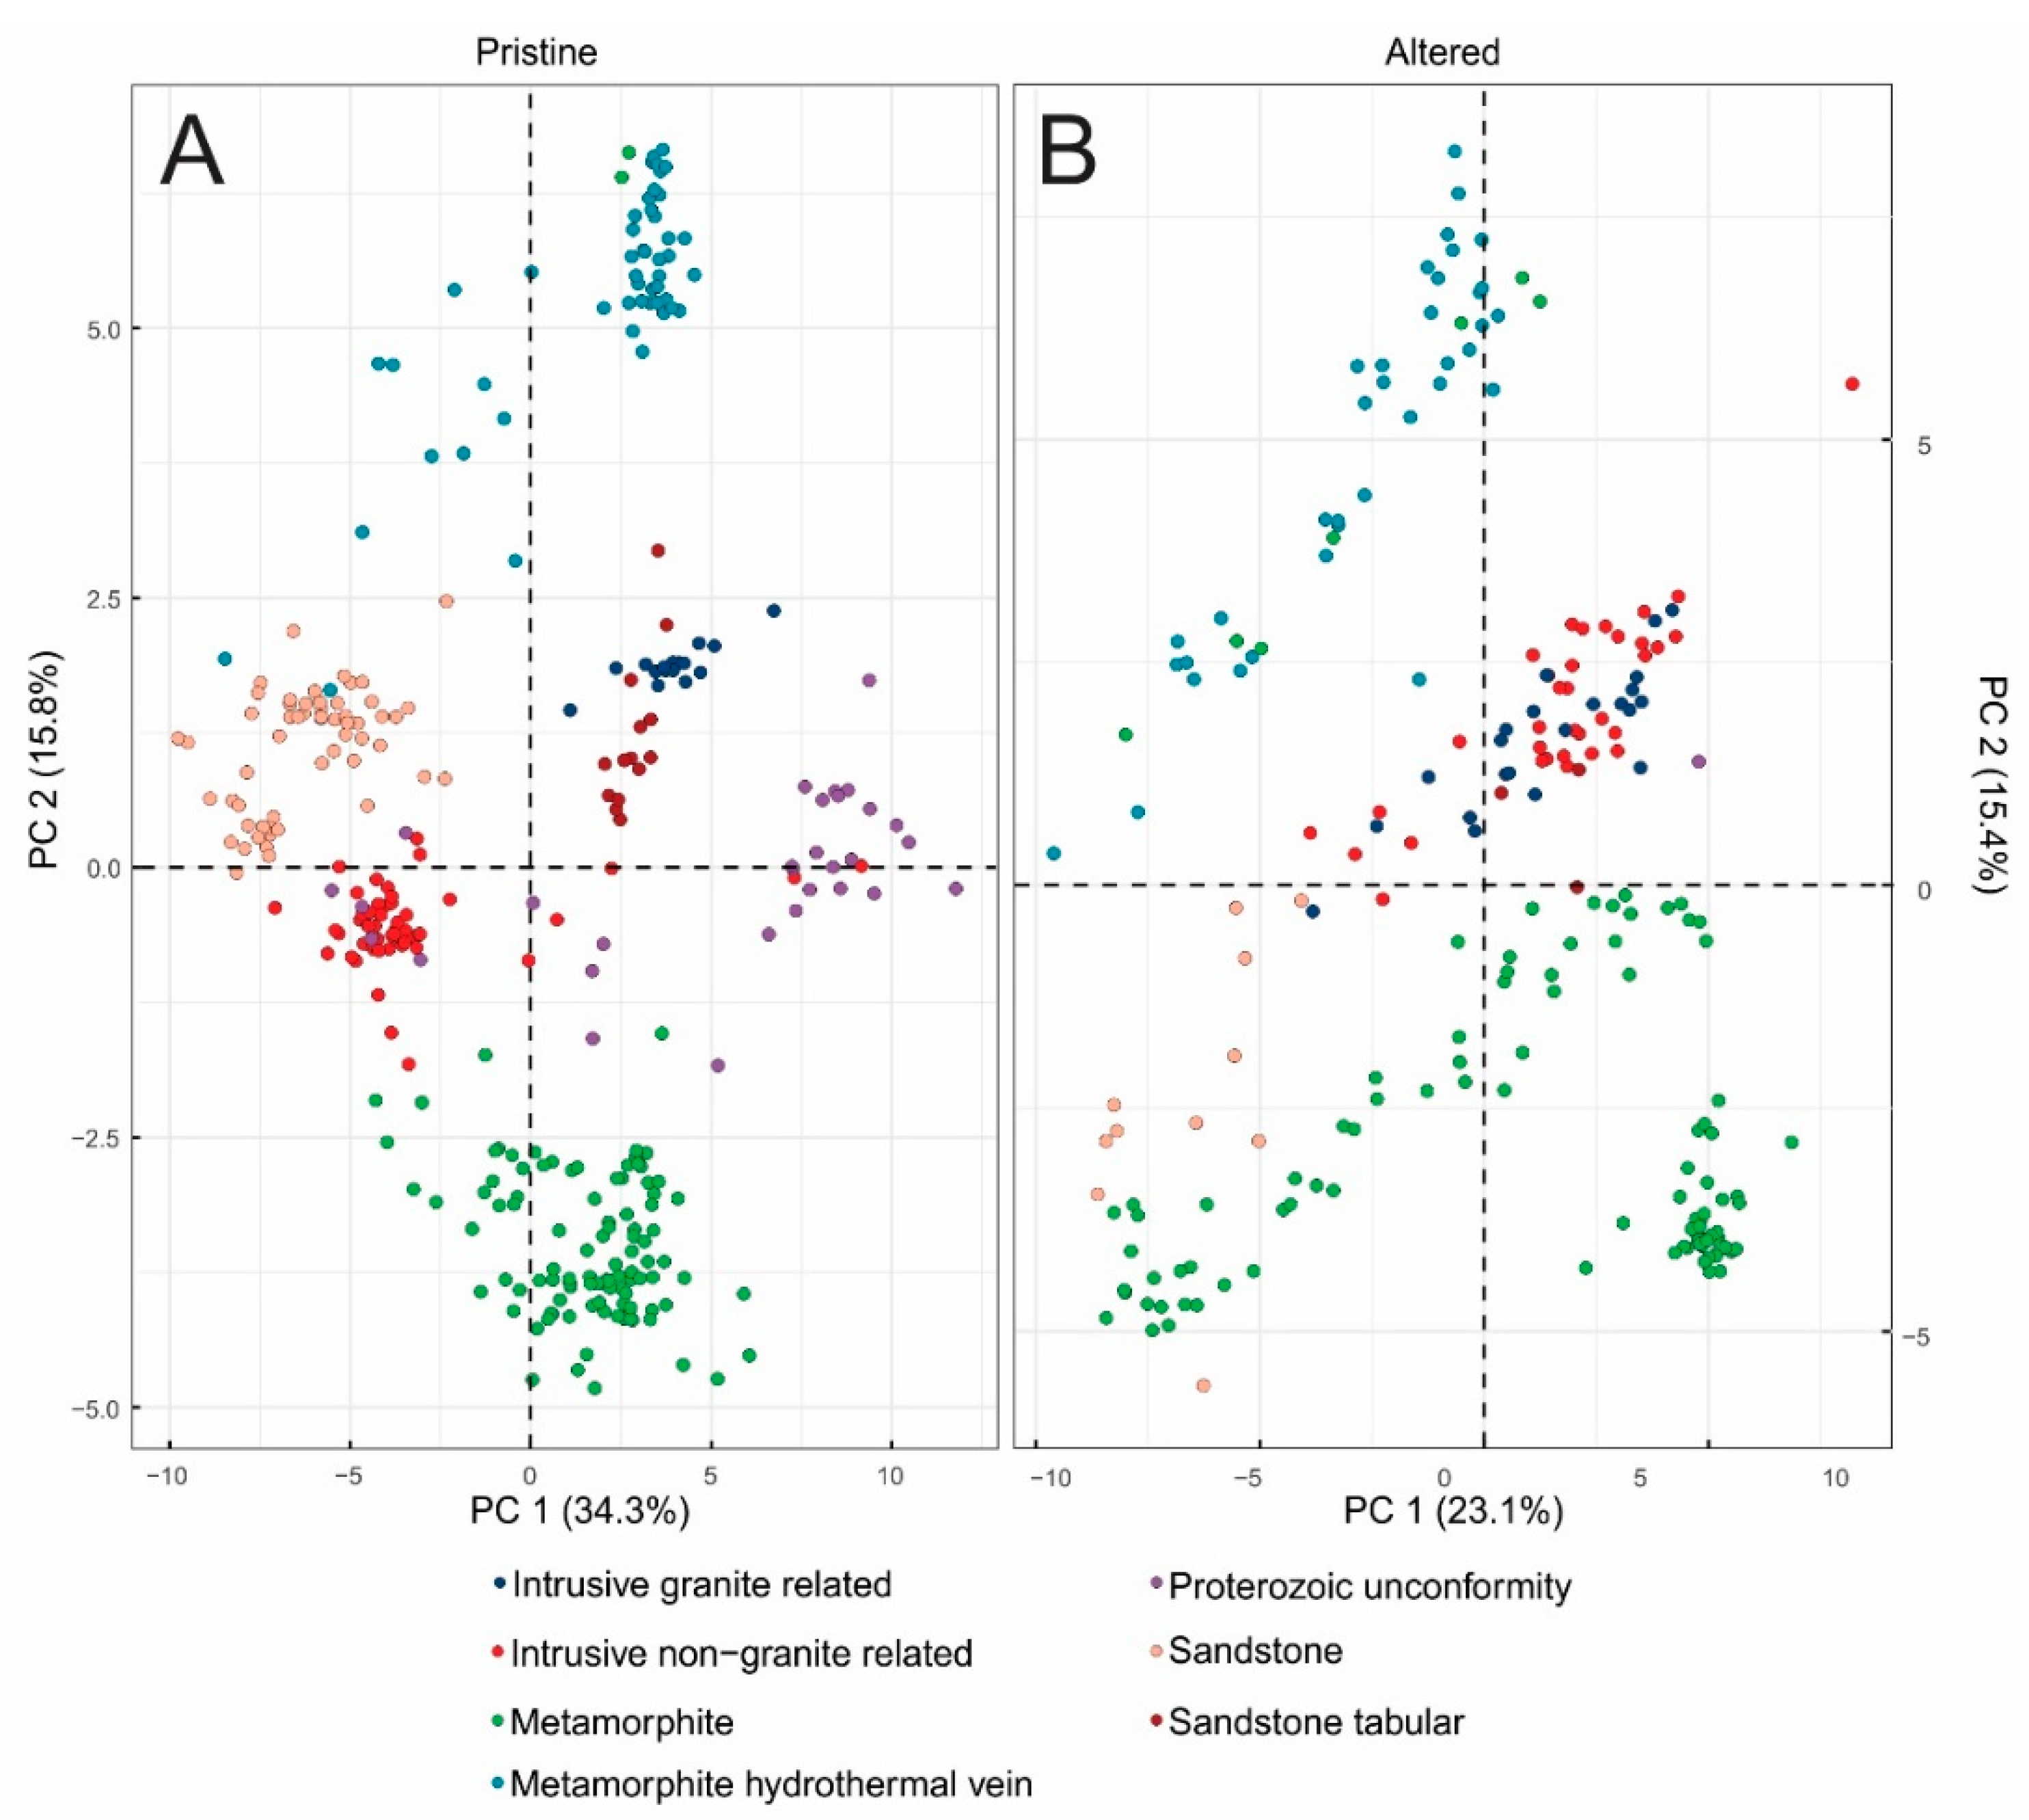
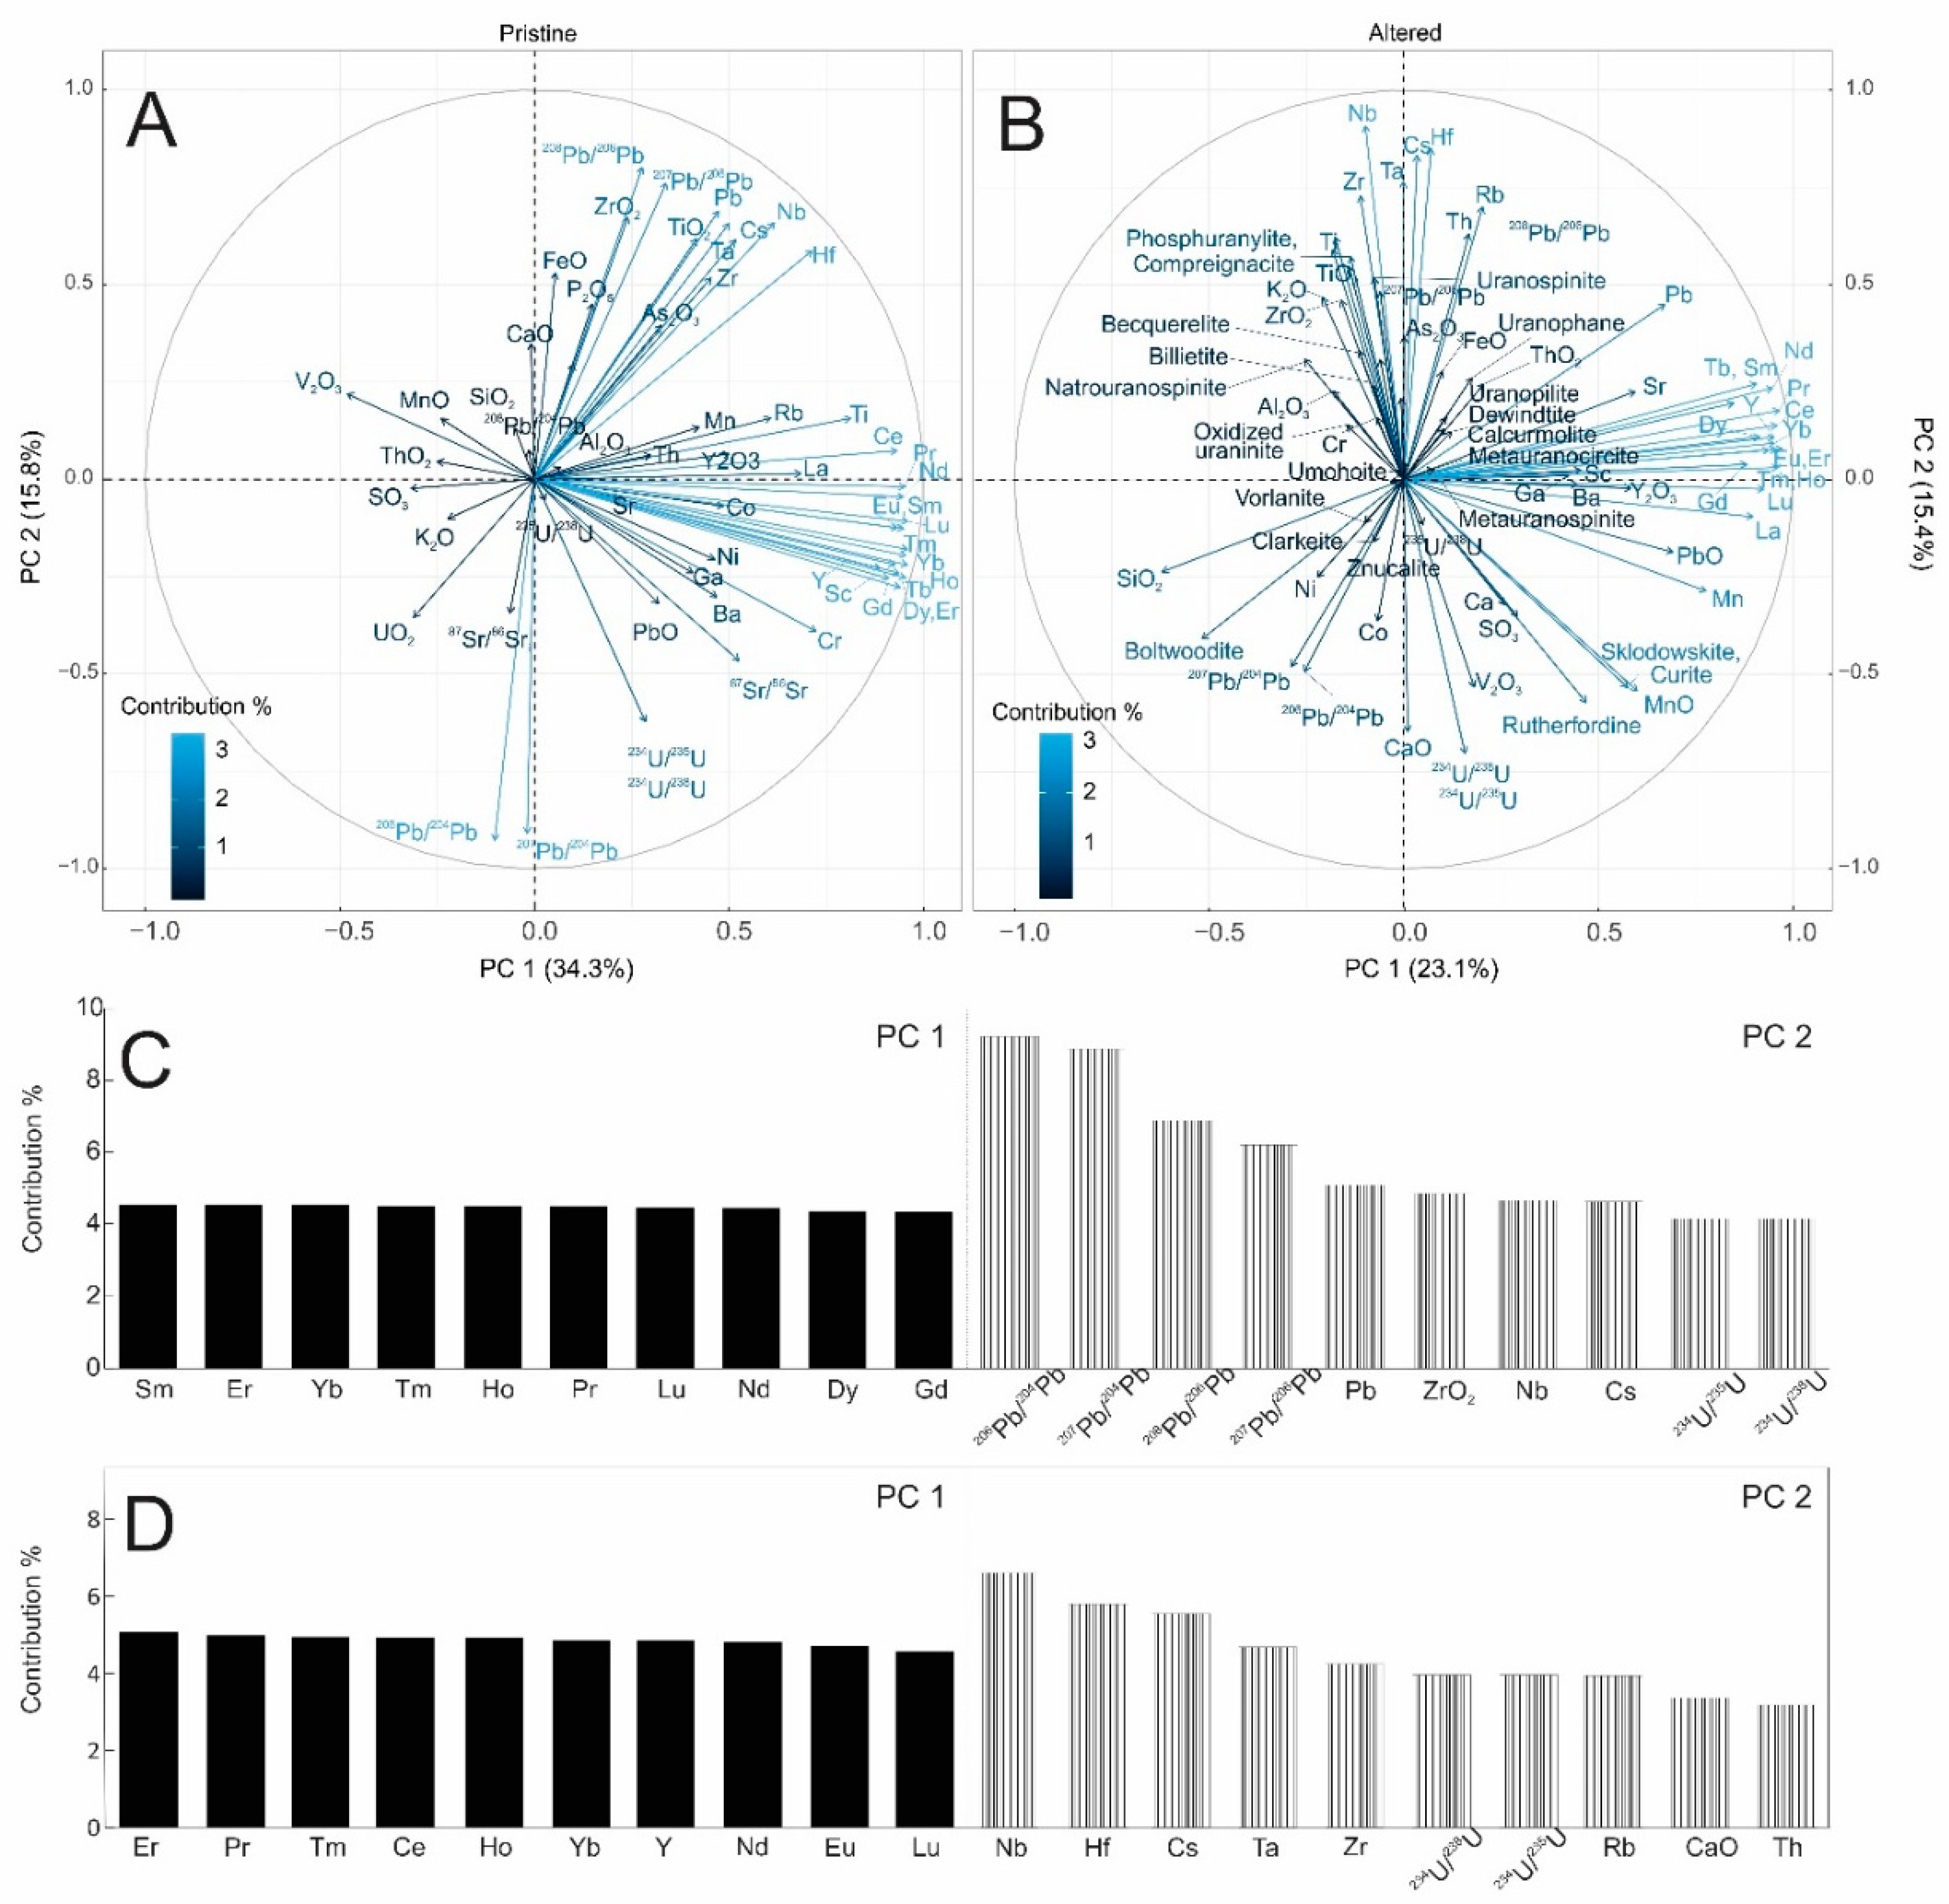
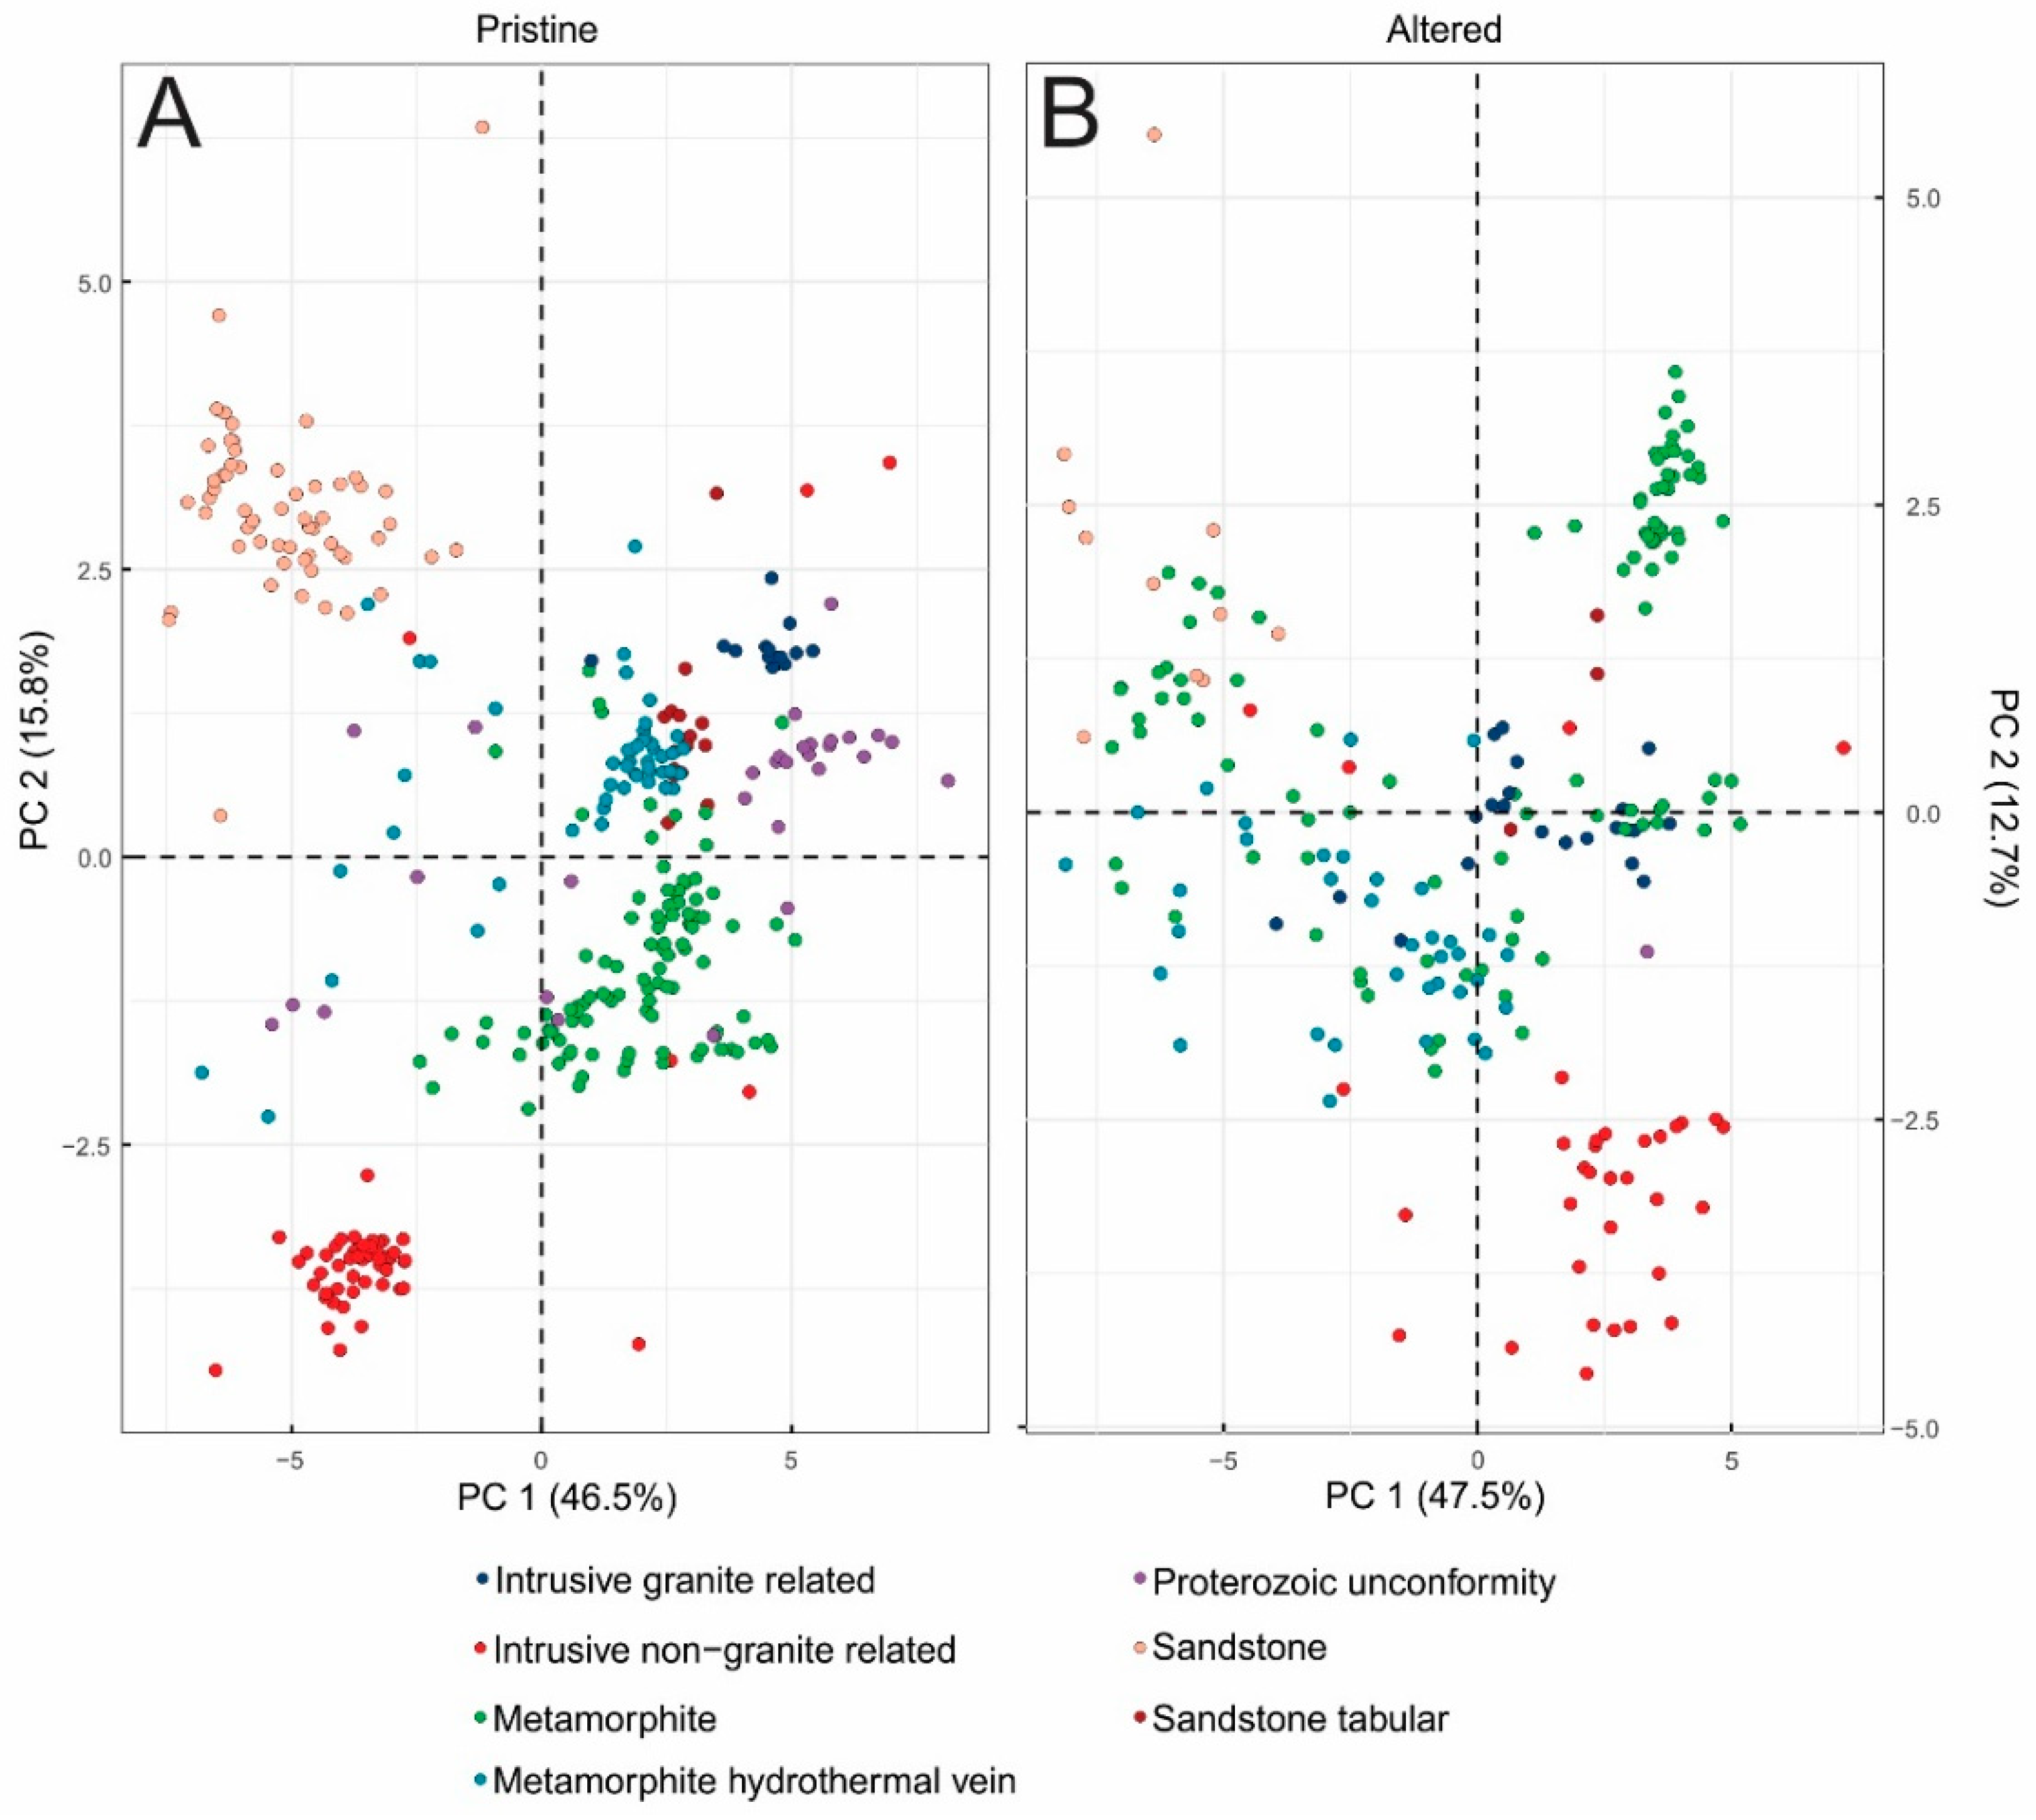
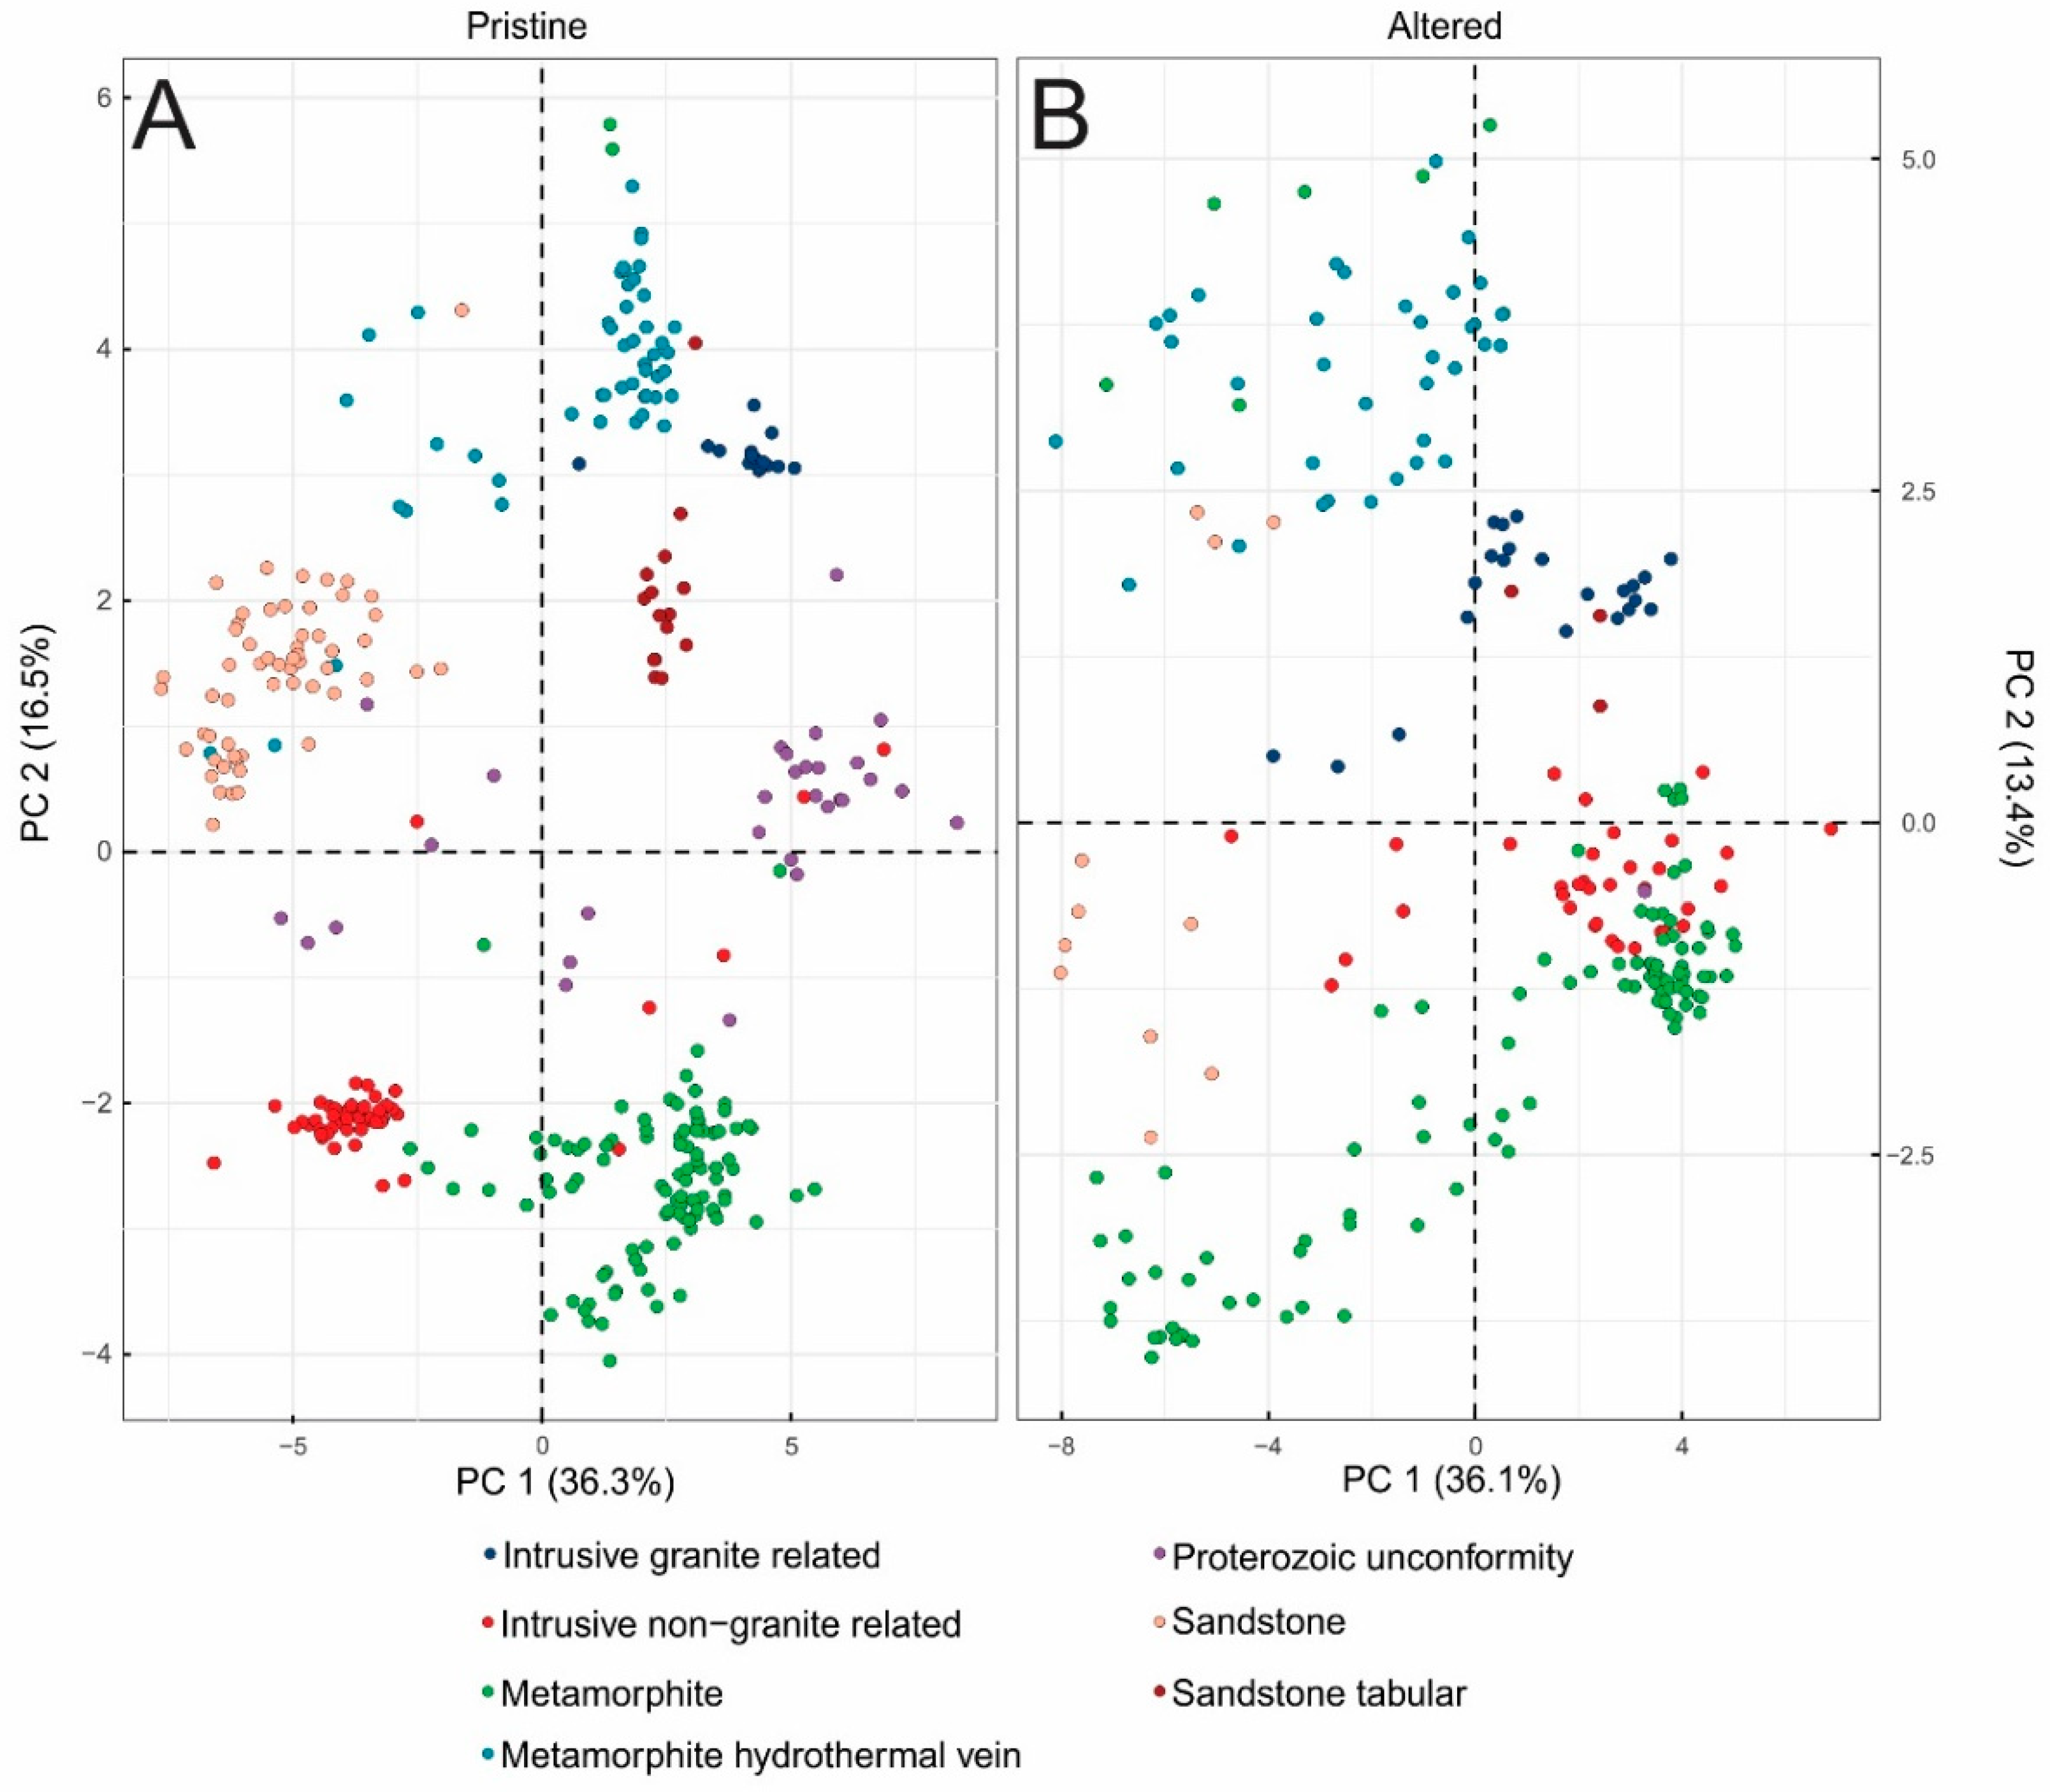
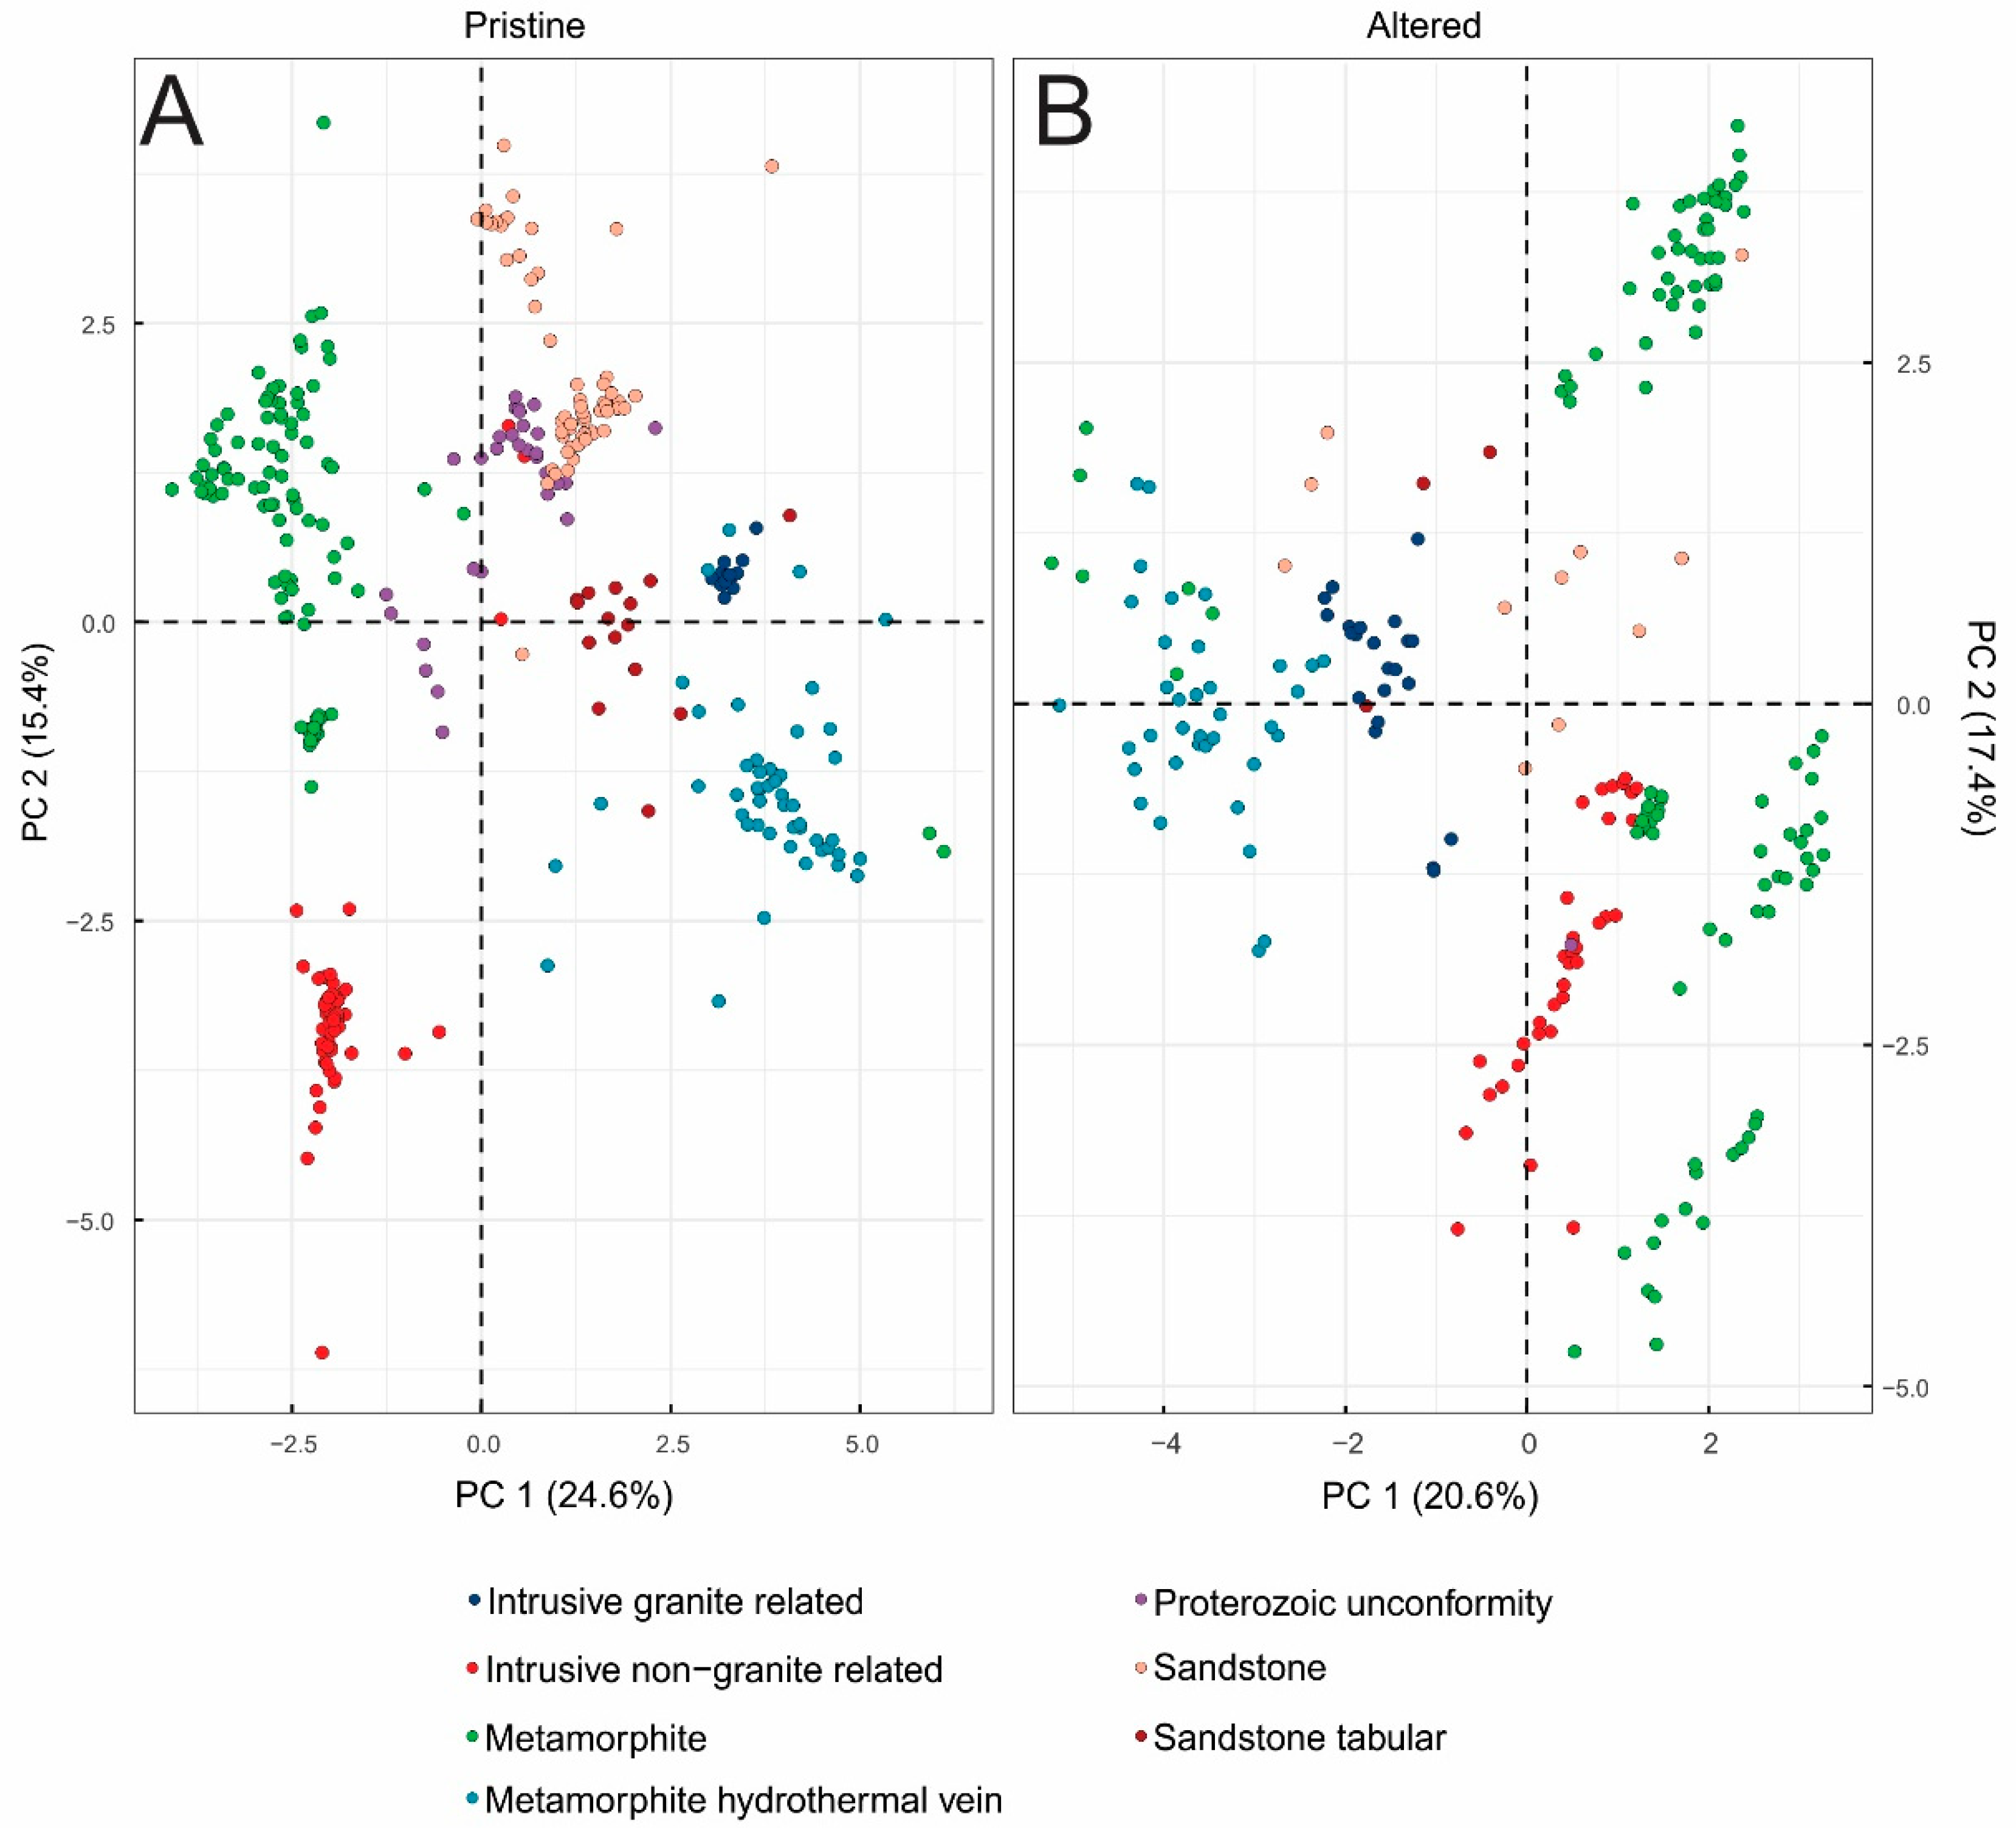
3.3. Principal Component Analysis (PCA) Results

Principal component analysis (PCA) was utilized to compare the data reported here as a whole rather than looking at any one particular trace element or isotopic signature. All variables (major, minor, trace, Sr, Pb, and U isotope ratios for both pristine and altered, and secondary minerals for the altered uraninite only) were used to produce the two PCA shown in Figure 7. Using all variables, the sum of PC 1 and PC 2 explains 50.1% of the variance of the pristine areas and 38.5% of the variance within the altered samples (Figure 8 and Table S5). The PCA results shown in Figure 7 indicate that the pristine uraninite samples are readily grouped according to deposit types. Of particular note, the secondary mineral assemblage observed within the altered uraninite areas does not contribute significantly to the PCA since all secondary minerals account for <7% of the variance recorded in principal component one and <20% for principal component two (Table S5). The variables that influence each PCA in the altered samples are similar to the variables in the pristine samples, e.g., Nb, Hf, and Cs, as well as the REEs; however, the Pb isotopic composition has little to no influence (Figure 8). The metamorphite uraninite samples plots within the negative PC 2 field, which is controlled primarily by the uranium isotopic compositions, whereas the metamorphite hydrothermal vein samples all plots within the positive PC 2 field (Nb, Hf, Cs, Ta, and Zr). Both metamorphite and metamorphite hydrothermal vein samples span the range of PC 1, which is similar to the pristine samples and is controlled primarily by the REE signatures.
The PCA based solely on the major element abundances (EMP analysis) and the REE data (LA-ICP-MS) is shown in Figure 9. Using solely these variables results in the largest proportion of variance being accounted for (sum of PC 1 and PC 2) within the samples with pristine = 62.3% and altered = 60.2%. However, the grouping for the pristine samples is not as well defined as when based on all the variables (Figure 7). The intrusive non-granite-related samples plot in both negative PC 1 and PC 2, which is controlled by the U, Th, S, and K abundances (Figure S4 and Table S5). In contrast, sandstone samples plot in the negative PC 1 and positive PC 2 space, which is defined by V and Mn concentrations (Figure S4 and Table S5). The other sample types do form groups; however, they are all controlled by their REE compositions, which results in their proximal location on the PCA plots Figure 9 and Figure S4). The altered intrusive non-granite-related samples are the only deposit type that is clearly separated within the altered samples, primarily due to the variation recorded in their ThO2 concentrations (Figure 9 and Figure S4).
If the isotopic compositions (Sr, Pb, and U) are combined with the major and REE contents, this combination produces a PCA plot that accounts for 52.8% and 49.5% of the variance for pristine and altered samples, respectively (Figure 10 and Figure S5). Using this combination of input variables (EMP, REE, and Sr, Pb, and U isotopic compositions) results in clear and distinct groupings of all deposit types for the pristine samples. Similar to the previous PCA, the various altered uraninite deposit types do cluster, however, there is a large range observed for each group, i.e., different deposit types overlap each other (Figure 10).
Lastly, the PCA illustrated in Figure 11 is based on the major element abundances and the U, Pb, and Sr isotopic compositions. This accounts for the least amount of variance of 40% and 38% for pristine and altered samples, respectively. However, the pristine samples still form distinct groups. The intrusive non-granite related deposit types are controlled by their K, Th, and S contents, whereas the metamorphite samples are dominated by their Pb isotopic compositions and Zr abundances (Figure 11 and Figure S6, Table S5). Some of the deposit types within the altered samples do form groups. For example, the metamorphite hydrothermal vein samples plot within the negative PC 1 and PC 2 fields. This distribution is controlled primarily by their Ti, Al, and Zr abundances. The sandstone deposit uraninite types are also separated from the remaining samples, however, their range is quite large and does not form a tight grouping (Figure 11). The apparent groupings observed using major element abundances in Figure 11 suggest that with a larger dataset, PCA may be useful for the separation of various geological settings that have undergone alteration.

4. Conclusions

The principal component analyses reported here demonstrate the usefulness of this statistical approach to a multivariate dataset involving nuclear samples. PCA has allowed for all seven uraninite deposit types to form discrete groups for pristine uraninite samples. The combination of major element abundances, rare earth element concentrations, and Sr, Pb, and U isotopic compositions as variables in PCA results in >50% of the variance being accounted for with PC 1 and PC 2, and clearly separates the various groups from each other. Hence, this outcome confirms the potential value of the PCA approach for provenance determination of pristine nuclear materials. With regards to altered uraninite samples, additional data (e.g., major element abundances) are required in order to allow for meaningful interpretation of their geological origins.

Supplementary Materials

The following are available online at https://www.mdpi.com/2075-163X/9/9/537/s1, Figure S1: Chondrite normalized rare earth element composition of all samples (n = 23), Figure S2: XRF map of major elements (U, Pb, Si, Ca, Th, and Fe) for all 23 samples, Figure S3: Isotopic compositions (Table S3) of pristine, altered, and bulk solution aliquots as a function of their age, Figure S4: Variable contribution (%) to pristine and altered samples for PCA using EMP and REEs (Figure 9), Figure S5: Variable contribution (%) to pristine and altered samples for PCA using EMP, REEs, and Sr, Pb, and U isotopic compositions (Figure 10), Figure S6: Variable contribution (%) to pristine and altered samples for PCA using EMP and Sr, Pb, and U isotopic compositions (Figure 11), Table S1: Major element abundance (EMP), Table S2: Minor and trace element concentrations (LA-ICP-MS), Table S3: Secondary minerals identified by PXRD, Table S4: Sr, Pb, and U isotopic compositions, Table S5: Per cent contribution of each variable to the PCA plots in Figure 7, Figure 9, Figure 10, Figure 11.

Author Contributions

Conceptualization, A.S. and L.C.; Funding acquisition, A.S.; Investigation, L.C., T.L.S., L.R.S., C.D., and S.S.; Methodology, A.S., S.S., and L.C.; Resources, P.C.B., writing—original draft preparation, L.C. and A.S.; writing—review and editing, L.C., A.S., T.L.S., S.R.L., C.D., S.S., and P.C.B.

Funding

This research was funded by the United States Department of Homeland Security, grant number DHS-14-DN-077-191ARI-01.

Acknowledgments

The authors thank Ian Steele for his expertise with electron microprobe analysis and the Center of Environmental Science and Technology (CEST) at the University of Notre Dame for training and use of the µ-XRF. All uraninite samples were obtained from the Rod Ewing Mineral Collection, housed at the University of Notre Dame.

Conflicts of Interest

The authors declare no conflict of interest. The funders had no role in the design of the study; in the collection, analyses, or interpretation of data; in the writing of the manuscript, or in the decision to publish the results.

References

  1. International Atomic Energy Agency (2019). Incident and Trafficking Database (ITDB). Incidents of Nuclear and Other Radioactive Material Out of Regulatory Control. IAEA, 2019; p. 6. Available online: http://www-ns.iaea.org/downloads/security/itdb-fact-sheet.pdf (accessed on 23 May 2019).
  2. Balboni, E.; Jones, N.; Spano, T.; Simonetti, A.; Burns, P.C. Chemical and Sr isotopic characterization of North America uranium ores: Nuclear forensic applications. Appl. Geochem. 2016, 74, 24–32. [Google Scholar] [CrossRef] [Green Version]
  3. Varga, Z.; Wallenius, M. Analysis of uranium ore concentrates for origin assessment. Proc. Radiochem. Suppl. Radiochim. Acta 2011, 1, 27–30. [Google Scholar]
  4. Varga, Z.; Krajkó, J.; Peńkin, M.; Novák, M.; Eke, Z.; Wallenius, M.; Mayer, K. Identification of uranium signatures relevant for nuclear safeguards and forensics. J. Radioanal. Nucl. Chem. 2017, 312, 639–654. [Google Scholar] [CrossRef] [Green Version]
  5. Cuney, M. Evolution of uranium fractionation processes through time: Driving the secular variation of uranium deposit types. Econ. Geol. 2010, 105, 553–569. [Google Scholar] [CrossRef]
  6. Eglinger, A.; André-Mayer, A.S.; Vanderhaeghe, O.; Mercadier, J.; Cuney, M.; Decrée, S.; Feybesse, J.L.; Milesi, J.P. Geochemical signatures of uranium oxides in the Lufilian belt: From unconformity-related to syn-metamorphic uranium deposits during the Pan-African orogenic cycle. Ore Geol. Rev. 2013, 54, 197–213. [Google Scholar] [CrossRef]
  7. Frimmel, H.E.; Schedel, S.; Brätz, H. Uraninite chemistry as forensic tool for provenance analysis. Appl. Geochem. 2014, 48, 104–121. [Google Scholar] [CrossRef]
  8. Janeczek, J.; Ewing, R.C. Mechanisms of lead release from uraninite in the natural fission reactors in Gabon. Geochim. et Cosmochim. Acta 1995, 59, 1917–1931. [Google Scholar] [CrossRef]
  9. Keegan, E.; Richter, S.; Kelly, I.; Wong, H.; Gadd, P.; Kuehn, H.; Alonso-Munoz, A. The provenance of Australian uranium ore concentrates by elemental and isotopic analysis. Appl. Geochem. 2008, 23, 765–777. [Google Scholar] [CrossRef]
  10. Keegan, E.; Wallenius, M.; Mayer, K.; Varga, Z.; Rasmussen, G. Attribution of uranium ore concentrates using elemental and anionic data. Appl. Geochem. 2012, 27, 1600–1609. [Google Scholar] [CrossRef]
  11. Mercadier, J.; Cuney, M.; Cathelineau, M.; Lacorde, M. U redox fronts and kaolinisation in basement-hosted unconformity-related U ores of the Athabasca Basin (Canada): Late U remobilisation by meteoric fluids. Miner. Depos. 2011, 46, 105–135. [Google Scholar] [CrossRef]
  12. Spano, T.L.; Simonetti, A.; Wheeler, T.; Carpenter, G.; Freet, D.; Balboni, E.; Dorais, C.; Burns, P.C. A novel nuclear forensic tool involving deposit type normalized rare earth element signatures. Terra Nova 2017, 29, 294–350. [Google Scholar] [CrossRef]
  13. International Atomic Energy Agency. Geological Classification of Uranium Deposits and Description of Selected Examples, IAEA-TECDOC-1842; IAEA: Vienna, Austria, 2018. [Google Scholar]
  14. Alexandre, P.; Kyser, T.K. Effects of cationic substitutions and alteration in uraninite, and implications for the dating of uranium deposits. Can. Mineral. 2005, 43, 1005–1017. [Google Scholar] [CrossRef]
  15. Janeczek, J.; Ewing, R.C. Structural formula of uraninite. J. Nucl. Mater. 1992, 190, 128–132. [Google Scholar] [CrossRef]
  16. Plášil, J. Oxidation-hydration weathering of uraninite: The current state-of-knowledge. J. Geosci. 2014, 59, 99–114. [Google Scholar] [CrossRef]
  17. Balboni, E.; Simonetti, A.; Spano, T.; Cook, N.D.; Burns, P.C. Rare-earth element fractionation in uranium ore and its U(VI) alteration minerals. Appl. Geochem. 2017, 87, 84–92. [Google Scholar] [CrossRef]
  18. Alexandre, P.; Kyser, K.; Layton-Matthews, D.; Joy, B.; Uvarova, Y. Chemical compositions of natural uraninite. Can. Mineral. 2015, 53, 595–622. [Google Scholar] [CrossRef]
  19. Chen, S.; Grunsky, E.C.; Hattori, K.; Liu, Y. Principal Component Analysis of Geochemical Data from the REE-Rich Maw Zone, Athabasca Basin, Canada; Natural Resources Canada: Ottawa, ON, Canada, 2015. [Google Scholar]
  20. Jolliffe, I.T. Principal Component Analysis, 2nd ed.; Springer: Berlin, Germany, 2002. [Google Scholar]
  21. Brobst, D.A. Geology of the Spruce Pine District Avery, Mitchell, and Yancey Counties North Carolina; US Government Printing Office: Washington, DC, USA, 1962.
  22. Desbarats, A.J.; Percival, J.B.; Venance, K.E. Trace element mobility in mine waters from granitic pegmatite U-Th-REE deposits, Bancroft area, Ontario. Appl. Geochem. 2016, 67, 153–167. [Google Scholar] [CrossRef]
  23. Lewis, S.R.; Simonetti, A.; Corcoran, L.; Spano, T.L.; Chung, B.W.; Teslich, N.E.; Burns, P.C. Characterization of uraninite using a FIB–SEM approach and its implications for LA-ICP-MS analyses. J. Radioanal. Nucl. Chem. 2018, 318, 1389–1400. [Google Scholar] [CrossRef]
  24. Mawdsley, J. Uraninite-bearing deposits, Charlebois Lake area, northeastern Saskatchewan. Can. Inst. Mining Metall. Bull. 1952, 482, 366–375. [Google Scholar]
  25. Mckeough, M.A.; Lentz, D.R.; Brown, J.A. Geology and Associated Pegmatite- and Vein-hosted Uranium Mineralization of the Kulyk, Eagle, and Karin Lakes Regions, Wollaston Domain, Northern Saskatchewan. Sask. Geol. Surv. 2010, 2, 1–23. [Google Scholar]
  26. McKeough, M.A.; Lentz, D.R.; Mcfarlane, C.R.M.; Brown, J. Geology and evolution of pegmatite-hosted U-Th ± REE-Y-Nb mineralization, Kulyk, Eagle, and Karin Lakes region, Wollaston Domain, northern Saskatchewan, Canada: Examples of the dual role of extreme fractionation and hybridization processes. J. Geosci. 2013, 58, 321–346. [Google Scholar] [CrossRef]
  27. Decrée, S.; Deloule, É.; De Putter, T.; Dewaele, S.; Mees, F.; Yans, J.; Marignac, C. SIMS U-Pb dating of uranium mineralization in the Katanga Copperbelt: Constraints for the geodynamic context. Ore Geol. Rev. 2011, 40, 81–89. [Google Scholar] [CrossRef]
  28. Dahlkamp, F.J. The time related occurrence of uranium deposits. Miner. Depos. 1980, 15, 69–79. [Google Scholar] [CrossRef]
  29. Miller, R.G. The geochronology of uranium deposits in the Great Bear batholith, Northwest Territories. Can. J. Earth Sci. 1982, 19, 1428–1448. [Google Scholar] [CrossRef]
  30. Lewis, S.R. Geochemical and Isotopic Constraints for Uraninite Formation: Implications for Nuclear Forensic Analyses. Ph.D. Thesis, University of Notre Dame, Notre Dame, IN, USA, 2018. [Google Scholar]
  31. Deditius, A.P.; Utsunomiya, S.; Ewing, R.C. Fate of trace elements during alteration of uraninite in a hydrothermal vein-type U-deposit from Marshall Pass, Colorado, USA. Geochim. et Cosmochim. Acta 2007, 71, 4954–4973. [Google Scholar] [CrossRef]
  32. Hoeve, J.; Sibbald, T.I.I. On the Genesis of Rabbit Lake and Other Unconformity-type Uranium Deposits in Northern Saskatchewan, Canada. Econ. Geol. 1978, 73, 1450–1473. [Google Scholar] [CrossRef]
  33. Corey, A.S. Mineralogy and Petrology of the Uranium Deposits of Cane Springs Canyon, San Juan and Grand Counties, Utah; RME-128 (open-file report); US Atomic Energy Commission: Washington, DC, USA, 1959. [Google Scholar]
  34. Chenoweth, W.L. The Geology and Production History of the Uranium Deposits in the White Canyon Mining District, San Juan County, Utah; Utah Geological Survey: Salt Lake City, UT, USA, 1993. [Google Scholar]
  35. Trites, A.F.; Chew, I.I.I.R. Geology of the Happy Jack Mine White Canyon Area San Juan County, Utah; 1009-H (open-file report); United States. Government Printing Office: Washington, DC, USA, 1955.
  36. Belluci, J.J.; Simonetti, A.; Koeman, E.C.; Wallace, C.; Burns, P.C. A detailed geochemical investigation of post-nuclear detonation trinitite glass at high spatial resolution: Delineating anthropogenic vs. natural components. Chem. Geol. 2014, 365, 69–86. [Google Scholar] [CrossRef]
  37. Donohue, P.H.; Simonetti, A.; Neal, C.R. Chemical Characterisation of Natural Ilmenite: A Possible New Reference Material. Geostand. Geoanalytical Res. 2011, 36, 61–73. [Google Scholar] [CrossRef]
  38. Schurr, M.R.; Donohue, P.H.; Simonetti, A.; Dawson, E.L. Multi-element and lead isotope characterization of early nineteenth century pottery sherds from Native American and Euro-American sites. J. Archaeol. Sci. Rep. 2018, 20, 390–399. [Google Scholar] [CrossRef]
  39. Simonetti, A.; Neal, C. In-situ chemical, U-Pb dating, and Hf isotope investigation of megacrystic zircons, Malaita (Solomon Islands): Evidence for multi-stage alkaline magmatic activity beneath the Ontong Java Plateau. Earth Planet. Sci. Lett. 2010, 295, 251–261. [Google Scholar] [CrossRef]
  40. Pearce, N.J.G.; Perkins, W.T.; Westgate, J.A.; Gorton, M.P.; Jackson, S.E.; Neal, C.R.; Chenery, S.P. A compilation of new and published major and trace element data for NIST SRM 610 and NIST SRM 612 glass reference materials. Geostand Geoanal. Res. 1997, 21, 115–144. [Google Scholar] [CrossRef]
  41. Van Achterberg, E.; Ryan, C.; Jackson, S.; Griffin, W. Data reduction software for LA-ICP-MS. Laser Ablation ICP-MS. Earth Sci. 2001, 29, 239–243. [Google Scholar]
  42. Dustin, M.K.; Koeman, E.C.; Simonetti, A.; Torrano, Z.; Burns, P.C. Comparative investigation between in situ laser ablation versus bulk sample (solution mode) inductively coupled plasma mass spectrometry (ICP-MS) analysis of trinitite post-detonation materials. Appl. Spectrosc. 2016, 70, 1446–1455. [Google Scholar] [CrossRef]
  43. Jenner, G.A.; Longerich, H.P.; Jackson, S.E.; Fryer, B.J. ICP-MS—A powerful tool for high-precision trace-element analysis in Earth sciences: Evidence from analysis of selected U.S.G.S reference samples. Chem. Geol. 1990, 83, 133–148. [Google Scholar] [CrossRef]
  44. Manhes, G.; Minster, J.F.; Allègre, C.J. Comparative uranium-thorium-lead and rubidium-strontium study of the Saint Sèverin amphoterite: Consequences for early solar system chronology. Earth Planet Sci. Lett. 1978, 39, 14–24. [Google Scholar] [CrossRef]
  45. Simonetti, A.; Gariépy, C.; Banic, C.M.; Tanabe, R.; Wong, H.K. Pb isotopic investigation of aircraft-sampled emissions from the Horne smelter (Rouyn, Québec): Implications for atmospheric pollution in northeastern North America. Geochim. Cosmochim. Acta 2004, 68, 3285–3294. [Google Scholar] [CrossRef]
  46. Pollington, A.D.; Kinman, W.S.; Hanson, S.K.; Steiner, R.E.F. Polyatomic interferences on high precision uranium isotope ratio measurements by MC-ICP-MS: Applications to environmental sampling for nuclear safeguards. J. Radioanal. Nucl. Chem. 2015, 307, 2109–2115. [Google Scholar] [CrossRef]
  47. Crock, J.G.; Lichte, F.E.; Wildeman, T.R. The group separation of the rare-earth elements and yttrium from geologic materials by cation-exchange chromatography. Chem. Geol. 1984, 45, 149–163. [Google Scholar] [CrossRef]
  48. R Core Team. R: A Language and Environment for Statistical Computing. R Foundation for Statistical Computing. Vienna, Austria. Available online: https://www.r-project.org/ (accessed on 7 December 2017).
  49. Lê, S.; Josse, J.; Husson, F. FactoMineR: An R Package for Multivariate Analysis. J. Stat. Softw. 2008, 25, 1–18. [Google Scholar] [CrossRef]
  50. Wickham, H. Ggplots2: Elegant Graphics for Data Analysis; Springer-Verlag: New York, NY, USA, 2016. [Google Scholar]
  51. GGally: Extension to “ggplot2”. Available online: https://cran.r-project.org/package=GGally (accessed on 7 January 2018).
  52. ggsci: Scientific Journal and Sci-Fi Themed Color Palettes for “ggplot2”. 2018. Available online: https://cran.r-project.org/package=ggsci (accessed on 7 January 2018).
  53. Varga, Z.; Katona, R.; Stefánka, Z.; Wallenius, M.; Mayer, K.; Nicholl, A. Determination of rare-earth elements in uranium-bearing materials by inductively coupled plasma mass spectrometry. Talanta 2010, 80, 1744–1749. [Google Scholar] [CrossRef]
Figure 1. Sample image (A) and micro-XRF major element map (B) for Rabbit Lake uraninite (#511) illustrating typical compositional changes observed in samples investigated here (Tables S1 and S2). Line A to A’ demonstrates a typical transect that was chosen to investigate both pristine and altered sections of each sample.
Minerals 09 00537 g001
Figure 2. (A) Log–log Th (ppm) versus Pb (ppm) for both pristine (UO2 > 80 wt. %) and altered (UO2 70–80 wt. %) uraninite. (B) Log–log cation wt. % (SiO2 + FeO + CaO) and PbO (wt. %) for pristine and altered areas of the uraninite samples.
Minerals 09 00537 g002
Figure 3. (A) Log–log total rare earth element concentration (ppm) versus U/Th ratio for both pristine and altered portions of the uraninite samples. The temperature threshold limits are modified from Frimmel et al. [7] and Mercadier et al. [11]. (B) Log–log of the sum of REE (ppm) and the chondrite-normalized light over heavy rare earth element fractionation (LREE = La, Ce, Pr, Nd; HREE = Er, Tm, Yb, Lu) for both pristine and altered samples. The temperature threshold limit is modified from Mercadier et al. [11].
Minerals 09 00537 g003
Figure 4. (A) Log–log plot of total cation (wt. %; SiO2 + FeO + CaO) versus total REE (ppm) for pristine and altered uraninite samples. (B) Europium versus cerium anomaly. Eu/Eu* = EuCN/(SmCN + GdCN)0.5 and Ce/Ce* = 3*CeCN/(2*LaCN + NdCN) for pristine and altered uraninite samples.
Minerals 09 00537 g004
Figure 5. (A) Log–log plots of Hf (ppm) versus Mo (ppm) for pristine and altered uraninite samples and (B) Nb (ppm) versus Mo (ppm) for pristine and altered uraninite samples.
Minerals 09 00537 g005
Figure 6. (A) 238U/235U ratio versus 207Pb/206Pb ratio for pristine, altered, and bulk solution. (B) 87Sr/86Sr versus 207Pb/206Pb ratio for pristine, altered, and bulk solution. The error bars represent 2σ (relative standard deviation) for the given isotope ratio. The error bars for 207Pb/206Pb and 87Sr/86Sr are within the symbol size.
Minerals 09 00537 g006
Figure 7. Principal component analysis for (A) pristine and (B) altered uraninite samples using all variables; pristine and altered both use major (wt. %; Table S1), minor and trace (ppm; Table S2) abundances and Sr, Pb, and U isotopic compositions (Table S4). The altered PCA also uses the secondary minerals that were identified with PXRD (Table S3). Two principal component analyses were conducted; therefore, the PC 1 and PC 2 are different vectors for both the pristine and altered PCA.
Minerals 09 00537 g007
Figure 8. Variable contribution for (A) pristine and (B) altered principal component analysis using all variables (Figure 7). The % each variable contributes is illustrated by the length and color of the individual vector with the longer the vector and lighter the color, the more that particular vector (variable) influences either PC1 or PC2. The top 10 variables that contribute to PC 1 and PC 2 for pristine and altered are given in C and D, respectively (Table S5).
Minerals 09 00537 g008
Figure 9. Principal component analysis for (A) pristine and (B) altered uraninite samples using major elements (wt. %; Table S1) and rare earth element abundances (ppm; Table S2). Two principal component analyses were conducted; therefore, the PC 1 and PC 2 are different vectors for both the pristine and altered PCA.
Minerals 09 00537 g009
Figure 10. Principal component analysis for (A) pristine and (B) altered uraninite samples using major elements (wt. %; Table S1), REE abundances (ppm; Table S2) and the Sr, Pb, and U isotopic compositions (Table S4). Two principal component analyses were conducted; therefore, the PC 1 and PC 2 are different vectors for both the pristine and altered PCA.
Minerals 09 00537 g010
Figure 11. Principal component analysis for (A) pristine and (B) altered uraninite samples using major elements (wt. %; Table S1) and the Sr, Pb, and U isotopic compositions (Table S4). Two principal component analyses were conducted; therefore, the PC 1 and PC 2 are different vectors for both the pristine and altered PCA.
Minerals 09 00537 g011
Table 1. Location and deposit classification of uraninite samples (n = 23).
Sample Mine LocationStateCountryIAEA Classification
333Yancey CountyNorth CarolinaUSAIntrusive non-granite-related
334Mitchell County North CarolinaUSAIntrusive non-granite-related
338Mitchell County North CarolinaUSAIntrusive non-granite-related
340BancroftOntarioCanadaIntrusive non-granite-related
344Ruggles MineNew HampshireUSAIntrusive non-granite-related
348Foster LakeSaskatchewanCanadaIntrusive non-granite-related
353Happy Jack, San Juan CountyUtahUSASandstone tabular
423Great Bear LakeNorthern TerritoriesCanadaMetamorphite
437ShinkolobweKatangaD.R. CongoMetamorphite
511Rabbit LakeSaskatchewanCanadaProterozoic unconformity
516AustraliaNorthern TerritoriesAustraliaMetamorphite
522Billiken Lode, Jefferson CountyColoradoUSAMetamorphite
531Marshall Pass, Gunnison CountyColoradoUSAMetamorphite hydrothermal vein
564JachymovKarlovy VaryCzech RepublicIntrusive granite-related
604AustraliaNorthern TerritoriesAustraliaProterozoic unconformity
623Marshall PassColoradoUSAMetamorphite hydrothermal vein
626Echo Mine, Great Bear LakeNorthern TerritoriesCanadaMetamorphite
662ShinkolobweKatangaD.R. CongoMetamorphite
809Marshall PassColoradoUSAMetamorphite hydrothermal vein
1232Big Indian Wash UtahUSASandstone
1237Adair Mine, Cane Spring CanyonUtahUSASandstone
1262Adair Mine, Cane Spring CanyonUtahUSASandstone
1303Big Indian Wash UtahUSASandstone

