Identification of Novel Chemical Entities for Adenosine Receptor Type 2A Using Molecular Modeling Approaches

 ,
,  , , , , and
Abstract
: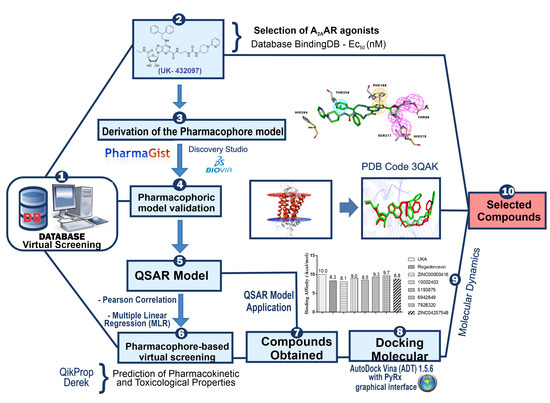
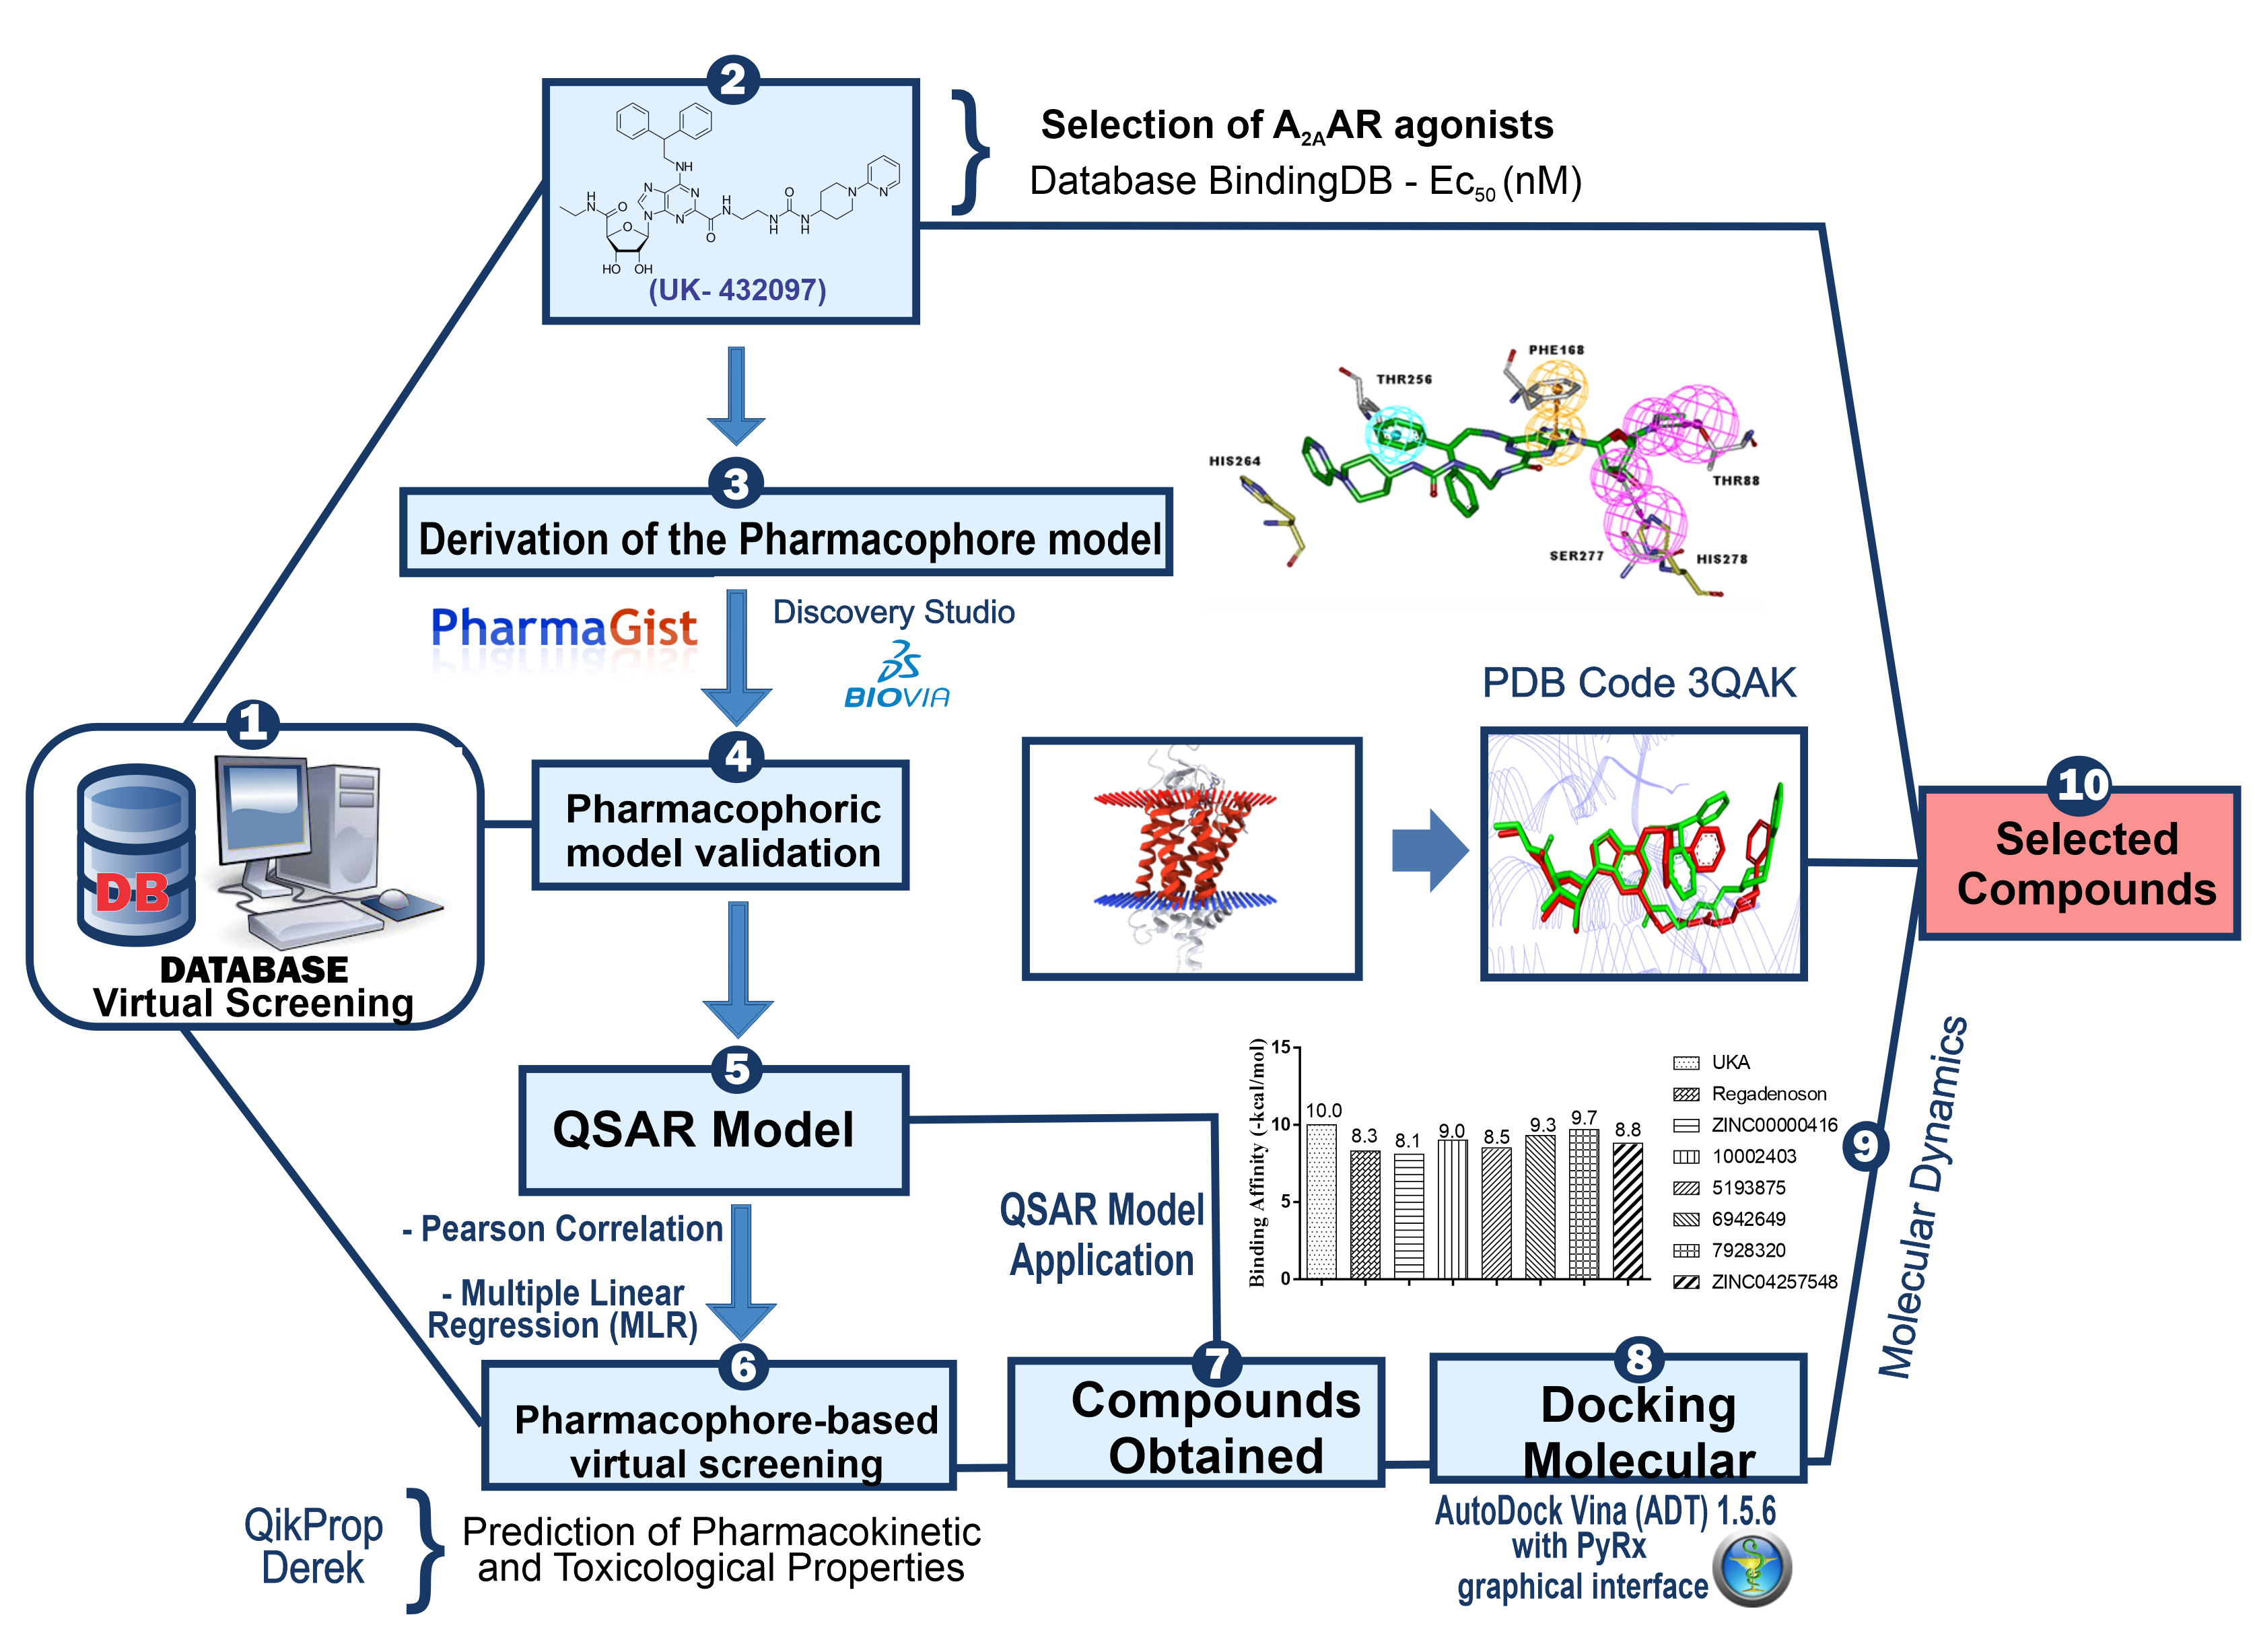
1. Introduction
2. Results and Discussions
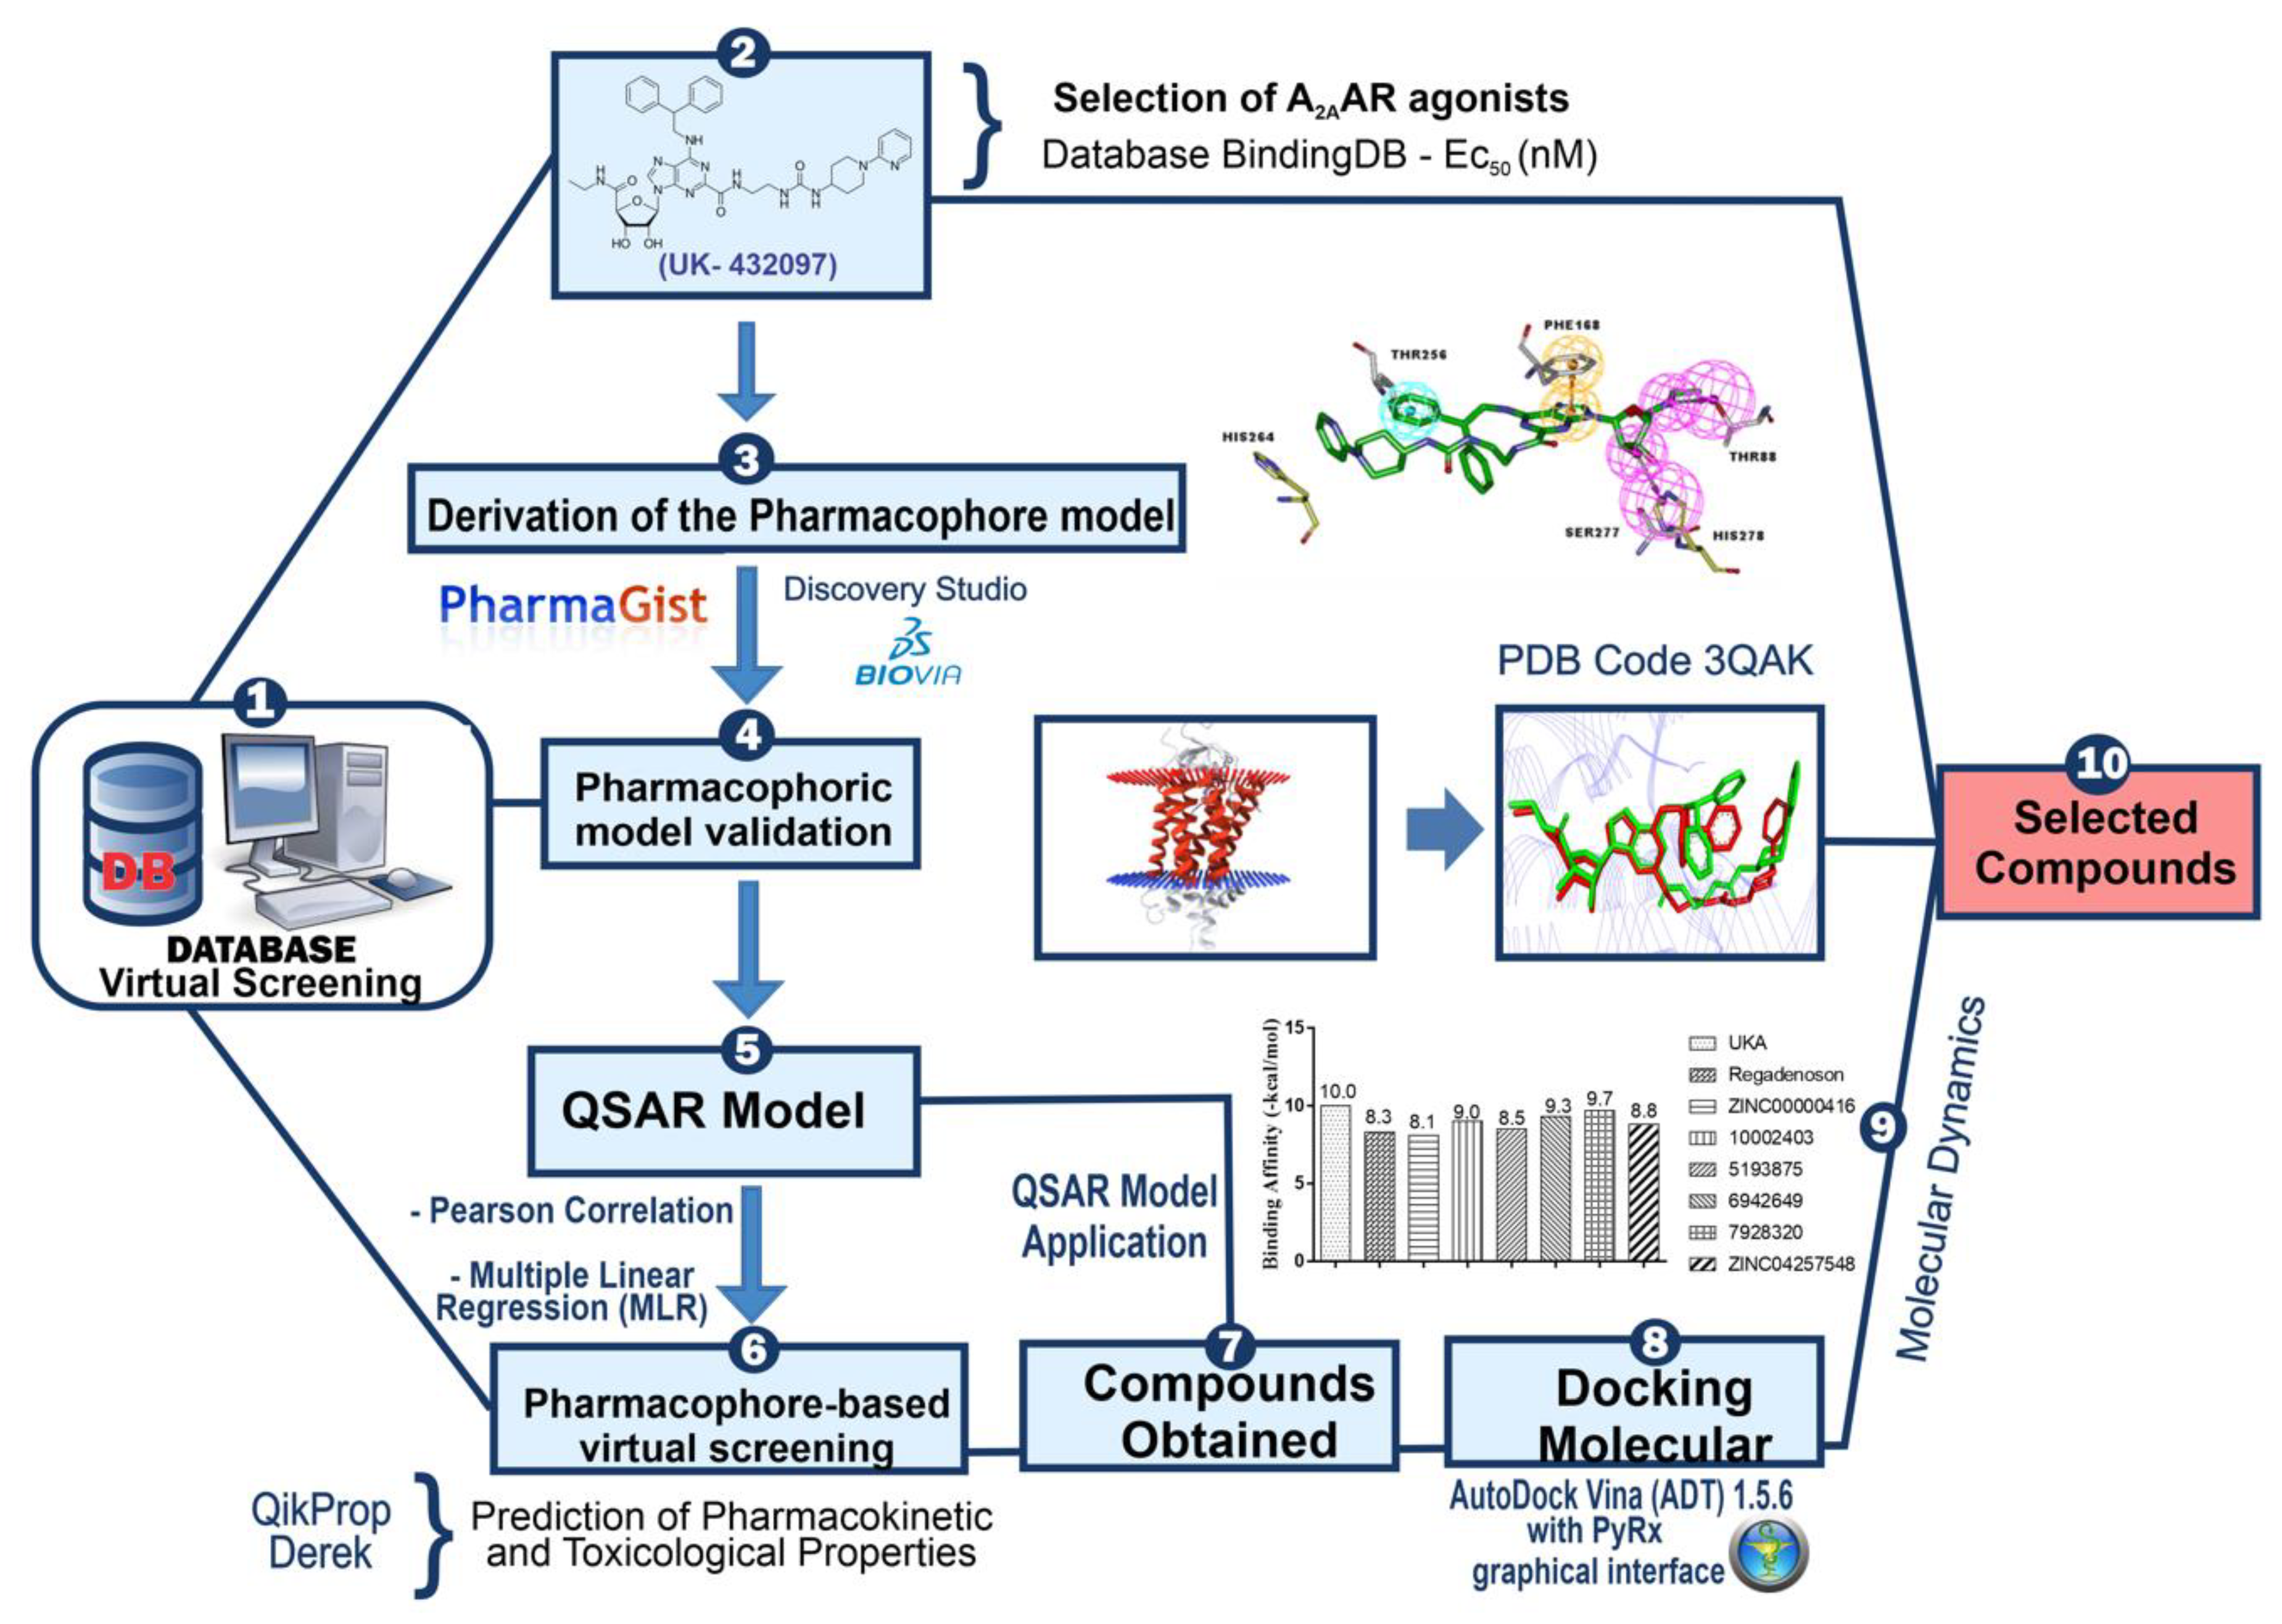
2.1. Pharmacophore Perception Using the PharmaGist and Discovery Studio Softwares
2.2. Pharmacophore Model Evaluation
2.3. QSAR Modeling Using Multiple Linear Regressions (MLR)
2.4. Tetraparametric Models
2.5. Pentaparametric Models
2.6. Hexaparametric Model
− 0.069166.(HG) + 0.120464.(AR)
2.7. Quantitative Structure–Activity Relationship (QSAR) Modeling—External Validation
2.8. Pharmacokinetic and Toxicological Predictions for the Compounds Obtained by Pharmacophore-Based Virtual Screening Approaches
2.9. Application of QSAR Model for Compounds Selected by Virtual Screening Approaches
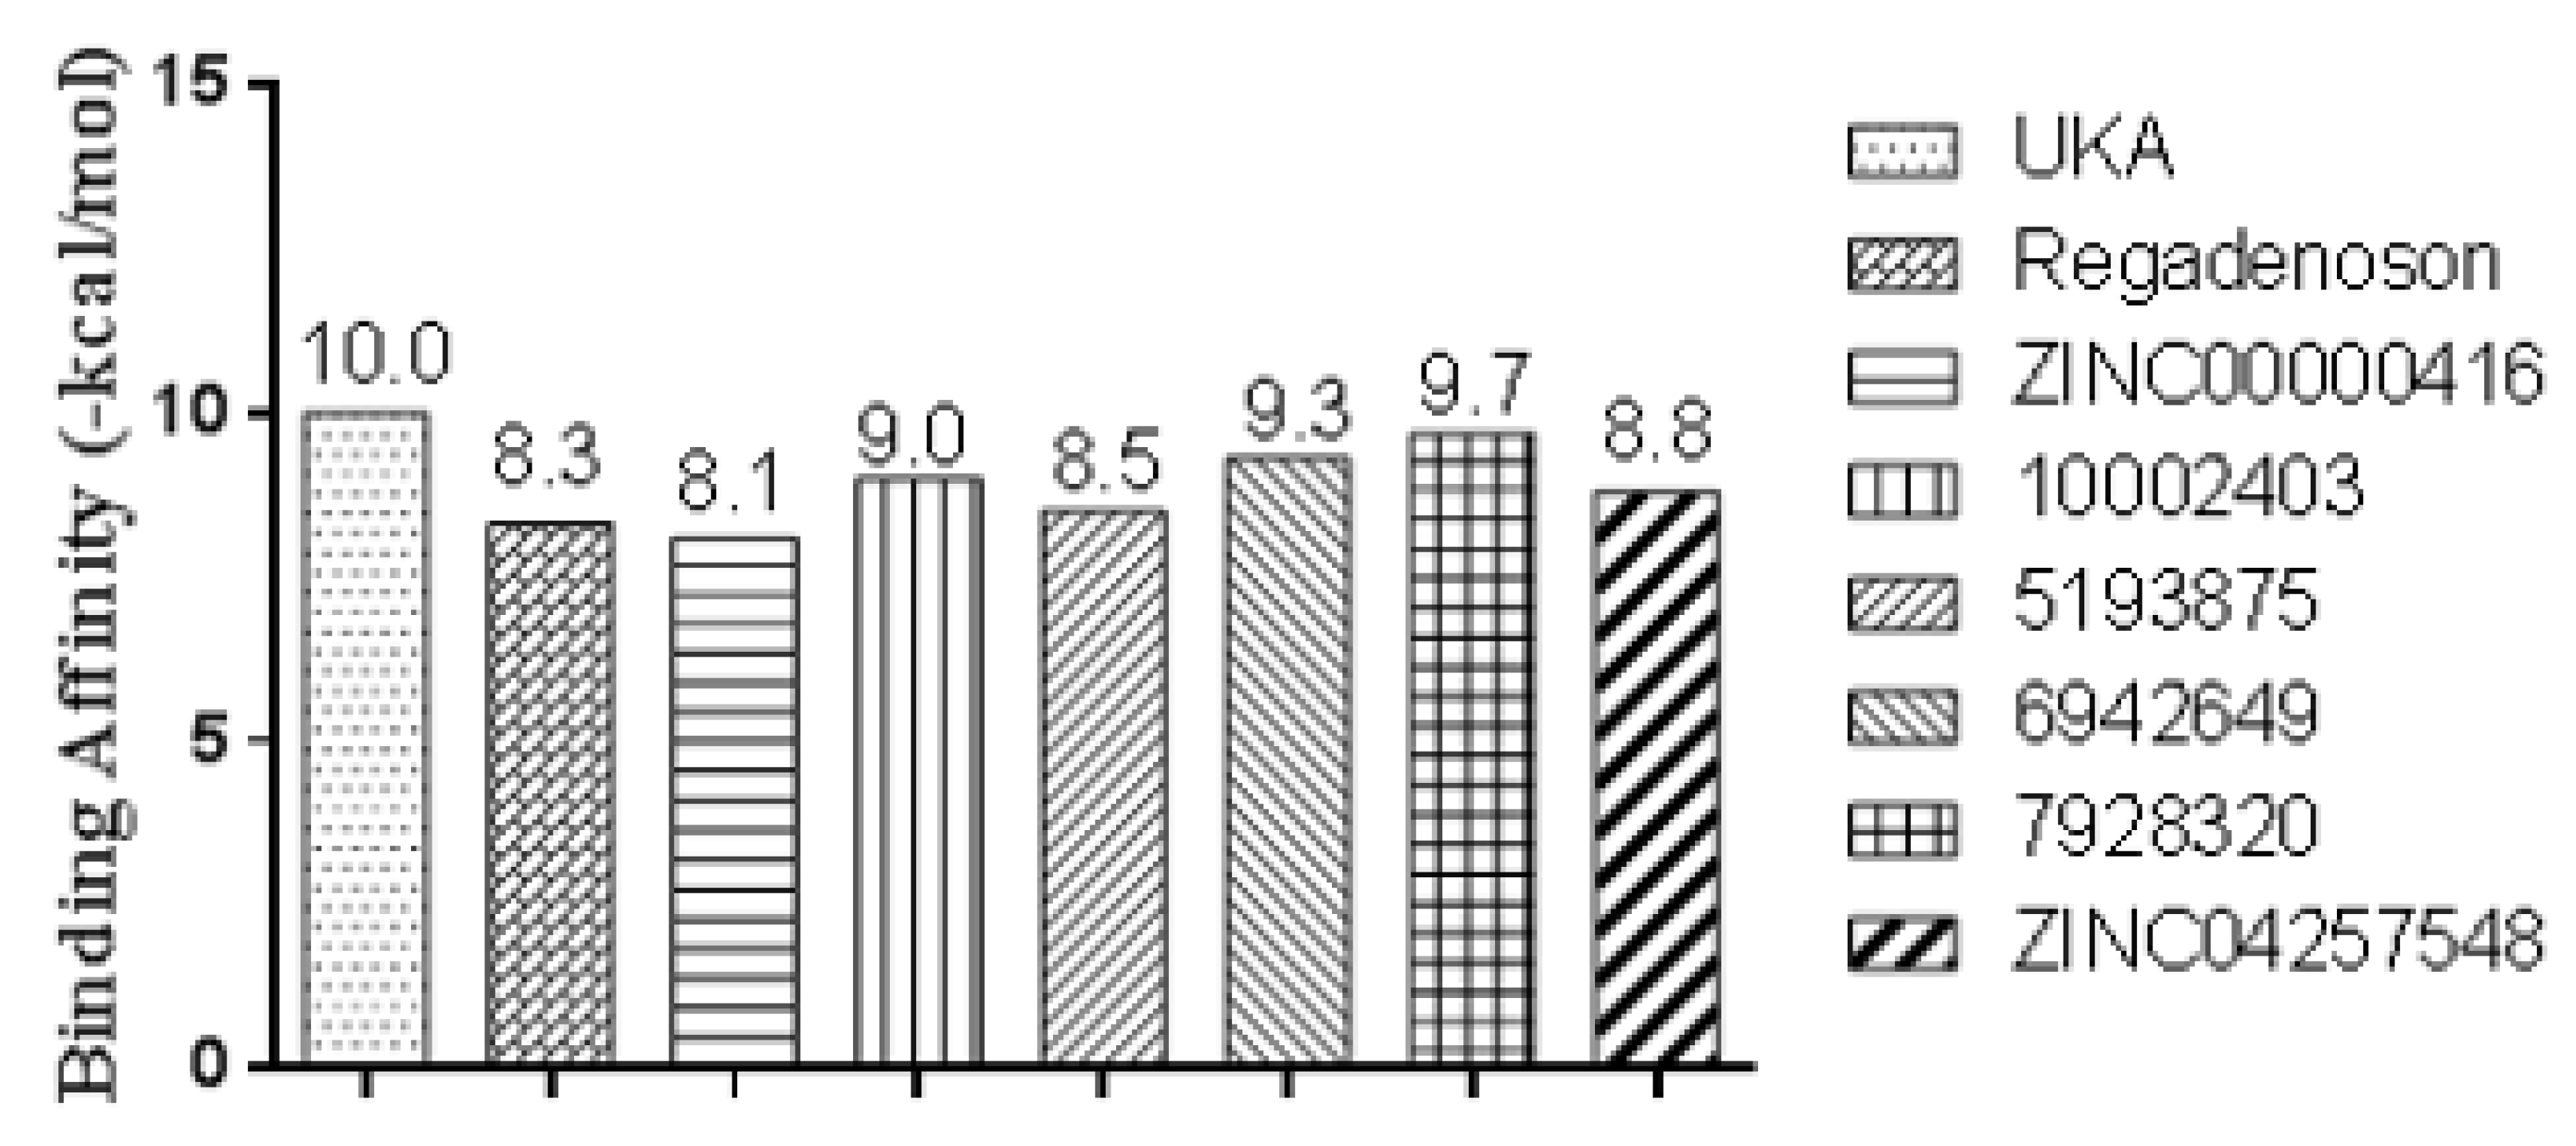
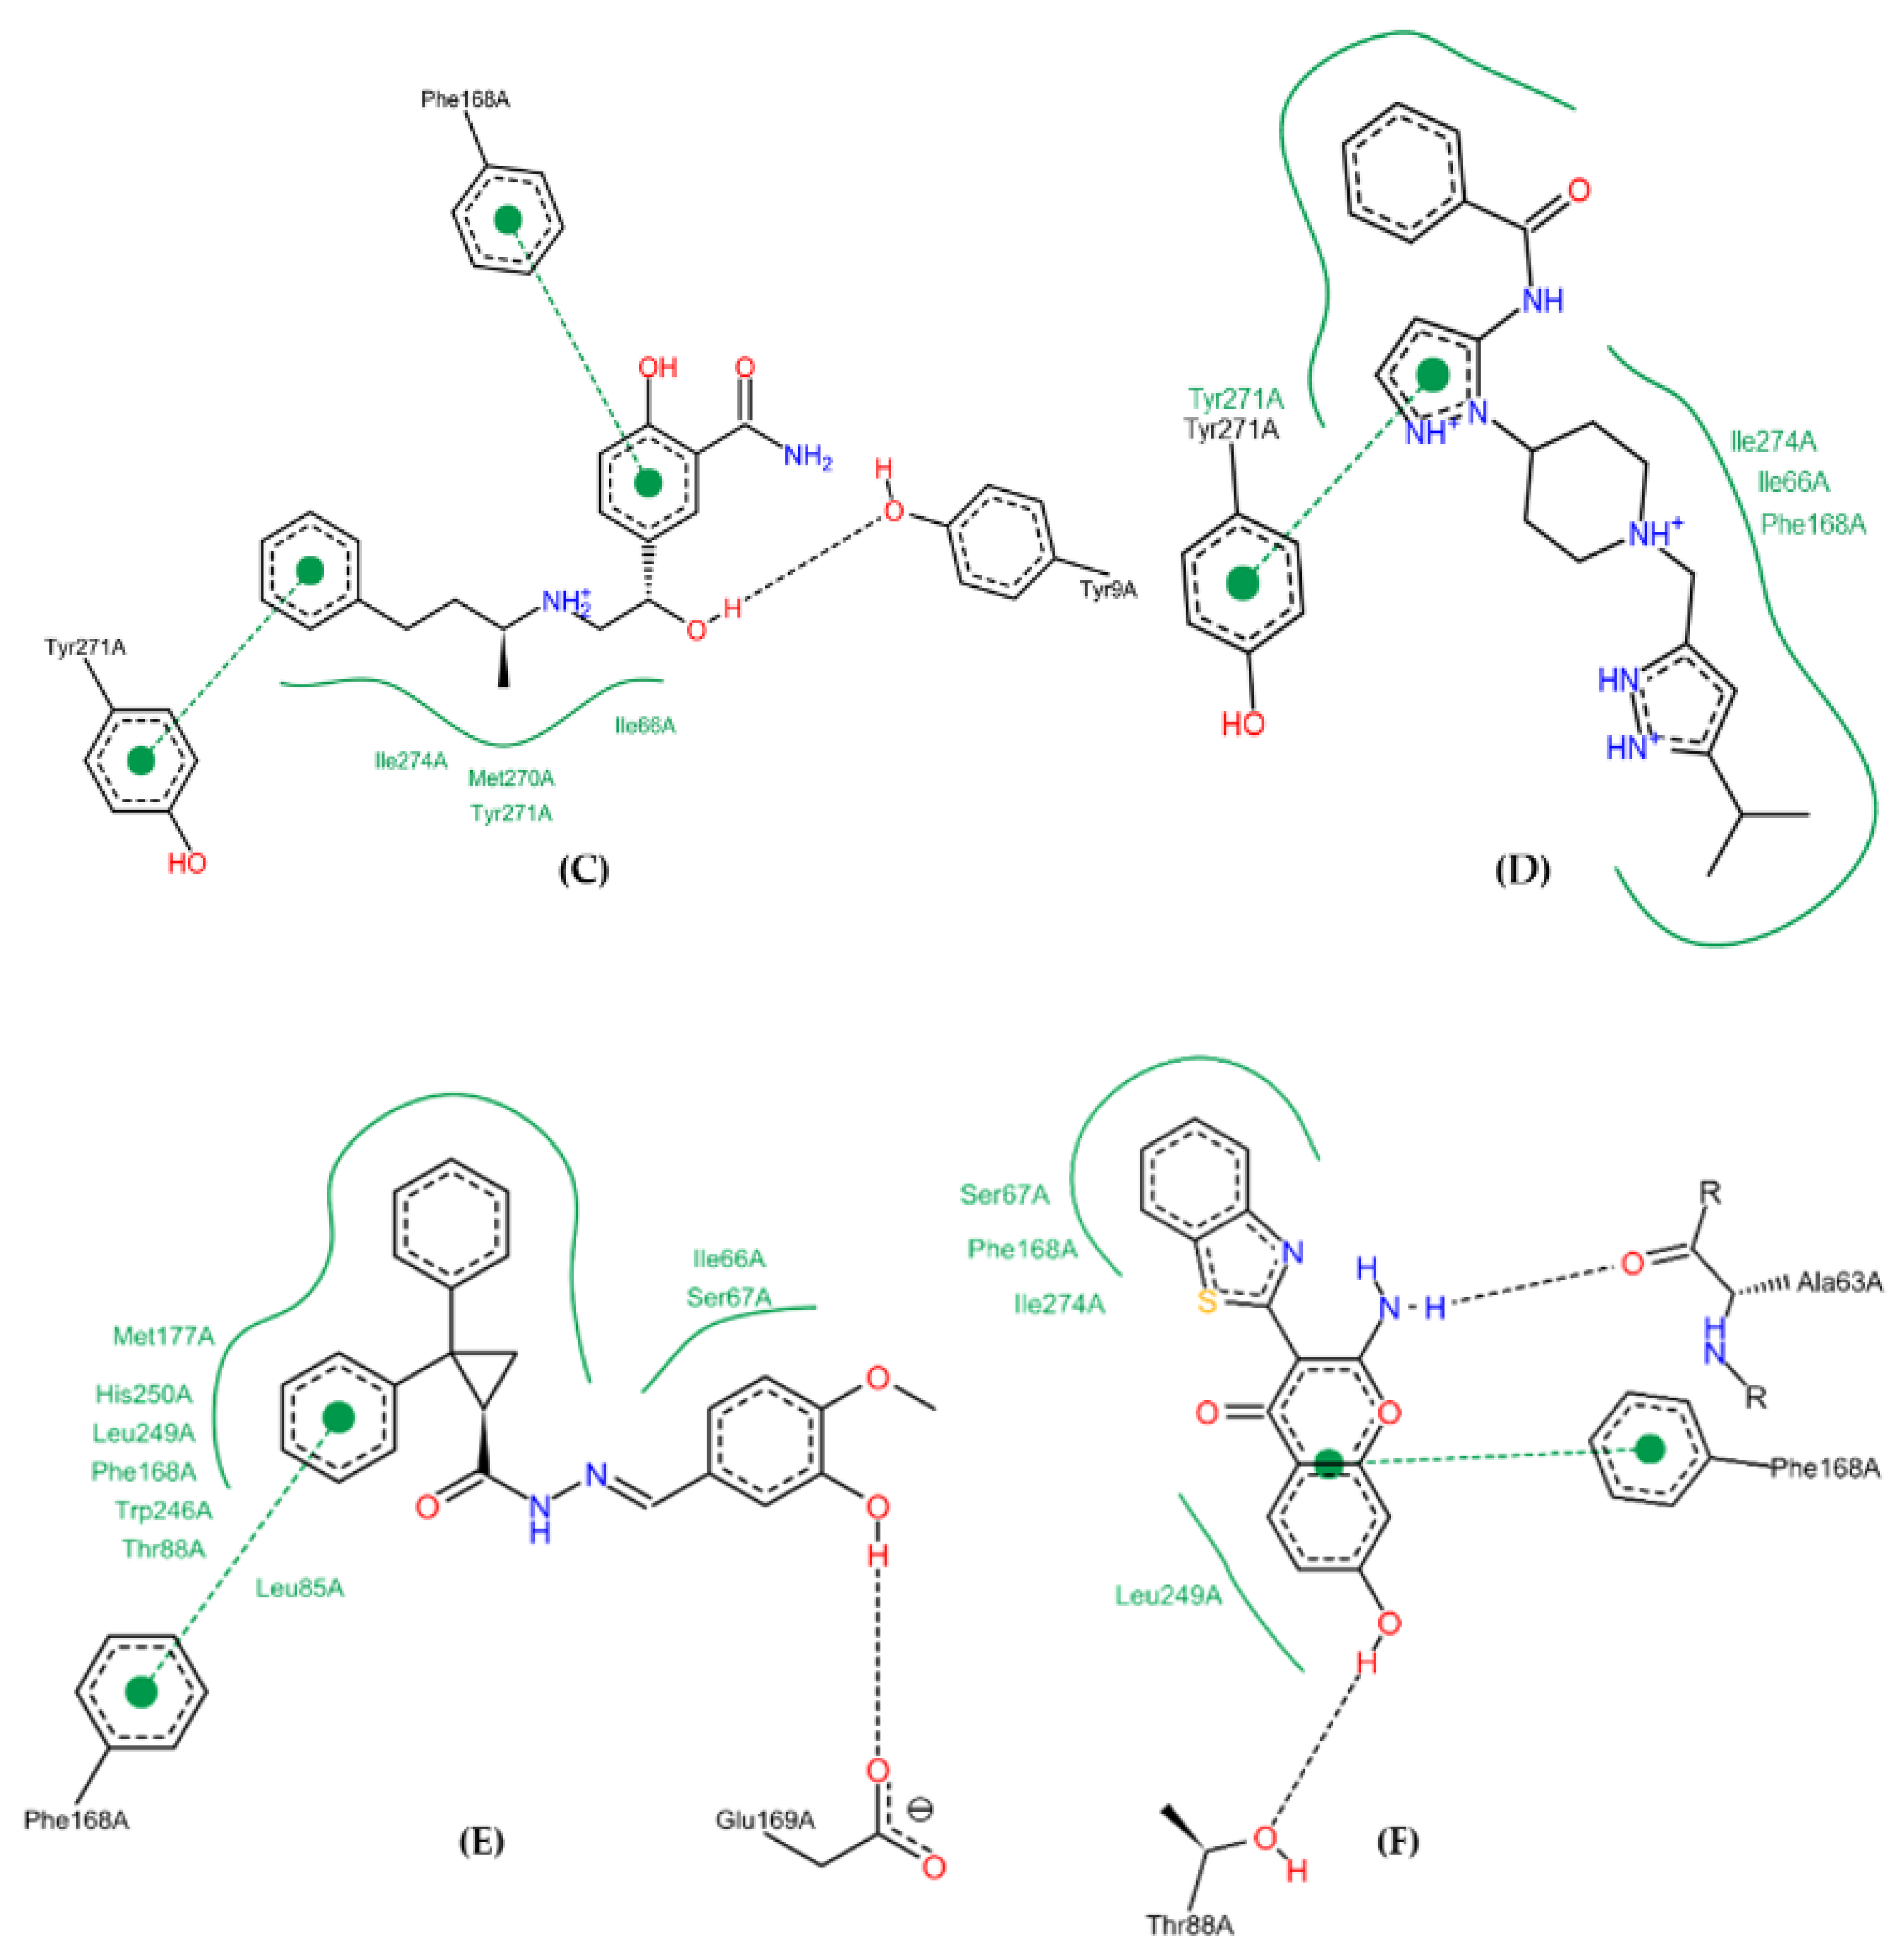
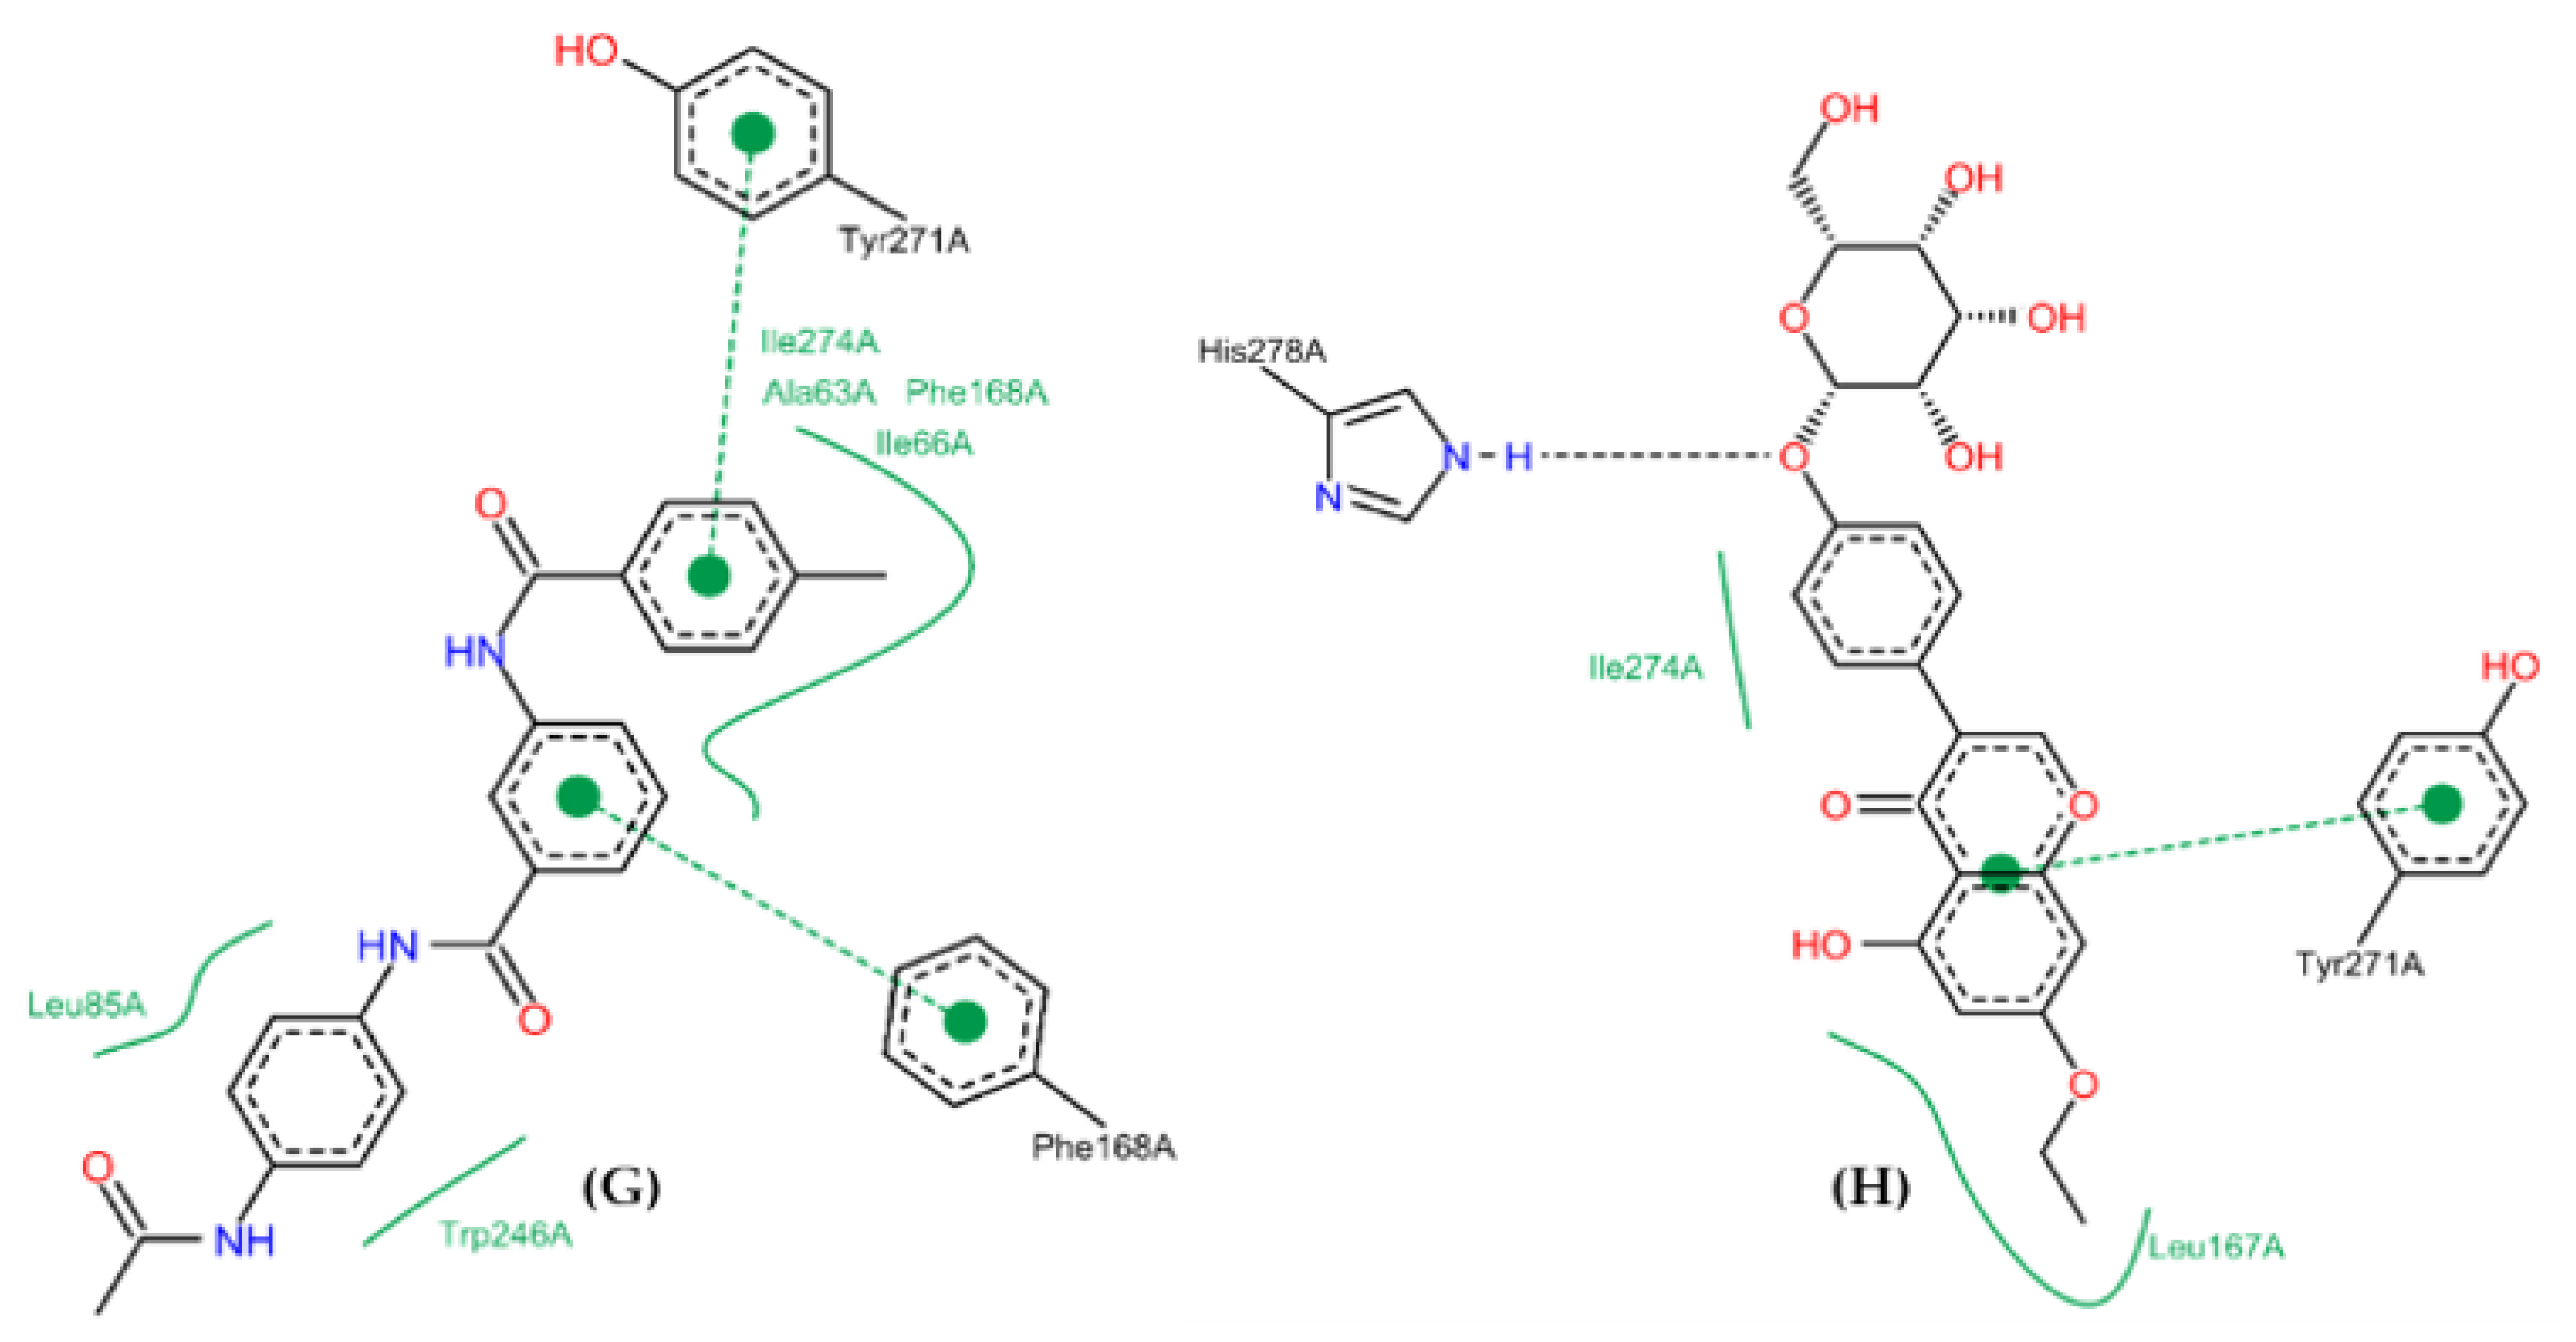
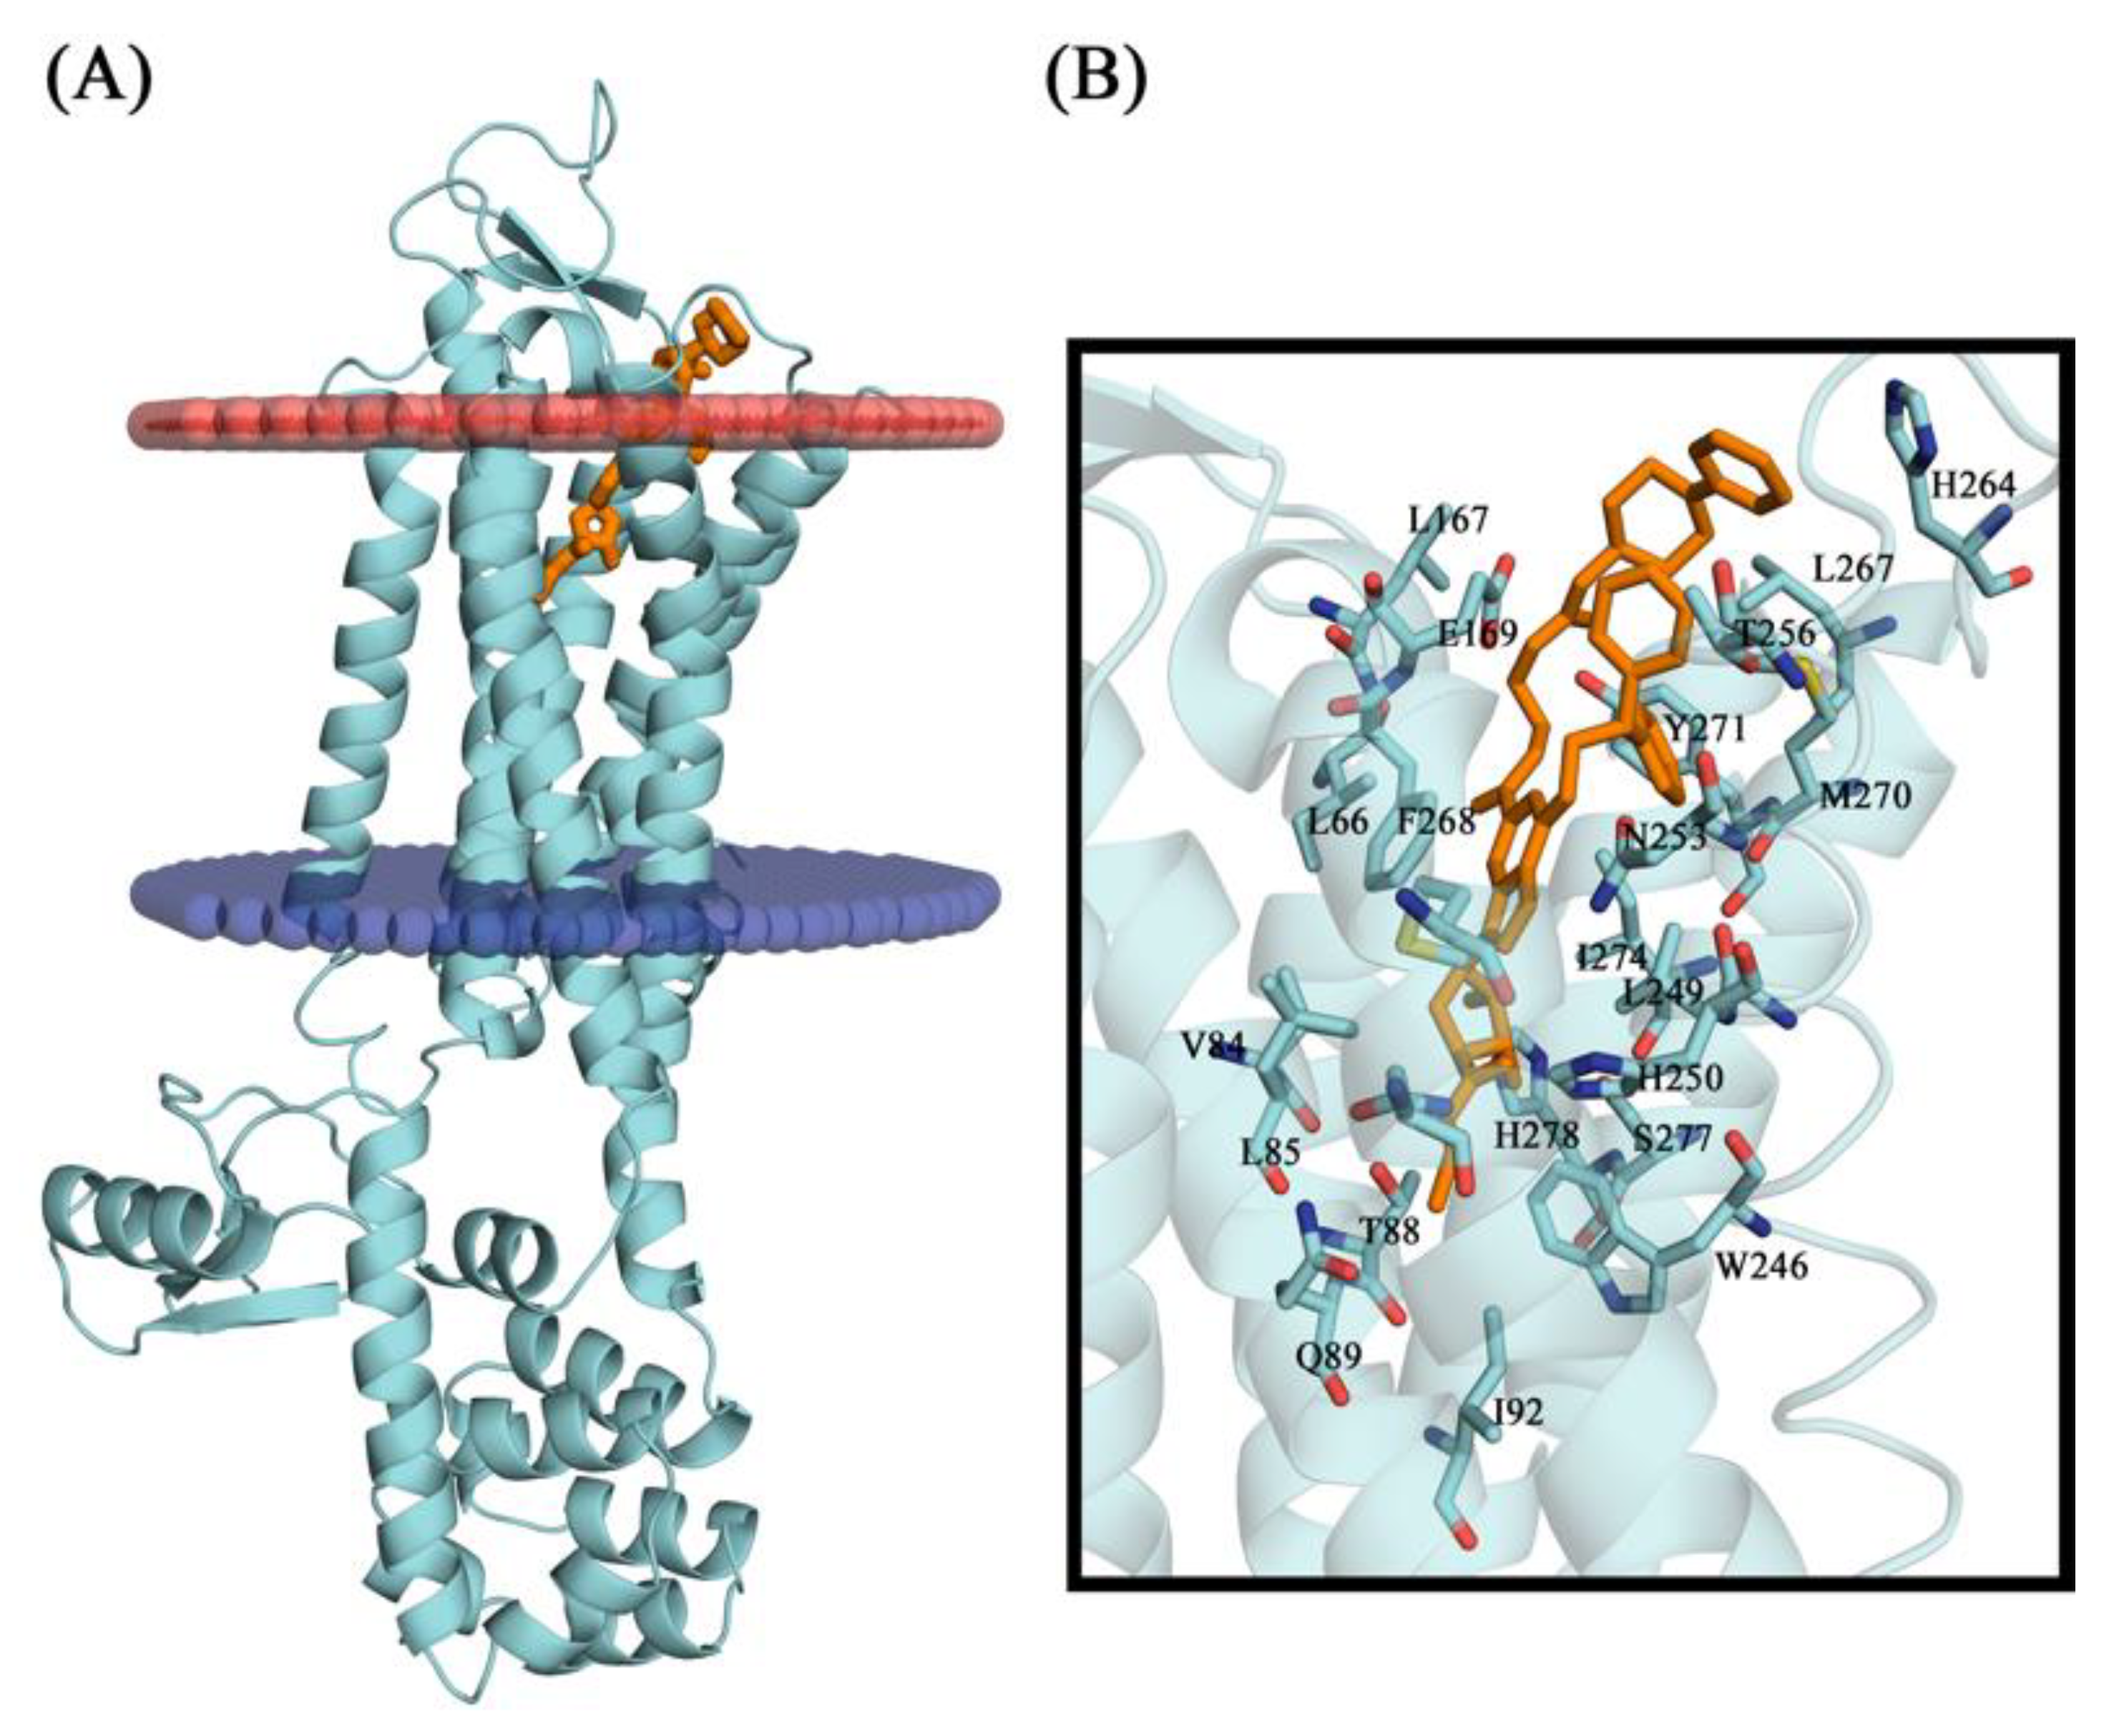
2.10. Molecular Docking Studies
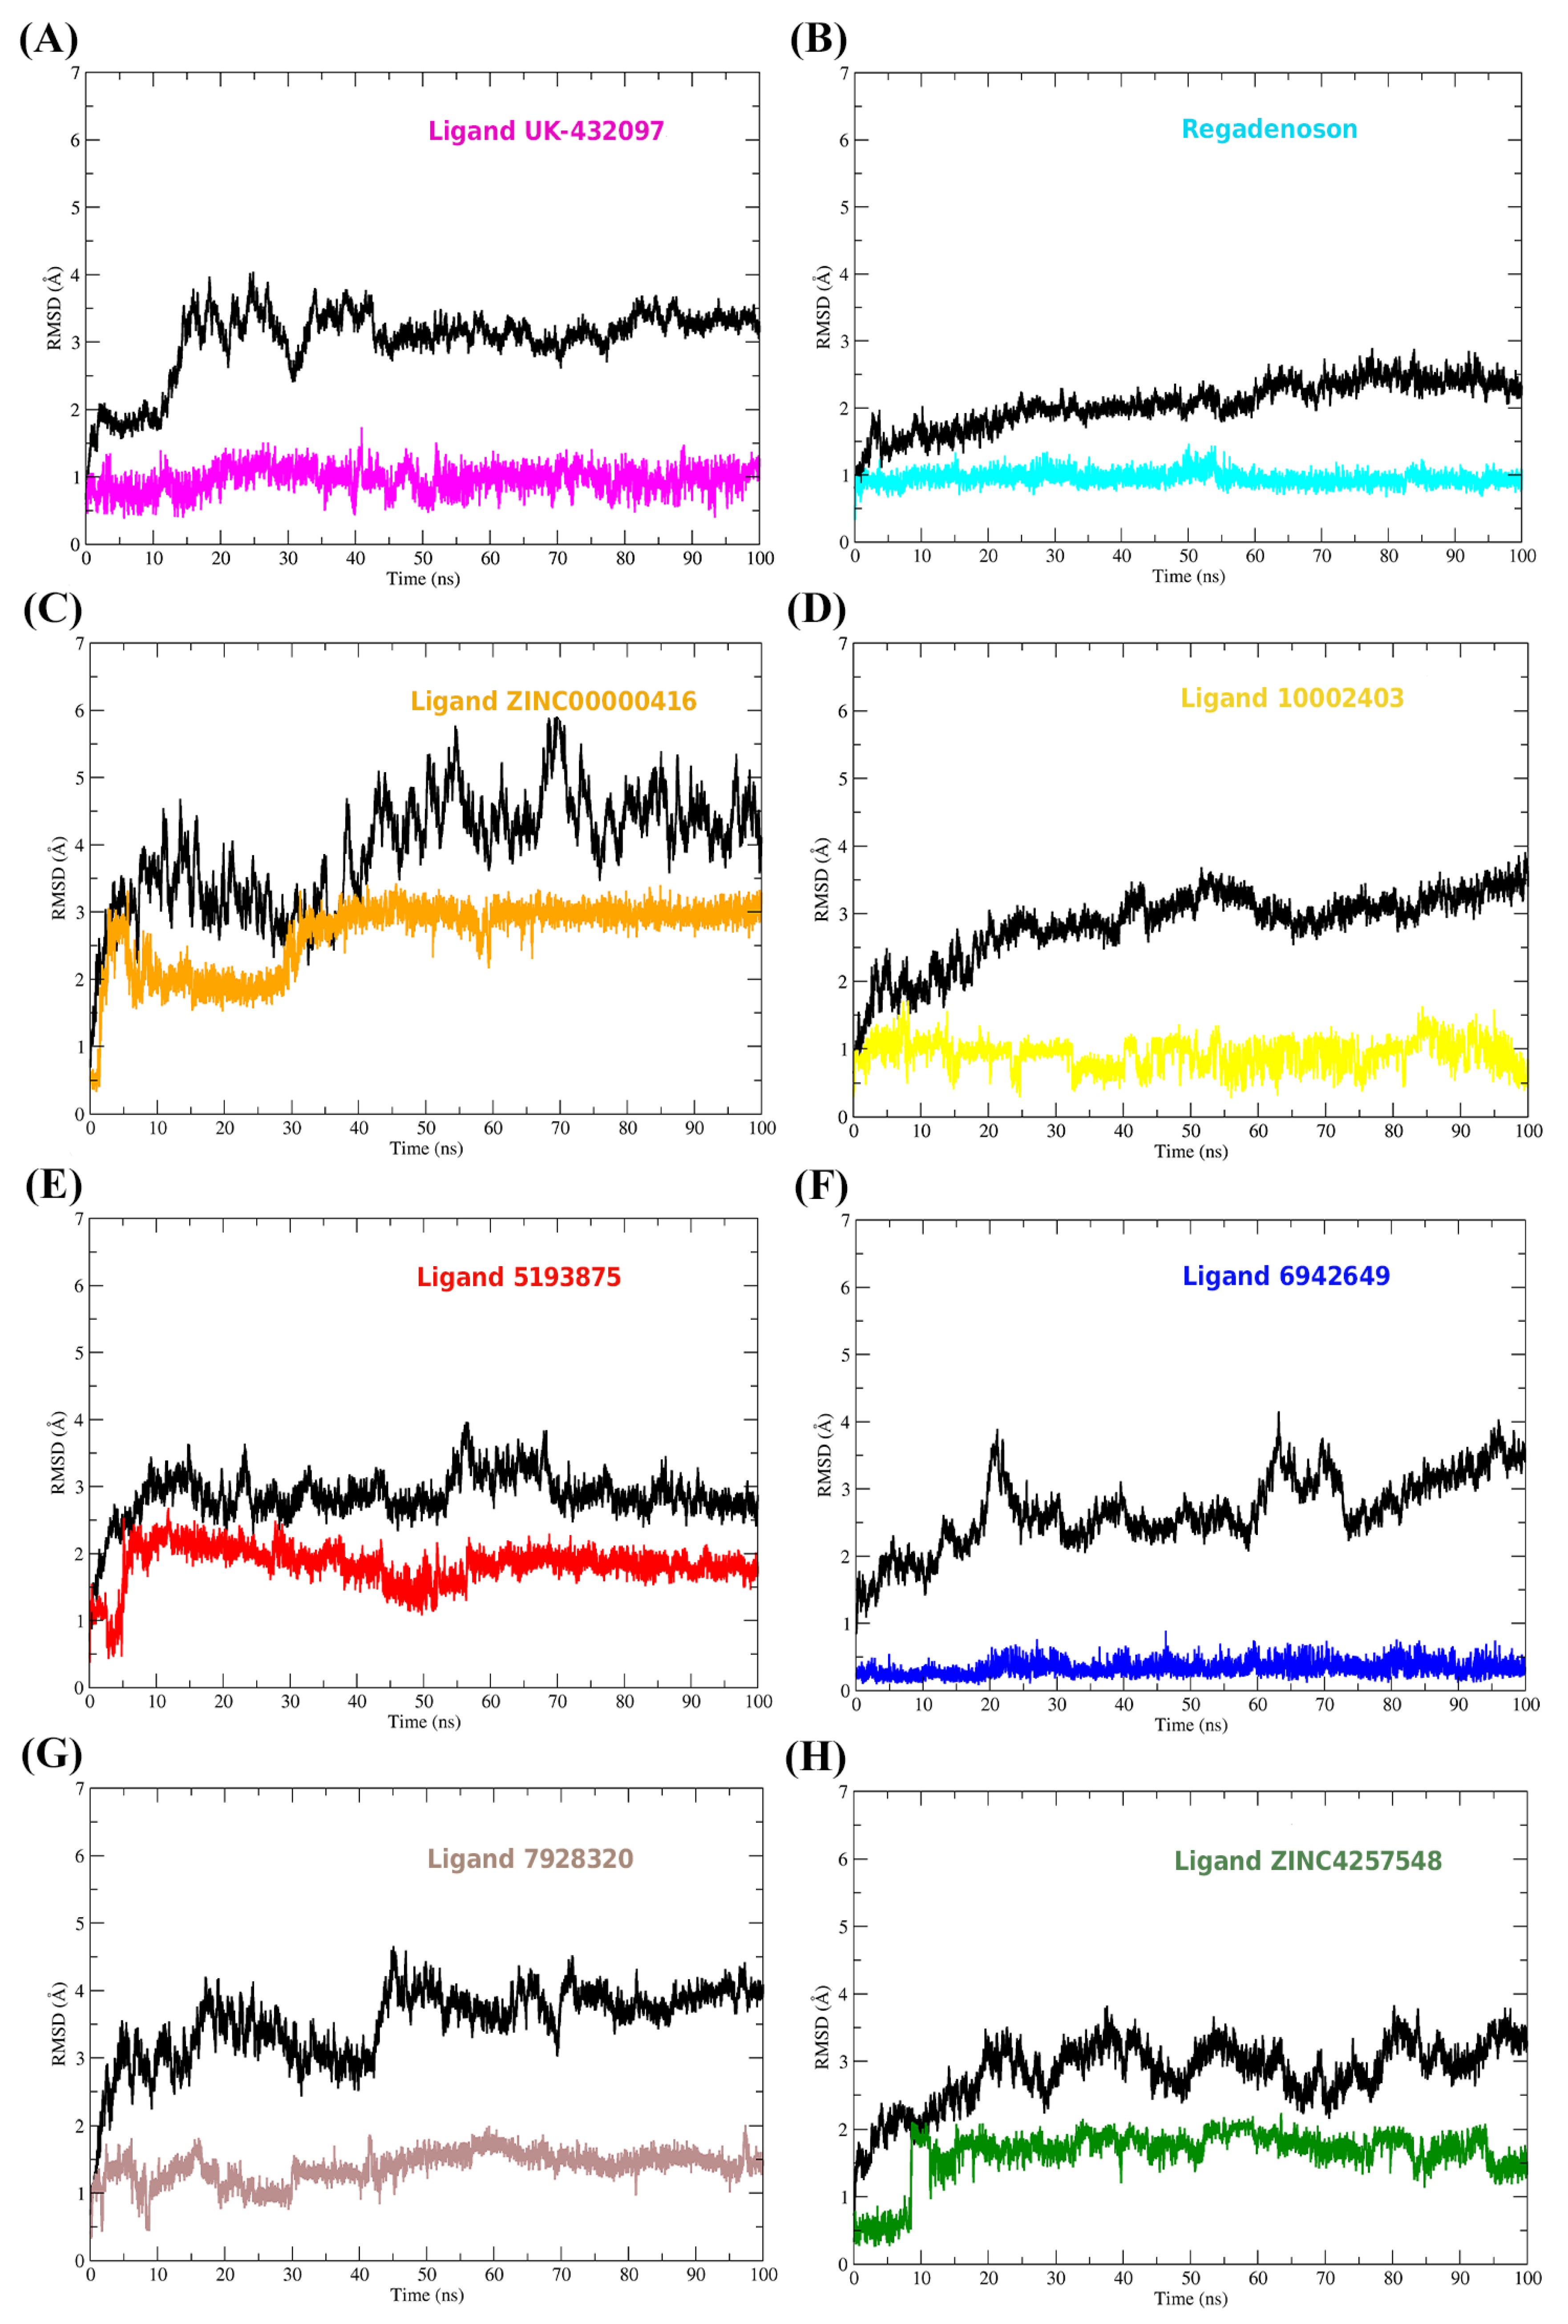
2.11. Conformational Stability of the A2A Receptor-Ligand Complexes and the Binding Affinities
3. Materials and Methods
3.1. Pharmacophore Detection by Pharmagist and Discovery Studio 4.0
3.2. Pharmacophore Prediction
3.3. Correlation Analysis, Design and Validation of the Multiple Linear Regression Model
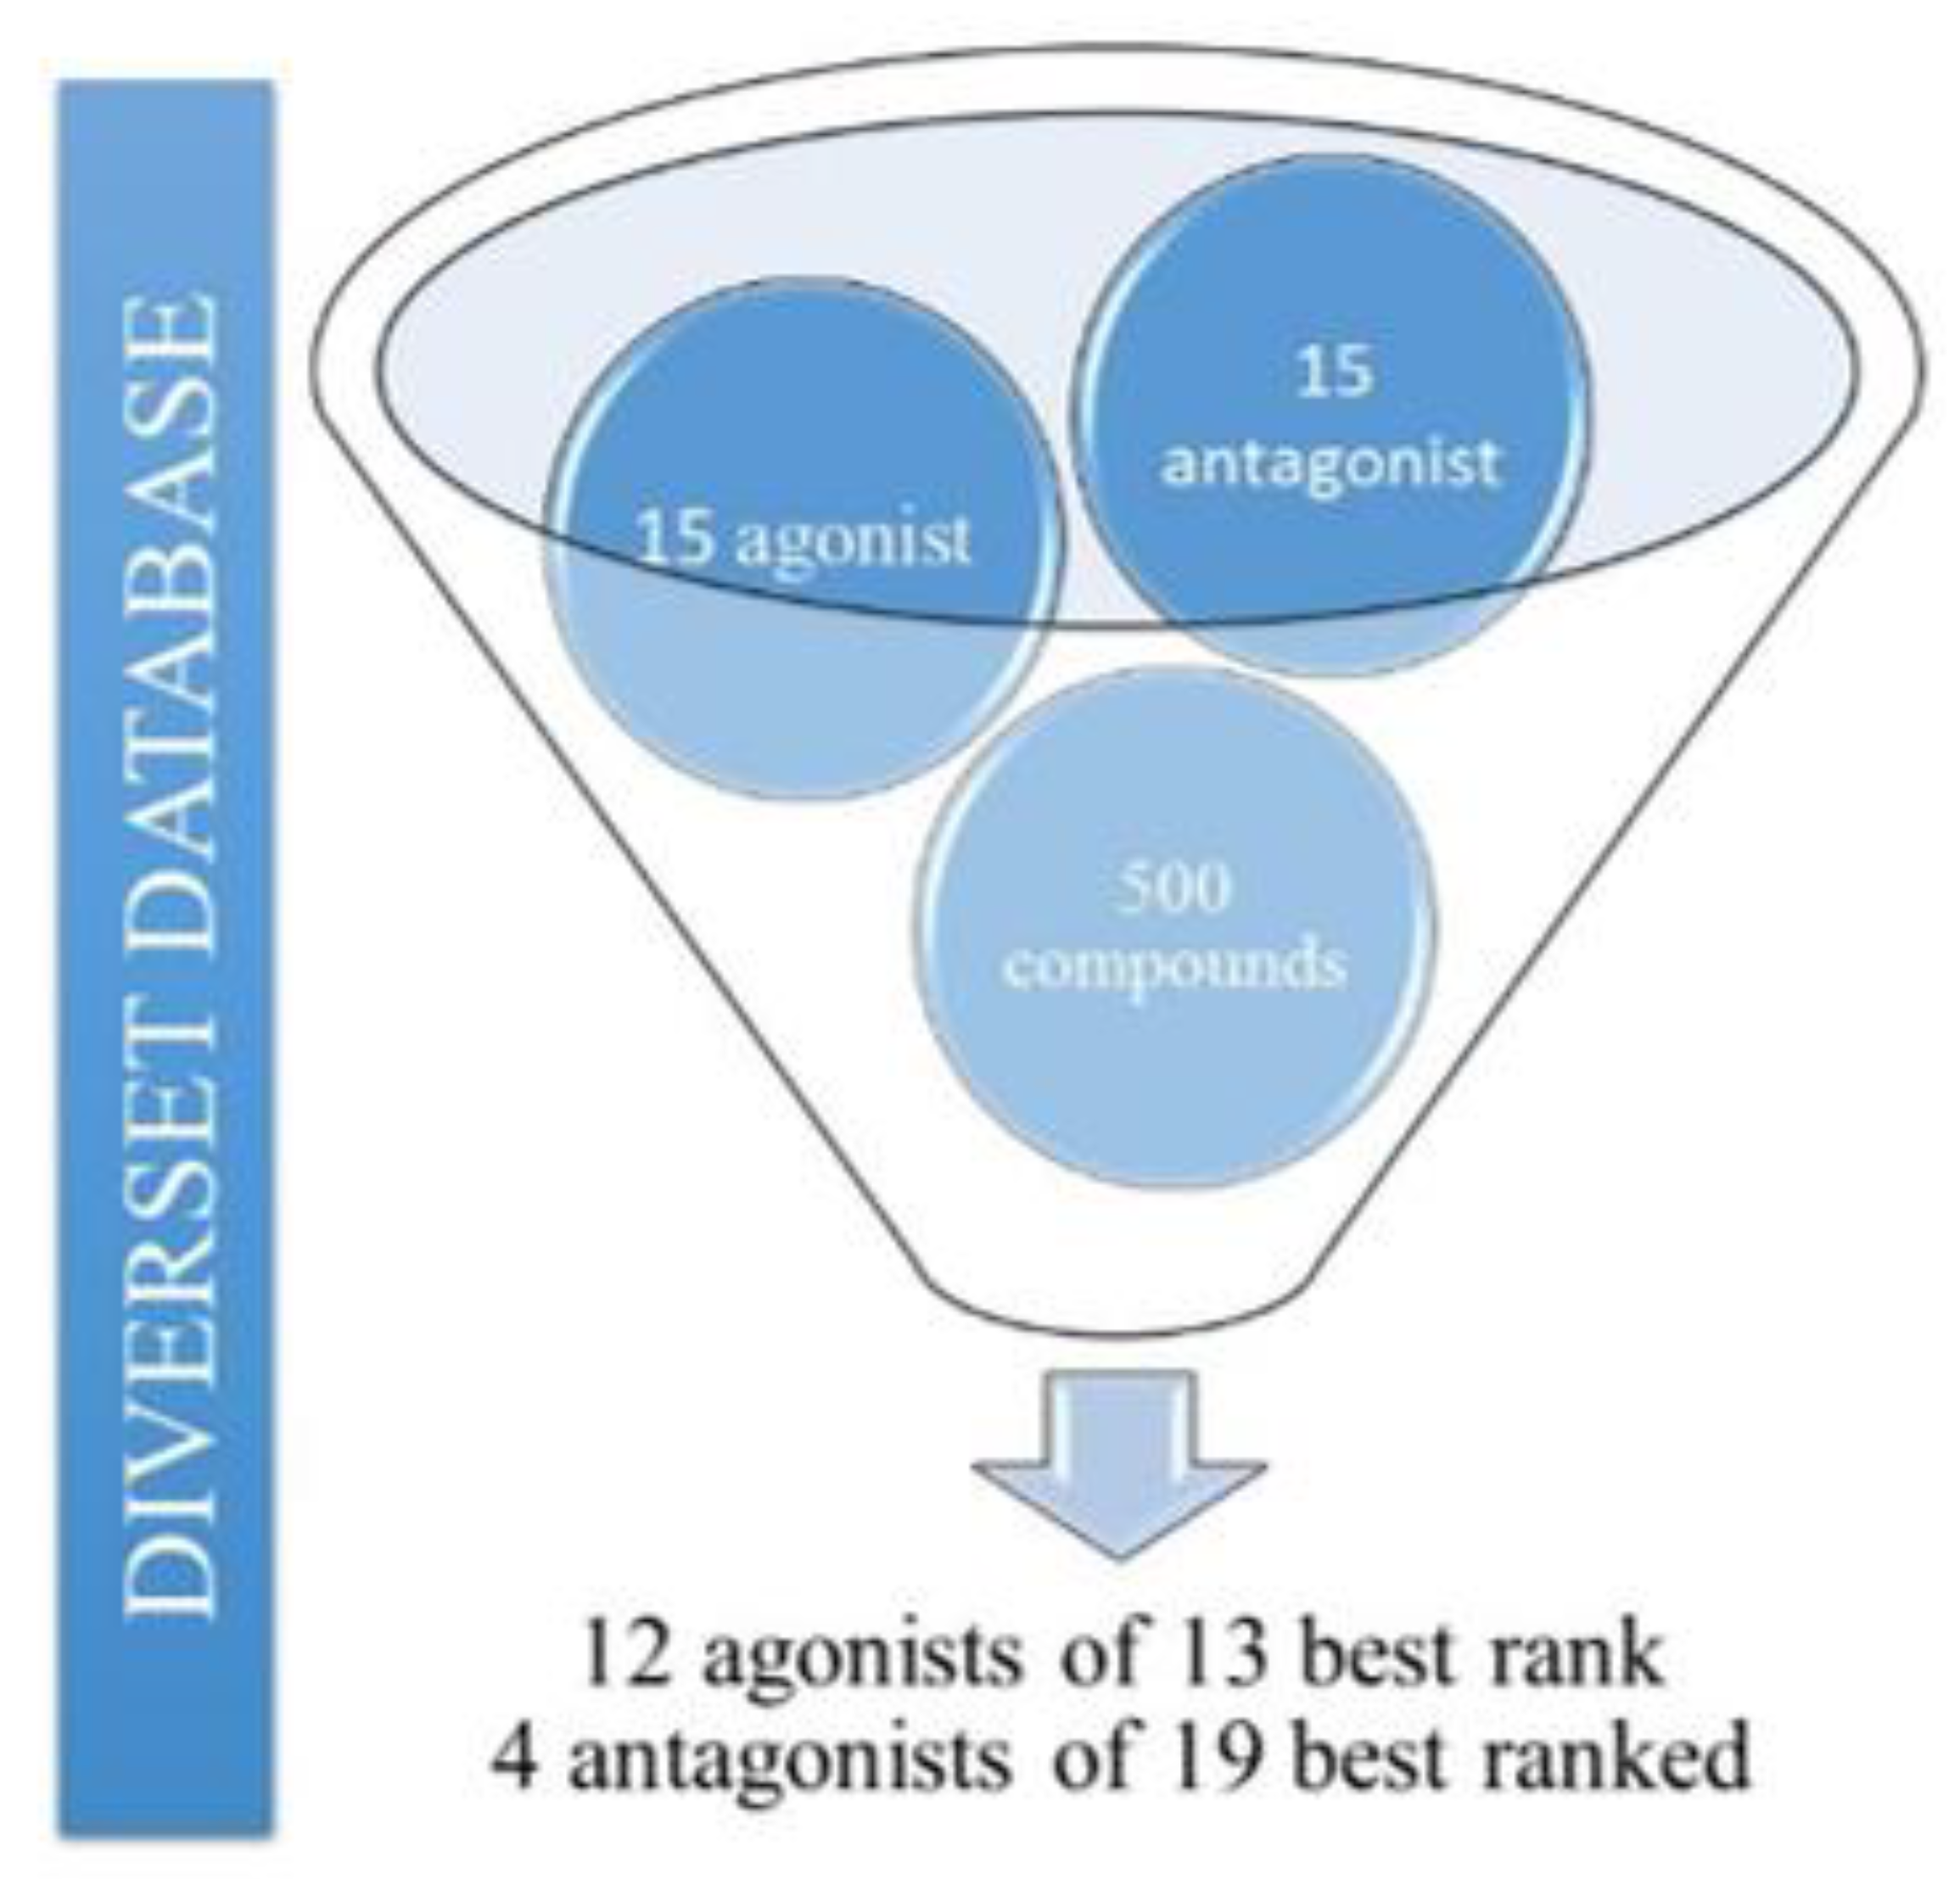
3.4. Pharmacophore-Based Virtual Screening
3.5. Pharmacokinetic and Toxicological Predictions
3.6. Molecular Docking Studies
3.7. Molecular Dynamics Simulations
3.8. Binding Affinities Calculations
3.9. Per-Residue Free Energy Decomposition Analysis
4. Conclusions
Author Contributions
Funding
Acknowledgments
Conflicts of Interest
References
- Ekins, S.; Mestres, J.; Testa, B. In silico pharmacology for drug discovery: Methods for virtual ligand screening and profiling. Br. J. Pharmacol. 2007, 152, 9–20. [Google Scholar] [CrossRef] [PubMed] [Green Version]
- Sinha, S.; Vohora, D. Drug Discovery and Development: An Overview. In Pharmaceutical Medicine and Translational Clinical Research; Elsevier Inc.: Amsterdam, The Netherlands, 2017; pp. 19–32. ISBN 9780-1280-2103-3. [Google Scholar]
- Paul, S.M.; Mytelka, D.S.; Dunwiddie, C.T.; Persinger, C.C.; Munos, B.H.; Lindborg, S.R.; Schacht, A.L. How to improve RD productivity: The pharmaceutical industry’s grand challenge. Nat. Rev. Drug Discov. 2010, 9, 203–214. [Google Scholar] [CrossRef] [PubMed]
- Hughes, J.P.; Rees, S.S.; Kalindjian, S.B.; Philpott, K.L. Principles of early drug discovery. Br. J. Pharmacol. 2011, 162, 1239–1249. [Google Scholar] [CrossRef] [PubMed] [Green Version]
- Da Costa, K.S.; Galúcio, J.M.; da Costa, C.H.S.; Santana, A.R.; dos Santos Carvalho, V.; do Nascimento, L.D.; Lima e Lima, A.H.; Neves Cruz, J.; Alves, C.N.; Lameira, J. Exploring the Potentiality of Natural Products from Essential Oils as Inhibitors of Odorant-Binding Proteins: A Structure- and Ligand-Based Virtual Screening Approach To Find Novel Mosquito Repellents. ACS Omega 2019, 4, 22475–22486. [Google Scholar] [CrossRef] [PubMed] [Green Version]
- Chen, H.; Engkvist, O.; Wang, Y.; Olivecrona, M.; Blaschke, T. The rise of deep learning in drug discovery. Drug Discov. Today 2018, 23, 1241–1250. [Google Scholar] [CrossRef] [PubMed]
- Coley, C.W.; Green, W.H.; Jensen, K.F. Machine Learning in Computer-Aided Synthesis Planning. Acc. Chem. Res. 2018, 51, 1281–1289. [Google Scholar] [CrossRef]
- Alves, F.S.; Rodrigues Do Rego, J.D.A.; Da Costa, M.L.; Lobato Da Silva, L.F.; Da Costa, R.A.; Cruz, J.N.; Brasil, D.D.S.B. Spectroscopic Methods and in silico Analyses using Density Functional Theory to Characterize and Identify Piperine Alkaloid Crystals Isolated from Pepper (Piper nigrum L.). J. Biomol. Struct. Dyn. 2019, 1–8. [Google Scholar] [CrossRef]
- Usha, T.; Shanmugarajan, D.; Goyal, A.K.; Kumar, C.S.; Middha, S.K. Recent Updates on Computer-aided Drug Discovery: Time for a Paradigm Shift. Curr. Top. Med. Chem. 2018, 17, 3296–3307. [Google Scholar] [CrossRef]
- Wu, K.J.; Zhong, H.J.; Li, G.; Liu, C.; Wang, H.M.D.; Ma, D.L.; Leung, C.H. Structure-based identification of a NEDD8-activating enzyme inhibitor via drug repurposing. Eur. J. Med. Chem. 2018, 143, 1021–1027. [Google Scholar] [CrossRef]
- Yang, C.; Wang, W.; Chen, L.; Liang, J.; Lin, S.; Lee, M.Y.; Ma, D.L.; Leung, C.H. Discovery of a VHL and HIF1α interaction inhibitor with: In vivo angiogenic activity via structure-based virtual screening. Chem. Commun. 2016, 52, 12837–12840. [Google Scholar] [CrossRef]
- Lappas, C.M.; Rieger, J.M.; Linden, J. A 2A Adenosine Receptor Induction Inhibits IFN-γ Production in Murine CD4 + T Cells. J. Immunol. 2005, 174, 1073–1080. [Google Scholar] [CrossRef] [PubMed] [Green Version]
- Müller, C.E.; Jacobson, K.A. Recent developments in adenosine receptor ligands and their potential as novel drugs. Biochim. Biophys. Acta Biomembr. 2011, 1808, 1290–1308. [Google Scholar] [CrossRef] [PubMed] [Green Version]
- Gebicke-Haerter, P.J.; Christoffel, F.; Timmer, J.; Northoff, H.; Berger, M.; Van Calker, D. Both adenosine A1- and A2-receptors are required to stimulate microglial proliferation. Neurochem. Int. 1996, 29, 37–42. [Google Scholar] [CrossRef]
- Haskó, G.; Cronstein, B.N. Adenosine: An endogenous regulator of innate immunity. Trends Immunol. 2004, 25, 33–39. [Google Scholar] [CrossRef]
- Hausler, N.E.; Devine, S.M.; McRobb, F.M.; Warfe, L.; Pouton, C.W.; Haynes, J.M.; Bottle, S.E.; White, P.J.; Scammells, P.J. Synthesis and Pharmacological Evaluation of Dual Acting Antioxidant A 2A Adenosine Receptor Agonists. J. Med. Chem. 2012, 55, 3521–3534. [Google Scholar] [CrossRef]
- Tosh, D.K.; Phan, K.; Gao, Z.-G.; Gakh, A.A.; Xu, F.; Deflorian, F.; Abagyan, R.; Stevens, R.C.; Jacobson, K.A.; Katritch, V. Optimization of Adenosine 5′-Carboxamide Derivatives as Adenosine Receptor Agonists Using Structure-Based Ligand Design and Fragment Screening. J. Med. Chem. 2012, 55, 4297–4308. [Google Scholar] [CrossRef] [Green Version]
- Xu, F.; Wu, H.; Katritch, V.; Han, G.W.; Jacobson, K.A.; Gao, Z.G.; Cherezov, V.; Stevens, R.C. Structure of an agonist-bound human A2A adenosine receptor. Science 2011, 332, 322–327. [Google Scholar] [CrossRef] [Green Version]
- Mantell, S.J.; Stephenson, P.T.; Monaghan, S.M.; Maw, G.N.; Trevethick, M.A.; Yeadon, M.; Walker, D.K.; Selby, M.D.; Batchelor, D.V.; Rozze, S.; et al. SAR of a series of inhaled A2A agonists and comparison of inhaled pharmacokinetics in a preclinical model with clinical pharmacokinetic data. Bioorg. Med. Chem. Lett. 2009, 19, 4471–4475. [Google Scholar] [CrossRef]
- Franchini, S.; Bencheva, L.I.; Battisti, U.M.; Tait, A.; Sorbi, C.; Fossa, P.; Cichero, E.; Ronsisvalle, S.; Aricò, G.; Denora, N.; et al. Synthesis and biological evaluation of 1,3-dioxolane-based 5-HT 1A receptor agonists for CNS disorders and neuropathic pain. Future Med. Chem. 2018, 10, 2137–2154. [Google Scholar] [CrossRef]
- Liessi, N.; Cichero, E.; Pesce, E.; Arkel, M.; Salis, A.; Tomati, V.; Paccagnella, M.; Damonte, G.; Tasso, B.; Galietta, L.J.V.; et al. Synthesis and biological evaluation of novel thiazole- VX-809 hybrid derivatives as F508del correctors by QSAR-based filtering tools. Eur. J. Med. Chem. 2018, 144, 179–200. [Google Scholar] [CrossRef]
- Silva, N.; Santos, C.; Gonçalves, L.; Braga, F.; Almeida, J.; Lima, C.; Brasil, D.; Silva, C.; Hage-Melim, L.; Santos, C. Molecular Modeling of the Major Compounds of Sesquiterpenes Class in Copaiba Oil-resin. Br. J. Pharm. Res. 2015, 7, 247–263. [Google Scholar] [CrossRef]
- Padilha, E.C.; Serafim, R.B.; Sarmiento, D.Y.R.; Santos, C.F.; Santos, C.B.R.; Silva, C.H.T.P. New PPARα/γ/δ optimal activator rationally designed by computational methods. J. Braz. Chem. Soc. 2016, 27, 1636–1647. [Google Scholar] [CrossRef]
- Sunseri, J.; Koes, D.R. Pharmit: Interactive exploration of chemical space. Nucleic Acids Res. 2016, 44, W442–W448. [Google Scholar] [CrossRef] [PubMed] [Green Version]
- Yang, S.Y. Pharmacophore modeling and applications in drug discovery: Challenges and recent advances. Drug Discov. Today 2010, 15, 444–450. [Google Scholar] [CrossRef]
- Al-Balas, Q.; Amawi, H.; Hassan, M.; Qandil, A.; Almaaytah, A.; Mhaidat, N. Virtual Lead Identification of Farnesyltransferase Inhibitors Based on Ligand and Structure-Based Pharmacophore Techniques. Pharmaceuticals 2013, 6, 700–715. [Google Scholar] [CrossRef] [Green Version]
- Ferreira, E.F.B.; Silva, L.B.; Costa, G.V.; Costa, J.S.; Fujishima, M.A.T.; Leão, R.P.; Ferreira, A.L.S.; Federico, L.B.; Silva, C.H.T.P.; Rosa, J.M.C.; et al. Identification of New Inhibitors with Potential Antitumor Activity from Polypeptide Structures via Hierarchical Virtual Screening. Molecules 2019, 24, 2943. [Google Scholar] [CrossRef] [Green Version]
- Macêdo, W.J.C.; Costa, J.S.; Federico, L.B.; Cruz, J.V.; Carvalho, S.S.; Ramos, R.S.; Wanderley, D.D.; Silva, C.H.T.P.; Santos, C.B.R. A MLR and ADME/Tox Study of New Dihydroartemisinin Compounds with Antimalarial Activity. J. Comput. Theor. Nanosci. 2018, 15, 2421–2427. [Google Scholar] [CrossRef]
- Belaidi, S.; Salah, T.; Melkemi, N.; Sinha, L.; Prasad, O. Structure activity relationship and quantitative structure-activity relationships modeling of antitrypanosomal activities of alkyldiamine cryptolepine derivatives. J. Comput. Theor. Nanosci. 2015, 12, 2421–2427. [Google Scholar] [CrossRef]
- Macêdo, W.J.C.; Braga, F.S.; Santos, C.F.; Da Silva Costa, J.; De Melo, G.S.; De Mello, M.N.; Sousa, D.S.; Carvalho, J.C.T.; Do Socorro Barros Brasil, D.; Dos Santos, C.B.R. Antimalarial artemisinins derivatives study: Molecular modeling and multivariate analysis (PCA, HCA, KNN, SIMCA and SDA). J. Comput. Theor. Nanosci. 2015, 12, 3443–3458. [Google Scholar] [CrossRef]
- da Silva Costa, J.; da Silva Lopes Costa, K.; Cruz, J.V.; da Silva Ramos, R.; Silva, L.B.; Do Socorro Barros Brasil, D.; de Paula da Silva, C.H.T.; dos Santos, C.B.R.; da Cruz Macedo, W.J. Virtual Screening and Statistical Analysis in the Design of New Caffeine Analogues Molecules with Potential Epithelial Anticancer Activity. Curr. Pharm. Des. 2018, 24, 576–594. [Google Scholar] [CrossRef]
- Southall, N.T.; Dill, K.A.; Haymet, A.D.J. A View of the Hydrophobic Effect. J. Phys. Chem. B 2002, 106, 521–533. [Google Scholar] [CrossRef]
- Barreiro, E.J.; Kümmerle, A.E.; Fraga, C.A.M. The methylation effect in medicinal chemistry. Chem. Rev. 2011, 111, 5215–5246. [Google Scholar] [CrossRef] [PubMed]
- Dror, O.; Schneidman-Duhovny, D.; Inbar, Y.; Nussinov, R.; Wolfson, H.J. Novel Approach for Efficient Pharmacophore-Based Virtual Screening: Method and Applications. J. Chem. Inf. Model. 2009, 49, 2333–2343. [Google Scholar] [CrossRef] [PubMed] [Green Version]
- Schneidman-Duhovny, D.; Dror, O.; Inbar, Y.; Nussinov, R.; Wolfson, H.J. PharmaGist: A webserver for ligand-based pharmacophore detection. Nucleic Acids Res. 2008, 36, W223–W228. [Google Scholar] [CrossRef] [Green Version]
- Miller, K.J. Additivity methods in molecular polarizability. J. Am. Chem. Soc. 1990, 112, 8533–8542. [Google Scholar] [CrossRef]
- Wang, J.; Cieplak, P.; Li, J.; Hou, T.; Luo, R.; Duan, Y. Development of Polarizable Models for Molecular Mechanical Calculations I: Parameterization of Atomic Polarizability. J. Phys. Chem. B 2011, 115, 3091–3099. [Google Scholar] [CrossRef] [Green Version]
- Rodríguez, A.; Guerrero, A.; Gutierrez-De-Terán, H.; Rodríguez, D.; Brea, J.; Loza, M.I.; Rosell, G.; Pilar Bosch, M. New selective A2A agonists and A3 antagonists for human adenosine receptors: Synthesis, biological activity and molecular docking studies. Medchemcomm 2015, 6, 1178–1185. [Google Scholar] [CrossRef]
- Deflorian, F.; Kumar, T.S.; Phan, K.; Gao, Z.-G.; Xu, F.; Wu, H.; Katritch, V.; Stevens, R.C.; Jacobson, K.A. Evaluation of Molecular Modeling of Agonist Binding in Light of the Crystallographic Structure of an Agonist-Bound A 2A Adenosine Receptor. J. Med. Chem. 2012, 55, 538–552. [Google Scholar] [CrossRef] [Green Version]
- Laoui, A.; Polyakov, V.R. Web services as applications’ integration tool: QikProp case study. J. Comput. Chem. 2011, 32, 1944–1951. [Google Scholar] [CrossRef]
- Lipinski, C.A.; Lombardo, F.; Dominy, B.W.; Feeney, P.J. Experimental and computational approaches to estimate solubility and permeability in drug discovery and development settings. Adv. Drug Deliv. Rev. 2001, 46, 3–26. [Google Scholar] [CrossRef]
- Artursson, P.; Karlsson, J. Correlation between oral drug absorption in humans and apparent drug permeability coefficients in human intestinal epithelial (Caco-2) cells. Biochem. Biophys. Res. Commun. 1991, 175, 880–885. [Google Scholar] [CrossRef]
- Norinder, U.; Haeberlein, M. Computational approaches to the prediction of the blood-brain distribution. Adv. Drug Deliv. Rev. 2002, 54, 291–313. [Google Scholar] [CrossRef]
- Derek Nexus Derek Nexus. Available online: https://www.lhasalimited.org/products/derek-nexus.htm (accessed on 8 January 2020).
- Fukushima, S.; Tanaka, H.; Asakawa, E.; Kagawa, M.; Yamamoto, A.; Shirai, T. Carcinogenicity of uracil, a nongenotoxic chemical, in rats and mice and its rationale. Cancer Res. 1992, 52, 1675–1680. [Google Scholar] [PubMed]
- Neves Cruz, J.; de Oliveira, M.S.; Gomes Silva, S.; da Silva Souza Filho, A.P.; Santiago Pereira, D.; Lima e Lima, A.H.; de Aguiar Andrade, E.H. Insight into the Interaction Mechanism of Nicotine, NNK, and NNN with Cytochrome P450 2A13 Based on Molecular Dynamics Simulation. J. Chem. Inf. Model. 2020, 60, 766–776. [Google Scholar] [CrossRef]
- Vale, V.V.; Cruz, J.N.; Viana, G.M.R.; Póvoa, M.M.; Brasil, D.d.S.B.; Dolabela, M.F. Naphthoquinones isolated from Eleutherine plicata herb: In vitro antimalarial activity and molecular modeling to investigate their binding modes. Med. Chem. Res. 2020, 29, 487–494. [Google Scholar] [CrossRef]
- Borges, R.S.; Palheta, I.C.; Ota, S.S.B.; Morais, R.B.; Barros, V.A.; Ramos, R.S.; Silva, R.C.; Costa, J.d.S.; Silva, C.H.T.P.; Campos, J.M.; et al. Toward of Safer Phenylbutazone Derivatives by Exploration of Toxicity Mechanism. Molecules 2019, 24, 143. [Google Scholar] [CrossRef] [Green Version]
- Preti, D.; Baraldi, P.G.; Saponaro, G.; Romagnoli, R.; Aghazadeh Tabrizi, M.; Baraldi, S.; Cosconati, S.; Bruno, A.; Novellino, E.; Vincenzi, F.; et al. Design, Synthesis, and Biological Evaluation of Novel 2-((2-(4-(Substituted)phenylpiperazin-1-yl)ethyl)amino)-5ʹ- N-ethylcarboxamidoadenosines as Potent and Selective Agonists of the A 2A Adenosine Receptor. J. Med. Chem. 2015, 58, 3253–3267. [Google Scholar] [CrossRef]
- FDA. Food and Drug Administration U.S. Food and Drug Administration. Available online: https://www.fda.gov/ (accessed on 8 January 2020).
- Kim, S.; Thiessen, P.A.; Bolton, E.E.; Chen, J.; Fu, G.; Gindulyte, A.; Han, L.; He, J.; He, S.; Shoemaker, B.A.; et al. PubChem Substance and Compound databases. Nucleic Acids Res. 2016, 44, D1202–D1213. [Google Scholar] [CrossRef]
- Pereira, A.L.E.; dos Santos, G.B.; Franco, M.S.F.; Federico, L.B.; da Silva, C.H.T.P.; Santos, C.B.R. Molecular modeling and statistical analysis in the design of derivatives of human dipeptidyl peptidase IV. J. Biomol. Struct. Dyn. 2018, 36, 318–334. [Google Scholar] [CrossRef]
- Costa, R.A.; Cruz, J.N.; Nascimento, F.C.A.; Silva, S.G.; Silva, S.O.; Martelli, M.C.; Carvalho, S.M.L.; Santos, C.B.R.; Neto, A.M.J.C.; Brasil, D.S.B. Studies of NMR, molecular docking, and molecular dynamics simulation of new promising inhibitors of cruzaine from the parasite Trypanosoma cruzi. Med. Chem. Res. 2019, 28, 246–259. [Google Scholar] [CrossRef]
- Cruz, J.; Neto, M.; Silva, L.; da Ramos, R.S.; da Costa, J.S.; Brasil, D.; Lobato, C.; da Costa, G.; Bittencourt, J.; da Silva, C.; et al. Identification of Novel Protein Kinase Receptor Type 2 Inhibitors Using Pharmacophore and Structure-Based Virtual Screening. Molecules 2018, 23, 453. [Google Scholar] [CrossRef] [Green Version]
- Stewart, J.J.P. Optimization of parameters for semiempirical methods IV: Extension of MNDO, AM1 and PM3 to more main group elements. J. Mol. Model. 2004, 10, 155–164. [Google Scholar] [CrossRef]
- dos Santos, C.; Lobato, C.; Braga, F.; Costa, J.; Favacho, H.; Carvalho, J.; Macedo, W.; Brasil, D.; da Silva, C.; da Silva Hage-Melim, L. Rational Design of Antimalarial Drugs Using Molecular Modeling and Statistical Analysis. Curr. Pharm. Des. 2015, 21, 4112–4127. [Google Scholar] [CrossRef]
- Cheng, A.S.H.; Pegg, T.J.; Karamitsos, T.D.; Searle, N.; Jerosch-Herold, M.; Choudhury, R.P.; Banning, A.P.; Neubauer, S.; Robson, M.D.; Selvanayagam, J.B. Cardiovascular Magnetic Resonance Perfusion Imaging at 3-Tesla for the Detection of Coronary Artery Disease. A Comparison With 1.5-Tesla. J. Am. Coll. Cardiol. 2007, 49, 2440–2449. [Google Scholar] [CrossRef] [Green Version]
- Trott, O.; Olson, A.J. AutoDock Vina: Improving the speed and accuracy of docking with a new scoring function, efficient optimization, and multithreading. J. Comput. Chem. 2010, 31, 455–461. [Google Scholar] [CrossRef] [Green Version]
- Dallakyan, S.; Olson, A.J. Small-molecule library screening by docking with PyRx. Methods Mol. Biol. 2015, 1263, 243–250. [Google Scholar] [PubMed]
- Wang, G.M.; Blaisten-Barojas, E.; Roitberg, A.E.; Martin, T.P. Strontium clusters: Many-body potential, energetics, and structural transitions. J. Chem. Phys. 2001, 115, 3640–3646. [Google Scholar] [CrossRef] [Green Version]
- Cornell, W.D.; Cieplak, P.; Bayly, C.I.; Kollman, P.A. Application of RESP charges to calculate conformational energies, hydrogen bond energies, and free energies of solvation. J. Am. Chem. Soc. 1993, 115, 9620–9631. [Google Scholar] [CrossRef]
- Frisch, M.J.; Trucks, G.W.; Schlegel, H.B.; Scuseria, G.E.; Robb, M.A.; Cheeseman, J.R.; Scalmani, G.; Barone, V.; Petersson, G.A.; Nakatsuji, H.; et al. Gaussian 16 Revision B.01 2016; Gaussian Inc.: Wallingford, CT, USA, 2016. [Google Scholar]
- Wang, J.; Wolf, R.M.; Caldwell, J.W.; Kollman, P.A.; Case, D.A. Development and testing of a general amber force field. J. Comput. Chem. 2004, 25, 1157–1174. [Google Scholar] [CrossRef] [PubMed]
- Dolinsky, T.J.; Nielsen, J.E.; McCammon, J.A.; Baker, N.A. PDB2PQR: An automated pipeline for the setup of Poisson-Boltzmann electrostatics calculations. Nucleic Acids Res. 2004, 32, W665–W667. [Google Scholar] [CrossRef]
- Lomize, M.A.; Pogozheva, I.D.; Joo, H.; Mosberg, H.I.; Lomize, A.L. OPM database and PPM web server: Resources for positioning of proteins in membranes. Nucleic Acids Res. 2012, 40, D370–D376. [Google Scholar] [CrossRef] [PubMed]
- Jo, S.; Kim, T.; Iyer, V.G.; Im, W. CHARMM-GUI: A web-based graphical user interface for CHARMM. J. Comput. Chem. 2008, 29, 1859–1865. [Google Scholar] [CrossRef] [PubMed]
- Maier, J.A.; Martinez, C.; Kasavajhala, K.; Wickstrom, L.; Hauser, K.E.; Simmerling, C. ff14SB: Improving the Accuracy of Protein Side Chain and Backbone Parameters from ff99SB. J. Chem. Theory Comput. 2015, 11, 3696–3713. [Google Scholar] [CrossRef] [PubMed] [Green Version]
- Dickson, C.J.; Madej, B.D.; Skjevik, Å.A.; Betz, R.M.; Teigen, K.; Gould, I.R.; Walker, R.C. Lipid14: The Amber Lipid Force Field. J. Chem. Theory Comput. 2014, 10, 865–879. [Google Scholar] [CrossRef]
- Jorgensen, W.L.; Chandrasekhar, J.; Madura, J.D.; Impey, R.W.; Klein, M.L. Comparison of simple potential functions for simulating liquid water. J. Chem. Phys. 1983, 79, 926–935. [Google Scholar] [CrossRef]
- Case, D.A.; Cheatham, T.E.; Darden, T.; Gohlke, H.; Luo, R.; Merz, K.M.; Onufriev, A.; Simmerling, C.; Wang, B.; Woods, R.J. The Amber biomolecular simulation programs. J. Comput. Chem. 2005, 26, 1668–1688. [Google Scholar] [CrossRef] [Green Version]
- Silva, S.G.; da Costa, R.A.; de Oliveira, M.S.; da Cruz, J.N.; Figueiredo, P.L.B.; Brasil, D.d.S.B.; Nascimento, L.D.; Chaves Neto, A.M.d.J.; de Carvalho Junior, R.N.; Andrade, E.H.d.A. Chemical profile of Lippia thymoides, evaluation of the acetylcholinesterase inhibitory activity of its essential oil, and molecular docking and molecular dynamics simulations. PLoS ONE 2019, 14, e0213393. [Google Scholar] [CrossRef] [Green Version]
- Darden, T.; York, D.; Pedersen, L. Particle mesh Ewald: An N log(N) method for Ewald sums in large systems. J. Chem. Phys. 1993, 98, 10089–10092. [Google Scholar] [CrossRef] [Green Version]
- Ryckaert, J.P.; Ciccotti, G.; Berendsen, H.J.C.C.; Ryckaert, J.P.; Ciccotti, G.; Berendsen, H.J.C.C. Numerical integration of the cartesian equations of motion of a system with constraints: Molecular dynamics of n-alkanes. J. Comput. Phys. 1977, 23, 327–341. [Google Scholar] [CrossRef] [Green Version]
- Izaguirre, J.A.; Catarello, D.P.; Wozniak, J.M.; Skeel, R.D. Langevin stabilization of molecular dynamics. J. Chem. Phys. 2001, 114, 2090–2098. [Google Scholar] [CrossRef]
- Neves Cruz, J.; da Costa, K.S.; de Carvalho, T.A.A.; de Alencar, N.A.N. Measuring the structural impact of mutations on cytochrome P450 21A2, the major steroid 21-hydroxylase related to congenital adrenal hyperplasia. J. Biomol. Struct. Dyn. 2019, 1–10. [Google Scholar] [CrossRef] [PubMed]
- De Oliveira, M.S.; da Cruz, J.N.; Gomes Silva, S.; da Costa, W.A.; de Sousa, S.H.B.; Bezerra, F.W.F.; Teixeira, E.; da Silva, N.J.N.; de Aguiar Andrade, E.H.; de Jesus Chaves Neto, A.M.; et al. Phytochemical profile, antioxidant activity, inhibition of acetylcholinesterase and interaction mechanism of the major components of the Piper divaricatum essential oil obtained by supercritical CO2. J. Supercrit. Fluids 2019, 145, 74–84. [Google Scholar] [CrossRef]
- Gohlke, H.; Kiel, C.; Case, D.A. Insights into Protein–Protein Binding by Binding Free Energy Calculation and Free Energy Decomposition for the Ras–Raf and Ras–RalGDS Complexes. J. Mol. Biol. 2003, 330, 891–913. [Google Scholar] [CrossRef]
- Cruz, J.N.; Costa, J.F.S.; Khayat, A.S.; Kuca, K.; Barros, C.A.L.; Neto, A.M.J.C. Molecular dynamics simulation and binding free energy studies of novel leads belonging to the benzofuran class inhibitors of Mycobacterium tuberculosis Polyketide Synthase 13. J. Biomol. Struct. Dyn. 2019, 37, 1616–1627. [Google Scholar] [CrossRef]
- Pinto, V.; Araújo, J.; Silva, R.; da Costa, G.; Cruz, J.; De, A.; Neto, M.; Campos, J.; Santos, C.; Leite, F.; et al. In Silico Study to Identify New Antituberculosis Molecules from Natural Sources by Hierarchical Virtual Screening and Molecular Dynamics Simulations. Pharmaceuticals 2019, 12, 36. [Google Scholar] [CrossRef] [Green Version]
- Ramos, R.S.; Macêdo, W.J.C.; Costa, J.S.; de Silva, C.H.D.P.; Rosa, J.M.C.; da Cruz, J.N.; de Oliveira, M.S.; de Aguiar Andrade, E.H.; Silva, R.B.L.E.; Souto, R.N.P.; et al. Potential inhibitors of the enzyme acetylcholinesterase and juvenile hormone with insecticidal activity: Study of the binding mode via docking and molecular dynamics simulations. J. Biomol. Struct. Dyn. 2019, 1–23. [Google Scholar] [CrossRef]
- Cruz, J.V.; Serafim, R.B.; da Silva, G.M.; Giuliatti, S.; Rosa, J.M.C.; Neto, M.F.A.; Leite, F.H.A.; Taft, C.A.; da Silva, C.H.T.P.; Santos, C.B.R. Computational design of new protein kinase 2 inhibitors for the treatment of inflammatory diseases using QSAR, pharmacophore-structure-based virtual screening, and molecular dynamics. J. Mol. Model. 2018, 24, 225. [Google Scholar] [CrossRef]
Sample Availability: Samples of the compounds are not available from the authors. |


| Spatial Characteristics | X | Y | Z | Radius |
|---|---|---|---|---|
| Aromatic 1 (AR1) | −5.449 | −10.056 | 53.789 | 1.1 |
| Aromatic 2 (AR2) | −4.468 | −9.125 | 52.185 | 1.1 |
| Hydrogen Acceptor 1 (HA1) | −5.990 | −10.020 | 55.012 | 0.5 |
| Hydrogen Acceptor 2 (HA2) | −4.278 | −8.013 | 52.455 | 0.5 |
| Hydrogen Acceptor 3 (HA4) | −5.467 | −11.213 | 52.094 | 0.5 |
| Hydrogen Acceptor 4 (HA4) | −5.735 | −10.642 | 47.065 | 0.5 |
| Compound | CODE | HG a | PF b | NA c | MP d | MV e | AR f |
|---|---|---|---|---|---|---|---|
| 1 | UK-432097 | 3 | 26 | 104 | 82.39 | 2155.82 | 5 |
| 2 | BDBM50385948 | 3 | 19 | 64 | 52.03 | 1379.46 | 4 |
| 3 | BDBM50150762 | 3 | 25 | 67 | 51.53 | 1393.64 | 3 |
| 4 | BDBM50150765 | 2 | 23 | 63 | 51.69 | 1381.93 | 3 |
| 5 | BDBM50385955 | 3 | 20 | 61 | 50.20 | 1317.10 | 5 |
| 6 | BDBM50150764 | 2 | 26 | 65 | 51.69 | 1420.28 | 4 |
| 7 | BDBM50385957 | 1 | 16 | 38 | 29.04 | 846.90 | 3 |
| 8 | BDBM50385950 | 4 | 23 | 84 | 68.15 | 1755.00 | 5 |
| 9 | BDBM50385947 | 4 | 24 | 81 | 65.16 | 1738.51 | 3 |
| 10 | BDBM50150767 | 2 | 25 | 64 | 49.70 | 1361.57 | 3 |
| 11 | BDBM50150766 | 2 | 23 | 63 | 49.06 | 1339.60 | 3 |
| 12 | BDBM50385958 | 2 | 19 | 56 | 43.81 | 1205.69 | 4 |
| 13 | BDBM50385943 | 2 | 20 | 58 | 45.16 | 1243.14 | 4 |
| 14 | BDBM50385946 | 16 | 38 | 95 | 72.06 | 1895.57 | 5 |
| 15 | BDBM50385944 | 2 | 18 | 56 | 46.44 | 1271.34 | 3 |
| 16 | BDBM50385945 | 16 | 36 | 94 | 71.43 | 1876.10 | 5 |
| 17 | BDBM50385949 | 4 | 22 | 82 | 66.80 | 1720.20 | 5 |
| 18 | BDBM50385954 | 6 | 28 | 107 | 88.15 | 2257.04 | 5 |
| 19 | BDBM50150763 | 2 | 24 | 63 | 50.99 | 1371.19 | 4 |
| 20 | BDBM50385952 | 18 | 39 | 120 | 94.42 | 2393.81 | 6 |
| 21 | BDBM50385956 | 18 | 41 | 118 | 93.22 | 2352.49 | 6 |
| Compound | Parametric QSAR Models (pEC50 = −logEC50) | Experimental (pEC50) | |||||
|---|---|---|---|---|---|---|---|
| Tetra- | Residual Values | Penta- | Residual Values | Hexa- | Residual Values | ||
| 1 | 8.98294818 | 0.197512 | 9.12779843 | 0.052662 | 8.642608925 | 0.537851 | 9.18046 |
| 2 * | 6.99156978 | 2.07901 | 7.13790683 | 1.932673 | 6.762230924 | 2.308349 | 9.07058 |
| 3 * | 8.27890486 | 0.574965 | 8.12289461 | 0.730975 | 7.763229123 | 1.090641 | 8.85387 |
| 4 * | 7.20833204 | 1.587548 | 6.98392019 | 1.81196 | 6.623110462 | 2.17277 | 8.79588 |
| 5 * | 6.4390024 | 2.255648 | 6.3982794 | 2.296371 | 5.974691405 | 2.719959 | 8.69465 |
| 6 | 8.39284814 | 0.115792 | 8.11686529 | 0.391775 | 7.793326136 | 0.715314 | 8.50864 |
| 7 | 7.76172650 | 0.490083 | 7.8997063 | 0.352104 | 7.565734821 | 0.686075 | 8.25181 |
| 8 * | 6.92233110 | 1.278329 | 6.94590035 | 1.25476 | 6.46444254 | 1.736217 | 8.20066 |
| 9 | 8.10517950 | 0.075281 | 8.2346837 | −0.054224 | 7.958933784 | 0.221526 | 8.18046 |
| 10 | 8.45979122 | −0.362881 | 8.24137752 | −0.144468 | 7.887637662 | 0.209272 | 8.09691 |
| 11 | 8.27402464 | −0.218505 | 8.18126794 | −0.125748 | 7.819516242 | 0.236004 | 8.05552 |
| 12 | 7.91841568 | 0.002404 | 8.05102783 | −0.130208 | 7.691452796 | 0.229367 | 7.92082 |
| 13 | 8.11225228 | −0.258382 | 8.20539668 | −0.351527 | 7.844506896 | 0.009363 | 7.85387 |
| 14 | 7.56453846 | 0.289332 | 7.54459856 | 0.309271 | 7.402379418 | 0.451491 | 7.85387 |
| 15 | 7.30993500 | 0.066815 | 7.4768018 | −0.100052 | 7.194105882 | 0.182644 | 7.37675 |
| 16 | 7.42057922 | −0.073789 | 7.53430987 | −0.18752 | 7.389967518 | −0.043178 | 7.34679 |
| 17 | 6.78045040 | 0.40001 | 6.8531334 | 0.327327 | 6.37965774 | 0.800802 | 7.18046 |
| 18 | 7.04603034 | 0.00118 | 7.04921319 | −0.002003 | 6.619084889 | 0.428125 | 7.04721 |
| 19 | 7.50229980 | −0.48907 | 7.23382085 | −0.220591 | 6.856821156 | 0.156409 | 7.01323 |
| 20 | 6.34535314 | 0.091167 | 6.41080264 | 0.025717 | 6.027298653 | 0.409221 | 6.43652 |
| 21 | 5.96752642 | −0.318166 | 5.79898512 | −0.149625 | 5.399238413 | 0.250122 | 5.64936 |
| Compound | Code | MV a | MP b | NA c | PF d | HG e | AR f | EC50 (nM) |
|---|---|---|---|---|---|---|---|---|
| 22 | BDBM35804 (CGS21680) | 1383.25 | 50.59 | 64 | 22 | 3 | 3 | 2.12 |
| 23 | BDBM50079321 | 1487.3 | 54.92 | 70 | 18 | 1 | 3 | 4.89 |
| 24 | BDBM50026816 | 1834.39 | 66.65 | 81 | 27 | 4 | 4 | 5.86 |
| 25 | BDBM50078426 | 1042.47 | 36 | 45 | 19 | 2 | 3 | 9.75 |
| 26 | BDBM50079322 | 1395.7 | 52.9 | 70 | 18 | 1 | 3 | 10.16 |
| 27 | BDBM21220 (NECA) | 855.09 | 29.13 | 38 | 15 | 1 | 2 | 12.58 |
| 28 | BDBM50385958 | 1218.48 | 43.81 | 56 | 18 | 2 | 3 | 12.00 |
| Compound | Parametric QSAR Models | Experimental (pEC50) b | |||||
|---|---|---|---|---|---|---|---|
| Tetra- | Residual Values a | Penta- | Residual Values a | Hexa- | Residual Values a | ||
| BDBM35804 (CGS21680) | 8.10378 | 0.56982 | 8.17729 | 0.49631 | 7.89214 | 0.78146 | 8.6736 |
| BDBM50079321 | 8.59992 | −0.28932 | 8.92832 | −0.61772 | 8.51537 | −0.20477 | 8.3106 |
| BDBM50026816 | 8.91106 | −0.67896 | 8.98461 | −0.75251 | 8.85516 | −0.62306 | 8.2321 |
| BDBM50078426 | 7.96806 | 0.04284 | 8.06957 | −0.05867 | 7.85361 | 0.15729 | 8.0109 |
| BDBM50079322 | 8.25996 | −0.26686 | 8.4744 | −0.4813 | 7.91206 | 0.08104 | 7.9931 |
| BDBM21220 (NECA) | 7.87135 | 0.02895 | 8.11297 | −0.21267 | 7.80671 | 0.09359 | 7.9003 |
| BDBM50385958 | 8.16918 | −0.24838 | 8.42937 | −0.50857 | 8.11924 | −0.19844 | 7.9208 |
| Compounds | Database | Code |
|---|---|---|
 | Drug Database ZINC | ZINC00000416 MolPort-003-666-813 |
 | Chembridge Diverset CL | 10002403. |
 | Chembridge Diverset EXP | 5193875. |
 | Chembridge Diverset EXP | 6942649. |
 | Chembridge Diverset EXP | 7928320. |
 | Natural ZINC | ZINC04257548 MolPort-002-509-467 |
| Compound | HOA a | %HOA b | QPPCaco c | QPPMDCK d | QPlogPo/w e | CNS f | QPlogBB g |
|---|---|---|---|---|---|---|---|
| UK−432097 | Medium | 27.582 | 24.065 | 17.281 | 2.526 | −2 | −3.029 |
| ZINC00000416 | Medium | 70.681 | 36.174 | 15.137 | 2.706 | −2 | −1.582 |
| 10002403 | High | 92.066 | 293.027 | 145.218 | 3.581 | 1 | −0.328 |
| 5193875 | High | 100.000 | 983.532 | 485.909 | 4.935 | −1 | −0.842 |
| 6942649 | High | 82.447 | 309.168 | 216.994 | 1.867 | −1 | −0.938 |
| 7928320 | High | 93.856 | 441.554 | 204.465 | 3.342 | −2 | −1.382 |
| ZINC04257548 | Medium | 65.251 | 75.562 | 30.334 | 0.801 | −2 | −2.344 |
| Compound Code | Toxicity Prediction Alert (Lhasa Prediction) | Toxicophoric Group | Toxicity Alert | Toxicity Prediction (Custom Prediction) |
|---|---|---|---|---|
| UK-432097 | Carcinogenicity | Pyrimidine or substituted purine | PLAUSIBLE | Nothing to declare |
| ZINC00000416 | Skin sensitization | Phenol or precursor | PLAUSIBLE | Nothing to declare |
| 10002403 | - | - | - | Nothing to declare |
| 5193875 | Skin sensitization | Catechol or precursor; Hydrazine or precursor | PLAUSIBLE | Nothing to declare |
| 6942649 | Skin sensitization | Phenol or precursor | PLAUSIBLE | Nothing to declare |
| 7928320 | Proliferation of peroxisome | Alkyl aryl Bi aryl carboxylic acid or precursor | IMPROBABLE | Nothing to declare |
| Skin sensitization | Primary or secondary aromatic amine | PLAUSIBLE | ||
| ZINC04257548 | Skin sensitization | Enol ether | PLAUSIBLE | Nothing to declare |
| Resorcinol or precursor |
| Compound Code | Molecular Properties | Parametric QSAR Models (pEC50 = −logEC50) | |||||||
|---|---|---|---|---|---|---|---|---|---|
| MV a | MP b | NA c | PF d | HG e | AR f | Tetra- | Penta- | Hexa- | |
| ZINC00000416 | 990.05 | 37.00 | 48 | 13 | 3 | 2 | 6.72890 | 7.16159 | 6.78904 |
| 10002403 | 1188.63 | 44.45 | 57 | 15 | 4 | 3 | 7.05978 | 7.54407 | 7.21051 |
| 5193875 | 1141.29 | 43.64 | 52 | 13 | 4 | 3 | 5.63389 | 6.06614 | 5.74906 |
| 6942649 | 802.06 | 32.34 | 32 | 11 | 0 | 4 | 3.35970 | 3.16129 | 2.66112 |
| 7928320 | 1144.49 | 43.24 | 50 | 12 | 3 | 3 | 5.69190 | 6.14174 | 5.84216 |
| ZINC04257548 | 1183.02 | 44.36 | 57 | 19 | 1 | 3 | 7.43343 | 7.38310 | 6.89273 |
| Receptor | Ligand | Experimental Binding Affinity * (kcal/mol) | Ki (nM) hA2AR | Docking Predicted Binding affinity (kcal/mol) | Resolution (Å) |
|---|---|---|---|---|---|
| PDB ID 3QAK | UK-432097 | −11.45 | 4.00 [39,49] | −10.00 | 2.71 |
| −11.35 | 4.75 [18] |
| Ligand | Terms | ||||
|---|---|---|---|---|---|
| ΔEvdW | ΔEele | ΔGGB | ΔGNP | ΔGbind | |
| Regadenoson | −51.85 ± 0.18 | −20.22 ± 0.37 | 59.03 ± 0.22 | −33.02 ± 0.01 | −46.06 ± 0.25 |
| UK-432097 | −49.78 ± 0.23 | −31.63 ± 0.44 | 41.03 ± 0.32 | −11.23 ± 0.01 | −51.61 ± 0.28 |
| ZINC00000416 | −47.88 ± 0.15 | −23.78 ± 0.24 | 36.43 ± 0.14 | −6.84 ± 0.01 | −42.07 ± 0.19 |
| 10002403 | −48.16 ± 0.20 | −21.59 ± 0.32 | 35.70 ± 0.24 | −6.50 ± 0.01 | −40.55 ± 0.25 |
| 5193875 | −48.62 ± 0.15 | −7.92 ± 0.21 | 23.69 ± 0.15 | −7.51 ± 0.01 | −40.36 ± 0.18 |
| 6942649 | −28.31 ± 0.15 | −23.15±0.31 | 24.51 ± 0.39 | −6.44 ± 0.01 | −33.39 ± 0.22 |
| 7928320 | −45.57 ± 0.18 | −33.31 ± 0.43 | 46.36 ± 0.31 | −6.44 ± 0.01 | −38.96 ± 0.20 |
| ZINC04257548 | −49.83 ± 0.19 | −42.54 ± 0.55 | 58.17 ± 0.37 | −7.15 ± 0.01 | −41.35 ± 0.22 |
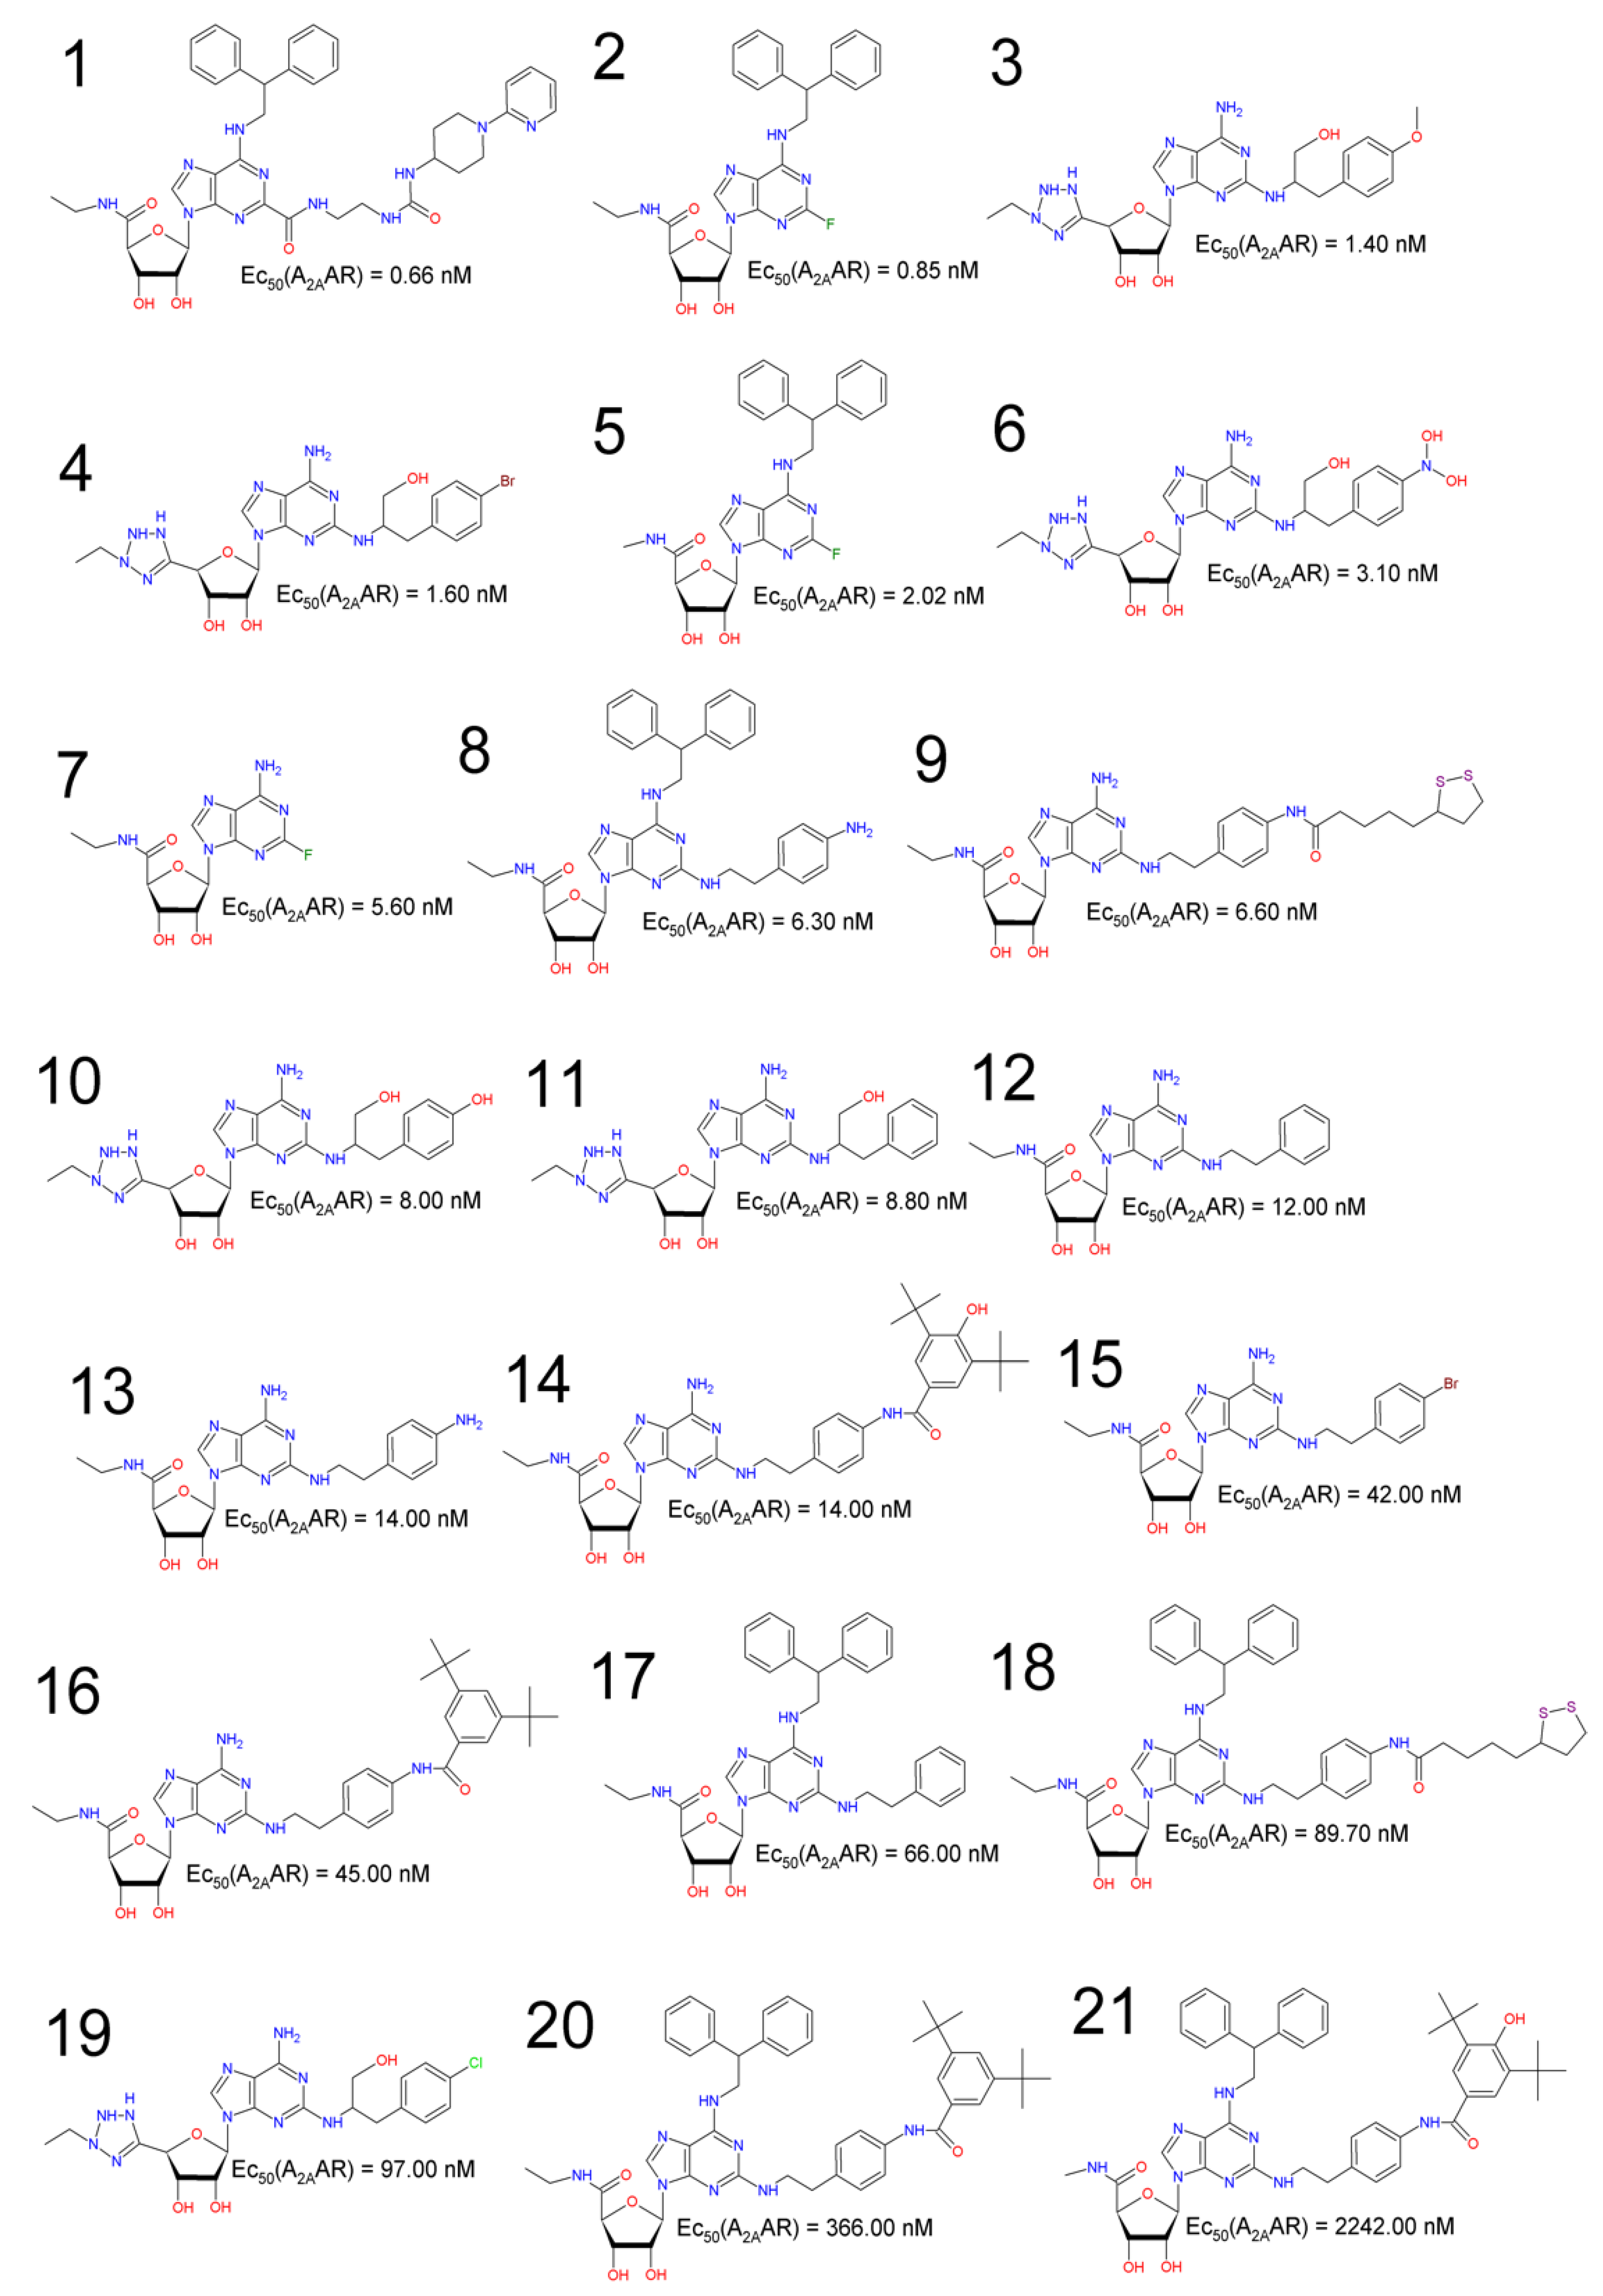
| Compound | Code | EC50 (nM) | pEC50 [a] | Reference |
|---|---|---|---|---|
| 1 | UK-432097 | 0.66 | 9.18046 | [18] |
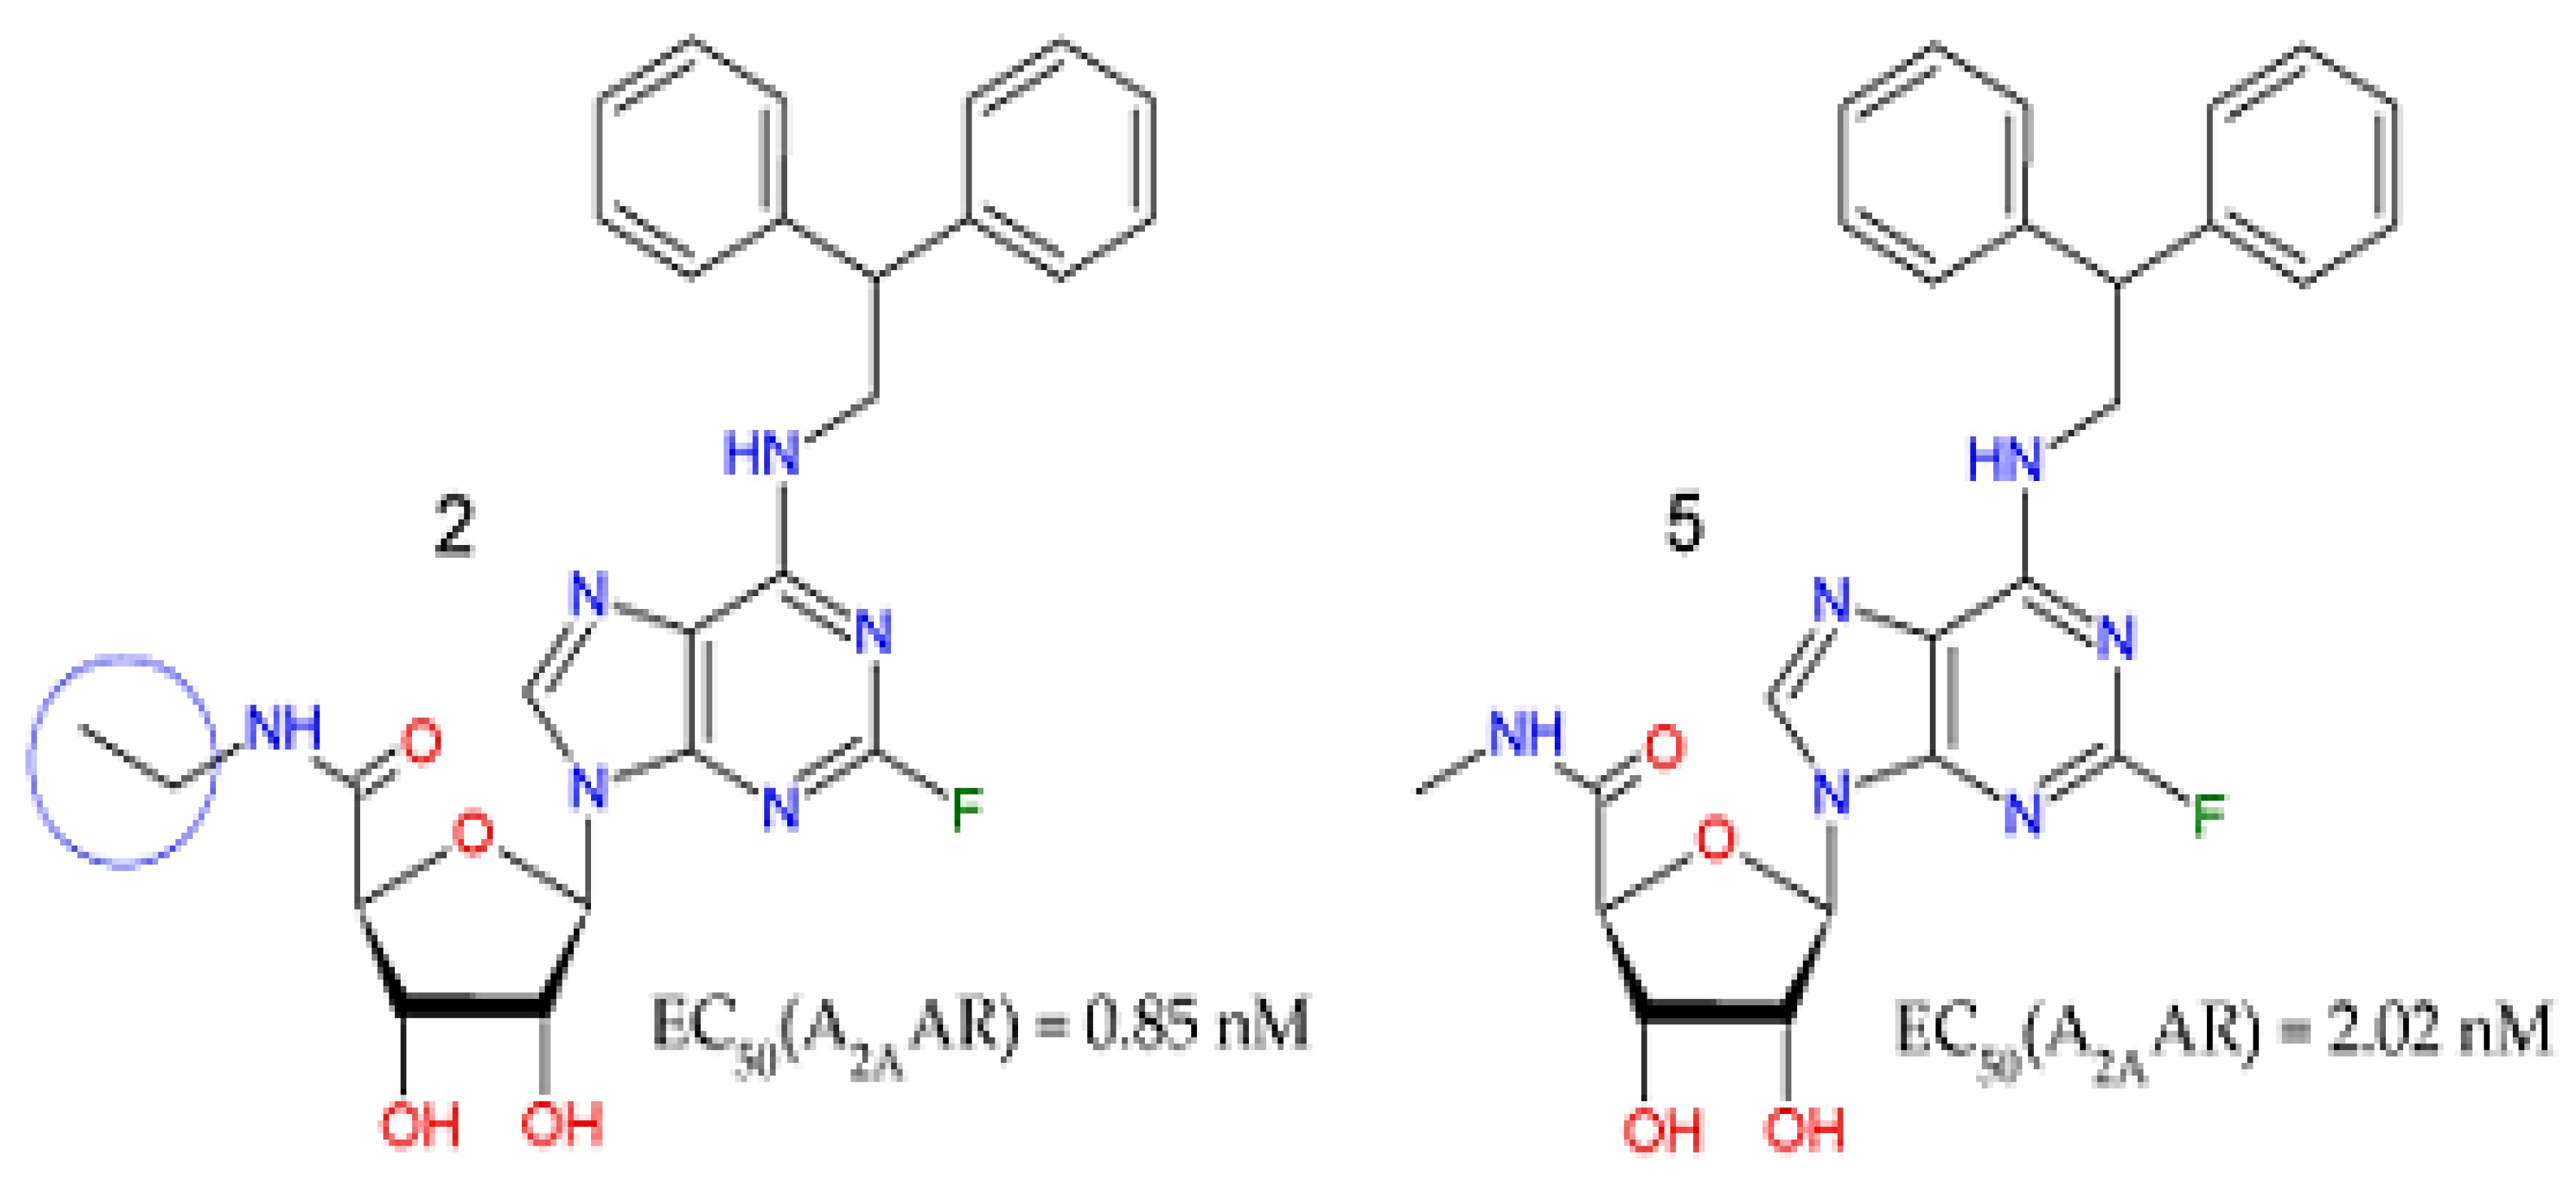
| 2 | BDBM50385948 | 0.85 | 9.07058 | [16] |
| 3 | BDBM50150762 | 1.40 | 8.85387 | [51] |
| 4 | BDBM50150765 | 1.60 | 8.79588 | [51] |
| 5 | BDBM50385955 | 2.02 | 8.69465 | [16] |
| 6 | BDBM50150764 | 3.10 | 8.50864 | [51] |
| 7 | BDBM50385957 | 5.60 | 8.25181 | [16] |
| 8 | BDBM50385950 | 6.30 | 8.20066 | [16] |
| 9 | BDBM50385947 | 6.60 | 8.18046 | [16] |
| 10 | BDBM50150767 | 8.00 | 8.09691 | [51] |
| 11 | BDBM50150766 | 8.80 | 8.05552 | [51] |
| 12 | BDBM50385958 | 12.00 | 7.92082 | [16] |
| 13 | BDBM50385943 | 14.00 | 7.85387 | [16] |
| 14 | BDBM50385946 | 14.00 | 7.85387 | [16] |
| 15 | BDBM50385944 | 42.00 | 7.37675 | [16] |
| 16 | BDBM50385945 | 45.00 | 7.34679 | [16] |
| 17 | BDBM50385949 | 66.00 | 7.18046 | [16] |
| 18 | BDBM50385954 | 89.70 | 7.04721 | [16] |
| 19 | BDBM50150763 | 97.00 | 7.01323 | [51] |
| 20 | BDBM50385952 | 366.00 | 6.43652 | [16] |
| 21 | BDBM50385956 | 2242.00 | 5.64936 | [16] |
| Receptor | Ligand * | Coordinates of the Grid Center (Angstrom) | Grid dimensions (Angstrom) |
|---|---|---|---|
| A2AAR (PDB ID 3QAK) | UK-432097 | X = −7.076 Y = −9.074 Z = 55.148 | X = 52 Y = 38 Z = 60 |
© 2020 by the authors. Licensee MDPI, Basel, Switzerland. This article is an open access article distributed under the terms and conditions of the Creative Commons Attribution (CC BY) license (http://creativecommons.org/licenses/by/4.0/).
Share and Cite
Santos, K.L.B.d.; Cruz, J.N.; Silva, L.B.; Ramos, R.S.; Neto, M.F.A.; Lobato, C.C.; Ota, S.S.B.; Leite, F.H.A.; Borges, R.S.; Silva, C.H.T.P.d.; et al. Identification of Novel Chemical Entities for Adenosine Receptor Type 2A Using Molecular Modeling Approaches. Molecules 2020, 25, 1245. https://doi.org/10.3390/molecules25051245
Santos KLBd, Cruz JN, Silva LB, Ramos RS, Neto MFA, Lobato CC, Ota SSB, Leite FHA, Borges RS, Silva CHTPd, et al. Identification of Novel Chemical Entities for Adenosine Receptor Type 2A Using Molecular Modeling Approaches. Molecules. 2020; 25(5):1245. https://doi.org/10.3390/molecules25051245
Chicago/Turabian StyleSantos, Kelton L. B. dos, Jorddy N. Cruz, Luciane B. Silva, Ryan S. Ramos, Moysés F. A. Neto, Cleison C. Lobato, Sirlene S. B. Ota, Franco H. A. Leite, Rosivaldo S. Borges, Carlos H. T. P. da Silva, and et al. 2020. "Identification of Novel Chemical Entities for Adenosine Receptor Type 2A Using Molecular Modeling Approaches" Molecules 25, no. 5: 1245. https://doi.org/10.3390/molecules25051245