Article

Carbon Xerogel Nanostructures with Integrated Bi and Fe Components for Hydrogen Peroxide and Heavy Metal Detection

1
Department of Chemical Engineering, Faculty of Chemistry and Chemical Engineering, “Babes-Bolyai” University, Arany Janos 11, RO-400028 Cluj-Napoca, Romania
2
Laboratory of Advanced Materials and Applied Technologies, Institute for Research-Development-Innovation in Applied Natural Sciences, “Babes-Bolyai” University, Fântânele 30, RO-400294 Cluj-Napoca, Romania
3
Department of Condensed Matter Physics and Advanced Technologies, Faculty of Physics, “Babes-Bolyai” University, M. Kogalniceanu 1, RO-400084 Cluj-Napoca, Romania
4
Nanostructured Materials and Bio-Nano-Interfaces Center, Institute of Interdisciplinary Research in Bio-Nano-Sciences, “Babes-Bolyai” University, T. Laurean 42, RO-400271 Cluj-Napoca, Romania
5
LPICM, CNRS, Ecole Polytechnique, IPParis, 91228 Palaiseau, France
6
Laboratoire de Physique de la Matière Condensée, Ecole Polytechnique, IPParis, 91228 Palaiseau, France
7
Department of Biomolecular Physics, Faculty of Physics, “Babes-Bolyai” University, M. Kogalniceanu 1, RO-400084 Cluj-Napoca, Romania
8
Laboratory Optical Processes in Nanostructure Materials, National Institute of Materials Physics, Atomistilor str. 405 A, 77125 Bucharest, Romania
*
Authors to whom correspondence should be addressed.
Molecules 2021, 26(1), 117; https://doi.org/10.3390/molecules26010117
Submission received: 7 December 2020 / Revised: 24 December 2020 / Accepted: 24 December 2020 / Published: 29 December 2020
(This article belongs to the Special Issue Electrochemical Applications of Carbon-Based Nanomaterials)

Abstract

:
Multifunctional Bi- and Fe-modified carbon xerogel composites (CXBiFe), with different Fe concentrations, were obtained by a resorcinol–formaldehyde sol–gel method, followed by drying in ambient conditions and pyrolysis treatment. The morphological and structural characterization performed by X-ray diffraction (XRD), Raman spectroscopy, N2 adsorption/desorption porosimetry, scanning electron microscopy (SEM) and scanning/transmission electron microscopy (STEM) analyses, indicates the formation of carbon-based nanocomposites with integrated Bi and Fe oxide nanoparticles. At higher Fe concentrations, Bi-Fe-O interactions lead to the formation of hybrid nanostructures and off-stoichiometric Bi2Fe4O9 mullite-like structures together with an excess of iron oxide nanoparticles. To examine the effect of the Fe content on the electrochemical performance of the CXBiFe composites, the obtained powders were initially dispersed in a chitosan solution and applied on the surface of glassy carbon electrodes. Then, the multifunctional character of the CXBiFe systems is assessed by involving the obtained modified electrodes for the detection of different analytes, such as biomarkers (hydrogen peroxide) and heavy metal ions (i.e., Pb2+). The achieved results indicate a drop in the detection limit for H2O2 as Fe content increases. Even though the current results suggest that the surface modifications of the Bi phase with Fe and O impurities lower Pb2+ detection efficiencies, Pb2+ sensing well below the admitted concentrations for drinkable water is also noticed.

1. Introduction

The detection of water contaminants such as heavy metals represents a significant research focus for present concern due to their significant threat to human health, animal health, and the environment [1]. Additionally, biomolecule detection such as hydrogen peroxide, dopamine, uric acid, etc. plays a crucial role in clinical diagnoses as well as in many industrial applications, such as food processing, pharmaceutical industries, paper bleaching, mineral processing, environmental analysis, and cleaning products [2].
Various analytical methods have been employed for detection of heavy metals or biomarkers including atomic fluorescence spectrometry [3], atomic absorbance spectrometry [4], chemiluminescence [5], chemiresistor [6], electrochemical [7,8,9], and colorimetric [10] sensors. Among most of the above-mentioned methods, which suffer from some technical downsides involving time-consumption, costs, or low sensitivity and selectivity, the electrochemical detection technique shows promising prospects due to its high sensitivity, high selectivity, simple instrumentation, fast response, miniaturization capabilities, portability and low cost [1].
For both biomarker [2] or heavy metal [11] detection, most of sensor preparation methods were based on the immobilization of different type of enzymes (such as horseradish peroxidase, cytochrome, myoglobin, glucose oxidase, acetylcholinesterase, etc.) on the electrodes surface previously functionalized, leading thus to a remarkable selectivity and high sensitivity [2,11]. Such enzyme-based sensors presents notable disadvantages due to the complex enzyme immobilization procedures, the strong influence of the experimental conditions (temperature, humidity, pH, light, etc.) on the sensor stability, and the particular nature of the enzymes, which also greatly influences the sensor stability [1,2,11].
Consequently, many efforts have been dedicated to the development of non-enzymatic electrochemical sensors for heavy metals [1,12] or biomarkers [2] detection. Development of innovative sensitive and cost-effective electrochemical sensors based on different carbonaceous nanocomposite materials, fabricated by different techniques, for the detection of biomolecules, or heavy metal ions has often been in the research focus. Carbonaceous-based nanomaterials such as graphite [13], carbon fibers [14], carbon aerogel [8,15,16], carbon xerogels [7,9], carbon nanotubes (single walled or multi-walled) [17], graphene [18], have been used as the conductive phase in different composite materials suitable for electrochemical detection of biomolecules [2], or heavy metals ions [12]. There is a variety of functional converters/additives such as metal nanoparticles (Au, Ag, Pd, Ir, Sb, St, Hg, and Bi), metal oxides (Bi2O3, Ce3O4, Fe3O4, SnO2, NiO, SnO2, Co3O4, MnFe2O4, MnCo2O4 NPs, ZnFe2O4), non-metals (N), halogen (F), alloys (AuPt alloy microsphere) [19,20,21], etc., which can be physically, chemically, or electrochemically introduced into the carbon matrix.
Among this variety of carbonaceous nanocomposite materials, Bi supporting carbon xerogel nanomaterials (CXBi) represent a good candidate for heavy metal detection [7,9], and so far, to the best of our knowledge, the properties of Bi-nanocomposite systems were not fully exploited. As major advantages to the functionality of the binary carbon-metal/oxide system, the CX is endowed with tunable morphological and structural properties and possesses a good electrical conductivity, high porosity and surface area [7,9]. Complementary, Bi adds to the nanocomposite system other important benefits such as (i) good electrochemical properties, i.e., large cathodic potential range and less sensitive to the dissolved oxygen [21]; (ii) its ability to form “fusible alloys” with heavy metals; (iii) good catalytic properties; (iv) low toxicity and environmental friendliness.
In our previous study we reported the use of high mesoporous Fe doped carbon aerogel for modified carbon paste electrodes preparation to catalyze the H2O2 electroreduction [8]. Based on these findings related to the applications of nanocomposite materials and their electrochemical applications [7,9,22,23], herein we combine the benefits of the presence of both Fe and Bi-based nanoparticles within the carbon xerogel matrix. Thus, this time the aim is to investigate the influence of Fe concentration on both the morphological and structural characteristics as well as the detection efficiency of both heavy metal (Pb2+), due to the presence of Bi, and biomarker (H2O2), due to the presence of Fe.

2. Materials and Methods

2.1. Reagents

Unless otherwise indicated, reagents were purchased from Sigma Aldrich and were used without any further purification: resorcinol (m-C6H4(OH)2, 99%), formaldehyde solution (37 wt.% in H2O, stabilized with methanol, Chem-Lab), bismuth (III) nitrate pentahydrate [Bi(NO3)3·5H2O, 98%, Alfa Aesar], acetic acid (CH3COOH, 99.7%), anhydrous iron (II) acetate (Fe(OOCCH3)2, minimum Fe content 29.5%), acetic acid (CH3COOH, 99%), ammonium hydroxide water solution (NH4OH, 10 wt.%), glycerol formal (47–67% 5-hydroxy-1,3-dioxane, 33–53% 4-hydroxymethyl-1,3-dioxolane). All reagents were of analytical grade. Bidistilled water was used for the preparation of all solutions.

2.2. Synthesis of Bi/Fe/C Xerogel Ternary Composite

The composite synthesis started with the dissolution under stirring of 1.2 g Bi(NO3)3·5H2O in glycerol formal respecting 0.12 g/mL. Then, 2 g resorcinol (R) followed by the formaldehyde (F) solution were added respecting a molar ratio R/F as 0.5. As pH adjustment, 4 mL 10% solution of NH4OH was drop by drop added. When 12 mL of acetic acid was poured to the prepared mixture a clear solution was obtained. The iron as Fe(OOCCH3)2 was dissolute in the solution using different amounts of 0.01, 0.12 and 1.2 g. These are the precursor solution of the final CXBiFex materials, where x is standing for the initial Fe precursor content added to the synthesis and is 0.01, 0.12 and 1.2 g, respectively. As blank, a solution without iron is also included (CXBiFe0).
The obtained solutions were sealed in glass vessels and placed at 60 °C for 3 days. Wet gels with the geometry of the vessels were obtained. These were then rinsed two times with ethanol and hold in acetic acid for one day for washing. After a second step of rinsing with ethanol, the gels were dried in ambient conditions for several days until constant mass. The obtained organic xerogels embedded with Bi and Fe ions were pyrolyzed at 750 °C for 1 h using a heat rate of 3 °C/min and argon atmosphere to yield the final carbon xerogel nanocomposites.

2.3. Characterization Methods

X-ray diffraction (XRD) measurements were performed on a powder diffractometer (X’Pert, PANalytical) in Bragg–Brentano geometry, using Cu Kα1 radiation (graphite monochromator to avoid Fe fluorescence signal) equipped with a Miniprop punctual detector. The experimental setup was as follows: fixed divergence slit 0.5°, fixed anti-scatted slit 1°, fixed incident mask 10 mm, incident, and receiving Soller slits 0.02 rad. The data were collected from 12 to 80° 2θ, step size 0.03°, 20 sec/step. For the phase identification, the ICDD PDF2 (release 2004) was used.
Nitrogen adsorption–desorption analysis was performed with a Sorptomatic (Thermo Electron Corp.) equipment after degassing around 100 mg of the tested material for 20 h at 106 °C in vacuum (<1 mPa). The specific surface area was determined using the three-parameter BET (Brunauer–Emmet–Teller) method, while the pore size distribution and the cumulative pore volume were evaluated using the BJH (Barrett–Joyner–Halenda) model for the mesopore range and the H–K (Horvath–Kawazoe) model for the micropore range.
Raman spectra were recorded with a Renishaw in Via Reflex Raman Microscope equipped with a Ren Cam charge-coupled device (CCD) detector. The 532 nm laser line was used for excitation, and the spectra were collected with a 0.85 NA objective of 100× magnification. Typical integration times were of 30 s, and the laser power was 1 mW. The Raman spectra were recorded with a spectral resolution of 4 cm−1.
Scanning electron microscopy (SEM) studies were performed using a FEI Quanta 3D FEG dual beam microscope (FEI, Hillsboro, OR, USA), working in high vacuum mode using ETD (Everhart Thornley Detector). Transmission Electron Microscopy (TEM) analyses have been performed on two different transmission electron microscopes (Jeol 2010, JEOL Ltd., Tokyo, Japan and FEI Titan–Themis, FEI, Hillsboro, OR, USA) both operating at 200 kV accelerating voltage. For the chemical analyses we used a Titan–Themis operating at 200 KV equipped with a Cs probe corrector and a SuperX detector that allows chemical analyses of light and heavy elements through energy dispersive X-ray spectroscopy (EDX) with a spatial resolution within picometer range.

2.4. Preparation of the Glassy Carbon/Chitosan (GC/Chi)–CXBiFex Electrodes

Glassy carbon electrode (GCE) surface (with the geometrical area of 0.07 cm2) was carefully polished on alumina slurry (1 μm, and then 0.1 μm Stuers, Copenhagen, Denmark). Then, GCE surface was washed with bidistilled water. By sonication for 5 minutes in acetone the alumina particles were removed, concomitantly with other possible contaminants. All CXBiFex nanocomposites were immobilized onto GCE surface by using a solution of 10 mg chitosan (Chi) polymer in 10 mL of 0.1 M acetic acid. By adding 1 g/L CXBiFex and sonicated for 2 h, 5 µL of the resulted mixture were placed onto the clean GCE surfaces. Then, by keeping for drying under a beaker for 2 h at room temperature the GC/Chi–CXBiFex electrodes were obtained.

2.5. Electrochemical Measurements

For electrochemical measurements, a PC controlled electrochemical analyzer (AUTOLAB PGSTAT302N EcoChemie, Utrecht, Netherlands) was used. A conventional three-electrode cell, equipped with GC/Chi–CXBiFex as working electrode, an Ag/AgCl, KCl sat. as reference electrode, and a Pt wire, as counter electrode was used. The electrochemical impedance spectroscopy investigations were carried out at room temperature, by immersing the working electrodes (GC and GC/Chi–CXBiFex), in 0.1 M acetate buffer containing 5 mM [Fe(CN)6]3−/4−, in a frequency range from 104 Hz to 10−1 Hz. The electrochemical experiments were performed by cyclic voltammetry (CV) and square wave anodic stripping voltammetry techniques (SWASV). The electroanalytical detection of heavy metal (i.e., Pb2+) was carried out in 0.1 M acetate buffer (pH 4.5), after potentiostatic polarization at −1.4 V vs. Ag/AgCl, KCl sat. for 180 s, under constant stirring at 400 rpm. Then, after 10 s of equilibration from the stirring stopping the anodic voltametric scan was achieved. For hydrogen peroxide detection, the SWV investigations were carried out in 0.1 M phosphate buffer (pH 7). The electrochemical behavior of GC/Chi–CXBiFex was exploited for 1–10 pM Pb2+ detection, and 3–30 µM for hydrogen peroxide, respectively. All experiments were carried out at the ambient temperature.

3. Results and Discussions

Since a major objective of the present research was to extend the material’s functionality, the synthesis method involved was a sol–gel process based on the polycondensation reaction of resorcinol with formaldehyde that led to the obtaining of ternary composite materials made up from carbon, bismuth and iron components [24]. By adding in the well-adjusted pH reaction medium bismuth and iron salts as metal precursors (i.e., co-synthesis pathway [22]), organic–inorganic wet gels were first achieved. By drying in ambient condition and pyrolysis in inert atmosphere and high temperature (i.e., 750 °C/1 h) ternary xerogels were finally obtained. These are composed of a carbon nanoporous framework embedded with metal/oxide nanoparticles that resulted during the pyrolytic reduction process [22,23,24]. Insights about the structural characteristics that are reflected in their applicability in sensing field are further revealed.

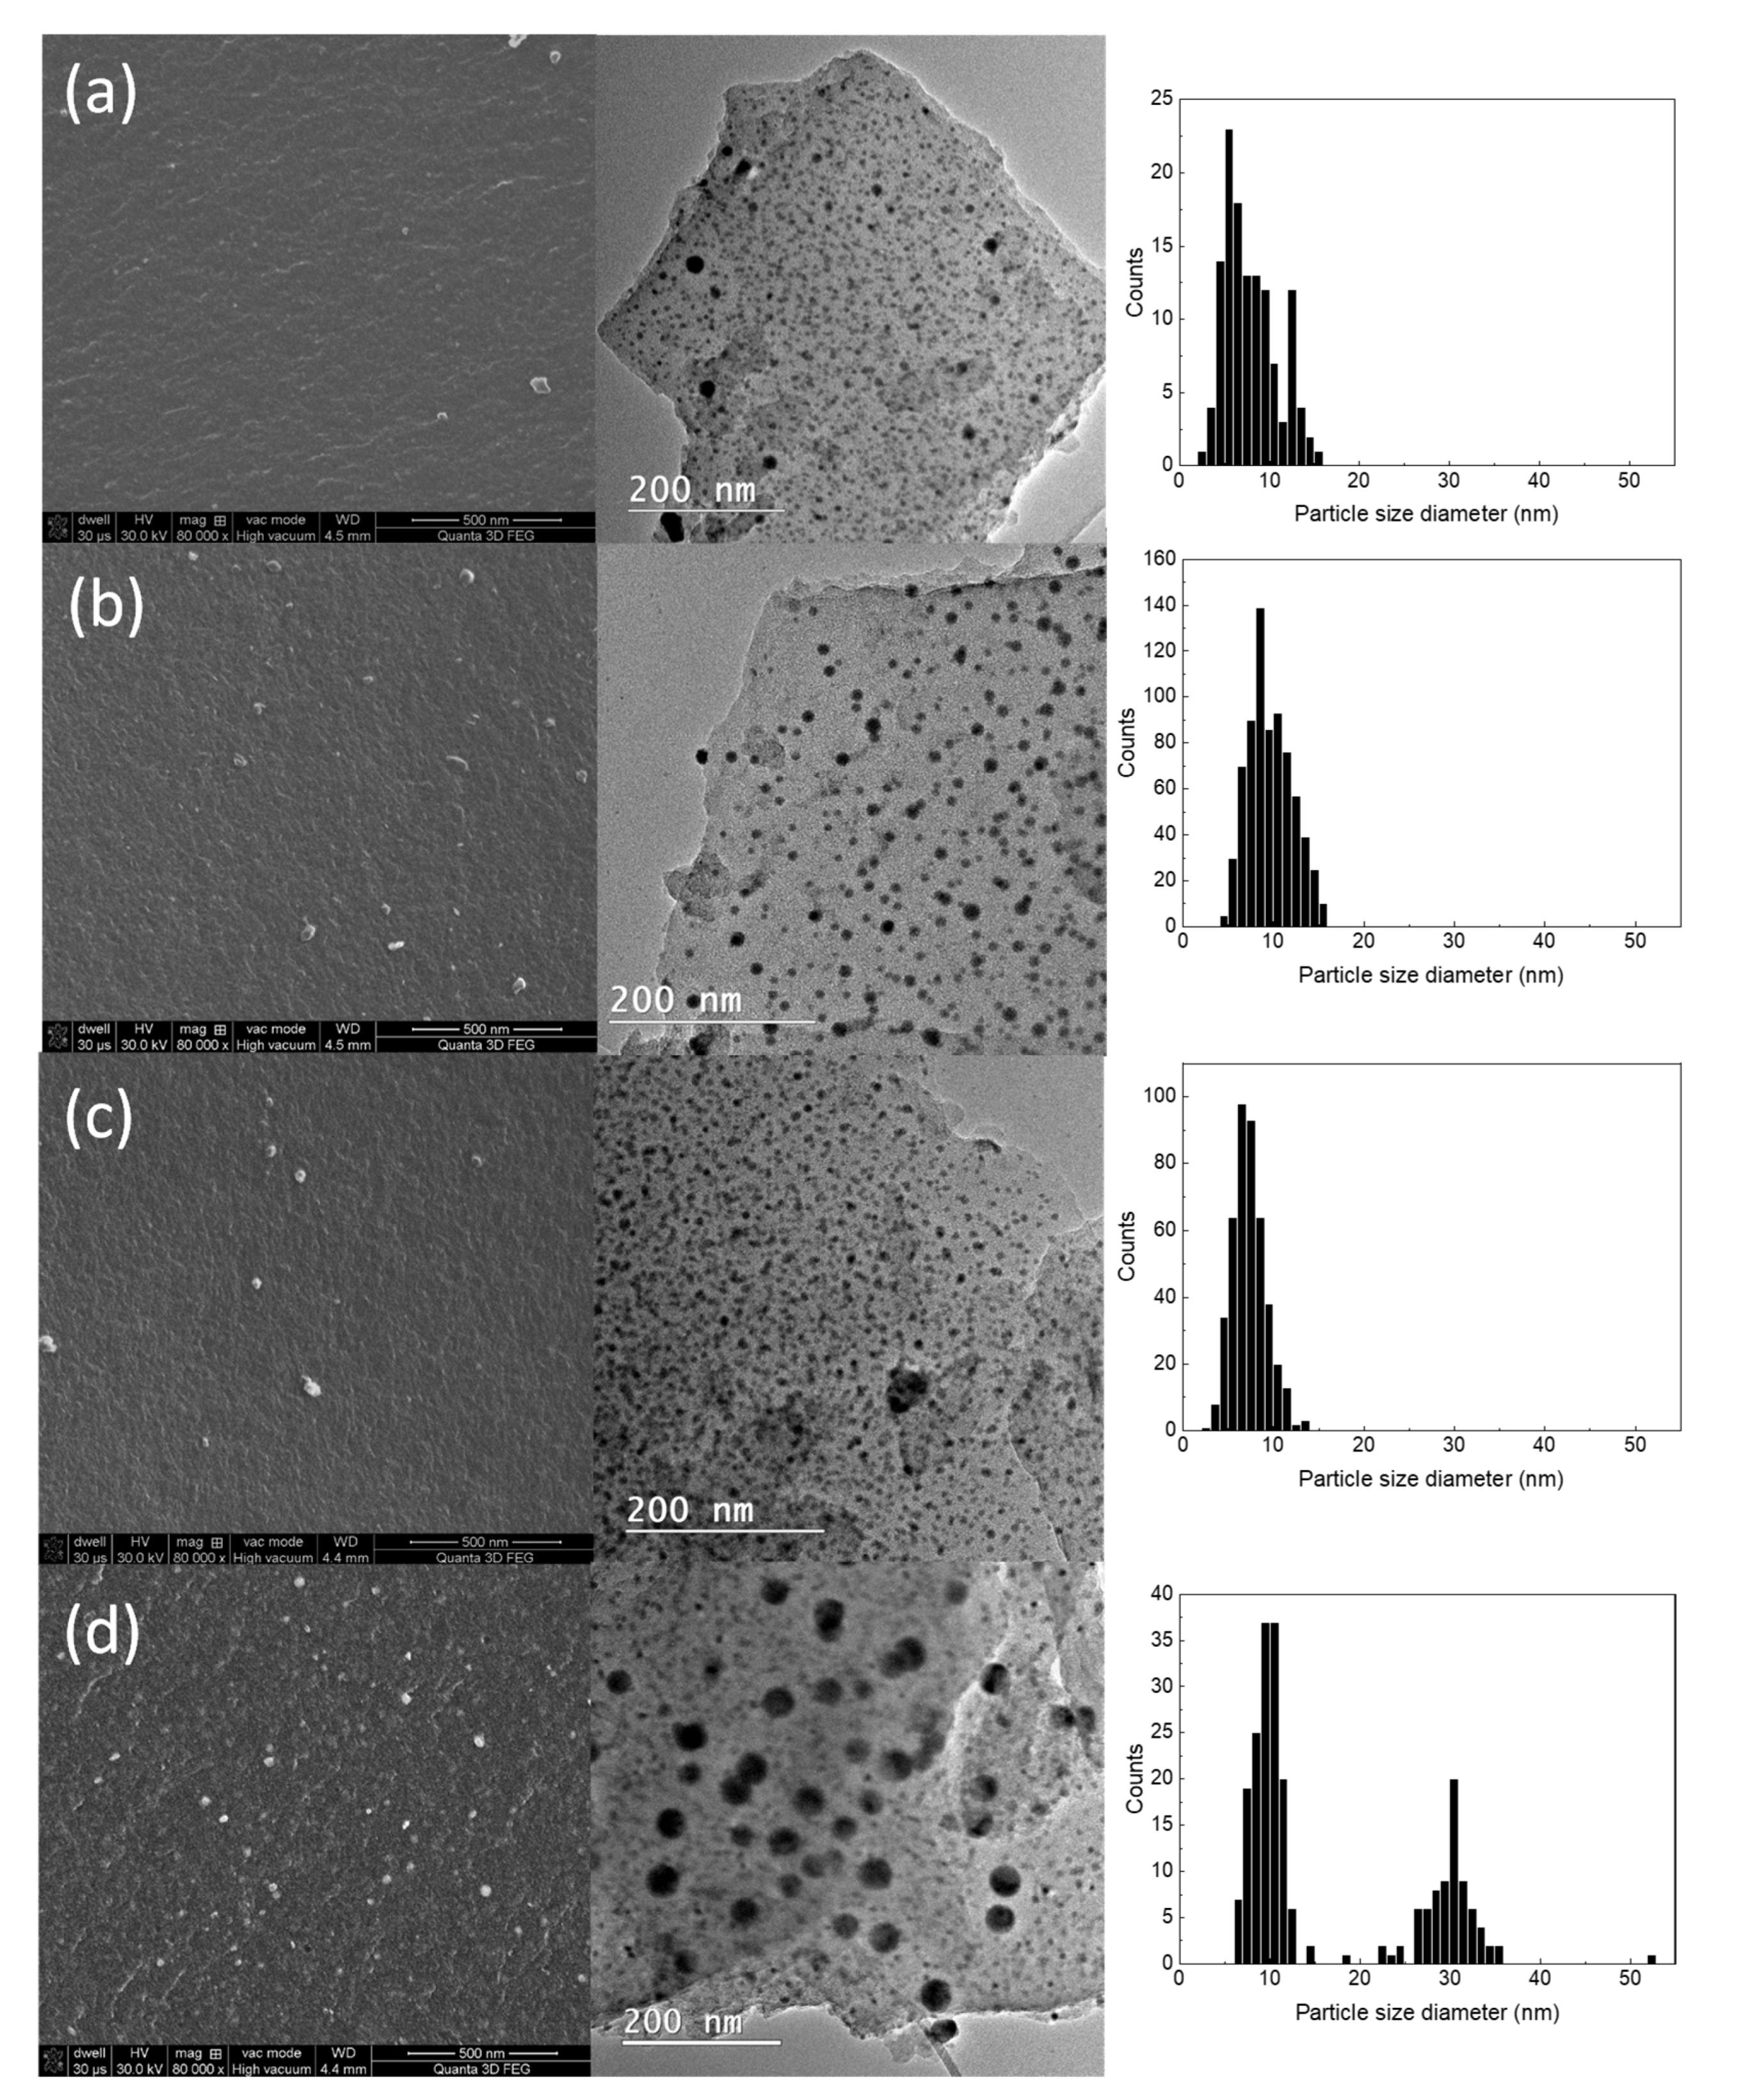
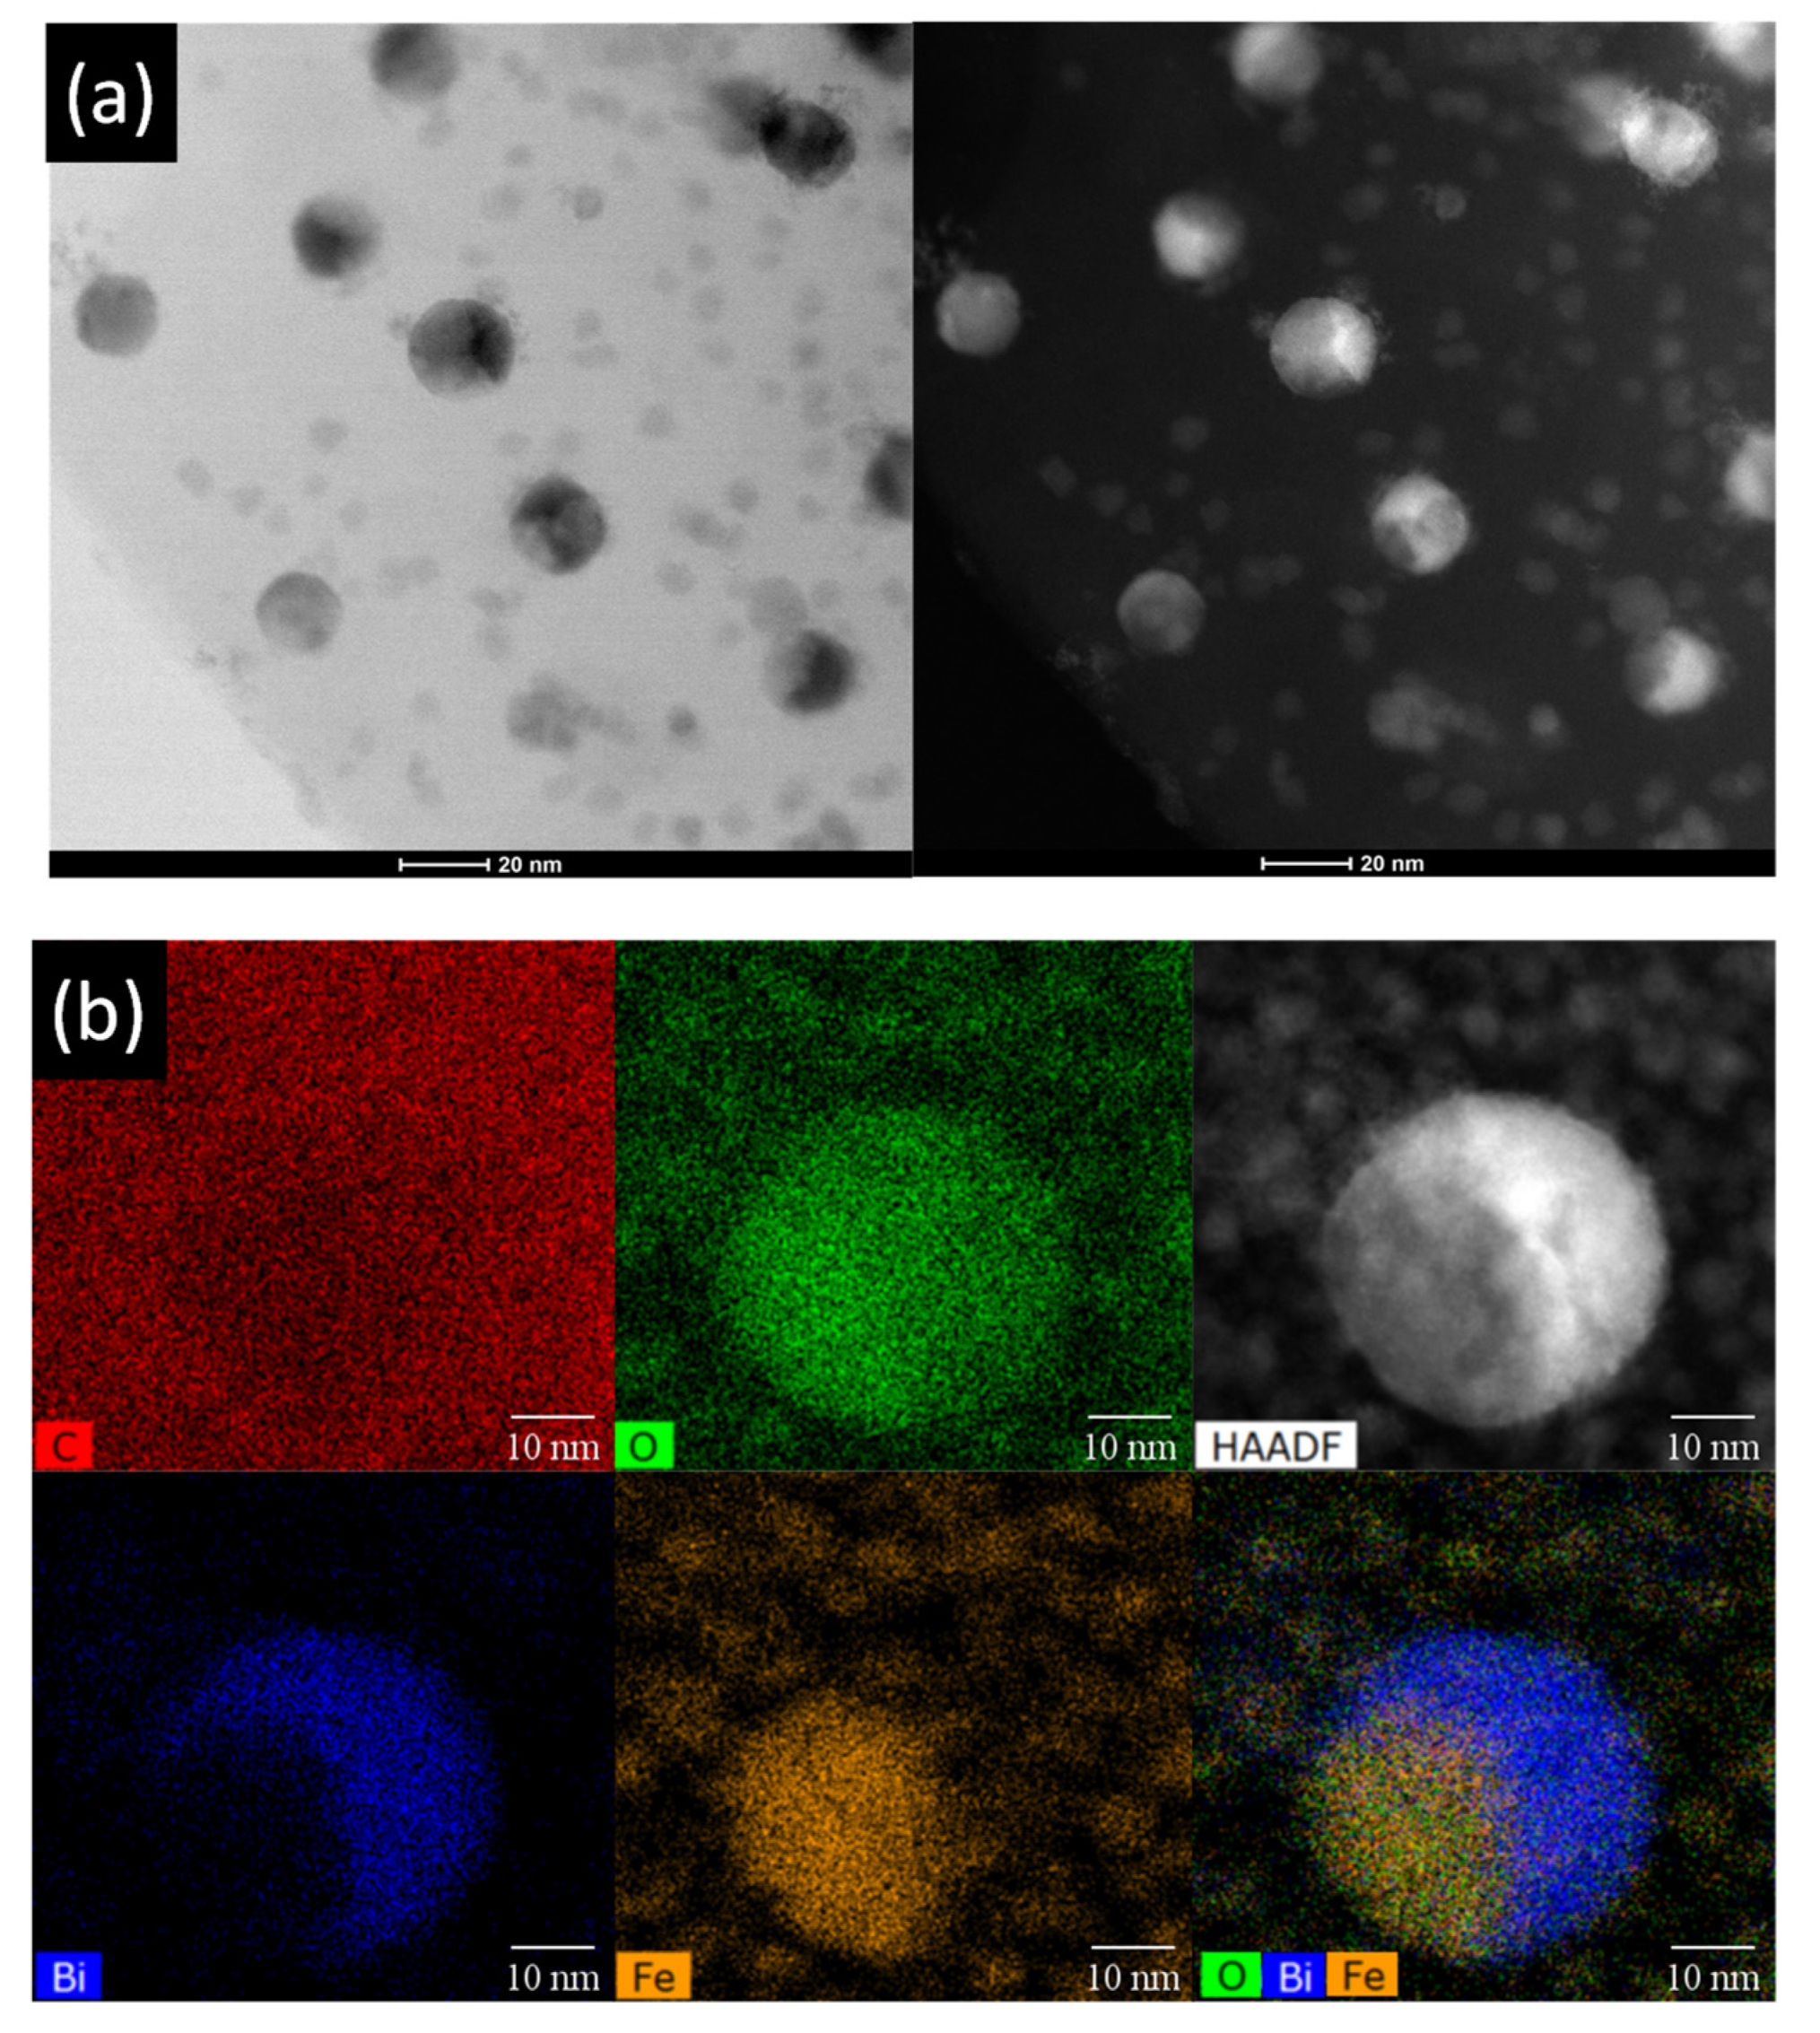
3.1. Morphological and Structural Analysis

Due to their wide area of sample analysis and large penetration depth, XRD investigations are initially performed to access the structural information characteristic to the investigated CXBiFex systems. The acquired diffractograms are presented in Figure 1I. The broad signals centered at 2θCu = 25° and 2θCu = 44° represent the reflections found in defect rich turbostratic carbon, while the broad signal at about 2θCu = 30° can be ascribed to bismuth oxide prior to crystallization. As observed, the crystalline reflections from the tetragonal Bi2O3 phase (JCPDS file 01-074-1374) are dominant for the CXBiFex composites with low Fe amounts. With the increase of the Fe concentration, the crystallinity of Bi2O3 phase is seen to drop, while iron oxide is identified as magnetite Fe3O4 (JCPDS file 01-075-0449) or maghemite γ-Fe2O3 (JCPDS file 00-024-0081). Indeed, by XRD, it is difficult to distinguish these two phases as they produce very similar peaks, which can contribute to the broadness of the peaks found at 2θCu= 35.8°, 57.4° and 63.2° together with the nano-size effects. For the CXBiFe1.2 sample, new intense reflections are observed at 2θCu = 28.2° and 29.0° corresponding to the mullite phase (Bi2Fe4O9, JCPDS file 00-020-0836).
Raman investigations were performed to detect if the presence of Fe in different concentration induces changes in the graphitization degree of the porous carbon matrix via the catalytic graphitization mechanism observed in previous studies [8]. From the Raman spectra presented in Figure 1II, the D and G signals characteristic to carbon structures are observed for all investigated systems. The first signal around 1348 cm−1 is characteristic to A1g defect activated vibrations and the second one around 1595 cm−1, due to the in plane E2g phonon found in sp2 graphitic carbons [25]. At present conditions, one can observe that the graphitization yield, expressed as ID/IG ratio (see Table 1), indicates no clear differences with variation of Fe content. However, as suggested by others, the ID/IG is not a fully characteristic figure of merit for carbon structures with small-sized graphene-like basal domains [25]. A certain degree of ordering can still be noticed with the increase of Fe concentration by observing that after a 4-signal deconvolution, the full width at height maxima of D1 and G bands (FWHMD and FWHMG) decrease with the increase of the Fe concentration (see Table 2). As confirmed by XRD measurements, Fe is essentially found in oxidized state. For this reason, the data suggests that carbothermal reduction reactions and graphitization mechanisms [26] may be active under the given conditions, but only found in an incipient stage.
The effects induced by the variation of Fe concentration over the microporous and mesoporous features of the investigated nanocomposites will affect the associated N2 adsorption/desorption isotherms as presented in Figure 1III. The samples with no or intermediate Fe concentrations show type III adsorption isotherms characterized by a convex shaped isotherm with respect to the P/P0 axis and no inflexion point at small relative pressure values. This feature is specific to systems with weak adsorbate-adsorbent interactions according to the IUPAC (International Union of Pure and Applied Chemistry) standards [27]. It can be observed that the CXBiFe1.2 sample with the highest Fe concentration exhibits a type I isotherm with high N2 adsorption amounts and a convex shaped isotherm for P/P0 < 0.35 followed by an inflexion point and steady increase until saturation.
The main data derived from the N2 isotherms together with the structural parameters achieved from Raman spectroscopy and TEM/SEM/EDX investigations are presented in Table 1 alongside other results already reported for similar C-Bi-based samples. The specific surface area follows a non-monotonous trend: the CXBiFe0 sample has the highest value of SBET = 181 m2/g and is followed by an abrupt decrease to SBET = 65 m2/g for CXBiFe0.01, and a further increase until SBET = 162 m2/g, for CXBiFe1.2 sample. Although the cumulative mesopore volume decreases with the increase of the Fe concentration, the micropore volumes follow an inverted trend. This could be because in some situations, Fe reinforces mesopore walls of the carbon structure. In other cases, by filling of mesopores with Fe nanoparticles micropores could be generated. An optimum ratio between precursors (i.e., C and Bi) permitted to have the highest specific surface area of CXBiFe0. The presence of Fe seems to decrease the specific surface area. Also, the higher Fe concentration could increase the loss of Bi content/component during pyrolytic treatment by local increase in temperature. The adsorption data suggest that the synthesis procedure that yielded the highest Fe concentration also tuned the pore formation mechanism towards the micropore range.
Electron microscopy investigations were further required to evaluate the changes in the nanocomposite morphology and structure when the Fe content is increased. As shown in Figure 2, the trapped amounts of Bi and Fe precursors form spheroidal nanoparticle systems imbedded in the pores of the carbon xerogel. Then, as suggested by the topological contrast specific to the SEM micrographs, the nanoparticles are exposed to the surrounding environment during the grinding of the pyrolyzed xerogel monoliths. As presented in Table 1, the elemental composition of the investigated nanocomposites indicates a steady increase of Fe concentration (in at. %) relative to the Bi content, which is kept constant throughout the synthesis step. As seen in the SEM and TEM micrographs and the measured particle size distributions, the average nanoparticle size is between 6-8 nm. At higher concentrations of Fe, the average size of the nanoparticles shifts towards larger values (10 nm), also emphasizing the appearance of secondary mode for nanoparticles with an average diameter of 30 nm for the CXBiFe1.2 sample.
Most notably, the high-angle annular dark-field scanning transmission electron microscopy (HAADF)-STEM-EDS analyses demonstrated the nanoparticles found in CXBiFe1.2 sample as being hybrid structures, as presented in Figure 3. In the HAADF images, due to the enhanced Z-contrast between Bi and Fe, the free-standing nanoparticles and the regions of the hybrid structures with weaker contrast are associated with Fe-rich phases such as Fe3O4 or Bi2Fe4O9, while the brighter region are associated with Bi-rich phases such as Bi2O3. This is well represented in the EDX maps that further confirmed the heterogeneous distribution of Bi, Fe, and O elements within the nanoparticle structure. During pyrolysis at 750 °C, clusters with compositions such as Bi and/or Bi2O3 and Fe3O4 are already formed and start to diffuse through the porous xerogel mass.
Having in mind that Bi and Bi2O3 have smaller bulk melting temperatures (TBi = 271 °C and TBi2O3 = 817 °C) than Fe and iron oxides (TFe = 1538 °C and TFe2O3-Fe3O4 ≈ 1567–1597 °C), it is considered that the mobile Bi/Bi2O3 will migrate more efficiently onto the carbon surface and coalesce with the surrounding clusters. This suggests that the Fe3O4 clusters will modify the Bi2O3 nanoparticle growth serving as nucleation and/or anchoring sites. The variations of the morphological and structural features of the nanoparticles strongly depend on the local conditions such as number and size of interacting clusters, local concentration of Bi, Fe and O, and temperature variation with time [28].
As suggested by the electron microscopy and XRD results, at the interface of two or several interacting nanoparticles, new hybrid structures and structural phases such as off-stoichiometric Bi2Fe4O9 could form and to act as anchoring sites for the Bi fraction. This mechanism can also explain the size increase observed at higher Fe concentrations. Thus, as opposed to the more ideal case demonstrated for the CXBiFe0 sample, the Bi-based nanoparticles will exhibit a modified surface composition in Fe-integrated systems that may alter their electrochemical response.

3.2. Electrochemical Performance

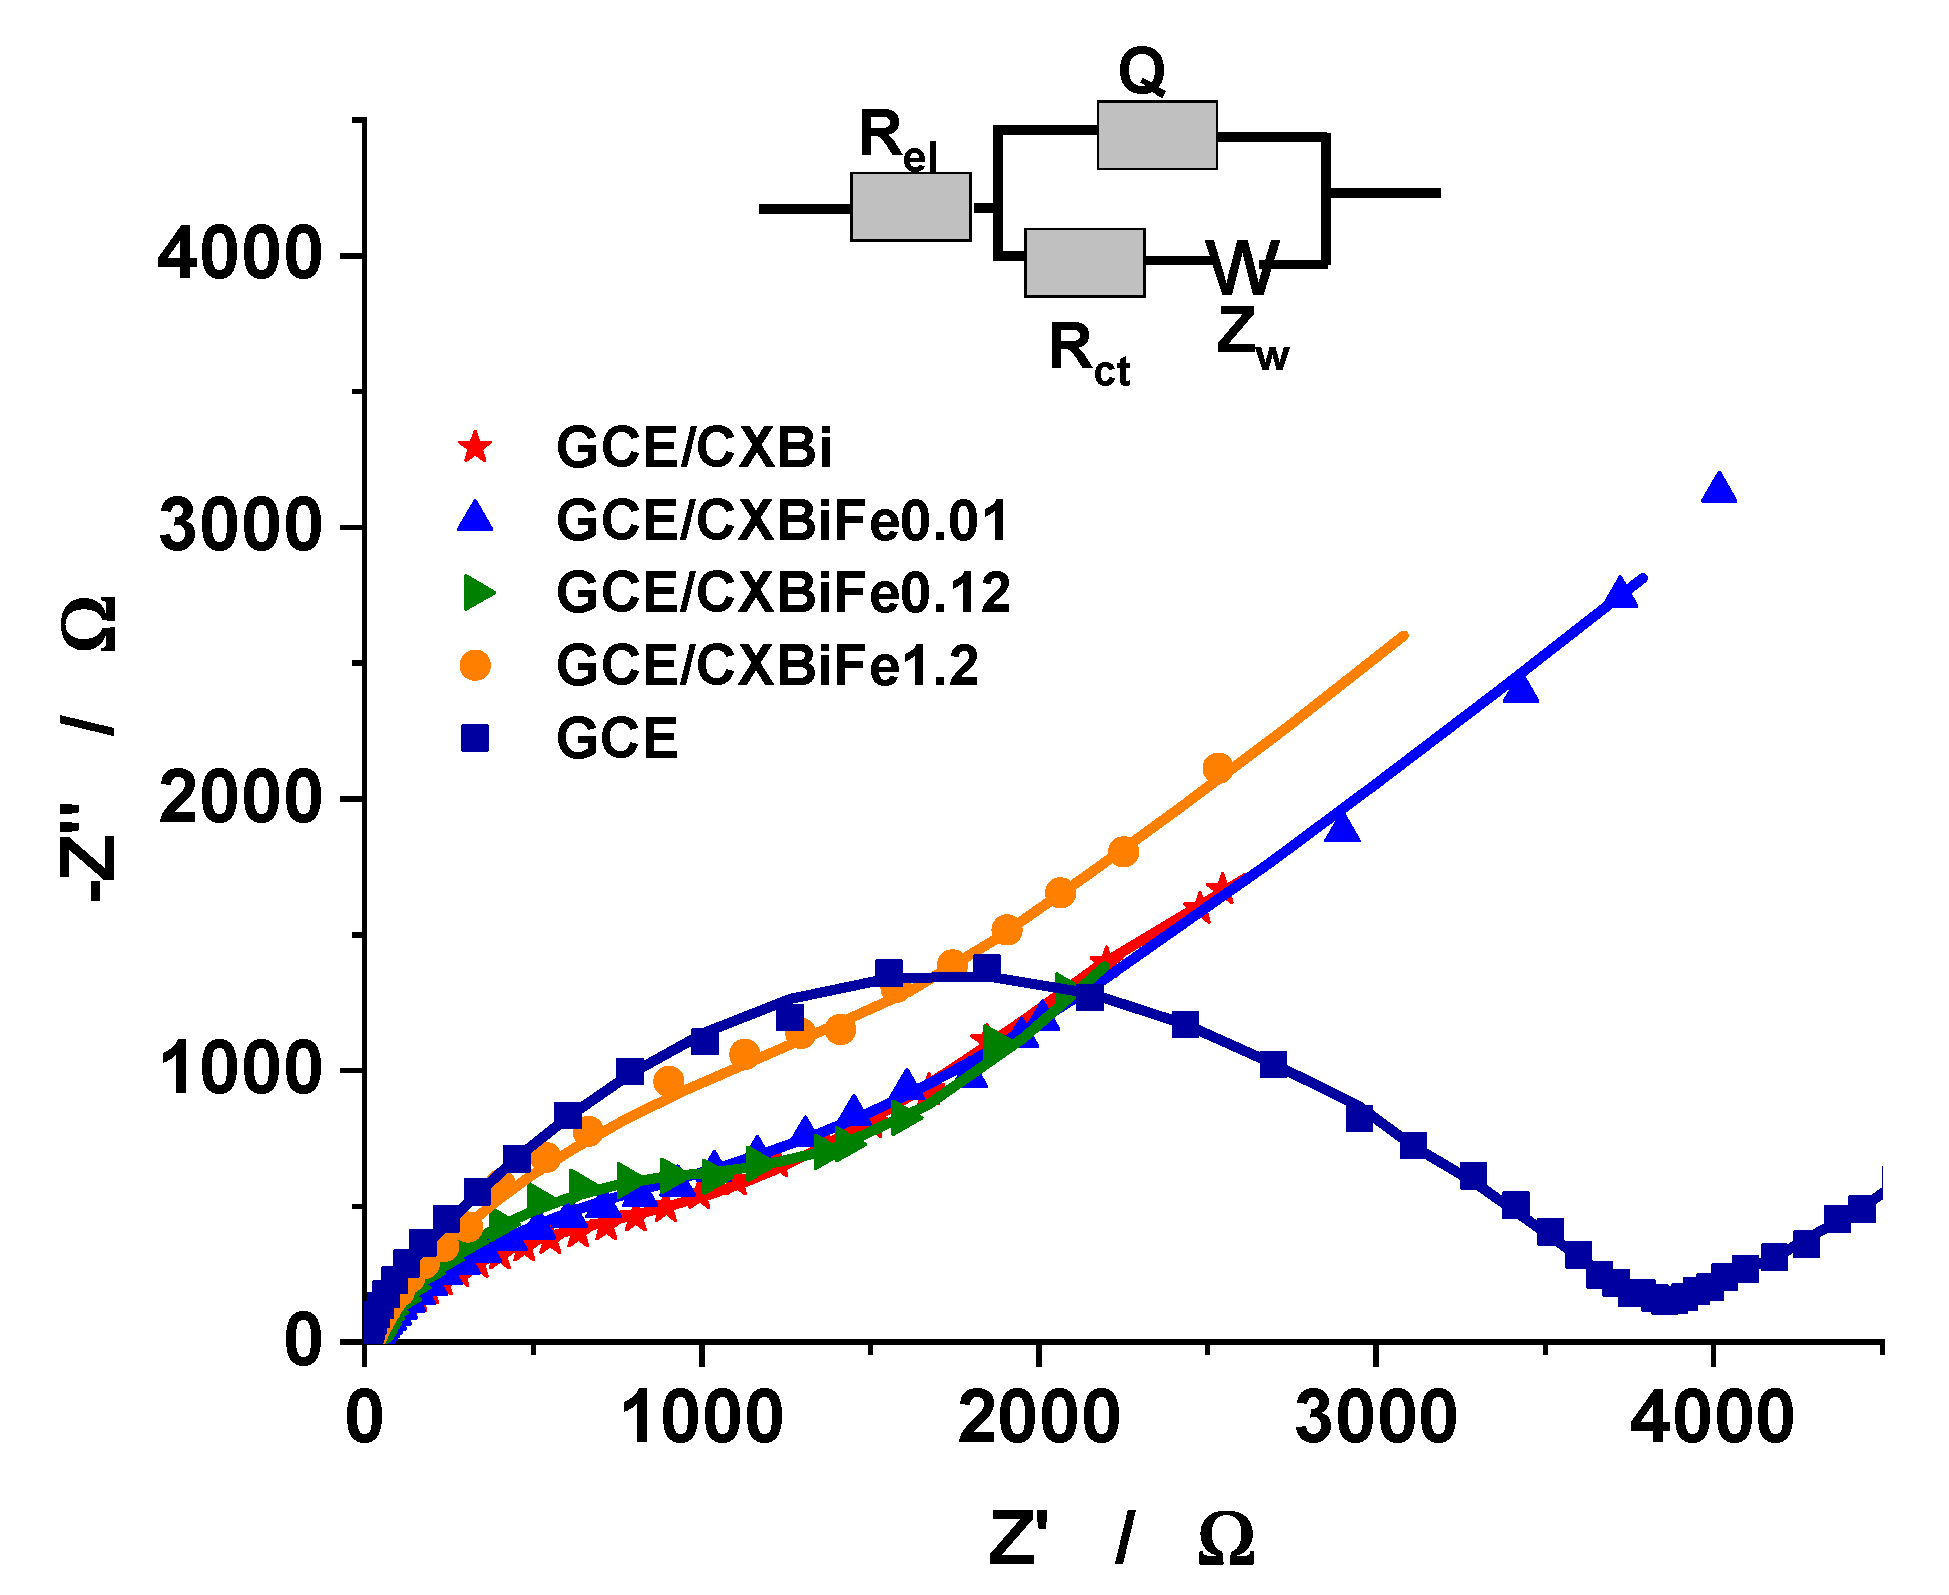
3.2.1. Electrochemical Characterization of GC/Chi–CXBiFex Electrodes

For characterizing the interfacial properties of GCE/CXBiFex modified electrodes, the electrochemical impedance spectroscopy (EIS), was used to comparatively investigate the GC/Chi–CXBiFex, and GC electrodes, using [Fe(CN)6]3−/4− as electrochemical probe (Figure 4). The EIS data were fitted to a modified Randles equivalent circuit [7,9], involving an uncompensated electrolyte solution resistance (Rel) coupled in series with a parallel combination of the interface capacitance (Q) and faradaic impedance. The former symbolizes a mixed capacitance including a constant phase element (CPE) and the double layer capacitance (C), while the faradaic impedance is modelled as a charge transfer resistance (Rct) coupled with a mass transfer resistance (W), respectively. By using the ZSimpWin 3.21 software, the values of all above-mentioned parameters were estimated, as can be seen from Table 3.
By comparing the Rct value obtained for bare GC electrode, and the value obtained for all modified electrode, one can conclude that the presence of the high conductive CXBiFex nanocomposite matrix on the GCE surface led to a significant diminish of the charge transfer resistance (Rct). On the other hand, the Rct value increases with the Fe concentration in the CXBiFex nanocomposite matrix. As previously observed, the nanoparticles are primarily found in oxidized states, also with lower crystallinity and poor conductivity [29]. Such inclusions may also alter the connectivity of the electron conducting matrix, increasing the capacitive response of the system. Moreover, the variation of specific surface area and the micro-porosity values for CXBiFex nanocomposite matrix, strongly influences the double layer capacitance (C), reflected by following sequence: GC ≪ GC/Chi-CXBiFe0 ˂ GC/Chi-CXBiFe0.01 ˂ GC/Chi-CXBiFe0.1 ˂ GC/Chi-CXBiFe1.2.
Interestingly, the following sequence WCXBiFe0 ≈ WCXBiFe0.01 ≈ WCXBiFe0.1 ≈ WCXBiFe1.2, showing similar behavior of CXBiFex, was obtained in the region corresponding to lower frequencies, which is the domain attributed to the diffusion limited processes (Figure 4).

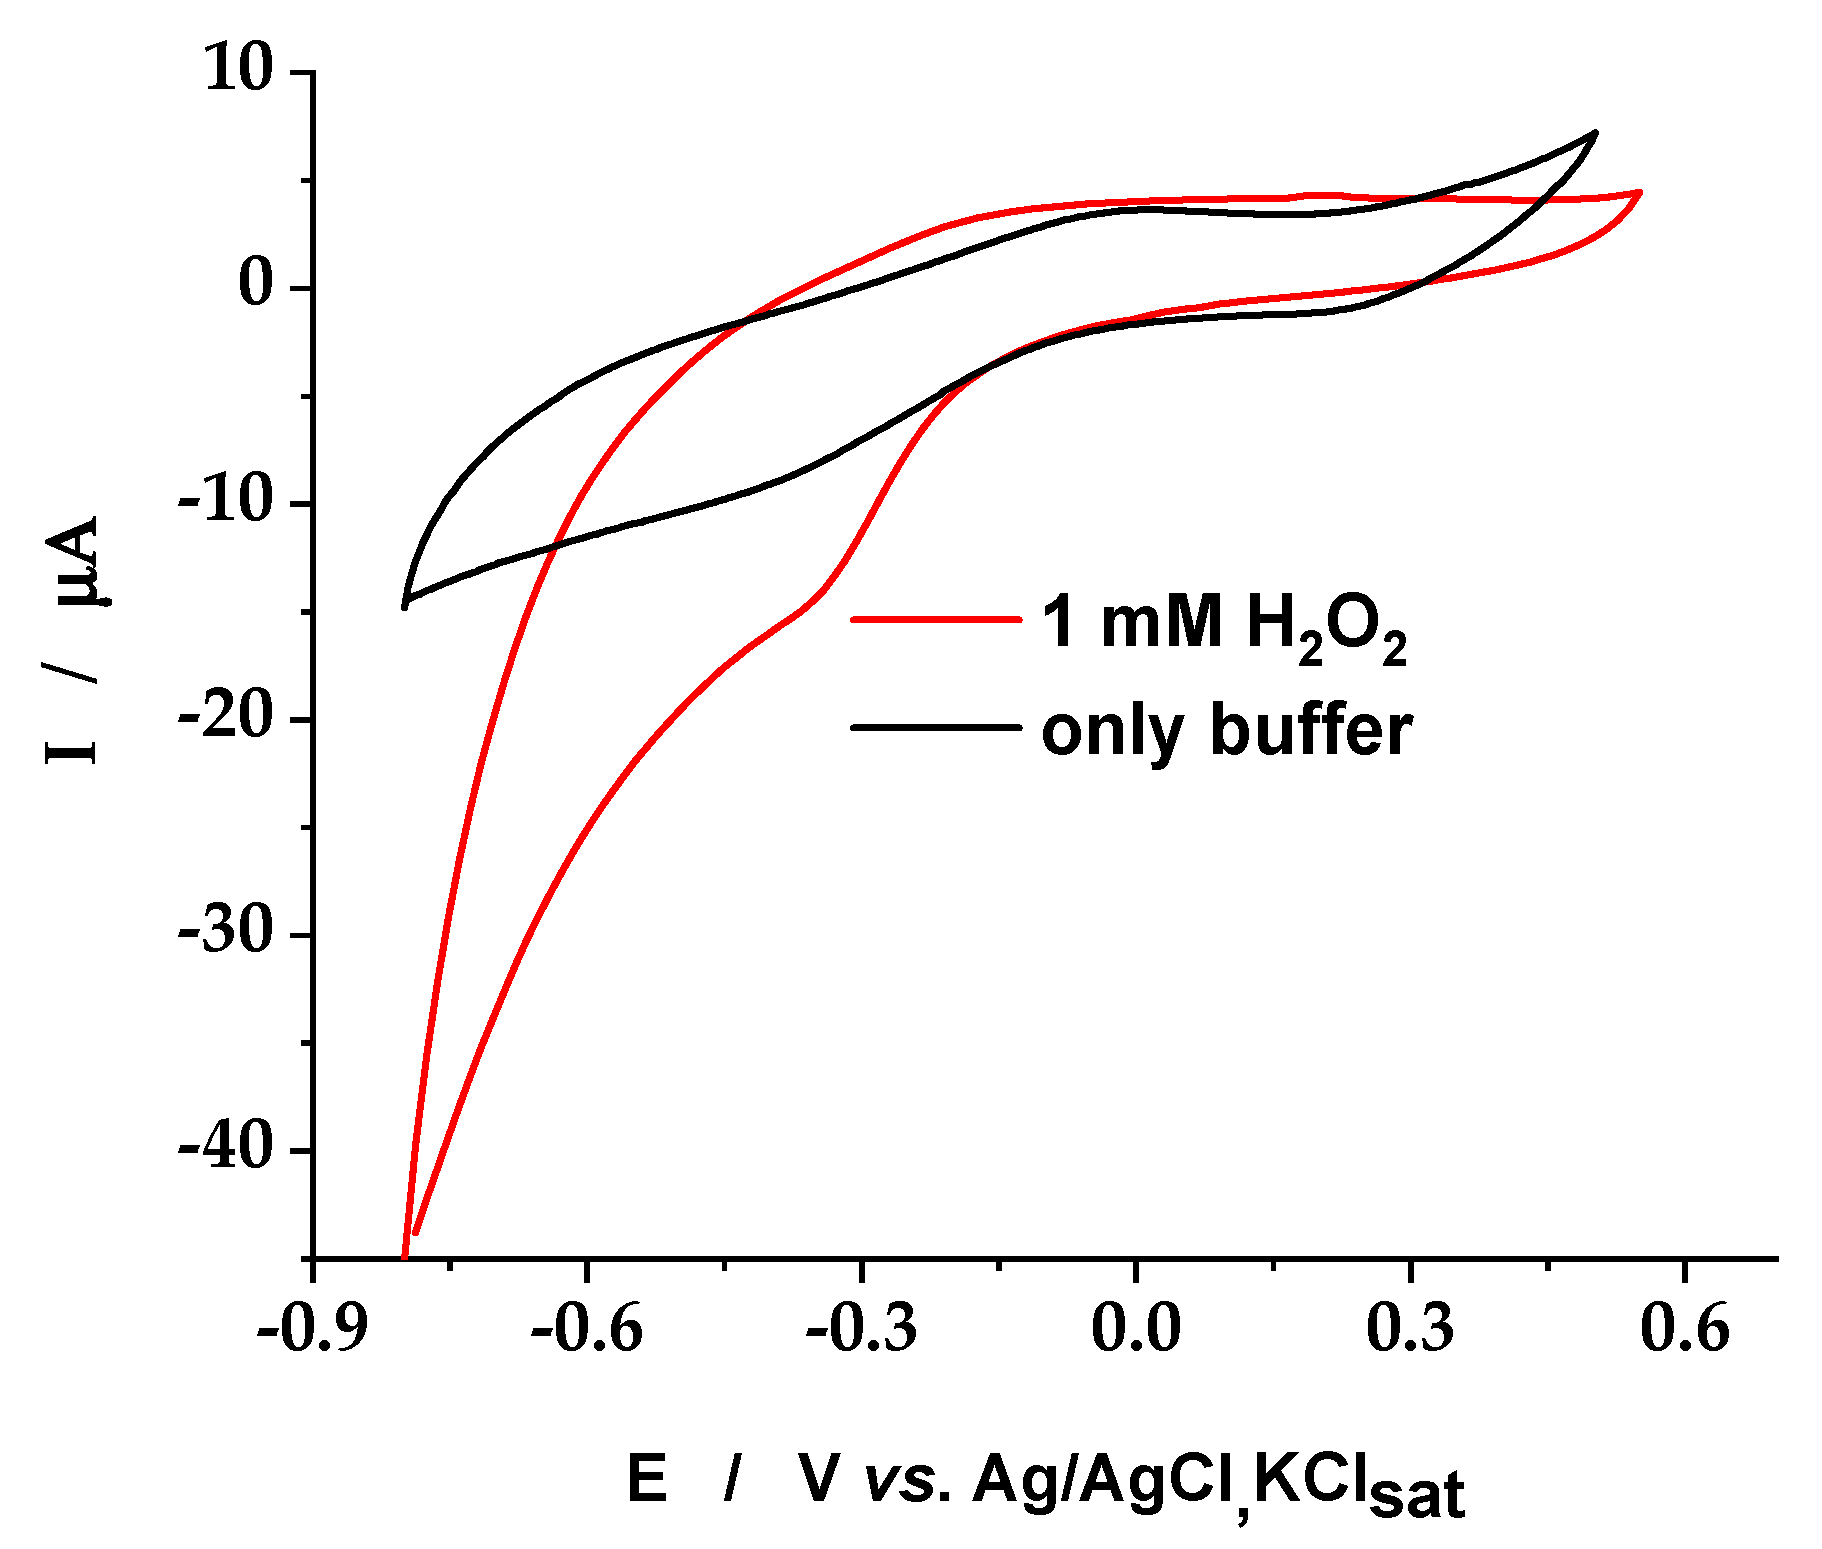
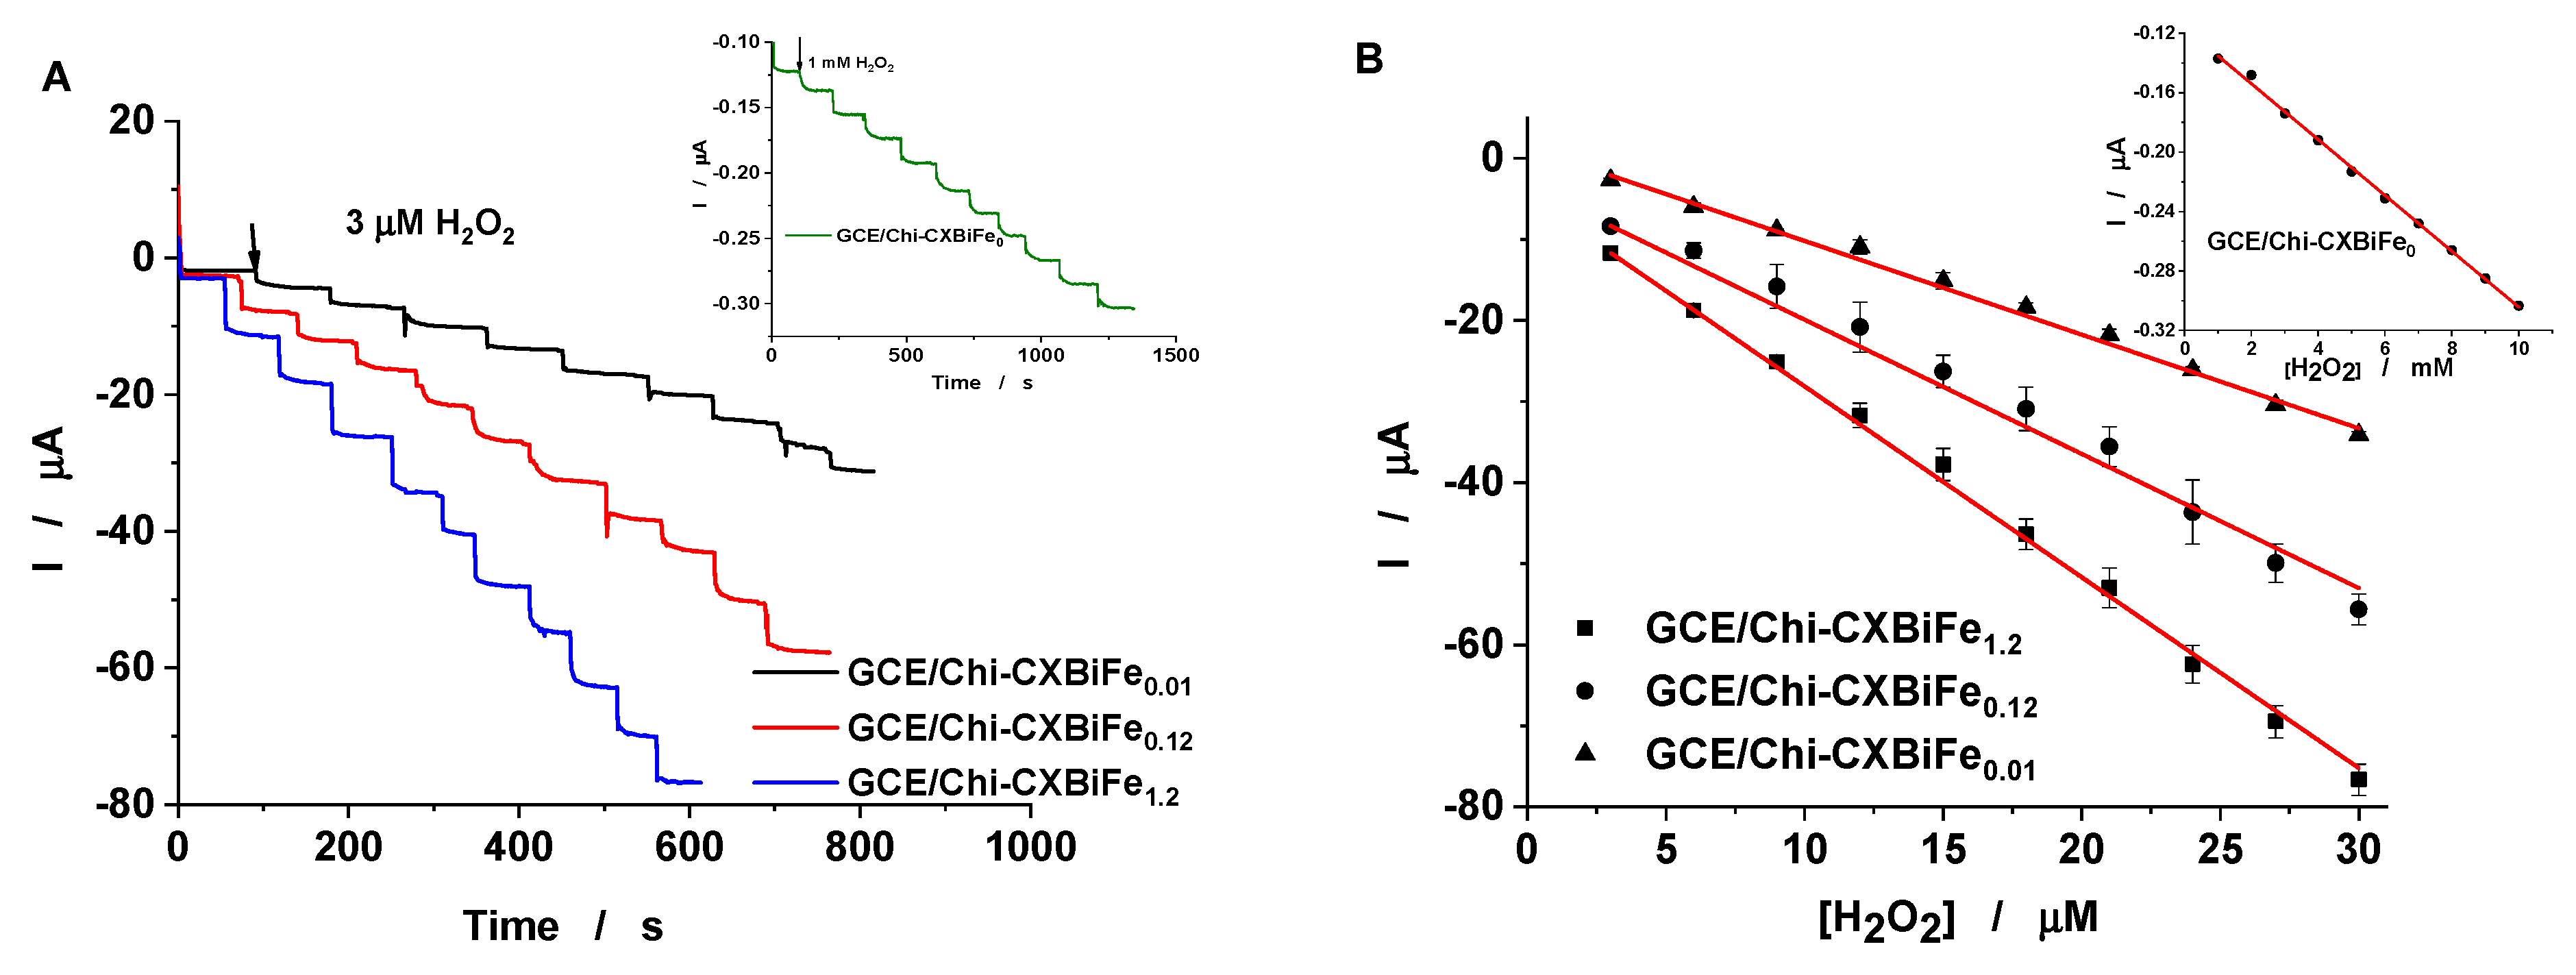
3.2.2. Amperometric H2O2 Detection

The cyclic voltammograms, recorded at GC/Chi-CXBiFe1.2 nanocomposite modified electrode (Figure 5), in the absence and in the presence of 1 mM H2O2, showed an electrocatalytic activity toward the H2O2 reduction at GC/Chi-CXBiFe1.2. The presence of 1 mM H2O2 in the electrolyte solution, in the potential domain, which corresponds to the voltametric peak due to the existence of Fe oxides in CXBiFe1.2 matrix, lead to a significant increase of the reduction peak current, thus demonstrating an electrocatalytic process. Therefore, two consecutive steps are involved: (i) the first one, occurring according to a Fenton-type mechanism [30], is the catalytic oxidation of reduced iron states ions by H2O2; (ii) the second one, assuring the regeneration of the catalyst, is the electrochemical reduction of the chemically generated Fe3+ ions.
The electroanalytical parameters for H2O2 reduction were estimated from the amperometric calibration curves, recorded at the GC/Chi–CXBiFex (Figure 6). After successive injections of 3 µM H2O2 typical current time response curves were obtained for all four investigated electrodes (Figure 6A). The amperometric response provided by the GC/Chi–CXBiFex becomes stable in less than 6 s, making these electrodes competitive with other similar sensors [8]. The average results, obtained by using three different GC/Chi–CXBiFex modified electrodes and electrolyte solutions containing H2O2 (1–30 µM) were used to draw the calibration curves described in Figure 6B. The corresponding linear regressions parameters illustrated in Table 4 enable the calculation of the electroanalytical parameters that are further compared with previously reported results for H2O2 detection (Table 5).
The increase in sensitivity values, and the decrease in detection limit values (estimated for a signal to noise ratio of 3) for H2O2 at GC/Chi–CXBiFex modified electrodes, with the Fe concentration increasing in CXBiFex nanocomposite (from 0 to 1.2) was observed (Table 5). As expected, the presence of nanostructured iron oxides in the CXBiFex nanocomposite matrix, successfully led to improved electroanalytical parameters values with the increase in the amount of iron precursor. The obtained electroanalytical parameters, recommend the GC/Chi–CXBiFex modified electrodes as competitive for H2O2 detection, with better or comparable results with others already published (Table 5).
GC, glassy carbon; Chi, chitosan; CX, carbon xerogel; CA, carbon aerogel; AP-Ni-MOF, Ni2+ metal organic framework based on adipic acid piperazine; CoFe/NGR, CoFe nanoparticles on the nitrogen-doped graphene; PFECS, polymer (poly(2,5-bis((2-ferroceneylethyl)oxy carbonyl)styrene).

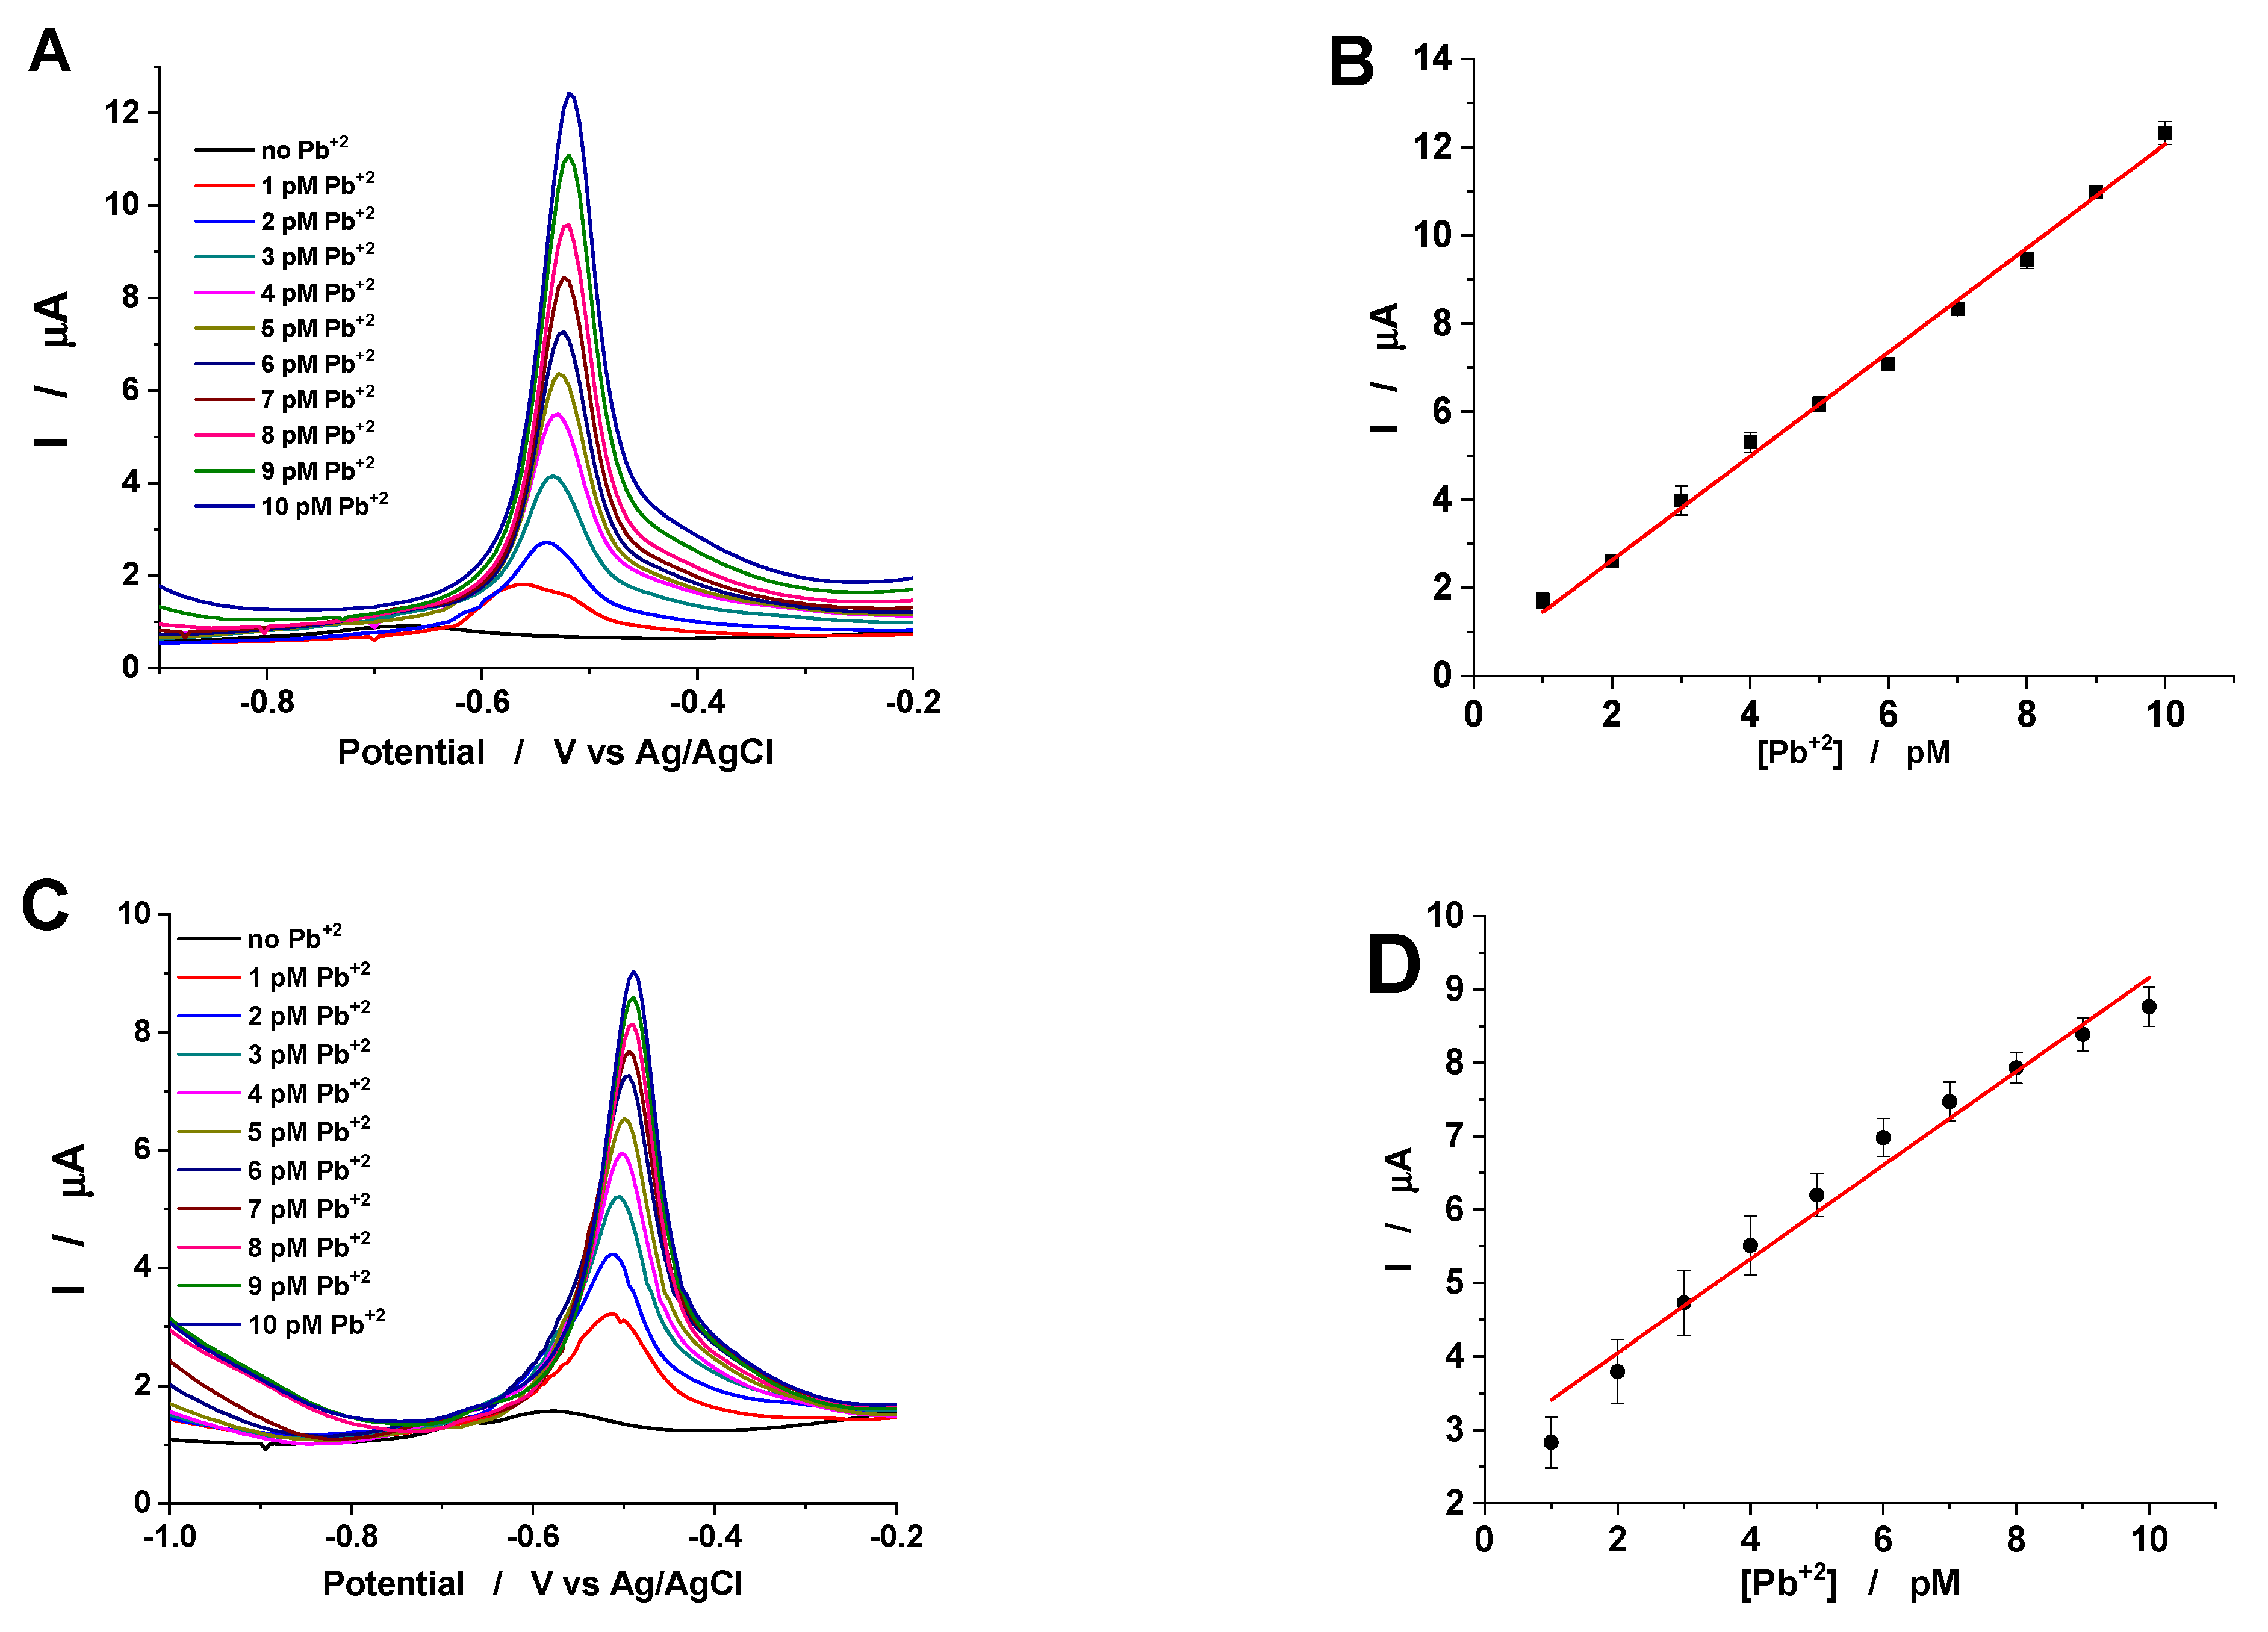
3.2.3. SWASV for Pb2+ Detection

The recorded voltammograms for GC/Chi–CXBiFex modified electrodes show well-shaped anodic peaks, corresponding to the dissolution of Pb previously deposited on the electrodes surface during the preconcentration step (Figure 7A,C).
By using three different GC/Chi–CXBiFex modified electrodes, for each Fe concentration, and electrolyte solutions containing very low Pb2+ concentrations (1–10 pM) the SWASV were recorded. Thus, the average results were used to draw the calibration curves for each type of electrode (Figure 7B,D). The obtained linear regression parameters (Table 6) permit the calculation of the electroanalytical parameters for Pb2+ detection (Table 7).
The anodic peak potential values for Pb2+ detection at the prepared GC/Chi–CXBiFex modified electrodes present small differences (Table 6) that can be associated with the material surface hydrophobicity [7].
Moreover, by the increasing of the Fe concentration in CXBiFex nanocomposite from 0 to 1.2%, the decreasing of the sensitivity from 1.17·106 µA/µM to 6.39·105 µA/µM and the increasing of the detection limit values from 0.36 pM to 1.24 pM (estimated for a signal to noise ratio of 3) was observed (Table 6). A possible explanation for the variation of the obtained electroanalytical parameters can arise from the corroborated effect of the (i) partial coverage of the Pb2+ sensing Bi centers due to Bi-O-Fe interactions and the formation of hybrid nanostructures (ii) individual or cumulative effects of the size and spatial distribution of the Bi/Fe nanoparticles, and (iii) charge transport properties affected by matrix graphitization yields, the chemical state of the nano-inclusions and the porosity (Table 1). Still, excellent electroanalytical performance (sensitivity, detection limit and linear range) was obtained at the GC/Chi–CXBiFex, which can detect Pb2+ concentrations starting from much lower values than the ones reported by official safety and recommendation standards for drinkable water [36,37]. This is mainly due to the irregular microstructure of CXBiFex nanocomposite, where the Bi/Fe nanoparticles, randomly dispersed in the carbon xerogel, offer an easy access to the heavy metal ions. The obtained analytical parameters, sensitivity, and detection limit, recommend the GC/Chi–CXBiFex modified electrode as competitive for Pb2+ detection, with comparable results with the best already published (Table 7).
By comparing four different compositions of Fe-modified carbonaceous nanocomposite materials, CXBiFex, the good electroanalytical properties, for both heavy metals (Pb2+), and biomarkers (H2O2) detection, proved that the synthetized electrode materials are well-matched with the two different applications. Due to Bi-O-Fe interactions, the H2O2 and Pb2+ sensing performances do not evolve in tandem: as Fe is seen to hinder the sensing capabilities of Bi while improving the H2O2 detection through its inherent Fenton mechanisms. The present study proved that CXBiFex composite material open new opportunities for sensors development, offering the advantages of using a very low amount of nanomaterial (CXBiFex) for the electrode preparation, and bifunctionalities.

4. Conclusions

Xerogel nanocomposites were obtained by tailoring the initial resorcinol–formaldehyde synthesis with Bi and Fe precursors. During this study, the variation of Fe concentration is investigated, while keeping constant the other synthesis parameters, including the Bi concentration. The increased Fe content, combined with the pyrolysis effect induced significant changes at the nanoscale. First, the growth of β-Bi2O3 and amorphous Bi2O3 was altered due to Bi-O-Fe interactions, which ultimately led to hybrid nanoparticles with increased size and structural features resembling that of a defected Bi2Fe4O9 structure. Secondly, the excess Fe amounts will be introduced as Fe3O4 nanoparticles as observed in XRD and TEM results. Finally, considering the changes in features of the carbon support, higher graphitization yields were not detected with the increase in Fe content, as pure metal/carbide catalytic states were not reached during present thermal conditions. Nevertheless, changes of the porous features for the carbon support were induced as the specific surface area and micropore volumes increased with Fe concentration. The electroanalytical parameters values indicate that the presence of Fe in the CXBiFex nanocomposite decrease the Pb2+ detection efficiency, most probably due to modification of Bi nanoparticle surface with Fe phase. Nevertheless, the obtained composites where still operational for sensing Pb2+ concentrations well below the standard detection limits. Further on, the nanocomposites revealed improved performance for H2O2 detection with the increase of Fe content. This clearly indicates that such materials are compatible with the two different applications and may represent a starting point for contexts where heavy metal ions and biological environments interact.

Author Contributions

The authors individual contributions are listed below: Conceptualization, C.I.F., L.B., L.C.C.; investigation, C.I.F., M.M.R., A.V., I.F., S.T.-N., M.B. (Monica Baia); writing—original draft preparation, C.I.F., M.M.R.; writing-review and editing, M.B. (Monica Baia), L.C.C., L.B., M.B. (Mihaela Baibarac); funding acquisition, L.C.C., L.B., M.B. (Mihaela Baibarac); supervision, L.B. All authors have read and agreed to the published version of the manuscript.

Funding

This work was supported by a grant of the Romanian Ministry of Research and Innovation, CCCDI—UEFISCDI, project number PN-III-P1-1.2-PCCDI-2017-0350/01.03.2018 (Graphene4Life), within PNCDI III).

Conflicts of Interest

The authors declare no conflict of interest. The funders had no role in the design of the study; in the collection, analyses, or interpretation of data; in the writing of the manuscript, or in the decision to publish the results.

Sample Availability

Samples of the compounds CXBiFex (x = 0.01, 0.12 and 1.2 g) are available from the authors.

References

  1. Fort, C.I.; Pop, L.C. Heavy metal and metalloid electrochemical detection by composite nanostructures. In Advanced Nanostructures for Environmental Health; Elsevier: Amsterdam, The Netherlands, 2020; pp. 185–250. [Google Scholar]
  2. Bollella, P.; Fusco, G.; Tortolini, C.; Sanzò, G.; Favero, G.; Gorton, L.; Antiochia, R. Beyond graphene: Electrochemical sensors and biosensors for biomarkers detection. Biosens. Bioelectron. 2017, 1, 152–166. [Google Scholar] [CrossRef]
  3. Dickinson, B.C.; Chang, C.J. A targetable fluorescent probe for imaging hydrogen peroxide in the mitochondria of living cells. J. Am. Chem. Soc. 2008, 130, 9638–9639. [Google Scholar] [CrossRef] [Green Version]
  4. Da-Col, J.A.; Domene, S.M.A.; Pereira-Filho, E.R. Fast Determination of Cd, Fe, Pb, and Zn in Food using AAS. Food Anal. Methods 2009, 2, 110–115. [Google Scholar] [CrossRef]
  5. Ahirovic, A.; Copra, A.; Omanovicmiklicanin, E.; Kalcher, K. A chemiluminescence sensor for the determination of hydrogen peroxide. Talanta 2007, 72, 1378–1385. [Google Scholar] [CrossRef] [PubMed]
  6. Song, E.; Choi, J.-W. Multi-analyte detection of chemical species using a conducting polymer nanowire-based sensor array platform. Sensors Actuators B Chem. 2015, 215, 99–106. [Google Scholar] [CrossRef]
  7. Rusu, M.M.; Fort, C.I.; Cotet, L.C.; Vulpoi, A.; Todea, M.; Turdean, G.L.; Danciu, V.; Popescu, I.C.; Baia, L. Insights into the morphological and structural particularities of highly sensitive porous bismuth-carbon nanocomposites based electrochemical sensors. Sens. Actuators B Chem. 2018, 268, 398–410. [Google Scholar] [CrossRef]
  8. Fort, C.I.; Cotet, L.C.; Danciu, V.; Turdean, G.L.; Popescu, I.C. Iron doped carbon aerogel—New electrode material for electrocatalytic reduction of H2O2. Mater. Chem. Phys. 2013, 138, 893–898. [Google Scholar] [CrossRef]
  9. Fort, C.I.; Cotet, L.C.; Vulpoi, A.; Turdean, G.L.; Danciu, V.; Baia, L.; Popescu, I.C. Bismuth doped carbon xerogel nanocomposite incorporated in chitosan matrix for ultrasensitive voltammetric detection of Pb(II) and Cd(II). Sens. Actuators B Chem. 2015, 220, 712–719. [Google Scholar] [CrossRef]
  10. Cai, S.; Han, Q.; Qi, C.; Lian, Z.; Jia, X.; Yang, R.; Wang, C. Pt 74 Ag 26 nanoparticle-decorated ultrathin MoS2 nanosheets as novel peroxidase mimics for highly selective colorimetric detection of H2O2 and glucose. Nanoscale 2016, 8, 3685–3693. [Google Scholar] [CrossRef]
  11. Gumpu, M.B.; Sethuraman, S.; Krishnan, U.M.; Rayappan, J.B.B. A review on detection of heavy metal ions in water—An electrochemical approach. Sens. Actuators B Chem. 2015, 213, 515–533. [Google Scholar] [CrossRef]
  12. Lu, Y.; Liang, X.; Niyungeko, C.; Zhou, J.; Xu, J.; Tian, G. A review of the identification and detection of heavy metal ions in the environment by voltammetry. Talanta 2018, 178, 324–338. [Google Scholar] [CrossRef] [PubMed]
  13. Marinho, J.Z.; Silva, R.A.B.; Barbosa, T.G.G.; Richter, E.M.; Muñoz, R.A.A.; Lima, R.C. Graphite composite electrodes bulk-modified with (BiO)2CO3 and Bi2O3 plates-like nanostructures for trace metal determination by anodic stripping voltammetry. Electroanalysis 2013, 25, 765–770. [Google Scholar] [CrossRef]
  14. Sun, M.; Liu, H.; Liu, Y.; Qu, J.; Li, J. Graphene-based transition metal oxide nanocomposites for the oxygen reduction reaction. Nanoscale 2015, 7, 1250–1269. [Google Scholar] [CrossRef] [PubMed]
  15. Fort, C.I.; Ortiz, R.; Cotet, L.C.; Danciu, V.; Popescu, I.C.; Gorton, L. Carbon aerogel as electrode material for improved direct electron transfer in biosensors incorporating cellobiose dehydrogenase. Electroanalysis 2016, 28, 2311–2319. [Google Scholar] [CrossRef]
  16. Fort, C.I.; Cotet, L.C.; Vasiliu, F.; Marginean, P.; Danciu, V.; Popescu, I.C. Methanol oxidation at carbon paste electrodes modified with (Pt-Ru)/carbon aerogels nanocomposites. Mater. Chem. Phys. 2016, 172, 179–188. [Google Scholar] [CrossRef]
  17. Deshmukh, B.M.A.; Celiesiute, R.; Ramanaviciene, A.; Shirsat, M.D.; Ramanavicius, A. EDTA_PANI/ SWCNTs nanocomposite modified electrode for electrochemical determination of copper (II), lead (II) and mercury (II) ions. Electrochim. Acta 2018, 259, 930–938. [Google Scholar] [CrossRef]
  18. Song, H.; Ni, Y.; Kokot, S. Investigations of an electrochemical platform based on the layered MoS2-graphene and horseradish peroxidase nanocomposite for direct electrochemistry and electrocatalysis. Biosens. Bioelectron. 2014, 56, 137–143. [Google Scholar] [CrossRef]
  19. Shamkhalichenar, H.; Choi, J.-W. Review—Non-Enzymatic Hydrogen Peroxide Electrochemical Sensors Based on Reduced Graphene Oxide. J. Electrochem. Soc. 2020, 167, 037531. [Google Scholar] [CrossRef]
  20. Waheed, A.; Mansha, M.; Ullah, N. Nanomaterials-based electrochemical detection of heavy metals in water: Current status, challenges and future direction. TrAC Trends Anal. Chem. 2018, 105, 37–51. [Google Scholar] [CrossRef]
  21. Švancara, I.; Prior, C.; Hočevar, S.B.; Wang, J. A Decade with Bismuth-Based Electrodes in Electroanalysis. Electroanalysis 2010, 22, 1405–1420. [Google Scholar] [CrossRef]
  22. Gich, M.; Fernández-Sánchez, C.; Cotet, L.C.; Niu, P.; Roig, A. Facile synthesis of porous bismuth-carbon nanocomposites for the sensitive detection of heavy metals. J. Mater. Chem. A 2013, 1, 11410–11418. [Google Scholar] [CrossRef]
  23. Fort, C.I.; Rusu, M.M.; Pop, L.C.; Cotet, L.C.; Vulpoi, A.; Baia, M.; Baia, L. Preparation and Characterization of Carbon Xerogel Based Composites for Electrochemical Sensing and Photocatalytic Degradation. J. Nanosci. Nanotechnol. 2020. [Google Scholar] [CrossRef]
  24. Cotet, L.C.; Gich, M.; Roig, A.; Popescu, I.C.; Cosoveanu, V.; Molins, E.; Danciu, V. Synthesis and structural characteristics of carbon aerogels with a high content of Fe, Co, Ni, Cu, and Pd. J. Non. Cryst. Solids 2006, 352, 2772–2777. [Google Scholar] [CrossRef]
  25. Jorio, A.; Souza Filho, A.G. Raman Studies of Carbon Nanostructures. Annu. Rev. Mater. Res. 2016, 46, 357–382. [Google Scholar] [CrossRef]
  26. Hoekstra, J.; Beale, A.M.; Soulimani, F.; Versluijs-Helder, M.; Van De Kleut, D.; Koelewijn, J.M.; Geus, J.W.; Jenneskens, L.W. The effect of iron catalyzed graphitization on the textural properties of carbonized cellulose: Magnetically separable graphitic carbon bodies for catalysis and remediation. Carbon N. Y. 2016, 107, 248–260. [Google Scholar] [CrossRef]
  27. Rouquerol, F.; Rouquerol, J.; Sing, K.S.W.; Maurin, G.; Llewellyn, P. Adsorption by Powders and Porous Solids. In Adsorption by Powders and Porous Solids; Rouquerol, F., Rouquerol, J., Sing, K.S.W., Llewellyn, P., Maurin, G.B.T.-A.P., Second, P.S.E., Eds.; Elsevier: Oxford, UK, 2014; pp. 1–24. [Google Scholar]
  28. Panda, A.; Govindaraj, R.; Mythili, R.; Amarendra, G. Formation of bismuth iron oxide based core–shell structures and their dielectric, ferroelectric and magnetic properties. J. Mater. Chem. C 2019, 7, 1280–1291. [Google Scholar] [CrossRef]
  29. Xia, Q.; Xu, M.; Xia, H.; Xie, J. Nanostructured Iron Oxide/Hydroxide-Based Electrode Materials for Supercapacitors. ChemNanoMat 2016, 2, 588–600. [Google Scholar] [CrossRef]
  30. Zhang, L.; Ni, Y.; Wang, X.; Zhao, G. Direct electrocatalytic oxidation of nitric oxide and reduction of hydrogen peroxide based on α-Fe2O3 nanoparticles-chitosan composite. Talanta 2010, 82, 196–201. [Google Scholar] [CrossRef]
  31. Heydaryan, K.; Almasi Kashi, M.; Sharifi, N.; Ranjbar-Azad, M. Efficiency improvement in non-enzymatic H2O2 detection induced by the simultaneous synthesis of Au and Ag nanoparticles in an RGO/Au/Fe3O4/Ag nanocomposite. New J. Chem. 2020, 44, 9037–9045. [Google Scholar] [CrossRef]
  32. Yang, Y.-Q.; Xie, H.-L.; Tang, J.; Tang, S.; Yi, J.; Zhang, H.-L. Design and preparation of a non-enzymatic hydrogen peroxide sensor based on a novel rigid chain liquid crystalline polymer/reduced graphene oxide composite. RSC Adv. 2015, 5, 63662–63668. [Google Scholar] [CrossRef]
  33. Hassan, M.; Jiang, Y.; Bo, X.; Zhou, M. Sensitive nonenzymatic detection of hydrogen peroxide at nitrogen-doped graphene supported-CoFe nanoparticles. Talanta 2018, 188, 339–348. [Google Scholar] [CrossRef] [PubMed]
  34. Sherino, B.; Mohamad, S.; Abdul Halim, S.N.; Abdul Manan, N.S. Electrochemical detection of hydrogen peroxide on a new microporous Ni–metal organic framework material-carbon paste electrode. Sens. Actuators B Chem. 2018, 254, 1148–1156. [Google Scholar] [CrossRef]
  35. Shu, Y.; Xu, J.; Chen, J.; Xu, Q.; Xiao, X.; Jin, D.; Pang, H.; Hu, X. Ultrasensitive electrochemical detection of H2O2 in living cells based on ultrathin MnO2 nanosheets. Sens. Actuators B Chem. 2017, 252, 72–78. [Google Scholar] [CrossRef]
  36. European Drinking Water Directive: 1. Council Directive 92008/105/EC of 16 December 2008 on Environmental Quality Standards in the ELD of Water Policy; Vol OJ L 348/84 24.12.2008, 1998 (Chapter Annex 1); European Union: Brussels, Belgium, 2008. [Google Scholar]
  37. Graham, N. Guidelines for Drinking-Water Quality, 2nd edition, Addendum to Volume 1—Recommendations, World Health Organisation, Geneva, 1998, 36 pages. Urban. Water 1999, 1, 183. [Google Scholar] [CrossRef]
Figure 1. Characterization of (a) CXBiFe0, (b) CXBiFe0.01, (c) CXBiFe0.12 and (d) CXBiFe1.2 investigated samples through (I). XRD with attached reference signals specific to bare carbon xerogel, β-Bi2O3, mullite Bi2Fe4O9, maghemite Fe2O3, and Fe3O4 magnetite (II). Raman spectroscopy revealing the D and G carbon specific vibrational region, and (III). N2 adsorption/desorption isotherms.
Molecules 26 00117 g001
Figure 2. SEM and TEM images together with nanoparticle size histograms corresponding to samples (a) CXBiFe0, (b) CXBiFe0.01, (c) CXBiFe0.12 and (d) CXBiFe1.2.
Molecules 26 00117 g002
Figure 3. (a) BF-STEM and HAADF-STEM images on a large area of the sample containing the hybrid nanoparticles; (b) STEM-EDS elemental map and its corresponding HAADF image on a single hybrid nanoparticle showing its chemical composition with bismuth in dark blue, iron in orange, and oxygen in green demonstrated in sample CXBiFe1.2.
Molecules 26 00117 g003
Figure 4. EIS spectra of GCE and GCE/Chi–CXBiFex. Experimental conditions: supporting electrolyte, 0.1 M acetate buffer (pH 4.5) containing 1 mM [Fe(CN)6]3−/4−; applied potential, 0.2 V vs. Ag/AgCl, KClsat, frequency interval, 0.1–104 Hz.
Molecules 26 00117 g004
Figure 5. Cyclic voltammograms recorded in the absence and the presence of 1 mM H2O2 at GC/Chi-CXBiFe1.2. Experimental conditions: scan rate, 20 mV s−1; supporting electrolyte, 0.2 M phosphate buffer (pH 7); starting potential, −0.8 V vs. Ag/AgCl, KCl sat.
Molecules 26 00117 g005
Figure 6. I vs. time dependence recorded at GC/Chi–CXBiFex, for successive addition of 3 µM H2O2, and 1 mM H2O2, respectively (A), and the corresponding amperometric calibration curve (B). Experimental conditions: rotating speed 400 rpm; supporting electrolyte, 0.2 phosphate buffer M (pH 7); applied potential, −0.3 V vs. Ag/AgCl, KCl sat.
Molecules 26 00117 g006
Figure 7. SWASVs recorded at GC/Chi-CXBiFe0 (A) and GC/Chi-CXBiFe1.2 (B) electrodes in the presence and absence of Pb2+, and the corresponding calibration curve (C,D), respectively. Experimental conditions: supporting electrolyte, 0.1 M acetate buffer (pH 4.5); deposition potential, −1.4 V vs. Ag/AgCl, KCl sat; deposition time, 180 s; frequency, 10 Hz; amplitude, 25 mV; starting dissolution potential, −1.2 V vs. Ag/AgCl, KCl sat.
Molecules 26 00117 g007
Table 1. Summary of morphological and structural parameters obtained for the synthesized samples and other similar materials.
MaterialPreparation MethodID/IG
SBET
(m2/g)
Vmpores
(cm3/g)
Vμpore
(cm3/g)
<D>
(nm)
C:O:Fe:Bi
(at%)
Ref.
C-Bi xerogelsimpregnation-800.041-561% (Bi)[9]
-200 --7% (Bi)[22]
co-synthesis----85/15516.4% (Bi)
-400--29/904.08% (Bi)
-71.50.049-1006% (Bi)
0.901420.077-25/11095.9:3.2:0:0.9[7]
C-Bi aerogelsco-synthesis0.895701.012 60/12096.8:2.7:0:0.5[7]
CXFeco-synthesis0.85344--1894.2:5.2:0.2:0.4[23]
CXBiFe0co-synthesis0.841850.2500.050894.2:2.1:0.0:0.2Present work
CXBiFe0.01co-synthesis0.84650.0930.0251096.3:3.5:0.02:0.1
CXBiFe0.12co-synthesis0.82790.1610.026796.6:3.0:0.2:0.1
CXBiFe1.2co-synthesis0.821620.0380.07110/3396.4:2.9:0.6:0.03
Table 2. Results obtained after a four peaks deconvolution of the D–G region of the Raman spectra.
SamplePeak IndexPosition
(cm−1)
FWHM
(cm−1)
Peak Area
(%)
CXBiFe0D41244.85232.9824.37
D11348.35142.7629.00
D31530.94194.0433.63
G1595.8763.4613.00
CXBiFe0.01D41241.63231.1622.64
D11347.84145.1031.41
D31533.29189.6532.91
G1597.1362.5713.03
CXBiFe0.12D41249.00244.4825.63
D11346.06139.1528.47
D31534.51196.5433.26
G1594.0759.5512.63
CXBiFe1.2D41249.00253.1725.28
D11344.53137.2029.13
D31536.29199.3232.70
G1595.0158.0312.88
Table 3. The parameters of the equivalent circuit.
Electrode
GCGC/Chi-CXBiFe0GC/Chi-CXBiFe0.01GC/Chi-CXBiFe0.1GC/Chi-CXBiFe1.2
Rel (Ω/cm2)22.23 ± 2.3048.19 ± 0.5623.72 ± 5.2823.32 ± 5.0713.92 ± 5.74
CPEdl (µS·sn/cm2)0.60 ± 3.7065.1 ± 1.5877.4 ± 3.9370.88 ± 1.13381 ± 14.12
n0.78 ± 0.830.57 ± 1.350.65 ± 0.830.68 ± 2.580.72 ± 3.98
Rct (Ω/cm2)3904 ± 3.751247 ± 1.431801 ± 3.752187 ± 6.203654 ± 5.04
W (mS·s1/2/cm2)0.66 ± 5.680.49 ± 1.700.57 ± 3.220.54 ± 1.000.60 ± 3.99
C (µF/cm2)0.109.7927.1329.48433.30
χ20.0035520.00037850.001400.002860.00514
n is the roughness factor; (±) represents the relative standard deviation (%).
Table 4. Linear regression parameters for amperometric detection of H2O2 at GC/Chi–CXBiFex.
Electrode TypeIntercept (µA)Slope (µA/µM)R2N
GC/Chi-CXBiFe1.2−4.586 ± 0.185−2.354 ± 0.0280.9986410
GC/Chi-CXBiFe0.12−3.353 ± 0.235−1.655 ± 0.0530.9907410
GC/Chi-CXBiFe0.011.365 ± 0.327−1.155 ± 0.0210.9967910
GC/Chi-CXBiFe0−0.116 ± 0.001−1.879 × 10⁻⁵ ± 0.028 × 10−50.9979610
Table 5. Analytical parameters of the sensors based on carbonaceous materials used for amperometric detection of H2O2.
Electrode TypeApplied Potential
V vs. Ag|AgCl, KClsat
Linear RangeDetection Limit (µM)Ref.
(Fe-CA)-CPE−0.31–50 mM500[8]
GC/Chi-BiFeCX−0.35–50 µM4.77[23]
GC/Chi-BiFeCX-TiO2−0.35–80 mM3110[23]
GCE/RGO/Au/Fe3O4/Ag0.552 µM–1.2 mM1.43[31]
PFECS/rGO/GCE0.4410–190µM1.25[32]
CoFe/NGR−0.251–86540.28[33]
AP-Ni-MOF/CPE−0.254 µM–60 mM0.9[34]
MnO2nanosheets/GCE−0.625 nM~2 μM and 10~454 μM5 nM[35]
GC/Chi-CXBiFe0−0.31–10 mM842.24This work
GC/Chi-CXBiFe0.01−0.33–30 µM0.85
GC/Chi/CXBiFe0.12−0.33–30 µM0.43
GC/Chi-CXBiFe1.2−0.33–30 µM0.24
Table 6. Linear regression parameters for SWASV detection of Pb2+ at CXBiFex nanocomposites modified glassy carbon electrodes.
Electrode TypeIntercept (µA)Slope (µA/pM)R2N
GC/Chi-CXBiFe02.69 ± 0.141.17·106 ± 0.02·1060.9974710
GC/Chi-CXBiFe0.012.98 ± 0.181.01·106 ± 0.02·1060.9936610
GC/Chi/CXBiFe0.121.20 ± 0.093.77·105 ± 0.16·1050.990017
GC/Chi-CXBiFe1.22.76 ± 0.266.39·105 ± 0.37·1050.9732310
Table 7. Analytical parameters of the sensors based on carbonaceous materials used for SWASV detection of Pb2+.
Electrode TypePeak Potential
V vs. Ag|AgCl, KCl sat.
Linear RangeSensitivity (µA/µM)Detection Limit (pM)Ref.
GC/Chi-(Bi-CX)−0.551–10 pM1.15·1060.36[9]
GC/Chi-(Bi-CX)−0.561–10 pM1.37·1060.28[7]
GC/Chi-(Bi-CA)−0.441–10 pM2.3·1050.48[7]
GC/Chi-CXBiFe0−0.531–10 pM1.17·1060.36This work
GC/Chi-CXBiFe0.01−0.581–10 pM1.01·1060.54
GC/Chi-CXBiFe0.12−0.561–10 pM3.77·1050.77
GC/Chi-CXBiFe1.2−0.511–10 pM6.39·1051.24
GC, glassy carbon; Chi, chitosan; CX, carbon xerogel; CA, carbon aerogel.
Publisher’s Note: MDPI stays neutral with regard to jurisdictional claims in published maps and institutional affiliations.

