
Protein O-Fucosyltransferase 1 Undergoes Interdomain Flexibility in Solution

 , ,
, ,  ,
,  and
and 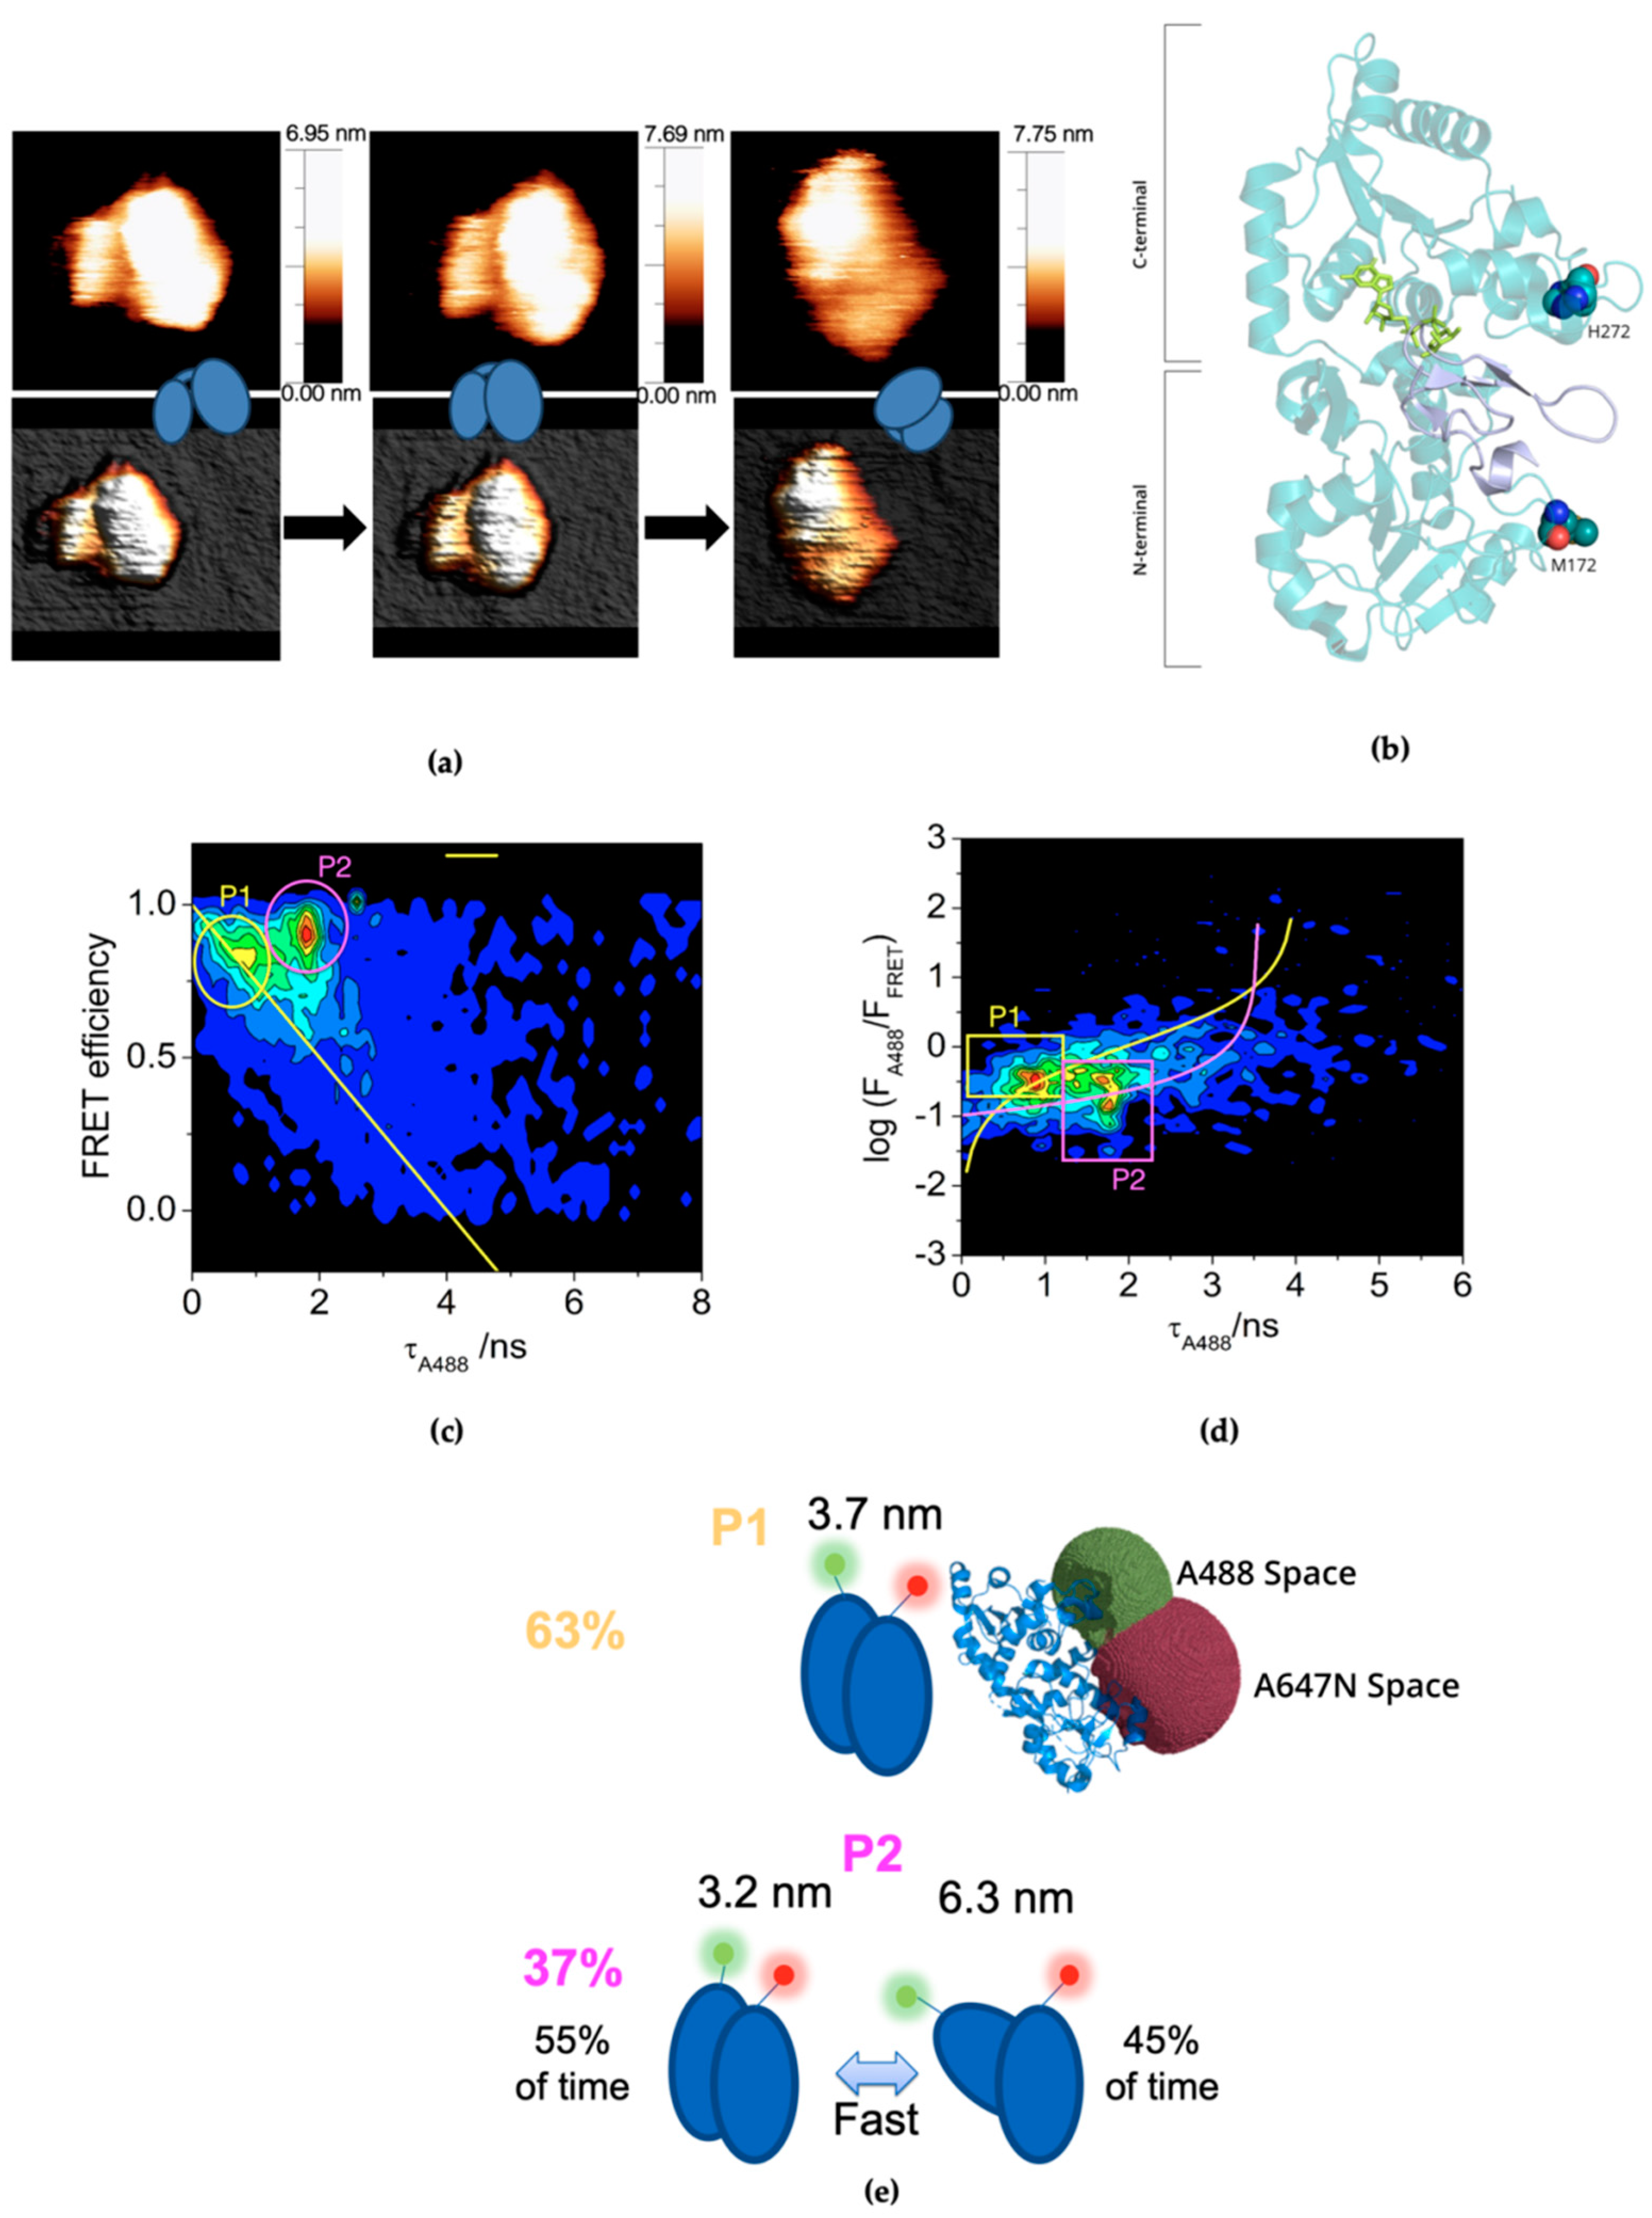
Abstract
:1. Introduction
2. Results
2.1. Plasticity of CePoFUT1 in Solution
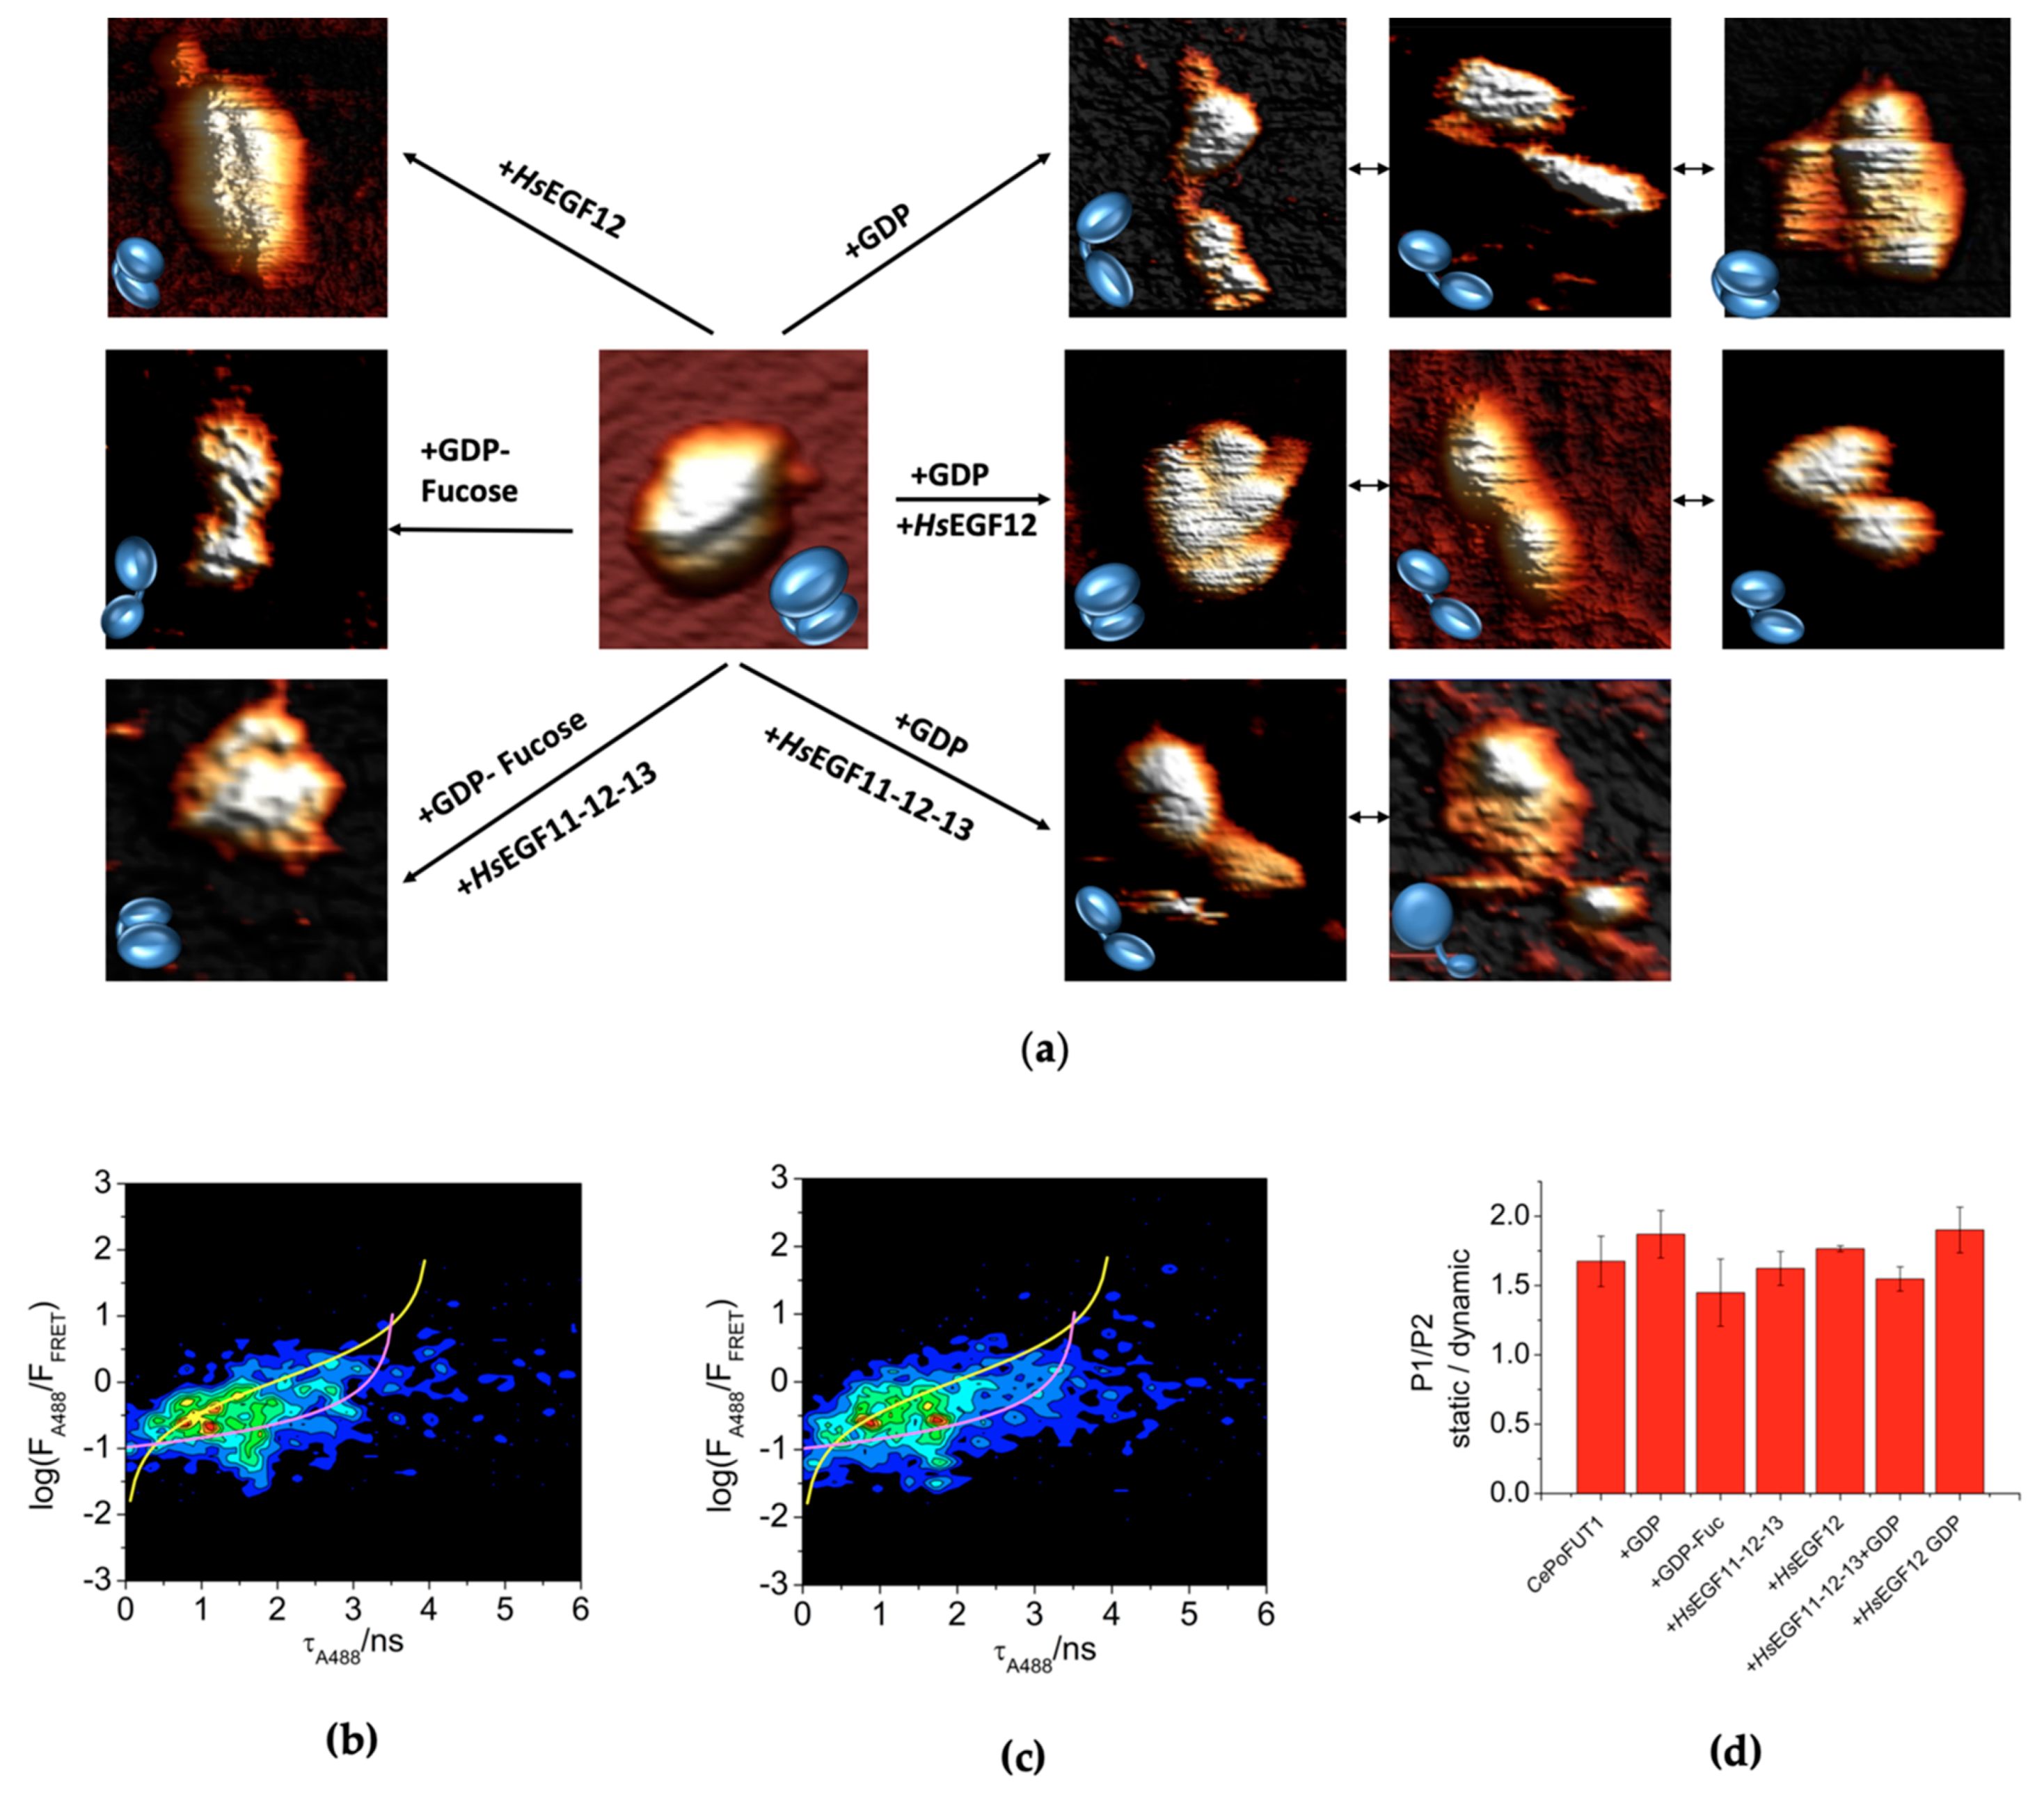
2.2. Additional Plasticity in CePoFUT1 upon Binding Substrates and Products
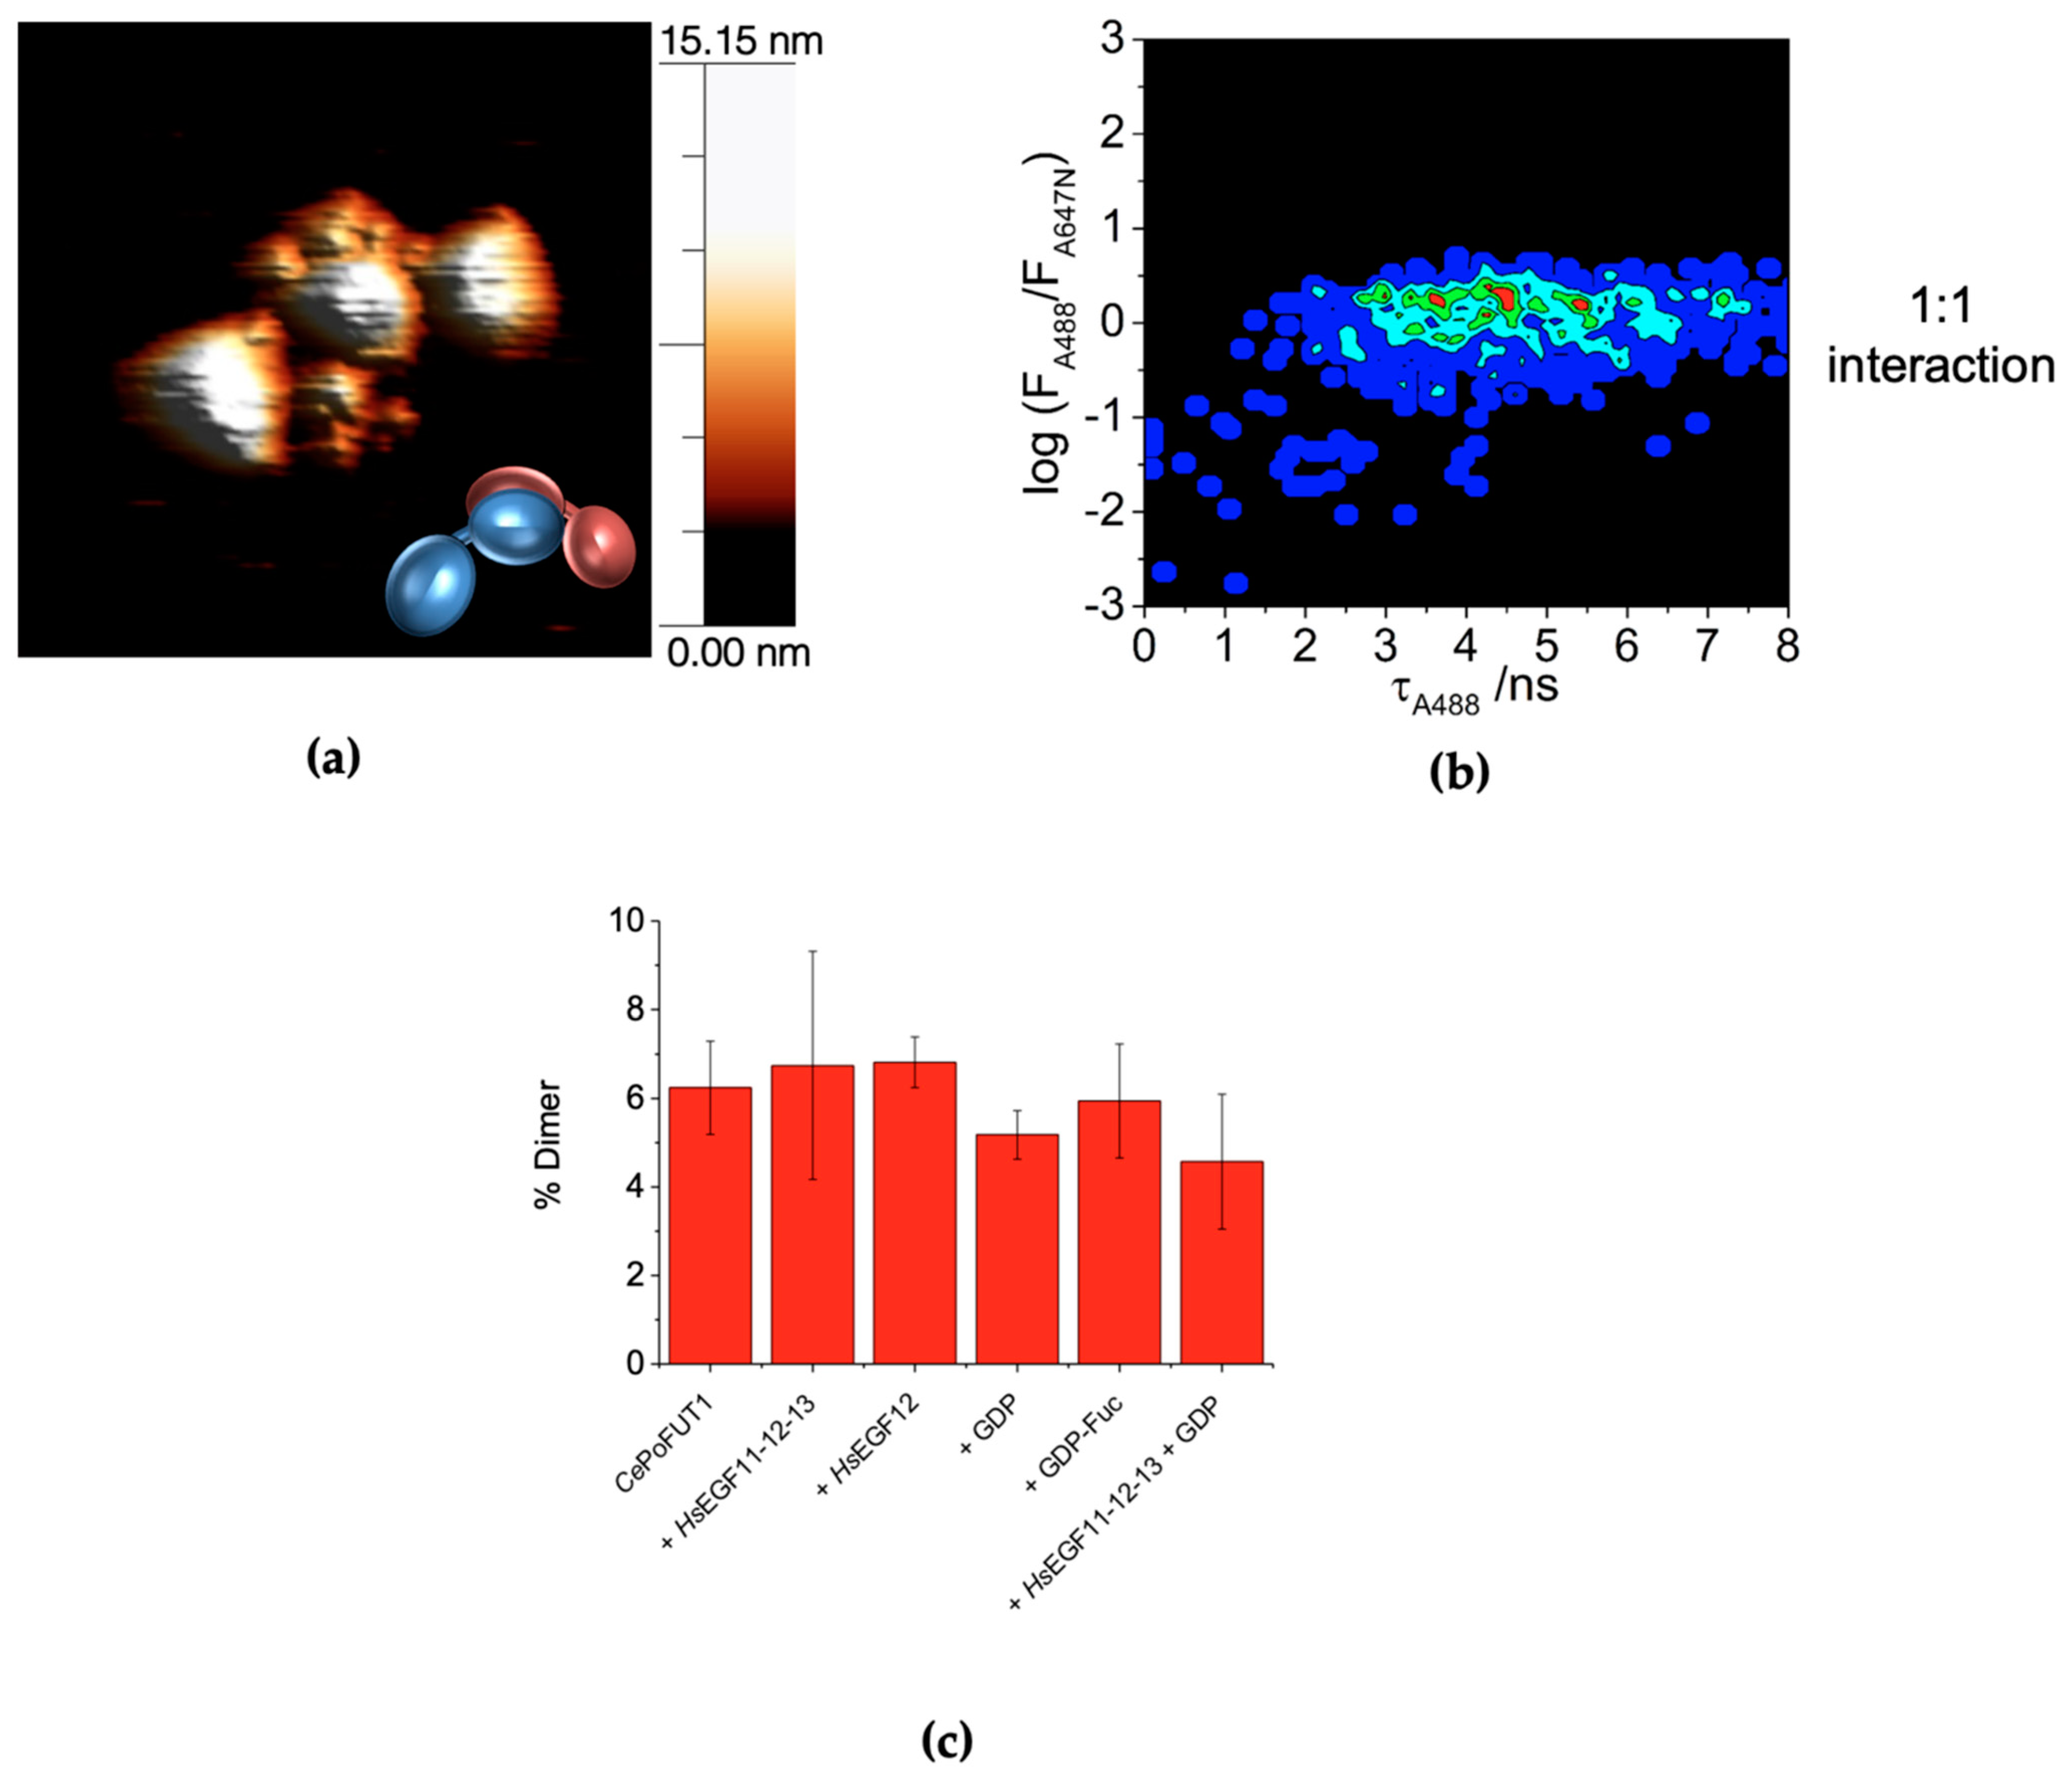
2.3. Dimers of CePoFUT1
3. Discussion
4. Materials and Methods
4.1. Expression and Purification of CePoFUT1 Wild Type and Double Mutant M172C/H272C
4.2. Cloning, Expression and Purification of HsEGF12 and HsEGF11-12-13
4.3. Labeling Reactions with Fluorescent Tags
4.4. Inter-Dye Distance Estimation Using the Positioning and Screening Software (FPS)
4.5. Atomic Force Microscopy Imaging
4.6. SMF-FRET Experiments
Author Contributions
Funding
Institutional Review Board Statement
Informed Consent Statement
Data Availability Statement
Conflicts of Interest
References
- Luo, Y.; Haltiwanger, R.S. O-Fucosylation of Notch Occurs in the Endoplasmic Reticulum. J. Biol. Chem. 2005, 280, 11289–11294. [Google Scholar] [CrossRef] [Green Version]
- Holdener, B.C.; Haltiwanger, R.S. Protein O-Fucosylation: Structure and Function. Curr. Opin. Struct. Biol. 2019, 56, 78–86. [Google Scholar] [CrossRef]
- Schneider, M.; Al-Shareffi, E.; Haltiwanger, R.S. Biological Functions of Fucose in Mammals. Glycobiology 2017, 27, 601–618. [Google Scholar] [CrossRef] [PubMed] [Green Version]
- Takeuchi, H.; Haltiwanger, R.S. Role of Glycosylation of Notch in Development. Semin. Cell Dev. Biol. 2010, 21, 638–645. [Google Scholar]
- Rampal, R.; Arboleda-Velasquez, J.F.; Nita-Lazar, A.; Kosik, K.S.; Haltiwanger, R.S. Highly Conserved O-Fucose Sites Have Distinct Effects on Notch1 Function. J. Biol. Chem. 2005, 280, 32133–32140. [Google Scholar] [CrossRef] [Green Version]
- Haltom, A.R.; Jafar-Nejad, H. The Multiple Roles of Epidermal Growth Factor Repeat O-Glycans in Animal Development. Glycobiology 2015, 25, 1027–1042. [Google Scholar] [CrossRef] [PubMed] [Green Version]
- Wang, Y.; Spellman, M.W. Purification and Characterization of a GDP-Fucose: Polypeptide Fucosyltransferase from Chinese Hamster Ovary Cells. J. Biol. Chem. 1998, 273, 8112–8118. [Google Scholar] [CrossRef] [PubMed] [Green Version]
- Luca, V.C.; Jude, K.M.; Pierce, N.W.; Nachury, M.V.; Fischer, S.; Garcia, K.C. Structural Basis for Notch1 Engagement of Delta-like 4. Science 2015, 347, 847–853. [Google Scholar] [CrossRef] [PubMed] [Green Version]
- Luca, V.C.; Kim, B.C.; Ge, C.; Kakuda, S.; Wu, D.; Roein-Peikar, M.; Haltiwanger, R.S.; Zhu, C.; Ha, T.; Garcia, K.C. Notch-Jagged complex structure implicates a catch bond in tuning ligand sensitivity. Science 2017, 355, 1320–1324. [Google Scholar] [CrossRef] [PubMed] [Green Version]
- Klein, T.; Arias, A.M. Interactions among Delta, Serrate and Fringe Modulate Notch Activity during Drosophila Wing Development. Development 1998, 125, 2951–2962. [Google Scholar] [PubMed]
- Xu, A.; Haines, N.; Dlugosz, M.; Rana, N.A.; Takeuchi, H.; Haltiwanger, R.S.; Irvine, K.D. In Vitro Reconstitution of the Modulation of Drosophila Notch-Ligand Binding by Fringe. J. Biol. Chem. 2007, 282, 35153–35162. [Google Scholar] [CrossRef] [Green Version]
- Taylor, P.; Takeuchi, H.; Sheppard, D.; Chillakuri, C.; Lea, S.M.; Haltiwanger, R.S.; Handford, P.A. Fringe-Mediated Extension of O-Linked Fucose in the Ligand-Binding Region of Notch1 Increases Binding to Mammalian Notch Ligands. Proc. Natl. Acad. Sci. USA 2014, 111, 7290–7295. [Google Scholar] [CrossRef] [Green Version]
- Kakuda, S.; LoPilato, R.K.; Ito, A.; Haltiwanger, R.S. Canonical Notch Ligands and Fringes Have Distinct Effects on NOTCH1 and NOTCH2. J. Biol. Chem. 2020, 295, 14710–14722. [Google Scholar] [CrossRef]
- Okajima, T.; Xu, A.; Lei, L.; Irvine, K.D. Chaperone Activity of Protein O-Fucosyltransferase 1 Promotes Notch Receptor Folding. Science 2005, 307, 1599–1603. [Google Scholar] [CrossRef] [Green Version]
- Lira-Navarrete, E.; Valero-González, J.; Villanueva, R.; Martínez-Júlvez, M.; Tejero, T.; Merino, P.; Panjikar, S.; Hurtado-Guerrero, R. Structural Insights into the Mechanism of Protein O-Fucosylation. PLoS ONE 2011, 6, e25365. [Google Scholar] [CrossRef] [Green Version]
- Lira-Navarrete, E.; Hurtado-Guerrero, R. A Perspective on Structural and Mechanistic Aspects of Protein O-Fucosylation. Acta Crystallogr. Sect. F Struct. Biol. Commun. 2018, 74, 443–450. [Google Scholar] [CrossRef] [PubMed]
- Breton, C.; Fournel-Gigleux, S.; Palcic, M.M. Recent Structures, Evolution and Mechanisms of Glycosyltransferases. Curr. Opin. Struct. Biol. 2012, 22, 540–549. [Google Scholar] [CrossRef] [PubMed]
- Moremen, K.W.; Haltiwanger, R.S. Emerging Structural Insights into Glycosyltransferase-Mediated Synthesis of Glycans. Nat. Chem. Biol. 2019, 15, 853–864. [Google Scholar] [CrossRef]
- Albesa-Jové, D.; Guerin, M.E. The Conformational Plasticity of Glycosyltransferases. Curr. Opin. Struct. Biol. 2016, 40, 23–32. [Google Scholar] [CrossRef] [PubMed]
- Alfaro, J.A.; Zheng, R.B.; Persson, M.; Letts, J.A.; Polakowski, R.; Bai, Y.; Borisova, S.N.; Seto, N.O.L.; Lowary, T.L.; Palcic, M.M.; et al. ABO(H) Blood Group A and B Glycosyltransferases Recognize Substrate via Specific Conformational Changes. J. Biol. Chem. 2008, 283, 10097–10108. [Google Scholar] [CrossRef] [Green Version]
- Pruitt, R.N.; Chumbler, N.M.; Rutherford, S.A.; Farrow, M.A.; Friedman, D.B.; Spiller, B.; Lacy, D.B. Structural Determinants of Clostridium Difficile Toxin A Glucosyltransferase Activity. J. Biol. Chem. 2012, 287, 8013–8020. [Google Scholar] [CrossRef] [Green Version]
- Lira-Navarrete, E.; De Las Rivas, M.; Compañón, I.; Pallarés, M.C.; Kong, Y.; Iglesias-Fernández, J.; Bernardes, G.J.L.; Peregrina, J.M.; Rovira, C.; Bernadó, P.; et al. Dynamic Interplay between Catalytic and Lectin Domains of GalNAc-Transferases Modulates Protein O-Glycosylation. Nat. Commun. 2015, 6. [Google Scholar] [CrossRef] [PubMed] [Green Version]
- de Las Rivas, M.; Coelho, H.; Diniz, A.; Lira-Navarrete, E.; Compañón, I.; Jiménez-Barbero, J.; Schjoldager, K.T.; Bennett, E.P.; Vakhrushev, S.Y.; Clausen, H. Structural Analysis of a GalNAc-T2 Mutant Reveals an Induced-Fit Catalytic Mechanism for GalNAc-Ts. Chem. Eur. J. 2018, 24, 8382–8392. [Google Scholar] [CrossRef] [Green Version]
- de Las Rivas, M.; Lira-Navarrete, E.; Gerken, T.A.; Hurtado-Guerrero, R. Polypeptide GalNAc-Ts: From Redundancy to Specificity. Curr. Opin. Struct. Biol. 2019, 56, 87–96. [Google Scholar] [CrossRef] [Green Version]
- Sheng, F.; Jia, X.; Yep, A.; Preiss, J.; Geiger, J.H. The Crystal Structures of the Open and Catalytically Competent Closed Conformation of Escherichia Coli Glycogen Synthase. J. Biol. Chem. 2009, 284, 17796–17807. [Google Scholar] [CrossRef] [PubMed] [Green Version]
- Vetting, M.W.; Frantom, P.A.; Blanchard, J.S. Structural and Enzymatic Analysis of MshA from Corynebacterium Glutamicum: Substrate-Assisted Catalysis. J. Biol. Chem. 2008, 283, 15834–15844. [Google Scholar] [CrossRef] [PubMed] [Green Version]
- Giganti, D.; Alegre-Cebollada, J.; Urresti, S.; Albesa-Jové, D.; Rodrigo-Unzueta, A.; Comino, N.; Kachala, M.; López-Fernández, S.; Svergun, D.I.; Fernández, J.M.; et al. Conformational Plasticity of the Essential Membrane-Associated Mannosyltransferase PimA from Mycobacteria. J. Biol. Chem. 2013, 288, 29797–29808. [Google Scholar] [CrossRef] [PubMed] [Green Version]
- Giganti, D.; Albesa-Jové, D.; Urresti, S.; Rodrigo-Unzueta, A.; Martínez, M.A.; Comino, N.; Barilone, N.; Bellinzoni, M.; Chenal, A.; Guerin, M.E.; et al. Secondary Structure Reshuffling Modulates Glycosyltransferase Function at the Membrane. Nat. Chem. Biol. 2015, 11, 16–18. [Google Scholar] [CrossRef] [PubMed]
- García-García, A.; Ceballos-Laita, L.; Serna, S.; Artschwager, R.; Reichardt, N.C.; Corzana, F.; Hurtado-Guerrero, R. Structural Basis for Substrate Specificity and Catalysis of A1,6-Fucosyltransferase. Nat. Commun. 2020, 11, 973. [Google Scholar] [CrossRef] [PubMed] [Green Version]
- McMillan, B.J.; Zimmerman, B.; Egan, E.D.; Lofgren, M.; Xu, X.; Hesser, A.; Blacklow, S.C. Structure of Human POFUT1, Its Requirement in Ligand-Independent Oncogenic Notch Signaling, and Functional Effects of Dowling-Degos Mutations. Glycobiology 2017, 27, 777–786. [Google Scholar] [CrossRef] [Green Version]
- Li, Z.; Han, K.; Pak, J.E.; Satkunarajah, M.; Zhou, D.; Rini, J.M. Recognition of EGF-like Domains by the Notch-Modifying O-Fucosyltransferase POFUT1. Nat. Chem. Biol. 2017, 13, 757. [Google Scholar] [CrossRef]
- Muller, D.J.; Dufrene, Y.F. Atomic force microscopy as a multifunctional molecular toolbox in nanobiotechnology. Nat. Nanotechnol. 2008, 3, 261–269. [Google Scholar] [CrossRef] [PubMed]
- Sasmal, D.K.; Pulido, L.E.; Kasal, S.; Huang, J. Single-Molecule Fluorescence Resonance Energy Transfer in Molecular Biology. Nanoscale 2016, 8, 19928–19944. [Google Scholar] [CrossRef] [PubMed] [Green Version]
- Kudryavtsev, V.; Sikor, M.; Kalinin, S.; Mokranjac, D.; Seidel, C.A.M.; Lamb, D.C. Combining MFD and PIE for Accurate Single-pair Förster Resonance Energy Transfer Measurements. ChemPhysChem 2012, 13, 1060–1078. [Google Scholar] [CrossRef] [PubMed]
- Felekyan, S.; Kalinin, S.; Sanabria, H.; Valeri, A.; Seidel, C.A.M. Filtered FCS: Species Auto-and Cross-Correlation Functions Highlight Binding and Dynamics in Biomolecules. ChemPhysChem 2012, 13, 1036–1053. [Google Scholar] [CrossRef] [PubMed] [Green Version]
- Hellenkamp, B.; Schmid, S.; Doroshenko, O.; Opanasyuk, O.; Kühnemuth, R.; Adariani, S.R.; Ambrose, B.; Aznauryan, M.; Barth, A.; Birkedal, V. Precision and Accuracy of Single-Molecule FRET Measurements—A Multi-Laboratory Benchmark Study. Nat. Methods 2018, 15, 669–676. [Google Scholar] [CrossRef]
- Kalinin, S.; Peulen, T.; Sindbert, S.; Rothwell, P.J.; Berger, S.; Restle, T.; Goody, R.S.; Gohlke, H.; Seidel, C.A.M. A Toolkit and Benchmark Study for FRET-Restrained High-Precision Structural Modeling. Nat. Methods 2012, 9, 1218–1225. [Google Scholar] [CrossRef]
- Orte, A.; Clarke, R.; Balasubramanian, S.; Klenerman, D. Determination of the Fraction and Stoichiometry of Femtomolar Levels of Biomolecular Complexes in an Excess of Monomer Using Single-Molecule, Two-Color Coincidence Detection. Anal. Chem. 2006, 78, 7707–7715. [Google Scholar] [CrossRef]
- Orte, A.; Clarke, R.W.; Klenerman, D. Single-Molecule Fluorescence Coincidence Spectroscopy and Its Application to Resonance Energy Transfer. ChemPhysChem 2011, 12, 491–499. [Google Scholar] [CrossRef]
- Rüttinger, S.; Macdonald, R.; Krämer, B.; Koberling, F.; Roos, M.; Hildt, E. Accurate Single-Pair Förster Resonant Energy Transfer through Combination of Pulsed Interleaved Excitation, Time Correlated Single-Photon Counting, and Fluorescence Correlation Spectroscopy. J. Biomed. Opt. 2006, 11, 24012. [Google Scholar] [CrossRef]
- Fritz, T.A.; Raman, J.; Tabak, L.A. Dynamic Association between the Catalytic and Lectin Domains of Human UDP-GalNAc: Polypeptide α-N-Acetylgalactosaminyltransferase-2. J. Biol. Chem. 2006, 281, 8613–8619. [Google Scholar] [CrossRef] [Green Version]
- De Las Rivas, M.; Lira-Navarrete, E.; Daniel, E.J.P.; Compañón, I.; Coelho, H.; Diniz, A.; Jiménez-Barbero, J.; Peregrina, J.M.; Clausen, H.; Corzana, F. The Interdomain Flexible Linker of the Polypeptide GalNAc Transferases Dictates Their Long-Range Glycosylation Preferences. Nat. Commun. 2017, 8, 1–11. [Google Scholar] [CrossRef]
- Valero-González, J.; Leonhard-Melief, C.; Lira-Navarrete, E.; Jiménez-Osés, G.; Hernández-Ruiz, C.; Pallarés, M.C.; Yruela, I.; Vasudevan, D.; Lostao, A.; Corzana, F.; et al. A Proactive Role of Water Molecules in Acceptor Recognition by Protein O-Fucosyltransferase 2. Nat. Chem. Biol. 2016, 12. [Google Scholar] [CrossRef] [Green Version]
- Lairson, L.L.; Henrissat, B.; Davies, G.J.; Withers, S.G. Glycosyltransferases: Structures, Functions, and Mechanisms. Annu. Rev. Biochem. 2008, 77. [Google Scholar] [CrossRef] [Green Version]
- Vandenberk, N.; Karamanou, S.; Portaliou, A.G.; Zorzini, V.; Hofkens, J.; Hendrix, J.; Economou, A. The Preprotein Binding Domain of SecA Displays Intrinsic Rotational Dynamics. Structure 2019, 27, 90–101. [Google Scholar] [CrossRef] [Green Version]
- Pallarés, M.C.; Marcuello, C.; Botello-Morte, L.; González, A.; Fillat, M.F.; Lostao, A. Sequential Binding of FurA from Anabaena sp. PCC 7120 to Iron Boxes: Exploring Regulation at the Nanoscale. Biochim. Biophys. Acta (BBA) Proteins Proteom. 2014, 1844, 623–631. [Google Scholar] [CrossRef]
- Marcuello, C.; Arilla-Luna, S.; Medina, M.; Lostao, A. Detection of a Quaternary Organization into Dimer of Trimers of Corynebacterium Ammoniagenes FAD Synthetase at the Single-Molecule Level and at the in Cell Level. Biochim. Biophys. Acta (BBA) Proteins Proteom. 2013, 1834, 665–676. [Google Scholar] [CrossRef] [PubMed]
- Horcas, I.; Fernández, R.; Gomez-Rodriguez, J.M.; Colchero, J.; Gómez-Herrero, J.; Baro, A.M. WSXM: A Software for Scanning Probe Microscopy and a Tool for Nanotechnology. Rev. Sci. Instrum. 2007, 78, 13705. [Google Scholar] [CrossRef] [PubMed]
- Lostao, A.; Peleato, M.L.; Gómez-Moreno, C.; Fillat, M.F. Oligomerization Properties of FurA from the Cyanobacterium Anabaena sp. PCC 7120: Direct Visualization by in Situ Atomic Force Microscopy under Different Redox Conditions. Biochim. Biophys. Acta (BBA) Proteins Proteom. 2010, 1804, 1723–1729. [Google Scholar] [CrossRef] [PubMed]
- Castello, F.; Paredes, J.M.; Ruedas-Rama, M.J.; Martin, M.; Roldan, M.; Casares, S.; Orte, A. Two-Step Amyloid Aggregation: Sequential Lag Phase Intermediates. Sci. Rep. 2017, 7, 1–11. [Google Scholar] [CrossRef] [PubMed] [Green Version]
- Edel, J.B.; Eid, J.S.; Meller, A. Accurate Single Molecule FRET Efficiency Determination for Surface Immobilized DNA Using Maximum Likelihood Calculated Lifetimes. J. Phys. Chem. B 2007, 111, 2986–2990. [Google Scholar] [CrossRef]


Publisher’s Note: MDPI stays neutral with regard to jurisdictional claims in published maps and institutional affiliations. |
© 2021 by the authors. Licensee MDPI, Basel, Switzerland. This article is an open access article distributed under the terms and conditions of the Creative Commons Attribution (CC BY) license (https://creativecommons.org/licenses/by/4.0/).
Share and Cite
Lira-Navarrete, E.; Pallarés, M.C.; Castello, F.; Ruedas-Rama, M.J.; Orte, A.; Lostao, A.; Hurtado-Guerrero, R. Protein O-Fucosyltransferase 1 Undergoes Interdomain Flexibility in Solution. Molecules 2021, 26, 2105. https://doi.org/10.3390/molecules26082105
Lira-Navarrete E, Pallarés MC, Castello F, Ruedas-Rama MJ, Orte A, Lostao A, Hurtado-Guerrero R. Protein O-Fucosyltransferase 1 Undergoes Interdomain Flexibility in Solution. Molecules. 2021; 26(8):2105. https://doi.org/10.3390/molecules26082105
Chicago/Turabian StyleLira-Navarrete, Erandi, María Carmen Pallarés, Fabio Castello, Maria J. Ruedas-Rama, Angel Orte, Anabel Lostao, and Ramón Hurtado-Guerrero. 2021. "Protein O-Fucosyltransferase 1 Undergoes Interdomain Flexibility in Solution" Molecules 26, no. 8: 2105. https://doi.org/10.3390/molecules26082105