
The Impact of Redox, Hydrolysis and Dehydration Chemistry on the Structural and Magnetic Properties of Magnetoferritin Prepared in Variable Thermal Conditions

 , , , ,
  , , , and
Abstract
:
1. Introduction
2. Results and Discussion
2.1. Formation of Iron Cores inside Apoferritin In Vitro and Characterization of Magnetoferritin
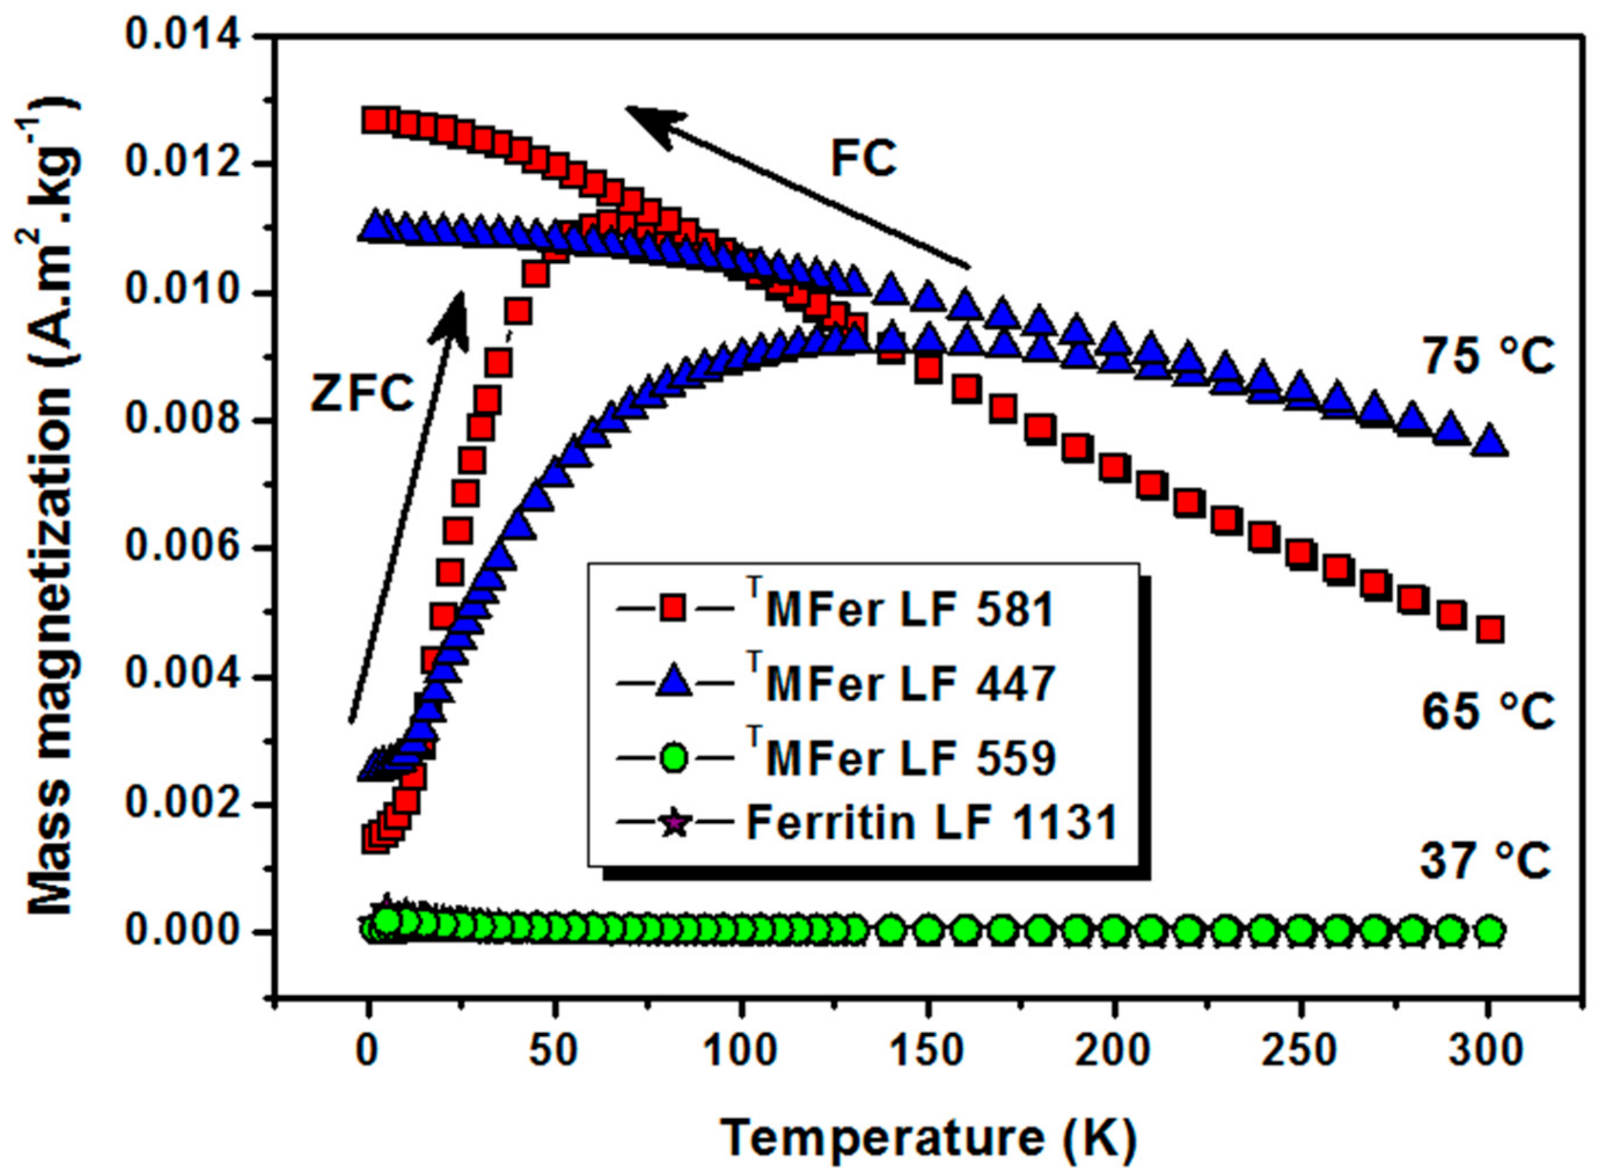
2.2. Synthesis Temperature Impact on the Magnetic Properties of Magnetoferritin
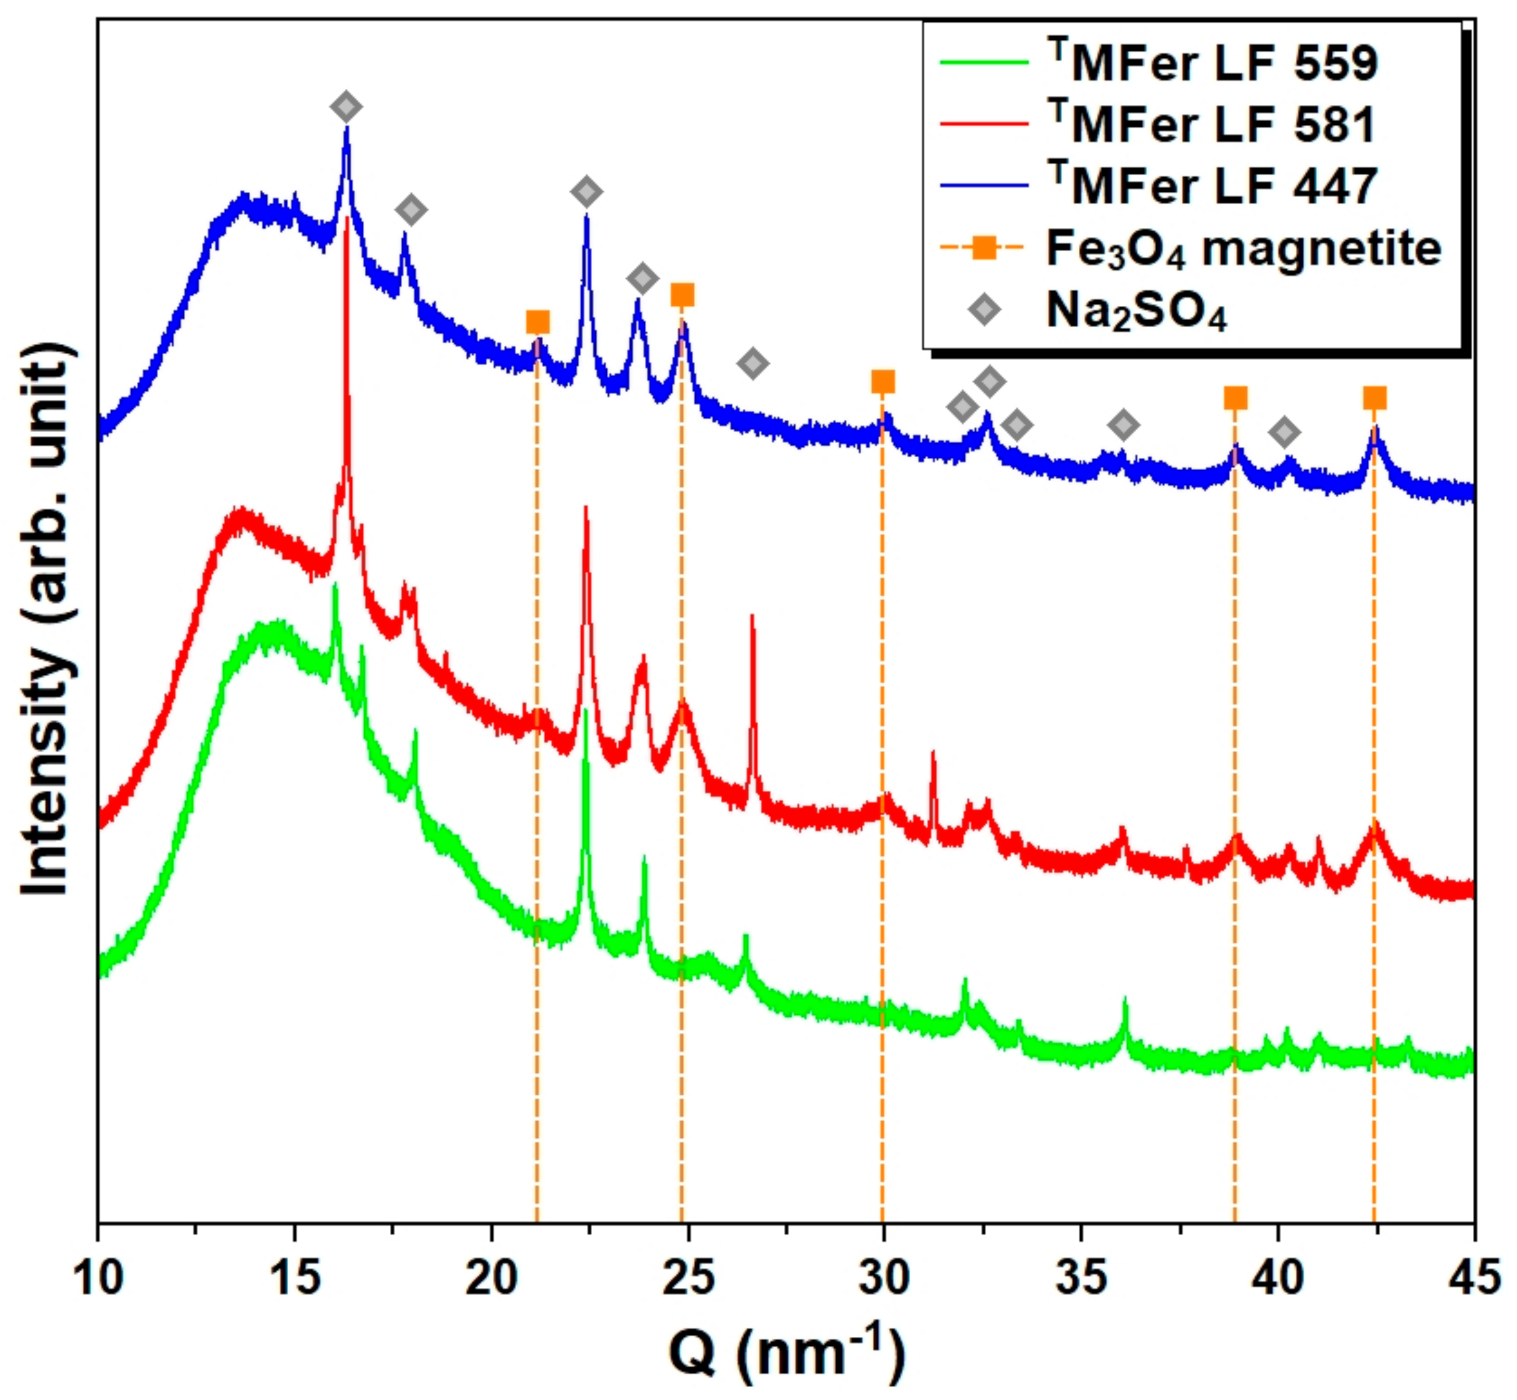
2.3. Synthesis Temperature Impact on the Crystallinity of Magnetoferritin
2.4. Protein Structure Variations under Aqueous Medium pH Changes
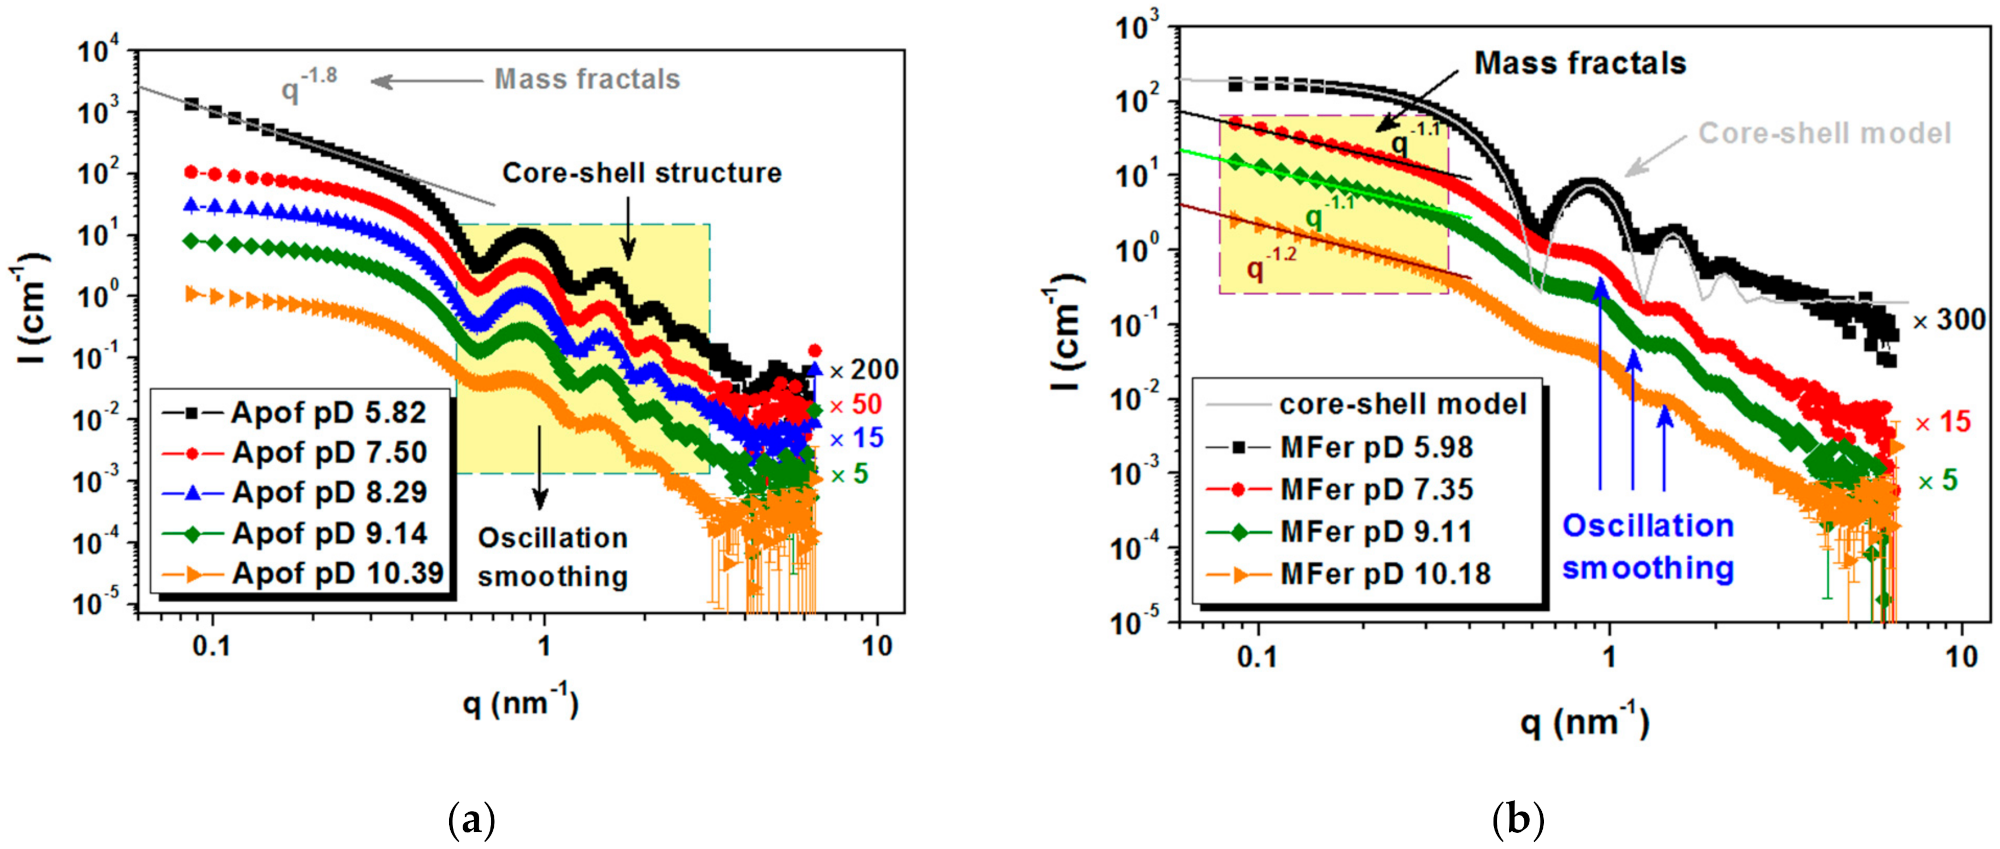
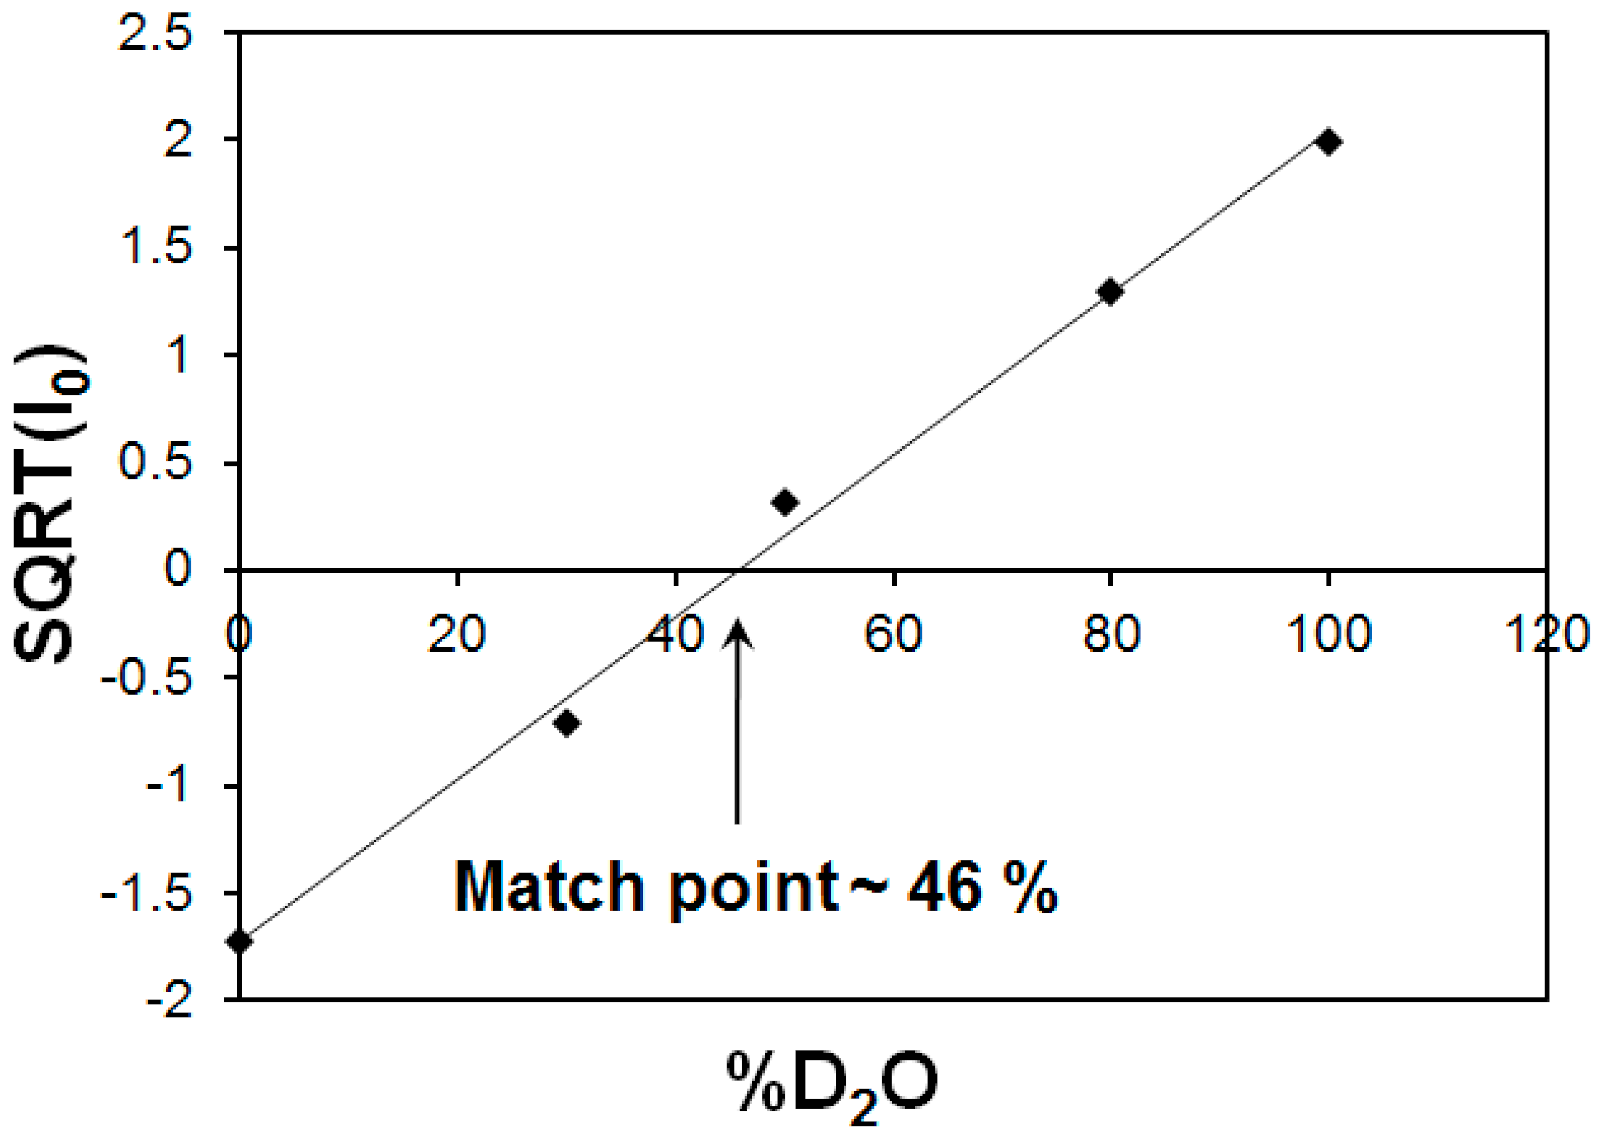
2.5. SANS Contrast Variation for Iron Core Characterization
2.6. Critical Assessment of Synthesis Technology and Application Potential of Magnetoferritin
3. Materials and Methods
3.1. Chemicals
3.2. Sample Preparation
3.3. Quantitative Ultraviolet and Visible Spectroscopic Analysis of Loading Factor
3.4. Dynamic Light Scattering from Magnetoferritin
3.5. Colloidal Stability and Determination of the Total Charge
3.6. Investigation of Morphology by Cryogenic Transmission Electron Microscopy
3.7. Determination of Magnetic Properties Using SQUID Magnetometry
3.8. Qualitative Determination of Iron Core Composition by High Resolution X-ray Powder Diffraction
3.9. Small-Angle Neutron Scattering Structural Analysis
4. Conclusions
Author Contributions
Funding
Data Availability Statement
Acknowledgments
Conflicts of Interest
Sample Availability
References
- Laufberger, M.V. Sur la cristallisation de la ferritine. Bull. Soc. Chim. Biol. 1937, 19, 1575–1582. [Google Scholar]
- Palombarini, F.; Di Fabio, E.; Boffi, A.; Macone, A.; Bonamore, A. Ferritin Nanocages for Protein Delivery to Tumor Cells. Molecules 2020, 25, 825. [Google Scholar] [CrossRef] [PubMed] [Green Version]
- Gu, C.; Zhang, T.; Lv, C.; Liu, Y.; Wang, Y.; Zhao, G. His-mediated reversible self-assembly of ferritin nanocages through two different switches for encapsulation of cargo molecules. ACS Nano 2020, 14, 17080–17090. [Google Scholar] [CrossRef] [PubMed]
- Shuvaev, V.V.; Khoshnejad, M.; Pulsipher, K.W.; Kiseleva, R.Y.; Arguiri, E.; Cheung-Lau, J.C.; LeFort, K.M.; Christofidou-Solomidou, M.; Stan, R.V.; Dmochowski, I.J.; et al. Spatially controlled assembly of affinity ligand and enzyme cargo enables targeting ferritin nanocarriers to caveolae. Biomaterials 2018, 185, 348–359. [Google Scholar] [CrossRef] [PubMed]
- Li, L.; Muñoz-Culla, M.; Carmona, U.; Lopez, M.P.; Yang, F.; Trigueros, C.; Otaegui, D.; Zhang, L.; Knez, M. Ferritin-mediated siRNA delivery and gene silencing in human tumor and primary cells. Biomaterials 2016, 98, 143–151. [Google Scholar] [CrossRef] [PubMed]
- Terashima, M.; Uchida, M.; Kosuge, H.; Tsao, P.S.; Young, M.J.; Conolly, S.M.; Douglas, T.; McConnell, M.V. Human ferritin cages for imaging vascular macrophages. Biomaterials 2011, 32, 1430–1437. [Google Scholar] [CrossRef] [PubMed] [Green Version]
- Theil, E.C. Ferritin: The protein nanocage and iron biomineral in health and in disease. Inorg. Chem. 2013, 52, 12223–12233. [Google Scholar] [CrossRef]
- Harrison, P.M.; Arosio, P. The ferritins:Molecular properties, iron storage function and cellular regulation. Biochim. Biophys. Acta 1996, 1275, 161–203. [Google Scholar] [CrossRef] [Green Version]
- Meldrum, F.C.; Heywood, B.R.; Mann, S. Magnetoferritin: In vitro synthesis of a novel magnetic protein. Science 1992, 257, 522–523. [Google Scholar] [CrossRef]
- He, D.; Marles-Wright, J. Ferritin family proteins and their use in bionanotechnology. New Biotechnol. 2015, 32, 651–657. [Google Scholar] [CrossRef] [Green Version]
- Fantechi, E.; Innocenti, C.; Zanardelli, M.; Fittipaldi, M.; Falvo, E.; Carbo, M.; Shullani, V.; Mannelli, L.D.C.; Ghelardini, C.; Ferretti, A.M.; et al. A smart platform for hyperthermia application in cancer treatment:Cobalt-doped ferrite nanoparticles mineralized in human ferritin cages. ACS Nano 2014, 8, 4705–4719. [Google Scholar] [CrossRef]
- Zhen, Z.; Tang, W.; Guo, C.; Chen, H.; Lin, X.; Liu, G.; Fei, B.; Chen, X.; Xu, B.; Xie, J. Ferritin nanocages to encapsulate and deliver photosensitizers for efficient photodynamic therapy against cancer. ACS Nano 2013, 7, 6988–6996. [Google Scholar] [CrossRef] [Green Version]
- Wang, W.; Huang, B.; Zhu, Y.; Tan, W.; Zhu, M. Ferritin nanoparticle-based SARS-CoV-2 RBD vaccine induces a persistent antibody response and long-term memory in mice. Cell Mol. Immunol. 2021, 18, 749–751. [Google Scholar] [CrossRef]
- Powell, A.E.; Zhang, K.; Sanyal, M.; Tang, S.; Weidenbacher, P.A.; Li, S.; Pham, T.D.; Pak, J.E.; Chiu, W.; Kim, P.S. A single immunization with spike-functionalized ferritin vaccines elicits neutralizing antibody responses against SARS-CoV-2 in mice. ACS Cent. Sci. 2021, 7, 183–199. [Google Scholar] [CrossRef]
- Caixia, Y.; Tian, R.; Liu, T.; Liu, G. MRI Reporter Genes for Noninvasive Molecular Imaging. Molecules 2016, 21, 580. [Google Scholar] [CrossRef] [Green Version]
- Zhao, Y.; Liang, M.; Li, X.; Fan, K.; Xiao, J.; Li, Y.; Shi, H.; Wang, F.; Choi, H.S.; Cheng, D.; et al. Bioengineered magnetoferritin nanoprobes for single-dose nuclear-magnetic resonance tumor imaging. ACS Nano 2016, 10, 4184–4191. [Google Scholar] [CrossRef]
- Hauser, A.K.; Mitov, M.I.; Daley, E.F.; McGarry, R.C.; Anderson, K.W.; Hilt, J.Z. Targeted iron oxide nanoparticles for the enhancement of radiation therapy. Biomaterials 2016, 105, 127–135. [Google Scholar] [CrossRef] [Green Version]
- Kirschvink, J.L.; Kobayashi-Kirschvink, A.; Woodford, B.J. Magnetite biomineralization in the human brain. Proc. Natl. Acad. Sci. USA 1992, 89, 7683–7687. [Google Scholar] [CrossRef] [Green Version]
- Kobayashi, A.; Yamamoto, N.; Kirschvink, J. Studies of inorganic crystals in biological tissue:Magnetite in human tumor. J. Jpn. Soc. Powder Powder Metall. 1997, 44, 294–300. [Google Scholar] [CrossRef]
- Mirabello, G.; Lenders, J.J.M.; Sommerdijk, N.A.J.M. Bioinspired synthesis of magnetite nanoparticles. Chem. Soc. Rev. 2016, 45, 5085–5106. [Google Scholar] [CrossRef]
- Li, L.; Yang, Y.; Ding, J.; Xue, J. Synthesis of magnetite nanooctahedra and their magnetic field-induced two-/three-dimensional superstructure. Chem. Mater. 2010, 22, 3183–3191. [Google Scholar] [CrossRef]
- Baumgartner, J.; Bertinetti, L.; Widdrat, M.; Hirt, A.M.; Faivre, D. Formation of magnetite nanoparticles at low temperature:From superparamagnetic to stable single domain particles. PLoS ONE 2013, 8, e57070. [Google Scholar] [CrossRef] [PubMed]
- Ganapathe, L.S.; Mohamed, M.A.; Yunus, R.M.; Berhanuddin, D.D. Magnetite (Fe3O4) nanoparticles in biomedical application:From synthesis to surface functionalisation. Magnetochemistry 2020, 6, 68. [Google Scholar] [CrossRef]
- Everett, J.; Brooks, J.; Lermyte, F.; O’Connor, P.B.; Sadler, P.J.; Dobson, J.; Collingwood, J.F.; Telling, N.D. Iron stored in ferritin is chemically reduced in the presence of aggregating Aβ(1–42). Sci. Rep. 2020, 10, 10332. [Google Scholar] [CrossRef] [PubMed]
- Štrbák, O.; Balejcíková, L.; Kmetová, M.; Gombos, J.; Trancikova, A.; Pokusa, M.; Kopcanský, P. Quantification of iron release from native ferritin and magnetoferritin induced by vitamins B2 and C. Int. J. Mol. Sci. 2020, 21, 6332. [Google Scholar] [CrossRef] [PubMed]
- Melkikh, A.V.; Meijer, D.K.F. On a generalized Levinthal’s paradox:The role of long- and short range interactions in complex bio-molecular reactions, including protein and DNA folding. Prog. Biophys. Mol. Biol. 2018, 132, 57–79. [Google Scholar] [CrossRef] [PubMed]
- Dunin-Borkowski, R.E.; McCartney, M.R.; Frankel, R.B.; Bazylinski, D.A.; Pósfai, M.; Buseck, P.R. Magnetic microstructure of magnetotactic bacteria by electron holography. Science 1998, 282, 1868–1870. [Google Scholar] [CrossRef] [PubMed] [Green Version]
- Fleissner, G.; Stahl, B.; Thalau, P.; Falkenberg, G.; Fleissner, G. A novel concept of Fe-mineral based magnetoreception:Histological and physicochemical data from the upper beak of homing pigeons. Naturwissenschaften 2007, 94, 631–642. [Google Scholar] [CrossRef]
- Ahn, T.; Kim, J.H.; Yang, H.-M.; Lee, J.W.; Kim, J.-D. Formation pathways of magnetite nanoparticles by coprecipitation method. J. Phys. Chem. C. 2012, 116, 6069–6076. [Google Scholar] [CrossRef]
- Wong, K.K.W.; Douglas, T.; Gider, S.; Awschalom, D.D.; Mann, S. Biomimetic synthesis and characterization of magnetic proteins (magnetoferritin). Chem. Mater. 1998, 10, 279–285. [Google Scholar] [CrossRef]
- Martínez-Pérez, M.J.; de Miguel, R.; Carbonera, C.; Martínez-Júlvez, M.; Lostao, A.; Piquer, C.; Gómez-Moreno, C.; Bartolomé, J.; Luis, F. Size-dependent properties of magnetoferritin. Nanotechnology 2010, 21, 465707. [Google Scholar] [CrossRef]
- Moro, F.; de Miguel, R.; Jenkins, M.; Gómez-Moreno, C.; Sells, D.; Tuna, F.; McInnes, E.J.L.; Lostao, A.; Luis, F.; van Slageren, J. Magnetic anisotropy of polycrystalline magnetoferritin investigated by SQUID and electron magnetic resonance. J. Magn. Magn. Mater. 2014, 361, 188–196. [Google Scholar] [CrossRef] [Green Version]
- Stefanini, S.; Cavallo, S.; Wang, C.-Q.; Tataseo, P.; Vecchini, P.; Giartosio, A.; Chiancone, E. Thermal stability of horse spleen apoferritin and human recombinant H apoferritin. Arch. Biochem. Biophys. 1996, 325, 58–64. [Google Scholar] [CrossRef]
- Balejcíková, L.; Kovác, J.; Garamus, V.M.; Avdeev, M.V.; Petrenko, V.I.; Almásy, L.; Kopcanský, P. Influence of synthesis temperature on structural and magnetic properties of magnetoferritin. Mendeleev Commun. 2019, 29, 279–281. [Google Scholar] [CrossRef]
- Men, D.; Zhang, T.-T.; Hou, L.-W.; Zhou, J.; Zhang, Z.-P.; Shi, Y.-Y.; Zhang, J.-L.; Cui, Z.-Q.; Deng, J.-Y.; Wang, D.-B.; et al. Self-assembly of ferritin nanoparticles into an enzyme nanocomposite with tunable size for ultrasensitive immunoassay. ACS Nano 2015, 9, 10852–10860. [Google Scholar] [CrossRef]
- Saragi, T.; Sinaga, H.D.; Rahmi, F.; Pramesti, G.A.; Sugiarto, A.; Therigan, A.; Syakir, N.; Hidayat, S.; Risdiana. Blocking temperature of magnetite nanoparticles Fe3O4 encapsulated silicon dioxide SiO2. Key Eng. Mater. 2020, 855, 172–176. [Google Scholar] [CrossRef]
- Saravia, D.C.A.; Bee, A.; Shibli, S.M. Blocking phenomena studies on ferronematics. J. Magn. Magn. Mater. 2005, 289, 152–154. [Google Scholar] [CrossRef]
- Kasyutich, O.; Sarua, A.; Schwarzacher, W. Bioengineered magnetic crystals. J. Phys. D: Appl. Phys. 2008, 41, 134022. [Google Scholar] [CrossRef]
- Koralewski, M.; Klos, J.W.; Baranowski, M.; Mitróová, Z.; Kopčanský, P.; Melníková, L.; Okuda, M.; Schwarzacher, W. The Faraday effect of natural and artificial ferritins. Nanotechnology 2012, 23, 355704. [Google Scholar] [CrossRef]
- Balejčíková, L.; Molčan, M.; Kováč, J.; Kubovčíková, M.; Saksl, K.; Mitróová, Z.; Timko, M.; Kopčanský, P. Hyperthermic effect in magnetoferritin aqueous colloidal solution. J. Mol. Liq. 2019, 283, 39–44. [Google Scholar] [CrossRef]
- Oto, B.; Gür, A. Gamma-ray shielding of concretes including magnetite in different rate. Int. J. Phys. Sci. 2013, 8, 310–314. [Google Scholar] [CrossRef]
- Krezel, A.; Bal, W. A formula for correlating pKa values determined in D2O and H2O. J. Inorg. Biochem. 2004, 98, 161–166. [Google Scholar] [CrossRef]
- Avdeev, M.V.; Aksenov, V.L. Small-angle neutron scattering in structure research of magnetic fluids. Phys.–Uspekhi 2010, 53, 971–993. [Google Scholar] [CrossRef]
- Stilk, S.T.; Breslow, E. Hydrogen ion interactions of horse spleen ferritin and apoferritin. J. Biol. Chem. 1976, 251, 6963–6973. [Google Scholar] [CrossRef]
- Kišš, Ľ.; Fodran, P.; Žemlička, L. Metaloproteins of the ferritin type. Chem. Listy 2017, 111, 115–120. [Google Scholar]
- Balejčíková, L.; Garamus, V.M.; Avdeev, M.V.; Petrenko, V.I.; Almásy, L.; Kopčanský, P. The effect of solution pH on the structural stability of magnetoferritin. Colloids Surf. B Biointerfaces 2017, 156, 375–381. [Google Scholar] [CrossRef]
- Melníková, L.; Petrenko, V.I.; Avdeev, M.V.; Ivankov, O.I.; Bulavin, L.A.; Garamus, V.M.; Almásy, L.; Mitróová, Z.; Kopčanský, P. SANS contrast variation study of magnetoferitin structure at various iron loading. J. Magn. Magn. Mater. 2015, 377, 77–80. [Google Scholar] [CrossRef] [Green Version]
- Rosato, E.; Bonelli, M.; Locatelli, M.; de Grazia, U.; Tartaglia, A.; Savini, F.; D’Ovidio, C. Forensic Biochemical Markers to Evaluate the Agonal Period: A Literature Review. Molecules 2021, 26, 3259. [Google Scholar] [CrossRef] [PubMed]
- Balejčíková, L.; Tomašovičová, N.; Zakuťanská, K.; Baťková, M.; Kováč, J.; Kopčanský, P. Dechlorination of 2,4,4′-trichlorobiphenyl by magnetoferritin with different loading factors. Chemosphere 2020, 260, 127629. [Google Scholar] [CrossRef] [PubMed]
- Melníková, L.; Pospiskova, K.; Mitróová, Z.; Kopčanský, P.; Šafařík, I. Peroxidase-like activity of magnetoferritin. Microchim. Acta 2014, 181, 295–301. [Google Scholar] [CrossRef]
- Pastore, P.; Roverso, M.; Tedesco, E.; Micheletto, M.; Mantovan, E.; Zanella, M.; Benetti, F. Comparative Evaluation of Intestinal Absorption and Functional Value of Iron Dietary Supplements and Drug with Different Delivery Systems. Molecules 2020, 25, 5989. [Google Scholar] [CrossRef]
- Levy, M.; Luciani, N.; Alloyeau, D.; Elgrabli, D.; Deveaux, V.; Pechoux, C.; Chat, S.; Wang, G.; Vats, N.; Gendron, F.; et al. Long term in vivo biotransformation of iron oxide nanoparticles. Biomaterials 2011, 32, 3988–3999. [Google Scholar] [CrossRef]
- Pang, S.C.; Chin, S.F.; Anderson, M.A. Redox equilibria of iron oxides in aqueous-based magnetite dispersions: Effect of pH and redox potential. J. Colloid Interface Sci. 2007, 311, 94–101. [Google Scholar] [CrossRef]
- Match!-Phase Analysis Using Powder Diffraction, Crystal Impact-Dr. Putz, H. & Dr. Brandenburg, K. GbR, Kreuzherrenstr. 102, 53227 Bonn, Germany. Available online: https://www.crystalimpact.de/match (accessed on 15 November 2021).
- Gražulis, S.; Daškevic, A.; Merkys, A.; Chateigner, D.; Lutterotti, L.; Quirós, M.; Serebryanaya, N.R.; Moeck, P.; Downs, R.T.; Le Bail, A. Crystallography Open Database (COD): An open-access collection of crystal structures and platform for World-Wide Collaboration. Nucleic Acids Res. 2012, 40, D420–D427. [Google Scholar] [CrossRef]


| Sample LF/TSYNTHESIS (°C) | DHYDR (nm) | PDI | ζ (mV) | Ms (A·m2·kg−1) at 5 T and 22 °C |
|---|---|---|---|---|
| MFer LF 160/65 | 18.6 ± 0.7 | 0.5 | −38.4 | - |
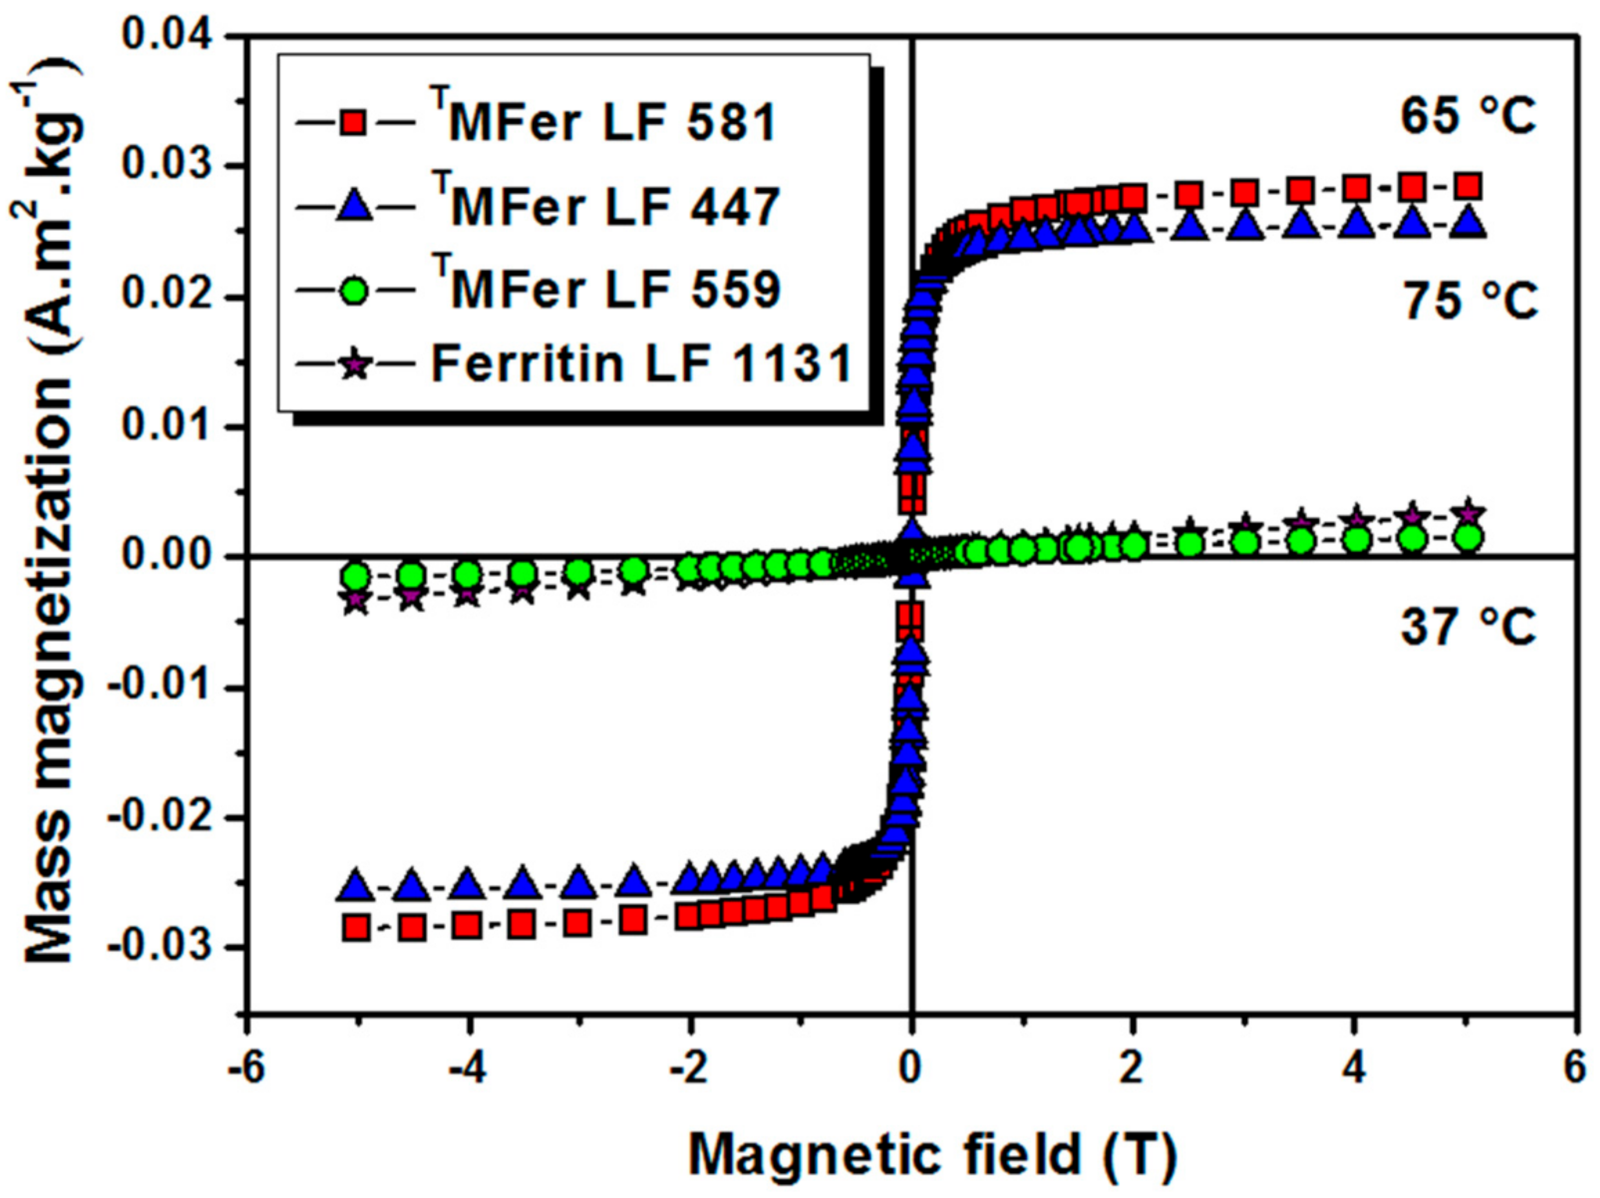
| TMFer LF 447/75 | 47.9 ± 0.8 | 0.4 | −27.6 | 0.025 |
| MFer LF 490/65 | 19.5 ± 4.3 | 0.3 | −29.2 | - |
| MFer LF 510/65 | 19.5 ± 1.2 | 0.3 | −37.1 | - |
| TMFer LF 559/37 | 45.6 ± 0.5 | 0.3 | −25.8 | 0.001 |
| TMFer LF 581/65 | 14.6 ± 2.1 | 0.3 | −26.2 | 0.028 |
| Ferritin LF 1131 | 15.6 ± 1.2 | 0.3 | −21.2 | 0.003 |
| Apoferritin | 11.9 ± 0.4 | 0.4 | −23.1 | - |
Publisher’s Note: MDPI stays neutral with regard to jurisdictional claims in published maps and institutional affiliations. |
© 2021 by the authors. Licensee MDPI, Basel, Switzerland. This article is an open access article distributed under the terms and conditions of the Creative Commons Attribution (CC BY) license (https://creativecommons.org/licenses/by/4.0/).
Share and Cite
Balejčíková, L.; Saksl, K.; Kováč, J.; Martel, A.; Garamus, V.M.; Avdeev, M.V.; Petrenko, V.I.; Almásy, L.; Kopčanský, P. The Impact of Redox, Hydrolysis and Dehydration Chemistry on the Structural and Magnetic Properties of Magnetoferritin Prepared in Variable Thermal Conditions. Molecules 2021, 26, 6960. https://doi.org/10.3390/molecules26226960
Balejčíková L, Saksl K, Kováč J, Martel A, Garamus VM, Avdeev MV, Petrenko VI, Almásy L, Kopčanský P. The Impact of Redox, Hydrolysis and Dehydration Chemistry on the Structural and Magnetic Properties of Magnetoferritin Prepared in Variable Thermal Conditions. Molecules. 2021; 26(22):6960. https://doi.org/10.3390/molecules26226960
Chicago/Turabian StyleBalejčíková, Lucia, Karel Saksl, Jozef Kováč, Anne Martel, Vasil M. Garamus, Mikhail V. Avdeev, Viktor I. Petrenko, László Almásy, and Peter Kopčanský. 2021. "The Impact of Redox, Hydrolysis and Dehydration Chemistry on the Structural and Magnetic Properties of Magnetoferritin Prepared in Variable Thermal Conditions" Molecules 26, no. 22: 6960. https://doi.org/10.3390/molecules26226960